taylor creek sediment control opportunity study - seattle.gov …spu/@drainsew/documents/w… ·...
TRANSCRIPT

www.confenv.com
TAYLOR CREEK SEDIMENT CONTROL OPPORTUNITY STUDY Prepared for: Seattle Public Utilities December 13, 2012

This page intentionally left blank
for double-sided printing
146 N Can al St , S u it e 1 1 1 • S eatt l e, WA 9 8 103 • ww w. c on f en v. c om
Taylor Creek Sediment Control Opportunity Study
REPORT
DEPT. CONTRACT NO. C12-034
Prepared for: Seattle Public Utilities PO Box 34018 Seattle, Washington Attn: Julie Crittenden Authored by: Annika Fain and Shane Cherry Confluence Environmental Company December 14, 2012

This page intentionally left blank
for double-sided printing

J:\1076.001\Reports\TaylorCreek.doc 12/13/12
Page i
TABLE OF CONTENTS
1.0 Introduction and Purpose ............................................................................................................ 1
2.0 Background ................................................................................................................................. 2
3.0 Approach and Methods ............................................................................................................... 3
3.1 Document Review ...................................................................................................................... 4
3.2 Field Data Collection .................................................................................................................. 4
3.3 Hydraulic Analysis ...................................................................................................................... 5
3.4 Sediment Transport Analysis ...................................................................................................... 6
3.5 Sediment Management Opportunities Analysis ......................................................................... 7
4.0 Field Observations ....................................................................................................................... 8
4.1 Watershed Overview .................................................................................................................. 8
4.2 Main Stem Taylor Creek ............................................................................................................. 9
4.3 East Fork Taylor Creek .............................................................................................................. 12
4.4 West Fork Taylor Creek ............................................................................................................ 13
4.5 Ravine Side Slopes ................................................................................................................... 14
5.0 Analysis and Results .................................................................................................................. 15
5.1 Hydraulic and Sediment Transport ........................................................................................... 15
5.2 Sensitivity of Sediment Transport to Flow Reduction ............................................................... 18
5.3 In-stream Sediment Storage Opportunities.............................................................................. 18
6.0 Recommendations .................................................................................................................... 19
7.0 References ................................................................................................................................ 21
Figures
Figure 1 Watershed Boundary Figure 2 Cross Section and Instream Sediment Opportunity (ISSO) Locations Figure 3 Landslide Locations Figure 4 2-Year Water Surface Elevations at Cross Sections on Main Stem (XS1-XS4) Figure 5 100-Year Water Surface Elevations at Cross Sections on Main Stem (XS1-XS4) Figure 6 Main Stem Spanner Log Locations Figure 7 Main Stem Profile LIDAR Elevations Figure 8 2-Year and 100-Year Water Surface Elevations at XS5 (East Fork) and
XS6 (West Fork)

Taylor Creek Sediment Control Opportunity Study
12/13/2012 Page ii
Figure 9 East Fork Profile Figure 10 West Fork Profile Figure 11 Surface Drainage Outfalls Tables
Table 1 Lower Taylor Creek Design Flows Table 2 Locations of Cross-Section (XS) as shown on Figures 2 and 3 Table 3 Locations of Landslide Deposits on east Stream Bank of Main Stem Taylor Creek Table 4 Locations of Instream Storage Opportunities (ISSO) as shown on Figure 2. Table 5 Locations and Types of Spanner Logs Table 6 Sediment Transport Calculations for 111.8 cfs, 100-year flow Table 7 Sediment Transport Calculations for 58.2 cfs, 2-year flow Table 8 Sediment Transport Calculations for 100.6 cfs, 90% of 100-year flow Table 9 Sediment Transport Calculations for 52.4 cfs, 90% of 2-year flow Table 10 Sediment Transport Calculations forXS5 and XS6 for 55.9 cfs, 50% of 100-year, and 29.1
cfs, 50% of the 2-year flows Table 11 ISSO Length, Width, Depth, and Volume Calculations Appendices
Appendix Site Photographs

12/13/2012
Page 1
TAYLOR CREEK SEDIMENT CONTROL OPPORTUNITY STUDY
1.0 INTRODUCTION AND PURPOSE
The City of Seattle, Seattle Public Utilities (SPU) plans to implement a substantial watershed-based stream habitat restoration project in Taylor Creek. Taylor Creek drains an approximately 640 acre watershed containing primarily residential land near the southern extent of the city of Seattle. Taylor Creek discharges between shoreline residences into the southwest corner of Lake Washington (Figure 1). The Lower Taylor Creek Improvement Project planned for Taylor Creek below Lakeridge Park includes multiple habitat restoration components: shoreline habitat restoration, relocation and restoration of the stream channel, restoration of fish passage by replacement of the fish passage barrier culvert under Rainier Avenue S, protection of City infrastructure, improvements to the channel high flow conveyance capacity, and enhanced ability to manage sediment delivery from the ravine upstream. The sediment control opportunity assessment documented in this report provides an updated evaluation of the nature of the sediment load delivered by the watershed and identifies opportunities for reducing and managing sediment load. SPU can apply the results of this analysis to inform the design of various elements of the Lower Taylor Creek Improvement Project as well as to supplement the project with cost effective sediment management actions identified in this report.
Confluence Environmental Company (Confluence) performed a geomorphic assessment within the Taylor Creek watershed to identify and describe sediment sources and analyze sediment routing processes. The results of the study will be used to inform the design phase of the Lower Taylor Creek Improvement Project. Objectives of the Taylor Creek Sediment Control Opportunity Study include:
• Evaluate the sensitivity and response of the channel to sediment loading.
• Determine the relative importance of geology and hydrology in estimating the amount of sediment loading to the stream. Estimate the delivery rate of the sediment load to the proposed project area downstream of Lakeridge Park.
• Determine the sensitivity of sediment discharge to variations in hydrology. Evaluate the potential to reduce sediment delivery by reducing peak flows.
• Identify opportunities to control sediment sources and sediment movement through the creek system.
• Assess opportunities for SPU to integrate the most promising sediment options into the stream and culvert project design.

Taylor Creek Sediment Control Opportunity Study
12/13/2012 Page 2
2.0 BACKGROUND
SPU has studied Taylor Creek over time for a variety of reasons. As a result, there is a relative abundance of watershed information relevant to the current sediment control opportunity study. The most relevant studies include:
Final Lower Taylor Creek Preliminary Concept Designs. Prepared for SPU by Osborn Consulting, Inc. and The Watershed Company, 2011.
Conceptual Design for Lower Taylor Creek – Hydrologic and Hydraulic Analysis Memorandum. Prepared for SPU by OCI, 2010.
Taylor Creek Sediment Study. Prepared for SPU by Perkins GeoSciences, 2007.
Addendum to Taylor Creek Sediment Study. Prepared for SPU by Perkins GeoSciences, 2008.
Seattle State of the Waters report, Volume 1. Prepared by SPU, 2007.
Taylor Creek is located in southeastern Seattle. One of the distinct attributes of Taylor Creek is the relative isolation and protection of this urban stream within the boundaries of Lakeridge Park. At the upstream end of Lakeridge Park, Taylor Creek is divided into an east fork and a west fork. Both tributaries originate in the Skyway area of unincorporated King County. Taylor Creek and its forks are approximately 2.7 miles in length, and the total watershed area is approximately 640 acres (SPU, 2007).
Geology of the watershed is typical of the Seattle area, and as a result Taylor Creek shares many similar attributes and issues of other regional urban streams draining through ravines into either Puget Sound or Lake Washington. The upland areas in the Taylor Creek watershed are underlain by silt, clay, sand, and gravel mixtures with low infiltration capacity and permeability. This combination of soil and geology can cause rapid surface water runoff and erosion where surficial soils have been removed. The in-stream sediments and deposits observed within the bottom of the ravine tend to be dense and are fairly resistant to erosive forces. The ravine walls are subject to landslides, which deliver gravel and sand to the stream channel (SPU, 2007).
In 1999, SPU replaced 3-ft diameter culverts at two road crossings on Holyoke Way. These old culverts were small and formed local constrictions for flow and sediment transport. The replacement culverts, both bottomless arch types, were designed to be fish passable and as a result have a much larger capacity to convey both water and sediment to the lower reaches of the creek.
In 2007, the Taylor Creek Sediment Study was prepared by Perkins GeoSciences (Perkins, 2007). This study included an analysis of Taylor Creek delta growth from 1939 to the present. The study calculated an average growth rate of 220 cubic yards per year for the period 1985 through 1997. Between 1999 and 2007, 40 cubic yards of gravel were deposited in a 700-foot-long reach below Rainier Avenue. From

Taylor Creek Sediment Control Opportunity Study
12/13/2012
Page 3
these observations we conclude that sediment delivery to lower Taylor Creek has been an issue for SPU and for streamside residents for some time.
In 2010 SPU initiated planning for the Lower Taylor Creek Improvement Project. This project will implement a comprehensive habitat restoration effort extending from the mouth of Taylor Creek at Lake Washington upstream to Lakeridge Park. The project includes the following objectives:
Replace the Taylor Creek culvert under Rainier Ave S to restore full fish passage, pass flows beyond the 25-year event, and minimize any flow constriction that would affect flooding of adjacent property.
Improve stream, floodplain, riparian, and shoreline habitat in the lower watershed.
If possible, provide full fish passage for salmonids from Lake Washington into Lakeridge Park.
Previous studies illustrate the historic issues associated with impacts of sediment load on infrastructure and private property in the watershed. The same issues have the potential to impair the success of the Lower Taylor Creek Improvement Project. SPU’s desire to understand and manage how the sediment load in the watershed may affect restoration project success and forms the primary motivation behind the present geomorphic analysis identifying sediment control opportunities in the Taylor Creek watershed.
3.0 APPROACH AND METHODS
The approach to the geomorphic study combines previous data and analysis with new observations and analysis to meet the project objectives. The primary components of the study are summarized below:
Document Review: Review previous data and analysis relevant to channel geomorphology, sediment loading, hydrology, hydraulics, and geology.
Field Data Collection: Conduct a field reconnaissance and data collection effort to address the following items:
o Identify sediment sources within Lakeridge Park.
o Describe and measure existing channel morphology at six representative cross sections.
o Identify opportunities to increase instream sediment storage using large woody debris (LWD) located over and adjacent to the channel.
o Identify locations within Lakeridge Park where recognizable landslide run out zones intersect Taylor Creek and deliver sediment to the stream.

Taylor Creek Sediment Control Opportunity Study
12/13/2012 Page 4
o Identify locations where surface water entering Lakeridge Park at the top of slope may influence sediment delivery.
Hydraulic Analysis: Calculate hydraulic conditions (e.g., velocity, depth, bed shear stress) at the representative cross sections.
Sediment Transport Analysis: Estimate sediment transport capacity and competence at the representative cross sections.
Sediment Management Opportunity Analysis: Estimate the quantity of additional instream storage potential associated with the instream sediment storage opportunities identified in the field survey.
3.1 Document Review
SPU provided background documents to Confluence in support of this project. Confluence conducted a focused review of the background documents by first screening the available reports, images, and data to determine which were directly relevant to the current geomorphic analysis. Relevant data and documents were then reviewed more thoroughly to identify specific data, images, and findings that could be applied within the geomorphic analysis. Data gaps identified in the document review informed the field data collection effort as well as the need for new analyses to verify, validate, and supplement previous sediment source and transport analysis. Documents that formed the core background information for the geomorphic assessment are listed below:
Final Lower Taylor Creek Preliminary Concept Designs. Prepared for SPU by Osborn Consulting, Inc. and The Watershed Company, 2011.
Conceptual Design for Lower Taylor Creek – Hydrologic and Hydraulic Analysis Memorandum. Prepared for SPU by OCI, 2010.
Taylor Creek Sediment Study. Prepared for SPU by Perkins GeoSciences, 2007.
Addendum to Taylor Creek Sediment Study. Prepared for SPU by Perkins GeoSciences, 2008.
Seattle State of the Waters report, Volume 1. Prepared by SPU, 2007.
3.2 Field Data Collection
Confluence scientists visited the study area on three successive days from September 19 through September 21, 2012. Photos from these visits are shown in Appendix A. During the September 19 site visit, Confluence and SPU staff conducted an initial reconnaissance of the greater Taylor Creek basin to gain familiarity with the landscape setting in relation to land use, as well as transportation and drainage infrastructure. Following the initial reconnaissance, CEC concluded that focused study of the geomorphic conditions and processes should be concentrated on primarily the lower portion of Taylor
Taylor Creek Sediment Control Opportunity Study
12/13/2012
Page 5
Creek within the confines of Lakeridge Park upstream of 68th Avenue North. The decision to concentrate on the channel within the park was two-fold: the park provides unrestricted public access; and the reach within the park’s ravine was considered likely to be most diagnostic of the sediment source concerns.
Beginning at the inlet of the culvert undercrossing at 68th Avenue South, Confluence walked the length of Taylor Creek using a hip-chain to measure longitudinal distance up the creek, making visual observations of channel conditions, signs of slope erosion and sediment deposition, composition of streambed and streambanks, vegetation along and within the channel, and the presence of structures. The reconnaissance focused on qualitatively documenting evidence of sediment supply and transport processes, while identifying instream opportunities to attenuate sediment transport. Data collected included the location and longitudinal distance of observed landslides, the presence of channel spanning logs that could be introduced as channel structure, and areas of potentially significant instream sediment storage opportunities. Additional observations included the size and composition of sediment and streambank material throughout the channel, and other geomorphic features including channel confinement and gradient characteristics.
To supplement the reconnaissance, Confluence surveyed five typical cross sections of Taylor Creek and its floodplain (Figure 2). Each cross-section survey also included a longitudinal profile to establish stream channel slope. The cross-section surveys were used simply to characterize the shape and dimensions of each cross section. These surveys do not include horizontal and vertical control, so all elevations reported are relative to an arbitrary datum. Confluence used a surveyor’s transit, tape measure, and stadia rod to collect streambed elevations and water depth data. The elevation data collected in the survey establish the channel geometry and relative elevation of channel cross sections sufficient for hydraulic analysis at each cross section.
3.3 Hydraulic Analysis
Confluence used the results of previous hydrologic analysis completed by Osborn in 2010 along with the cross section surveys to estimate the water surface elevation, flow velocity, and streambed shear stress for the estimated 2-yr and 100-yr flows (Table 1) at each of the 4 cross sections in main stem Taylor Creek. Flow values for the east fork and west fork were approximated by assuming that the flow value for the main stem was divided equally between the forks. The water surface elevation results were used to validate field estimation of the active channel dimensions based on geomorphic indicators. Flow velocity and shear stress results provided a basis for estimating sediment transport capacity, which helps to describe potential transport rates for delivering sediment from the primary sediment source areas in the main stem and forks of Taylor Creek to the Lower Taylor Creek Improvement Project area downstream.

Taylor Creek Sediment Control Opportunity Study
12/13/2012 Page 6
Table 1. Lower Taylor Creek Design Flows Flow Frequency (years) 1 2 10 25 100 Peak Flow (cfs) 46.2 58.2 83.1 95.0 111.8 Source: TWC, 2010
Manning’s Equation was used in an Excel spreadsheet to calculate water surface elevation, velocity, and boundary shear stress based on surveyed channel cross sections and channel slope. The equation makes use of channel geometry, channel gradient, and an estimated channel roughness value (Manning’s n) based on channel substrate and the degree of irregularity in channel and floodplain shape. An estimated Manning’s n value of n=0.034 was used in the present analysis. The flow rates estimated by previous hydrologic analysis completed by The Watershed Company (2010) were used to determine water surface elevations and hydraulic characteristics in each of the four main stem cross sections corresponding to those flow values. Specifically, the hydraulic calculations used an estimated 100-yr flow value of 111.8 cfs and an estimated 2-year flow value of 58.2 cfs. These values were compared to and deemed compatible with the most current available flow monitoring data provided by SPU. For the east fork and west fork, discharge values for 2-year and 100-year recurrence interval were approximated by assuming the forks each conveyed roughly 50 percent of the total discharge in the main stem.
In addition to determining hydraulic parameters, the hydraulic analyses also addressed the potential benefits of reductions in peak flow values in the basin to reduce sediment loading or attenuate sediment routing rates to the lower basin. This analysis evaluated the sensitivity of hydraulic and sediment transport parameters for two additional flow values reflecting a 10 percent reduction in peak flows for the 2-year and 100-year recurrence interval flows. The effects of regional detention and other potential stormwater management efforts on peak flow reduction were not explicitly modeled or evaluated as part of this sensitivity analysis.
3.4 Sediment Transport Analysis
Confluence used two sediment transport characteristics to evaluate sediment dynamics in the Taylor Creek channel. The first characteristic is sediment transport competence. The second characteristic is sediment transport capacity. These characteristics were determined for the 2-year and 100-year recurrence interval flow values at each of the 4 cross sections on the main stem. For the two cross sections surveyed on the east fork and the west fork, discharge values for 2-year and 100-year recurrence interval were approximated by assuming the forks each conveyed roughly 50 percent of the total discharge in the main stem.
In sediment transport analysis, “competence” is a technical term that describes the ability of a river or stream to mobilize a particular size of sediment. Sediment transport competence is typically stated as a maximum grain size (e.g., the channel is competent to mobilize all sediment up to 10 mm diameter). Competence usually varies along the channel with changes in channel geometry, gradient, and flow. When a stream channel traverses a geomorphic transition and becomes flatter or less confined, the

Taylor Creek Sediment Control Opportunity Study
12/13/2012
Page 7
competence of the channel is reduced and may result in sediment deposition if the appropriate larger sediment sizes are presently in transport. Sediment transport competence analysis relies on the Shields diagram to identify the critical shear stress associated with particular size sediment (Shields 1936, Vanoni 1975, Yalin 1977).
Sediment transport capacity describes the rate of sediment transport usually as a volume or mass of sediment per unit time (e.g., tons per year). Sediment transport capacity is determined by the hydraulic characteristics of the channel and the nature of the sediment supplied by and transported by the stream system. There are multiple empirically derived sediment transport equations each with its limitations and optimal application. The Engelund-Hanson Function (Engelund and Hansen 1972) was selected for the present analysis:
qs* = (0.05/Cf ) τ*2.5
Where qs* = dimensionless sediment transport rate,
Cf = friction factor, and
τ* : dimensionless shear stress.
3.5 Sediment Management Opportunities Analysis
The field reconnaissance identified the locations of LWD pieces greater than 24” diameter above and along the channel as well as specific areas in which sediment deposition within the channel and accessible floodplain could be enhanced by realignment of non-functioning LWD. Each of the instream sediment storage opportunities identified in the field reconnaissance was measured and sketched to provide approximate dimensions of the available depositional zone. These dimensions were combined with an estimated depth to develop an estimate of available instream sediment storage for each opportunity. The depth of increased sediment deposition was estimated by considering the diameter of the available nearby LWD piece or pieces. The cumulative total volume of potential new instream sediment deposition was estimated by summing the volume of each instream sediment storage opportunity.
During the field reconnaissance, Confluence scientists observed that the existing channel is very rough and contains a large amount of instream macro-structure comprising both LWD and large boulders. As a result of this observation, the assessment of instream sediment storage opportunities also included an assessment of storage potential under existing channel conditions. This total volume was estimated by using the length of the Main Stem Taylor Creek between the Holyoke Street Culvert and the forks confluence (2,349 ft), using an average channel of 15 ft width based on cross section survey results, and an assumed average sediment deposition depth of 1 ft throughout that channel length.

Taylor Creek Sediment Control Opportunity Study
12/13/2012 Page 8
Recommendations for potential instream sediment management opportunities are based on the following strategies:
Increase instream sediment storage through placement of additional functioning instream LWD structures
Stabilize or intercept sediment supply from side slopes or eroding stream banks
Intercept or divert surface water entering Lakeridge Park at the top of slope along the ravine
Reduce sediment delivery and attenuate sediment routing rates by reducing the magnitude of peak flows through regional detention or other stormwater management methods.
4.0 FIELD OBSERVATIONS
Confluence scientists conducted a 3-day field reconnaissance of the Taylor Creek watershed on September 19-21, 2012, focusing on documenting overall watershed conditions and collecting channel geomorphology data within the main stem and forks located within Lakeridge Park. Confluence conducted an additional half-day reconnaissance on November 6, 2012, focusing on observing landslide initiation points on the east slope of the ravine in Lakeridge Park. Specific observations are noted below for the watershed, the channel, and the ravine slopes.
4.1 Watershed Overview
The outline of the Taylor Creek watershed is shown on Figure 1 along with the stream channel alignment for the main stem, east fork, and west fork. The watershed includes a total area of approximately 640 acres and drainage derives primarily from residential land use. Confluence toured the watershed by car on September 19, 2012, along with SPU staff Katherine Lynch and Joe Starstead. The watershed tour focused on the portion of the drainage network within Lakeridge Park and publicly accessible locations within the upper watershed including road crossings and public property within the east fork and west fork areas. The reconnaissance did not include the lower watershed below the Holyoke Street culvert since that portion of the watershed is appropriately characterized in the Lower Taylor Creek Preliminary Concept Drawings Report (OCI, 2011). The following observations were recorded during the September 19, 2012 reconnaissance:
The West Fork Taylor Creek upstream of Renton Avenue S. flows approximately 2,000 feet through an extensive low gradient wetland complex. This landscape feature is a zone of sediment deposition and reduces the potential sediment load derived from the West Fork to the approximately 1,500 linear feet open channel extending downstream of Renton Avenue S. to the confluence of the East Fork and West Fork.
Much of the East Fork Taylor Creek upstream of S. 116 Place flows within an enclosed pipe. The open channel portion of the East Fork is limited to the low gradient reach located in Skyway

Taylor Creek Sediment Control Opportunity Study
12/13/2012
Page 9
Park and the reach extending primarily on private property downstream of S. 116 Place to the confluence of the East Fork and West Fork. The open channel within Skyway Park is not a significant source of sediment.
The primary potential sources of sediment within the East Fork and West Fork are located on private property. This limits SPUs ability to directly address those areas outside of Lakeridge Park.
Lakeridge Park comprises a forested ravine with steep side slopes, a trail along the west slope, and Taylor Creek at the bottom of the ravine. The primary source of sediment delivery to Taylor Creek appears to be a series of landslides located on the east slope upstream of Holyoke Way.
4.2 Main Stem Taylor Creek
Confluence scientists walked the main stem of Taylor Creek making observations of geomorphic conditions and surveying four stream cross sections. The cross-section survey locations were selected to represent the variability of local channel shape, width, depth, and gradient. Specific observations are listed below:
The main stem of Taylor Creek channel within Lakeridge Park contains frequent existing instream structure composed of LWD and boulders. The frequent and dramatic variations in flow constriction created by these structures create abundant instream sediment storage under existing conditions. While there is a modest amount of mobile sediment currently stored within and along the channel, the system is by no means “fully charged” with sediment, and there is abundant capacity to receive and temporarily store new sediment delivered from the ravine slopes.
Confluence selected four stream channel cross sections (XS1, XS2, XS3, and XS4) to represent the variability of local channel shape, width, depth, and gradient along the main stem of Taylor Creek. Cross-section locations are shown in Figures 2 and 3, Table 2, and cross sections are plotted in Figures 4 and 5. For each cross section, Confluence surveyed the channel cross section as high as feasible above the bank full channel as limited by sight lines. Each survey also included a longitudinal profile of the channel bed spanning the cross section and capturing transitions between pools, riffles, and steps over boulders and logs. Photos of stream cross sections are included in Appendix A – Photos.

12/13/2012 Page 10
Table 2. Locations of Cross-Section (XS) as shown on Figure 2 and 3.
Station Name
Distance Upstream
(ft) Notes
Holyoke Way
0 Station location at downstream end of Holyoke Way on Main Stem
XS1 290 Main Stem XS1 XS2 470 Main Stem XS2 XS3 875 Main Stem XS3 XS4 1,787 Main Stem XS4 XS5 39 East Fork , station is distance upstream of confluence XS6 138 West Fork , station is distance upstream of confluence Notes: All station locations are approximate. Field observations made in September 19-21, 2012. Holyoke Way is approximately 1,630 feet upstream from Lake Washington
The survey located six recognizable landslide deposits that intersect the stream bank on the east side of Taylor Creek upstream of Holyoke Way. Data collection included noting the stream length by station indicating the length of stream bank contacted by each landslide deposit. Each landslide deposit included a small amount of surface water flowing to the creek either as a small channel or a dripping seep of saturated soil along the stream bank. Landslide deposit locations are shown in Figure 3 and Table 3.
Table 3. Locations of Landslide Deposits on east Stream Bank of Main Stem Taylor Creek
Landslide Location
Distance Upstream from Holyoke Way
(ft)
Landslide (L1) 236-279 Landslide (L2) 383-578 Landslide (L3) 670-735 Landslide (L4) 790-885 Landslide (L5) 990-1026 Landslide (L6) 1481-1664
Notes: All station locations are approximate. Field observations made September 19-21, 2012 for L1 through L5
and on November 6, 2012 for L6.
Each piece of non-functioning LWD presents an opportunity to increase instream storage by repositioning the log to intersect stream flow. In addition to the 14 logs identified in the survey, six specific instream sediment storage opportunities (ISSOs) were identified and measured to

Taylor Creek Sediment Control Opportunity Study
12/13/2012 Page 11
support a rough estimate of potential sediment storage volume. ISSO locations are shown on Figure 2. ISSO stations and dimensions are summarized in Table 4.
Table 4. Locations of Instream Storage Opportunities (ISSO) as shown on Figure 2.
Station Name
Distance Upstream
(ft) Notes
Holyoke Way
0 Station location at downstream end of Holyoke Way on Main Stem
ISSO1 85-143 58 ft long, Existing LWD in channel at Station 85 and 143 ISSO2 236-279 43 ft long, 18" cedar spanner log at Station 279 ISSO3 530-560 30 ft long, 48" cedar spanner log at Station 530 ISSO4 1407-1448 41 ft long, 48" cedar spanner log at Station 1407 ISSO5 1554-1613 59 ft long, 36" cedar spanner log at Station 1554 ISSO6 1904-1945 41 ft long, 18" alder spanner log at Station 1904 Notes: All station locations are approximate. Field observations made in September 19-21, 2012. Holyoke Way is approximately 1,630 feet upstream from Lake Washington
Abundant non-functioning LWD exists along and above Taylor Creek within Lakeridge Park. The survey identified the approximate location, species, and diameter of logs that usually span the channel suspended above the range of flows (Figure 6). The survey identified spanner logs at least 18 inches diameter breast height (DBH). Spanner log data are summarized in Table 5. Photos of example spanner logs are included in Appendix A – Photos.

12/13/2012 Page 12
Table 5. Locations and Types of Spanner Logs.
Spanner Log Type
Distance Upstream from Holyoke Way
(ft)
Notes
cedar 279 Upstream end of ISSO2, 18" DBH (Diameter Breast Height) cedar 530 Downstream end of ISSO3, 48" DBH cedar 735 72" DBH cedar 950 Two cedar spanner logs: 24" DBH and 48" DBH cedar 1,065 36" DBH cedar 1,121 48" DBH cedar 1,336 72" DBH cedar 1,407 Downstream station of ISSO4, 48" DBH cedar 1,554 Downstream station of ISSO5, 36" DBH cedar 1,629 24" DBH cedar 2,006 18" DBH douglas fir 931 36" DBH alder 1,904 Downstream station of ISSO6 hemlock 652 36" DBH
Notes: All station locations are approximate. Field observations made September 19-21, 2012
Channel gradient within the main stem of Taylor Creek within Lakeridge Park was consistently about 5% with localized variations measured between 3.7% and 5.7% due primarily to instream structures. The overall approximate longitudinal profile of Taylor Creek is plotted using LIDAR data on Figure 7. Individual profile surveys at each cross section are not plotted, but the results consistently show an approximate gradient of 5% for the main stem of Taylor Creek located upstream of Holyoke Way.
Streambed composition throughout the main stem is primarily gravel and cobble with sand and frequent boulders. Some of the boulders are over 6 feet diameter. Photos of stream bed gravel were taken at each cross section, and example photos illustrating the variations in gravel types are included in Appendix A – Photos.
4.3 East Fork Taylor Creek
Confluence scientists walked the East Fork of Taylor Creek making observations of geomorphic conditions and surveying one stream cross section. The cross section survey location was selected to represent the channel shape, width, depth, and gradient of the East Fork channel within Lakeridge Park. Specific observations are listed below:
Taylor Creek Sediment Control Opportunity Study
12/13/2012 Page 13
The selected cross section location representing the channel dimensions observed within the east fork is shown in Figures 2 and 3, and the east fork cross section, XS5, is plotted in Figure 8.
Surveyed channel gradient within the East Fork within Lakeridge Park was approximately 5%. The gradient varied locally with the presence of a 3 feet high vertical step just upstream of the confluence and with the two concrete weirs observed within the channel. The overall approximate longitudinal profile of the East Fork of Taylor Creek is plotted using LIDAR data on Figure 9.
Streambed composition in the East Fork is primarily gravel with occasional cobbles. The large boulders observed in the main stem are absent from the East Fork.
LWD was much less frequent and smaller sized within the observed portion of the East Fork. There were no opportunities to reposition locally available LWD to promote instream sediment storage.
No landslide deposits were observed along the slopes above the East Fork within Lakeridge Park. Inspection of the slope revealed that soil composition was relatively loose and sandy, and while no landslides were observed, the slope appears susceptible to surface erosion of the sandy soil.
Within Lakeridge Park, the East Fork channel flows over two concrete weirs that appear to be components of a defunct instream facility. There is a broken culvert no longer conveying flow that formerly bypassed the relict structure. SPU staff indicated that within recent years the stream flowed through the culvert that is now abandoned, and the observed stream alignment flowing over the two concrete weirs represents a channel relocation that may have occurred on its own when the broken culvert failed.
There is a large relatively flat open area in the vicinity of the two concrete weirs observed in the channel, and an old access road extending up the slope to the south of this area. This zone may be a candidate location for installing a structure or facility to promote instream sediment storage. Confluence observed a sanitary sewer line manhole in the vicinity of the two concrete weirs. The presence of the sewer line may preclude the ability to construct a sediment storage facility at this location.
4.4 West Fork Taylor Creek
Confluence scientists walked the west fork of Taylor Creek within Lakeridge Park making observations of geomorphic conditions and surveying one stream cross section. The cross section survey location was selected to represent the channel shape, width, depth, and gradient of the west fork channel within Lakeridge Park. Specific observations are listed below:
Taylor Creek Sediment Control Opportunity Study
12/13/2012 Page 14
The selected cross section location representing the channel dimensions observed within the west fork is shown in Figures 2 and 3, and the west fork cross section, XS6, is plotted in Figure 8.
Surveyed channel gradient within the west fork within Lakeridge Park was approximately 5%. The overall approximate longitudinal profile of the West Fork of Taylor Creek is plotted using LIDAR data on Figure 10.
Streambed composition in the West Fork is primarily gravel with occasional cobbles. The large boulders observed in the main stem are absent from the west fork.
LWD was abundant within the observed portion of the West Fork, and the observed wood was largely functional in its current positioning to promote sediment deposition within and along the channel. There were no opportunities to reposition locally available LWD to promote instream sediment storage.
One landslide area was observed along the slopes above the west fork within Lakeridge Park. The landslide appears to have been initiated at the old access road noted previously and located immediately under the overhead power lines. The landslide scar is vegetated with uniform alders indicated that the slide moved several years ago and is not a current source of uncontrolled sediment input.
4.5 Ravine Side Slopes
On November 6, 2012, Confluence scientists traversed the east slope of the ravine to observe landslide initiation points and search for signs of surface water flowing onto the top of the ravine slope. Observations of the west slope were made from the trail on the west slope and from the stream bed during the surveys conducted September 19-21, 2012. Observations of the ravine side slopes are summarized below:
Confluence observed 5 landslides, during the September stream survey work, on the east slope that intersect with the stream bank of Taylor Creek and deliver sediment to the system. During the November 6, 2012 reconnaissance, Confluence observed an additional landslide from the top of slope that was not visible from the channel. The landslide locations are shown on Figure 6 and stations are identified on Table 3.
Confluence observed no landslide deposits intersection Taylor Creek on the west slope. No active landslides were observed above or below the trail on the west slope. The west slope does not appear to be a source of sediment due to active landslides.
Active landslide initiation points located on the east slope each occurred approximately ¾ of the distance up the slope from the stream bank. The headwall of each landslide was a near vertical wall composed of hard packed gravel, sand, and fines. Each headwall had either a
Taylor Creek Sediment Control Opportunity Study
12/13/2012 Page 15
flowing spring or saturated soil at the base of the wall where it transitions to the chute conveying landslide material downslope. This configuration suggests that landslide initiation in this zone occurred as a combination of shallow groundwater and geologic conditions.
5.0 ANALYSIS AND RESULTS
Analysis focused on evaluating hydraulic and sediment transport conditions at each of the surveyed cross sections, assessing the potential for peak flow reductions to reduce sediment delivery rates, and estimating the amount of additional in-stream sediment storage that could be achieved at the 6 in-stream sediment storage opportunities identified in the field. The analysis and results for each of these items are discussed in the following subsections.
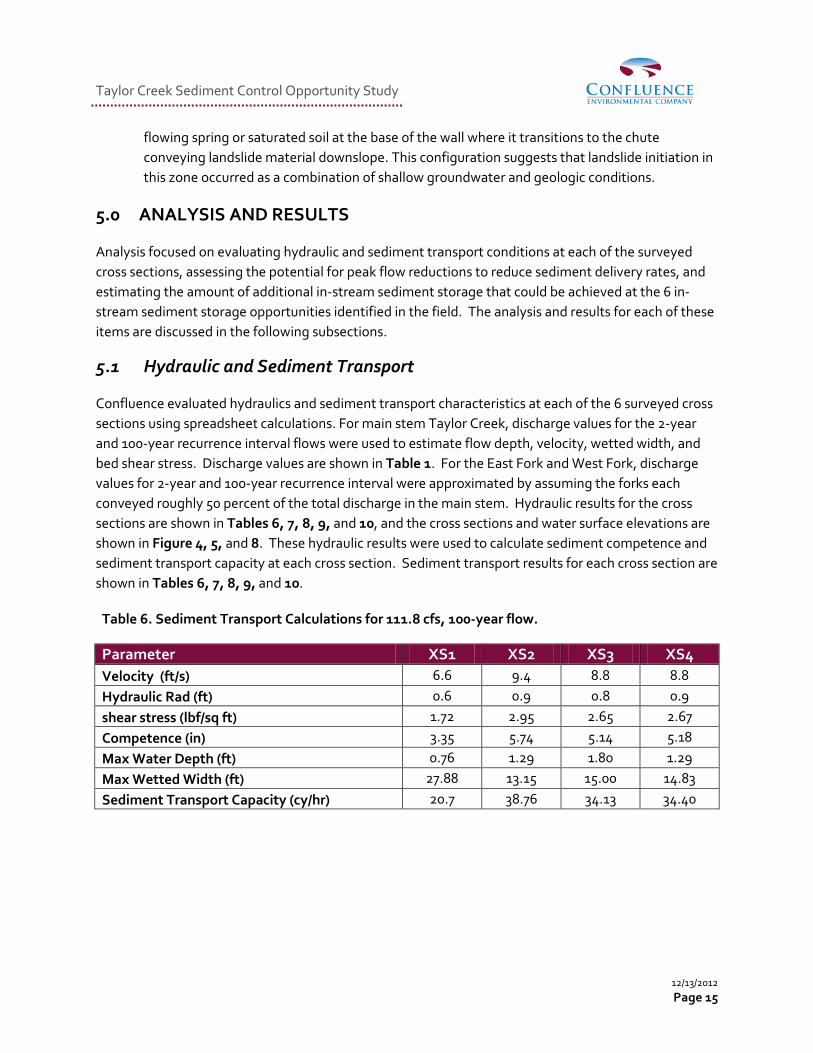
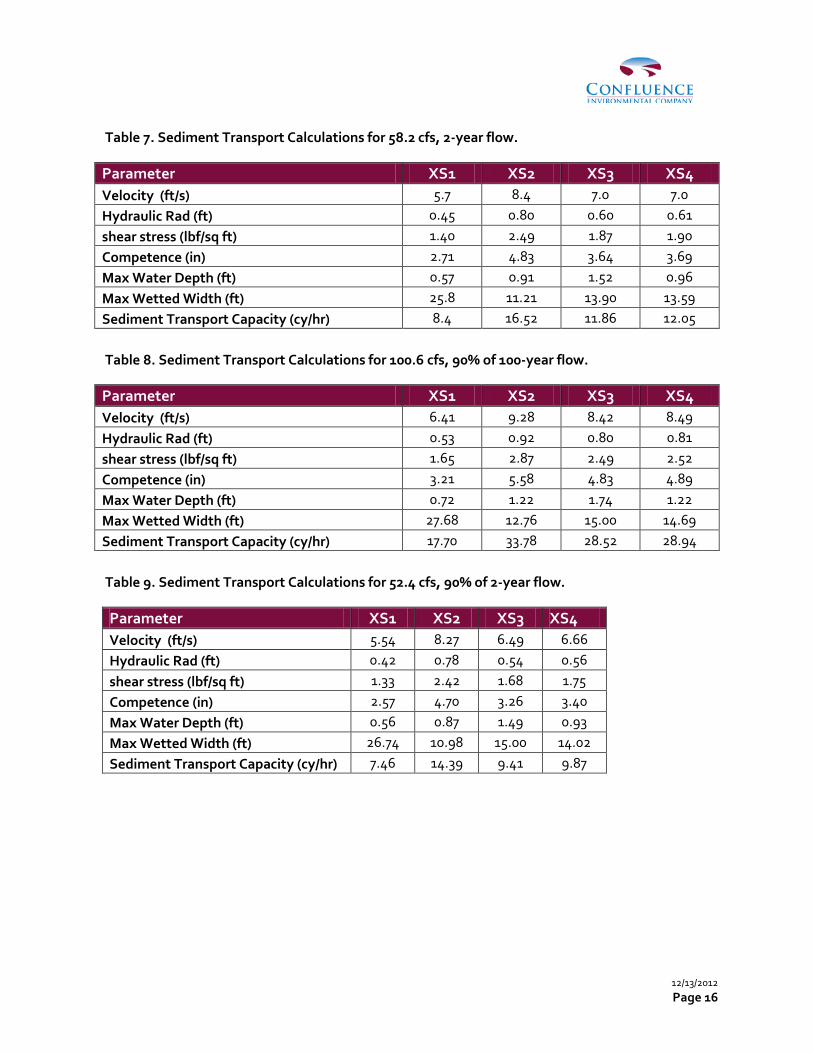
5.1 Hydraulic and Sediment Transport
Confluence evaluated hydraulics and sediment transport characteristics at each of the 6 surveyed cross sections using spreadsheet calculations. For main stem Taylor Creek, discharge values for the 2-year and 100-year recurrence interval flows were used to estimate flow depth, velocity, wetted width, and bed shear stress. Discharge values are shown in Table 1. For the East Fork and West Fork, discharge values for 2-year and 100-year recurrence interval were approximated by assuming the forks each conveyed roughly 50 percent of the total discharge in the main stem. Hydraulic results for the cross sections are shown in Tables 6, 7, 8, 9, and 10, and the cross sections and water surface elevations are shown in Figure 4, 5, and 8. These hydraulic results were used to calculate sediment competence and sediment transport capacity at each cross section. Sediment transport results for each cross section are shown in Tables 6, 7, 8, 9, and 10.
Table 6. Sediment Transport Calculations for 111.8 cfs, 100-year flow.
Parameter XS1 XS2 XS3 XS4 Velocity (ft/s) 6.6 9.4 8.8 8.8 Hydraulic Rad (ft) 0.6 0.9 0.8 0.9 shear stress (lbf/sq ft) 1.72 2.95 2.65 2.67 Competence (in) 3.35 5.74 5.14 5.18 Max Water Depth (ft) 0.76 1.29 1.80 1.29 Max Wetted Width (ft) 27.88 13.15 15.00 14.83 Sediment Transport Capacity (cy/hr) 20.7 38.76 34.13 34.40
12/13/2012 Page 16
Table 7. Sediment Transport Calculations for 58.2 cfs, 2-year flow.
Parameter XS1 XS2 XS3 XS4 Velocity (ft/s) 5.7 8.4 7.0 7.0 Hydraulic Rad (ft) 0.45 0.80 0.60 0.61 shear stress (lbf/sq ft) 1.40 2.49 1.87 1.90 Competence (in) 2.71 4.83 3.64 3.69 Max Water Depth (ft) 0.57 0.91 1.52 0.96 Max Wetted Width (ft) 25.8 11.21 13.90 13.59 Sediment Transport Capacity (cy/hr) 8.4 16.52 11.86 12.05 Table 8. Sediment Transport Calculations for 100.6 cfs, 90% of 100-year flow.
Parameter XS1 XS2 XS3 XS4 Velocity (ft/s) 6.41 9.28 8.42 8.49 Hydraulic Rad (ft) 0.53 0.92 0.80 0.81 shear stress (lbf/sq ft) 1.65 2.87 2.49 2.52 Competence (in) 3.21 5.58 4.83 4.89 Max Water Depth (ft) 0.72 1.22 1.74 1.22 Max Wetted Width (ft) 27.68 12.76 15.00 14.69 Sediment Transport Capacity (cy/hr) 17.70 33.78 28.52 28.94 Table 9. Sediment Transport Calculations for 52.4 cfs, 90% of 2-year flow.
Parameter XS1 XS2 XS3 XS4 Velocity (ft/s) 5.54 8.27 6.49 6.66 Hydraulic Rad (ft) 0.42 0.78 0.54 0.56 shear stress (lbf/sq ft) 1.33 2.42 1.68 1.75 Competence (in) 2.57 4.70 3.26 3.40 Max Water Depth (ft) 0.56 0.87 1.49 0.93 Max Wetted Width (ft) 26.74 10.98 15.00 14.02 Sediment Transport Capacity (cy/hr) 7.46 14.39 9.41 9.87

12/13/2012 Page 17
Table 10. Sediment Transport Calculations forXS5 and XS6 for 55.9 cfs, 50% of 100-year, and 29.1 cfs, 50% of the 2-year flows.
Parameter XS5 XS5 XS6 XS6 Flow (cfs) 29.10 55.90 29.10 55.90 Velocity (ft/s) 6.79 8.54 5.19 6.62 Hydraulic Rad (ft) 0.58 0.81 0.39 0.56 shear stress (lbf/sq ft) 1.80 2.54 1.20 1.73 Competence (in) 3.49 4.93 2.33 3.37 Max Water Depth (ft) 0.76 1.11 1.06 1.35 Max Wetted Width (ft) 7.43 8.05 14.57 15.19 Sediment Transport Capacity (cy/hr) 5.66 16.23 3.53 10.41
The results of the hydraulic analysis reflect the variability of cross section shape. The relatively steep stream gradient of 5% prevails consistently among the cross sections, but channel width varies from about 7 feet at cross section 5 (East Fork) to 26 feet at cross section 1. Velocities of 6 to 8 feet per second are consistent with the relatively steep channel gradient of 5%. Overall the hydraulic results are compatible with the observed channel conditions and provide a reasonable approximation to support the present analysis.
Sediment transport competence and capacity commonly vary widely along a stream system, and those variations are reflected in the variations in streambed material and transitions between depositional zones and transport reaches. The results of the sediment transport analysis show relative consistency in competence and transport capacity suggesting that generally the forks and the main stem channel are primarily transport reaches that convey sediment further downstream. Sediment transport competence values varied between approximate gravel diameters of 3 – 6 inches. This result is validated by the typical composition of the streambed and gravel bars observed during the reconnaissance, which reflect the transportable sediment load. The lowest estimated sediment transport capacity for the 2-year flow on main stem Taylor Creek was 8.4 cubic yards per hour. For the 100-year flow, it was 20.7 cubic yards per hour. Capacity does not reflect the actual sediment load, but it estimates the potential for the system to deliver sediment downstream under conditions of infinite supply.
Previous sediment transport analysis completed for Taylor Creek yielded an estimated average annual sediment discharge of approximately 200 cubic yards per year with the caveat that this total could vary widely. Among the surveyed cross sections of the main stem of Taylor Creek, the minimum estimated sediment transport capacity was 8.4 cubic yards per hour at XS1. In comparing these numbers, it is notable that the channel would have to convey sediment at the capacity of the 2-year flow rate for a total of approximately 24 hours over the course of a wet season to produce the average estimated annual sediment discharge. This appears to represent a reasonable validation of the previous estimate prepared by Perkins Geosciences.

Taylor Creek Sediment Control Opportunity Study
12/13/2012 Page 18
5.2 Sensitivity of Sediment Transport to Flow Reduction
In addition to determining hydraulic parameters, the hydraulic analysis also addressed the potential benefits of reductions in peak flow values in the basin to reduce sediment loading or to attenuate sediment routing rates to the lower basin. This analysis evaluated the sensitivity of hydraulic and sediment transport parameters for two additional flow values reflecting a 10 percent reduction in peak flows for the 2-year and 100-year recurrence interval flows. The lowest estimated values for competence and capacity along the main stem of Taylor Creek were observed at cross section 1. This cross section was used to illustrate the potential reduction in sediment transport competence and capacity since this would be a limiting point for sediment transport within the study area. Tables 8 and 9 present the potential reduction in competence and transport capacity possible with reductions in peak flow values. As an example, at cross section 1 a 10% reduction in the 2-year flow value would reduce competence from 3.4 inches to 3.2 inches. This reduction is less than the variability of these parameters between the surveyed cross sections. It is unlikely that flow reduction would meaningfully affect sediment transport capacity through the main stem channel or promote additional sediment storage.
This analysis is a rough sensitivity analysis and the results are very limited in their applicability beyond this study. The use of 10% reduction in flow values was an arbitrary value used only to illustrate the sensitivity of the relation between sediment transport and flow reduction.
5.3 In-stream Sediment Storage Opportunities
The field survey identified and measured the approximate dimensions of six in-stream sediment storage opportunities along the main stem of Taylor Creek within the ravine. These locations and their dimensions are listed on Table 4 and shown on Figure 2. For each of these locations, large downed trees either clear span the channel well above active flows or are present adjacent to but above the channel. The locations, sizes, and species of these downed trees are summarized on Table 5. It is notable that these trees range in size from 2 -6 feet in diameter. One strategy for increasing temporary in-stream sediment storage would be to reposition those trees in each of the observed areas to create a localized deposition zone. The analysis focuses on estimating the individual and total potential sediment storage volume that could be gained by applying this approach.
Potential storage volume estimates were made by assuming a uniform depth of 2 feet of sediment deposition within each of the 6 identified storage areas and multiplying by the area available as measured in the field. Results of this volume estimate are shown in Table 11. The total potential increase in in-stream sediment storage that would be produced by this approach is approximately 507 cubic yards. This total is larger than the total annual sediment discharge of 200 cubic yards estimated by Perkins Geosciences (2007). This comparison suggests that the additional storage would have the ability to smooth out the sediment signal and extend the period over which a rapid sediment influx from slopes or from upstream would be delivered by the stream to lower Taylor Creek.

Taylor Creek Sediment Control Opportunity Study
12/13/2012 Page 19
Confluence scientists observed that the existing channel is very rough and contains a large amount of instream macro-structure comprising both LWD and large boulders. This total volume was estimated by using the length of the Main Stem Taylor Creek between the Holyoke Street Culvert and the forks confluence (2,349 ft), using an average channel of 15 ft width based on cross section survey results, and an assumed average sediment deposition depth of 1 ft throughout that channel length. Using this approach estimates the available storage to be 1,305 cubic yards in the main stem channel under under existing channel conditions.
Table 11. ISSO Length, Width, Depth, and Volume Calculations.
ISSO Length
(ft)
Average Width
(ft)
Depth (ft)
Volume (cubic ft)
Volume (cubic yards)
ISSO1 58 27 2 3132 116 ISSO2 43 26 2 2236 83 ISSO3 30 21 2 1260 47 ISSO4 41 35 2 2870 106 ISSO5 59 21 2 2439 90 ISSO6 41 21 2 1749 65 Total 13686 507
6.0 RECOMMENDATIONS
Landslides along the east slope of the ravine containing the main stem of Taylor Creek appear to be the largest identifiable source of sediment loading to the system. Landslides have the potential to produce very large sediment loads in a short term episodic mode. For this type of sediment delivery mechanism, attenuation of the sediment transport signal can be an effective strategy alongside a downstream sediment trapping facility. Reductions in the transport rate through attenuation could be used to reduce the immediacy and urgency of cleaning out the sediment trap facility. Spreading out the sediment delivery signal over time potentially reduces the required effective storage volume of the sediment trapping facility.
Instream storage opportunities provide enough additional instream storage to temporarily store approximately 507 cubic yards of sediment behind new in-stream LWD structures. This volume is larger than the estimated annual sediment delivery rate of 200 cubic yards. We recommend enhancing instream sediment storage to provide temporary attenuation of the sediment delivery rate that would be experienced in the lower watershed. The most effective actions would occur along the main stem of Taylor Creek within the ravine in Lakeridge Park. The proposed repositioning of large diameter (e.g. 3-6 feet) in the stream channel has the potential to create fish passage barriers. If this approach is adopted, SPU will need to take care in determining in advance effective log orientations and positions to effectively trap sediment while preserving fish passage around the LWD structures.

Taylor Creek Sediment Control Opportunity Study
12/13/2012 Page 20
The Taylor Creek main stem channel within the ravine is difficult to access, and placement of LWD imported from off site would be potentially very disruptive to the valley slopes, floodplain, and channel. We recommend using available on-site LWD that is suspended above the active channel or positioned close to the stream on the side slope out of the active channel. We recommend using a low-impact non-mechanical approach (e.g,. labor, chain saws, and portable winches) to minimize temporary construction impacts and construction costs.
Opportunities to directly stabilize the slopes on the east side of the ravine are limited. Observations of the landslide initiation points high on the slopes illustrate that landslide initiation occurs in response to subsurface conditions including geology and seepage that seasonally saturates potential slope failure zones. Slope stabilization activities using equipment would create large disruptions that would be counterproductive to promoting slope stability. Surface treatments implemented with laborers without large mechanical equipment would provide the equivalent of temporary erosion control, but such actions would have little if any effect on the initiation of deeper slope failures. We recommend that SPU does not engage in slope stabilization efforts as part of this effort.
No specific surface water sources entering the top of the ravine slopes were identified during the field reconnaissance traversing the east slope of the ravine within Lakeridge Park. Additionally, each of the landslides observed during the field reconnaissance appeared to be initiated by shallow subsurface water flow rather than surface water runoff. SPU provided a map showing two stormwater outfalls at the top of slope (Figure 11), and both of these outfalls discharge street runoff directly above existing landslides. These two surface water sources should be considered a potential slope hazard risk, we recommend SPU consider working with King County to find ways to route the drainage away from slope failure hazard zones.
SPU intends to potentially install a sediment trapping facility in lower Taylor Creek. We recommend that the effects of sediment attenuation be used to reduce the design sediment deposition capacity and inform the maintenance protocol for the facility. The previously estimate annual sediment load of 200 cubic yards (Perkins 2007) may be legitimately reduced to a smaller value, whether by enhanced instream storage or by consider the effects of existing instream storage potential. Any design would still need to account for temporal variability in annual sediment load.
In addition to the other planned or pending options, we recommend that SPU evaluate and consider installing another in-line sediment trap on the east fork just upstream of the forks confluence (100 ft upstream of XS5. This zone is relatively broad and locally flat with a defunct access road and relict concrete structures in the East Fork channel. Utility conflicts with the sanitary sewer line and the overhead power lines may preclude or at least limit the scale and potential configuration of a sediment trapping facility. We recommend that SPU consider as another option configuring this zone as another temporary sediment storage zone through the placement of LWD or modification of the existing concrete weirs.

Taylor Creek Sediment Control Opportunity Study
12/13/2012 Page 21
Sensitivity analysis revealed that a 10 percent reduction in peak flow rates would have an incrementally small effect on sediment transport within the main stem of Taylor Creek. Therefore we do not recommend the installation of new stormwater management facilities for the sole purpose of reducing sediment load. If regional stormwater management facilities are developed within the basin to serve other purposes, there may be an incremental small benefit of reducing the sediment delivery rate to the lower basin.
The following recommendations are provided in the order of priority based on potential to effectively support SPU’s goals for sediment management.
Confluence recommends increasing in-stream storage potential by repositioning large downed trees located in close proximity to the main stem channel. This action will supplement the existing buffering capacity the main stem channel has for temporarily storing large sediment inputs and metering out the sediment delivery to the lower watershed over time.
Confluence recommends a future evaluation to determine the feasibility of installing sediment trapping facilities within the watershed as part of the lower Taylor Creek Improvement Project. We recommend that SPU include an evaluation of the East Fork within Lakeridge Park as a candidate site.
Confluence recommends against developing regional stormwater detention facilities solely for the purpose of reducing sediment load in Taylor Creek. If such facilities are developed for a broader suite of performance goals, they would provide an incremental benefit to reducing the rate of sediment delivery to the lower watershed.
Confluence recommends against intrusive activities to directly stabilize the landslides located on the eastern slope of the ravine above the main stem. Stabilization efforts in that setting would be dangerous and have high potential to destabilize the slopes.
Confluence recommends that SPU contact King County to advocate for intercepting stormwater runoff that is currently discharged to the eastern slope of the ravine. It may be possible to intercept and reroute that water and reduce the risk of erosion on that slope.
7.0 REFERENCES
Engelund, F. and E. Hansen. 1972. A Mongraph on Sediment transport in Alluvial Streams. Teknisk Forlag, Copenhagen.
Meyer-Peter, E; Müller, R. 1948. Formulas for bed-load transport. Proceedings of the 2nd Meeting of the International Association for Hydraulic Structures Research. pp. 39–64
OCI, 2010. Conceptual Design for Lower Taylor Creek – Hydrologic and Hydraulic Analysis Memorandum (Appendix A of the Final Lower Taylor Creek Preliminary Concept Designs).
Taylor Creek Sediment Control Opportunity Study
12/13/2012 Page 22
OCI (Osborn Consulting, Inc.) and TWC (The Watershed Company), 2011. Final Lower Taylor Creek Preliminary Concept Designs. Prepared for Seattle Public Utilities. February 21, 2011.
Perkins (Perkins GeoSciences), 2007. Taylor Creek Sediment Study. Prepared for Seattle Public Utilities, Washington.
Perkins, 2008. Addendum to Taylor Creek Sediment Study. Prepared for Seattle Public Utilities, Washington.
Shields, A., 1936, Application of similarity principles and turbulence research to bed load movement, Versuchsant fur Wasserbau und Schiffbau, Berlin, No. 26. (in German).
SPU (Seattle Public Utilities). 2007. Seattle state of the waters report, Volume 1.
Vanoni, V.A. 1975. Sedimentation Engineering, Manual and Report No. 54, American Society of Civil Engineers, New York, N.Y.
Yalin, M.S. 1977. The Mechanics of Sediment transport, second edition. Pergamon Press, Oxford United Kingdom. xiv + 298pp.

Figures

This page intentionally left blank
for double-sided printing

J:\001076_Seattle Public Utilities\Reports\Report-Final-Dec 2012\Figures\Figure 1-Watershed Boundary_12042012.Docx 12/4/2012
Source: Seattle 2012
FIGURE 1
Taylor Creek Watershed Boundary
Taylor Creek Sediment Control Opportunity Study Seattle, WA
for Seattle Public Utilities
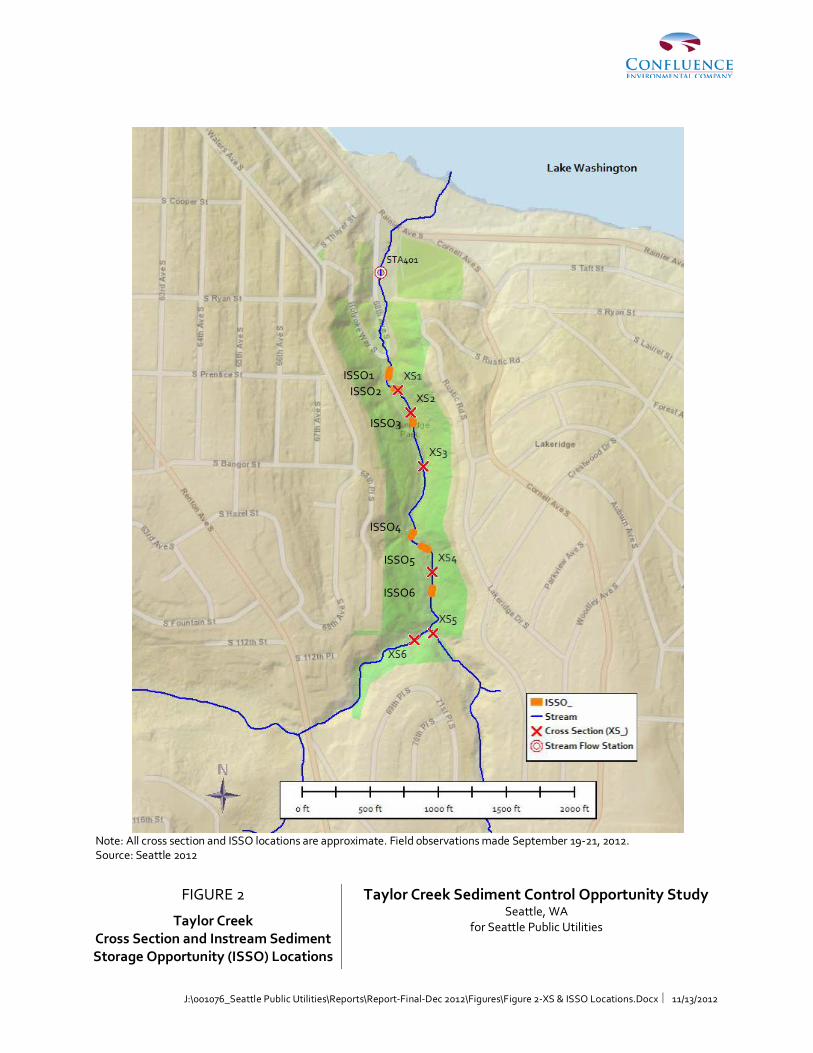
J:\001076_Seattle Public Utilities\Reports\Report-Final-Dec 2012\Figures\Figure 2-XS & ISSO Locations.Docx 11/13/2012
Note: All cross section and ISSO locations are approximate. Field observations made September 19-21, 2012. Source: Seattle 2012
FIGURE 2
Taylor Creek Cross Section and Instream Sediment Storage Opportunity (ISSO) Locations
Taylor Creek Sediment Control Opportunity Study Seattle, WA
for Seattle Public Utilities
ISSO1 ISSO2
ISSO3
ISSO5
ISSO6
ISSO4

J:\001076_Seattle Public Utilities\Reports\Report-Final-Dec 2012\Figures\Figure 3-Landslide Locations 12042012.Docx 12/4/2012
Note: All cross section and landslide locations are approximate. Field observations made in September 19-21, 2012. Source: Seattle 2012
FIGURE 3
Landslide Locations
Taylor Creek Sediment Control Opportunity Study Seattle, WA
for Seattle Public Utilities

J:\001076_Seattle Public Utilities\Reports\Report-Final-Dec 2012\Figures\Figure 4-2 Yr Water Surface Elelvations.Docx 11/19/2012
1516171819202122232425
0 5 10 15 20 25 30 35 40 45 50
Elev
atio
n (f
t)
Distance Across Channel (ft)
XS1
Bed ElevationWater Surface Elevation (2-yr)
1516171819202122232425
0 5 10 15 20 25 30 35 40 45 50
Elev
atio
n (f
t)
Distance Across Channel (ft)
XS2
Bed ElevationWater Surface Elevation (2-yr)
1516171819202122232425
0 5 10 15 20 25 30 35 40 45 50
Elev
atio
n (f
t)
Distance Across Channel (ft)
XS3
Bed ElevationWater Surface Elevation (2-yr)
1516171819202122232425
0 5 10 15 20 25 30 35 40 45 50
Elev
atio
n (f
t)
Distance Across Channel (ft)
XS4
Bed ElevationWater Surface Elevation (2-yr)
FIGURE 4
2-Year Water Surface Elevations at Cross Sections on Main Stem (XS1-XS4)
Taylor Creek Sediment Control Opportunity Study Seattle, WA
for Seattle Public Utilities

J:\001076_Seattle Public Utilities\Reports\Report-Final-Dec 2012\Figures\Figure 5-100 Yr Water Surface Elelvations.Docx 11/19/2012
1516171819202122232425
0 5 10 15 20 25 30 35 40 45 50
Elev
atio
n (f
t)
Distance Across Channel (ft)
XS1
Bed ElevationWater Surface Elevation (100-yr)
1516171819202122232425
0 5 10 15 20 25 30 35 40 45 50
Elev
atio
n (f
t)
Distance Across Channel (ft)
XS2
Bed ElevationWater Surface Elevation (100-yr)
1516171819202122232425
0 5 10 15 20 25 30 35 40 45 50
Elev
atio
n (f
t)
Distance Across Channel (ft)
XS3
Bed ElevationWater Surface Elevation (100-yr)
1516171819202122232425
0 5 10 15 20 25 30 35 40 45 50
Elev
atio
n (f
t)
Distance Across Channel (ft)
XS4
Bed ElevationWater Surface Elevation (100-yr)
FIGURE 5
100-Year Water Surface Elevations at Cross Sections on Main Stem (XS1-XS4)
Taylor Creek Sediment Control Opportunity Study Seattle, WA
for Seattle Public Utilities

J:\001076_Seattle Public Utilities\Reports\Report-Final-Dec 2012\Figures\Figure 6-Spanner Log Locations.Docx 11/13/2012
Note: All ISSO and spanner log locations are approximate. Field observations made September 19-21, 2012. Source: Seattle 2012
FIGURE 6
Main Stem Taylor Creek Spanner Log Locations
Taylor Creek Sediment Control Opportunity Study Seattle, WA
for Seattle Public Utilities

J:\001076_Seattle Public Utilities\Reports\Report-Final-Dec 2012\Figures\Figure 7-Main Stem Profile.Docx 11/14/2012
Notes: LIDAR may provide artificial elevation where large logs or culverts span the channel. Source: LIDAR 2000
0
50
100
150
200
250
300
350
0 500 1000 1500 2000 2500 3000 3500 4000 4500
Elev
atio
n (f
t) (N
AV
D88
)
Distance Upstream of Lake Washington (ft)
Main Stem Taylor Creek Profile
Holyoke Way S
FIGURE 7
Main Stem Taylor Creek Profile LIDAR Elevations
Taylor Creek Sediment Control Opportunity Study Seattle, WA
for Seattle Public Utilities
Lake Washington
Confluence with East and West Fork Taylor Creek

J:\001076_Seattle Public Utilities\Reports\Report-Final-Dec 2012\Figures\Figure 8-2 Yr & 100 Yr E-W Fork Water Surface Elelvations.Docx 11/20/2012
1516171819202122232425
0 5 10 15 20 25 30 35 40 45 50
Elev
atio
n (f
t)
Distance Across Channel (ft)
XS5-East Fork
Bed ElevationWater Surface Elevation (50% of 2-yr)
1516171819202122232425
0 5 10 15 20 25 30 35 40 45 50
Elev
atio
n (f
t)
Distance Across Channel (ft)
XS5-East Fork
Bed ElevationWater Surface Elevation (50% of 100-yr)
1516171819202122232425
0 5 10 15 20 25 30 35 40 45 50
Elev
atio
n (f
t)
Distance Across Channel (ft)
XS6-West Fork
Bed ElevationWater Surface Elevation (50% of 2-year)
1516171819202122232425
0 5 10 15 20 25 30 35 40 45 50El
evat
ion
(ft)
Distance Across Channel (ft)
XS6-West Fork
Bed ElevationWater Surface Elevation (50% of 2-year)
FIGURE 8
2-Year and 100-Year Water Surface Elevations at XS5 (East Fork) and XS6 (West Fork)
Taylor Creek Sediment Control Opportunity Study Seattle, WA
for Seattle Public Utilities

J:\001076_Seattle Public Utilities\Reports\Report-Final-Dec 2012\Figures\Figure 9-East Fork Profile.Docx 11/14/2012
Notes: LIDAR may provide artificial elevation where large logs or culverts span the channel. Source: LIDAR 2000
0
50
100
150
200
250
300
350
0 500 1000 1500 2000 2500 3000 3500 4000 4500 5000
Elev
atio
n (f
t) (N
AV
D88
)
Distance Upstream of Confluence with Main Stem Taylor Creek (ft)
Renton Ave S
FIGURE 9
East Fork Taylor Creek Profile
Taylor Creek Sediment Control Opportunity Study Seattle, WA
for Seattle Public Utilities
Confluence with Main Stem Taylor Creek

J:\001076_Seattle Public Utilities\Reports\Report-Final-Dec 2012\Figures\Figure 10-West Fork Profile.Docx 11/14/2012
Notes: LIDAR may provide artificial elevation where large logs or culverts span the channel. Source: LIDAR 2000
0
50
100
150
200
250
300
350
0 1000 2000 3000 4000 5000 6000
Elev
atio
n (f
t) (N
AV
D88
)
Distance Upstream of Confluence with Main Stem Taylor Creek
Confluence with Main Stem Taylor Creek
S 115th Street
FIGURE 10
West Fork Taylor Creek Profile
Taylor Creek Sediment Control Opportunity Study Seattle, WA
for Seattle Public Utilities

J:\001076_Seattle Public Utilities\Reports\Report-Final-Dec 2012\Figures\Figure 11-Taylor Creek_Lakeridge Park FINAL.Docx 12/4//2012
. Source: Seattle 2012
FIGURE 11
Taylor Creek/Lakeridge Park Skyway Surface Drainage Outfalls
Taylor Creek Sediment Control Opportunity Study Seattle, WA
for Seattle Public Utilities

This page intentionally left blank
for double-sided printing

Appendix Site Photographs

This page intentionally left blank
for double-sided printing

PHOTO APPENDIX: TAYLOR CREEK SEDIMENT CONTROL OPPORTUNITY STUDY
11/21/2012 Page 1
Photo 1— Looking upstream at XS1, (taken by CEC on 9/20/12).
Photo 2— Streambed gravel at XS1 (taken by CEC on 9/20/12).

Taylor Creek Sediment Control Opportunity Study – Photo Appendix
11/21/2012 Page 2
Photo 3— Looking upstream at XS2, (taken by CEC on 9/20/12).
Photo 4— Streambed gravel at XS2 (taken by CEC on 9/20/12).

Taylor Creek Sediment Control Opportunity Study – Photo Appendix
11/21/2012 Page 3
Photo 5 – Looking upstream at XS3, (taken by CEC on 9/20/12).
Photo 6 – Streambed gravel at XS3 (taken by CEC on 9/20/12).

Taylor Creek Sediment Control Opportunity Study – Photo Appendix
11/21/2012 Page 4
Photo 7— Looking upstream at XS4, (taken by CEC on 9/21/12).
Photo 8— Streambed gravel at XS4 (taken by CEC on 9/21/12).

Taylor Creek Sediment Control Opportunity Study – Photo Appendix
11/21/2012 Page 5
Photo 9— Looking downstream at XS5, (taken by CEC on 9/21/12).
Photo 10— Streambed gravel at XS5 (taken by CEC on 9/21/12).

Taylor Creek Sediment Control Opportunity Study – Photo Appendix
11/21/2012 Page 6
Photo 11—Looking upstream at XS6, (taken by CEC on 9/21/12).

Taylor Creek Sediment Control Opportunity Study – Photo Appendix
11/21/2012 Page 7
Photo 12— Typical cedar spanner log (taken by CEC on 9/20/12).
Photo 13— Typical cedar spanner log (taken by CEC on 9/20/12).

Taylor Creek Sediment Control Opportunity Study – Photo Appendix
11/21/2012 Page 8
Photo 14— Looking upstream at perched culvert (taken by CEC on 9/21/12).
Photo 15— Looking upstream at culvert upstream of XS5 (taken by CEC on 11/6/12).

Taylor Creek Sediment Control Opportunity Study – Photo Appendix
11/21/2012 Page 9
Photo 16— Looking across channel at weir upstream of XS5 (taken by CEC on 9/21/12).
Photo 17— Looking upstream at weir upstream of XS5 (taken by CEC on 11/6/12).

Taylor Creek Sediment Control Opportunity Study – Photo Appendix
11/21/2012 Page 10
Photo 18— Looking at landslide on east slope of Main Stem Taylor Creek (taken by CEC on 11/6/12).