taxonomy of intrusion risk assessment and response...
TRANSCRIPT

Taxonomy of Intrusion Risk Assessment and Response System
Alireza Shameli-Sendi1, Mohamed Cheriet1, and Abdelwahab Hamou-Lhadj2
Department of Electrical and Computer Engineering, Ecole de Technologie Superieure (ETS), Montreal, Canada1
Department of Electrical and Computer Engineering, Concordia University, Montreal, Canada2
[email protected], [email protected], [email protected]
Abstract
In recent years, we have seen notable changes in the way attackers infiltrate computer systems compromisingtheir functionality. Research in intrusion detection systems aims to reduce the impact of these attacks. In thispaper, we present a taxonomy of intrusion response systems (IRS) and Intrusion Risk Assessment (IRA), twoimportant components of an intrusion detection solution. We achieve this by classifying a number of studiespublished during the last two decades . We discuss the key features of existing IRS and IRA. We show howcharacterizing security risks and choosing the right countermeasures are an important and challenging part ofdesigning an IRS and an IRA. Poorly designed IRS and IRA may reduce network performance and wronglydisconnect users from a network. We propose techniques on how to address these challenges and highlight theneed for a comprehensive defense mechanism approach. We believe that this taxonomy will open up interestingareas for future research in the growing field of intrusion risk assessment and response systems.
Keywords
Intrusion detection system, Intrusion response system, Intrusion risk assessment, Response time, Prediction,Response cost, Attack graph, Service dependency graph.
I. INTRODUCTION
Today’s society relies increasingly on network services to manage its critical operations in a variety ofdomains including health, finances, public safety, telecommunication, and so on. It is therefore importantto maintain high-availability and adequate response time of these services at all time. This is threatenedby the presence of hostile attackers that look for ways to gain access to systems and infect computers[1]. To mitigate these threats, the deployment of an appropriate defense mechanism is needed. AsFigure 1 illustrates, the defense life-cycle includes four phases: Prevention, Monitoring, Detection, andMitigation. The prevention phase ensures that appropriate safeguards are placed in different locations tosecure services and data. In the monitoring phase, monitoring tools are deployed to gather useful hostor network information to follow the execution of the system. The detection phase is where an IntrusionDetection System (IDS) analyzes the running systems, looking for deviations from a pre-establishednormal behaviour.
IDSs vary depending on whether they monitor network traffic (Network-based IDS) or local hosts(Host-based IDS)[18], [20], [21], [22], [23]. IDSs are divided into two categories: anomaly-based andsignature-based. Anomaly-based techniques rely a two-step process. The first step, the training phase,a classifier is built using a machine learning algorithm, such as a decision trees, Bayesian Network, aNeural Network, etc. [24], [25], [26]. The second step, the testing phase, tests the detection accuracy (bymeasuring true positive and false positive rates). The anomaly-based detection approach is able to detectunknown attack patterns and does not need predefined signatures. However, it suffers from the problemof characterizing the normal behavior. Signature-based techniques (also known as misuse detection) [27],on the other hand, rely on known patterns (signatures) of attacks. Pattern matching makes this technique
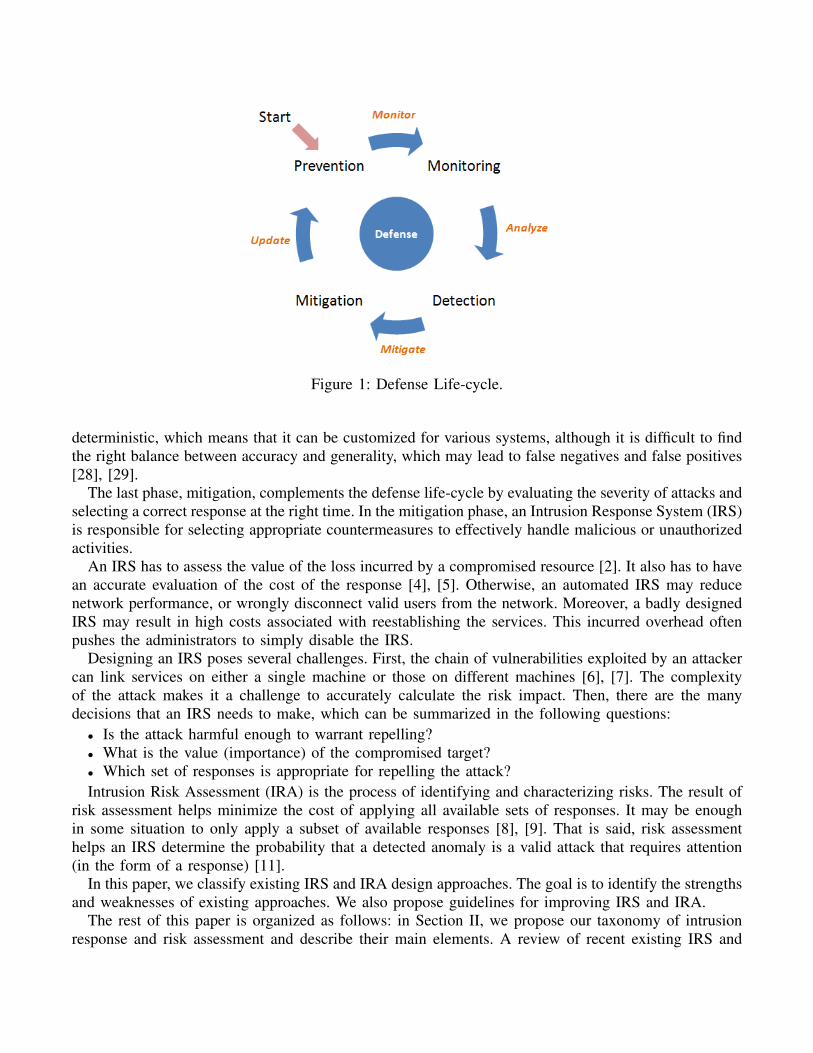
Figure 1: Defense Life-cycle.
deterministic, which means that it can be customized for various systems, although it is difficult to findthe right balance between accuracy and generality, which may lead to false negatives and false positives[28], [29].
The last phase, mitigation, complements the defense life-cycle by evaluating the severity of attacks andselecting a correct response at the right time. In the mitigation phase, an Intrusion Response System (IRS)is responsible for selecting appropriate countermeasures to effectively handle malicious or unauthorizedactivities.
An IRS has to assess the value of the loss incurred by a compromised resource [2]. It also has to havean accurate evaluation of the cost of the response [4], [5]. Otherwise, an automated IRS may reducenetwork performance, or wrongly disconnect valid users from the network. Moreover, a badly designedIRS may result in high costs associated with reestablishing the services. This incurred overhead oftenpushes the administrators to simply disable the IRS.
Designing an IRS poses several challenges. First, the chain of vulnerabilities exploited by an attackercan link services on either a single machine or those on different machines [6], [7]. The complexityof the attack makes it a challenge to accurately calculate the risk impact. Then, there are the manydecisions that an IRS needs to make, which can be summarized in the following questions:• Is the attack harmful enough to warrant repelling?• What is the value (importance) of the compromised target?• Which set of responses is appropriate for repelling the attack?Intrusion Risk Assessment (IRA) is the process of identifying and characterizing risks. The result of
risk assessment helps minimize the cost of applying all available sets of responses. It may be enoughin some situation to only apply a subset of available responses [8], [9]. That is said, risk assessmenthelps an IRS determine the probability that a detected anomaly is a valid attack that requires attention(in the form of a response) [11].
In this paper, we classify existing IRS and IRA design approaches. The goal is to identify the strengthsand weaknesses of existing approaches. We also propose guidelines for improving IRS and IRA.
The rest of this paper is organized as follows: in Section II, we propose our taxonomy of intrusionresponse and risk assessment and describe their main elements. A review of recent existing IRS and
IRA is presented in Section III. Section IV, we discuss the current state of the intrusion response andrisk assessment, and suggestions for future research which can improve the current weaknesses of IRS.Finally, in Section V, we present our conclusions.
II. A TAXONOMY OF INTRUSION RESPONSE SYSTEMS AND RISK ASSESSMENT
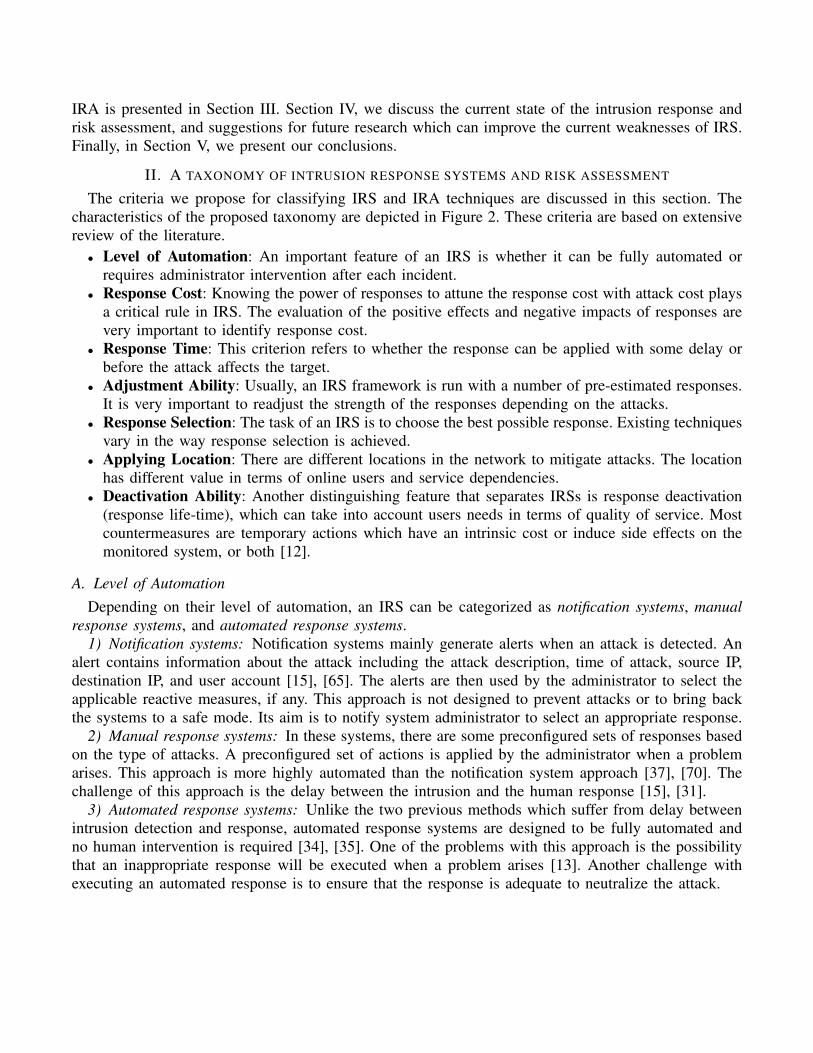
The criteria we propose for classifying IRS and IRA techniques are discussed in this section. Thecharacteristics of the proposed taxonomy are depicted in Figure 2. These criteria are based on extensivereview of the literature.• Level of Automation: An important feature of an IRS is whether it can be fully automated or
requires administrator intervention after each incident.• Response Cost: Knowing the power of responses to attune the response cost with attack cost plays
a critical rule in IRS. The evaluation of the positive effects and negative impacts of responses arevery important to identify response cost.
• Response Time: This criterion refers to whether the response can be applied with some delay orbefore the attack affects the target.
• Adjustment Ability: Usually, an IRS framework is run with a number of pre-estimated responses.It is very important to readjust the strength of the responses depending on the attacks.
• Response Selection: The task of an IRS is to choose the best possible response. Existing techniquesvary in the way response selection is achieved.
• Applying Location: There are different locations in the network to mitigate attacks. The locationhas different value in terms of online users and service dependencies.
• Deactivation Ability: Another distinguishing feature that separates IRSs is response deactivation(response life-time), which can take into account users needs in terms of quality of service. Mostcountermeasures are temporary actions which have an intrinsic cost or induce side effects on themonitored system, or both [12].
A. Level of AutomationDepending on their level of automation, an IRS can be categorized as notification systems, manual
response systems, and automated response systems.1) Notification systems: Notification systems mainly generate alerts when an attack is detected. An
alert contains information about the attack including the attack description, time of attack, source IP,destination IP, and user account [15], [65]. The alerts are then used by the administrator to select theapplicable reactive measures, if any. This approach is not designed to prevent attacks or to bring backthe systems to a safe mode. Its aim is to notify system administrator to select an appropriate response.
2) Manual response systems: In these systems, there are some preconfigured sets of responses basedon the type of attacks. A preconfigured set of actions is applied by the administrator when a problemarises. This approach is more highly automated than the notification system approach [37], [70]. Thechallenge of this approach is the delay between the intrusion and the human response [15], [31].
3) Automated response systems: Unlike the two previous methods which suffer from delay betweenintrusion detection and response, automated response systems are designed to be fully automated andno human intervention is required [34], [35]. One of the problems with this approach is the possibilitythat an inappropriate response will be executed when a problem arises [13]. Another challenge withexecuting an automated response is to ensure that the response is adequate to neutralize the attack.
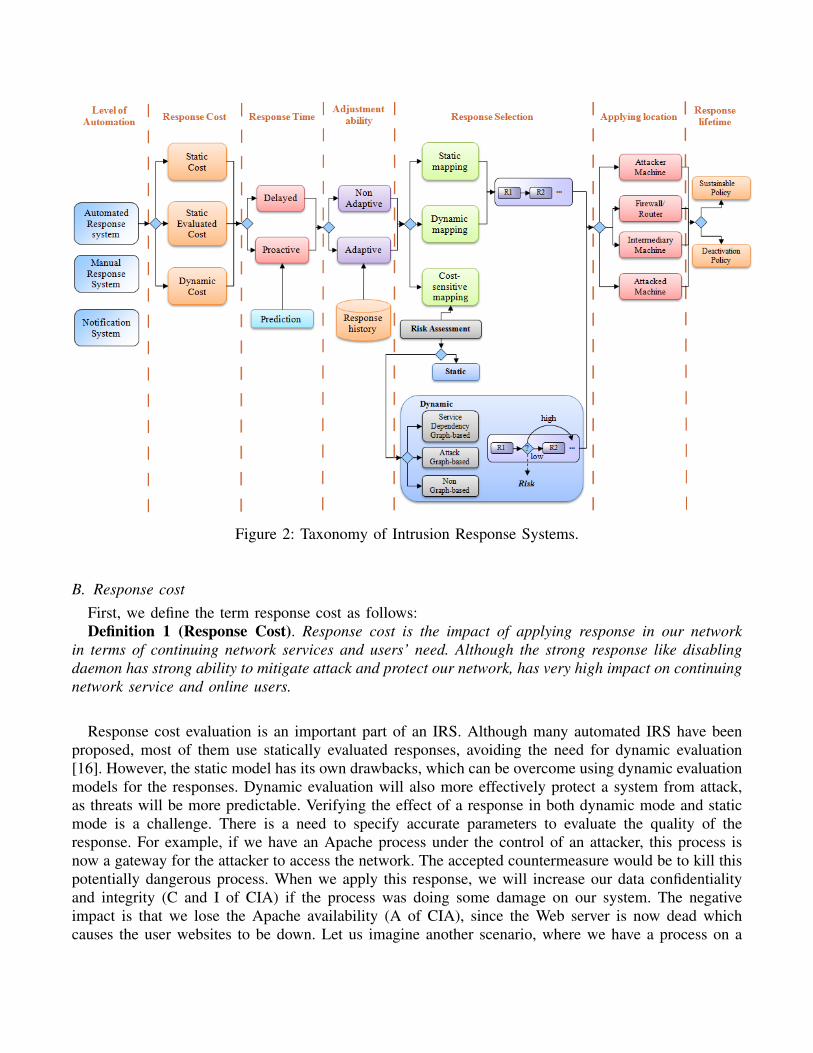
Figure 2: Taxonomy of Intrusion Response Systems.
B. Response costFirst, we define the term response cost as follows:Definition 1 (Response Cost). Response cost is the impact of applying response in our network
in terms of continuing network services and users’ need. Although the strong response like disablingdaemon has strong ability to mitigate attack and protect our network, has very high impact on continuingnetwork service and online users.
Response cost evaluation is an important part of an IRS. Although many automated IRS have beenproposed, most of them use statically evaluated responses, avoiding the need for dynamic evaluation[16]. However, the static model has its own drawbacks, which can be overcome using dynamic evaluationmodels for the responses. Dynamic evaluation will also more effectively protect a system from attack,as threats will be more predictable. Verifying the effect of a response in both dynamic mode and staticmode is a challenge. There is a need to specify accurate parameters to evaluate the quality of theresponse. For example, if we have an Apache process under the control of an attacker, this process isnow a gateway for the attacker to access the network. The accepted countermeasure would be to kill thispotentially dangerous process. When we apply this response, we will increase our data confidentialityand integrity (C and I of CIA) if the process was doing some damage on our system. The negativeimpact is that we lose the Apache availability (A of CIA), since the Web server is now dead whichcauses the user websites to be down. Let us imagine another scenario, where we have a process on a

server consuming a considerable amount of CPU resources that is doing nothing but slowing down amachine (a kind of CPU DoS). This time, killing the process will improve service availability (systemperformance), but will not change anything in terms of data confidentiality and integrity. We now havetwo very different results for the same response. Also, of the effects of some responses may dependon the network infrastructure. For example, applying a response inside the external DMZ is probablyvery different from doing so inside the LAN or ”secure zone” in terms of CIA. Responses cannot beevaluated without considering the attacks themselves, which are generally divided into the followingfour categories [31], [32]:
1) Denial of service (DoS): The attacker tries to make resources unavailable to their intended users,or consume resources such as bandwidth, disk space, or processor time. The attacker is not lookingto obtain root access, and so there is not much permanent damage.
2) User to root (U2R): An individual user tries to obtain root privileges illegally by exploiting systemvulnerabilities. The attacker first gains local access on the target machine, and then exploits systemvulnerabilities to perform the transition from user to root level. After acquiring root privileges,the attacker can install backdoor entries for future exploitation and change system files to collectinformation [33].
3) Remote to local (R2L): The attacker tries to gain unauthorized access to a computer from aremote machine by exploiting system vulnerabilities.
4) Probe: The attacker scans a network to gather information and detect possible vulnerabilities. Thistype of attack is very useful, in that it can provide information for the first step of a multi-stepattack. Examples are using automated tools such as ipsweep, nmap, portsweep, etc.
In the first category, where the attacker attempts to slow down the system, we are looking for aresponse that can increase service availability (or performance). In the second and third categories,because the system is under the control of an attacker, we are looking for a response that can increasedata confidentiality and integrity. In the fourth category, attackers attempt to gather information aboutpossible vulnerabilities from the network. Thus, responses that improve data confidentiality and serviceavailability are called for. A dynamic response model offers the best response based on the currentsituation of the network, and so the positive effects and negative impacts of the responses must beevaluated online at the time of the attack. Evaluating the cost of the response in online mode can bebased on resource interdependencies, the number of online users, the users privilege level, etc. Thereare three types of response cost model:
1) Static cost model: The static response cost (Rscost) is obtained by assigning a static value based
on an expert’s opinion. So, in this approach, a static value is considered for each response (Rscost =
CONSTANT ).2) Static evaluated cost model: In this approach, a statically evaluated cost, obtained by an evaluation
mechanism, is associated with each response (Rsecost = f(x)). The response cost in the majority of existing
models is statically evaluated. A common solution is to evaluate the positive effects (P ) of the responsesbased on their consequences on confidentiality (C), integrity (I), availability (A), and performance (P ).To evaluate the negative impacts (N ), we can consider the consequences for the other resources in termsof availability (¬A) and performance (¬P ) [4], [43]. For example, after running a response that blocksa specific subnet, a Web server under attack is no longer at risk, but the availability of the service hasdecreased. After evaluating the positive effect and negative impact of each response, we then calculatethe response cost. One solution is as Eq. 1 illustrates [13], obviously the higher RC, the better theresponse in ordering list:

Rsecost =
P
N=C + I + A+ P
¬A+ ¬P(1)
3) Dynamic evaluated cost model: The dynamic evaluated cost (Rdecost) is based on the network
situation. We can evaluate the response cost online based on the dependencies between resources [8],[51] and online users. For example, the effect of terminating a dangerous process depends on the numberof other entities (other processes, online users, etc.) that use this process. If the cost of terminating theprocess is high then perhaps another response should be selected. Evaluating the response cost shouldtake into account the resource dependencies, the number of online users, and the user privilege levels.In other words, we need an accurate cost-sensitive response system.
C. Response timeIn point of response time, IRSs can be classified into type categories: Delayed and Proactive[15],
[44]. In the delayed mode, the responses are formulate only after an intrusion is detected. Most existingIRS use this approach (e.g., [4], [72]) although it is known to be ineffective for maximum security.This is because an attacks can cause serious harm (stealing confidential information) before an IDS candetect it. This approach has been criticized because of the fact that an attack. Take, for example, the casewhere an attacker gains access to an unauthorized database. An IDS may detect this intrusion only afterthe attacker had illegally gained possession of critical information. In such as case, a delayed responsewould not be useful. Another important limitation of the delayed approach is that it is often difficult (ifnot impossible) to return the system to a healthy state because of the damages that an attack may causebefore it is detected [21]. In contrast, the proactive approach aims to control and prevent a maliciousactivity before it happens. This approach is considered critical for defending hosts and networks againstattacks. The proactive IRS needs an intrusion prediction mechanism that usually relies on probabilitymeasures [45] and it is often hard to guarantee that the prediction result is 100 accurate [15].
D. Adjustment abilityThere are two types of adjustment models: Non-adaptive and Adaptive [15], [71]. In the non-adaptive
model, the order of the responses remains the same during the life of the IRS software. In fact, there isno mechanism for tracing the behaviors of the deployed responses. In the adaptive model, the systemhas the ability to automatically and appropriately adjust the order of the responses based on responsehistory [15]. The response goodness concept was introduced by [5], [71] can be used to convert anon-adaptive model to an adaptive one.
Definition 2 (Response Goodness (RG)). Response goodness represents the history of success (Rs)and failure (Rf ) of each response to mitigate attack over time.
The Algorithm 1 can be used to convert a non-adaptive model to an adaptive one:For each response, first we calculate goodness factor (line 3). As a simple way, the response goodness
is calculated by sum of success rates (∑n
i=1Rsi) minus sum of failure rates (∑m
j=1Rfi) divided by thetotal number of response deployment. Then, the response effectiveness (RE) can be calculated bymultiplying the response cost times response goodness (line 4). The response cost can be one of thecost functions explained in Section B: Rs
cost, Rsecost, or Rde
cost. Finally, the adaptive model presents a newordering list of responses (line 6).
E. Response selectionThere are three response selection models: static mapping, dynamic mapping, and cost-sensitive
mapping.

Algorithm 1 Adaptive Intrusion Response SystemRequire: 4: list of responsesRequire: τ : attack cost
1: 4 = {R1, R2, R3, ..., Rn}2: for each R ∈ 4 do3: RG(t) =
∑ni=1 Rsi−
∑mj=1 Rfi
n+m
4: RE(t) = Rs|se|decost ×RG(t)
5: end for6: reorder(4)
1) Static mapping: An alert is mapped to a predefined response. This model is easy to build, but itsweakness is that the response measures are predictable by attackers [37].
2) Dynamic mapping: The responses of this model are based on multiple factors, such as the systemstate, attack metrics (frequency, severity, confidence, etc.), and the network policy [34]. In other words,responses to an attack may differ, depending on the targeted host, for instance. One drawback of thismodel is that it does not learn anything from attack to attack, so the intelligence level remains the sameuntil the next upgrade [35], [36].
3) Cost-sensitive mapping: This is an interesting technique that attempts to attune intrusion damageand response cost [3], [13], [37], [69].
Definition 3 (Intrusion Damage Cost). Intrusion damage cost represents the ”amount of damageto an attack target when the IDS and other protective measures are either unavailable or ineffective[10]”.
The results of a risk assessment are very important, in terms of minimizing the performance costof applying strong responses, as a weak response is enough to mitigate a weak attack. Some cost-sensitive approaches have been proposed (e.g., [5], [71], [72]) that use an offline risk assessmentcomponent, which is calculated by evaluating all the resources in advance. The value of each resourceis static. In contrast, online risk assessment components can help accurately measure intrusion damage.The challenge with online risk assessment is the accuracy of calculating intrusion damage. In case ofinaccurate calculation, the IRS may select an unduly high impact response for the network or apply aweaker response.
Intrusion risk assessment is very important in cost-sensitive mapping. Many real-time risk assessmentmodels have been proposed during the last decade. As illustrated in Figure 2, the proposed approachescan be grouped into three main categories:
(i) Attack Graph-based: The attack graphs not only help to identify attacks, but also to quantitativelyanalyze their impact on the critical services in the network, based on the attackers behavior andvulnerabilities that can be exploited [8], [9], [78]. The attack graph is a useful model that can show theattack paths in a network based on service vulnerabilities [7], [75]. It not only correlates the intrusiondetection system [76], [77] outputs, but also helps intrusion response systems to apply responses ina timely fashion, at the right place, and with the appropriate intensity [8], [9]. One challenge in thisapproach is attack modeling. The correlation methods proposed in the last decade to connect attacksteps can be classified into three categories [82], [83]: implicit, explicit, and semi-explicit correlations.
The implicit correlation attempts to find similarities between alerts in order to correlate them. Inthe explicit correlation, attack scenarios have to be defined statically. The attack signatures form the
attack graph [84]. The semi-explicit correlation type generalizes the explicit method by introducingpreconditions and postconditions for each step in the attack graph [17].
(ii) Service Dependency Graph-based: Three properties are defined for each service: C(S), I(S), andA(S), which denote the confidentiality, integrity, and availability of service (S) respectively. The impactof the attack on a service is propagated to other services based on the type of dependency. In this typeof approach, the attack graph is not used to evaluate attack cost [51].
(iii) Non Graph-based: Risk assessment is carried out independently of the attack detected by theIDS. This means that the IDS detects an attack and sends an alert to the risk assessment component,which performs a risk analysis based on alert statistics and other information provided in the alert(s)[2], [11], [50], [80].
F. Applying locationMost IRSs apply responses either on the attacked machine or the intruders machine if it is accessible.
By extracting the ”attack path”, we can identify appropriate locations, those with the lowest penalty cost,for applying them. Moreover, responses can be assigned to calculate the dynamic cost associated withthe location type, as discussed in the ”Response cost model” section. The numerous locations and thevariety of responses at each location will constitute a more effective framework for defending a systemfrom attack, as its behavior will be less predictable. An attack path consists of four points: 1) the startpoint, which is the intruder machine; 2) the firewall point, which includes firewalls and routers; 3) themidpoint, which includes all the intermediary machines that the intruder exploits (through vulnerabilities)to compromise the target host; and 4) the end point (the intruders target machine). Despite the researchadvances in the detection of attack paths [54], [55], [57], this method has rarely been implemented inactual IDSs or IRSs.
G. Deactivation abilityThe need to deactivate a response action is not recognized in the majority of existing automated IRS.
The importance of this need was first suggested in [12]. The authors argue that most responses aretemporary actions which have an intrinsic cost or can even induce side effects on the monitored system.The question is how and when to deactivate the response. The deactivation of policy-based responsesis not a trivial task.
III. CLASSIFICATION OF EXISTING MODELS
A. Response costLee et al. [31] proposed an intrusion response system based on cost factors. Attack damage and
response costs have been statically defined based on four categories (ROOT, R2L, DoS, and PROBE). Maximum damage cost is 100 considered for ROOT category meanwhile minimum damage cost is2 allocated for PROBE category. Maximum response cost is 60 considered for ROOT category whenattack is trying from a remote host. In contrast, minimum response cost is 5 considered for PROBEcategory when probing is being done in a short period of time. In this work there is not any list andevaluation of responses. The important feature of this work from response cost view is that responsecost has tight relationship with attack category.
Papadaki and Furnell [72] proposed a static evaluated cost response system. To evaluate the charac-teristics of each response action, they have proposed the following parameters: counter-effects, stoppingpower, transparency, efficiency, and confidence level. Also, the proposed model assesses the staticand dynamic contexts of the attack. A database for analyzing the static context is needed to manageimportant characteristics of an attack, such as targets, applications, vulnerabilities, and so on. In terms of
evaluating the dynamic context of an attack, there are some interesting ideas embodied in the proposedmodel. The two main features of this model are: 1) the ability to easily propose different orders ofresponses for different attack scenarios; and 2) the ability to adapt decisions in response to changes inthe environment.
Strasburg et al. [4] proposed a structured methodology for evaluating the cost of a response basedon three parameters: operational cost (OC), impact of the response on the system (RSI), and responsegoodness (RG). The response cost model is: RC = OC + RSI - RG. OC refers to the cost of settingup and developing responses. The RSI quantifies the negative effect of the response on the systemresources. RG is defined based on two concepts: 1) the number of possible intrusions that the responsecan potentially address; 2) the amount of resources that can be protected by applying the response.
Dynamic evaluated response cost approach is firstly proposed in [37]. Toth and Kruegel [37] presenteda network model that takes into account relationships between users and resources, since users performtheir activities by utilizing the available resources. The goal of a response model is to keep the systemin as high a state of usability as possible. Each response alternative (which node to isolate) is insertedtemporarily into the network model and a calculation is performed to determine which response has thelowest negative impact on services. In this model, every service has a static cost, and there is only the”block IP” response to evaluate as a way to repel an attack. When the IDS detects an incoming attack,an algorithm attempts to find the firewall/gateway that can effectively minimize the penalty cost of theresponse action.
B. Response timeTanachaiwiwat et al. [70] proposed a non-adaptive response system. Although they claim that their
method is adaptive, they have, in fact, implemented a non-adaptive mechanism. They point out thatverifying the effectiveness of a response is quite expensive. They check, IDS efficiency, alarm frequency(per week), and damage cost, in order to select the best strategy. The alarm frequency reveals the numberof alarms triggered per attack, and damage cost assesses the amount of damage that could be causedby the attacker. An appropriate list of response is available in the proposed model.
In [5], Stakhanova et al. proposed a proactive IRS. This model focuses on detecting anomalousbehavior in software systems. It monitors system behaviors in terms of system calls, and has twolevels of classification mechanism to detect intrusion. In the first detection step, when both normaland abnormal patterns are available, the model attempts to determine what kind of pattern is triggeredwhen sequences of system calls are monitored. If the sequences do not match the normal or abnormalpatterns, the system relies on machine learning techniques to establish whether the system is normal oranomalous. These authors have presented a response system that is automated, cost-sensitive, preemptive,and adaptive. The response is triggered before the attack completes.
Haslum et al. [32] proposed a real time intrusion prevention model. They designed a predictionmodel based on the hidden Markov model (HMM) to model the interaction between the intruder andthe network [73]. The proposed HMM is based on four states: Normal, Intrusion Attempt, Intrusionin progress, and Successful attack. When the attacker gets appropriate results in attack, system movesfrom Normal state to the Intrusion attempt state and so on. When the probability of Normal state isdown, it means the probability of other states are up. That model can detect the U2R, R2L, and PROBEcategories of attacks, but not the DoS category.
C. Adjustment abilityFoo et al. [71] presented a graph-based approach, called ADEPTS. The responses for the affected
nodes are based on parameters such as confidence level of attack, previous measurements of responses
in similar cases, etc. The model is adaptive and ADEPTS uses a feedback mechanism to estimate thesuccess or failure of an applied response.
Stakhanova et al. [5] proposed an adaptive IRS. There is a mapping between system resources,response actions, and intrusion patterns which has to be defined in advance. Whenever a sequence ofsystem calls matches a prefix in an abnormal graph, the response algorithm decides whether to repel theattack or not, based on a confidence level threshold. Multiple candidate responses may be available, andthe one with the least negative effect is selected based on utility theory. The effectiveness of each appliedresponse is measured for future response selection. If the selected response succeeds in neutralizing theattack, its success factor is increased by one, otherwise it is decreased by one.
D. Response selectionChen et al. [62] proposed a static-mapping intrusion detection and prevention system based on
firewalls. The idea is an attack response matrix which maps attack types to some responses. Theydo not consider trading off security enforcement levels and system performance.
Curtis et al. [34], [63], [64] propose a complex dynamic mapping based on an agent architecture(AAIRS). In AAIRS, multiple IDS monitor a host and generate alarms. The alarms are first processedby the Master Analysis agent. This agent indicates the confidence level of the attack and passes it onto an Analysis agent, which then generates a response plan based on degree of suspicion, attack time,attacker type, attack type, attack implications, response goal, and policy constraints.
Lee et al. [31] proposed a cost-sensitive model based on three factors: 1) operational cost, whichrefers to the cost of processing the stream of events by an IDS; 2) damage cost, the amount of damageto a resource caused by an attacker when the IDS is ineffective; and 3) response cost, which is the costof applying a response when an attack is detected.
Balepin et al. [53] presented a dynamic cost-sensitive model and a response cost model. They proposeda local resource dependency model to evaluate responses. Their approach considers the current state ofthe system so as to calculate the response cost. Each resource has common response measures associatedwith the current state. The authors argue that designing a model to assess the value of each resource is adifficult task, so they rank the resources by their importance to produce a cost configuration. Then, staticcosts are assigned to high priority resources. Costs are injected into the resource dependency modelwhen associated resources are involved in an incident. A particular response for a node is selected basedon three criteria: 1) response benefit: sum of costs of resources that response action restores to a workingstate, 2) response cost: sum of costs of resources which is negatively affected by the response action,and 3) attack cost: sum of costs of resources that are negatively affected by the intruder. This approachsuffers from multiple limitations. First, it is not clear how the response benefit is calculated in terms ofconfidentiality and integrity. Secondly, restoring the state of resources alone cannot be used to evaluatethe response positive effect [51]. Finally, the proposed model is applicable for host-based intrusionresponse systems. Its application to network-based intrusion response requires significant modificationsin the cost model [51].
Mu and Li [13] presented a hierarchical task network planning model to repel intrusions. In theirapproach, every response has an associated static risk threshold that can be calculated by its ratio ofpositive to negative effects. The permission to run each response is based on the current risk index of thenetwork. When the risk index is greater than the response static threshold, the next response is allowed torun. The authors proposed a response selection window, where the most effective responses are selectedto repel intrusions. There is no evaluation of responses in this work. Also, it is unclear how the positiveand negative effects of responses have been calculated. In that framework, the communication componentis responsible for receiving alerts from multiple IDSs. The authors proposed to use an intrusion response
planning to find a sequence of actions that achieve a response goal. These goals are the same as thosein [34]: analyze the attack, capture the attack, mask the attack, maximize confidentiality, maximizeintegrity, recovery gracefully, and sustain service. Each goal has its own sequence of responses. Forexample, if the goal is to analyze an attack, the earlier responses in the sequence have to be weak, butlater responses have to be strong.
Zhang et al. [69] presented an approach for measuring attack impact with the objective beingto suggest rational response using cost-benefit analysis. The proposed architecture is composed ofthree components: events processor, system state estimator, and response actuator. Observable MarkovDecision Process has been used in this model and the system states were classified into four coarse-grained categories, namely, normal, probing, under exploitation, and compromised states. The rationalresponse is chosen by estimating system states, and taking a rational response. Two cost functions weredefined for rational response policy: maintenance cost due to intrusion response and failure cost due toattack. The proposed automated response mechanism can tune the tradeoff between system maintenancecost and failure cost for achieving rational defense.
Kheir et al. [51] proposed a cost-sensitive IRS based on a service dependency graph to evaluate theconfidentiality and integrity impacts, as well as the availability impact. The authors argue that it is reallydifficult to identify the impact on data confidentiality and integrity of other resources when we applya response on a resource. To address this problem, the authors use a specific type of responses (e.g.,”allow unsecure connections”) [52] in case of an openSSL attack. They targeted specific response thathas negative effect on data confidentiality and integrity.
1) Cost-sensitive mapping with dynamic risk assessment: Kanoun et al. [9] presented a risk assess-ment model based on attack graphs to evaluate the severity of the total risk of the monitored system.The LAMBDA [17] language is used to model attack graphs when an attack is detected. When an attackgraph is obtained, the risk gravity model begins to compute the risk, which is a combination of two majorfactors: (i) Potentiality, which measures the probability of a given scenario taking place and successfullyachieving its objective. Evaluating this factor is based on calculating its minor factors: natural exposition,and dissuasive measures. The first of these minor factors measures the natural exposure of the targetsystem facing the detected attack. To reduce the probability of an attack progressing, the second minorfactor, dissuasive measures, can be enforced. (ii) Impact, which is defined as a vector with three cellsthat correspond to the three fundamental security principles: Availability, Confidentiality, and Integrity.The interesting point with this model is that the impact parameters are calculated dynamically. Thatimpact depends on the importance of the target assets, as well as the impact of the level of reductionmeasures deployed on the system to reduce and limit the impact, when the attack is successful.
Wang et al. [79] presented a middleware approach to bridge the gap between system-level vulner-abilities and organization-level security metrics. The model is fundamentally different from previousmethods because it uses dependency attack graphs rather than state-based attack graphs to representnetwork observations. The proposed approach systematically integrates attack graphs and Hidden MarkovModels together for exploring the probabilistic relation between system observations and states. It thenapplies a cost-driven heuristic algorithm to search for the optimal security hardening from a list ofcountermeasure candidates. A set of security metrics and defence cost factors was specified in this workfor calculating attack cost and defense cost. Attack impact was measured by confidentiality loss, denialof service, public embarrassment, privilege escalation, and integrity loss, while defence cost factors wascalculated by system downtime, installation cost, operation cost, training cost, and incompatibility cost.
Jahnke et al. [8] presented a graph-based approach for modeling the effects of attacks against resourcesand the effects of the response measures taken in reaction to those attacks. The proposed approachextends the idea put forward by Toth and Kregel in [37] by using general, directed graphs showing
dependencies between resources and by deriving quantitative differences between system states fromthese graphs. If we assume that G1 and G2 are the graphs we obtain before and after the reactionrespectively, then calculation of the responses positive effect is the difference between the availabilityplotted in the two graphs: A(G2)-A(G1). Like [37], [53], these authors focus on the availability impacts.
Kheir et al. [51] proposed a dependency graph to evaluate the confidentiality and integrity impacts,as well as the availability impact. The confidentiality and integrity criteria are not considered in [8]. In[51], the impact propagation process proposed by Jahnke et al. is extended to include these impacts.Now, each service in the dependency graph is described with a 3D CIA vector, the values of which aresubsequently updated, either by actively monitoring estimation or by extrapolation using the dependencygraph. In the proposed model, dependencies are classified as structural or functional dependencies.
In [50], Arnes et al. presented a non graph-based real-time risk assessment method for informationsystems and networks based on observations from network sensors. The proposed model is a multi-agent system where each agent observes objects in a network using sensors. An object is any kind ofasset in the network that is valuable in terms of security. To perform dynamic risk assessment with thisapproach, discrete-time Markov chains are used. For each object, a Hidden Markov Model (HMM) isconsidered and the HMM states illustrate the security state, which changes over time. The proposedstates are: Good, Attacked, and Compromised. The compromised state indicates that the host has beencompromised. Thus, each object in the network can be in a different state at any time. In their model,it is assumed that there is no relationship between objects and that the HHMs work independently. Astatic cost, Ci, is allocated to each state, Si. The total risk for each object at time t can be calculatedas: Rt =
∑ni=1 γt(i)C(i). The γt(i) value gives the probability that the object is in state Si at time t.
Gehani et al. [2] presented a non graph-based real-time risk management model, called RheoStat.This model dynamically alters the exposure of a host to contain an intrusion when it occurs. A host’sexposure consists of the exposure of all its services. To analyze a system’s risk, a combination of threefactors is considered: 1) the likelihood of occurrence of an attack; 2) the impact on assets, i.e., the lossof confidentiality, integrity, and availability; and 3) the vulnerability’s exposure, which is managed bysafeguards.
Haslum et al. [80] proposed a fuzzy model for online risk assessment in networks. Human expertsrely on their experience and judgment to estimate risk based on a number of dependent variables.Fuzzy logic is applied to capture and automate this process. The knowledge of security and risk expertsis embedded in rules for a fuzzy automatic inference system. The main contribution is the use offuzzy logic controllers. These were developed to quantify the various risks based on a number ofvariables derived from the inputs of various components. The fuzzy model is used to model threat level,vulnerability effect, and asset value. Threat level (FLC-T) is modeled using three linguistic variables:Intrusion frequency, Probability of threat success, and Severity. The HMM module used for predictingattacks provides an estimate of intrusion frequency. The asset value (FLC-A) is derived from three otherlinguistic variables: Cost, Criticality, Sensitivity, and Recovery. In addition, the vulnerability effect (FLC-V) has been modeled as a derived variable from Threat Resistance and Threat Capability. Eventually,the risk is estimated based on the output of the three fuzzy logic controllers FLC-T, FLC-A, and FLC-V.
Mu et al. [11] proposed a non graph-based real-time risk assessment model based on D-S evidencetheory. D-S evidence theory is a method for solving a complex problem where the evidence is un-certain or incomplete. The proposed model consists of two steps, which identify: Risk Index and RiskDistribution. In the first step, the risk index has to be calculated. The risk index is the probability thata malicious activity is a true attack and can achieve its mission successfully. In D-S evidence theory,five factors are used to calculate the risk index: Number of alerts, Alert Confidence, Alert Type, AlertSeverity, and Alert Relevance Score. Risk distribution is the real evaluation of risk with respect to the
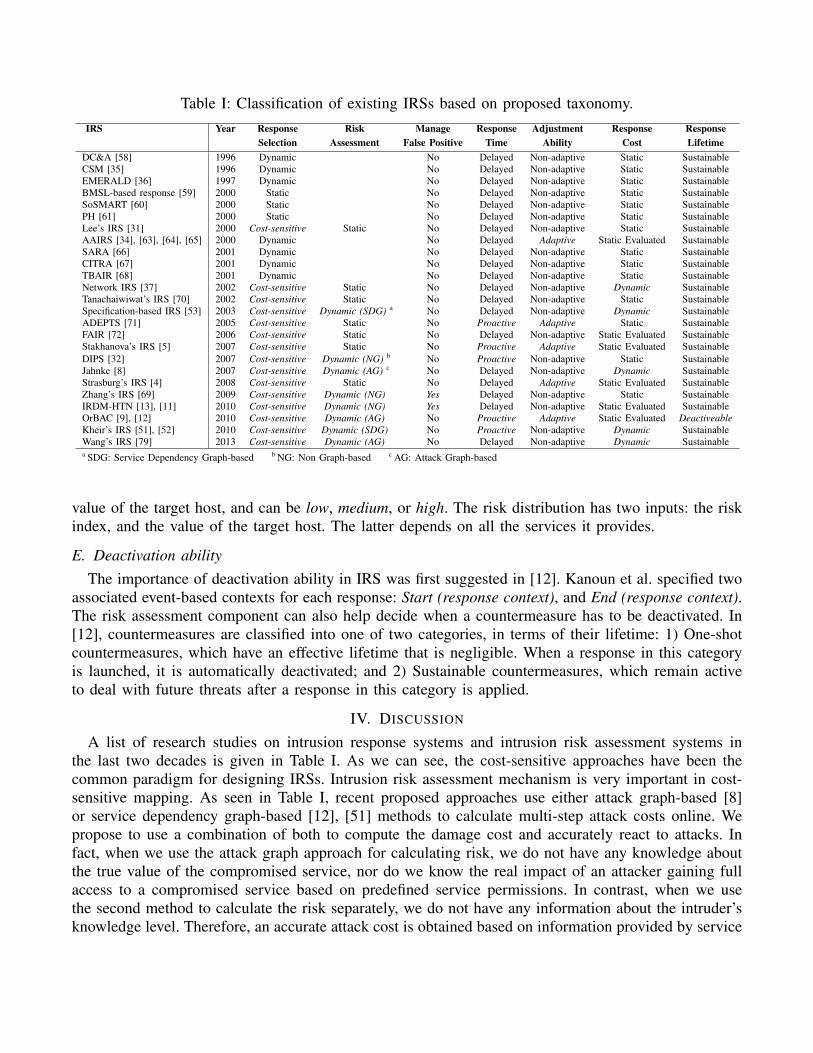
Table I: Classification of existing IRSs based on proposed taxonomy.IRS Year Response Risk Manage Response Adjustment Response Response
Selection Assessment False Positive Time Ability Cost LifetimeDC&A [58] 1996 Dynamic No Delayed Non-adaptive Static SustainableCSM [35] 1996 Dynamic No Delayed Non-adaptive Static SustainableEMERALD [36] 1997 Dynamic No Delayed Non-adaptive Static SustainableBMSL-based response [59] 2000 Static No Delayed Non-adaptive Static SustainableSoSMART [60] 2000 Static No Delayed Non-adaptive Static SustainablePH [61] 2000 Static No Delayed Non-adaptive Static SustainableLee’s IRS [31] 2000 Cost-sensitive Static No Delayed Non-adaptive Static SustainableAAIRS [34], [63], [64], [65] 2000 Dynamic No Delayed Adaptive Static Evaluated SustainableSARA [66] 2001 Dynamic No Delayed Non-adaptive Static SustainableCITRA [67] 2001 Dynamic No Delayed Non-adaptive Static SustainableTBAIR [68] 2001 Dynamic No Delayed Non-adaptive Static SustainableNetwork IRS [37] 2002 Cost-sensitive Static No Delayed Non-adaptive Dynamic SustainableTanachaiwiwat’s IRS [70] 2002 Cost-sensitive Static No Delayed Non-adaptive Static SustainableSpecification-based IRS [53] 2003 Cost-sensitive Dynamic (SDG) a No Delayed Non-adaptive Dynamic SustainableADEPTS [71] 2005 Cost-sensitive Static No Proactive Adaptive Static SustainableFAIR [72] 2006 Cost-sensitive Static No Delayed Non-adaptive Static Evaluated SustainableStakhanova’s IRS [5] 2007 Cost-sensitive Static No Proactive Adaptive Static Evaluated SustainableDIPS [32] 2007 Cost-sensitive Dynamic (NG) b No Proactive Non-adaptive Static SustainableJahnke [8] 2007 Cost-sensitive Dynamic (AG) c No Delayed Non-adaptive Dynamic SustainableStrasburg’s IRS [4] 2008 Cost-sensitive Static No Delayed Adaptive Static Evaluated SustainableZhang’s IRS [69] 2009 Cost-sensitive Dynamic (NG) Yes Delayed Non-adaptive Static SustainableIRDM-HTN [13], [11] 2010 Cost-sensitive Dynamic (NG) Yes Delayed Non-adaptive Static Evaluated SustainableOrBAC [9], [12] 2010 Cost-sensitive Dynamic (AG) No Proactive Adaptive Static Evaluated DeactiveableKheir’s IRS [51], [52] 2010 Cost-sensitive Dynamic (SDG) No Proactive Non-adaptive Dynamic SustainableWang’s IRS [79] 2013 Cost-sensitive Dynamic (AG) No Delayed Non-adaptive Dynamic Sustainablea SDG: Service Dependency Graph-based b NG: Non Graph-based c AG: Attack Graph-based
value of the target host, and can be low, medium, or high. The risk distribution has two inputs: the riskindex, and the value of the target host. The latter depends on all the services it provides.
E. Deactivation abilityThe importance of deactivation ability in IRS was first suggested in [12]. Kanoun et al. specified two
associated event-based contexts for each response: Start (response context), and End (response context).The risk assessment component can also help decide when a countermeasure has to be deactivated. In[12], countermeasures are classified into one of two categories, in terms of their lifetime: 1) One-shotcountermeasures, which have an effective lifetime that is negligible. When a response in this categoryis launched, it is automatically deactivated; and 2) Sustainable countermeasures, which remain activeto deal with future threats after a response in this category is applied.
IV. DISCUSSION
A list of research studies on intrusion response systems and intrusion risk assessment systems inthe last two decades is given in Table I. As we can see, the cost-sensitive approaches have been thecommon paradigm for designing IRSs. Intrusion risk assessment mechanism is very important in cost-sensitive mapping. As seen in Table I, recent proposed approaches use either attack graph-based [8]or service dependency graph-based [12], [51] methods to calculate multi-step attack costs online. Wepropose to use a combination of both to compute the damage cost and accurately react to attacks. Infact, when we use the attack graph approach for calculating risk, we do not have any knowledge aboutthe true value of the compromised service, nor do we know the real impact of an attacker gaining fullaccess to a compromised service based on predefined service permissions. In contrast, when we usethe second method to calculate the risk separately, we do not have any information about the intruder’sknowledge level. Therefore, an accurate attack cost is obtained based on information provided by service

Table II: Comparison of existing online intrusion risk assessment approaches
IRA Year Technique used Quantitative Qualitative HybridBalepin et al. [53] 2003 Decision Theory Convention
√
Gehani and Kedem [2] 2004 Addition, Multiplication, and Division Operations√
Arnes et al. [50] 2005 Hidden Markov Model√
Papadaki and Furnell [72] 2006 Decision-making√
Jahnke et al. [8] 2007 Attack Graph√
Mu et al. [11] 2008 Dempster-Shafer Theory√
Kanoun et al. [9] 2008 Attack Graph√
Haslum et al. [80] 2008 Fuzzy Logic√
Kheir et al. [52] 2009 Service Dependency Graph√
Zhang et al. [69] 2009 Decision Theoretic√
Wang et al. [79] 2013 Dependency attack graph√
dependency and attack graphs. Eventually, the response selection module applies a response in which theattack and response costs are in proportion. Risk assessment methodologies are classified into three maincategories: Quantitative, Qualitative, and Hybrid. Table II compares the online intrusion risk assessmentapproaches discussed in this paper (listed in Table I).
As we can see from the table, the most common approaches used for online mode is the quantitativeapproach. Quantitative approaches rely on hard numbers, complex calculations, probability theory andstatistics to determine the risk exposure and they may be difficult for non-technical people to interpret[86], [88].
Qualitative approaches use classes and relative values to show the impact and probability of a particularscenario [87]. They also assess information security risks by employing methods and principles withnon-numerical levels. The result of qualitative approaches is vastly dependent on the security expertswho conduct the risk analysis [89], [90]. To address the weaknesses of both methodologies, some modelshave been proposed (e.g. [11]) to combine the best of both worlds into a unique hybrid approach.
Many IRS models choose responses according to raw IDS alerts. This may lead to false positiveresponses because of the high IDS false positive alert rate [19], [81], [85]. Unfortunately, there have notbeen many studies that address the tolerance of IRSs to false positive IDS alerts. [13], [69] proposed amodel to control false positives in IRS. Mu et. al [13] defined a risk threshold for each countermeasurewhere an online risk assessment module measures the alert risk. Since the risk value for a false positiveis not high, it cannot reach the countermeasure risk threshold. Zhang et al. [69] proposed an alertcorrelation mechanism to combine the low-level alerts of a group of IDS sensors into one observationvector and treating them as a whole.
In addition, as discussed in the paper, the adjustment ability of IRS is an important factor thatinfluences the strength of the responses against attack over time. As we see in Table I, only five IRSout of twenty five supports adjustment ability [5], [12], [13], [34], [71]. The response goodness (RG)concept plays a critical role in the adaptive approach that was introduced by Stakhanova et al. and Fooet al. [5], [71]. This parameter shows the history of each response (success or failure) in the past tomitigate an attack. One way to measure the success or failure of a response is to use the result of theonline risk assessment component. RG can be calculated as proposed by Stakhanova et al. in [5]: ifthe selected response succeeds in neutralizing the attack, its success factor (Rs) is increased by one,otherwise, its failure factor (Rf ) is increased. Unfortunately, the current solutions to calculate responsegoodness do not consider the time factor. A point of interest is that the most recent results must beconsidered more valuable than the earlier ones. For example, assume the results of Rs and Rf for aresponse are 10 and 3 respectively, the most recent result being: {F, F, F}. If we calculate the response
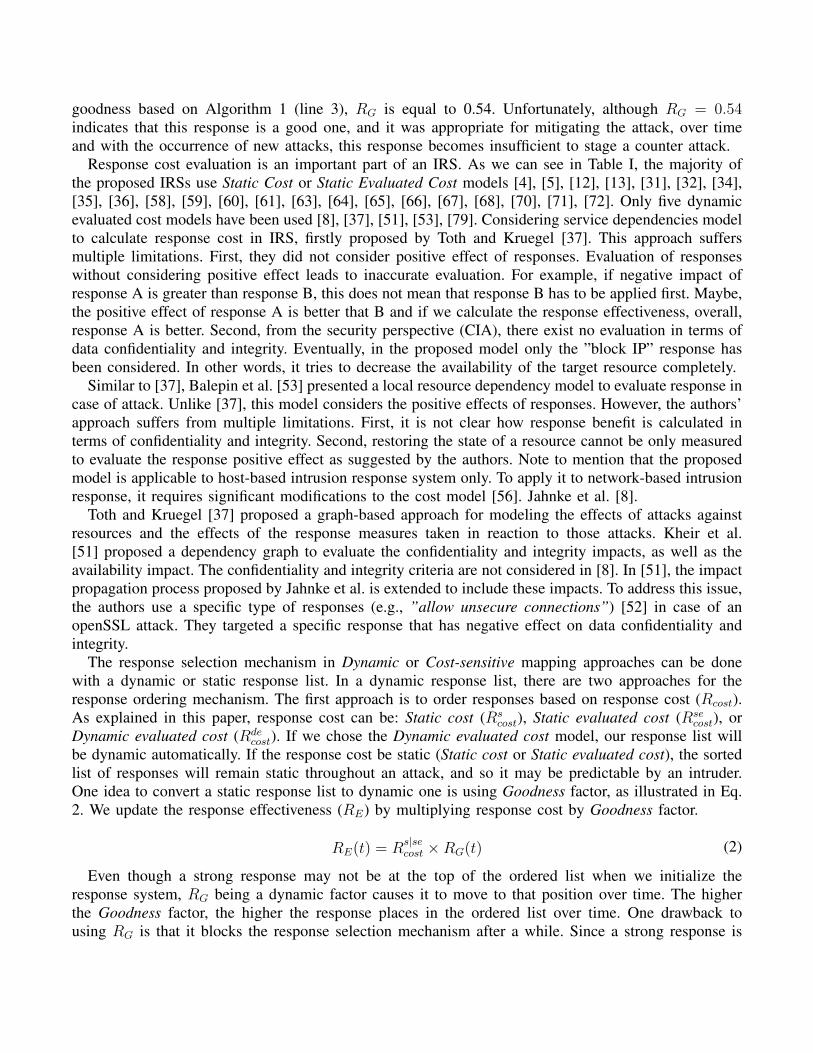
goodness based on Algorithm 1 (line 3), RG is equal to 0.54. Unfortunately, although RG = 0.54indicates that this response is a good one, and it was appropriate for mitigating the attack, over timeand with the occurrence of new attacks, this response becomes insufficient to stage a counter attack.
Response cost evaluation is an important part of an IRS. As we can see in Table I, the majority ofthe proposed IRSs use Static Cost or Static Evaluated Cost models [4], [5], [12], [13], [31], [32], [34],[35], [36], [58], [59], [60], [61], [63], [64], [65], [66], [67], [68], [70], [71], [72]. Only five dynamicevaluated cost models have been used [8], [37], [51], [53], [79]. Considering service dependencies modelto calculate response cost in IRS, firstly proposed by Toth and Kruegel [37]. This approach suffersmultiple limitations. First, they did not consider positive effect of responses. Evaluation of responseswithout considering positive effect leads to inaccurate evaluation. For example, if negative impact ofresponse A is greater than response B, this does not mean that response B has to be applied first. Maybe,the positive effect of response A is better that B and if we calculate the response effectiveness, overall,response A is better. Second, from the security perspective (CIA), there exist no evaluation in terms ofdata confidentiality and integrity. Eventually, in the proposed model only the ”block IP” response hasbeen considered. In other words, it tries to decrease the availability of the target resource completely.
Similar to [37], Balepin et al. [53] presented a local resource dependency model to evaluate response incase of attack. Unlike [37], this model considers the positive effects of responses. However, the authors’approach suffers from multiple limitations. First, it is not clear how response benefit is calculated interms of confidentiality and integrity. Second, restoring the state of a resource cannot be only measuredto evaluate the response positive effect as suggested by the authors. Note to mention that the proposedmodel is applicable to host-based intrusion response system only. To apply it to network-based intrusionresponse, it requires significant modifications to the cost model [56]. Jahnke et al. [8].
Toth and Kruegel [37] proposed a graph-based approach for modeling the effects of attacks againstresources and the effects of the response measures taken in reaction to those attacks. Kheir et al.[51] proposed a dependency graph to evaluate the confidentiality and integrity impacts, as well as theavailability impact. The confidentiality and integrity criteria are not considered in [8]. In [51], the impactpropagation process proposed by Jahnke et al. is extended to include these impacts. To address this issue,the authors use a specific type of responses (e.g., ”allow unsecure connections”) [52] in case of anopenSSL attack. They targeted a specific response that has negative effect on data confidentiality andintegrity.
The response selection mechanism in Dynamic or Cost-sensitive mapping approaches can be donewith a dynamic or static response list. In a dynamic response list, there are two approaches for theresponse ordering mechanism. The first approach is to order responses based on response cost (Rcost).As explained in this paper, response cost can be: Static cost (Rs
cost), Static evaluated cost (Rsecost), or
Dynamic evaluated cost (Rdecost). If we chose the Dynamic evaluated cost model, our response list will
be dynamic automatically. If the response cost be static (Static cost or Static evaluated cost), the sortedlist of responses will remain static throughout an attack, and so it may be predictable by an intruder.One idea to convert a static response list to dynamic one is using Goodness factor, as illustrated in Eq.2. We update the response effectiveness (RE) by multiplying response cost by Goodness factor.
RE(t) = Rs|secost ×RG(t) (2)
Even though a strong response may not be at the top of the ordered list when we initialize theresponse system, RG being a dynamic factor causes it to move to that position over time. The higherthe Goodness factor, the higher the response places in the ordered list over time. One drawback tousing RG is that it blocks the response selection mechanism after a while. Since a strong response is
better to repel an attack, its Goodness attribute increases all the time. If we sort the responses based onRG, we will be selecting the strong response all the time after a while, which is not desirable. Anotherdrawback is that Quality of Service (QoS) in the network is not considered. Because many servicesare available and accessed by large numbers of users, it is important to maintain the users’ QoS, theresponse time of applications, and the critical services that are in high demand. Since, when we useRG, the strongest response is selected in case of attack, we are restricting network functionality untilthe response is deactivated.
The second approach that we propose for future research is not to consider RG in the responseordering mechanism, and instead, to start with a poor response. It does not matter if a poor responseis applied, because in this case the current network risk level slips under the risk threshold, based onthe response Goodness, and brings us very close to the risk threshold again. If the attack is in progress,the network risk passes the risk threshold again very quickly and response system applies the nextresponse. This approach has two main benefits. The first one is that all non-optimal responses will bereconsidered, and one or more of them may be able to prevent the attack this time. So, even if one ofthe responses applied previously was inefficient, it may work for a new attack. The second is that user’sneeds are considered in terms of QoS. So, in this approach, we start with a poor response, and, whenthe attack is likely to prove dangerous for our network, stronger responses are applied and networkfunctionality is reduced slowly.
In the cost-sensitive approach, attack and response costs are attuned. Table III illustrates the parametersthat are defined in the surveyed cost-sensitive approaches (discussed in Table I) to measure thesetwo costs. The common way to calculate attack cost is by assessing the attack’s impact on CIA(Confidentiality, Integrity, and Availability) [4], [51], [52], [69]. Response cost, on the other hand,is only assessed by measuring the impact of the response on resource availability [37], [53], [91]. Thismakes it difficult to compare attack cost to response cost since they impact different security attributes.In other words, they do not use the same measurement unit. There have been a few studies that aimto reconcile the measurement unit used to measure response cost with the one used for attack cost.For example, kheir et al. [51], [52] proposed a model that system under attack with strong protocollike https moves to another state that allows users to use unsecure protocol like http. The activation ofunsecure protocol increases an attacker’s ability to beat the system. Thus, this type of response affectsnot only on our critical resource availability but also on data confidentiality and integrity.
Balepin et al. [53] attempted to put these two costs in the same measurement unit by simplifying theproblem. For the attack cost, they considered the sum of costs of resources that are negatively affectedby the intruder (availability loss). For the response cost, they considered not only negative effect of theresponse on services but also the sum of costs of resources to restore the system to a working state(availability gain).
In some models [5], [8], [37], only the response cost is considered. For example, Toth and Kregel[37] and Jahnke [8] applied different responses to a model to understand which one has the lowestnegative effect on services. In contrast, in some other models [11], [13], [32], only the attack cost iscalculated and the response cost has a static value. Haslum et al. in [32] classified attack cost parametersinto three categories: asset value, vulnerability effect, and threat impact. Asset value was modeled ascost, criticality, sensitivity, and recovery. Vulnerability effect was measured by two threat resistance andthreat capability. Threat impact was modeled as the frequency of attacks, the probability that an intrudersucceeds to subvert security controls, and the severity of attacks. Usually asset value and vulnerabilityeffect are calculated statically. Threat effect can be measured dynamically based on IDS results. Muet al. in [11], [13], calculated the attack cost by alert amount, confidence, type, severity, and relevancescore. The attack cost results is in range of [0, 1]. A list of responses are distributed in a range of [0,
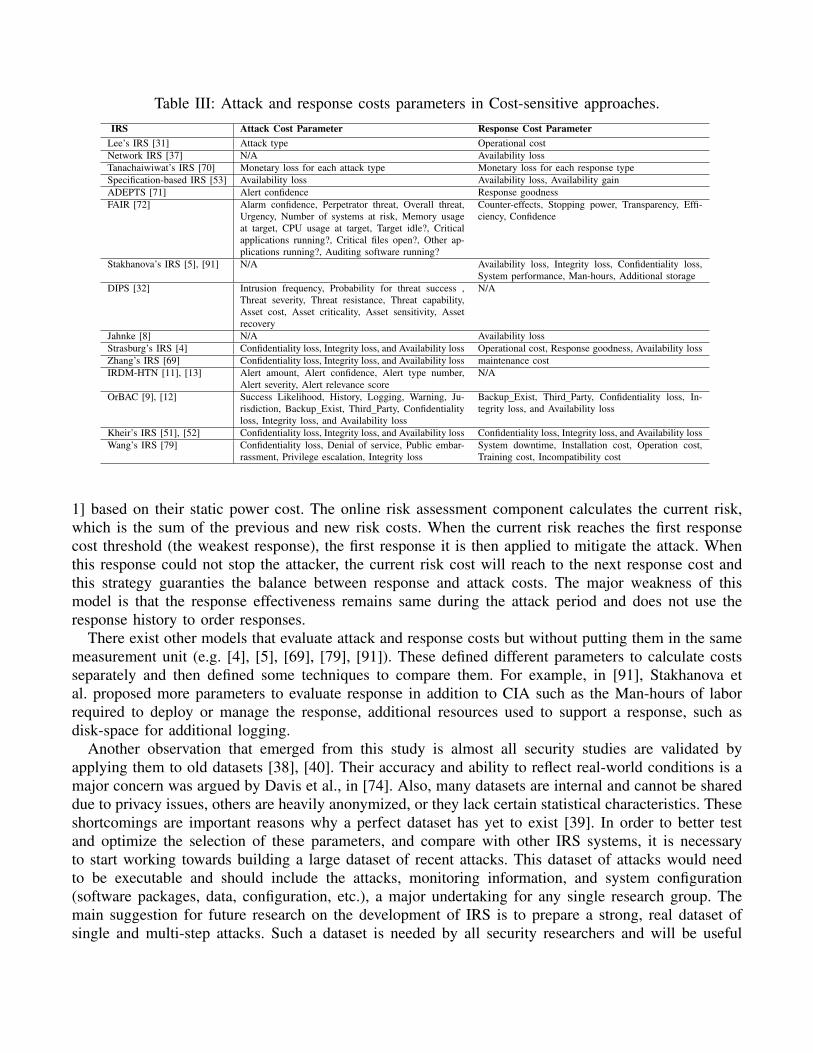
Table III: Attack and response costs parameters in Cost-sensitive approaches.IRS Attack Cost Parameter Response Cost Parameter
Lee’s IRS [31] Attack type Operational costNetwork IRS [37] N/A Availability lossTanachaiwiwat’s IRS [70] Monetary loss for each attack type Monetary loss for each response typeSpecification-based IRS [53] Availability loss Availability loss, Availability gainADEPTS [71] Alert confidence Response goodnessFAIR [72] Alarm confidence, Perpetrator threat, Overall threat,
Urgency, Number of systems at risk, Memory usageat target, CPU usage at target, Target idle?, Criticalapplications running?, Critical files open?, Other ap-plications running?, Auditing software running?
Counter-effects, Stopping power, Transparency, Effi-ciency, Confidence
Stakhanova’s IRS [5], [91] N/A Availability loss, Integrity loss, Confidentiality loss,System performance, Man-hours, Additional storage
DIPS [32] Intrusion frequency, Probability for threat success ,Threat severity, Threat resistance, Threat capability,Asset cost, Asset criticality, Asset sensitivity, Assetrecovery
N/A
Jahnke [8] N/A Availability lossStrasburg’s IRS [4] Confidentiality loss, Integrity loss, and Availability loss Operational cost, Response goodness, Availability lossZhang’s IRS [69] Confidentiality loss, Integrity loss, and Availability loss maintenance costIRDM-HTN [11], [13] Alert amount, Alert confidence, Alert type number,
Alert severity, Alert relevance scoreN/A
OrBAC [9], [12] Success Likelihood, History, Logging, Warning, Ju-risdiction, Backup Exist, Third Party, Confidentialityloss, Integrity loss, and Availability loss
Backup Exist, Third Party, Confidentiality loss, In-tegrity loss, and Availability loss
Kheir’s IRS [51], [52] Confidentiality loss, Integrity loss, and Availability loss Confidentiality loss, Integrity loss, and Availability lossWang’s IRS [79] Confidentiality loss, Denial of service, Public embar-
rassment, Privilege escalation, Integrity lossSystem downtime, Installation cost, Operation cost,Training cost, Incompatibility cost
1] based on their static power cost. The online risk assessment component calculates the current risk,which is the sum of the previous and new risk costs. When the current risk reaches the first responsecost threshold (the weakest response), the first response it is then applied to mitigate the attack. Whenthis response could not stop the attacker, the current risk cost will reach to the next response cost andthis strategy guaranties the balance between response and attack costs. The major weakness of thismodel is that the response effectiveness remains same during the attack period and does not use theresponse history to order responses.
There exist other models that evaluate attack and response costs but without putting them in the samemeasurement unit (e.g. [4], [5], [69], [79], [91]). These defined different parameters to calculate costsseparately and then defined some techniques to compare them. For example, in [91], Stakhanova etal. proposed more parameters to evaluate response in addition to CIA such as the Man-hours of laborrequired to deploy or manage the response, additional resources used to support a response, such asdisk-space for additional logging.
Another observation that emerged from this study is almost all security studies are validated byapplying them to old datasets [38], [40]. Their accuracy and ability to reflect real-world conditions is amajor concern was argued by Davis et al., in [74]. Also, many datasets are internal and cannot be shareddue to privacy issues, others are heavily anonymized, or they lack certain statistical characteristics. Theseshortcomings are important reasons why a perfect dataset has yet to exist [39]. In order to better testand optimize the selection of these parameters, and compare with other IRS systems, it is necessaryto start working towards building a large dataset of recent attacks. This dataset of attacks would needto be executable and should include the attacks, monitoring information, and system configuration(software packages, data, configuration, etc.), a major undertaking for any single research group. Themain suggestion for future research on the development of IRS is to prepare a strong, real dataset ofsingle and multi-step attacks. Such a dataset is needed by all security researchers and will be useful

for testing the efficiency and scalability aspects of the intrusion response systems in real-time in largeenvironments. Shiravi et al. [39] proposed a set of guidelines to how to create valid datasets, which canbe followed to create the new datasets.
V. CONCLUSION
The paper surveys existing techniques and tools for Intrusion Risk Assessment and Intrusion ResponseSystems. The main findings of this paper are, that despite two decades of research in the area, existingapproaches suffer from serious limitations. First the online risk assessment component is not tightlyintegrated and attuned with the response system. As we discussed earlier, perfect coordination betweenthe risk assessment mechanism and the response system leads to an efficient framework that is able tomanage false positive and select appropriate response in which to be attuned to attack cost.
We also found that most adaptive IRSs do not support effective algorithms for updating responsehistory over time. Many studies claim to achieve this but the review of the literature shows that theyonly support very basic mechanisms. For example, they do not consider time in their calculation ofresponse goodness. Not considering time causes these technique to overlook the most recent resultswhile they must be considered more valuable than earlier ones. Moreover, it is not clear how moststudies measure response goodness (success or failure).
Another important limitation of existing studies lies in the assessment method used to evaluate theeffectiveness of the approach. Most researchers only consider true positives (i.e., the number of correctresponses). While true positive is an indication of accuracy, it only draws a partial picture. False positivemust also be taken into account. It is important to know how responses for IRSs and risks for IRA havebeen wrongly identified.
In addition, most IRSs focus only on response activation. They do not consider response deactivation,which can take into account users needs in terms of quality of service. Finally, most attack graphmethods look at the generation of complex attack graphs and the complexity of analyzing these largeattack graphs. There has been little attention paid to real live implementations for calculating damagecosts. The response selection is also ineffective unless the attack context is taken into account, whichis not the case is most studies.
We believe that these limitations are the main reasons that prevent these techniques from findingtheir place in commercial tools. To build on existing work, we propose, in this paper, to conduct furtherresearch in the following areas: 1) Adaptive IRS, 2) Attack context-aware response selection mechanismin IRS, 3) Dynamic response cost evaluation framework for IRS that meet network demands, 4) ElasticIRSs that consider response activation and deactivation by considering the rate of attack or networkrisk tolerance, and 5) Building dataset of single and multi-step attacks. Such a dataset is needed by allsecurity researchers and will be useful for testing the IRSs and IRAs approaches.
ACKNOWLEDGMENT
This work is partly funded by NSERC CRD to GSTC project and by CRC on Sustainable SmartEco-Cloud.
REFERENCES
[1] C. V. Zhou, C. Leckie, and S. Karunasekera, ”A survey of coordinated attacks and collaborative intrusion detection,”Computers & Security, vol. 29, no. 1, pp. 124-140, 2010.
[2] A. Gehani and G. Kedem, ”Rheostat: Real-time risk management,” In Recent Advances in Intrusion Detection: 7thInternational Symposium, (RAID 2004), pp. 296-314, France, 2004.
[3] Z. Zhang, F. Nat-Abdesselam, P. H. Ho, and Y. Kadobayashi, ”Toward cost-sensitive self-optimizing anomaly detectionand response in autonomic networks,” Computers & Security, vol. 30, no. 6, pp. 525-537, 2011.
[4] C. Strasburg, N. Stakhanova, S. Basu, and J. S. Wong, ”A Framework for Cost Sensitive Assessment of IntrusionResponse Selection,” Proceedings of IEEE Computer Software and Applications Conference, pp. 355-360, 2009.
[5] N. Stakhanova, S. Basu and J. Wong, ”A cost-sensitive model for preemptive intrusion response systems,” Proceedingsof the 21st International Conference on Advanced Networking and Applications, IEEE Computer Society, Washington,DC, USA, pp. 428-435, 2007.
[6] P. Ammann, D. Wijesekera, and S. Kaushik, ”Scalable, Graph-Based Network Vulnerability Analysis,” Proceedings of9th ACM Conference on Computer and Communications Security (ACM-CCS 2002), pp. 217-224, 2002.
[7] S. Jha, O. Sheyner, and J. Wing, ”Two formal analyses of attack graphs,” Proceedings of the 15th Computer SecurityFoundation Workshop, June 2002.
[8] M. Jahnke, C. Thul, and P. Martini, ”Graph-based Metrics for Intrusion Response Measures in Computer Networks,”Proceedings of the 3rd LCN Workshop on Network Security. Held in conjunction with the 32nd IEEE Conference onLocal Computer Networks (LCN), pp. 1035-1042, Dublin, Ireland, 2007.
[9] W. Kanoun, N. Cuppens-Boulahia, F. Cuppens, and J. Araujo, ”Automated reaction based on risk analysis and attackersskills in intrusion detection systems,” Third International Conference on Risks and Security of Internet and Systems, pp.117-124, 2008.
[10] H. Wei, D. Frinke, O. Carter, and C. Ritter, ”Cost-benet analysis for network intrusion detection systems,” CSI 28thAnnual Computer Security Conference, Washington, DC, 2001.
[11] C. P. Mu, X. J. Li, H. K. Huang, and S. F. Tian, ”Online risk assessment of intrusion scenarios using D-S evidencetheory,” Proceedings of the 13th European Symposium on Research in Computer Security, pp. 35-48, Malaga, Spain,2008.
[12] W. Kanoun, N. Cuppens-Boulahia, F. Cuppens, and S. Dubus, ”Risk-Aware Framework for Activating and DeactivatingPolicy-Based Response,” Proceedings of the Fourth International Conference on Network and System Security, pp. 207-215, 2010.
[13] C. P. Mu and Y. Li, ”An intrusion response decision-making model based on hierarchical task network planning,”Expert systems with applications, vol. 37, no. 3, 2010, pp. 2465-2472.
[14] G. N. Matni and M. Dagenais, ”Operating system level trace analysis for automated problem identification,” The OpenCybernetics and Systemics Journal, vol. 5, 2011, pp. 45-52.
[15] N. Stakhanova, S. Basu, and J. Wong, ”Taxonomy of Intrusion Response Systems,” Journal of Information andComputer Security, vol. 1, no. 2, 2007, pp. 169-184.
[16] A. Shameli-Sendi, N. Ezzati-Jivan, M. Jabbarifar, and M. Dagenais, ”Intrusion Response Systems: Survey andTaxonomy,” International Journal of Computer Science and Network Security, vol. 12, no. 1, pp. 1-14, 2012.
[17] F. Cuppens and R. Ortalo, ”Lambda: A language to model a database for detection of attacks,” Proceedings of theThird International Workshop on Recent Advances in Intrusion Detection (RAID2000), pp. 197-216 Toulouse, France,2000.
[18] K. Scarfone and P. Mell, ”Guide to Intrusion Detection and Prevention Systems,” Technical report, NIST: NationalInstitute of Standards and Technology, U.S. Department of Commerce, 2007.
[19] S. Lee, B. Chung, H. Kim, Y. Lee, C. Park, and H. Yoon, ”Real-time analysis of intrusion detection alerts viacorrelation,” Computers & Security, vol. 25, no. 3, pp. 169-183, 2006.
[20] G. Stein, C. Bing, A. S. Wu, and K. A. Hua, ”Decision Tree Classifier For Network Intrusion Detection With GA-basedFeature Selection,” Proceedings of the 43rd annual Southeast regional conference, Georgia, ISBN:1-59593-059-0, pp.136-141, 2005.
[21] N. B. Anuar, H. Sallehudin, A. Gani, and O. Zakaria, ”Identifying False Alarm for Network Intrusion Detection SystemUsing Hybrid Data Mining and Decision Tree,” Malaysian Journal of Computer Science, ISSN 0127-9084, 2008, pp.110-115.
[22] A. Lazarevic, L. Ertz, V. Kumar, A. Ozgur, and J. Srivastava, ”A Comparative Study of Anomaly Detection Schemesin Network Intrusion Detection,” Proceedings of the Third SIAM International Conference on Data Mining, 2003.
[23] F. Xiao, S. Jin, and X. Li, ”A Novel Data Mining-Based Method for Alert Reduction and Analysis,” Journal ofNetworks, vol. 5, no. 1, 2010, pp. 88-97.
[24] P. Berkhin, ”Survey of clustering data mining techniques,” 2001.
[25] A. O. Adetunmbi, S. O. Falaki, O. S. Adewale, and B. K. Alese, ”Network Intrusion Detection based on Rough Setand k-Nearest Neighbour,” International Journal of Computing and ICT Research, vol. 2, no. 1, 2008, pp. 60-66.
[26] J. Han and M. Kamber, ”Data Mining: Concepts and Techniques,” 2nd ed., San Francisco: Elsevier, 2006.
[27] The Snort Project, Snort users manual 2.8.5, 2009.
[28] Difference between Signature Based and Anomaly Based Detection in IDS, URLhttp://www.secguru.com/forum/difference between signature based and anomaly based detection in ids.
[29] M. F. Yusof, ”Automated Signature Generation of Network Attacks,” B.Sc. thesis, University Teknologi Malasia, 2009.
[30] H. Debar, D. Curry, and B. Feinstein, ”The Intrusion Detection Message Exchange Format (IDMEF),”http://www.ietf.org/rfc/rfc4765.txt.
[31] W. Lee, W. Fan, and M. Miller, ”Toward Cost-Sensitive Modeling for Intrusion Detection and Response,” Journal ofComputer Security, vol. 10, no. 1, 2002, pp. 5-22.
[32] K. Haslum, A. Abraham, and S. Knapskog, ”DIPS: A framework for distributed intrusion prediction and preventionusing hidden markov models and online fuzzy risk assessment,” Proceedings of the 3rd International Symposium onInformation Assurance and Security, pp. 183-188, Manchester, United Kingdom, 2007.
[33] M. Sabhnani and G. Serpen, ”Formulation of a Heuristic Rule for Misuse and Anomaly Detection for U2R Attacks inSolaris Operating System Environment,” In Security and Management, pp. 390-396, 2003.
[34] A. Curtis and J. Carver, ”Adaptive agent-based intrusion response,” Ph.D. thesis, Texas A&M University, USA, 2001.
[35] G. White, E. Fisch, and U. Pooch ”Cooperating security managers: a peer-based intrusion detection system,” IEEENetwork, vol. 10, 1996, pp. 20-23.
[36] P. Porras and P. Neumann, ”EMERALD: event monitoring enabling responses to anomalous live disturbances,” NationalInformation Systems Security Conference, pp. 353-365, 1997.
[37] T. Toth and C. Kregel, ”Evaluating the impact of automated intrusion response mechanisms,” Proceedings of the 18thAnnual Computer Security Applications Conference, Los Alamitos, USA, 2002.
[38] MIT Lincoln Laboratory, 2000 darpa intrusion detection scenario specific data sets, 2000.
[39] A. Shiravi, H. Shiravi, M. Tavallaee, and A. A. Ghorbani, ”Toward developing a systematic approach to generatebenchmark datasets for intrusion detection,” Computers & Security, vol. 31, no, 3, pp. 357-374, 2012.
[40] University of California. KDD Cup 1999 data, http://kdd.ics.uci.edu/databases/kddcup99/kddcup99.html.
[41] M. Gaber, A. Zaslavsky, and S. Krishnaswamy, ”Mining Data Streams: A Review,” ACM SIGMOD Record, vol. 34,2005.
[42] C. Aggarwal, J. Han, J. Wang, and P. Yu, ”A Framework for Projected Clustering of High Dimensional Data Streams,”Proceedings of the 30th VLDB Conference, Toronto, pp. 852-863, Canada, 2004.
[43] C. Strasburg, N. Stakhanova, S. Basu, and J. S. Wong, ”The Methodology for Evaluating Response Cost for IntrusionResponse Systems,” Technical Report 08-12, Iowa State University.
[44] N. B. Anuar, M. Papadaki, S. Furnell, and N. Clarke, ”An investigation and survey of response options for intrusionresponse systems,” Information Security for South Africa, pp. 1-8, 2010.
[45] L. Feng , W. Wang , L. Zhu, and Y. Zhang, ”Predicting intrusion goal using dynamic Bayesian network with transferprobability estimation,” Journal of Networks and Computer Applications, vol. 32, no. 3, 2009, pp. 721-732.
[46] D. Yu and D. Frincke, ”Improving the quality of alerts and predicting intruder’s next goal with Hidden ColoredPetri-Net,” Computer Networks, pp. 632-654, 2007.
[47] A. Shameli-Sendi, M. Dagenais, M. Jabbarifar, and M. Couture ”Real Time Intrusion Prediction based on improvingthe priority of alerts with Hidden Markov Model,” Journal of Networks, vol. 7, no. 2, February 2012, pp. 311-321.
[48] Z. Li, Z. Lei, L. Wang, and D. Li, ”Assessing attack threat by the probability of following attacks,” Proceedings ofthe International Conference on Networking, Architecture, and Storage, IEEE, pp. 91-100, 2007.
[49] P. Arnes, F. Valeur, and R. Kemmerer, ”Using hidden markov models to evaluate the risk of intrusions,” Proceedingsof the 9th international conference on Recent Advances in Intrusion Detection, pp. 145-164, Hamburg, Germany, 2006.
[50] A. Arnes, K. Sallhammar, K. Haslum, T. Brekne, M. Moe, and S. Knapskog, ”Real-time risk assessment with networksensors and intrusion detection systems,” In Computational Intelligence and Security, vol. 3802 of Lecture Notes inComputer Science, pp. 388-397, 2005.
[51] N. Kheir, N. Cuppens-Boulahia, F. Cuppens, and H. Debar, ”A service dependency model for cost sensitive intrusionresponse,” Proceedings of the 15th European Conference on Research in Computer Security, pp. 626-642, 2010.
[52] N. Kheir, H. Debar, N. Cuppens-Boulahia, F. Cuppens, and J. Viinikka, ”Cost evaluation for intrusion response usingdependency graphs,” In IFIP International Conference on Network and Service Security, 2009.
[53] I. Balepin, S. Maltsev, J. Rowe, and K. Levitt ”Using specification-based intrusion detection for automated response,”Proceedings of the 6th International Symposium on Recent Advances in Intrusion Detection, pp. 136-154, 2003.
[54] Y. Chen, B. Boehm, and L. Sheppard, ”Value Driven Security Threat Modeling Based on Attack Path Analysis,” In40th Hawaii International Conference on System Sciences, Big Island, Hawaii, January 2007.
[55] Y. Zhang, X. Fan, Y. Wang, and Z. Xue, ”Attack grammar: A new approach to modeling and analyzing network attacksequences,” Proceedings of the Annual Computer Security Applications Conference (ACSAC 2008), pp. 215-224, 2008.
[56] N. Kheir, ”Response policies and counter-measures : Management of service dependencies and intrusion and reactionimpacts,” Ph.D. Thesis, 2010.
[57] S. Savage, D. Wetherall, A. Karlin and T. Anderson ”Practical network support for IP traceback,” In ACM SIGCOMM,pp. 295-306, August 2000.
[58] E. Fisch, ”A Taxonomy and Implementation of Automated Responses to Intrusive Behavior,” Ph.D. thesis, Texas A&MUniversity, 1996.
[59] T. Bowen, D. Chee, M. Segal, R. Sekar, T. Shanbhag, and P. Uppuluri, ”Building survivable systems: an integratedapproach based on intrusion detection and damage containment,” In DARPA Information Survivability Conference andExposition, pp. 84-99, 2000.
[60] S. Musman and P. Flesher, ”System or security managers adaptive response tool,” In DARPA Information SurvivabilityConference and Exposition, pp. 56-68, 2000.
[61] A. Somayaji and S. Forrest, ”Automated response using system-call delay,” Proceedings of the 9th USENIX SecuritySymposium, pp.185-198, 2000.
[62] Y.M. Chen and Y. Yang, ”Policy management for network-based intrusion detection and prevention,” In IEEE NetworkOperations and Management Symposium, 2004.
[63] C. Carver and U. Pooch, ”An intrusion response taxonomy and its role in automatic intrusion response,” IEEE Workshopon Information Assurance and Security, 2000.
[64] C. Carver, J. M. Hill, and J. R. Surdu, ”A methodology for using intelligent agents to provide automated intrusionresponse,” IEEE Systems, Man, and Cybernetics Information Assurance and Security Workshop, pp. 110-116, 2000.
[65] D. Ragsdale, C. Carver, J. Humphries, and U. Pooch, ”Adaptation techniques for intrusion detection and intrusionresponse system,” IEEE International Conference on Systems, Man, and Cybernetics, pp. 2344-2349, 2000.
[66] S. M. Lewandowski, D. J. V. Hook, G. C. OLeary, J. W. Haines, and M. L. Rossey, ”SARA: Survivable autonomicresponse architecture,” In DARPA Information Survivability Conference and Exposition, pp. 77-88, 2001.
[67] D. Schnackenberg, H. Holliday, R. Smith, K. Djadhandari, and D. Sterne, ”Cooperative intrusion traceback and responsearchitecture citra,” In IEEE DARPA Information Survivability Conference and Exposition, pp. 56-68, 2001.
[68] X. Wang, D. S. Reeves, and S. F. Wu, ”Tracing based active intrusion response,” Journal of Information Warefare, vol.1, 2001, pp. 50-61.
[69] Z. Zhang, P. H. Ho, and L. He, ”Measuring IDS-estimated attack impacts for rational incident response: A decisiontheoretic approach,” Computers & Security, vol. 28, no. 7, pp. 605-614, 2009.
[70] S. Tanachaiwiwat, K. Hwang, and Y. Chen, ”Adaptive Intrusion Response to Minimize Risk over Multiple NetworkAttacks,” ACM Transactions on Information and System Security, 2002, pp. 1-30.
[71] B. Foo, Y. S. Wu, Y. C. Mao, S. Bagchi, and E. Spafford, ”ADEPTS: adaptive intrusion response using attack graphsin an e-commerce environment,” International Conference on Dependable Systems and Networks, pp. 508-517, 2005.
[72] M. Papadaki and S. M. Furnell, ”Achieving automated intrusion response: a prototype implementation,” InformationManagement and Computer Security, vol. 14, no. 3, 2006, pp. 235-251.
[73] K. Haslum, M. E. G. Moe, and S. J. Knapskog, ”Real-time intrusion prevention and security analysis of networksusing HMMs,” In 33rd IEEE Conference on Local Computer Networks, pp. 927-934, Montreal, Canada, 2008.

[74] J. J. Davis and A. J. Clark, ”Data preprocessing for anomaly based network intrusion detection: A review,” Computers& Security, vol. 30, no. 6, pp. 353-375, 2011.
[75] L. Wang, T. Islam, T. Long, A. Singhal, and S. Jajodia, ”An attack graph-based probabilistic security metric,”Proceedings of The 22nd Annual IFIP WG 11.3 Working Conference on Data and Applications Security (DBSEC08),2008.
[76] S. Noel and S. Jajodia, ”Understanding complex network attack graphs through clustered adjacency matrices,”Proceedings of the 21st Annual Computer Security Conference (ACSAC), pp. 160-169, 2005.
[77] L. Wang, A. Liu, and S. Jajodia, ”Using Attack Graph for Correlating, Hypothesizing, and Predicting Intrusion Alerts,”Computer Communications, vol. 29, no. 15, 2006, pp. 2917-2933.
[78] R. Dantu, K. Loper, and P. Kolan, ”Risk Management Using Behavior Based Attack Graphs,” Proceedings of theInternational Conference on Information Technology: Coding and Computing (ITCC’04), pp. 445-449, 2004.
[79] S. Wang, Z. Zhang, and Y. Kadobayashi, ”Exploring attack graph for cost-benefit security hardening: A probabilisticapproach,” Computers & Security, vol. 32, pp. 158-169, 2013.
[80] K. Haslum, A. Abraham, and S. Knapskog, ”Fuzzy Online Risk Assessment for Distributed Intrusion Prediction andPrevention Systems,” Tenth International Conference on Computer Modeling and Simulation, IEEE Computer SocietyPress, pp. 216-223, Cambridge, 2008.
[81] G. P. Spathoulas and S. K. Katsikas, ”Reducing false positives in intrusion detection systems,” Computers & Security,vol. 29, no. 1, pp. 35-44, 2010.
[82] W. Kanoun, N. Cuppens-Boulahia, F. Cuppens, and F. Autrel, ”Advanced reaction using risk assessment in intrusiondetection systems,” Proceedings of the Second international conference on Critical Information Infrastructures Security,PP. 58-70., Spain, 2007.
[83] E. Totel, B. Vivinis, and L. Me, ”A language driven intrusion detection system for event and alert correlation,”Proceedings at the 19th IFIP International Information Security Conference, Kluwer Academic, Toulouse, pp. 209-224, 2004.
[84] J. Goubault-Larrec, ”An introduction to logweaver,” Technical report, LSV, 2001.
[85] Y. D. Lin, Y. C. Lai, C. Y. Ho, and W. H. Tai, ”Creditability-based weighted voting for reducing false positives andnegatives in intrusion detection,” Computers & Security, vol. 39, pp. 460-474, 2013.
[86] E. Hulitt and R. B. Vaughn, ”Information system security compliance to FISMA standard: a quantitative measure,”Telecommunication Systems, vol. 45, no. 2-3, pp. 139-152, 2010.
[87] A. Ekelhart, S. Fenz, M. Klemen, and E. Weippl, ”Security Ontologies: Improving Quantitative Risk Analysis, in The40th Hawaii International Conference on System Sciences, Hawaii, 2007.
[88] C. C. Lo and W. J. Chen, ”A hybrid information security risk assessment procedure considering interdependencesbetween controls,” Expert Systems with Applications, vol. 39, no. 1, pp. 247-257, 2012.
[89] E. Hulitt and R. B. Vaughn, ”Information system security compliance to FISMA standard: a quantitative measure,”Telecommunication Systems, vol. 45, no. 2-3, pp. 139-152, 2010.
[90] B. Karabacak and I. Sogukpinar, ”ISRAM: information security risk analysis method,” Computers & Security, vol. 24,no. 2, pp. 147-159, 2005.
[91] N. Stakhanova, ”A framework for adaptive, cost-sensitive intrusion detection and response system,” Ph.D. thesis, IowaState University, USA, 2007.