taxonomical discrimination of pollen grains by using confocal laser
TRANSCRIPT

Taxonomical discrimination of pollen grains by using confocal laser
scanning microscopy (CLSM) imaging of autofluorescence
A.J. Castro, J.D. Rejón, M. Fendri, M.J. Jiménez-Quesada, A. Zafra, J.C. Jiménez-López, M.I.
Rodríguez-García and J.D. Alché,
Department of Biochemistry, Cellular and Molecular Biology of Plants, Estación Experimental del Zaidín (CSIC),
Profesor Albareda 1, 18008 Granada, Spain
Several components of the exine (i.e. the outer layer of the pollen wall) show conspicuous autofluorescence in the pollen
grain. We describe the autofluorescence properties of pollens from the Mediterranean cypress, lily, turnip and olive (cvs.
Picual, Loaime, Cornicabra and Ayrouni). The intensity and pattern of autofluorescence largely varied depending on the
species and the hydration stage of pollen. In the case of olive, differences in the level of autofluorescence were detected
among the four cultivars analyzed. This technique also allowed further morphological characterization of pollen (e.g.
determination of pollen size and shape, and the number and type of apertures, the pattern of the exine, etc), evaluation of
pollen integrity, detection of additional components (e.g. the pollen coat) over the surface of the pollen wall, etc. The
methods used can be considered non-disruptive and lack of sample preparation. Monitoring pollen autofluorescence could
be useful in disciplines like Aerobiology, Plant Taxonomy, and Cell and Molecular Biology.
Keywords autofluorescence; CLSM; cultivars; exine; hydration; pollen; pollen coat; pollen wall; species; taxonomy
1. Introduction
Autofluorescence of living cells and tissues is an intrinsic property arising from to the presence of endogenous
molecules like aromatic amino acids, lipo-pigments and pyridine (NADPH) and flavin (FADH2) co-enzymes, which
become fluorescent when excited by ultraviolet (UV) light [1, 2]. In plant cells, autofluorescence is mainly derived from
the presence of chlorophyll in chloroplasts and lignin in secondary cell walls [3].
Similar to other plant cells and tissues, the pollen grain (i.e. the male gametophyte) also exhibits autofluorescence [4-
6]. This property relies on compounds like carotenoids, phenolics (e.g. flavonoids) and terpenoids [7], which are firmly
bound to the outer layer of the pollen wall (i.e. exine). The emission of autofluorescence has been used to assess pollen
sensitivity to environmental factors such as ozone and peroxides [8-9], to study pollen retention in the stigma [10], to
monitor pollen wall development [11-13] or simply to count pollen grains in an appropriate device [14-15]. Pollen
autofluorescence levels change during its ontogeny and ageing. These changes have been correlated with pollen
viability by several authors [16]. Autofluorescence has begun to be used for taxonomical discrimination. In a pioneer
study, 15 out of 21 grass pollen species were classified on the basis of the autofluorescence colour of the cytoplasm and
exine layers, and the overall autofluorescence intensity [17]. More recently, pollen from nine plant species were
identified on the basis of its size and the ratio of the blue to red autofluorescence spectra [18].
In the present work, we examine the autofluorescence properties of mature pollen obtained from four plant species:
olive, Mediterranean cypress, lily and turnip. In the case of olive, pollen from cultivars Picual, Loaime, Cornicabra and
Ayrouni was imaged and analyzed.
2. Material and methods
2.1 Plant material
Mature pollen grains from olive (Olea europaea L., cvs. Picual, Loaime, Cornicabra and Ayrouni), Mediterranean
cypress (Cupressus sempervirens L.), lily (Lilium longiflorum L.) and turnip (Brassica rapa L.) plants were sampled by
vigorously shaking the flowering shoots inside paper bags. Olive, cypress and turnip pollen grains were collected from
their natural habitats, whereas lily pollen was obtained from flowering shoots purchased in a local flower nursery.
Pollen grains (approximately 0.05 g for each plant species) were hydrated by placing them on a wet filter paper and
incubating at 30ºC for 30 min in the dark.
2.2 CLSM imaging
The autofluorescence of pollen exine was imaged at different magnifications with a C1 confocal laser scanning
microscope (Nikon, Japan) using a combination of He-Ne (543 nm) and He-Ne (633 nm) lasers. Autofluorescence
emission was captured independently at 590-650 nm (orange-red spectrum) and 650LP nm (far red spectrum). In all
cases, section stacks were generated, which were then projected into a single plane. Identical parameters for each
Microscopy: Science, Technology, Applications and Education A. Méndez-Vilas and J. Díaz (Eds.)
©FORMATEX 2010 607
______________________________________________

acquisition were used, in order to enable making comparisons of the registered autofluorescence. The image capture
was performed using the EZ-C1 viewer v.3.30 software (Nikon, Japan). Pseudocolours were assigned to each type of
pollen to differentiate species.
2.3 Measurement of pollen autofluorescence intensity and statistical analysis
The intensity of autofluorescence of intact pollen surfaces was calculated in arbitrary units (A.U.) per area unit using
the EZ-C1 viewer v.3.30 software (Nikon, Japan). Means (N= 20 pollen grains per species) ± SD were calculated and
plotted using the SSPS Statistics v. 17.0.0 software (SSPS, USA). Non-parametric comparisons of variables (total
autofluorescence intensity and 590/650 to 650LP fluorescence ratio) for two unpaired groups (Mann-Whitney test) and
more than three unmatched groups (Kruskal-Wallis test) were performed using the SSPS Statistics v. 17.0.0 software
(SSPS).
3. Results and Discussion
3.1 Discrimination of plant species by pollen autofluorescence
The autofluorescence intensity of the pollen varied depending on the species and its hydration status, as shown in Fig. 1.
Contaminating structures (trichomes) in olive pollen samples also fluoresced but they were easily distinguishable from
true pollen grains (Fig. 1A, E). Pollen autofluorescence mainly came from the exine wall, while the apertures did not
fluoresce in any of the species analyzed (Fig. 1G, H). This fluorescence is likely due to carotenoids and phenols present
in the exine, as described in other species [16, 19-22]. Indeed, the extraction of these compounds with organic solvents
was demonstrated to lead to a loss of pollen autofluorescence [23]. We observed that the intensity of autofluorescence
was heterogeneous in each pollen sample, some grains being brighter than others. This intraspecific variability was
more marked in the olive and turnip and could reflect differences in the water content of each grain within a species
(Fig.1).
Fig. 1 Representative autofluorescence images of olive (cv. Picual), Mediterranean cypress, lily and turnip pollen before (Fig. 1A,
B, C and D, respectively) and after (Fig. 1E, F, G and H, respectively) rehydration. Images were obtained with a confocal laser
microscope and represent the sum of the fluorescence emitted at 590-650 nm and 650LP nm after excitation at 543 nm (green laser)
and 633 nm (red laser), respectively. Different pseudocolours were used to differentiate species. T, trichome. Bars= 100 µm.
The brightest autofluorescent signal was detected in the dry pollen, independently of the species. Then the
autofluorescence intensity decreased as pollen becomes fully hydrated. It was previously described that water quenched
the autofluorescence of viable pollen during in vitro germination [13] and upon contact of pollen with the stigma
surface [20]. Supposedly non-viable pollen grains, however, remained fluorescent after pollen wetting. A similar pattern
occurred in olive, cypress, lily and turnip. Figure 2 highlights the results of quantifying both the total fluorescence
intensity and the green to red illumination-emitted fluorescence ratio for each type of pollen. The statistical analysis of
these data showed significant differences in the total autofluorescence intensity among the species studied (Fig. 2A),
Microscopy: Science, Technology, Applications and Education A. Méndez-Vilas and J. Díaz (Eds.)
608 ©FORMATEX 2010
______________________________________________

independently of whether the pollen grain was fully hydrated (Kruskal-Wallis test, χ2= 55.664, p= 0.000) or not (χ
2=
49.996, p= 0.000). Before rehydration, cypress pollen produced the highest emission of autofluorescence, while turnip
pollen showed the lowest values. These interspecific differences could be due to both quantitative and qualitative
variations in the composition of the exine and/or differences in the degree of pollen hydration at maturity, as
demonstrated in other plant species [9, 13]. Non-parametric comparisons of two unpaired groups of species revealed
that the dry pollen grains of olive and lily present similar autofluorescence intensity values (Mann-Whitney test, U=
105.0, p= 0.071), but the rest of comparisons resulted in significant differences. After hydration, measurements
indicated a different situation, with olive and turnip pollens showing similar values of autofluorescence (U= 130.0, p=
0.311), and the remaining comparisons resulting in significant differences.
Fig. 2 Quantification of total autofluorescence intensity (A) and orange-red/far red autofluorescence ratio (B) of olive (Olea
europaea), Mediterranean cypress (Cupressus sempervirens), lily (Lilium longiflorum) and turnip (Brassica rapa) pollen. Grey
columns refer to dry pollen, whereas white columns refer to hydrated pollen. Means (N= 20) ±SD are displayed for each plant
species. AU= arbitrary units.
Pollen from olive, cypress and turnip showed a higher fluorescence emission in the 590-650 nm spectrum than in the
far red (650LP nm) region (Fig. 2B). Contrary, lily pollen displayed higher autofluorescence values in the far red
(650LP nm) emission wavelength. Interestingly, the orange-red/far red fluorescence ratio also varied significantly
among the species studied (Fig. 2B) in both hydrated (Kruskal-Wallis test, χ2= 64.680, p= 0.000) and dry (χ
2= 63.884,
p= 0.000) pollen. Non-parametric comparisons of G/R fluorescence for two unpaired groups of species always resulted
in significant differences, independently of the water status of pollen. Therefore, this last parameter alone or in
combination with the autofluorescence intensity allowed classifying the four plant species studied.
Autofluorescence visualization also allowed identifying additional pollen morphological traits (Table 1). Parameters
like pollen shape and size (i.e. pollen diameters), exine pattern, and type and number of pollen apertures were easily
determined in our samples (Fig. 3A-B). Thus, lily pollen was almost four-fold larger in diameter than the other species
studied, and experienced a drastic change in its shape after hydration. Turnip pollen kept its oval shape after hydration
while pollen grains rounded off in the other species. All together, these parameters might be a valuable supplement to
the autofluorescence data for fine discrimination of a higher number of plant species.
Table 1 Morphological parameters examined in four plant species using the autofluorescence properties of pollen.
Species Pollen diameter
and shape (P/E)
Exine
pattern
Classification of
pollen according
to the number and
type of apertures Dry Hydrated
Polar (P)
(µm)
Equatorial (E)
(µm)
P/E Polar (P)
(µm)
Equatorial (E)
(µm)
P/E
Olive 38.58±6.34 28.14±3.77 1.37 34.37±6.19 31.96±4.20 1.08 Reticulate Trizonocolporate
Cypress 40.50±9.40 33.64±6.46 1.20 48.00±13.62 44.81±8.12 1.07 Smooth Inaperturate
Lily 227.34±11.75 86.97±4.74 2.61 194.47±9.22 152.88±7.28 1.27 Reticulate Monocolpate
Turnip 63.53±4.88 27.05±2.63 2.35 60.53±5.43 40.57±2.51 1.49 Reticulate Dicolpate
In addition to these morphological traits, imaging of autofluorescence at higher magnification allowed analyzing
other characteristics of pollen. In this way, the hydration status of pollen could be easily monitored. Fully hydrated
pollen was discernible from partially dehydrated pollen owing to autofluorescence emission was significantly quenched
by water. This technique also permitted to detect the presence of additional secreted components over the surface of the
pollen wall. We could observe drops of fluorescent material filling the cavities of the exine in the lily pollen (Fig. 3C).
Microscopy: Science, Technology, Applications and Education A. Méndez-Vilas and J. Díaz (Eds.)
©FORMATEX 2010 609
______________________________________________
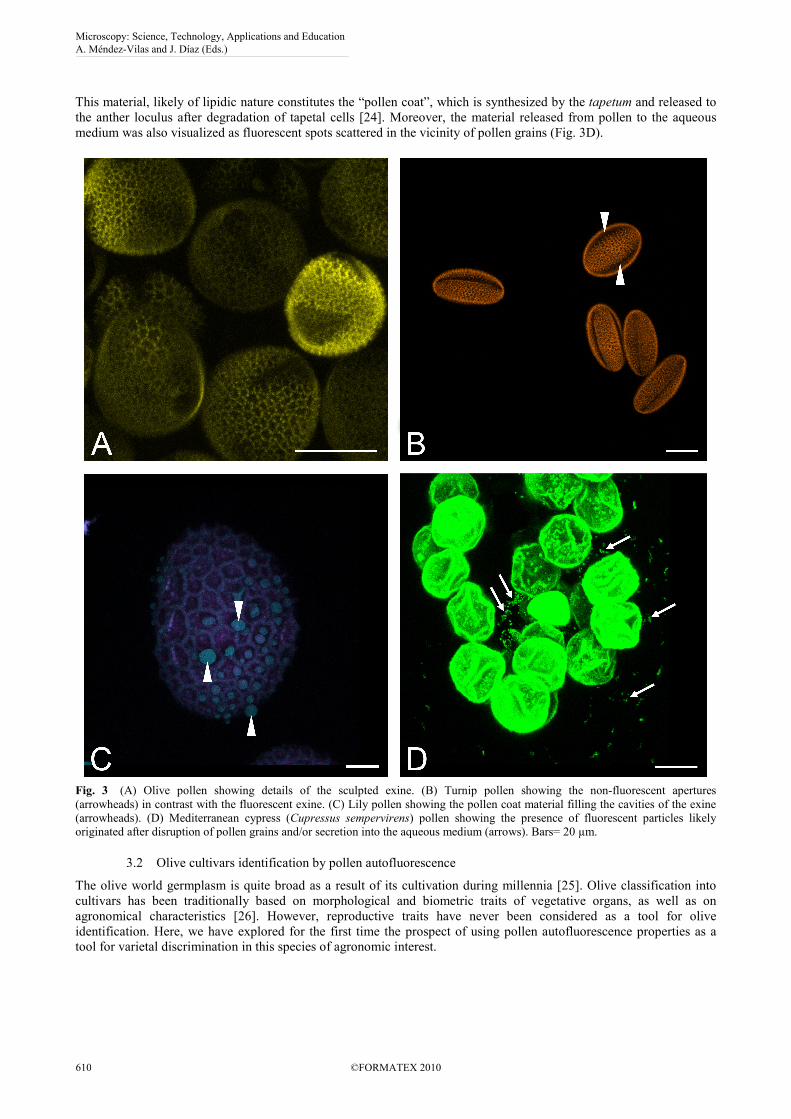
This material, likely of lipidic nature constitutes the “pollen coat”, which is synthesized by the tapetum and released to
the anther loculus after degradation of tapetal cells [24]. Moreover, the material released from pollen to the aqueous
medium was also visualized as fluorescent spots scattered in the vicinity of pollen grains (Fig. 3D).
Fig. 3 (A) Olive pollen showing details of the sculpted exine. (B) Turnip pollen showing the non-fluorescent apertures
(arrowheads) in contrast with the fluorescent exine. (C) Lily pollen showing the pollen coat material filling the cavities of the exine
(arrowheads). (D) Mediterranean cypress (Cupressus sempervirens) pollen showing the presence of fluorescent particles likely
originated after disruption of pollen grains and/or secretion into the aqueous medium (arrows). Bars= 20 µm.
3.2 Olive cultivars identification by pollen autofluorescence
The olive world germplasm is quite broad as a result of its cultivation during millennia [25]. Olive classification into
cultivars has been traditionally based on morphological and biometric traits of vegetative organs, as well as on
agronomical characteristics [26]. However, reproductive traits have never been considered as a tool for olive
identification. Here, we have explored for the first time the prospect of using pollen autofluorescence properties as a
tool for varietal discrimination in this species of agronomic interest.
Microscopy: Science, Technology, Applications and Education A. Méndez-Vilas and J. Díaz (Eds.)
610 ©FORMATEX 2010
______________________________________________

Fig. 4 Images of autofluorescent olive pollen from cultivars Ayrouni (A), Cornicabra (B), Loaime (C) and Picual (D) after
rehydration, showing slight differences in size and autofluorescence intensity. Bars= 100 µm.
The autofluorescence emission pattern after pollen rehydration was similar for all cultivars to that described above
(Fig. 1E), with some pollen grains being brighter than others (Fig. 4). Similarly, this intra-varietal variability could
reflect differences in the water content of each grain within a cultivar. As shown in Fig. 5A, the total autofluorescence
intensity significantly varied among cultivars (Kruskal-Wallis test, χ2= 28.228, p= 0.000). Comparisons using the
Mann-Whitney test revealed that Ayrouni presented higher autofluorescence values than Picual, Loaime and Cornicabra
cultivars. These differences are likely due to intrinsic factors of pollen (i.e. composition of exine and the material
adhered to it) since all cultivars showed similar performance in terms of viability (data not shown).
In all cultivars studied, olive pollen showed a higher fluorescence emission in the range 590-650 nm, although also
exhibited significant fluorescence at 650LP nm (Fig. 5B). Interestingly, the orange-red/far red autofluorescence ratio
also varied significantly among cultivars (Kruskal-Wallis test, χ2= 35.779, p= 0.000). Non-parametric comparisons of
the autofluorescence ratio for two unpaired groups of species always resulted in significant differences except when
Cornicabra and Ayrouni cultivars were compared. Therefore, all together, these parameters allowed classifying the four
olive cultivars studied. However, to validate this method for cultivar identification purposes, this study needs to be
extended to a larger number of olive cultivars. Moreover, the use of microscopes fitted with spectral detection will help
to obtain further data regarding the autofluorescence properties of these samples, and will improve taxonomical
discrimination ability.
Microscopy: Science, Technology, Applications and Education A. Méndez-Vilas and J. Díaz (Eds.)
©FORMATEX 2010 611
______________________________________________

Fig. 5 Quantification of total autofluorescence intensity (A) and orange-red/far red autofluorescence ratio (B) of hydrated pollen
from four olive cultivars. Means (N= 20) ±SD are displayed for each plant species. AU= arbitrary unit.
4. Conclusions
Autofluorescence imaging can be considered a non-disruptive method for pollen classification since it does not require
any treatment of fixing or staining of the specimens. Therefore, this simple and fast method can be used for pollen
counting and taxonomical classification in multiple applications that concern disciplines like Aerobiology, Plant
Taxonomy and Cell and Molecular Biology. Moreover, autofluorescence properties of pollen could be used in
combination with other morphological parameters to classify olive cultivars.
Acknowledgements The support by the Spanish Ministry of Science and Innovation (ERDF-cofinanced project BFU2008-00629)
and CSIC (cooperation agreement 2007PT0039) is gratefully acknowledged.
References
[1] Chance B, Cohen P, Jobsis F, Schoener B. Intracellular oxidation-reduction states in vivo. The microfluorometry of pyridine
nucleotide gives continuous measurement of the oxidation state. Science. 1962;137:499-508.
[2] Benson RC, Meyer RA, Zaruba MW, McKhann GM. Cellular autofluorescence – is it due to flavins. J. Histochem. Cytochem.
1979;27:44-48.
[3] Krause GH, Weis E. Chlorophyll fluorescence and photosynthesis: the basics. Ann. Rev. Plant Physiol. Plant Mol. Biol.
1991;42:313-349.
[4] Ruhland W, Wetzel K. Der nachweis von chloroplasten in den generativen zellen von pollenschlaüchen. Ber. Deutsch. Bot. Ges.
1924;42:3-14.
[5] Berger F. Das verhalten der heufieber-erregenden pollen in filtrien ultravioleten licht. Beitr. Biol. Pflanzen. 1934;22:1-12.
[6] Asbeck F. Fluoreszieren der blutenstaub. Naturwiss. 1955;4:632.
[7] Roshchina VV, Mel´nikova EV, Mit´kovskaya LI, Karnaukhov VN. Microspectrofluorometry for the study of intact plant
secretory cells. Zh. Obshch. Biol. 1998;59:531-554.
[8] Roshchina VV, Karnaukhov VN. Changes in pollen autofluorescence induced by ozone. Biol. Plant. 1999;42:273-278.
[9] Roshchina VV, Mel´nikova EV. Pollen chemosensitivity to ozone and peroxides. Russ. J. Plant Physiol. 2001;48:74-83.
[10] Weinbaum SA, Polito VS. Assessment of pollen retention using exine autofluorescence. Mikroskopie. 1985;42:278-280.
[11] Willemse MTM. Changes in the autofluorescence of the pollen wall during microsporogenesis and chemical treatments. Acta
Bot. Neerl. 1972;21:1-16.
[12] Willemse MTM. Autofluorescence of pollen wall of Lilium and changes in pollen wall of Gasteria and Lilium anther. Acta Soc.
Bot. Pol. 1981;50:103-110.
[13] Audran JC, Willemse MTM. Wall development and its autofluorescence of sterile and fertile Vicia faba L. pollen. Protoplasma.
1982;110:106-111
[14] Suzuzi M, Tonouchi M Muyarama K, Mitsumoto K. An analysis of high concentration of pollen at early morning in 2005
spring and a measurement of Japanese cedar and cypress pollen using autofluorescence characteristics. J. Aerosol Res.
2005;20:281-289.
[15] Fonseca AE, Westgate ME, Doyle RT. Application of fluorescence microscopy and image analysis for quantifying dynamics of
maize pollen shed. Crop Sci. 2002;42:2201-2206
[16] Roshchina VV, Mel´nikova EV, Kovaleva LV. Changes in fluorescence during development of the male gametophyte. Russ. J.
Plant Physiol. 1997;44:45-53.
[17] Driessen MNBM, Willemse MTM, van Luijin JAG. Grass pollen grain determination by light- and UV- microscopy. Grana.
1989;28:115-122.
Microscopy: Science, Technology, Applications and Education A. Méndez-Vilas and J. Díaz (Eds.)
612 ©FORMATEX 2010
______________________________________________

[18] Mitsumoto K, Yabusaki K, Aoyagi H. Classification of pollen species using autofluorescence image analysis. J. Biosci. Bioeng.
2009;107:90-94.
[19] Stanley RG, Linskens HF, eds. Pollen: Biology, Biochemistry, Management. Berlin: Springer-Verlag; 1974.
[20] Roshchina VV, Popov VI, Novoselov VI, Mel´nikova EV, Peshenko IV, Khutsyan SS, Fesenko EE. Transduction of
chemosignal in pollen. Cytology. 1998;40:964-971.
[21] Roshchina VV, Mel´nikova EV, Gordon Rya, Konovalov DA, Kuzin AM. A study of the radioprotective activity of proazulenes
using a chemosensory model of Hippeastrum hybridum pollen. Doklady Biophys. 1998;358:20-23.
[22] Roshchina VV, Mel´nikova EV, Kovaleva LV. Autofluorescence in the pollen-pistil system of Hippeastrum hybridum. Doklady
Biol. Sci. 1996;349:118-120.
[23] Mel´nikova EV, Roshchina VV, Karnaukhov VN. Microspectrofluorometry of pollen. Biophys. 1997;42:226-233.
[24] Pacini E, Juniper BE. The ultrastructure of pollen-grain development in the olive (Olea europaea). 2. Secretion by the tapetal
cells. New Phytol. 1979;83:165-174.
[25] Zohary D, Spiegel-Roy P. Beginnings of fruit growing in the Old World. Science. 1975;187:319-327.
[26] Trujillo I, Morales A, Belaj A, Valpuesta V, Botella MA, Rallo P, Martín A, Dorado G. Identificación de variedades de olivo
por marcadores moleculares. In: Rallo L, Barranco D, Caballero JM, Del Rio C, Martin A, Tous J, Trujillo I, eds. Variedades
de olivo en España. Madrid: Junta de Andalucía, MAPA and Ediciones Mundi-Prensa; 2005:431-450.
Microscopy: Science, Technology, Applications and Education A. Méndez-Vilas and J. Díaz (Eds.)
©FORMATEX 2010 613
______________________________________________