taxation of cross border dividend payments within eu 2012 clean
TRANSCRIPT

DG Taxation and Customs Union
TAXATION OF CROSS-BORDER DIVI-DEND PAYMENTS WITHIN THE EU IMPACTS OF SEVERAL POSSIBLE SOLUTIONS TO ALLEVIATE DOUBLE TAXATION | 22 JUNE 2012

Taxation of cross-border dividend payments within the EU
2
Disclaimer
This report has been produced by Copenhagen Economics following the commissioning of a
study by the European Commission, Directorate-General for Taxation and Customs Union.
It is the result of independent work carried out by Copenhagen Economics, and does not
necessarily reflect the opinions or position of the European Commission or of the experts or
stakeholders. Any errors are our own.
COLOPHON
Author: Partner Sigurd Næss-Schmidt (project manager), senior economist Eva Rytter
Sunesen (team leader), economist Martin Bo Hansen (team member) and analyst
Holger Nikolaj Jensen (team member)
Client: DG TAXUD
Date: 22 June 2012
Contact: SANKT ANNÆ PLADS 13, 2nd FLOOR | DK-1250 COPENHAGEN
PHONE: +45 2333 1810 | WWW.COPENHAGENECONOMICS.COM
Taxation of cross-border dividend payments within the EU
3
Preface 8
Executive summary....................................................................................................... 9
0.1 Dividend flows and their taxation .......................................................................... 9
0.2 Distortions to investment and the Internal Market .............................................. 11
0.3 Key impacts on Member States' budgets and possible welfare gains...................... 16
Chapter 1 Current cross-border equity investments and taxation of dividends ...... 18
1.1. Structuring of cross-border portfolio equity investments ...................................... 20
1.2. Current cross-border investments between member states .................................... 23
1.3. Current cross-border dividend flows between Member States .............................. 28
1.4. The current taxation of cross-border dividends .................................................... 31
Chapter 2 Option 1: Revenue effects from the current taxation of cross-
border dividends ........................................................................................................ 36
2.1. A preliminary assessment of the current tax regime .............................................. 36
2.2. Impacts on EU Member States of the current tax regime ..................................... 38
2.3. Impacts on investors of the current tax regime ..................................................... 44
2.4. Impacts on the Internal Market of the current tax regime .................................... 51
Chapter 3 The economic impacts of the proposed options ..................................... 56
3.1. Option 2: Abolition of WHT on cross-border dividends ..................................... 56
3.2. Option 3: Full credit for WHT levied on cross-border dividends ......................... 61
3.3. Option 4: Net rather than gross taxation in the source country ............................ 66
3.4. Option 5: General EU-wide reduced WHT rate with information exchange........ 68
3.5. Option 6: Limited taxation of dividend income and credit for corporate tax ........ 73
3.6. Option 7: No WHT and no income tax on cross-border dividends ..................... 78
3.7. Summing up the economic impacts of proposed options ..................................... 82
Chapter 4 The legal impacts of the proposed options ............................................ 87
4.1. Option 1: Maintaining the existing situation ....................................................... 87
4.2. Option 2: Abolition of WHT levied on cross-border dividends ........................... 94
4.3. Option 3: Full credit for WHT on cross-border dividends ................................... 95
4.4. Option 4: Net rather than gross taxation in the source country ............................ 96
4.5. Option 5: General EU-wide reduced WHT rate with information exchange........ 97
4.6. Option 6: Limited taxation of dividend income and credit for corporate tax ........ 99
4.7. Option 7: No WHT and no income tax on cross-border dividends ................... 100
4.8. Summing up the legal impacts of the proposed options ..................................... 101
Chapter 5 Cross-cutting issues related to the proposed options ........................... 102
5.1. Impacts of the proposed options on different investors ...................................... 102
5.2. Macroeconomic impacts of the reduced cost of capital ....................................... 103
5.3. Impacts on third countries ................................................................................. 107
TABLE OF CONTENTS

Taxation of cross-border dividend payments within the EU
4
5.4. Impacts on the Internal Market ......................................................................... 107
5.5. Interaction with the Parent Subsidiary Directive ................................................ 108
5.6. Sensitivity analysis ............................................................................................. 109

Taxation of cross-border dividend payments within the EU
5
Table 0.1 Impacts of the various options on compliance and administrative costs .............. 14
Table 0.2 Impacts of the various options on distortions to investment decision .................. 15
Table 0.3 Quantifiable costs to investors in the different options ...................................... 17
Table 1.1 Outbound portfolio equity investments ............................................................. 24
Table 1.2 Inbound portfolio equity investments ................................................................ 25
Table 1.3 Outbound portfolio equity investments as a share of total outbound equity
investments ....................................................................................................................... 26
Table 1.4 Inbound portfolio investments as a share of total inbound equity investments .... 27
Table 2.1 What is at stake for individual EU Member States? ............................................ 38
Table 2.2 Current tax revenues from WHT in EU Member States (Option 1) .................. 39
Table 2.3 Tax revenues from WHT compared with corporate income taxes ...................... 40
Table 2.4 Administration of the refund procedure in selected source countries .................. 44
Table 2.5 Current tax burden of investors in EU Member States (Option 1) ..................... 45
Table 2.6 Current tax burden of different investor types (Option 1) .................................. 46
Table 2.7 Summary of findings from two meta analysis ..................................................... 54
Table 3.1 Impact of Option 2 on tax revenues (compared to the current situation) ............ 58
Table 3.2 Tax burden of investors under Option 2 (compared to the current situation) ..... 59
Table 3.3 Tax burden by investor type under Option 2 (compared to current situation) .... 60
Table 3.4 Impact of Option 3 on tax revenues (compared to the current situation) ............ 63
Table 3.5 Tax burden of investors under Option 3 (compared to the current situation) ..... 64
Table 3.6 Tax burden by investor type, Option 3 (compared to the current situation) ....... 65
Table 3.7 Taxes faced by investors in source and residence countries.................................. 67
Table 3.8 Impact of Option 5 on tax revenues (compared to the current situation) ............ 70
Table 3.9 Tax burden of investors under Option 5 (compared to the current situation) ..... 71
Table 3.10 Tax burden by investor type, Option 5 (compared to the current situation) ..... 72
Table 3.11 Impact of Option 6 on tax revenues (compared to the current situation) .......... 75
Table 3.12 Tax burden of investors under Option 6 (compared to the current situation) ... 76
Table 3.13 Tax burden by investor type, Option 6 (compared to the current situation) ..... 77
Table 3.14 Impact of Option 7 on tax revenues (compared to the current situation) .......... 79
Table 3.15 Tax burden of investors under Option 7 (compared to the current situation) ... 80
Table 3.16 Tax burden by investor type, Option 7 (compared to the current situation) ..... 81
Table 3.17 Quantifying juridical double taxation............................................................... 83
Table 3.18 Foregone tax relief ........................................................................................... 83
Table 3.19 Impacts on compliance costs for investors and administration cost for Member
States ................................................................................................................................. 85
Table 3.20 Quantifiable impacts on compliance cost ........................................................ 86
Table 4.1 Domestic WHT rates on dividends paid to residents and non-residents ............. 88
Table 4.2 Gross or net basis taxation ................................................................................. 89
Table 4.3 Withholding taxation vs. taxation by assessment ................................................ 90
Table 4.4 Relief at source or refund ................................................................................... 91
Table 4.5 Domestic taxation of dividends from resident and non-resident companies and
CIVs.................................................................................................................................. 92
Table 4.6 Method for relieving international juridical double taxation ............................... 93
LIST OF TABLES

Taxation of cross-border dividend payments within the EU
6
Table 4.7 Legal impacts of Option 2 ................................................................................. 95
Table 4.8 Legal impacts of Option 3 ................................................................................. 96
Table 4.9 Legal impacts of Option 4 ................................................................................. 97
Table 4.10 Legal impacts of Option 5 ............................................................................... 99
Table 4.11 Legal impacts of Option 6 ............................................................................. 100
Table 4.12 Legal impacts of Option 7 ............................................................................. 101
Table 4.13 Legal impacts of Options 2-7 ......................................................................... 101
Table 5.1 Change in tax burden of investors (compared to the current situation) ............. 103
Table 5.2 Impact on GDP from a reduction in cost of capital .......................................... 105
Table 5.3 Expected positive impact on the Internal Market of the proposed options ........ 108
Table 5.4 Sensitivity analysis on CIV’s treaty entitlements ............................................... 110

Taxation of cross-border dividend payments within the EU
7
Figure 0.1 EU taxation of portfolio and individuals' cross-border dividends ....................... 10
Figure 1.1 Individual investing in equity............................................................................ 21
Figure 1.2 Individuals investing in equity via domestic financial companies ....................... 22
Figure 1.3 Individuals investing in equity via foreign financial companies .......................... 23
Figure 1.4 Composition of intra-EU portfolio equity investments ..................................... 28
Figure 1.5 Total inbound portfolio dividends in Member States as a share of GDP ........... 29
Figure 1.6 Total outbound portfolio dividends in Member States as a share of GDP ......... 29
Figure 1.7 The potential distortions and other problems appear to be getting worse .......... 32
Figure 3.1 Change in tax revenue (compared to the current situation) ............................... 84
Figure 5.1 Distribution of current tax liabilities from cross border dividend flows on investor
type ................................................................................................................................. 102
Figure 5.2 Macroeconomic impacts of the reduced cost of capital .................................... 106
Figure 5.3 The organisational structure of EU firms ........................................................ 109
LIST OF FIGURES

Taxation of cross-border dividend payments within the EU
8
The European Commission has asked Copenhagen Economics to undertake a:
Study on the impact of several alternative solutions to the taxation problems that arise when
dividends are paid across borders to individual and portfolio investors within the EU.
The study relies on readily available information on legislation on domestic taxation of divi-
dends as well as withholding tax (WHT) rates in respect to dividends received by individuals
and companies. Information concerning the domestic taxation and WHT on dividends re-
ceived by collective investment vehicles (CIVs) is obtained by a survey of nine EU countries
carried out by Deloitte offices in the countries concerned.
The scope of the study has been narrowed in several ways:
� We exclude venture capital as returns from such investments are mostly in the form
of capital gains.
� We exclude equity investments in shares that are not listed since dividend taxation
in some resident States depends on whether the shares are listed or not.
� Issues related to dividend payments to portfolio investors/ individuals who are resi-
dent in non-EU Member States are out of scope of the study.
� The impact of all options on the revenue and cost factors for the Clearing and Set-
tlement Industry does not have to be looked into or reported on.
Finally, the following issues are outside the scope of the study because they are the subject of
separate Commission work:
� The tax issues related to Real Estate Investment Trusts (REITS) and open-ended
property investment funds.
� The tax issues related to UCITS IV recast1.
� The tax treatment of cross-border venture capital funds which was the subject of
discussions in a Commission expert group and on which a report2 was published in
2010.
� The functioning of the EU Savings Directive covering bond funds, which is being
dealt with in the discussions on the Commission's proposal to amend the Di-
rective.
� Interest and royalty payments.
1 Directive 2009/65/EC of the European Parliament and of the Council of 13 July 2009 on the coordination of laws, regulations and administrative provisions relating to undertakings for collective investment in transferable se-curities (UCITS) (recast). 2 http://ec.europa.eu/taxation_customs/resources/documents/taxation/company_tax/initiatives_small_business/venture_capital/tax_obstacles_venture_capital_en.pdf.
PREFACE

Taxation of cross-border dividend payments within the EU
9
The basic premise for the discussion is that the present overall structure of taxation of cross-
border portfolio and individuals' equity investments creates distortions to investments in two
ways. First, it may lead to a higher overall taxation of dividends from non-domestic than
domestic equity investment and hence require a higher compensating pre-tax return. This
reduces the incentive to invest in other EU Member States and conflicts with the objective
of a common Internal Market for capital. Second, procedures to relieve such “over-taxation”
(e.g. the necessity to claim refund where relief at source is not available) may entail compli-
ance burdens that likewise reduce the incentive to undertake cross-border investments.
The European Commission has, on the basis of stakeholders’ suggestions, identified several
possible options on how to improve the current taxation of cross-border dividends. The eco-
nomic and legal impacts of the six options (in addition to the option to do nothing) have
been assessed in this report. The executive summary outlines the main results from the study
under three headlines:
� Dividend flows and their taxation
� Distortions to investment and the Internal Market
� Key impacts on Member States’ budgets and possible welfare gains
0.1 DIVIDEND FLOWS AND THEIR TAXATION In this section we recap the essential characteristics of the present tax regime in all its com-
plexity. The report only reviews portfolio investments (i.e. where the investor is a company
or individual which owns less than 10 per cent of the shares) as well as direct investments by
individuals. Investments by companies with shareholdings of more than 10 per cent are cov-
ered by the Parent-Subsidiary Directive and are outside the scope of this study.
In the simplest case, an individual in residence country A undertakes a portfolio equity in-
vestment in a company in source country B (see Figure 0.1) in the hope of receiving a return
on his investment for example in the form of dividends. Such a dividend stems from profits
which have initially been taxed at the company level. When it is paid to the individual as
dividends it will be subject to a withholding tax (WHT) in the source country generally
ranging between 5 to 30 per cent (some countries also levy no WHT). Tax treaties between
Member States normally reduce the WHT to 5-15 per cent. However, to benefit from the
reduced rate the investor will need to apply for a relief at source or a relief by refund of ex-
cess WHT, i.e. the difference between the non-treaty and the treaty rate. Then the investor
is also taxed in the country of residence. Recognising that the dividend has already been
taxed at source, the residence country usually relieves international juridical double taxation.
EXECUTIVE SUMMARY

Taxation of cross-border dividend payments within the EU
10
Figure 0.1 EU taxation of portfolio and individuals' cross-border dividends
Source: Copenhagen Economics.
However, most cross-border portfolio investments are carried out by institutional investors
(pension, mutual and insurance funds and companies etc.) that manage investments on be-
half of the ultimate investors. This also implies that the flow from such institutional inves-
tors to the ultimate investors may take many forms e.g. an annuity at retirement, an ongoing
dividend payment or a capital gain when selling out shares/units in a mutual fund.
In the most straightforward version, the ultimate investor invests in a foreign company
through an institutional investor resident in the same country as the ultimate investor. In
this case, taxation in the source country depends on how this country treats the institutional
investor in question. In some cases, institutional investors are not treated like separate enti-
ties for tax purposes (tax transparent), implying that source taxation depends on the charac-
teristics of the ultimate investors. In other situations, institutional investors are recognized as
separate entities for tax purposes and are taxed as other portfolio investors, including the
possibility of relief at source or relief by refund. In addition to this, taxation of the institu-
tional investor takes place in the residence country.
In the residence country, and at the level of the institutional investor, dividend income can
be tax exempt, subject to tax at relatively low tax rates or subject to a low effective taxation
because provisions made for obligations towards the ultimate investors are deductible. Con-
sequently, a foreign tax credit for the amount of WHT suffered in the source country may
not be obtained in the residence country. In this case, the WHT tax becomes a final tax un-
less the ultimate investors are entitled to claim a foreign tax credit for the WHT suffered by
the institutional investor. The most dominant result is that a foreign tax credit is not ob-
tained for full WHT amount paid by institutional investors.
Foreign/domestic financial company Foreign companyIndividual
Cross-border/domestic dividend payment
Portfolio equity investment Portfolio equity investment
Cross-borderdividend payment
Residencecountry� Tax on dividend income�Tax relief for WHT paidin source country
Intermediate country Source country� WHT on dividends� Refund of excessWHT (if applied WHT rate is higher than treaty rate)Direct equity investment
Cross-border dividend payment

Taxation of cross-border dividend payments within the EU
11
0.2 DISTORTIONS TO INVESTMENT AND THE INTERNAL MARKET Our assessment is that the current tax regime in many cases leads to compliance costs for in-
vestors, administrative cost for Members States, and distortions to investments linked to the
following outcomes:
� Compliance costs for investors:
o Liquidity costs that arise where relief is granted by refund (due to the long
time period investors have to wait to get a refund)
o Difficulties encountered when applying for relief by refund (i.e. docu-
mentation requirements and need to deal with foreign tax administra-
tions)
o Documentation requirements when applying for relief at source
o Foregone WHT relief in the State of Source when tax relief procedures
are too costly, burdensome and time-consuming
� Administrative costs for Member States:
o Administrating a relief at source system in the source country
o Administrating relief by refund claims (i.e. costs for handling refund
claims made by investors) in the source country
o Administrating tax credits to residents for foreign WHT
� Direct distortions to investment decisions:
o Created by economic double taxation, i.e. if the same profits are taxed in
the hands of two different taxpayers (e.g. at the company level and share-
holder level).
- distortions of investors’ incentive to carry out portfolio investments by
choosing debt rather than equity financing,
- related incentive to distribute profits in forms other than dividends
- distortion to the decision whether the profits shall be retained or dis-
tributed.
o Created by juridical double taxation, i.e. if the excessive withholding tax is
not fully credited in the residence country for the WHT paid abroad.
- distortions to incentives to invest abroad.
- distortions to the choice of investment location due to different degrees
of taxation and tax credit schemes
- distortions to the choice of the legal form and legal arrangements used
This is particularly important for CIV’s that are often unable to credit
withholding taxes in their residence country due to lack of taxable in-
come.
To deal with these potential distortions, the European Commission has on the basis of
stakeholders' suggestions identified several alternative solutions that might improve the cur-
rent situation:

Taxation of cross-border dividend payments within the EU
12
� Option 1: Keeping the existing situation unchanged
� Option 2: Abolition of withholding taxes on cross-border dividend payments to
portfolio/individual investors
� Option 3: The residence country grants full credit for the withholding taxes levied
in the source country
� Option 4: Net rather than gross taxation in the source country.
� Option 5: Application of a general EU-wide reduced rate of withholding tax with
information exchange (Neumark solution) if the taxpayer opts for information ex-
change
� Option 6: Limitation of both source and residence taxation of dividend income
and granting of limited underlying tax credit for foreign corporate taxation
� Option 7: No WHT in the source country and no taxation of foreign source divi-
dends in the residence country
In this study, we have reviewed the extent to which these options help address the distortions
created by the current system of taxing cross-border dividends.
Option 2 would eliminate discrimination of outbound and domestic dividends provided
that it would encompass all relevant entities including pension funds and CIVs with EU in-
vestors. Option 2 would eliminate juridical double taxation but would not in itself eliminate
economic double taxation. Option 2 will by definition remove the administrative costs asso-
ciated with refund of excess WHT and will considerably reduce compliance costs for inves-
tors associated with withholding tax relief procedures, although investors will still need to
document that they are entitled to be exempt from WHT. Moreover, the tax systems in
most source Member States will be simplified so that the cost of administrating withholding
tax relief procedures will be reduced. Furthermore the cost of administrating tax credits to
residents for foreign WHT is completely removed.
Option 3 will eliminate juridical double taxation of cross-border dividends when it is im-
plemented so that full credit of the withholding tax is provided independent of the taxes im-
posed in the residence state.3 This will therefore help deal with cases where domestic tax lia-
bilities of individual tax investors, for various reasons, is insufficient to allow full credits for
source taxes paid abroad. Option 3 however, will not remove discrimination of outbound
dividends in the source state and will not in itself eliminate economic double taxation. This
option is not expected to have a major impact on compliance costs for investors or adminis-
trative costs for Member States.
Whether Option 4 would eliminate juridical double taxation of cross-border dividends de-
pends, among other things, on how foreign tax credit is calculated in the residence state, the
level of expenses that may be allocated to the dividend income under the domestic tax laws
3 This would imply that governments in some cases would refund the surplus tax to the investors levy negative tax-es) if there were no sufficient tax liabilities to credit from. This assumption is based on the description in the Terms of Reference to this study

Taxation of cross-border dividend payments within the EU
13
of the source state and residence state and the level of the tax rates of the source state and
residence state. If the residence state calculates foreign tax credit on a gross income basis (Ita-
ly, the Netherlands, France, Ireland and the UK cf. Table 4.6) juridical double taxation
would normally be eliminated provided that sufficient taxes are imposed in the residence
state to accommodate an ordinary credit. If the residence state calculates foreign tax credit
on a net income basis (Germany, Luxembourg, Spain and Sweden), juridical double taxation
would normally be eliminated provided that the level of expenses allocated to the dividend is
almost identical in the source state and residence state and that the tax rate in the source
state does not exceed the tax rate in the residence state. Option 4 would not remove all dis-
crimination of cross-border dividends in the source state and residence state. In addition,
Option 4 would not of itself eliminate economic double taxation and seems to be difficult to
implement in practice.
Option 5 would in most cases reduce existing problems by reducing the level of WHT.
Whether juridical double taxation of cross-border dividends would be eliminated depends,
among other things, on how foreign tax credit is calculated in the residence state, the level of
expenses that may be allocated to the dividend income under the domestic tax laws of the
source state and residence state and the level of tax rates in the source state and residence
state. However, given that the withholding tax rate would be low, it is likely that this will
happen in most cases, besides those where there is no actual taxation at the CIV level. Op-
tion 5 would not remove all discrimination of cross-border dividends in the source state and
residence state. In addition, Option 5 would not of itself eliminate economic double taxa-
tion. By implementing an EU wide information exchange system, this option would provide
tax administrations with adequate safeguards and would justify the application of the re-
duced rate at source rather than by means of refund. It should also reduce the compliance
cost for investors of crediting WHT in the residence country since the residence state would
dispose of the necessary information.
Option 6 and 7 are far more far-reaching. Under Option 6, juridical double taxation of
cross-border dividends would normally be eliminated by requiring the residence state to pro-
vide a full credit relief. As in Option 3 this would imply that governments might refund sur-
plus tax. Option 6 would reduce economic double taxation to a very large degree by requir-
ing the residence state to grant ordinary credit relief for underlying corporate tax in the
source state. The solution will remove compliance costs for the tax payer of applying for re-
fund, but could also imply that the resident tax payer is allowed to credit foreign, but not
domestic, corporate tax rates when calculating the dividend tax burden. If Option 6 was to
be implemented, it should be accompanied by a proposal that credit for underlying corpo-
rate tax should also apply to domestic dividends in order to avoid a new distortion between
domestic and cross-border investments.
Option 7 would remove both juridical and economic double taxation of cross-border divi-
dends. Moreover, discrimination of cross-border dividends would be removed. Unless do-
mestic dividend income tax is also eliminated this option would introduce distortions be-

Taxation of cross-border dividend payments within the EU
14
tween dividends obtained domestically and abroad. As in Option 6, this option should also
be accompanied by an exemption for domestic dividends in order not to create new distor-
tions between domestic and cross-border investments.
The options from an economic perspective
The report touches upon the economic impacts of the current tax regime and the economic
impacts of the proposed options. In particular, the report discusses impacts on compliance
and administrative costs cf. Table 0.1, and impacts on current distortions, cf. Table 0.2. We
find that Option 2 eliminates almost all of the distortions, but it is only Option 6 or 7 that
reduce or eliminates economic double taxation. In addition, we find that Option 4 and 5 are
the only options that do not fully eliminate juridical double taxation.
Table 0.1 Impacts of the various options on compliance and administrative costs Option 2 Option 3 Option 4 Option 5* Option 6** Option 7
Compliance cost for inves-tors reduced
Liquidity costs reduced Full No No Full Full Full
Compliance costs for apply-ing for refund reduced
Full No No Full Partial Full
Compliance costs for relief at source reduced
Partial No No Partial No Partial
Less foregone tax relief Full No No Full Full Full
Compliance costs of docu-menting WHT payments in order to receive credit in res-idence country reduced
Full No No Partial No Full
Administrative costs for Member States reduced
Simplification of tax system in source country
Yes No No Yes No Yes
Simplification of tax system in residence country
Yes No No Partial No Yes
Improved information ex-change
No No No Yes No No
Note: * Under the assumption of full information exchange. ** Assuming that treaty rates are not below 7.5 per cent. In these (rather few) situations there will be compliance costs associated with refunding excess WHT and liquidity costs
Source: Copenhagen Economics, based on the analysis in Chapter 3.

Taxation of cross-border dividend payments within the EU
15
Table 0.2 Impacts of the various options on distortions to investment decision Distortion Option 2 Option 3 Option 4 Option 5* Option 6** Option 7
From economic double taxa-tion
No No No No Partial Full
Debt rather than equity fi-nancing
No No No No Partial Full
Incentive to distribute prof-its in forms other than divi-dends
Full Full No Partial Full Full
Distortion of individual in-vestors’ incentive to carry out portfolio equity invest-ments
Full Full Partial No Full Full
Distortion to the decision whether profits should be retained or distributed
Full Full Partial No Full Full
From juridical double taxa-tion
Full Full Partial Partial Full Full
Distortions to invest abroad Full Full Partial Partial Full Full
Distortions to different in-vestment locations
Full Full Full Full No Full
Distortions to the choice of the legal form and legal ar-rangements used
Full Full Partial No Full Full
CIV’s inability to credit WHT in residence country
Investing in non-zero WHT country
Full Full No No Full Full
Note: N.R means Not Relevant. * Under the assumption of full information exchange. ** Assuming that treaty rates are not below 7.5 per cent. In these (rather few) situations there will be compliance costs associated with refunding excess WHT and liquidity costs
Source: Copenhagen Economics, based on the analysis in Chapter 5.
The options from a legal perspective
We find that parts of the existing tax law in all Member States infringe internal market prin-
ciples from a legal perspective. So doing nothing would seem to be a non-acceptable route to
take. The six proposed possible options to change the taxation have been evaluated on six
criteria applied to dividend flows in 9 countries from a legal and compliance perspective as
outlined in Table 0.2.

Taxation of cross-border dividend payments within the EU
16
Table 0.2 Legal impacts of the options to change dividend taxation in 9 selected Mem-
ber States4.
Problem Option 2 Option 3 Option 4 Option 5 Option 6 Option 7
Simplification of MS’s tax systems
7 0 0 0 0 9
Practical diffi-culties and new administration
0 0 7 7 9 0
Conflict with principle of source-country entitlement to tax
9 0 9 0 0 9
Costs related to the intro-duction of au-tomatic ex-change of in-formation
0 0 0 7* 0 0
Need to amend domestic legis-lation
7 9 7 7 9 9
Need to amend Double Tax Conventions
0 0 0 0 0 0
Note: The table depicts how many countries in the survey (9 countries in total) that could answer “yes” to the ques-tion in column 1. Note that when 7 countries have answered “yes”, the two countries answering “no” is consistently UK and Ireland. * The Mutual Assistance Directive introduces automatic information exchange from 2015 of some income categories, however not dividend income. However, by having such a system in place already, the costs of introducing automatic exchange of information in dividend income will be reduced.
Source: Copenhagen Economics based on Deloitte survey of withholding tax rates in selected EU countries.
It can be noted that all options require all (or most) Member States to amend domestic legis-
lation. Moreover, only Option 2 and 7 (abolishing withholding taxes and abolishing all port-
folio dividend taxes respectively) are the only options simplifying Member States’ tax sys-
tems. Option 4, 5 and 6 may give rise to new administration and practical difficulties.
0.3 KEY IMPACTS ON MEMBER STATES' BUDGETS AND POSSIBLE WELFARE
GAINS Our study suggests that there are several welfare effects of the proposed options. Firstly, the
current situation leads to economic and juridical double taxation of portfolio/ individual in-
vestors. The different options will to varying degrees resolve this double taxation. Secondly,
the cost of investing in portfolio equity is reduced primarily due to a lower tax burden, but
also due to reduced compliance costs.
4 The survey includes Italy, Spain, Luxembourg, Netherlands, Germany, France, Sweden, Ireland and the UK. The-se 9 countries have been selected in order to cover as much of the dividend flows as possible. The group of countries receive 89 percent and 86 percent of ingoing dividends and outgoing dividends respectively.

Taxation of cross-border dividend payments within the EU
17
Our calculations suggest that the amount of juridical double taxation in the current situation
corresponds to €3.7 billion, cf. Table 3.17. This is fully reduced in Option 2, 6 and 7. In
Option 5, the double taxation is reduced to app. €2.0 billion, while in Option 3 juridical
double taxation is almost eliminated but totals to €0.1 billion. Moreover, some simple calcu-
lations suggest that the reduced cost of capital will increase the capital stock and lead to an
increase in EU's total GDP between 0.03-0.05 per cent (app. €3.0 – 6.4 billion) per year.
This is due to the growth effects of increasing the supply of capital.
Moreover, compliance costs for investors will be reduced in some of the options. We have
been able to quantify liquidity cost and compliance cost related to applying for refund re-
spectively, cf. Table 0.3. Since we have only quantified some of the compliance cost reduc-
tions, the total macroeconomic impacts can be expected to exceed these numbers. In addi-
tion, the capital stock may also increase since the reduced taxation of cross-border dividend
payments between EU countries will make such investments more attractive relative to in-
vesting in other locations (domestically or in a non-EU country) or relative to making other
types of investments.
Table 0.3 Quantifiable costs to investors in the different options Impacts Option 1 Option 2 Option 3 Option 5 Option 6 Option 7
Direct impact on investors 30 0 30 6 0 0
Liquidity costs 16 0 16 3 0 0
Compliance costs for applying for refund 14 0 14 3 0 0
Juridical double taxation 3,709 0 122 1,961 0 0
Note: All figures are in million EUR. Liquidity cost is found by considering the total amount excess collected WHT. Compliance cost for applying for refund is found by considering the refundable amount which is 70 per cent of the excess collected WHT.
Source: Copenhagen Economics.
All options will also lead to some direct reductions in tax revenues which vary across the dif-
ferent options from app. €1.7 billion in Option 5 to €8 billion in Option 7. The reduction
in tax revenue corresponds to the same amount as the reduction in investors’ tax burden.
The relevant question is thus whether the proposed options to reform is a good investment
compared to other uses of public revenue. This should also be seen in the perspective that a
vast amount of Member States’ current tax revenue from dividend taxation occurs through
double taxation and foregone tax relief, which investors are entitled to. Hence, by improving
the current situation, investors will receive a larger share of what they would have received
were it not for double taxation and foregone tax relief. We find that in most options – put
very crudely - the welfare gain from reducing the cost of capital outweighs the loss in tax rev-
enue as a per centage of GDP. Moreover, there are also legal reasons to improve the current
situation, since it may be infringing EU law.

Taxation of cross-border dividend payments within the EU
18
When a company is making profits it may choose to pay out dividends as a return to the eq-
uity investments made by its shareholders.
There is an inherent risk of double or multiple taxation of dividends when they are paid
across borders. In such cases there are generally three layers of taxation:
- Corporate income tax on the profits of the dividends distributing company in its
Member State of residence
- Withholding tax on the dividend payment to the non-resident investor in the
source Member State and
- Income tax in the investor's Member State of residence.
Dividend payments between Member States' associated companies are in principle exempt
from withholding tax under the Parent-Subsidiary Directive5 provided that certain share-
holding and other requirements are met. However, as these requirements are not met in the
case of individual shareholders and of companies with a mere portfolio shareholding, divi-
dend payments to such recipients are not covered by the Directive.
Withholding taxes play an important role in dividing taxing rights between a source state of
income and the state of residence of an investor. They also help to enforce taxation, thereby
preventing tax avoidance and evasion by taxpayers. Nevertheless, the fact that cross-border
dividend payments are subject to taxes in two Member States can lead to several problems.
Withholding taxes may give rise to juridical6 or economic7 double taxation, there may be dis-
crimination of non-resident investors and there may, consequently, be distortions of invest-
ment decisions (e.g. with regard to the type or location of the investment, etc) in the Inter-
nal Market.
Double Tax Conventions (DTCs) based on the OECD Model reduce juridical double taxa-
tion on dividends typically by limiting source State taxation on the dividends and by requir-
ing a State of residence of an investor to grant relief for source State taxation through a credit
or exemption mechanism. However, source State withholding taxes, even when reduced un-
der DTCs, may not be completely creditable in the State of residence.
5 Council Directive 90/435/EEC of 23 July 1990 on the common system of taxation application in the case of par-ent companies and subsidiaries of different Member States, amended by Council Directive 2003/123/EC of 22 De-cember 2003 6 "Juridical double taxation" occurs when the same income, such as a dividend, is taxed twice in the hands of the same person: first in the source Member State, when the dividend is distributed (normally by means of withholding tax), and then in the residence Member State, when it is taxed as a part of the same shareholder's taxable income. Juridical double taxation normally occurs in cross-border situations. 7 "Economic double taxation" occurs when the same profits are taxed in the hands of two different persons, such as dividends taxed first at the level of the company paying the dividends and then in the hands of the shareholders. Such taxation can take place both at a domestic level and at an international level.
Chapter 1 CURRENT CROSS-BORDER EQUITY INVESTMENTS AND
TAXATION OF DIVIDENDS
Taxation of cross-border dividend payments within the EU
19
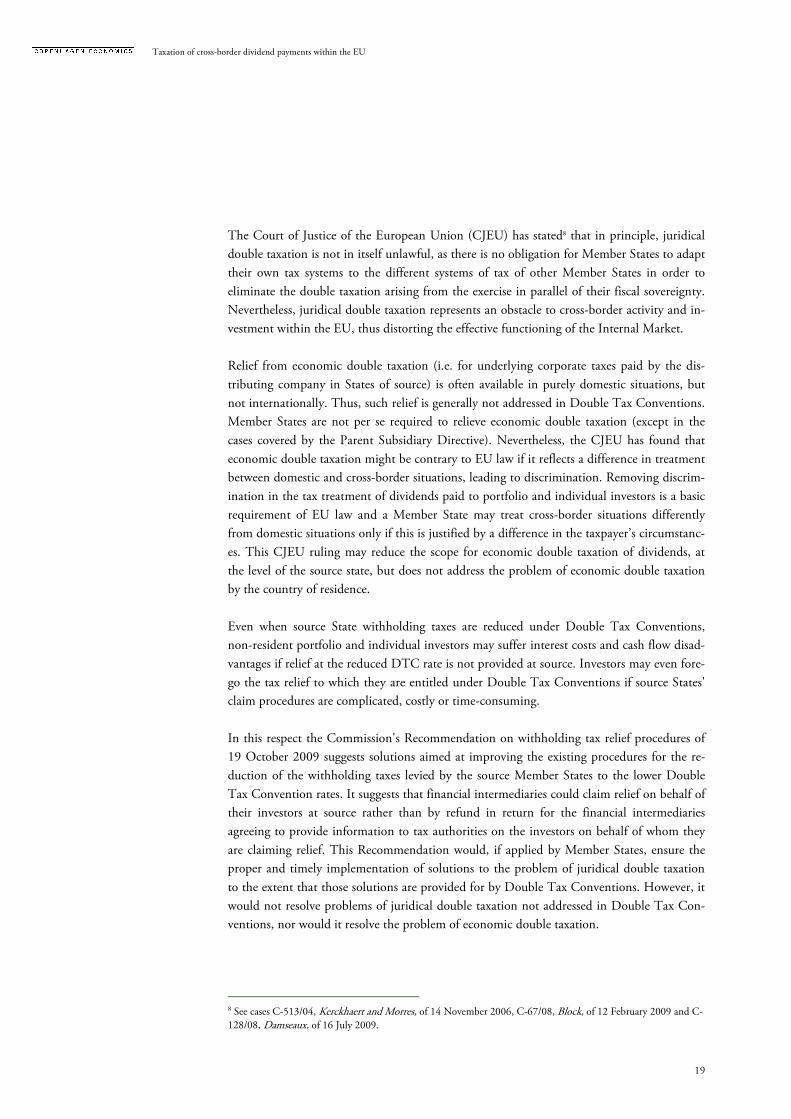
The Court of Justice of the European Union (CJEU) has stated8 that in principle, juridical
double taxation is not in itself unlawful, as there is no obligation for Member States to adapt
their own tax systems to the different systems of tax of other Member States in order to
eliminate the double taxation arising from the exercise in parallel of their fiscal sovereignty.
Nevertheless, juridical double taxation represents an obstacle to cross-border activity and in-
vestment within the EU, thus distorting the effective functioning of the Internal Market.
Relief from economic double taxation (i.e. for underlying corporate taxes paid by the dis-
tributing company in States of source) is often available in purely domestic situations, but
not internationally. Thus, such relief is generally not addressed in Double Tax Conventions.
Member States are not per se required to relieve economic double taxation (except in the
cases covered by the Parent Subsidiary Directive). Nevertheless, the CJEU has found that
economic double taxation might be contrary to EU law if it reflects a difference in treatment
between domestic and cross-border situations, leading to discrimination. Removing discrim-
ination in the tax treatment of dividends paid to portfolio and individual investors is a basic
requirement of EU law and a Member State may treat cross-border situations differently
from domestic situations only if this is justified by a difference in the taxpayer’s circumstanc-
es. This CJEU ruling may reduce the scope for economic double taxation of dividends, at
the level of the source state, but does not address the problem of economic double taxation
by the country of residence.
Even when source State withholding taxes are reduced under Double Tax Conventions,
non-resident portfolio and individual investors may suffer interest costs and cash flow disad-
vantages if relief at the reduced DTC rate is not provided at source. Investors may even fore-
go the tax relief to which they are entitled under Double Tax Conventions if source States'
claim procedures are complicated, costly or time-consuming.
In this respect the Commission's Recommendation on withholding tax relief procedures of
19 October 2009 suggests solutions aimed at improving the existing procedures for the re-
duction of the withholding taxes levied by the source Member States to the lower Double
Tax Convention rates. It suggests that financial intermediaries could claim relief on behalf of
their investors at source rather than by refund in return for the financial intermediaries
agreeing to provide information to tax authorities on the investors on behalf of whom they
are claiming relief. This Recommendation would, if applied by Member States, ensure the
proper and timely implementation of solutions to the problem of juridical double taxation
to the extent that those solutions are provided for by Double Tax Conventions. However, it
would not resolve problems of juridical double taxation not addressed in Double Tax Con-
ventions, nor would it resolve the problem of economic double taxation.
8 See cases C-513/04, Kerckhaert and Morres, of 14 November 2006, C-67/08, Block, of 12 February 2009 and C- 128/08, Damseaux, of 16 July 2009.

Taxation of cross-border dividend payments within the EU
20
Finally, the reality that the majority of portfolio and individual investors hold their invest-
ments indirectly via collective investment vehicles (CIVs) rather than directly in companies,
creates additional layer of issues related to the tax treaty entitlement in the source state and
availability of foreign tax credit in the residence state of the portfolio/individual investor.
All these legal and economic problems arising when cross-border dividends are paid to port-
folio/individual investors result in numerous distortions presented in more detail above.
The purpose of this chapter is to review the current cross-border equity investments and the
taxation of cross-border dividends in the EU. In Section 1.1 we outline how portfolio inves-
tors may structure their equity investments. In Section 1.2 we provide an overview of the
current cross-border portfolio dividend flows between EU Member States to understand the
importance of such payments both for the EU as a whole and for different EU Member
States.
1.1. STRUCTURING OF CROSS-BORDER PORTFOLIO EQUITY INVESTMENTS There are many ways in which an investor in one country can make an equity investment in
another country and each alternative has different tax implications in the source and resi-
dence country. Below we will describe some of the mechanisms that are at play when inves-
tors make equity investment abroad. We will provide more details on the taxation of divi-
dends in Section 1.3.
When an individual buys shares in a foreign company it makes a direct equity investment
(shareholding>10%) or a portfolio equity investment (shareholding<10%). In most cases,
the source country charges a WHT on outbound dividends. Most countries have domestic
WHT rates (called non-treaty rates throughout the report) but these rates may be reduced
through a tax treaty between the source and the residence country (the treaty rate). When
there is relief at source and the investor is able to prove that he is eligible for the reduced rate
under the tax treaty, the WHT is automatically reduced to the treaty rate. When relief at
source is not granted, the investor will pay the non-treaty rate. The excess WHT (the differ-
ence between the non-treaty and the treaty rate) may be refunded if the investor applies for
this in the source country. Portfolio/ individual investors are also generally subject to tax on
the dividend income in the residence country. International juridical double taxation is in
most cases relieved in the residence country by way of a foreign tax credit.
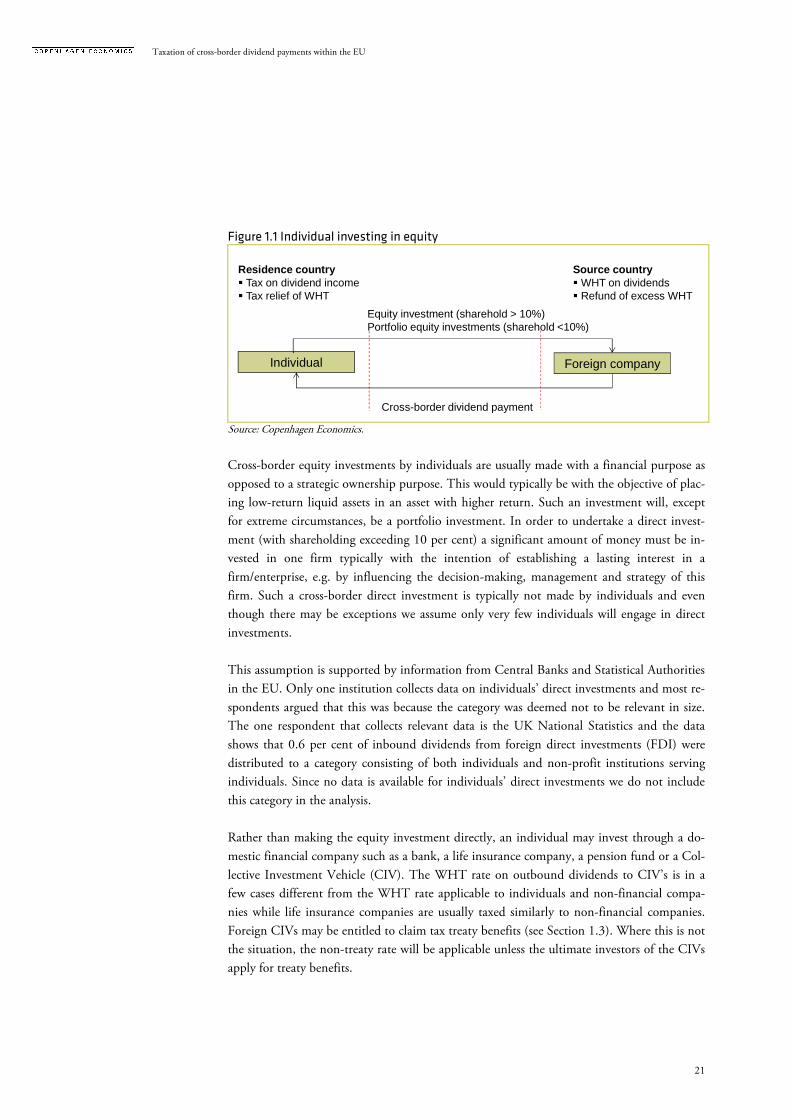
The mechanisms at play in this type of investment are sketched in Figure 1.1. We note that
the same situation arises in cases where a non-financial company makes a portfolio equity
investment although the WHT rate on outbound dividends in the source country and the
tax on dividend income in the residence country are in many cases different for the two in-
vestor types.
Taxation of cross-border dividend payments within the EU
21
Figure 1.1 Individual investing in equity
Source: Copenhagen Economics.
Cross-border equity investments by individuals are usually made with a financial purpose as
opposed to a strategic ownership purpose. This would typically be with the objective of plac-
ing low-return liquid assets in an asset with higher return. Such an investment will, except
for extreme circumstances, be a portfolio investment. In order to undertake a direct invest-
ment (with shareholding exceeding 10 per cent) a significant amount of money must be in-
vested in one firm typically with the intention of establishing a lasting interest in a
firm/enterprise, e.g. by influencing the decision-making, management and strategy of this
firm. Such a cross-border direct investment is typically not made by individuals and even
though there may be exceptions we assume only very few individuals will engage in direct
investments.
This assumption is supported by information from Central Banks and Statistical Authorities
in the EU. Only one institution collects data on individuals’ direct investments and most re-
spondents argued that this was because the category was deemed not to be relevant in size.
The one respondent that collects relevant data is the UK National Statistics and the data
shows that 0.6 per cent of inbound dividends from foreign direct investments (FDI) were
distributed to a category consisting of both individuals and non-profit institutions serving
individuals. Since no data is available for individuals’ direct investments we do not include
this category in the analysis.
Rather than making the equity investment directly, an individual may invest through a do-
mestic financial company such as a bank, a life insurance company, a pension fund or a Col-
lective Investment Vehicle (CIV). The WHT rate on outbound dividends to CIV’s is in a
few cases different from the WHT rate applicable to individuals and non-financial compa-
nies while life insurance companies are usually taxed similarly to non-financial companies.
Foreign CIVs may be entitled to claim tax treaty benefits (see Section 1.3). Where this is not
the situation, the non-treaty rate will be applicable unless the ultimate investors of the CIVs
apply for treaty benefits.
Residence country� Tax on dividend income� Tax relief of WHT
Source country� WHT on dividends� Refund of excess WHT
Individual Foreign company
Equity investment (sharehold > 10%)Portfolio equity investments (sharehold <10%)
Cross-border dividend payment

Taxation of cross-border dividend payments within the EU
22
The residence country taxation of cross-border dividends of a domestic financial company
depends on the type of financial company. CIVs are often tax exempt on dividend income
(or are entitled to a tax deduction for provisions set up for obligations towards the ultimate
investors). However, an individual is typically taxed on its dividend income from a domestic
financial company. Other financial companies (such as life insurance companies and pension
funds) typically accumulate the dividend income with the individual investor being taxed
once the accumulated savings are paid out. The taxation may be either of a capital gain or
capital income character at this stage. If the original investment were tax deductible against
income, then their payout will typically also be taxable as income.
The residence country usually offers a foreign tax credit for WHT paid by a domestic finan-
cial company on inbound dividends. The mechanisms at play in this type of investment are
sketched in Figure 1.2.
Figure 1.2 Individuals investing in equity via domestic financial companies
Note: In official statistics an individual investment in a financial company will be classified as an equity invest-
ment even though the individual purchases an investment certificate and not equity per se. Moreover, “investments“ from individuals in pension funds and insurance companies are not considered
investments as such but pension contributions and insurance premiums. Consequently, returns from such vehicles are not dividends but other types of capital income such as pension and/or insurance disburse-ment.
Source: Copenhagen Economics.
The individual investor may also invest through a foreign financial company. When the for-
eign financial company makes an equity investment in a third country, there will be two
cross-border dividends: (i) the foreign company in the third country pays out dividends to
the financial company, and (ii) the financial company pays out dividends to the individual.
From a tax perspective, the consequence of such an intermediate country depends on wheth-
er the foreign financial company is eligible or non-eligible for tax treaty benefits. Here, it is
important to note that the tax status may be different in the three countries involved (cf.
Section 1.3).
When the financial company is non-eligible for tax treaty benefits in the source country, in-
formation on the ultimate investor (the individual) is often unknown to the source country
and the WHT rate charged will be the non-treaty rate which is often higher than the treaty
rate. When the financial company is eligible for tax treaty benefits in the source country, the
Domestic financial company Foreign companyIndividual
Dividend payment
Portfolio equity investment Portfolio equity investment
Cross-border dividend payment
Residencecountry� Tax on dividend income� Tax relief of WHT
Source country� WHT on dividends� Refund of excessWHT
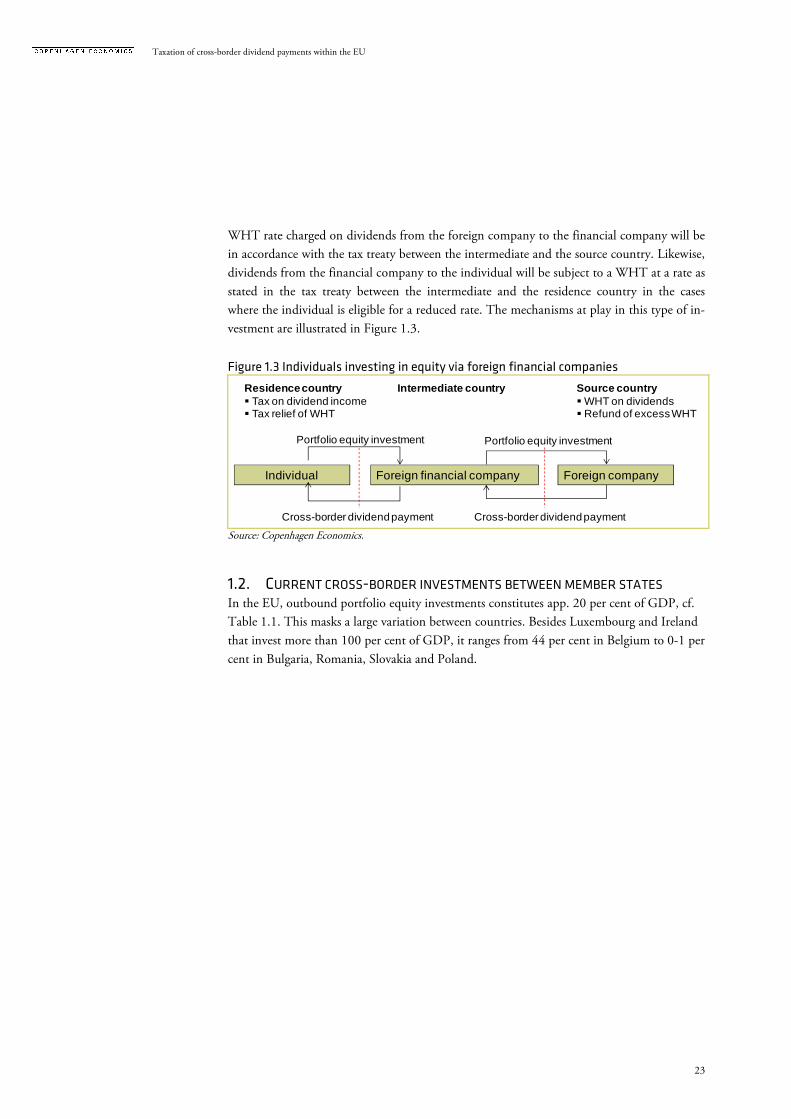
Taxation of cross-border dividend payments within the EU
23
WHT rate charged on dividends from the foreign company to the financial company will be
in accordance with the tax treaty between the intermediate and the source country. Likewise,
dividends from the financial company to the individual will be subject to a WHT at a rate as
stated in the tax treaty between the intermediate and the residence country in the cases
where the individual is eligible for a reduced rate. The mechanisms at play in this type of in-
vestment are illustrated in Figure 1.3.
Figure 1.3 Individuals investing in equity via foreign financial companies
Source: Copenhagen Economics.
1.2. CURRENT CROSS-BORDER INVESTMENTS BETWEEN MEMBER STATES In the EU, outbound portfolio equity investments constitutes app. 20 per cent of GDP, cf.
Table 1.1. This masks a large variation between countries. Besides Luxembourg and Ireland
that invest more than 100 per cent of GDP, it ranges from 44 per cent in Belgium to 0-1 per
cent in Bulgaria, Romania, Slovakia and Poland.
Foreign financial company Foreign companyIndividual
Cross-border dividend payment
Portfolio equity investment Portfolio equity investment
Cross-borderdividend payment
Residencecountry� Tax on dividend income� Tax relief of WHT
Intermediate country Source country� WHT on dividends� Refund of excessWHT

Taxation of cross-border dividend payments within the EU
24
Table 1.1 Outbound portfolio equity investments
Country Total outgoing portfolio invest-
ments (EUR) Outgoing portfolio investments
as a share of GDP
Luxembourg 329.110 791%
Ireland 198.211 129%
Belgium 156.655 44%
Netherlands 177.618 30%
Sweden 103.825 30%
Finland 44.745 25%
Germany 425.209 17%
Italy 252.467 16%
Denmark 36.902 16%
France 285.815 15%
United Kingdom 237.686 14%
Austria 38.821 14%
Portugal 19.618 11%
Malta 632 10%
Estonia 888 6%
Spain 64.000 6%
Cyprus 1.034 6%
Hungary 5.346 5%
Greece 11.707 5%
Czech Republic 6.298 4%
Slovenia 1.291 4%
Lithuania 822 3%
Latvia 388 2%
Poland 3.613 1%
Bulgaria 271 1%
Slovak Republic 409 1%
Romania 394 0%
EU 27 2.403.775 20%
Note: Data from 2009. Source: Copenhagen Economics based on data from Coordinated Portfolio Investment Survey Database (CPIS)-
IMF (extract April 2012). GDP data is from Eurostat.
Inbound portfolio equity investments in EU similarly constitute 20 per cent of GDP (per
definition). Luxembourg’s inbound investments as share of GDP is a massive 2,000 per cent
while Ireland’s is 104 per cent, cf. Table 1.2. In addition to these two countries, Portugal has
a share of 26 per cent of GDP while Lithuania, Latvia, Romania, Slovenia, and Slovakia has
app. 1 per cent inbound portfolio investments as share of GDP.

Taxation of cross-border dividend payments within the EU
25
Table 1.2 Inbound portfolio equity investments
Country Total ingoing portfolio invest-
ments (EUR) Ingoing portfolio investments as
a share of GDP
Luxembourg 864.095 2077%
Ireland 160.625 104%
Portugal 44.979 26%
Finland 41.769 23%
Netherlands 110.004 19%
Cyprus 3.076 18%
United Kingdom 286.117 17%
France 273.123 14%
Belgium 44.275 13%
Sweden 43.451 13%
Germany 267.445 11%
Spain 103.221 10%
Malta 544 9%
Austria 19.439 7%
Denmark 14.888 6%
Italy 98.270 6%
Hungary 4.366 4%
Greece 9.035 4%
Poland 9.446 3%
Estonia 326 2%
Czech Republic 2.811 2%
Bulgaria 553 2%
Lithuania 355 1%
Latvia 152 1%
Romania 886 1%
Slovenia 192 1%
Slovak Republic 330 1%
EU 27 2.403.775 20%
Note: Data from 2009. Inbound portfolio investments corresponds to outbound investments from other EU Member States.
Source: Copenhagen Economics based on data from Coordinated Portfolio Investment Survey Database (CPIS)- IMF (extract April 2012). GDP data is from Eurostat.
The amount of outbound portfolio equity investments as a share of total outbound equity
investments (direct and portfolio investments) differ across countries, and varies from 16 per
cent in Slovakia to 82 per cent in Luxembourg, cf, Table 1.3. This picture naturally covers
large variety in the total size of investments. For the EU countries, the share of portfolio in-
vestments to direct investments is app. 34 per cent.

Taxation of cross-border dividend payments within the EU
26
Table 1.3 Outbound portfolio equity investments as a share of total outbound equity
investments
Country Outbound portfolio investments as a share of total
outbound investments
Luxembourg 82%
Ireland 68%
Romania 63%
Slovenia 62%
Malta 59%
Latvia 59%
Hungary 51%
Italy 50%
Lithuania 45%
CzechRepublic 41%
Germany 40%
Finland 40%
Denmark 40%
Greece 39%
France 39%
Sweden 39%
Austria 35%
Bulgaria 34%
United Kingdom 30%
Poland 28%
Estonia 24%
Spain 20%
Cyprus 20%
Slovakia 16%
Belgium N.A
Netherlands N.A
Portugal N.A
EU 27 47%
Note: Total equity investments equals: Foreign direct equity investments and portfolio equity investments abroad. Data is available in Table 4.5 in the Appendix. Data on direct investments were not available for the Netherlands, Belgium and Portugal. The data for FDI does not cover investments made by Special Purpose Entities which is only collected for an EU aggregate. Data is for 2009.
Source: IMF – Coordinated Portfolio Investment Survey Database (CPIS) for portfolio data (extract April 2012). Eurostat is used for data on direct equity investments.
Taxation of cross-border dividend payments within the EU
27
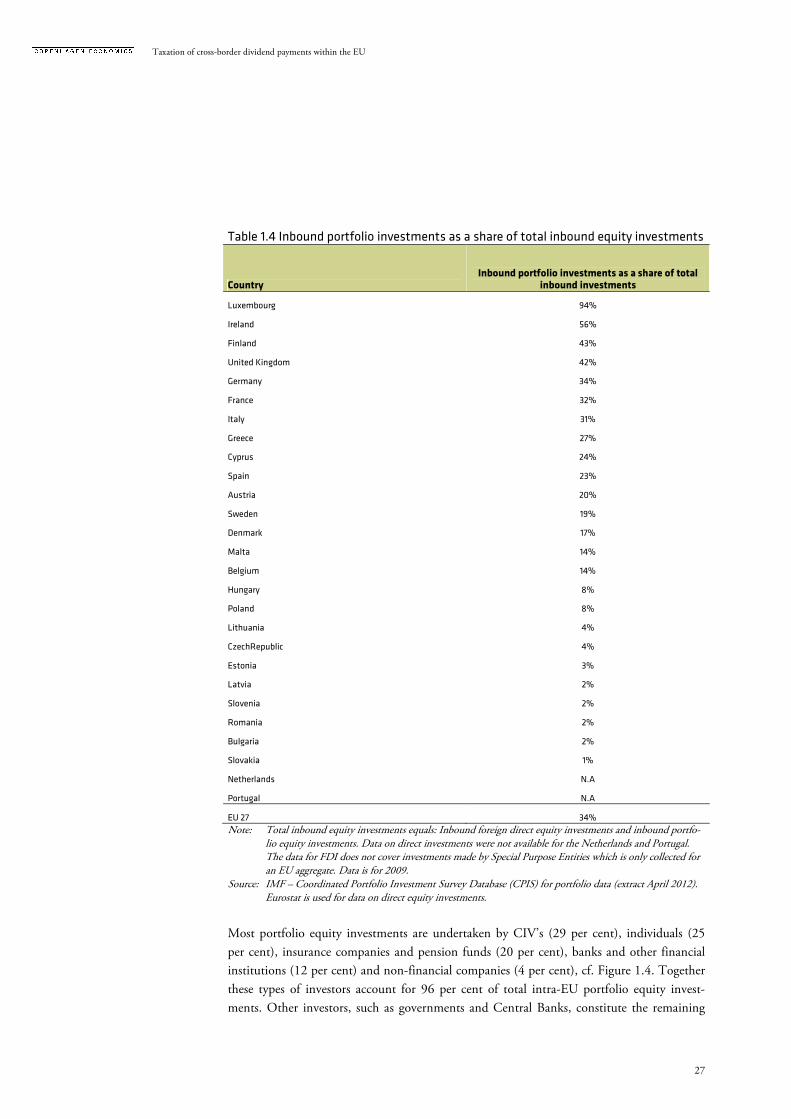
Table 1.4 Inbound portfolio investments as a share of total inbound equity investments
Country Inbound portfolio investments as a share of total
inbound investments
Luxembourg 94%
Ireland 56%
Finland 43%
United Kingdom 42%
Germany 34%
France 32%
Italy 31%
Greece 27%
Cyprus 24%
Spain 23%
Austria 20%
Sweden 19%
Denmark 17%
Malta 14%
Belgium 14%
Hungary 8%
Poland 8%
Lithuania 4%
CzechRepublic 4%
Estonia 3%
Latvia 2%
Slovenia 2%
Romania 2%
Bulgaria 2%
Slovakia 1%
Netherlands N.A
Portugal N.A
EU 27 34%
Note: Total inbound equity investments equals: Inbound foreign direct equity investments and inbound portfo-lio equity investments. Data on direct investments were not available for the Netherlands and Portugal. The data for FDI does not cover investments made by Special Purpose Entities which is only collected for an EU aggregate. Data is for 2009.
Source: IMF – Coordinated Portfolio Investment Survey Database (CPIS) for portfolio data (extract April 2012). Eurostat is used for data on direct equity investments.
Most portfolio equity investments are undertaken by CIV’s (29 per cent), individuals (25
per cent), insurance companies and pension funds (20 per cent), banks and other financial
institutions (12 per cent) and non-financial companies (4 per cent), cf. Figure 1.4. Together
these types of investors account for 96 per cent of total intra-EU portfolio equity invest-
ments. Other investors, such as governments and Central Banks, constitute the remaining

Taxation of cross-border dividend payments within the EU
28
four per cent. These investors are not included in the analysis since they are typically not
subject to taxation. Since they constitute a relatively small amount of total dividend flows
their exclusion will not have much impact on the results. It has not been possible to obtain
information on the number of investors engaging in portfolio equity investments.
Figure 1.4 Composition of intra-EU portfolio equity investments
Note: We label the investor group called mutual funds as CIV’s in the following. The data used is for the 17
countries shown in Figure 1.5. The large share of individual investors is driven mainly by Germany for which individual investors' share is on average 50%.
Source: IMF – Coordinated Portfolio Investment Survey Database (CPIS), extracted March 2012.
1.3. CURRENT CROSS-BORDER DIVIDEND FLOWS BETWEEN MEMBER STATES Total inbound portfolio dividend payments are very unevenly distributed across EU Mem-
ber States. Luxembourg is the main recipient of cross-border portfolio dividend payments
(when calculated as a share of GDP) followed by Ireland and Belgium, cf. Figure 1.5.
Individuals23%
Non-financial companies
4%
Insurance companies and pension funds
19%
CIV's31%
Banks and other financial
institutions19%
Other investors including
governments and central banks
4%

Taxation of cross-border dividend payments within the EU
29
Figure 1.5 Total inbound portfolio dividends in Member States as a share of GDP
Note: Data calculated as an average from 2004-2009. Dividend data is incomplete for Malta. For Belgium, Bul-
garia, Cyprus, Denmark, Finland, Germany, Latvia, Slovenia and UK data has been provided by Central Banks. For Portugal we have estimated the data based on investment data.
Source: Copenhagen Economics calculations based on Eurostat data supplemented with data from Central Banks. See Annex Table 4.9 for amounts in Euro.
Figure 1.6 Total outbound portfolio dividends in Member States as a share of GDP
Note: Data calculated as an average from 2004-2009. Dividend data is incomplete for Bulgaria and Malta. For Luxembourg, Portugal, Germany, UK and France dividends are combined from data provided from Cen-tral Bank data and through the CE estimation method.
Source: Copenhagen Economics calculations based on Eurostat data supplemented with data from Central Banks. See Annex Table 4.10 for amounts in Euro
0,0%
0,5%
1,0%
1,5%
2,0%
2,5%
3,0%
3,5%
4,0%
4,5%
5,0%
pct. of GDP
18 %
26 %
0,5%
0,0%
1,0%
2,0%
3,0%
4,0%
5,0%
6,0%
7,0%
8,0%

Taxation of cross-border dividend payments within the EU
30
Bilateral dividend data is not available from official sources and has been collected/estimated
for the purposes of this report, cf. Box 1.1.
Box 1.1 Short description of how we obtain bilateral dividend data per investor type We are interested in obtaining data on dividends paid out as a return on portfolio equity investments be-tween all pairs of EU Member States and for each type of investor. How we obtain bilateral dividend data Portfolio dividend data is available for most EU countries on an aggregate level. Data on bilateral dividend payments between EU Member States is not available from official sources. To obtain this data we have followed a two step procedure:
1) We have enquired Central Banks (CBs) and Statistical Authorities (Stats) of the EU Members States for the availability of the relevant data. Through such direct enquiries we have received data for 16 countries9 (some available under confidentiality restrictions).
2) For the remaining countries we have estimated the data by using data on bilateral portfolio in-vestment relationships (see description underneath). This data was available for 10 additional countries.10
Our method to estimate data on bilateral dividends is illustrated in the following example with three coun-tries:
We have data on total dividend flows going into France (from Eurostat) which amount to approxi-mately €5.073 million.11 We assume that there are no systematic deviations in the returns obtained by French portfolio investments in other EU countries. We therefore assume that the share of France’s total dividends that comes from Belgium, for example, will be equal to the share of total French port-folio investments invested in Belgium. Data from the IMF CPIS database show that 5 per cent of total French portfolio investments are invested in Belgium and our estimate of dividend payments from Belgium to France will therefore be €332 million (5% of €5.073 million). By using the split of French portfolio investments across countries we can map out total inbound dividends from these countries. This method is repeated for the countries where we lack bilateral dividend data from Central Banks and Statistical Authorities.
By these two steps we are able to obtain data for 26 countries. For the one remaining country (Malta) no data is available from the CBs or from the CPIS database. The only data available stems from Central Banks or Statistical Authorities in other countries who have reported data on outbound dividends to Malta. In-bound dividends to Malta are therefore uncertain and incomplete and cannot be used conclusively. For the countries where we both have data from Central Banks and from our estimation method, it can be seen that the real data and the estimated data are indeed quite similar. See Appendix 2.1-2.3 for more on data requirements and availability. How we split bilateral dividend data per type of investor If all types of investors were taxed at the same rate then we could use data on bilateral dividends between EU countries to assess the economic impacts of the current situation in Chapter 2 and of the proposed op-tions in Chapter 3. However, different types of investors are in most cases taxed differently both in the source country and in the residence countries. In the source country, it is not always the case that all types of investors are entitled to treaty benefits (e.g. CIVs). In the residence countries, CIV’s are rarely taxed on their dividend income whereas other investors are taxed according to their respective income tax rates. We therefore need to attribute total dividends to each investor. In some cases the data on bilateral dividends provided by the Central Banks and Statistical Authorities is already split according to investor type. For the remaining countries we will obtain the split by a method il-lustrated in the following example:
We have data on France’s portfolio investments by each type of investor. We assume that the rate of return to all French portfolio investments in Belgium is the same irrespective of which type of investor
9 Belgium, Bulgaria, Cyprus, Denmark, Estonia, Finland, Germany, Greece, Ireland, Italy, Latvia, Poland, Slovak Republic, Slovenia, Sweden and UK. 10 Austria, Czech Republic, France, Hungary, Luxembourg, Netherlands, Portugal, Romania and Spain. It was not possible to obtain any data for Malta. 11 When taking an average from 2004-2009.

Taxation of cross-border dividend payments within the EU
31
makes the investment. For example, if five per cent of France’s investments in Belgium are made by individuals we assume that five per cent of the €332 millions dividends flowing from Belgium to France flow to individuals (equal to €16.6 millions). These dividends will then be taxed both in the source and in the residence country according to the investor type and nationality.
For Luxembourg and Ireland we applied a different method to assess the investor split since much dividend flow between two Member States pass through these countries’ (especially Luxembourg) CIV’s. The meth-od is based described in Box 2.1 in the Appendix. Using these three methods in combination we are able to obtain data for 26 countries. Results for Malta are not reported as we have not been able to obtain data for bilateral dividend or investment flows.
Source: Copenhagen Economics.
Luxembourg, and to a large extent also Ireland, are in many ways a special case. This is pri-
marily the case since the countries are home for a vast number of financial companies such as
investment funds and other collective investment vehicles. This implies that while income
derived by e.g. mutual funds in most countries is distributed to individuals in the same
country, Luxembourg acts as a transit country for dividend flows. We have been able to de-
rive data on cross border dividend flows to and from Luxembourg, which means that we will
catch both dividends going into Luxembourg based CIVs from other countries, and the div-
idends distributed from Luxembourg CIVs to shareholders in other countries. Due to the
special case of Luxembourg we have made the assumption, that Luxembourg does not earn
dividend tax income from the dividends being distributed from the CIVs. This is contrary to
our general assumption that dividend income earned by CIVs is taxed by the dividend in-
come tax rate for individuals. This assumption is made, since dividend income to CIVs in
general will – eventually – be distributed to individuals.
The fact that Luxembourg is a “transit” country for dividend flows is confirmed by the large
share of outbound dividends related to GDP (amounting to 26 per cent), cf. Figure 1.6. The
EU average outbound dividend flow is 0.5 per cent of GDP.
1.4. THE CURRENT TAXATION OF CROSS-BORDER DIVIDENDS WHT on cross-border portfolio dividends allows the taxing rights to be shared between the
source country and the residence country. WHT help to enforce taxation, thereby prevent-
ing tax avoidance and evasion. Dividend payments between associated companies are cov-
ered by the Parent-Subsidiary Directive and are therefore exempt from WHT. Cross-border
portfolio dividends and dividends received by individual investors regardless of their share-
holdings are not covered by the Directive.
The current system of different national WHT schemes creates distortions in intra-EU in-
vestment behaviour. Even though several bilateral double taxation treaties aim to treat WHT
in a common framework, large variations exist both with respect to the scope of WHT’s and
to the rate of WHT and domestic dividend income tax respectively. As discussed in the fol-
lowing chapter, this gives rise to juridical double taxation. Moreover, the current situation
also gives rise to economic double taxation, since dividend income tax is paid in the resi-
dence country on dividend income which has already been taxed via corporate tax at the

Taxation of cross-border dividend payments within the EU
32
firm level (see also the discussion in the following section). Such double taxation will distort
investments and reduce the overall amount of portfolio equity investments, since the cost of
investing is increased.
There is reason to believe that the distortions and other problems may get worse over time.
Except for the outbreak of the financial crisis in 2008, we find EU Member States tend to
receive an increasing amount of intra-EU cross border dividends from portfolio investments
for a number of countries, cf. Figure 1.7. From 2004 to 2008 dividends from portfolio equi-
ty investments increased from app. €12 billion to almost €45 billion. This suggests that the
current situation of double taxation should be expected to get worse over time.
Figure 1.7 The potential distortions and other problems appear to be getting worse
Note: Data is not available for a number of countries: Denmark, Germany, Spain, Italy, Malta, Portugal and UK. Source: Copenhagen Economics based on Eurostat [data series: bop_q_c] extracted February 2012
The taxation of cross-border portfolio dividends is determined by the taxation of outbound
dividends in the source country on the one hand and the taxation of inbound dividends in
the residence country on the other hand. We will discuss these two options in the following.
Taxation of outbound dividends in the source country
The domestic WHT on dividends in the source country (the non-treaty rate) varies accord-
ing to investor type. The domestic WHT rates on portfolio dividend income12 across coun-
tries and investor types can be found in Appendix 4, Table 4.1. WHT varies from 1.4 per
cent13 to 30 per cent14 in the countries that impose a WHT on outbound dividends. Cyprus,
12 That is, for shareholdings below 10 percent. 13 In Italy for e.g. non-financial investors. 14 In Sweden for e.g. individual investors.
0
5.000
10.000
15.000
20.000
25.000
30.000
35.000
40.000
45.000
50.000
2004 2005 2006 2007 2008 2009 2010
million EUR

Taxation of cross-border dividend payments within the EU
33
Ireland, Malta, Portugal, the Slovak Republic and the United Kingdom neither impose
WHT on outbound dividends to individuals nor corporate investors. Greece, Hungary, Lat-
via and Bulgaria do levy WHT on individual but not on corporate investors with sufficiently
low shareholding to be deemed portfolio investors. The non-treaty WHT rate can be re-
duced according to a tax treaty between the source country and the residence country (the
treaty rate). Treaty rates between EU Member States have large variations. However, in most
cases the treaty rate is significantly lower than the non-treaty rate. The general trend is that
the treaty rate is 15 per cent for portfolio dividends. This corresponds to the tax rate laid
down in Article 10(2)(b) of the OECD Model Income Tax Convention.15
Most countries in our survey grant tax treaty benefits to CIVs, cf. Annex 6, that meet two
requirements: (i) the CIV qualify as a “person” under the tax treaty, and (ii) the CIV quali-
fies as a “resident” under the tax treaty. The situation in most countries is that some foreign
CIVs are recognized under tax treaties whereas other CIVs are not eligible for tax treaty ben-
efits. Among the nine EU Member States covered by the Deloitte survey, France represents
an exception since foreign CIVs are generally not granted tax treaty benefits unless this is
specifically agreed in a tax treaty.
In order to obtain treaty relief two different procedures may be available under domestic law:
(i) the relief at source procedure, and (ii) the relief by refund procedure.
Under relief at source, WHT is imposed at the reduced treaty rate provided that the investor
has documented to be eligible for treaty benefits. This relief procedure is available in 14 out
of the 23 EU Member States that charge WHT on outbound dividends (at least for some
types of investors).16
Under relief by refund, WHT is imposed at the non-treaty rate and the investor is entitled
to apply for a refund for the excess WHT. This procedure is available in all EU countries
that charge WHT on outbound dividends. In 9 countries the relief by refund is the only al-
ternative (there is no relief at source).
The procedures are often complicated, costly, time-consuming and vary considerably among
EU Member States (cf. Appendix 2, Table 2.5). The investor therefore faces compliance
costs. The compliance costs hinder the good functioning of the capital markets and raise the
costs of cross-border transactions. This may reduce the volume of cross-border investments.17
We will get back to this in the next chapter when we discuss the possible distortions and in-
efficiencies caused by WHT on cross-border dividends.
15 http://www.oecd.org/document/37/0,3746,en_2649_33747_1913957_1_1_1_1,00.html. 16 Austria, Bulgaria, Czech Republic, Denmark, Estonia, Finland, France, Greece, Italy, Luxembourg, Netherlands, Poland, Spain and Sweden. 17 The European Commission's general Impact Assessment study on Clearing and Settlement of 2006 concluded that in the EU, an investor pays on average between twice and six times more for a cross-border equity transaction compared to a domestic one. The report can be downloaded from http://ec.europa.eu/internal_market/financial-markets/docs/clearing/draft/draft_en.pdf.

Taxation of cross-border dividend payments within the EU
34
The taxation of inbound dividends in the residence country
The residence country may charge a tax on the dividend income earned abroad. Dividends
are therefore often taxed both in the source and in the residence country. This may cause
both juridical and economic double taxation as described in Box 1.2.
Box 1.2 Definition of juridical and economic double taxation A distinction should be made between juridical and economic double taxation: Juridical double taxation can generally be defined as the imposition of comparable taxes in two (or more) States on the same taxpayer in respect of the same subject matter and for identical periods.18 Juridical dou-ble taxation normally occurs in cross-border situations but may also arise in domestic situations. Economic double taxation can generally be defined as the imposition of taxes on two different persons in respect of the same income.19 For example, income may first be subject to tax at the level of a company and second be subject to tax in the hands of the shareholders upon a dividend distribution. Economic double taxation may occur for both domestic and cross-border dividends.
Source: Copenhagen Economics.
Juridical double taxation is most likely to arise when investments take place between two
countries with a large difference between the withholding tax rate on the one side, and the
residence dividend income tax rate on the other side. In the situation where the withholding
tax rate is higher than the residence dividend income tax rate, double taxation will occur
even if it is alleviated by the residence country granting relief for the foreign WHT in the
domestic tax. Juridical double taxation, including non-refunded excess withholding taxes, in
the current situation is of a considerable margin (€3,709 million), amounting to app. 38 per
cent of total tax revenue from the current withholding tax system.20
Most EU Member States relieve economic double taxation under scheduler systems involv-
ing that dividends received from domestic companies are subject to taxation at reduced rates.
Moreover, EU Member States normally attempt to eliminate juridical double taxation of
dividends received from abroad by granting a tax relief to resident taxpayers. The tax relief is
granted through a foreign tax credit, tax exemption or tax deduction as described in Box 1.3.
18 Para. 1 of the Introduction and Para. 1 of the Commentary on Article 23 of the OECD Model Income Tax Convention (2010). 19 Para. 2 of the Commentary on Article 23 of the OECD Model Income Tax Convention (2010). 20 Based on Copenhagen Economics’ model simulations which will be described further in Chapter 3, Section 3.7

Taxation of cross-border dividend payments within the EU
35
Box 1.3 Exemption, foreign tax credit and deduction methods Relief for juridical double taxation may be granted under one of three methods:
� Exemption method: Income earned in foreign jurisdictions is tax exempt.21 � Foreign tax credit: Income earned in foreign jurisdictions is subject to tax. However, the tax bur-
den is reduced by the amount of foreign taxes paid. Under the method of ordinary credit, the amount of the credit is maximized to the lower of: (i) the actual foreign taxes paid, and (ii) the domestic taxes that fall due on the foreign income.22 Under the method of full credit, the amount of the credit is maximized to the actual foreign taxes paid.
� Deduction: Income earned in foreign jurisdictions is subject to tax. However, the actual foreign taxes paid are deducted in the calculation of the taxable income.
Consider the following illustrative example. A cross-border dividend of €100 is subject to a 5 per cent WHT in the source country and a 30 per cent income tax in the residence country. Under the exemption method, the total tax burden is €5 to be paid in the source country. Under the credit method, the total tax burden is €30 (i.e. €5 in the source country and €25 in the residence country). Under the deduction method, the total tax burden is €33.5 (i.e. €5 in the source country and €28.5 in the residence country). If the residence coun-try income tax was 2 per cent instead of 30 per cent, the foreign tax credit system would entail that the to-tal tax burden was €5 (€5 in the source country and €0 in the residence country since the investor receives a credit up to the €2 residence tax).
Source: Copenhagen Economics.
The most common relief method in EU Member States is the method of ordinary tax credit.
In such cases double taxation may not always be fully relieved. This is the case when the tax
rate in the residence country is lower than the WHT rate in the source country, such that
the full amount of taxes paid abroad will not be credited in the residence country, and also
when there is not enough income in the residence country. The investor therefore ends up
with a higher tax burden than in a domestic situation. Belgium, and in many cases Czech
Republic, is a rare case offering no relief to domestic investors for foreign source WHT,
while a few Member States only provide relief for a fixed share of the withholding taxes paid
abroad. This is the case in e.g. Estonia (21 per cent) and Hungary (90 per cent). A detailed
description of the various countries’ relief systems can be found in Appendix 2, Table 2.4.
The taxation of cross-border dividend payments may cause other distortions than juridical
double taxation and we will come back to this in the next chapter where we assess the impact
of the current situation on the functioning of the Internal Market.
21 Article 23 A of the OECD Model Income Tax Convention. 22 Article 23 B of the OECD Model Income Tax Convention.

Taxation of cross-border dividend payments within the EU
36
In this chapter we quantify how the current cross-border tax regime impacts on tax revenues
in EU Member States. This is a useful benchmark for the quantification of the economic
impacts of the proposed options that follows in the next chapter. In Section 2.1 we make a
preliminary assessment of which countries receive relatively most income from the current
tax regime. In Section 2.2 we assess the impacts on tax revenues in EU Member States of the
current tax regime, in Section 2.3 we assess the situation from the point of view of the inves-
tors, and in Section 2.4 we consider how the current tax regime impacts on the functioning
of the Internal Market.
2.1. A PRELIMINARY ASSESSMENT OF THE CURRENT TAX REGIME Before turning to the quantitative impacts of the current tax regime we make a preliminary
assessment of how the current system affects government tax revenues in EU Member States
and, consequently, what is at stake if the current tax regime is changed.
Basically, the current tax regime impacts governments’ tax revenues in the following way:
� WHT on outbound portfolio dividends paid to investors who are tax resident in
other EU Member States (gross WHTs less refund of excess WHT paid to inves-
tors claiming the reduced treaty rate) adds to government tax revenue
� Relief to resident investors for WHTs paid abroad counts as a government tax ex-
pense
In addition to this there will be administrative and compliance costs faced by both Member
States and investors. Specifically, Member States will face administrative cost of handling a
system granting relief at source and relief by refund respectively, and administrative costs of
giving tax credits to residents for WHT paid abroad. Investors will have compliance costs of
filing claims for relief by refund and meeting documentation requirements in order to obtain
relief at source. Moreover, investors may incur liquidity costs when excess amounts of WHT
are being collected in the source state in the period until the excess WHT is refunded. These
costs will be dealt with separately from the impact on Member States’ tax revenue and tax
burdens for investors.
To make a preliminary assessment of the current tax regime, we identify four groups of
countries.
Group 1Group 1Group 1Group 1 consists of countries that collect large net income from WHT on outbound portfo-
lio dividends while at the same time offering low or even no relief for WHT paid by resident
investors abroad. Belgium and the Czech Republic belong to this group. These countries can
be expected to lose tax revenues if the current tax regime is changed in a way that would
make them grant higher tax relief for WHT paid abroad or to lower their WHT.
Group 2Group 2Group 2Group 2 consists of countries that collect large net income from WHT on outbound portfo-
lio dividends but also provide high tax relief for WHT paid abroad by resident taxpayers.
Chapter 2 OPTION 1: REVENUE EFFECTS FROM THE CURRENT
TAXATION OF CROSS-BORDER DIVIDENDS

Taxation of cross-border dividend payments within the EU
37
This group consists mainly of the "old23" EU15 Member States and Estonia.24 These coun-
tries can be expected both to increase tax revenues (from the fact that they will have to pro-
vide less tax relief to resident investors for the WHT paid abroad) and to decrease revenues
(from lower or no WHT) if the current tax regime is changed. The net impact will therefore
depend on how the new system is designed.
Group 3Group 3Group 3Group 3 is the mirror picture of Group 2 and consists of countries that collect little net in-
come from WHT on outbound portfolio dividends and due to the relatively low flat rates on
inbound dividends in combination with ordinary tax credit also in practice offer very limited
tax relief of WHT paid abroad. This group consists mainly of "new" Member States.25
Changes to the current tax regime are expected to have little impact on this group of coun-
tries primarily since the amount of dividend flows to and from these countries is very lim-
ited.
Group 4Group 4Group 4Group 4 consists of countries that collect little net income from WHT on outbound portfo-
lio dividends while at the same time offering high relief of WHT paid abroad. Ireland, Italy,
Malta and the United Kingdom belong to this group. These countries can be expected to
gain tax revenues if the current tax regime is changed in a way that would lower or eliminate
WHT in other EU Member States since the tax relief burden of countries in this group
would then be reduced.
The preliminary assessment is summarised in Table 2.1. Group 2 and Group 3 include most
of the countries since the WHT system is typically “symmetric” in the sense that countries
typically combine high WHT on outbound dividends with high relief for withholding taxes
paid abroad – or the other way around.
23 Member States which joined the European Union before the big enlargement of 2004. The Member States which joined after 2004 are often referred to as the "new" Member States. 24 Austria, Denmark, Estonia, Finland, France, Germany, Luxembourg, Netherlands, Portugal, Spain and Sweden. 25 Including Bulgaria, Cyprus, Greece, Latvia, Lithuania, Hungary, Poland, Romania, Slovenia and Slovakia.

Taxation of cross-border dividend payments within the EU
38
Table 2.1 What is at stake for individual EU Member States? Low relief of WHT levied on
inbound dividends
(as a share of GDP)
High relief of WHT levied on
inbound dividends
(as a share of GDP)
Large net income from WHT on out-bound dividends (as a share of GDP)
Group 1 Belgium, Czech Rep.
Group 2 Austria, Denmark, Estonia, Finland,
France, Germany, Luxembourg, Neth-erlands, Portugal, Spain, Sweden
Small net income from WHT on out-bound dividends (as a share of GDP)
Group 3 Bulgaria, Cyprus, Greece, Hungary, Lat-via, Lithuania, Poland, Romania, Slo-
vakia, Slovenia
Group 4 Ireland, Italy, Malta, UK
Note: Income from WHT on outbound dividends as a share of GDP is calculated as net WHT revenue (WHT on outbound dividends less refund of excess WHTs) as a share of GDP. Relief of foreign WHT as a share of GDP is calculated as total tax relief of WHT on inbound dividends. Large/high means above the EU median and small/low means below the EU median.
We do not have sufficient data for Malta so results for cannot be deemed representative. Source: Copenhagen Economics.
2.2. IMPACTS ON EU MEMBER STATES OF THE CURRENT TAX REGIME In this section we will assess the impacts on EU Member States of the current tax regime by
quantifying the tax revenue impacts in EU Member States and by making a qualitative as-
sessment of the administrative costs of the current system borne by tax authorities.
Tax revenue impacts in EU Member States
An assessment of the impacts of the current tax regime on tax revenues from cross-border
portfolio dividends in EU Member States will need to consider the net revenue from both
inbound and outbound dividends (four elements in total):
� Net income from WHT on outbound portfolio dividends
o Income from WHT on outbound dividends (government tax revenue)
o Refund of excess WHT charged (government tax expense)
� Net income from taxation of inbound dividends
o Income from taxes on inbound portfolio dividends (government tax reve-
nue)
o Relief for double taxation (government tax expense)
The second element above, taxes on inbound dividends, is not directly related to the WHT
regimes. However, we need to consider this element in order to compare countries that pro-
vide relief for double taxation through tax exemption and countries that provide relief
through foreign tax credit. Under tax exemption, income is simply exempt and there is thus
no tax revenue from taxes on inbound dividends and hence no relief for double taxation, cf.
Box 1.3. Under foreign tax credit, dividends are taxable and hence there is tax revenue from
income taxes on inbound dividends and usually also some relief for WHT paid abroad. Un-
der tax deduction, there is only a very minor relief. Some of the proposed options will be
implemented differently depending on whether the residence country has a tax credit or tax
exemption system in place. The four elements above should be considered in combination,

Taxation of cross-border dividend payments within the EU
39
since e.g. relief for double taxation usually is constrained by the level of resident taxation of
the inbound dividends (ordinary credit).
As explained earlier, by not offering relief at source, some countries will collect an excessive
amount of WHT revenue. Due to the administrative cost associated with the procedures of
reclaiming this amount, some relief will be foregone by the investors. In the calculations, 30
per cent of the excessive collected amount is assumed to be foregone by the investors, thus
adding to Member States’ tax revenue.
All Member States obtain positive net revenues under the current tax regime. The total tax
revenues within the EU from WHT and national dividend income tax on cross-border port-
folio dividends is app. €8 billion per year (app. 0.07 per cent of GDP) cf. Table 2.2. With-
holding taxes account for about €5.3 billion per year (€5,566 million less a refund of €284
million per year equalling app. 0.04 per cent of GDP), and national dividend income taxa-
tion account for the remaining €2.8 billion (€4.1 billion less €1.3 billion). As predicted by
the preliminary assessment in Section 2.1 we find that it is mainly the countries in Group 1
that obtain positive revenue and the countries in Group 4 that gain only little from the cur-
rent tax regime measured as a per centage of GDP. The Member States in Group 2 also gain
extra revenue of 0.09 per cent of GDP, (app. €6.6 billion) whereas inbound and outbound
dividend flows in Member States in Group 3 are too small to have any measurable impact
on tax revenues.
Table 2.2 Current tax revenues from WHT in EU Member States (Option 1)
Net income from taxation of inbound dividends
Net income from WHT on outbound dividends
Tax revenue impact
Country Income
from taxes on inbound dividends
Relief of double tax-
ation offered to resident investors
Income from WHT
on outbound dividends
Refund of excess WHT charged
Total
As a share of GDP
Group 1 (Belgium, Czech Rep.) 837 0 151 -5 983 0.21% Group 2 (Austria, Denmark, Estonia, Finland, France, Germany, Luxembourg, Netherlands, Portugal, Spain, Sweden) 2,994 -1,122 5,045 -277 6,640 0.09% Group 3 (Bulgaria, Cyprus, Greece, Hungary, Latvia, Lithuania, Poland, Romania, Slovakia, Slovenia) 33 -18 43 -2 56 0.01% Group 4 (Ireland, Italy, Malta, UK) 220 -183 327 0 365 0.01%
Total 4,085 -1,323 5,566 -284 8,044 0.07%
Note: All data is in million EUR. Negative numbers mean loss of tax revenue. The larger the negative number, the larger the loss. Refund of excess WHT is assumed to be 70 per cent of excess WHT collected.
Source: Copenhagen Economics.
Tax revenue in Member States derived from the WHT system is rather limited, and consti-
tute only 0.2 per cent of Member States’ total tax revenue, cf. Table 2.3. The share is the

Taxation of cross-border dividend payments within the EU
40
highest in Group 1 countries (0.5 per cent). For comparison, corporate income taxation
constitutes a larger share of total tax revenue, ranging from 4.8 per cent in Group 3 coun-
tries to 7.6 per cent in Group 3 countries with an average value of 5.6 per cent.
Table 2.3 Tax revenues from WHT compared with corporate income taxes
Country Net income from dividend taxation (less tax relief etc)
Net income from div-idend taxation (share of total tax revenue)
Income from cor-porate taxation
Income from cor-porate taxation (share of total tax
revenue)
Group 1 983 0.5% 13,531 6.7%
Group 2 6,640 0.2% 137,239 4.8%
Group 3 56 0.0% 22,923 7.6%
Group 4 365 0.0% 85,429 6.7%
Total 8,044 0.2% 259,122 5.6%
Note: Net income from dividend taxation equals portfolio investors’ tax burdens. Total tax revenue equals: Total receipts from taxes and social contributions (including imputed social con-tributions) after deduction of amounts assessed but unlikely to be collected
Corporate taxation equals: Taxes on the income or profits of corporations including holding gains All data is in million EUR except for the numbers in per centage. Data for each Member State is given in Appendix Table 4.6 Data is for 2009
Source: Net income from WHT is derived from the above table, while corporate income taxation and total tax revenues come from Eurostat.
Our quantification methodology is shortly described in Box 2.1 and we refer to Appendix 1
for more technical details on the methodology and the model calibration.

Taxation of cross-border dividend payments within the EU
41
Box 2.1 Short description of how we calculate tax revenues in EU Member States We will illustrate our methodology by an example of dividend payments from Belgium to French portfolio individual investors. Income from WHT on outbound dividends EU Member States earn revenue on dividends paid to foreign investors by imposing a WHT on outbound dividends. The WHT rates imposed are in most cases bilateral and depend on the type of particular investor in question. If countries offer relief at source, the treaty WHT rate is levied on outbound dividends. If there is not relief at source, the investor must reclaim excess WHT in the source country (see below).
Belgium imposes different WHT rates on dividends to investors from different countries and different types of investors. For a French individual, according to the bilateral double taxation treaty, a WHT of 15 per cent is imposed while an Irish individual is required to pay a 25 per cent WHT. The matrix of bi-lateral WHT rates per country and investor type (individuals, companies and CIV’s) is found in Appen-dix 4, Table 4.2-4.4. Belgium does not offer relief at source and it therefore charges the non-treaty rate of 25 per cent on all outbound dividend payments to individuals.
Refund of excess WHT When the source country does not offer relief at source it collects WHT which may be fully or partly re-claimed by the investor. The refund of excess WHT may be costly in terms of time and money and not all investors will file this refund claim (in some cases the costs of filing the claim outweigh the benefits). We therefore assume that only 70 per cent of the collected excess WHT will actually be refunded. This assump-tion is based on estimates from industry participants.26
French individuals that receive dividend payments from Belgium and that have paid the non-treaty WHT rate of 25 per cent have the opportunity to reclaim the excess WHT. The treaty rate is 15 per cent and the individuals have therefore been overtaxed by the difference between 25 and 15 per cent of the dividend flows. 70 per cent of this amount will actually be refunded.
Income from taxes on inbound dividends Residence countries that offer relief for double taxation by the exemption system do not tax inbound divi-dends. However, countries with a foreign tax credit system earn revenue from taxing inbound dividends, while in parallel providing credit for WHT paid abroad. Most countries tax the dividend income of individu-als, companies and CIVs differently. CIVs are usually subject to exemptions or very low rates. Inbound divi-dends to CIVs will however eventually be distributed to individuals through capital gains, dividends etc. To be able to capture that taxes will therefore eventually be paid on the inbound dividends to CIVs we assume that they are redistributed to individual as dividends when they are received by the CIV. For these dividends we therefore apply a tax rate which is the sum of the tax rate of CIVs and the tax rate for individuals and assume that the individual is based in the same country as the CIV. If not we would be underestimating the tax revenue obtained when the CIV pays out benefits to the owners. For countries such as Luxembourg and Ireland, the above assumption of dividends to CIVs being taxed by the domestic tax rate for individuals is not accurate, since most CIVs payout their earnings to investors in other countries. Hence, in the case of Luxembourg and Ireland, we assume that tax revenue in Luxembourg and Ireland is not increased when dividend income to CIVs in Luxembourg and Ireland increase, since the CIV tax rate is zero. The tax revenue from this dividend income will however be captured in other Member States as dividends are redistributed to other Member States and therefore included in the available data we use to calculate tax revenue. If the dividends are distributed from Luxembourg and Ireland as other types of income than dividends (e.g. capital income) we will not be able to capture it.
Belgium gains revenue by taxing resident investors on their dividend income earned abroad. Belgium taxes the dividend income of individuals, companies and CIVs differently. Belgium individuals earning a dividend abroad pay a 15 per cent income tax while companies pay a 34 per cent corporate income tax and CIVs are exempt. We also apply the assumption that dividends paid to Belgian CIVs will be taxed with the tax rate to individual to calculate the total income of Belgium from taxes on inbound dividends.
We assume that all financial companies are non-transparent. This may not be true for a small subset of CIVs and the assumption is therefore an approximation. If a CIV is transparent it will in some countries not be eligible for treaty benefits. However, since we expect only a very few CIVs to be transparent, and since even transparent CIVs will be eligible for treaty benefits in certain countries, we expect the approximation to be relatively good. In chapter 5 we present a sensitivity analysis, showing how our results would change if we changed the assumption such that only 80 per cent of CIVs are non-transparent. While transparency
26 See e.g. European Commission (2009), p. 40.

Taxation of cross-border dividend payments within the EU
42
typically leads to no taxation at source and that tax credits flow to the investors, this is not always the case. In addition, transparency may be viewed differently from the Member States involved. Relief for double taxation offered to resident investors Most countries offer some kind of relief to residence investors for the WHT they paid in the source country. This relief can be dependent on the investor type. In the calculations we distinguish between countries ap-plying the exemption and foreign credit method respectively, the size of the relief offered and whether or not it is dependent on the investor type (see Appendix 2, Table 2.4). Belgium offers no relief for double tax-ation. The Netherlands, to take another example, offers credit to individuals and exemption to corpora-tions. We illustrate relief of double taxation by using the following example:
Consider a Dutch individual earning €100 dividends in Belgium and facing a treaty WHT rate of 15 per cent. This investor should be taxed by app. 22.5 per cent on his dividend income in the Netherlands (€22.5) but the Netherlands offers an ordinary tax credit and therefore relieves the investor for the €15 paid in Belgium. The tax revenue in the Netherlands is then €22.5-15 = €7.5. The investor thus pays €22.5 in dividend taxes: €15 to Belgium and €7.5 to the Netherlands. Now consider an Italian company earning €100 dividends in Belgium and facing a treaty rate of 15 per cent. Italian companies are exempt from paying corporate income tax in Italy up to 95 per cent of the dividends earned abroad. Besides from paying €15 in Belgium, the Italian company will also pay the effective corporate income tax rate in Italy of 1.4 per cent on 5 per cent of its dividend income; that is 0.4*0.05*100 = €0.7. For investors resident in countries which apply 100 per cent exemption, no divi-dends earned abroad will be taxed in their country of residence.
Note that CIVs will generally not be able to credit any WHT in the residence country since the residence tax rate is usually zero (1 per cent in Spain). The methodology and model calibrations are presented in Appendix 1.
Source: Copenhagen Economics.
Administrative costs of the current tax regime borne by tax authorities
An important consideration in the design and operation of a tax regime is the costs associat-
ed with their administration. Currently tax authorities basically incur two types of adminis-
trative costs: 1) Costs of administrating withholding tax relief procedures for non-residents
investors (notably when relief is granted by means of refund), and 2) Costs of administrating
the provision of tax credits to residents in order to compensate for the withholding taxes
paid abroad.
Relief to non-residents from withholding taxes may be granted at source (i.e. at the moment
of the payment) or by means of refund. In the first case, the procedure is normally handled
by financial intermediaries, including the issuer company (which initially bear the costs and
subsequently pass them on to investors) and the tax authorities of the source Member State
are not directly involved in checking whether or not tax relief should be granted. Differently,
in the second case, the procedure is administered by the tax authorities of the source Mem-
ber State which are responsible for examining all refund claims submitted by the investors
with a view to assessing whether or not they are actually entitled to the refunds. In both cas-
es, the tax administrations of the residence Member States are indirectly involved in these
procedures as they are normally required to issue residence certificates for the investors who
are tax resident within their territory. The survey carried out by Deloitte provides useful in-
formation about how withholding tax relief procedures and, in particular, refund procedures

Taxation of cross-border dividend payments within the EU
43
are administrated in the EU Member States included in the survey.27 The relevant survey da-
ta with respect to refund procedures is summarised in Table 2.4.
In all the nine countries covered in the survey, the refund claims are handled in a central of-
fice within the tax authorities (one-stop shop), and a financial intermediary is allowed to
submit refund claims on behalf of their investors. These are two of the key recommendations
on how to improve refund procedures made, by the FISCO group which examined with-
holding tax relief procedures in the Member States and suggested possible ways for Member
States to simplify and improve them.28 Another key recommendation is the standardisation
of forms to be used to submit a refund claim. Our survey shows that six of the nine Member
States that have been examined have standard forms (Italy has standard forms only for four
EU Member States) while France has not standardised the relevant forms. Our survey con-
firms that financial intermediaries charge fees to investors for making the refund claim on
their behalf, but these fees are not standardised, and may vary across firms and countries.
Market participators suggest that some firms charge around €130 per hour spent on the re-
claim procedure, whereas another source says that charges can amount to €145 per dividend
payment. The amount of time spent will vary according to the country in question. We note
that Italy and France provide interest on the refund.
In addition, in the Commission's public consultation on portfolio dividends initiated on the
same issue that this analysis is commissioned to help address, one respondent mentioned that
the cost of claiming a refund of excess withholding taxes collected abroad is a five per cent
fee of the amount withstanding.29
Overall, we expect the tax refund systems in Italy and France to be administratively more
costly for both tax authorities and non-resident investors than the other five countries in the
survey. This is so because there are no standardised forms in France, and since Italy only has
standardised forms for four EU countries (Germany, Portugal, Sweden and the UK). The
lack of standardisation not only makes tax refund costly for national tax authorities but also
for the investor or financial intermediary.
Based on current data availability, it has not been possible to quantify the administrative cost
of the current tax regime for Member States.
27 The survey includes Italy, Spain, Luxembourg, Netherlands, Germany, France, Sweden, Ireland and the UK. These countries have been selected in order to cover as much of the dividend flows as possible. The group of coun-tries receive 84 percent and 95 percent of ingoing dividends and outgoing dividends respectively. 28 European Commission (2009). 29 http://ec.europa.eu/taxation_customs/common/consultations/tax/2011_withholding_taxes_en.htm.

Taxation of cross-border dividend payments within the EU
44
Table 2.4 Administration of the refund procedure in selected source countries Italy
Spain
Luxem-
bourg
Nether-
lands
Germany
France
Sweden
Is the refund made by the tax authorities or the withholding agent?
The tax au-thorities
The tax au-thorities
The tax au-thorities
The tax au-thorities
The tax au-thorities
The tax au-thorities
The tax au-thorities
Is there a central office within the tax admin-istration which handles all refund claims?
Yes Yes Yes Yes Yes Yes Yes
Are financial intermediar-ies allowed to submit re-fund claims on behalf of their investors?
Yes in princi-ple but this is not done in practice
Yes Yes Yes Yes Yes Yes
Are there standardised forms to be used to sub-mit a refund claim?
Only for four EU countries (Germany, Portugal, Sweden and the UK)
Yes Yes Yes Yes No Yes
Is the investor entitled to interest on a refund?
Interest is due on a bi-yearly basis (at a rate of 1% for each semes-ter)
Yes, but only if the reclaim has not been approved by the admin-istration with-in app. 4 years.
No No No, only for refund of WHT unduly withheld un-der the Inter-est and Roy-alty Directive
Yes in case of an adminis-trative reclaim (e.g. based on the Aberdeen case law)
No
Is exchange of infor-mation made with other EU Member States re-garding payment of divi-dends?
Yes Yes Yes, under the EU Directives
Yes, under the EU Directives
Yes Yes Yes
In the affirmative, is in-formation provided au-tomatically, on request or spontaneously?
On request On request On request Both on re-quest and spontaneous-ly
On request On request Both on re-quest and au-tomatically
Source: Deloitte survey of withholding tax rates in selected EU countries.
2.3. IMPACTS ON INVESTORS OF THE CURRENT TAX REGIME In this section we will assess the impacts on tax burdens borne by EU investors of the cur-
rent tax regime. Two elements are relevant in this respect: (i) the tax burden of EU investors
and (ii) the compliance costs related to withholding taxes in the current situation.
The tax burden of EU investors under the current tax regime
Investors making portfolio investments abroad are being taxed on their dividend income
both in the source and the residence country. The tax burden of investors in EU Member
States will therefore depend on the following elements:
� Tax burden in the residence country
o Income taxes paid on dividend income (tax burden)
o Relief for double taxation on inbound dividends (reduction of tax bur-
den)

Taxation of cross-border dividend payments within the EU
45
� Tax burden in the source country30
o Withholding taxes levied on dividends (tax burden)
o Refund of excess WHT (reduction of tax burden)
The total tax burden of EU investors is by definition equal to the total tax revenue gained by
tax authorities in EU Member States. Taken as a share of GDP we see that it is mainly inves-
tors resident in (for double taxation relief) countries in Group 1 that face a high tax burden,
cf. Table 2.5. This is primarily due to the juridical double taxation occurring in Group 1
countries, where residents are not relieved for the withholding taxes paid abroad. Investors in
Group 2 and 4 also face significant tax burdens, however substantially lower than investors
in Group 1.
Table 2.5 Current tax burden of investors in EU Member States (Option 1)
Tax burden in the residence country
Tax burden in the source country
Tax burden
Country Taxes paid on inbound dividend income in
the residence country
Tax relief in residence country
Withholding taxes levied on outbound dividend
payments in the source country
Refund in the source country of excess
WHT paid abroad
Total
As a share of GDP
Group 1 (Belgium, Czech Rep.) -837 0 -744 47 -1,534 -0.32% Group 2 (Austria, Denmark, Esto-nia, Finland, France, Germany, Luxembourg, Netherlands, Portugal, Spain, Sweden) -2,994 1,122 -2,989 140 -4.721 -0.07% Group 3 (Bulgaria, Cyprus, Greece, Hungary, Latvia, Lithua-nia, Poland, Romania, Slovakia, Slovenia) -33 18 -33 2 -46 0.00% Group 4 (Ireland, Italy, Malta, UK) -220 183 -1,801 96 -1,743 -0.05%
Total -4,085 1,323 -5,566 284 -8,044 -0.07%
Note: All data is in million EUR. Negative numbers mean taxes that the investors have to pay. The larger the negative number, the higher the tax burden. Refund of excess WHT is assumed to be 70 per cent of excess WHT collected.
Source: Copenhagen Economics.
It is assumed that the source country refunds 70 per cent of the excess WHT collected to in-
vestors. 30 per cent of this amount is never reclaimed by investors due to presumed large
administrative costs associated herewith. The amount of foregone relief adds to €122 mil-
lion.31
30 In addition, when investors receive a dividend, corporate taxes will already have been paid on the profits from which the dividend is distributed. This does not, however directly add to the investor’s tax burden, but can be seen as an underlying burden. This double taxation is also known as economic double taxation as explained elsewhere in the report. 31 €284 million divided by 70 percent, multiplied by 30 percent

Taxation of cross-border dividend payments within the EU
46
The tax burden of different investor types in the different Member States are given in Table
2.6.
Table 2.6 Current tax burden of different investor types (Option 1)
Member State Total tax income for MS of dividend taxation (WHT and dividend income tax)
Individuals Non-
financial companies
Insurance companies and pen-sion funds
CIVs
Banks and other
financial institutions
Austria 105 39 7 28 41 5
Belgium 940 292 63 376 230 521
Bulgaria 0 0 0 1 0 0
Cyprus 0 0 0 1 0 0
Czech Rep. 43 0 41 7 2 2
Denmark 104 25 11 55 60 25
Estonia 3 0 0 1 0 0
Finland 186 15 1 80 0 31
France 1,726 55 79 312 255 405
Germany 1,887 821 39 43 167 36
Greece 7 0 1 0 0 3
Hungary 7 6 0 6 2 0
Ireland 273 2 27 20 133 3
Italy 91 225 5 222 7 325
Latvia 0 0 0 0 0 0
Lithuania 1 0 0 0 0 0
Luxembourg 1,114 4 84 30 729 8
Malta 1 0 0 1 0 1
Netherlands 698 162 9 115 89 314
Poland 36 5 1 11 1 2
Portugal 65 0 15 22 0 20
Romania 1 0 0 0 0 0
Slovak Rep. 0 0 0 0 0 0
Slovenia 3 1 0 2 0 0
Spain 474 87 24 21 27 37
Sweden 276 154 8 38 49 38
UK 0 0 0 570 170 31 Total tax burden of investors 8,044 1,894 416 1,964 1,962 1,808
Note: All data is in million EUR. The tax income in a country and the tax burden of investors in the same coun-try do not equal each other. This is because the government collects revenue from both resident and for-eign investors and resident investors likewise pays taxes both domestically and abroad.
Source: Copenhagen Economics.

Taxation of cross-border dividend payments within the EU
47
Our methodology for quantifying the tax burden of investors is shortly described in Box 2.2
and we refer to Appendix 1, Section 1.2 for more technical details.

Taxation of cross-border dividend payments within the EU
48
Box 2.2 Short description of how we calculate the tax burdenburdenburdenburden of investors Taxes paid on dividend income in the residence country Investors who earn dividend income abroad are being taxed in the residence country on their foreign income (when such income is reported). Individuals are normally being taxed by the income tax rate, companies are typically being taxed by the corporate income tax, and in most countries CIVs are tax exempt or subject to very low tax rates. Inbound dividends to CIVs will however eventually be distributed to individuals through capital gains, dividends etc. To be able to capture that inbound dividends to CIVs will eventually be taxed, we assume that they are redistributed to individuals as dividends, when they are received by the CIV. For these dividends we therefore apply a tax rate which is the sum of the tax rate of CIVs and the household tax rate.32 If not we would be underestimating the tax revenue obtained when the CIV pays out benefits to the owners. The income tax rate differs across residence countries but does not depend on the source coun-try. On an aggregate level, the tax burden of investors equals the income tax accruing to the tax authorities in the residence country as described in Box 2.1. However, on a country-by-country basis the investors’ tax burden will not be equal to the residence country’s tax revenue.
Belgian investors pay income taxes in Belgium on their dividend income earned abroad. Belgium levies different dividend taxes on different investors. Belgian individuals pay a 15 per cent income tax, com-panies pay a 34 per cent corporate income tax and CIV’s are exempt.33 In order to capture the fact that taxes will eventually be paid on dividends obtained by CIVs, these will be calculated as a tax burden faced by CIVs, even though it is actually the burden of the beneficial owners/unitholders of the CIVs.
Relief for double taxation in the residence country Member States with a foreign tax credit system relieve double taxation by offering a credit for WHT paid in the source country. The credit provided is based on the treaty rate. Tax relief is typically limited to the resi-dence country’s taxation of the dividends (ordinary tax credit) as opposed to a relief with no limit (full tax credit). Since CIV’s are tax exempt in almost all countries these investors will not be able to obtain any credit (since the limit is zero). This is not changed by our assumption above that dividends paid to CIV’s eventually are taxed with the income tax rate for individuals. In the following example we use Dutch inves-tors since Belgium offers no tax relief.
Dutch investors pay WHT on dividends earned abroad. A large share of this amount is eligible for a foreign tax credit in the Netherlands since foreign WHT are typically lower than the Dutch residence taxation. The Netherlands offers ordinary credit which means that all WHT paid by Dutch investors will be credited as long as the WHT is lower than the Dutch residence taxation.
WHT levied on dividend payments in the source country Investors must pay WHT in most foreign countries where they earn dividends. The WHT rate typically dif-fers both across countries and between types of investors. If the source country has provided relief at source, the investor immediately pays the treaty rate, if he has provided all the necessary documentation. If relief is granted by refund, the investor pays the non-treaty rate and may apply for a refund of the excess WHT.
A Belgian individual who invests in Denmark will receive relief at source and pay the treaty rate which is 15 per cent. When the individual makes the same type of investment in Germany it pays the non-treaty rate of 26 per cent rather than the treaty rate of 15 per cent and will have to apply for a refund.
Refund in the source country of excess WHT When no relief at source applies, the investor typically pays the non-treaty rate and may file a claim for a refund. The refund procedure is costly in terms of both time and money, which means that a share of inves-tors for which it is uneconomical to claim refund, will choose never to apply for the refund. We assume that 30 per cent of the excess collected WHT is never reclaimed due to this.
Belgian individuals investing in Denmark have no need to apply for a tax relief since Denmark offers relief at source and therefore charges the treaty rate in the first place. Belgian individuals investing in Germany pay the non-treaty rate of 26 per cent rather than the treaty rate of 15 per cent and 11 per cent of the dividend payment is thus eligible for a refund in Germany. Due to the costs of filing the claim, we assume that only 70 per cent is reclaimed.
Source: Copenhagen Economics.
32 This does not change the fact that CIV’s are typically not eligible to receive tax credit since the residence taxation of these investors is zero. 33 That CIV’s are exempt in Belgium is an assumption based on the general picture derived from the Deloitte sur-vey.

Taxation of cross-border dividend payments within the EU
49
Quantifying double taxation
A part of the tax burden associated with withholding taxes is juridical double taxation. This
is given as the difference arising from receiving the income from a cross border transaction
compared to receiving the income from a domestic transaction. According to our model
simulations, the amount of juridical double taxation associated in the current situation (Op-
tion 1) is equal to €3,709 million corresponding to app. 38 per cent of the total gross tax
revenue derived from withholding taxes and dividend income taxes.34 It is primarily residents
in four countries (Belgium, Italy, Luxembourg and UK) that bear the majority of the double
tax burden (74 per cent of total double taxation). This is caused by a combination of no or
low domestic relief (Belgium), and low domestic dividend income tax (Luxembourg (only
for CIVs), Italy and UK). The different countries’ double taxation burden is given in Ap-
pendix Table 4.7.
Compliance and liquidity costs for investors related to WHT
Compliance costs in this context are defined as all the costs of complying with the current
tax regime of WHTs and long term structural consequences (i.e. the inefficiencies caused by
tax planning companies that distort organisational forms in order to avoid paying withhold-
ing taxes as described in the next section). Compliance costs include both costs related to
withholding tax relief procedures and liquidity costs. As will become clear below, many types
of compliance costs are fixed. In the context of this report, this has two important conse-
quences. First, merely reducing WHT rates will not significantly reduce compliance costs.
However, if there is an EU-wide WHT rate applicable at source, so no refund procedure is
necessary, this should be associated with much lower compliance costs.35 Second, compliance
costs, and especially liquidity costs, are particularly burdensome for SMEs since such costs
constitute a larger share of the firms’ cash flow and the loss of liquidity becomes increasingly
important the lower the amount of other liquid assets is.
Some of the compliance costs are relatively straightforward to quantify while others are
much more complicated and require assumptions that can only be documented through de-
tailed market analysis. Adding up the estimates of compliance and liquidity costs, which we
attempt to quantify below, we find that EU portfolio and individual investors would save
approximately €34 million each year if WHT on portfolio dividends were eliminated, cf.
Table 3.20 (see Appendix 3, Table 3.13 for a detailed table showing how the cost saving is
distributed across Member States). If refund procedures were to be made more effective part
of the benefit could also be realised.
34 Total tax revenue derived from dividends income tax and WHT is calculated in our model. By gross revenue we mean the revenue from these tax sources before credit and refund of excess withholding taxes. 35 The European Commission (2010) points out that in cases where withholding taxes cannot be eliminated, com-pliance costs can be reduced considerably if the tax relief systems in EU Member States were simplified (e.g. by us-ing common electronic systems and standards). Under a conservative approach the report finds that the savings from such simplifications would range from between 30 percent to 50 percent of the total compliance costs.

Taxation of cross-border dividend payments within the EU
50
Compliance costs related to relief procedures One of the benefits offered to equity investors by tax treaties are the reduced dividend WHT
rates. However, when tax treaties reduce WHT rates applicable to investors resident in cer-
tain Member States, it creates administrative difficulties for investors that need to document
that they are in fact eligible for the reduced WHT rate. Compliance costs related to relief
procedures fall into two categories: relief by refund and relief at source.
In the case of refund procedures, the compliance costs are higher because, in principle, it is
the investor himself who files and submits a refund claim directly to the tax authorities of
the source Member State. This can be complicated as investors have to deal with the tax ad-
ministration of a Member State different from his residence Member State. Other costs are
linked to the fact that investors, like in the case of relief at source have to produce documen-
tation to prove that they are entitled to tax relief.
Alternatively investors can ask financial intermediaries to submit a refund request on their
behalf. Industry representatives have reported that the market price of using the service from
an agent to administer reclaim procedures are approximately five per cent of the refundable
amount less the foregone refunds, since this per definition is not attempted to be reclaimed.36
This means that administrative costs of applying for refund of excess WHT (excess WHT
which is refunded is equal to €284 million cf. Table 2.5) on dividend payments amount to
€14 million per year (5 per cent of €284 million)
Some of the important elements in increasing compliance costs for investors is the use of pa-
per forms and the different document formats, different documents to be attached, different
confirmations and certifications, including a residence certificate, etc.37 Many of the compli-
ance costs could therefore be overcome if forms and documentation requirements were
standardised and made electronic.
When relief is granted at source, the compliance costs are mainly due to the fact that the in-
vestor has to provide a residence certificate to the financial intermediary which administers
the withholding tax procedure in order to prove that he is entitled to tax relief. Complica-
tions arise from the fact that residence certificates have a short validity period and that, in
some cases, they even have to be translated and authenticated. In addition the investor will
have, in his country of residence, to document that foreign WHT has been paid in order to
qualify for tax credit. Still, the compliance costs for relief at source are expected to be lower
than if the refund procedure applies.
Quantifying compliance costs requires knowledge of local costs at a very detailed level. In
Chapter 5, we will therefore evaluate in which direction these costs may change in response
to the different policy options but we cannot quantify the change.
36 This has been reported by a stakeholder in the open consultation initiated by the Commission. 37 See the European Commission (2010).

Taxation of cross-border dividend payments within the EU
51
Liquidity costs caused by WHT The application process for tax refund may not only be administratively burdensome and
costly but it may also take a long time before taxpayers actually receive the refund. Liquidity
costs arise in cases where excess WHT has been collected in the source country and where
investors are subsequently reimbursed. This problem, which only concerns refund proce-
dures, is particularly pronounced in Italy, where the relief by refund procedure takes 2-3
years, cf. survey results for Italy in Appendix 6 (see summary in Appendix 2, Table 2.5).
To estimate the opportunity costs of claiming WHT relief on dividends, interest and other
securities income, the European Commission (2009) applies the interest paid for taking out
a loan. In their calculations, an investor who receives the tax relief without delay could invest
their relief with at present at least a four per cent return per year. In “normal economic peri-
ods” (defined as in between boom and bust) the alternative rate of return on capital is not far
from this number. Consequently, the total of €406 million paid in excess WHT on dividend
payments38 in countries where there is no relief at source carry a cost for the investors due to
the delay of approximately €16 million per year (four per cent of €406 billion).
2.4. IMPACTS ON THE INTERNAL MARKET OF THE CURRENT TAX REGIME From the point of view of distortions to decisions with regard to the location of the invest-
ment, several distortions of WHT on the Internal Market can be envisaged:
� WHT might dissuade cross-border equity investments while encouraging domestic
investment
� WHT might distort the location of cross-border equity investments
These distortions and others will be discussed below and we will also shortly mention other
possible impacts of WHT (such as impacts on the incentive to invest in debt rather than eq-
uity and the choice of legal form). Whenever possible we will draw on empirical evidence on
these issues and we also revert to the Internal Market distortions in Section 5.2 where we
quantify the impact on capital of reducing/eliminating WHT on cross-border dividends.
However, few empirical studies have analysed the relationship between taxation and the be-
haviour of portfolio investors. In principle, all individuals face the same tax system within
the same country. However, tax systems are often progressive or in other ways designed to
redistribute income. This means that the marginal tax facing different individuals will de-
pend on their economic circumstances (such as their incomes or their family structures and
associated tax deductions). This implies that the potential distortions from unequal tax
treatment of cross border investments also depend on the tax positions of individuals. Most
of the empirical evidence is based on US data.
38 This is the full amount of excess collected withholding tax whereas the number in Table 2.5 is 70 percent of this.

Taxation of cross-border dividend payments within the EU
52
To supplement our analysis we therefore draw on the voluminous literature linking FDI and
taxes. One should keep in mind that there are notable differences between direct and portfo-
lio investments since portfolio investors are typically shorter-term investors, for whom taxes
may have a larger relative importance in the investment decision causing more distortions.
However, this branch of the literature may nevertheless convey useful information on the ex-
tent to which withholding taxes may distort the Internal Market.
WHT might reduce cross-border equity investments
WHT tend to reduce cross-border equity investments in at least two ways. First, in cases of
discrimination (i.e. when outbound dividends are being taxed heavier than domestic divi-
dends) investors will face “over-taxation” when where there is insufficient income in the res-
idence country against which to offset a WHT levied in the source country. This will make
it less attractive to invest abroad. Over-taxation is often a problem for financial companies
(mainly CIVs) since these companies in many cases do not pay income taxes in the residence
country. It may also however be a problem for individual investors and non-financial com-
panies especially when considering the fact that some residence countries tax income accord-
ing to the net principle while source countries always tax non-residents according to the
gross principle.
Second, as described above, WHT may cause juridical double taxation which is a true cost
for cross-border investors (economic double taxation may also be a problem for both domes-
tic and cross-border portfolio equity investments). The additional cost imposed on the inves-
tor draws a wedge between the required rate of return on domestic equity investments and
foreign equity investments. This will make it less attractive to invest abroad.
The empirical literature also finds a tendency for investors to invest in a large amount of
domestic equities, despite the purported benefits of diversifying into foreign equities. This is
called the “home bias”. This bias is believed to arise as a result of the extra difficulties associ-
ated with investing in foreign equities, such as legal restrictions, information asymmetries
and additional transaction costs (such as withholding taxes on outbound dividends). A re-
cent IMF study on cross-border equity holdings finds that, despite of the liberalisation of
foreign portfolio investment that has taken place in most countries in the world since the
early 1980s, the home-bias is still found to exist.39
The implication of these findings for this study is that reduction/ elimination of WHT may
trigger increased cross-border portfolio investments between EU Member States instead of
domestic portfolio investments.
WHT might distort the location of cross-border equity investments
When WHT are not harmonised across EU Member States, portfolio equity investors have
an incentive to locate investments in low-tax locations. We have found no empirical studies
39 Faruqee, Li and Yan (2004) and references therein.

Taxation of cross-border dividend payments within the EU
53
that have analysed the link between WHT and portfolio investments, and we therefore draw
on three types of indirect evidence related to the responsiveness of investors to taxation.
First, after the conclusion of a tax treaty, portfolio investments between the treaty countries
tend to increase. A study covering 37 host and 50 source countries sets up an event study
methodology for new treaties signed between 2001 and 2007 to investigate their effects on
cross-border equity investments. During the year the tax treaty is signed foreign equity port-
folio investments between the two countries almost double and during the second year in-
vestments increase by more than 20 per cent.40 Further, equity investments increase with the
difference in corporate income tax rates between the residence and the source country so that
countries with low tax rates tend to attract equity investment from countries with high tax
rates.
Second, evidence based on the capital gains tax reforms in the US and other policy changes
suggest that asset trading behaviour responds when investors perceive a tax-induced reward
to trading at one point in time rather than another. There seems to be a similar effect on the
geographical location of trades -- when taxes make it expensive to carry out trades in one lo-
cation, the trades may move elsewhere. It is not clear how much of the trading response to
capital gains tax changes, for example, is the result of re-timing of trades that would other-
wise take place at a different point in time, and how much is "new" trading.41
Third, the empirical literature suggests that taxes have a significant and negative impact on
the location of FDI, i.e. that the elasticity of FDI (measures either in terms of number of
foreign subsidiaries or FDI inflows) is negative. Rather than going into details with all of the
studies we shortly describe two meta studies that have extracted the main learning point
from these studies, cf. Box 2.3. Overall, the meta studies find strong support for a negative
relationship between FDI and taxes.
The implication for this study is that changes in current tax regime are likely to have an im-
pact also on the distribution of portfolio investments across countries.
40 Parikh, Jain and Spahr (2011). 41 Poterba (2000).

Taxation of cross-border dividend payments within the EU
54
Box 2.3 Description of two meta analyses of FDI and taxation Meta analysis is a research method to synthesise research results and can be used as a statistical way of reviewing and summarising empirical results. It provides a tool to compare and/or combine outcomes of different empirical studies with similar set-ups or set-ups that can be controlled for. Meta analysis has two advantages that make it useful for our purposes:
� Systematic approach to analysing the sources of variation in existing empirical studies � Provides the possibility of investigating how research design, model specification and estima-
tion technique impact on empirical results Some of the problems related to the meta analysis are the risk of publication bias in the results, concerns about the comparability of estimated effects and the degree of independence between different empirical studies. The set up and main findings in the meta analysis by Mooij and Ederveen (2006) and Feld and Heckemeyer (2009) are summarised in Table 2.7.
Table 2.7 Summary of findings from two meta analysis
Study Meta analysis setup Main findings
Mooij and Ederveen (2006)
Covers 31 empirical papers including 427 semi elastici-ties in EU countries, the US, Australia, Canada and Japan during the 1980s and 1990s
The median semi elasticity is -2.9 where: � Real investments in plants are more responsive to taxes than
other forms of FDI � FDI is more responsive to effective tax rates than statutory tax
rates � No significant difference between estimates for parents from
tax exemption countries and estimates from tax credit coun-tries
� The change in elasticities is non-linear (higher in the 1990s than in the 1980s)
� No systematic variation between small and large countries
Feld and Heckemey-er (2009)
Covers 45 empirical papers including 730 semi elastici-ties in a broad selection of OECD countries during the period 1965-2005
The median semi elasticity is -1.7 where: � FDI is more responsive to effective rather than statutory tax
rates � Localisation of economic rents is less influenced by taxes than
the marginal investment decision � Including time fixed effects reduces the significance of tax ef-
fects � Agglomeration effects do not have any robust significant ef-
fect on estimated tax elasticities � Tax elasticities are higher in studies including EU countries
compared to the US
Source: Copenhagen Economics.
Distortions with regard to the amount of equity investment and other distortions
caused by WHT
When the taxation of dividend income depends on the mode of investment, (i.e. whether
the investor holds equity directly, through financial intermediaries or through a company
with some other legal form), the investor may make portfolio investment decisions that are
suboptimal compared to a situation where there are no such differences. This aspect will be
touched upon in Chapter 5 where we will examine the legal aspects of the current situation
and the possible solutions.
The presence of withholding taxes on cross-border dividend payments may also:
� Give portfolio investors an incentive to invest in debt rather than in more produc-
tive types of investments. Eventually, the lower levels of equity investments will in-
crease the cost of capital.
� Spur companies to retain profits. This means that less capital will be available in
the market and that capital is retained in less profitable companies.

Taxation of cross-border dividend payments within the EU
55
� Providing an incentive to distribute profits in other (and lower taxed) forms than
dividends. This means that Member States will be able to collect less tax revenue.
� Affect the choice of legal form of the entity in which to invest. This means, for ex-
ample, that the choice between investing through a transparent and a non-
transparent entity will be distorted.
We have not been able to quantify these impacts. However, in Chapter 5 we discuss how the
proposed options interact with the Parent-Subsidiary Directive in circumstances where in-
terest and dividend payments are taxed differently so that investors will have an incentive to
prefer one type of investments over the other.
Taxation of cross-border dividend payments within the EU
56
The Commission services have made a preliminary analysis and have on the basis of stake-
holders' contributions identified several different approaches that might improve the situa-
tion of taxing cross-border dividend income received by individuals and portfolio investors:
� Option 2: Abolition of withholding taxes on cross-border dividend payments to
portfolio/individual investors
� Option 3: The residence country grants full credit for the withholding taxes levied
in the source country
� Option 4: Net rather than gross taxation in the source country
� Option 5: Application of a general EU-wide reduced rate of withholding tax with
information exchange (Neumark solution)
� Option 6: Limitation of both source and residence taxation of dividend income
and granting of credit for underlying foreign corporate tax
� Option 7: No WHT in the source country and no taxation of foreign source divi-
dends in the residence country
Below we will describe each of the options in more details, discuss the advantages and disad-
vantages of the proposed options, and summarise the impacts on tax revenues in the Mem-
ber States, impacts on the tax burden of investors and impacts on the Internal Market (Sec-
tion 3.1 through section 3.6). All options except from Option 4 will be assessed quantita-
tively using the methodology from Option 1. Section 3.7 sums up the economic impacts of
the proposed options.
When we discuss the impact of Options 2 - 7 we take Option 1 (the current situation) as the
starting point. We therefore quantify how much tax revenues are reduced in individual EU
Member States compared to the current tax revenues, and we also quantify how much the
tax burden of EU investors is reduced compared to the current tax burden.
3.1. OPTION 2: ABOLITION OF WHT ON CROSS-BORDER DIVIDENDS
This option could be implemented in the following way:
� No Member State will charge withholding taxes on dividends paid to EU resident
portfolio and individual investors. A tax system remains in place however to be able
to tax non-EU residents.
� Member States will grant the application of this tax treatment at source (rather
than by means of refund procedures).
� There will be no excess WHT to be relieved by the source country.
� There will be no WHT paid abroad to be credited in the residence country.
Chapter 3 THE ECONOMIC IMPACTS OF THE PROPOSED OPTIONS

Taxation of cross-border dividend payments within the EU
57
Advantages:
� Dividend income earned abroad is only taxed in the residence country and juridical
double taxation is fully eliminated.
� Discrimination of outbound dividends is fully eliminated in the source country.
� The effective tax rate of dividend income earned abroad is the resident state’s tax
rate, hence the distortion of the location choice is fully eliminated (tax neutrality),
which makes cross border investments more attractive.
� The simplification of Member States' tax systems will reduce both compliance and
liquidity cost of investors, and reduce administrative costs for tax authorities of
administrating both relief systems for residents and non-residents.
� Tax revenue of residence countries will increase because they will not have to pro-
vide tax relief for the WHT levied by the source country.
� Reduce tax planning opportunities, e.g. for investors who claim multiple tax cred-
its, etc.
� No conflict with the principle of source-state entitlement to tax; the source state, in
its capacity as the residence state of the paying company, already taxes the profits of
the company out of which the dividend distributions are made.
Disadvantages:
� Source countries will lose tax revenues.
� If investors do not need to apply for a relief of WHT paid abroad they have less in-
centive to report their dividend income in the residence countries which might in-
crease the risk for tax evasion. However, this may be avoided by introducing auto-
matic exchange of information between Member States.
� The increased opportunity for tax evasion would adversely affect the neutrality of
investments made through domestic and foreign collective investment vehicles as
the former in most cases are required to inform tax authorities of dividend income
of resident investors.
� The solution will not address economic double taxation.
Impact on Member States' tax revenues
We find that the countries that used to charge high withholding taxes on outbound divi-
dends (countries in Group 1 and 2) lose tax revenues amounting to €146 million and
€3,450 million respectively (0.03 per cent and 0.05 per cent of GDP respectively) while the
countries that provided high relief of withholding taxes and charge low withholding taxes
(Group 4) only lose little tax revenue, amounting to €93 million (0.00 per cent of GDP)
under Option 2. On an aggregate level Option 2 reduces EU wide tax revenues by the full
amount of withholding taxes charged on cross-border dividend payments less the saved cred-
it payments. This amounts to app. €3.7 billion (0.03 per cent of GDP), which is app. a 46
per cent reduction of the total taxation of cross border dividends.

Taxation of cross-border dividend payments within the EU
58
Table 3.1 Impact of Option 2 on tax revenues (compared to the current situation)
Net income from taxation of inbound dividends
Net income from WHT on outbound dividends
Tax revenue impact
Country Income
from taxes on inbound dividends
Tax relief offered to resident in-vestors
Income from WHT on out-bound
dividends
Refund of excess WHT charged
Total
As a share of GDP
Group 1 (Belgium, Czech Rep.) 0 0 -151 5 -146 -0.03% Group 2 (Austria, Denmark, Estonia, Finland, France, Germany, Luxembourg, Netherlands, Portugal, Spain, Sweden) 196 1,122 -5,045 277 -3,450 -0.05% Group 3 (Bulgaria, Cyprus, Greece, Hungary, Latvia, Lithuania, Poland, Romania, Slovakia, Slovenia) 6 18 -43 2 -17 0.00% Group 4 (Ireland, Italy, Malta, UK) 52 183 -327 0 -93 0.00%
Total 253 1,323 -5,566 284 -3,706 -0.03%
Note: All data is in million EUR. Negative numbers represent a loss of revenues compared to Option 1. E.g. a positive number in “tax relief” means that a country pays less in tax relief as compared to Option 1.
Source: Copenhagen Economics.
Impact on EU investors’ tax burdens
The total tax burden on EU investors is reduced by the same amount, cf. Table 3.2. It is
mainly the investors in Group 1 countries that benefit from the elimination of withholding
taxes under Option 2. This is so because these investors did not receive credit for withhold-
ing taxes paid abroad in the current option. Investors in Group 2 and 4 also gain from re-
duced withholding taxes but also “lose” from the loss of a beneficial domestic credit system.

Taxation of cross-border dividend payments within the EU
59
Table 3.2 Tax burden of investors under Option 2 (compared to the current situation)
Tax burden in the residence country
Tax burden in the source country
Tax burden
Country Taxes on dividend income
Tax relief WHT paid on dividend payments
Refund of excess
WHT paid abroad
Total
As a share of GDP
Group 1 (Belgium, Czech Rep.) 0 0 744 -47 697 0.15% Group 2 (Austria, Denmark, Esto-nia, Finland, France, Germany, Luxembourg, Netherlands, Portugal, Spain, Sweden) -196 -1,122 2,989 -140 1,531 0.02% Group 3 (Bulgaria, Cyprus, Greece, Hungary, Latvia, Lithua-nia, Poland, Romania, Slovakia, Slovenia) -6 -18 33 -2 7 0.00% Group 4 (Ireland, Italy, Malta, UK) -52 -183 1,801 -96 1,470 0.05%
Total -253 -1,323 5,566 -284 3,706 0.03%
Note: All data is in million EUR. Negative numbers mean that investors will pay more taxes than compared to Option 1. A positive number in WHT paid means that investors pay less WHT taxes. Refund of excess WHT is assumed to be 70 per cent of excess WHT collected.
Source: Copenhagen Economics.
The tax burden of different investor types in the different Member States are given in Table
3.3.

Taxation of cross-border dividend payments within the EU
60
Table 3.3 Tax burden by investor type under Option 2 (compared to current situation)
Member State
Change in tax revenue for MS
Individuals Non-
financial companies
Insurance companies and pension
funds
CIVs
Banks and other
financial institutions
Austria -30 -2 0 -1 -41 0
Belgium -131 -146 -20 -116 -230 -161
Bulgaria 1 0 0 0 0 0
Cyprus 0 0 0 0 0 0
Czech Rep. -15 0 -18 -3 -2 -1
Denmark 10 -1 0 -1 -60 -1
Estonia -2 0 0 0 0 0
Finland -60 0 0 -1 0 -1
France -895 -3 -2 -7 -255 -8
Germany -980 -1 -10 -11 -167 -9
Greece -4 0 0 0 0 0
Hungary 3 0 0 -2 -2 0
Ireland -244 0 -3 -20 -133 0
Italy 151 -37 -5 -201 -7 -294
Latvia 0 0 0 0 0 0
Lithuania* 0 0 0 0 0 0
Luxembourg* -999 0 -7 -3 -729 -1
Malta* 1 0 0 0 0 0
Netherlands -105 1 0 -2 -89 -5
Poland -17 0 0 0 -1 0
Portugal -8 0 0 0 0 0
Romania 0 0 0 0 0 0
Slovak Rep. 0 0 0 0 0 0
Slovenia 1 0 0 0 0 0
Spain -305 -2 0 0 -24 -1
Sweden -76 -2 0 -35 -49 0
UK 0 0 0 -570 -170 -31
Total -3,706 -194 -65 -974 -1,959 -513
Note: All data is in million EUR. The tax income and tax burden for investors do not sum for each country, since the government of a country may collect more or less revenue than the investors of this country pay in taxes.
Data for Malta is incomplete and cannot be used to draw conclusions. The numbers in the table reflect the derived effects from the changes in other countries dividend flows.
Source: Copenhagen Economics.
Impact on EU investors' compliance costs and Member States’ administrative costs
The compliance costs borne by the investor will be almost fully eliminated. As Member
States will grant the application of this tax treatment at source, there will be no need for in-

Taxation of cross-border dividend payments within the EU
61
vestors to go through refund procedures. Therefore, there will be no compliance costs linked
with refund procedures, no liquidity costs and no foregone tax refund. The only remaining
compliance costs are those related to obtaining relief at source. They will not be fully re-
moved since the investor will still need to prove to be eligible for the application of no with-
holding tax, e.g. by documenting EU residence. However, if residence certificates are re-
placed by standardised investor-self documentation, we expect these costs to be considerably
reduced.42
The tax systems in most source Member States will be simplified. The administrative cost of
administrating relief at source and relief by refund will be reduced, and the cost of adminis-
trating tax credits to residents for foreign WHT is completely removed. This option, howev-
er, does not involve improved information exchange or enhanced co-operation between tax
authorities in the source and residence countries. In the absence of withholding tax in the
source Member State, investors have no incentive to report the dividends earned abroad to
their Member State of residence. This is even truer in a simplified relief at source system
where financial intermediaries apply the tax relief at source, on the basis of investor-self doc-
umentation. Therefore, in order to ensure taxpayers' compliance in the residence Member
States, Option 2 might be complemented by the introduction of an automatic exchange of
information system on dividends payments.
3.2. OPTION 3: FULL CREDIT FOR WHT LEVIED ON CROSS-BORDER DIVIDENDS At present no country provides “full credits”43 to domestic investors for the withholding tax-
es paid abroad. This implies that when investors face a withholding tax rate on dividends in
the source country that exceeds the tax burden in the residence country, the effective tax will
be the level of the withholding tax rate paid abroad (which is applied on a gross basis) in-
stead of the domestic tax (which is applied on a net basis). Moreover, some countries only
offer credit for part of the withholding taxes paid abroad, e.g. Estonia where individual in-
vestors are credited up to 21 per cent of withholding taxes paid abroad. Both situations im-
ply that investors will face double taxation. To address this, the residence country could pro-
vide for a "full", rather than an ordinary, credit for the withholding taxes levied in the source
country. A full credit would imply that where the withholding tax levied in the source coun-
try exceeds the actual tax related to such dividend income in the residence country, the tax
authorities in the residence country would have to credit the foreign withholding tax in full,
thereby reducing the investor's tax charge on other domestic income or even refunding or
carrying forward/backwards the surplus tax. Currently as a rule, there are no provisions for
full credits included in Double Tax Conventions or domestic law.
42 See Commission staff working document of 2009. 43 Full credit occurs when the resident country off-sets the entire WHT payment in the source country. This may theoretically imply that resident countries make a payment to investor. Opposed to full credit is ordinary credit, where the credit is limited by the resident country’s dividend income tax rate.
Taxation of cross-border dividend payments within the EU
62
This option could be implemented in the following way:
� The residence country grants full credit for the WHT rate stated in the DTT be-
tween the residence and the source country. If there is no such DTT, the residence
country will provide a credit equal to the non-treaty rate in the source country.
� Any WHT collected in the source country (including WHT above the dividend in-
come tax rate in the residence country) will be credited in the residence income
taxation even if this would imply a payment from the residence country to the in-
vestor. This is also the case for CIVs (but not insurance companies) that typically
do not pay domestic income taxes.44
Advantages:
� If the residence country grants full credit for the amount of WHT paid abroad
then juridical double taxation will be fully eliminated. The tax burden of the inves-
tor will therefore be reduced.
� Full credit for the amount of WHT paid abroad suggests that dividend income
earned abroad is in principle taxed at the same rate irrespective of the source coun-
try. This is so since the domestic dividend income tax becomes the final tax rate.
This eliminates the distortion of the location choice (tax neutrality). If the option is
combined with a simplification of the tax system in the source country (such as re-
fund at source) then there will be a greater degree of tax neutrality.
� No need to amend existing Double Tax Conventions (tax relief could be provided
by the State of residence of the investor on a unilateral basis).
Disadvantages:
� Residence countries would lose tax revenue and de facto finance other countries
withholding taxes. There may however be an incentive for Member States to nego-
tiate low bilateral WHT rates.
� Residence countries would pay out money to investors in order to compensate for
taxes paid abroad, including investors that are tax exempt such as CIV’s.
� Source countries will have an incentive to attract and lock-in companies which
generate WHT revenues from outbound dividend payments while at the same time
lowering tax revenue in residence countries that offer a tax credit to their resident
investors of WHT paid abroad. This would distort the location of equity invest-
ments and hinder cross-border business restructuring.
� Compliance costs for investors would still exist, since they will still need to apply
for refund (also causing liquidity costs) and meet documentation requirements in
order to get relief at source.
� Administrative costs in Member States are not reduced (may even be increased)
since residents still need to go through tax relief procedures.
� The solution will not address economic double taxation.
44 According to the Deloitte survey, only Spain collects dividend income taxes from CIVs (1 percent). Sweden has a progressive system where the rate increases from 0 percent to 30 percent on income above a certain threshold.

Taxation of cross-border dividend payments within the EU
63
Impact on Member States' tax revenues
The full tax relief proposed under Option 3 will reduce the total tax revenues by app. €3.6
billion cf. Table 3.4, which is app 45 per cent of total tax revenue collected from WHTs.
Countries in Group 2, 3 and 4 lose relatively little tax revenue as a per cent of GDP (0.00 –
0.04 per cent of GDP) under this option since these countries already offer a high amount of
relief for withholding taxes. Again, we find that it is mainly countries in Group 1 that can be
expected to lose tax revenues. The reason is that under this option they are required to offer
generous tax relief to resident investors for the withholding taxes paid abroad as opposed to
the current situation where they offer very low or even no relief.
Note that the reduction in taxes from inbound dividends in both Group 2, 3 and 4 is driven
by the increase in the rate of exemption in these countries which reduces taxable income.
Similar to the full credit implementation, Member States provides “full exemption” imply-
ing that Member States may pay money back to the investor in order to fully relief their
withholding taxes and bring the total tax burden down to the domestic level of taxation.
Table 3.4 Impact of Option 3 on tax revenues (compared to the current situation)
Net income from taxation of inbound dividends
Net income from WHT on outbound dividends
Tax revenue impact
Country Income
from taxes on inbound dividends
Tax relief offered res-ident inves-
tors
Income from WHT on out-bound
dividends
Refund of excess WHT charged
Total
As a share of GDP
Group 1 (Belgium, Czech Rep.) 0 -677 0 0 -677 -0.14% Group 2 (Austria, Denmark, Estonia, Finland, France, Germany, Luxembourg, Netherlands, Portugal, Spain, Sweden) -89 -1,383 0 0 -1,472 -0.02% Group 3 (Bulgaria, Cyprus, Greece, Hungary, Latvia, Lithuania, Poland, Romania, Slovakia, Slovenia) -4 -2 0 0 -6 0.00% Group 4 (Ireland, Italy, Malta, UK) -651 -779 0 0 -1,429 -0.04%
Total -743 -2,841 0 0 -3,585 -0.03%
Note: All data is in million EUR. Negative numbers represent a loss of revenues compared to Option 1. E.g. a positive number in “tax relief” means that a country pays less in tax relief as compared to Option 1.
Source: Copenhagen Economics.
Impact on EU investors’ tax burdens
The reduction of the investors’ tax burden shows the same picture as the reduction in reve-
nue of the different governments. This implies that there is only very limited transfer of tax
revenues between Member States, but a “transfer” of €3,585 million from governments to
investors, cf. Table 3.5. This “transfer” includes among others juridical double taxation and
foregone tax relief, which in a sense could be said to have belonged to investors in the first
place.

Taxation of cross-border dividend payments within the EU
64
Table 3.5 Tax burden of investors under Option 3 (compared to the current situation)
Tax burden in the residence country
Tax burden in the source country
Tax burden
Country Taxes on divi-dend in-come
Tax relief WHT paid on dividend payments
Refund of excess
WHT paid abroad
Total
As a share of GDP
Group 1 (Belgium, Czech Rep.) 0 677 0 0 677 0.14% Group 2Group 2Group 2Group 2 (Austria, Denmark, Estonia, Finland, France, Germany, Luxembourg, Netherlands, Portugal, Spain, Sweden) 89 1,383 0 0 1,472 0.02% Group 3 (Bulgaria, Cyprus, Greece, Hungary, Latvia, Lithuania, Poland, Romania, Slovakia, Slovenia) 4 2 0 0 6 0.00% Group 4 (Ireland, Italy, Malta, UK) 651 779 0 0 1,429 0.04%
Total 743 2,841 0 0 3,585 0.03%
Note: All data is in million EUR. Negative numbers mean that investors will pay more taxes than compared to Option 1. A positive number in WHT paid means that investors pay less WHT taxes.. Refund of excess WHT is assumed to be 70 per cent of excess WHT collected.
Source: Copenhagen Economics.
The tax burden of different investor types in the different Member States is given in Table
3.6.

Taxation of cross-border dividend payments within the EU
65
Table 3.6 Tax burden by investor type, Option 3 (compared to the current situation)
Member State
Change in tax income for MS
Individuals Non-
financial companies
Insurance companies and pension
funds
CIVs
Banks and other
financial institutions
Austria -41 -1 0 0 -41 0
Belgium -654 -139 -19 -112 -230 -155
Bulgaria -1 0 0 0 0 0
Cyprus 0 0 0 0 0 0
Czech Rep. -23 0 -17 -3 -2 -1
Denmark -56 0 0 0 -56 0
Estonia 0 0 0 0 0 0
Finland 0 0 0 0 0 0
France -254 0 0 0 -254 0
Germany -195 0 -10 -11 -166 -9
Greece 0 0 0 0 0 0
Hungary -3 0 0 -1 -1 0
Ireland -153 0 -2 -19 -132 0
Italy -533 -34 -5 -198 -7 -290
Latvia 0 0 0 0 0 0
Lithuania 0 0 0 0 0 0
Luxembourg -733 0 -4 -2 -727 0
Malta 0 0 0 0 0 0
Netherlands -85 3 0 0 -89 0
Poland -1 0 0 0 -1 0
Portugal 0 0 0 0 0 0
Romania 0 0 0 0 0 0
Slovak Rep. 0 0 0 0 0 0
Slovenia 0 0 0 0 0 0
Spain -24 0 0 0 -24 0
Sweden -83 0 0 -34 -49 0
UK -743 0 0 -544 -169 -30
Total -3,585 -172 -57 -923 -1,948 -485
Note: All data is in million EUR. The tax income and tax burden for investors do not sum for each country, since the government of a country may collect more or less revenue than the investors of this country pays in taxes.
Data for Malta is incomplete and cannot be used to draw conclusions. The numbers in the table reflect the derived effects from the changes in other countries dividend flows.
Source: Copenhagen Economics.

Taxation of cross-border dividend payments within the EU
66
Impacts on EU investors' compliance costs and Member States’ administrative costs
Compliance costs for investors will remain unchanged. Tax systems in the source and resi-
dence countries will not be simplified and no information exchange is involved, hence the
administrative costs to the Members States are not reduced. However, the investor will have
an increased incentive to report dividend income in order to obtain "full" credit for with-
holding taxes paid abroad. This is likely to improve investors’ tax-compliance.
3.3. OPTION 4: NET RATHER THAN GROSS TAXATION IN THE SOURCE COUNTRY A way to remedy the problem of “over-taxation” would be for the source country to limit its
taxation in such cases. In such a solution, the source country would be required to tax a net
rather than gross amount of dividend. This could be done by setting the same proportion of
tax free allowances against the dividend as would be set off if the investor was resident in the
source country and subject to full taxation in that country.
It is very difficult to estimate the extent of this problem as it is highly linked to the overall
income position of individual investors. The problem depends on two factors: First, the do-
mestic effective taxation of dividends in the residence country may be below the rate of the
source withholding tax. Second, the overall amount of dividend income of the relevant re-
ceiving investor is so low that that it falls below thresholds for the application of the (lowest)
rate of taxation of dividends. As a consequence, the potential to off-set source tax against
domestic taxation of dividends cannot be (fully) exploited. We have only identified UK, Ire-
land and Luxembourg as having progressive taxation starting from zero and the lowest effec-
tive tax rate for dividend income exceeds the WHT rate levied in the source country in near-
ly all countries cf. Table 3.7.

Taxation of cross-border dividend payments within the EU
67
Table 3.7 Taxes faced by investors in source and residence countries
Country
Weighted source
treaty rates faced by
Individuals
Domestic dividend
tax for Individuals
Weighted source
treaty rates faced
by companies
Domestic
corporate in-
come tax rate
Austria 11 25 9 25
Belgium 13 15 14 34
Bulgaria 6 5 6 10
Cyprus 11 15 8 10
Czech Rep. 11 15 11 15
Denmark 9 32 10 25
Estonia 14 0 13 21
Finland 9 28 8 26
France 11 19 10 34.43
Germany 10 26.375 11 10
Greece 11 40 11 24
Hungary 12 30 12 10
Ireland 9 20 8 12.5
Italy 10 12.5 12 1.375
Latvia 15 10 15 15
Lithuania 15 20 15 15
Luxembourg 13 15 9 14.4
Malta 13 15 6 35
Netherlands 10 27.5 10 22.5
Poland 11 19 11 19
Portugal 8 21.5 8 25
Romania 6 16 6 16
Slovak Rep. 10 19 0 19
Slovenia 14 20 13 20
Spain 11 20 10 30
Sweden 11 30 11 26.3
UK 11 25 12 0
Source: Copenhagen Economics based on PWC World Summary Tables.
Due to the observations above, this option will be discussed only qualitatively and includes
the following elements:
� For individuals: One way of implementing this option could be if the taxpayer's as-
sessment is done in the residence country. Subsequently, the taxpayer will have to
present to the source country the assessment from his residence country and claim
the source country to tax him accordingly, which means that the WHT in the
source country would be limited to the individual average tax rate applied in the
investor's residence country.
Taxation of cross-border dividend payments within the EU
68
� An alternative could be for the taxpayer to declare his worldwide income in the
source country and let it calculate his tax burden according to its domestic tax rules
and subsequently allow it to tax only the proportion of the income attributable to
the source country. The taxpayer will still have to declare his income and pay tax in
the residence country.
� This alternative is by its nature not applicable to companies with portfolio share-
holdings. For companies it would be unjustifiable to try and develop a new con-
cept, which is completely different than the one already in place in the Parent-
Subsidiary Directive.
Advantages:
� Would eliminate the problem of discrimination from the perspective of the source
country.
� Reduction or elimination of juridical double taxation, caused by the amount of
withholding taxes levied by the source country being higher than the tax levied on
the same dividend in the investor's residence country.
� No need to amend existing Double Taxation Conventions (tax relief could be pro-
vided by the source or residence country on a unilateral basis).
� Increase in tax revenue for the residence countries which would have to provide
lower credits for the reduced WHT levied by the source country.
Disadvantages:
� Huge administrative costs associated with the exchange of tax information between
countries. Not only dividend tax information but information on investors’ entire
tax liabilities would need to be exchanged between all Member States.
� Huge compliance costs for investors who should declare their worldwide income in
the source country.
� Investors would still have to claim double tax relief to eliminate juridical double
taxation. As many types of compliance costs are fixed (see previous chapter) merely
reducing withholding tax rates will not significantly reduce compliance costs.
� Lower tax revenues in the source country.
� Practical difficulties particularly if the costs had to be calculated on an individual
basis, but perhaps there would be scope for a 'pro rata' calculation (as would be the
case in the residence country when calculating the tax credit in respect of foreign
source dividends).
� The option does not address economic double taxation.
3.4. OPTION 5: GENERAL EU-WIDE REDUCED WHT RATE WITH INFORMATION
EXCHANGE Under this option a reduced rate of withholding tax will be applied under the precondition
that the recipient agrees to information exchange (the Neumark solution). If the recipients
do not opt for automatic exchange of information, then a substantially higher WHT rate

Taxation of cross-border dividend payments within the EU
69
(the source country’s standard rate) will be applied on their dividend income in the source
country. The reduced WHT rate is fixed at 7.5 per cent since this is around half of the most
commonly applied DTC rate for portfolio investors. Option 5 could therefore be seen as a
compromise between the current situation (Option 1) and the abolition of withholding taxes
on dividends (Option 2).
This option could be implemented in the following way:
� Non-treaty WHT rates are reduced to 7.5 per cent for all types of investors who
agree to information exchange. Existing rates lower than 7.5 per cent will remain in
place.
� The reduced withholding tax rate will be applied at source (as opposed to by means
of refund procedures), when investors agree to information exchange.
� We assume that 80 per cent of the investors would agree to information exchange
in which case there will be relief at source and no excess withholding taxes will be
collected in the source country. The remaining 20 per cent (that do not agree to in-
formation exchange) will pay the non-reduced non-treaty rate and may thus face
excess withholding taxes. The choice of opting for information exchange will be
most relevant for investors that receive large amounts of dividend income, and face
high treaty rates, face large differences between the treaty and the non-treaty rate in
the countries that do not offer relief at source, are taxed lightly on their dividend
income in the residence country, and/or receive full relief of WHT paid abroad.
� There will be ordinary tax credit relief in the country of residence
Advantages:
� Reduces juridical double taxation. There may still be juridical double taxation if
residence countries have domestic income tax rates lower than 7.5 per cent. The tax
burden of investors will be reduced.
� Reduces discrimination of dividend income earned abroad.
� Possibilities of tax evasion/avoidance will be eliminated for investors who opt for
information exchange due to the better information available by tax administra-
tions.
� Increased tax revenues for the residence countries that will have to provide a lower
amount of tax relief for the reduced WHT rate levied by the source country.
� Taxing rights of the source country will not be completely eliminated.
Disadvantages:
� There will be costs related to the introduction of automatic exchange of infor-
mation, i.e. standardised forms, formats and channels of communication, etc.
� Loss of withholding tax revenues for source countries due to the reduced WHT
rate for investors opting for information exchange.
� The choice between two co-existing procedures (higher rate if no information ex-
change and lower if information exchange) might lead to further costs for tax ad-
ministrations and intermediaries.

Taxation of cross-border dividend payments within the EU
70
� The problem of juridical double taxation is reduced or eliminated but economic
double taxation is not addressed.
� Impact on Double Tax Conventions.
Impact on Member States' tax revenues
Option 5 will have a relatively equal impact on tax revenues across country groups. While
Group 4 and 2 will gain a little revenue (€58 and €423 million respectively) by not having
to offer as much tax relief on foreign WHT, the same countries lose even more revenue
(€138 and €2,380 million respectively) from the reduction in withholding taxes, cf. Table
3.8. Group 1 also lose a little revenue due to the lowering of WHT rates. Conversely, coun-
tries in Group 3 actually gain a little revenue since the need to relief WHT abroad is re-
duced.
Since investors pay less WHT, residence states need to offer less tax relief hence increasing
revenue from this source. However, since WHT rates are reduced this decreases revenue
from outgoing dividends. Due to the large amount of investors opting for information ex-
change, the amount of excess WHT is reduced and the refunded amount is therefore also
reduced, implying an increase in revenue. Note that this also affects income from WHT
since countries that used to offer relief by refund (and hence levy the non-treaty rate) now
offers relief at source (and hence levy the lower treaty-rate).
Table 3.8 Impact of Option 5 on tax revenues (compared to the current situation)
Net income from taxation of inbound dividends
Net income from WHT on outbound dividends
Tax revenue impact
Country Income
from taxes on inbound dividends
Tax relief offered res-ident inves-
tors
Income from WHT on out-bound
dividends
Refund of excess WHT charged
Total
As a share of GDP
Group 1 (Belgium, Czech Rep.) 0 0 -40 4 -35 -0.01% Group 2 (Austria, Denmark, Estonia, Finland, France, Germany, Luxembourg, Netherlands, Portugal, Spain, Sweden) 95 423 -2,380 222 -1,640 -0.02% Group 3 (Bulgaria, Cyprus, Greece, Hungary, Latvia, Lithuania, Poland, Romania, Slovakia, Slovenia) 1 6 -1 1 8 0.00% Group 4 (Ireland, Italy, Malta, UK) 2 58 -138 0 -78 0.00%
Total 99 487 -2,558 227 -1,746 -0.01%
Note: All data is in million EUR. Negative numbers represent a loss of revenues compared to Option 1. E.g. a positive number in “tax relief” means that a country pays less in tax relief as compared to Option 1.
Source: Copenhagen Economics.
Impact on EU investors’ tax burdens
All investors will experience a lower (or unchanged) tax burden under Option 5 relative to
Option 1 and the total reduction in the tax burden is 1.746 million, cf. Table 3.9, which is a

Taxation of cross-border dividend payments within the EU
71
reduction of the total tax burden of app. 22 per cent. It is mainly the investors in Group 1
countries who stand to gain relatively because their WHT burden is reduced. The WHT
burden for investors in the other countries is also reduced, however the net gain is lower
since the relief for source WHT is reduced in parallel.
Table 3.9 Tax burden of investors under Option 5 (compared to the current situation)
Tax burden in the residence country
Tax burden in the source country
Tax burden
Country Taxes on dividend income
Tax relief WHT paid on dividend payments
Refund of excess
WHT paid abroad
Total
As a share of GDP
Group 1 (Belgium, Czech Rep.) 0 0 357 -37 320 0.07% Group 2 (Austria, Denmark, Esto-nia, Finland, France, Germany, Luxembourg, Netherlands, Portugal, Spain, Sweden) -95 -423 1,365 -112 735 0.01% Group 3 (Bulgaria, Cyprus, Greece, Hungary, Latvia, Lithua-nia, Poland, Romania, Slovakia, Slovenia) -1 -6 13 -2 4 0.00% Group 4 (Ireland, Italy, Malta, UK) -2 -58 823 -77 687 0.02%
Total -99 -487 2,558 -227 1,746 0.01%
Note: All data is in million EUR. Negative numbers mean that investors will pay more taxes than compared to Option 1. A positive number in WHT paid means that investors pay less WHT taxes.. Refund of excess WHT is assumed to be 70 per cent of excess WHT collected.
Source: Copenhagen Economics.
The tax burden of different investor types in the different Member States are given in Table
3.10.

Taxation of cross-border dividend payments within the EU
72
Table 3.10 Tax burden by investor type, Option 5 (compared to the current situation)
Member State
Change in tax income for MS
Individuals Non-
financial companies
Insurance companies and pension
funds
CIVs
Banks and other
financial institutions
Austria -15 -1 0 -1 -21 0
Belgium -30 -61 -8 -49 -126 -68
Bulgaria 0 0 0 0 0 0
Cyprus 0 0 0 0 0 0
Czech Rep. -6 0 -5 -1 -1 0
Denmark 4 0 0 -1 -27 -1
Estonia -1 0 0 0 0 0
Finland -25 0 0 -1 0 0
France -434 -2 -1 -5 -122 -7
Germany -587 -1 -8 -9 -57 -7
Greece 11 0 0 0 0 0
Hungary 4 0 0 -1 -1 0
Ireland -203 0 -2 -7 -63 0
Italy 125 -29 -2 -92 -4 -135
Latvia 0 0 0 0 0 0
Lithuania 0 0 0 0 0 0
Luxembourg -402 0 -6 -2 -350 -1
Malta 0 0 0 0 0 0
Netherlands -15 0 0 -1 -45 -4
Poland -7 0 0 0 0 0
Portugal -16 0 0 0 0 0
Romania 0 0 0 0 0 0
Slovak Rep. 0 0 0 0 0 0
Slovenia 0 0 0 0 0 0
Spain -123 -2 0 0 -12 0
Sweden -27 -2 0 -14 -21 0
UK 0 0 0 -263 -74 -14
Total -1,746 -99 -34 -450 -923 -239
Note: All data is in million EUR. The tax income and tax burden for investors do not sum for each country, since the government of a country may collect more or less revenue than the investors of this country pays in taxes.
Data for Malta is incomplete and cannot be used to draw conclusions. The numbers in the table reflect the derived effects from the changes in other countries dividend flows.
Source: Copenhagen Economics.

Taxation of cross-border dividend payments within the EU
73
Impacts on EU investors' compliance costs and Member States’ administrative costs
Overall, we expect that 80 per cent of total investments will be undertaken under infor-
mation exchange. Opting for information exchange will benefit the investors as they will be
entitled to the reduced rate which will be applied directly at source. Besides from paying a
lower tax rate, investors will only have to meet the documentation requirements related to
relief at source. There will be no liquidity costs, no administrative costs of refund, and there
will be no foregone tax refund. Compliance costs related to obtaining relief at source will not
be completely removed since the investor will still need to prove being eligible for the re-
duced rate. However, the use of standardised investor-self documentation (as opposed to res-
idence certificates) will minimise these costs. The same conclusions are valid for compliance
costs borne by financial intermediaries. If forms are standardised and made electronic, we
expect compliance costs to be reduced by 50 per cent.45
In the cases where the investor does not agree to information exchange (we assume 20 per
cent of total investments), the investor will still face compliance and liquidity costs as in the
current situation.
Regarding the system of automatic information exchange, there will be start-up costs related
to introducing the system. Besides from reducing compliance costs for investors, such a sys-
tem will enhance co-operation between tax authorities as well as enhancing investors’ tax-
compliance in the residence country.
3.5. OPTION 6: LIMITED TAXATION OF DIVIDEND INCOME AND CREDIT FOR COR-
PORATE TAX The non-treaty WHT rate is reduced to 7.5 per cent as in Option 5 for all investors, howev-
er there is no information exchange system and investors in some countries will still need to
apply for relief by refund. Countries that have a lower WHT in place are assumed to main-
tain this rate. In the case where the residence country exempts dividend income, the final tax
burden will be equal to the underlying corporate tax paid in the source country and WHT
levied in the source country. In the case where the residence country applies the credit
method to relieve double taxation, the residence country shall:
a) Levy income tax as under normal circumstances.
b) Provide full credit for the WHT levied in the source country (no cap, hence resi-
dent investors may receive a payment from the residence country).
c) Provide ordinary tax credit for the corporate tax paid in the source country. The
amount of credit will be capped at a level which depends on the investor type:
a. Companies and CIVs: Cap is the residence corporate income tax
b. Individuals: Cap is the individual dividend income tax rate
45 See European Commission (2010).

Taxation of cross-border dividend payments within the EU
74
This option could be implemented in the following way:
� Non-treaty WHT rates are reduced to a maximum rate of 7.5 per cent for all types
of investors.
� Residence countries with a tax credit system provide full credit (no limit) for with-
holding taxes, and ordinary tax credit for underlying corporate taxes paid in the
source country (limited to the corporate tax rate for companies, and the average in-
come tax rate for individuals in the residence country).
� In residence countries with a tax exemption system the final tax burden will be
equal to the underlying corporate tax and WHT levied in the source country.
� The system of relief for excess charged WHT in the source country is unchanged,
i.e. countries provide relief at source or relief by refund as in the current situation.
Advantages:
� Economic double taxation as well as juridical double taxation would be reduced or
eliminated since the residence country provides full credit/exemption for the un-
derlying CIT paid abroad.
� Since there is no limit to the tax credit/exemption for withholding taxes levied
abroad the incentive for tax evasion/avoidance is reduced.
� Tax revenues from cross-border dividends will be shared between the source and
the residence country.
� The limited credit or exemption for underlying tax in the country of residence
would, in effect, involve a system similar to that applicable on a more comprehen-
sive basis to direct investors under the Parent-Subsidiary Directive. Distortions be-
tween the different types of equity investments are therefore eliminated.
Disadvantages:
� By making the residence countries provide credit for the corporate tax paid abroad
economic double taxation is reduced/ eliminated for cross-border investments.
However, this would introduce a significant distortion between foreign investments
and domestic investments, since most Member States do not give credit for corpo-
rate tax paid domestically.
� (Resident) countries will lose significant tax revenue due to the credit offered to re-
lief the corporate tax paid in the source country, and de facto finance foreign coun-
tries corporate taxation associated with cross border dividend flows.
� In the case where there is no relief at source there will still be compliance costs
linked to filing for a refund of excess charged WHT.
� It is very difficult practically to establish the underlying CIT in the source country,
especially in the case of multinational companies.
� Double Tax Conventions would have to be amended.
Impact on Member States' tax revenues
All country groups lose tax revenues from this option. The total loss in revenue amounts to
app. €5,300 million, cf. Table 3.11, amounting to app. 65 per cent of total WHT revenue.

Taxation of cross-border dividend payments within the EU
75
This is so because all non-treaty withholding taxes are reduced while at the same time coun-
tries of residence are required to grant full credit (no limit) for withholding taxes paid
abroad. Moreover residence countries are required to provide tax credit for corporate taxes
paid abroad. This reduction in revenue is unique to Option 6.
Note also that since non-treaty rates are reduced to 7.5 per cent, there will be a further re-
duction in the WHT income for countries that grant relief by refund, since these countries
will no longer levy a high non-treaty rate. Moreover, less excess tax will be collected and the
refund of these will therefore also decrease.
Relatively, most of these costs are borne by the countries in Group 1, where tax revenues are
reduced by 0.16 per cent of GDP (€780 million). Countries in Group 2 and 4 suffer a reve-
nue loss of 0.05 and 0.03 per cent of GDP respectively (€3,604 and €844 million respective-
ly). As in Option 3, Group 4 loses revenue (€298 million) from domestic dividend income
taxes, since the option involves full exemption for dividends earned abroad.
Table 3.11 Impact of Option 6 on tax revenues (compared to the current situation)
Net income from taxation of in-bound dividends
Net income from WHT on outbound divi-
dends Tax revenue impact
Country Income from tax-es on
inbound dividends
Tax relief offered to resident investors
Tax credit for company taxation
Income from WHT on out-
bound div-idends
Refund of
excess WHT charged
Total
As a share of GDP
Group 1 (Belgium, Czech Rep.) 0 -398 -338 -49 5 -780 -0.16% Group 2 (Austria, Denmark, Esto-nia, Finland, France, Germany, Luxembourg, Netherlands, Portugal, Spain, Sweden) 43 -77 -1,112 -2,736 277 -3,604 -0.05% Group 3 (Bulgaria, Cyprus, Greece, Hungary, Latvia, Lithua-nia, Poland, Romania, Slovakia, Slovenia) -1 6 -20 -14 3 -26 0.00% Group 4 (Ireland, Italy, Malta, UK) -298 -317 -78 -152 0 -844 -0.03%
Total -255 -785 -1,548 -2,951 285 -5,254 -0.04%
Note: All data is in million EUR. Negative numbers represent a loss of revenues compared to Option 1. E.g. a positive number in “tax relief” means that a country pays less in tax relief as compared to Option 1.
Source: Copenhagen Economics.
Impact on EU investors’ tax burdens
Investors will have their tax burden reduced in parallel to the loss of tax revenue by govern-
ments. This option however introduces some transfers between Member States since the in-
vestors of some country groups (such as Group 1 and 4) will see a larger reduction in the tax
burden than governments of Group 1 will lose tax revenues. Governments of Group 2 will
lose tax revenues of 0.05 per cent of GDP but the investors of countries in Group 2 will only
have their tax burden reduced by 0.04 per cent of GDP. The large transfers are due to the
nature of Option 6 where governments must compensate investors for the corporate taxes
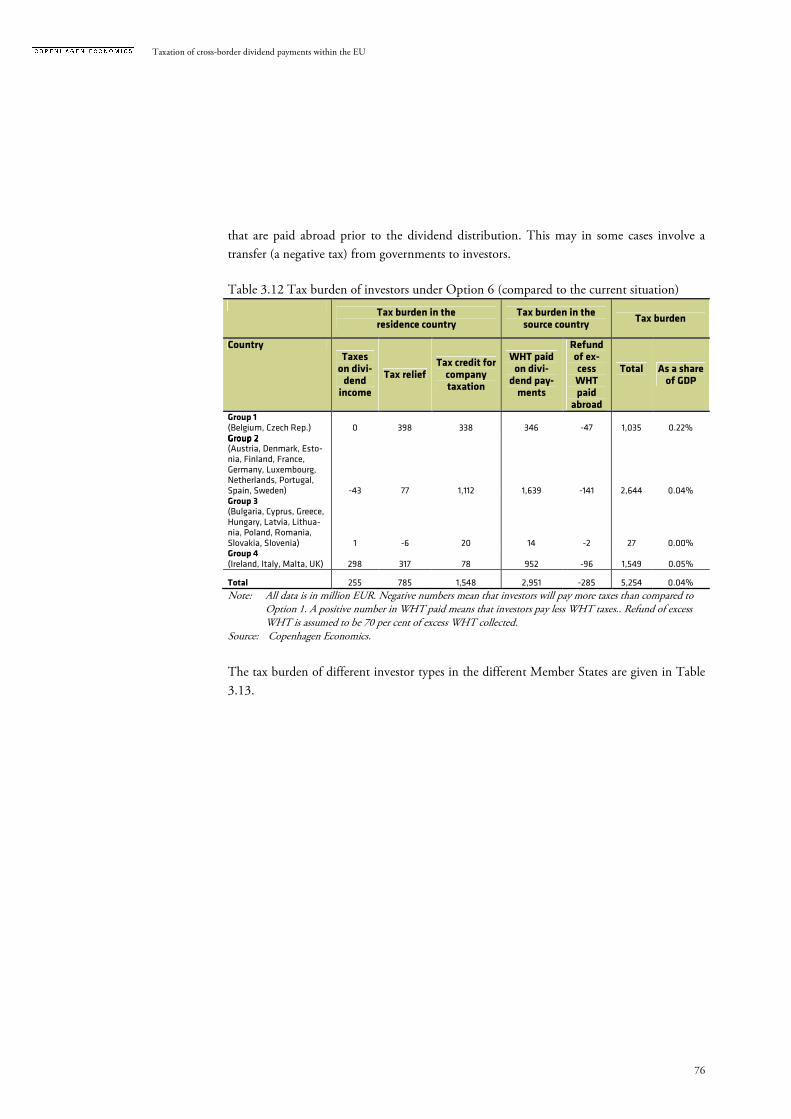
Taxation of cross-border dividend payments within the EU
76
that are paid abroad prior to the dividend distribution. This may in some cases involve a
transfer (a negative tax) from governments to investors.
Table 3.12 Tax burden of investors under Option 6 (compared to the current situation)
Tax burden in the residence country
Tax burden in the source country
Tax burden
Country Taxes on divi-dend income
Tax relief Tax credit for company taxation
WHT paid on divi-dend pay-ments
Refund of ex-cess WHT paid abroad
Total
As a share of GDP
Group 1 (Belgium, Czech Rep.) 0 398 338 346 -47 1,035 0.22% Group 2Group 2Group 2Group 2 (Austria, Denmark, Esto-nia, Finland, France, Germany, Luxembourg, Netherlands, Portugal, Spain, Sweden) -43 77 1,112 1,639 -141 2,644 0.04% Group 3 (Bulgaria, Cyprus, Greece, Hungary, Latvia, Lithua-nia, Poland, Romania, Slovakia, Slovenia) 1 -6 20 14 -2 27 0.00% Group 4 (Ireland, Italy, Malta, UK) 298 317 78 952 -96 1,549 0.05%
Total 255 785 1,548 2,951 -285 5,254 0.04%
Note: All data is in million EUR. Negative numbers mean that investors will pay more taxes than compared to Option 1. A positive number in WHT paid means that investors pay less WHT taxes.. Refund of excess WHT is assumed to be 70 per cent of excess WHT collected.
Source: Copenhagen Economics.
The tax burden of different investor types in the different Member States are given in Table
3.13.

Taxation of cross-border dividend payments within the EU
77
Table 3.13 Tax burden by investor type, Option 6 (compared to the current situation)
Member State
Change in tax income for MS
Individuals Non-
financial companies
Insurance companies and pension
funds
CIVs
Banks and other
financial institutions
Austria -62 -2 -4 -14 -41 -3
Belgium -731 -146 -40 -237 -230 -331
Bulgaria -1 0 0 -1 0 0
Cyprus -1 0 0 0 0 0
Czech Rep. -49 0 -40 -6 -2 -2
Denmark -62 -1 -6 -24 -60 -14
Estonia -2 0 0 0 0 0
Finland -77 0 0 -28 0 -21
France -963 -3 -30 -112 -255 -154
Germany -875 -1 -30 -32 -167 -27
Greece 4 0 0 0 0 -1
Hungary -5 0 0 -5 -2 0
Ireland -227 0 -7 -20 -133 -25
Italy -228 -37 -5 -220 -7 -323
Latvia 0 0 0 0 0 0
Lithuania -1 0 0 0 0 0
Luxembourg -925 0 -28 -242 -729 -118
Malta 0 0 0 0 0 0
Netherlands -286 1 -4 -42 -89 -151
Poland -20 0 0 -9 -1 -2
Portugal -37 0 -8 -12 0 -11
Romania -1 0 0 0 0 0
Slovak Rep. 0 0 0 0 0 0
Slovenia -1 0 0 -1 0 0
Spain -214 -2 -13 -10 -24 -20
Sweden -100 -2 -4 -37 -49 -18
UK -389 0 0 -570 -170 -31
Total -5,254 -194 -222 -1.626 -1,959 -1,253
Note: All data is in million EUR. The tax income and tax burden for investors do not sum for each country, since the government of a country may collect more or less revenue than the investors of this country pays in taxes.
Data for Malta is incomplete and cannot be used to draw conclusions. The numbers in the table reflect the derived effects from the changes in other countries dividend flows.
Source: Copenhagen Economics.

Taxation of cross-border dividend payments within the EU
78
Impacts on EU investors' compliance costs and Member States’ administrative costs
Since non-treaty rates are reduced to 7.5 per cent, the cost related to relief by refund are
greatly reduced. This is since excess collected withholding taxes will only occur when the bi-
lateral treaty rate is below 7.5 per cent and the source country does not offer relief at source.
Hence compliance cost of applying for a refund and the liquidity costs associated with excess
withholding taxes are reduced. The compliance costs associated documentation requirements
etc is not reduced.
Since fewer reclaim applications will be filed, Member States’ administration costs associated
with this will be reduced. Administration costs associated with relief at source and giving re-
lief to domestic residents is unchanged. Moreover, there will be improved compliance and
the incentive for tax evasion will be reduced since the possibility of refund of the underlying
CIT provides an economic incentive to comply.
3.6. OPTION 7: NO WHT AND NO INCOME TAX ON CROSS-BORDER DIVIDENDS
Advantages:
� No compliance or administrative cost.
� No juridical or economical double taxation
� No discrimination of outbound dividends and no distortion of location choice of
investors
� Increased volume of equity investments and better allocation of capital.
Disadvantages:
� Loss of revenue for Member States.
� By making the residence countries exempt inbound dividends economic double
taxation is eliminated for cross-border investments. However, this would introduce
a significant distortion between foreign investments and domestic investments,
since most Member States do not give credit for corporate tax paid domestically.
Impact on Member States' tax revenues
When there is no WHT in the source country and no taxation of foreign dividend income
in the residence country, cross-border dividend payments will not be taxed at all. The under-
lying company profits giving rise to the dividend payments have still been collected however.
This means that all countries will lose the tax revenue collected on both inbound dividends
and from withholding taxes levied on outbound dividend payments, equal in total to more
than €8 billion (0.07 per cent of GDP), cf. Table 3.14. Note that Option 7 presents a mir-
ror image of Option 1, since all income in Option 1 is abandoned in Option 7.
Note that the impact of implementing Option 7 on tax revenues will be dependent not only
on dividend flows and WHT rates but also on the national income taxation rate. This adds a
third dimension which makes the two-dimensional country-grouping a little less illustrative.

Taxation of cross-border dividend payments within the EU
79
Table 3.14 Impact of Option 7 on tax revenues (compared to the current situation)
Net income from taxation of inbound dividends
Net income from WHT on outbound dividends
Tax revenue impact
Country Income from taxes
on inbound dividends
Tax relief offered
resident in-vestors
Income from WHT on out-bound
dividends
Refund of excess WHT charged
Total
As a share of GDP
Group 1 (Belgium, Czech Rep.) -837 0 -151 5 -983 -0.21% Group 2Group 2Group 2Group 2 (Austria, Denmark, Estonia, Finland, France, Germany, Luxembourg, Netherlands, Portugal, Spain, Sweden) -2,994 1,122 -5,045 277 -6,640 -0.09% Group 3 (Bulgaria, Cyprus, Greece, Hungary, Latvia, Lithuania, Poland, Romania, Slovakia, Slovenia) -33 18 -43 2 -56 -0.01% Group 4 (Ireland, Italy, Malta, UK) -220 183 -327 0 -365 -0.01%
Total -4,085 1,323 -5,566 284 -8,044 -0.07%
Note: All data is in million EUR. Negative numbers represent a loss of revenues compared to Option 1. E.g. a positive number in “tax relief” means that a country pays less in tax relief as compared to Option 1.
Source: Copenhagen Economics.
Impact on EU investors’ tax burdens
In parallel to the reduction in tax revenue, the tax burden of investors is also reduced by app.
€8 billion. Investors in Group 1 will gain relatively the most (0.32 per cent of GDP) since a
reduction in WHT is of more value to these investors due to the low rate of domestic relief.
Investors in Group 2 and 4 will gain 0.07 and 0.05 per cent of GDP respectively, cf. Table
3.15, while the impact on Group 3 is negligible.

Taxation of cross-border dividend payments within the EU
80
Table 3.15 Tax burden of investors under Option 7 (compared to the current situation)
Tax burden in the residence country
Tax burden in the source country
Tax burden
Country WHT paid on
dividend payments
Refund of excess WHT paid abroad
WHT paid on dividend payments
Refund of excess
WHT paid abroad
Total
As a share of GDP
Group 1 (Belgium, Czech Rep.) 837 0 744 -47 1,534 0.32% Group 2 (Austria, Denmark, Esto-nia, Finland, France, Germany, Luxembourg, Netherlands, Portugal, Spain, Sweden) 2,994 -1,122 2,989 -140 4,721 0.07% Group 3 (Bulgaria, Cyprus, Greece, Hungary, Latvia, Lithua-nia, Poland, Romania, Slovakia, Slovenia) 33 -18 33 -2 46 0.00% Group 4 (Ireland, Italy, Malta, UK) 220 -183 1,801 -96 1,743 0.05%
Total 4,085 -1,323 5,566 -284 8,044 0.07%
Note: All data is in million EUR. Negative numbers mean that investors will pay more taxes than compared to Option 1. A positive number in WHT paid means that investors pay less WHT taxes.. Refund of excess WHT is assumed to be 70 per cent of excess WHT collected.
Source: Copenhagen Economics.
The tax burden of different investor types in the different Member States are given in Table
3.16. Note that this is just a mirror image of Option 1.

Taxation of cross-border dividend payments within the EU
81
Table 3.16 Tax burden by investor type, Option 7 (compared to the current situation)
Member State Total tax income for MS
Individuals Non-
financial companies
Insurance companies and pen-sion funds
CIVs
Banks and other
financial institutions
Austria -105 -39 -7 -28 -41 -5
Belgium -940 -292 -63 -376 -230 -521
Bulgaria 0 0 0 -1 0 0
Cyprus 0 0 0 -1 0 0
Czech Rep. -43 0 -41 -7 -2 -2
Denmark -104 -25 -11 -55 -60 -25
Estonia -3 0 0 -1 0 0
Finland -186 -15 -1 -80 0 -31
France -1,726 -55 -79 -312 -255 -405
Germany -1,887 -821 -39 -43 -167 -36
Greece -7 0 -1 0 0 -3
Hungary -7 -6 0 -6 -2 0
Ireland -273 -2 -27 -20 -133 -3
Italy -91 -225 -5 -222 -7 -325
Latvia 0 0 0 0 0 0
Lithuania -1 0 0 0 0 0
Luxembourg -1,114 -4 -84 -30 -729 -8
Malta -1 0 0 -1 0 -1
Netherlands -698 -162 -9 -115 -89 -314
Poland -36 -5 -1 -11 -1 -2
Portugal -65 0 -15 -22 0 -20
Romania -1 0 0 0 0 0
Slovak Rep. 0 0 0 0 0 0
Slovenia -3 -1 0 -2 0 0
Spain -474 -87 -24 -21 -27 -37
Sweden -276 -154 -8 -38 -49 -38
UK 0 0 0 -570 -170 -31
Total -8,044 -1,894 -416 -1,964 -1,962 -1,808
Note: All data is in million EUR. The tax income and tax burden for investors do not sum for each country, since the government of a country may collect more or less revenue than the investors of this country pays in taxes.
Data for Malta is incomplete and cannot be used to draw conclusions. The numbers in the table reflect the derived effects from the changes in other countries dividend flows.
Source: Copenhagen Economics.
Impacts on EU investors' compliance costs and Member States' administrative costs
The compliance and liquidity costs faced by investors will practically be reduced to zero,
since no excess WHT need to be reclaimed and no documentation requirements is needed
with respect to relief at source. Moreover, the administration costs for Member States are al-

Taxation of cross-border dividend payments within the EU
82
so greatly reduced, since the system of providing relief to residents no longer need to be in
place.
3.7. SUMMING UP THE ECONOMIC IMPACTS OF PROPOSED OPTIONS In this section we summarise the budgetary impacts and the compliance costs related to each
of the proposed options. Three other points are worth emphasising:
� Option 6 and 7 are the only options which solve the economic double taxation
problem. However, one should keep in mind that portfolio equity investors who
invest domestically normally also face economic double taxation. As a consequence,
Option 6 and 7 would positively discriminate cross-border investors compared to
domestic investors unless economic double taxation was also addressed for domes-
tic investments.
� With regard to Option 7, it must be noted that CIT rates are usually lower than
the marginal PIT rates.
� Many of the options involve significant reductions in investors’ tax liabilities.
However, in order to also reduce compliance and liquidity costs it is important that
withholding tax relief is granted at source, that procedures are standardised and
electronic, and that investors could prove their entitlement to tax relief by provid-
ing standardised investor-self documentation.
Impact on juridical double taxation
As mentioned in relation to the different options, juridical double taxation is affected in dif-
ferent ways by the different solutions. Some options reduce double taxation by reducing or
abolishing WHT rates, while other options reduce double taxation by increasing domestic
relief.
Juridical double taxation in the current situation amounts to €3,709 million, cf. Table 3.17.
Option 5 will reduce double taxation partly to €1,961 million, while Option 3 almost elim-
inates juridical double taxation to €122 million. All other options will eliminate juridical
double taxation completely. Option 2 and 7 achieves this by abolishing withholding taxes,
whereas Option 3 reduces double taxation by increasing domestic relief. Option 6 uses a
combination of both elements. Option 3 does not eliminate juridical double taxation com-
pletely since there will still be collected excess withholding taxes in countries with relief by
refund, which will not all be reclaimed and therefore count as double taxation.46 Compared
to the current situation, option 3 almost fully eliminates juridical doublet taxation.
46 Note that this could also have been the case in Option 6 which neither implies relief at source. However, due to the reduction in WHT rates in option 6 there is no unreclaimed excessive withholding tax.

Taxation of cross-border dividend payments within the EU
83
Table 3.17 Quantifying juridical double taxation
Juridical double taxation
Option 1 3,709
Option 2 0
Option 3 122
Option 5 1,961
Option 6 0
Option 7 0
Note: Data is in million EUR. Member State specific data is given in Appendix Table 4.7. Source: Copenhagen Economics.
As the amount of foregone tax relief is proportional to the amount of excess collected WHT,
foregone relief varies across the different options. Option 1 and 3 implies the most foregone
tax relief of €122 million, cf. Table 3.18. As the excess collected WHT is reduced in Option
5, foregone tax relief is also reduced to €24 million. In option 2, 6 and 7, there is (almost)
no excess WHT and therefore no foregone tax relief.
Table 3.18 Foregone tax relief
million EUR Refund of excess WHT Foregone tax relief
Option 1 284 122
Option 2 0 0
Option 3 284 122
Option 5 57 24
Option 6 1 1
Option 7 0 0
Note: Refund of excess WHT and foregone tax relief is 70 and 30 per cent of excess WHT respectively. To go from column 2 to 3, one needs to multiply by 0.3/0.7.
Source: Copenhagen Economics.
Impact on Member States' tax revenues and investors’ tax burden
The proposed options have different impacts on tax revenues (and consequently on the tax
burden borne by investors), cf. Figure 3.1. Except for Option 7 (0.07 pct of GDP and €8
billion), Option 6 is by far the most costly in terms of foregone tax revenue for EU Member
States (0.04 pct of GDP and €5.2 billion) since this option involves credit for the corporate
tax paid in the source country. Option 5 is the least costly (0.01 pct of GDP and €1.7 bil-
lion) since the reduction in WHT rate is to a large degree offset by a reduced need for tax re-
lief; however this option to some extent entails a "rebalancing" of tax revenues between gov-
ernments of Group 2 to tax payers of Group 1 and 4. Option 2 and Option 3 implies a
slightly larger loss in tax revenue of 0.03 pct. of GDP equalling €3.6 and €3.7 billion respec-
tively. Note once again the symmetry between Member States’ tax revenue and investors’ tax
liabilities. This implies that every euro of foregone tax revenue is also a reduced tax burden
for investors.

Taxation of cross-border dividend payments within the EU
84
Figure 3.1 Change in tax revenue (compared to the current situation)
Note: All data is in million EUR. Source: Copenhagen Economics.
Impacts on EU investors' compliance costs and Member States' administrative costs
For some of the administrative costs for Member States and compliance costs for investors, it
is possible to quantify the size. However, for several of the administrative burdens this can-
not be done without knowledge of very detailed cost structures, which we have not found
any good documentation for. For these burdens we provide a qualitative comparison. The
reasoning for this is explained in depth in sections earlier in the chapter.
The impact on compliance costs for investors and administrative costs for Member States as-
sociated with the different options is summarised in Table 3.19.
-9.000
-8.000
-7.000
-6.000
-5.000
-4.000
-3.000
-2.000
-1.000
0Option 2 Option 3 Option 5 Option 6 Option 7

Taxation of cross-border dividend payments within the EU
85
Table 3.19 Impacts on compliance costs for investors and administration cost for Mem-
ber States
Impacts Option 2 Option 3 Option 4 Option 5* Option 6** Option 7
Impacts on investors
Liquidity costs reduced Full No No Full Full Full
Compliance costs for applying for refund reduced Full No No Full Partial Full
Compliance costs for relief at source reduced Partial No No Partial No Partial
Less foregone tax relief Full No No Full Full Full
Compliance costs of documenting WHT payments in order to receive credit in residence country re-duced
Full No No Partial No Full
Impacts on Member States
Simplification of tax system in source country Yes No No No Yes
Simplification of tax system in residence country Yes No Yes Partial Yes
Improved information exchange No No Full No No
Note: *The impacts listed under Option 5 are related to the cases where the investor agrees to information ex-change. **The impacts listed under Option 6 are related to the cases when the treaty rate is not below 7.5 per cent.
Source: Copenhagen Economics.
Based on the following assumptions we are able to quantify the impact on investors’ liquidi-
ty costs and administrative costs for applying for refund for excess collected WHT in the
source.
The liquidity cost is calculated as the alternative rate of return from investing the amount of
excess withheld taxes. In a “normal economic period” (defined as in between boom and
busts) the alternative annual rate of return on capital can be assumed to be around 4 per
cent.47 This is then multiplied by the excess withheld taxes in the various options, so that the
outcome shows what is foregone annually.
47 This rate naturally fluctuates over time.

Taxation of cross-border dividend payments within the EU
86
The administrative costs of applying for refund have been estimated to 5 per cent of the re-
fundable amount.48 We only consider 70 per cent of the refundable amount since the re-
maining 30 per cent is foregone and hence no administrative costs are thus incurred trying
to reclaim it. Both the compliance cost and the liquidity cost are, as expected, highest in Op-
tion 1 and 3, cf. Table 3.20. Liquidity costs are marginally larger than the compliance costs,
but the number appear not to be of a substantial magnitude.
Table 3.20 Quantifiable impacts on compliance cost
Impacts Option 1 Option 2 Option 3 Option 5 Option 6 Option 7
Impacts on investors
Liquidity costs 16 0 16 3 0 0
Compliance costs for applying for refund 14 0 14 3 0 0
Note: All figures are in million EUR. Liquidity cost is found by considering the total amount excess collected WHT. Compliance cost for applying for refund is found by considering the refundable amount which is 70 per cent of the excess collected WHT.
Source: Copenhagen Economics.
48 Five percent is a figure given by industry participants in the European Commission’s consultation procedure.

Taxation of cross-border dividend payments within the EU
87
The purpose of this chapter is to analyse the legal impact of the solutions on Member States'
domestic legislation, the tax treaties they have concluded, as well as on EU law and the
investors. The examination covers nine Member States (France, Germany, Ireland, Italy,
Luxembourg, the Netherlands, Spain, Sweden and the United Kingdom). These countries
have been selected in light of their size and importance in respect of intra EU dividend
flows. Together this group of countries is the recipient of 84 per cent of total inbound divi-
dend flows and the source of 95 per cent of total outbound dividend flows. The detailed
survey results can be found in Appendix 6. Moreover, the settled case law can be found in
Appendix 5.
4.1. OPTION 1: MAINTAINING THE EXISTING SITUATION
Outbound dividends
The examination of the taxation of outbound dividends includes seven Member States: Italy,
Spain, Luxembourg, the Netherlands, Germany, France and Sweden. Ireland and the United
Kingdom have not been examined under this Option because they do not levy WHT on
outbound dividends.
Economic double taxation
All of the Member States examined except Sweden apply a schedular tax system where in-
come of a company is subject to taxation at both company level and shareholder level (upon
distribution). Economic double taxation is mitigated by the shareholders being taxed at a re-
duced tax rate compared to other income. Sweden applies the classical system where income
is subject to full taxation at both levels. All of the Member States examined grant tax exemp-
tion for certain dividend payments to non-financial companies, insurance companies, pen-
sion funds and CIVs. Whether the tax systems are compatible with the EU fundamental
freedoms depends, among other things, on the tax rates, tax basis and timing of tax pay-
ments for residents and non-residents (see below).
Tax rates
Table 4.1 summarises the tax rates applicable under domestic tax law to dividends paid by
resident companies to residents (domestic dividends) and non-residents (outbound divi-
dends).
Chapter 4 THE LEGAL IMPACTS OF THE PROPOSED OPTIONS

Taxation of cross-border dividend payments within the EU
88
Table 4.1 Domestic WHT rates on dividends paid to residents and non-residents Taxpayer Italy
Spain
Luxembourg
Netherlands
Germany
France
Sweden
Individual Residents 12.5 or 11.4-21.4
19 or 21 0-21 25 or 304 26.3757 19 or 0-24.6 3016
Non-residents
12.5, 15 or 271 19
2 0/ 15 15 26.375
8 19
10 30
12
Non-financial
Residents 1.375 0 or 15 14.4 0 or 25 0.79125 0 or 34.43 26.3
Non-residents
1.375 0 or 192 0/ 15 0 or 15 15.838 0 or 2510 3012
Life insurance
Residents 1.375 0 or 15 14.4 049 or 25 15.83 0 or 34.43 0.7513
Non-residents
1.375 0 or 192 0/ 15 0 or 15 15.83
9 0 or 25
10 30
Pension funds
Residents 11 0 0 or 14.43 0 15.83 15 0.414
Non-residents
11 0 0/ 15 05 15.839 15 30
CIVs Residents 0 1 0 06 0 0 26.3 or 30
Non-residents
27, 15 or 1.3751
1 0/15 15 26.3758 2511 3012
Note: 1 Treaty rate is usually 15%. 2 Treaty rate is usually 15%. However, Spain has no tax treaty with Denmark and Cyprus. 3 SEPCAV effectively taxed at 0% and ASSEP taxed at 14.4%. 4 Basis for 30% tax is deemed dividend income of 4% of the market value of the shares. 5 Requires non-resident to be tax exempt in both the residence country and in the Netherlands. 6 FIIs are entitled to offset the 15% WHT against its own WHT burden upon distribution to its members whereby the effective tax rate on dividends received is reduced to 0%. By contrast, the 15% WHT is final for EIIs. 7 If the marginal tax rate for a resident is below 26.375%, a refund of the difference is possible. 8 Treaty rate is usually 15%. 9 WHT at 26.375% may unilaterally be reduced to 15.83% upon application. Treaty rate is usually 15%. 10 Treaty rate is usually 10%. However, France has no tax treaty with Denmark. 11 CIVs are usually not entitled to tax treaty benefits. 12 Treaty rate is usually 15%. 13 Residents effectively taxed at 0.75% and non-residents taxed at 30%. Treaty rate is usually 15%. 14 Residents effectively taxed at 0.4% and non-residents taxed at 30%. Treaty rate is usually 15%. 15 Dividends paid by CIVs in Luxemburg are exempt from dividend withholding tax 16 The 30% WHT for residents is an advance tax credited against the individual's final income tax liability
Source: Deloitte survey of withholding tax rates in selected EU countries.
All of the Member States examined apply certain tax rules under which non-residents are
subject to a higher tax rate on dividends compared to residents (marked in yellow). Domes-
tic tax laws of the Member States examined may thus potentially infringe on the fundamen-
tal freedoms.50
Tax basis
Table 4.2 summarises whether residents and non-residents are taxed on a gross income basis
or net income basis with respect to dividends. It is specifically shown whether life insurance
49 No tax on dividends received by life insurance companies on moneys invested for their policy holders 50 Appendix 5.1
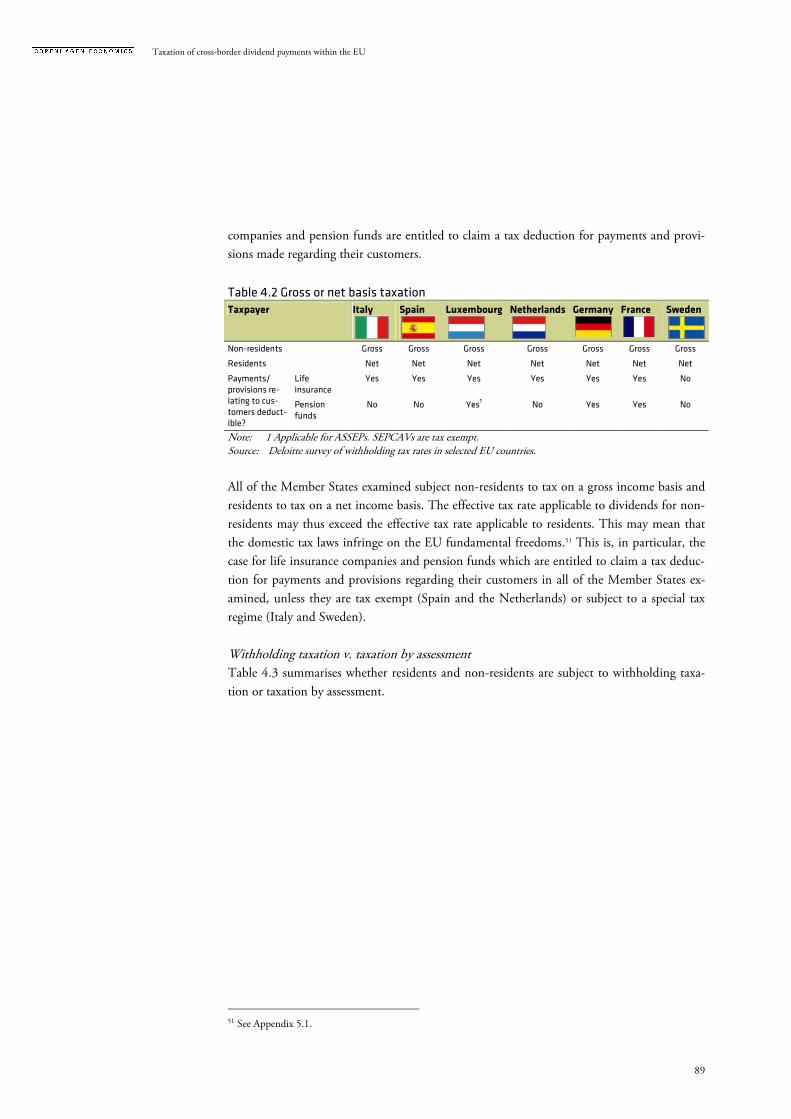
Taxation of cross-border dividend payments within the EU
89
companies and pension funds are entitled to claim a tax deduction for payments and provi-
sions made regarding their customers.
Table 4.2 Gross or net basis taxation Taxpayer Italy
Spain
Luxembourg
Netherlands
Germany
France
Sweden
Non-residents Gross Gross Gross Gross Gross Gross Gross
Residents Net Net Net Net Net Net Net
Payments/ provisions re-lating to cus-tomers deduct-ible?
Life insurance
Yes Yes Yes Yes Yes Yes No
Pension funds
No No Yes1 No Yes Yes No
Note: 1 Applicable for ASSEPs. SEPCAVs are tax exempt. Source: Deloitte survey of withholding tax rates in selected EU countries.
All of the Member States examined subject non-residents to tax on a gross income basis and
residents to tax on a net income basis. The effective tax rate applicable to dividends for non-
residents may thus exceed the effective tax rate applicable to residents. This may mean that
the domestic tax laws infringe on the EU fundamental freedoms.51 This is, in particular, the
case for life insurance companies and pension funds which are entitled to claim a tax deduc-
tion for payments and provisions regarding their customers in all of the Member States ex-
amined, unless they are tax exempt (Spain and the Netherlands) or subject to a special tax
regime (Italy and Sweden).
Withholding taxation v. taxation by assessment
Table 4.3 summarises whether residents and non-residents are subject to withholding taxa-
tion or taxation by assessment.
51 See Appendix 5.1.

Taxation of cross-border dividend payments within the EU
90
Table 4.3 Withholding taxation vs. taxation by assessment Taxpayer Italy
Spain
Luxembourg
Netherlands
Germany
France
Sweden
Individual Residents WHT
1 WHT
2 WHT WHT WHT ASS WHT/
ASS10
Non-residents
WHT WHT2 WHT WHT WHT WHT WHT
Non-financial
Residents ASS WHT WHT6 WHT
8 WHT ASS ASS
Non-residents
WHT WHT3 WHT6 WHT8 WHT WHT9 WHT
Life insurance
Residents ASS WHT WHT6 WHT8 WHT ASS ASS
Non-residents
WHT WHT3 WHT
6 WHT
8 WHT WHT
9 WHT
Pension funds
Residents ASS WHT WHT7 WHT WHT ASS ASS
Non-residents
WHT WHT4 WHT WHT WHT WHT WHT
CIVs Residents ASS WHT WHT WHT WHT ASS ASS
Non-residents
WHT WHT5 WHT WHT WHT WHT WHT
Note: 1 Taxation by assessment for qualifying shareholdings (voting power > 2%, or capital > 5%). 2 Exemption for WHT up to €1,500 apply for both residents and non-residents. 3 Exemption for WHT apply for non-residents which own at least 5% of the capital. 4 Exemption for WHT apply for qualifying non-resident pension funds. 5 Partial exemption for WHT apply for qualifying CIVs. 6 Exemption for WHT if shareholding > 10% or > €1.2 M, and the shareholding is held for 12 months. 7 Exemption for ASSEPs. 8 Exemption for WHT if shareholding amounts to at least 5%. 9 Exemption for WHT if shareholding amounts to at least 5%. 10 The 30% WHT for residents is an advance tax credited against the individual's final income tax liability.
Source: Deloitte survey of withholding tax rates in selected EU countries.
All of the Member States examined are taxing non-residents by way of a withholding tax.
Italy, France and Sweden generally apply the approach of taxation by assessment for resi-
dents other than individuals. This may trigger cash flow disadvantages for non-residents vis-
á-vis residents and infringe on the EU fundamental freedoms.52 The other Member States
examined also apply the approach of withholding taxation for residents, subject to a number
of exceptions that normally are applicable to both residents and non-residents.
Relief at source or refund
Table 4.4 summarises whether application of reduced treaty rates for non-residents are made
at source or by means of a refund procedure.
52 Appendix 5.1

Taxation of cross-border dividend payments within the EU
91
Table 4.4 Relief at source or refund Taxpayer Italy
Spain
Luxembourg
Nether-
lands
Germany
France
Sweden
Relief at source Yes Yes Yes Yes No Yes Yes
Relief by refund Yes Yes Yes Yes Yes Yes Yes
Time to obtain re-fund
2-3 years > 6 months 2-3 months 2-3 months 6 months 2-3 months 0-2 months
Source: Deloitte survey of withholding tax rates in selected EU countries.
All of the Member States examined except Germany allows non-residents to obtain relief at
source provided that proper documentation is submitted. If relief is not obtained at source, a
non-resident may apply for a refund. The time to obtain a refund varies considerable be-
tween the Member States.
Inbound dividends
The examination of the taxation of inbound dividends included nine Member States: Italy,
Spain, Luxembourg, the Netherlands, Germany, France, Sweden, Ireland and the United
Kingdom.
Taxation
Table 4.5 summarises whether dividends received by resident investors from resident and
non-resident companies and CIVs are subject to an equal tax treatment.
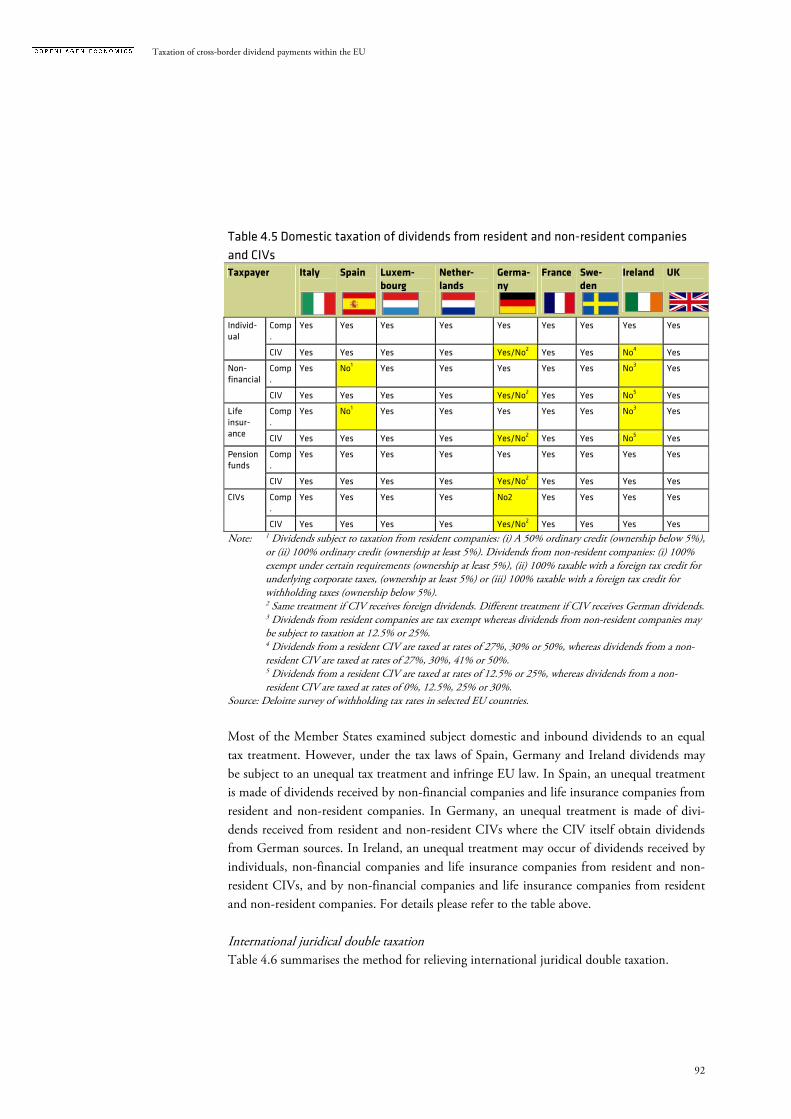
Taxation of cross-border dividend payments within the EU
92
Table 4.5 Domestic taxation of dividends from resident and non-resident companies
and CIVs
Taxpayer Italy
Spain
Luxem-
bourg
Nether-
lands
Germa-
ny
France
Swe-
den
Ireland
UK
Individ-ual
Comp.
Yes Yes Yes Yes Yes Yes Yes Yes Yes
CIV Yes Yes Yes Yes Yes/No2 Yes Yes No
4 Yes
Non-financial
Comp.
Yes No1 Yes Yes Yes Yes Yes No3 Yes
CIV Yes Yes Yes Yes Yes/No2 Yes Yes No5 Yes
Life insur-ance
Comp.
Yes No1 Yes Yes Yes Yes Yes No3 Yes
CIV Yes Yes Yes Yes Yes/No2 Yes Yes No5 Yes
Pension funds
Comp.
Yes Yes Yes Yes Yes Yes Yes Yes Yes
CIV Yes Yes Yes Yes Yes/No2 Yes Yes Yes Yes
CIVs Comp.
Yes Yes Yes Yes No2 Yes Yes Yes Yes
CIV Yes Yes Yes Yes Yes/No2 Yes Yes Yes Yes
Note: 1 Dividends subject to taxation from resident companies: (i) A 50% ordinary credit (ownership below 5%), or (ii) 100% ordinary credit (ownership at least 5%). Dividends from non-resident companies: (i) 100% exempt under certain requirements (ownership at least 5%), (ii) 100% taxable with a foreign tax credit for underlying corporate taxes, (ownership at least 5%) or (iii) 100% taxable with a foreign tax credit for withholding taxes (ownership below 5%). 2 Same treatment if CIV receives foreign dividends. Different treatment if CIV receives German dividends. 3 Dividends from resident companies are tax exempt whereas dividends from non-resident companies may be subject to taxation at 12.5% or 25%. 4 Dividends from a resident CIV are taxed at rates of 27%, 30% or 50%, whereas dividends from a non-resident CIV are taxed at rates of 27%, 30%, 41% or 50%. 5 Dividends from a resident CIV are taxed at rates of 12.5% or 25%, whereas dividends from a non-resident CIV are taxed at rates of 0%, 12.5%, 25% or 30%.
Source: Deloitte survey of withholding tax rates in selected EU countries.
Most of the Member States examined subject domestic and inbound dividends to an equal
tax treatment. However, under the tax laws of Spain, Germany and Ireland dividends may
be subject to an unequal tax treatment and infringe EU law. In Spain, an unequal treatment
is made of dividends received by non-financial companies and life insurance companies from
resident and non-resident companies. In Germany, an unequal treatment is made of divi-
dends received from resident and non-resident CIVs where the CIV itself obtain dividends
from German sources. In Ireland, an unequal treatment may occur of dividends received by
individuals, non-financial companies and life insurance companies from resident and non-
resident CIVs, and by non-financial companies and life insurance companies from resident
and non-resident companies. For details please refer to the table above.
International juridical double taxation
Table 4.6 summarises the method for relieving international juridical double taxation.

Taxation of cross-border dividend payments within the EU
93
Table 4.6 Method for relieving international juridical double taxation Tax payer Italy
Spain
Luxem-
bourg
Nether-
lands
Germa-
ny
France
Sweden
Ireland
UK
Method OC OC OC OC OC OC OC OC OC
Limitation Per coun-try
Per coun-try
Per coun-try
Per coun-try
Per coun-try
1 Per item Overall or
per item Per item Per coun-
try2
Gross or net principle
Gross Net Net Gross Net Gross Net Gross Gross
Direct v. indi-rect expenses
N/A Direct Direct and indirect
N/A Direct and indirect
N/A Direct and indirect
N/A N/A
Excess foreign tax credit
8 years back or forward
10 years forward
No Indefi-nitely forward
No No 5 years forward
No No
Investor of a resident CIV entitled to a FTC for WHT of CIV?
No No No No Yes Yes No No No
Investor of a non-resident CIV entitled to a FTC for WHT of CIV?
No No No No Yes Yes No No No
Note: 1Relief for juridical double taxation is calculated on an overall basis for individuals.2Per item if income from multiple sources from the same Member State is subject to WHT.
Source: Deloitte survey of withholding tax rates in selected EU countries.
All of the Member States examined apply the method of ordinary credit which is compatible
with the fundamental freedoms.53 Moreover, all of the Member States except Sweden require
the foreign tax credit to be calculated per country or per item. This may arguably infringe on
the fundamental freedoms.54 The application of a net and gross principle of taxation is al-
most equally distributed among the Member States examined. In general, the use of the net
principle hardly infringes on EU law.55 An excess foreign tax credit may not be carried for-
ward in five Member States. Among these Member States, Luxembourg, Germany and Ire-
land are obliged to grant relief for international juridical double taxation because relief is
granted for domestic juridical double taxation.56 Accordingly, these Member States arguably
infringe on the fundamental freedoms because an excess foreign tax credit caused by losses
from other sources cannot be carried forward.57
Economic double taxation
The Member States examined are in principle applying the same method for mitigating eco-
nomic double taxation for residents and non-residents.
53 Appendix 5.1. 54 Appendix 5.1. 55 Appendix 5.1. 56 Appendix 5.1. 57 Appendix 5.1.
Taxation of cross-border dividend payments within the EU
94
Tax treaties
Most of the Member States examined have concluded bilateral tax treaties (a multilateral tax
treaty is in place between the Nordic countries) with each other based on the OECD Model
Income Tax Convention. The primary purpose of tax treaties is to prevent international ju-
ridical double taxation by imposing restrictions on the taxing authority provided by domes-
tic laws.
The source country is usually granted the right to impose a 15 per cent tax on the gross
amount of portfolio dividends and dividends paid to individuals. However, some tax treaties
of Luxembourg, France, Germany, Italy, the Netherlands, Spain and Sweden call for a re-
duced source country taxation of 10 per cent, 5 per cent or 0 per cent. A few tax treaties
concluded by France, Germany and the Netherlands contain special rules for pension funds
and CIVs.
The residence country is entitled to tax the entire dividend but most resident countries miti-
gate juridical double taxation by granting an ordinary tax credit for the taxes levied in the
source country. Tax treaties do not address the details of the calculation of the foreign tax
credit in the residence country.
Summary
Under Option 1, the domestic tax laws of all of the Member States examined contain rules
regarding outbound and inbound dividends which infringe the fundamental freedoms.
4.2. OPTION 2: ABOLITION OF WHT LEVIED ON CROSS-BORDER DIVIDENDS Under Option 2, the domestic tax laws of all of the examined Member States except Ireland
and the UK need to be changed. Hence, under existing law outbound dividends are subject
to withholding taxes in France, Germany, Italy, Luxembourg, the Netherlands, Spain and
Sweden. The tax treaties of the Member States need not be changed because tax treaties sole-
ly provide authority to mitigate taxation, not to impose taxation. From an EU law perspec-
tive, Option 2 would eliminate discrimination of outbound and inbound dividends provid-
ed that it would encompass all relevant entities including pension funds and CIVs. Option 2
would be consistent with the approach of the Parent-Subsidiary Directive to eliminate jurid-
ical double taxation by abolishing source country taxation and would not cause distortions
vis-á-vis the Directive. Contrary to the directive, Option 2 would not of itself eliminate eco-
nomic double taxation. However, assuming that inbound dividends would be treated equally
with domestic dividends as required by EU law, economic double taxation would normally
be mitigated under domestic tax law and the schedular systems now in place in most Mem-
ber States. The legal impacts of Option 2 are summarised in Table 4.7.

Taxation of cross-border dividend payments within the EU
95
Table 4.7 Legal impacts of Option 2 Problem France
Germa-
ny
Ireland
Italy
Luxem-
bourg
Nether-
lands
Spain
Sweden
UK
Simplification of MS' tax systems
Yes Yes No Yes Yes Yes Yes Yes No
Practical difficul-ties and new ad-ministration
No No No No No No No No No
Conflict with principle of source-country entitlement to tax
Yes Yes Yes Yes Yes Yes Yes Yes Yes
Costs related to the introduction of automatic ex-change of infor-mation
No No No No No No No No No
Need to amend domestic legisla-tion
Yes Yes No Yes Yes Yes Yes Yes No
Need to amend Double Tax Con-ventions
No No No No No No No No No
Source: Deloitte survey of withholding tax rates in selected EU countries.
4.3. OPTION 3: FULL CREDIT FOR WHT ON CROSS-BORDER DIVIDENDS Under Option 3, the domestic tax laws of all of the examined Member States need to be
changed. Hence, under existing law relief for juridical double taxation of inbound dividends
is granted under the method of ordinary credit. The tax treaties of the Member States need
not be changed because tax treaties solely provide authority to mitigate taxation, not to im-
pose taxation. Option 3 would eliminate juridical double taxation of cross-border dividends
given that residence States in some cases would need to refund the surplus tax to the inves-
tors (negative tax).
From an EU law perspective, Option 3 would remove discrimination of outbound dividends
in the source state. Option 3 would not be consistent with the approach of the Parent-
Subsidiary Directive to eliminate juridical double taxation by abolishing source country taxa-
tion. However, Option 3 should not cause distortions vis-á-vis the Directive. In addition,
Option 3 would not in itself eliminate economic double taxation. However, assuming that
inbound dividends would be treated equally with domestic dividends as required by EU law,
economic double taxation would normally be mitigated under the schedular tax systems now
in place in most Member States. The legal impacts of Option 3 are summarised in Table
4.8.

Taxation of cross-border dividend payments within the EU
96
Table 4.8 Legal impacts of Option 3 Problem France
Germa-
ny
Ireland
Italy
Luxem-
bourg
Nether-
lands
Spain
Sweden
UK
Simplification of MS’s tax systems
No No No No No No No No No
Practical diffi-culties and new admin-istration
No No No No No No No No No
Conflict with principle of source-country enti-tlement to tax
No No No No No No No No No
Costs related to the intro-duction of au-tomatic ex-change of in-formation
No No No No No No No No No
Need to amend do-mestic legis-lation]
Yes Yes Yes Yes Yes Yes Yes Yes Yes
Need to amend Double Tax Conven-tions
No No No No No No No No No
Source: Deloitte survey of withholding tax rates in selected EU countries.
4.4. OPTION 4: NET RATHER THAN GROSS TAXATION IN THE SOURCE COUNTRY Under Option 4, the domestic tax laws of all of the examined Member States except Ireland
and the UK need to be changed. Hence, under existing law, source country taxation is on a
gross income basis. The tax treaties of the Member States need not be changed because tax
treaties solely provide authority to mitigate taxation, not to impose taxation. Whether Op-
tion 4 would eliminate juridical double taxation of cross-border dividends depends, among
other things, on how foreign tax credit is calculated in the residence country, the level of ex-
penses that may be allocated to the dividend income under the domestic tax laws of the
source country and residence country and the level of the tax rates of the source country and
residence country. If the residence country calculates foreign tax credit on a gross income ba-
sis (Italy, the Netherlands, France, Ireland and the UK), juridical double taxation would
normally be eliminated provided that sufficient taxes are imposed in the residence country to
accommodate an ordinary credit. If the residence country calculates foreign tax credit on a
net income basis (Germany, Luxembourg, Spain and Sweden), juridical double taxation
would normally be eliminated provided that the level of expenses allocated to the dividend is
almost identical in the source country and residence country and that the tax rate in the
source country does not exceed the tax rate in the residence country.
From an EU law perspective, Option 4 would not remove all discrimination of cross-border
dividends in the source country and residence country. Option 4 would not be consistent

Taxation of cross-border dividend payments within the EU
97
with the approach of the Parent-Subsidiary Directive to eliminate juridical double taxation
by abolishing source country taxation. Option 4 would not necessarily be as beneficial for
portfolio investors as the Directive is for parent/subsidiaries. In addition, Option 4 would
not in itself eliminate economic double taxation. However, assuming that inbound divi-
dends would be treated equally with domestic dividends as required by EU law, economic
double taxation would normally be mitigated under the schedular tax systems now in place
in most Member States. The legal impacts of Option 4 are summarised in Table 4.9.
Table 4.9 Legal impacts of Option 4 Problem France
Germa-
ny
Ireland
Italy
Luxem-
bourg
Nether-
lands
Spain
Sweden
UK
Simplification of MS’s tax systems
No No No No No No No No No
Practical diffi-culties and new admin-istration
Yes Yes No Yes Yes Yes Yes Yes No
Conflict with principle of source-country enti-tlement to tax
Yes Yes Yes Yes Yes Yes Yes Yes Yes
Costs related to the intro-duction of au-tomatic ex-change of in-formation
No No No No No No No No No
Need to amend do-mestic legis-lation]
Yes Yes No Yes Yes Yes Yes Yes No
Need to amend Double Tax Conven-tions
No No No No No No No No No
Source: Deloitte survey of withholding tax rates in selected EU countries.
4.5. OPTION 5: GENERAL EU-WIDE REDUCED WHT RATE WITH INFORMATION
EXCHANGE Under Option 5, the domestic tax laws of all of the examined Member States except Ireland
and the United Kingdom need to be changed. Hence, a separate tax rate for EU dividends
and administrative procedures for an automatic exchange of information would need to be
implemented. The tax treaties of the Member States need not be changed because tax treaties
solely provide authority to mitigate taxation, not to impose taxation. In general, Option 5
would in most cases simply mitigate existing problems by reducing the level of withholding
taxes. Whether juridical double taxation of cross-border dividends would be eliminated de-
pends, among other things, on how foreign tax credit is calculated in the residence country,
the level of expenses that may be allocated to the dividend income under the domestic tax

Taxation of cross-border dividend payments within the EU
98
laws of the source country and residence country and the level of tax rates in the source
country and residence country.
From an EU law perspective, Option 5 would not remove all discrimination of cross-border
dividends in the source country and residence country. Hence, should the CJ decide that
gross basis taxation in the source country infringe on the fundamental freedoms, this would
involve a de facto implementation of Option 4 concurrent with Option 5. Option 5 would
not be consistent with the approach of the Parent-Subsidiary Directive to eliminate juridical
double taxation by abolishing source country taxation. Option 5 would not be as beneficial
for portfolio investors as the Directive is for parent/subsidiaries. In addition, Option 5
would not of itself eliminate economic double taxation. However, assuming that inbound
dividends would be treated equally with domestic dividends as required by EU law, econom-
ic double taxation would normally be mitigated under the schedular tax systems now in
place in most Member States. The legal impact of Option 5 are summarised in Table 4.10.
If an investor does not opt for information exchange, the legal consequences would be as de-
scribed under Option 1 (see section 4.1).

Taxation of cross-border dividend payments within the EU
99
Table 4.10 Legal impacts of Option 5 Problem France
Germa-
ny
Ireland
Italy
Luxem-
bourg
Nether-
lands
Spain
Sweden
UK
Simplification of MS’s tax systems
No No No No No No No No No
Practical diffi-culties and new admin-istration
Yes Yes No Yes Yes Yes Yes Yes No
Conflict with principle of source-country enti-tlement to tax
No No No No No No No No No
Costs related to the intro-duction of au-tomatic ex-change of in-formation
Yes Yes No Yes Yes Yes Yes Yes No
Need to amend do-mestic legis-lation]
Yes Yes No Yes Yes Yes Yes Yes No
Need to amend Double Tax Conven-tions
No No No No No No No No No
Source: Deloitte survey of withholding tax rates in selected EU countries.
4.6. OPTION 6: LIMITED TAXATION OF DIVIDEND INCOME AND CREDIT FOR COR-
PORATE TAX Under Option 6, the domestic tax laws of all of the examined Member States need to be
changed in order to provide for a reduced EU withholding tax rate and/or to implement
rules for calculating foreign tax credit of EU dividends. The tax treaties of the Member
States need not be changed because tax treaties solely provide authority to mitigate taxation,
not to impose taxation. Juridical double taxation of cross-border dividends would normally
be eliminated by requesting the residence country to grant exemption or full credit relief.
Option 6 would not be consistent with the approach of the Parent-Subsidiary Directive to
eliminate juridical double taxation by abolishing source country taxation. However, Option
6 should not cause distortions vis-á-vis the Directive. In addition, Option 6 will reduce eco-
nomic double taxation by requiring an ordinary credit to be granted in the residence country
for the underlying corporate tax, and a full credit for withholding taxes. Moreover, by as-
suming that inbound dividends would be treated equally with domestic dividends as re-
quired by EU law, economic double taxation would normally be mitigated under the sched-
ular tax systems now in place in most Member States. The legal impacts of Option 6 are
summarised in Table 4.11.

Taxation of cross-border dividend payments within the EU
100
Table 4.11 Legal impacts of Option 6 Problem France
Germa-
ny
Ireland
Italy
Luxem-
bourg
Nether-
lands
Spain
Sweden
UK
Simplifica-tion of MS’s tax systems
No No No No No No No No No
Practical dif-ficulties and new admin-istration
Yes Yes Yes Yes Yes Yes Yes Yes Yes
Conflict with principle of source-country enti-tlement to tax
No No No No No No No No No
Costs related to the intro-duction of automatic exchange of information
No No No No No No No No No
Need to amend do-mestic legis-lation]
Yes Yes Yes Yes Yes Yes Yes Yes Yes
Need to amend Dou-ble Tax Con-ventions
No No No No No No No No No
Source: Deloitte survey of withholding tax rates in selected EU countries.
4.7. OPTION 7: NO WHT AND NO INCOME TAX ON CROSS-BORDER DIVIDENDS Under Option 7, the domestic tax laws of all of the examined Member States need to be
changed in order to abolish withholding tax on EU dividends and exempt inbound EU divi-
dends. The tax treaties of the Member States need not be changed because tax treaties solely
provide authority to mitigate taxation, not to impose taxation. Option 7 would remove both
juridical and economic double taxation of cross-border dividends. From an EU law perspec-
tive, discrimination of cross-border dividends would be removed. Option 7 would be con-
sistent with the approach of the Parent-Subsidiary Directive to eliminate juridical double
taxation by abolishing source country taxation and to abolish economic double taxation by
way of exemption. Option 7 could potentially cause distortions vis-á-vis the Directive, e.g.
that companies might aim at shareholdings lower than 10 per cent if the new rules do not set
additional requirements similar those in the Directive. The legal impacts of Option 7 are
summarised in Table 4.12.
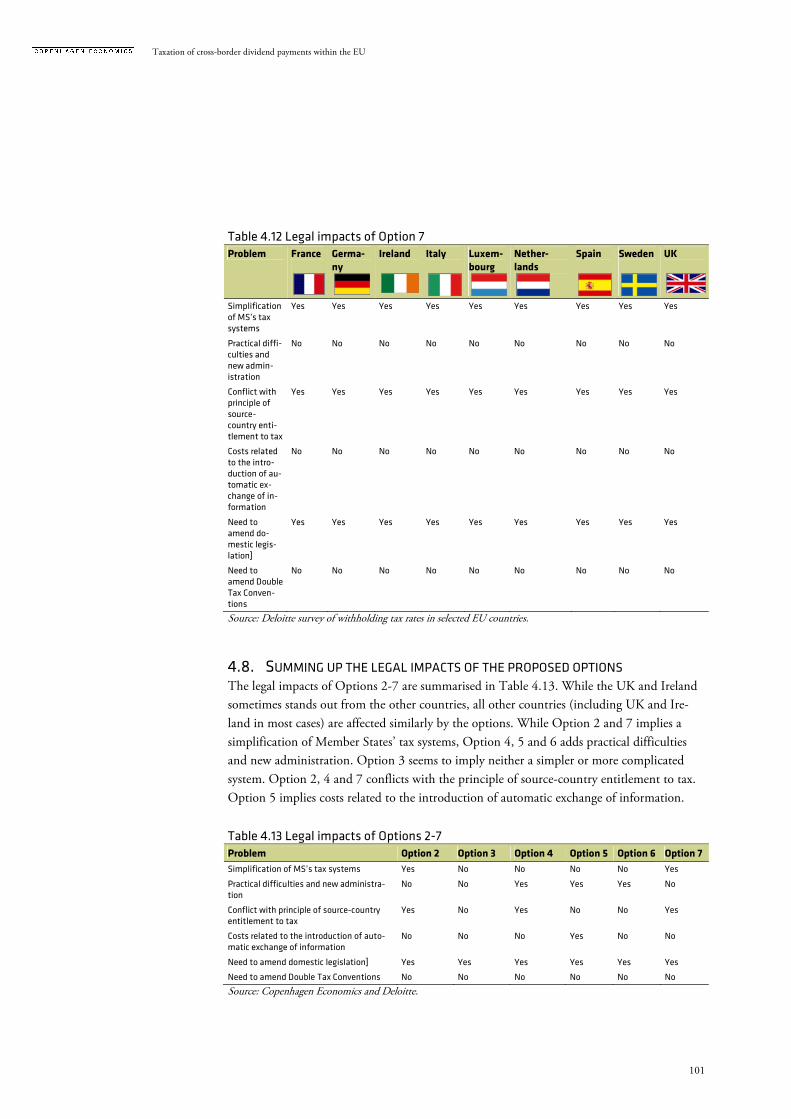
Taxation of cross-border dividend payments within the EU
101
Table 4.12 Legal impacts of Option 7 Problem France
Germa-
ny
Ireland
Italy
Luxem-
bourg
Nether-
lands
Spain
Sweden
UK
Simplification of MS’s tax systems
Yes Yes Yes Yes Yes Yes Yes Yes Yes
Practical diffi-culties and new admin-istration
No No No No No No No No No
Conflict with principle of source-country enti-tlement to tax
Yes Yes Yes Yes Yes Yes Yes Yes Yes
Costs related to the intro-duction of au-tomatic ex-change of in-formation
No No No No No No No No No
Need to amend do-mestic legis-lation]
Yes Yes Yes Yes Yes Yes Yes Yes Yes
Need to amend Double Tax Conven-tions
No No No No No No No No No
Source: Deloitte survey of withholding tax rates in selected EU countries.
4.8. SUMMING UP THE LEGAL IMPACTS OF THE PROPOSED OPTIONS The legal impacts of Options 2-7 are summarised in Table 4.13. While the UK and Ireland
sometimes stands out from the other countries, all other countries (including UK and Ire-
land in most cases) are affected similarly by the options. While Option 2 and 7 implies a
simplification of Member States’ tax systems, Option 4, 5 and 6 adds practical difficulties
and new administration. Option 3 seems to imply neither a simpler or more complicated
system. Option 2, 4 and 7 conflicts with the principle of source-country entitlement to tax.
Option 5 implies costs related to the introduction of automatic exchange of information.
Table 4.13 Legal impacts of Options 2-7
Problem Option 2 Option 3 Option 4 Option 5 Option 6 Option 7
Simplification of MS’s tax systems Yes No No No No Yes
Practical difficulties and new administra-tion
No No Yes Yes Yes No
Conflict with principle of source-country entitlement to tax
Yes No Yes No No Yes
Costs related to the introduction of auto-matic exchange of information
No No No Yes No No
Need to amend domestic legislation] Yes Yes Yes Yes Yes Yes
Need to amend Double Tax Conventions No No No No No No
Source: Copenhagen Economics and Deloitte.

Taxation of cross-border dividend payments within the EU
102
In this chapter we touch upon some of the cross-cutting issues that are relevant for assessing
the overall impacts of the proposed options. First, we discuss how impacts on tax burdens
differ across investor types. Second, we quantify the impact of reduced compliance costs on
the capital stock and on GDP, and we discuss qualitatively how EU investors may respond
to the reduced or eliminated withholding taxes. Third, we make a short note on the impacts
on third countries. Fourth, we evaluate the internal market impacts of the proposed options
and discuss how a reduction of withholding taxes may impact on incentives. Fifth, we carry
out a sensitivity analysis of the main assumptions in our model. And, finally, we make an
overall evaluation that brings together the main aspects of the proposed options.
5.1. IMPACTS OF THE PROPOSED OPTIONS ON DIFFERENT INVESTORS Current tax liabilities on cross border dividend flows are not evenly distributed across differ-
ent types of investors, cf. Figure 5.1. It is CIVs that carry the main burden since such in-
vestment vehicles very often face double taxation due to the fact that withholding tax levied
abroad cannot always be credited in the tax to be paid in the residence country. The income
tax paid by individuals (who are the ultimate owners of the portfolio equity investment) is
also taken into account.
Figure 5.1 Distribution of current tax liabilities from cross border dividend flows on in-
vestor type
Note: Data is from 2009. Source: Copenhagen Economics.
We find that all the options reduce the tax burden of investors but that the impact differs
across investor types, cf. Table 5.1. Since the different options aim to remove or reduce
withholding taxes, the investor groups that will gain the most in per centage of their total tax
payments from such options are the investors paying the most in withholding tax relative to
Individuals19%
Non-financial companies
3%
Insurance companies and pension funds
21%
CIVs40%
Bank and other financial institution
17%
Chapter 5 CROSS-CUTTING ISSUES RELATED TO THE PROPOSED OPTIONS

Taxation of cross-border dividend payments within the EU
103
their income dividend taxes. Since households in general are charged a relatively high divi-
dend income tax, they do not gain as much in per centage from reducing withholding taxes.
On the other hand CIV’s, which pay (almost) all their dividend taxes through withholding
taxes (income dividend taxation is zero for CIV’s in almost all countries) get a comparatively
higher reduction in their total tax burden. We note that a reduced tax burden of CIVs, bene-
fit the ultimate owner such as regular stock holders.
Table 5.1 Change in tax burden of investors (compared to the current situation)
Investor type Option 2 Option 3 Option 5 Option 6 Option 7
Individuals -10% -9% -5% -10% -100%
Non-financial companies -16% -14% -8% -53% -100%
Insurance companies and pension funds -50% -47% -23% -83% -100%
CIVs -100% -99% -47% -100% -100%
Bank and other financial institution -28% -27% -13% -69% -100%
Total change in tax burden -46% -45% -22% -65% -100%
Source: Copenhagen Economics.
5.2. MACROECONOMIC IMPACTS OF THE REDUCED COST OF CAPITAL The reduction or elimination of withholding taxes has an effect on capital flows within the
EU from at least two different channels. The first channel is through a reduction in the cost
of capital within the EU due mainly to the reduced tax burden facing EU investors, but also
due to a reduction in compliance costs. The reduced cost of capital will stimulate capital in-
vestments, and the larger capital stock will have a positive impact on GDP through a higher
investment level. The second channel is related to how the lower WHT rates make portfolio
investments within the EU more attractive, which may give investors an incentive to down-
scale their other investments (substitution effect). Capital may therefore be drawn from oth-
er investment location or other investment products. The two impacts are described in more
details in the following section.
Impacts of reduced costs of capital on GDP
Compliance costs and the tax burden related to withholding taxes are reduced or eliminated
under the different options. The tax burden, and to a lesser extent, compliance cost consti-
tute a real burden and expense on investors, and their reduction or elimination is therefore
likely to lower the cost of capital. When the cost of capital is reduced, the amount of capital
available for investments is likely to increase, which will stimulate GDP. In this section we
make an attempt to quantify the extent to which each of the options reduce the cost of capi-
tal and the macroeconomic effects that can be expected to follow.
We base our calculations on the European Commission FISCO study from 2009. The
methodology can be described in four steps:
1. By how much will the cost of cross-border investments be reduced when withhold-
ing taxes are reduced or eliminated?

Taxation of cross-border dividend payments within the EU
104
2. By how much will capital costs be reduced when the cost of cross-border invest-
ments are reduced?
3. By how much will the capital stock increase when capital costs are reduced?
4. By how much will GDP increase when the capital stock increases?
The FISCO study finds that simplifying the withholding tax relief procedure implies a re-
duction in the cross-border cost of capital by 0.35 per cent. Under the assumption that 80
per cent of new real investments are financed by retained earnings of companies, the FISCO
study finds that the cost of capital will be reduced by 0.07 per cent, when the cross-border
cost of capital is reduced by 0.35 per cent. Based on the empirical finding that when the cost
of capital is reduced by 1 per cent, the capital stock also increases by 1 per cent, the study
finds that the capital stock increases by 0.07 per cent. And, finally, since 40 per cent of GDP
is created by the capital stock, the ultimate change in GDP will be equal to 0.028 per cent
(equal to €3.4 billion per year). Details of the calculations can be found in Box 5.1.
Box 5.1 Detailed description of the FISCO method to calculate macro impacts We use the example from the FISCO report to illustrate the methodology. The study identifies three sources of costs related to withholding taxes on dividend and interest payments between EU Member States (including also payments to non-EU countries):
i. Liquidity costs due to delayed claims and payments of tax refunds amount to €1.84 billion per year. ii. Foregone tax relief due to investors who do not claim their tax refunds amounts to €5.47 billion per
year iii. Administrative costs related to the reclaim procedure amount to €1.09 billion per year
The total value of the three components is given by €8.40 billion. The study then assumes that 90 per cent of all cross-border investments are affected (cases where withholding taxes are not already eliminated due to a bilateral DTT between the source and the residence country), the value is reduced to €7 billion per year. Furthermore, only 25 per cent of the holdings are related to portfolio investments in which case the cost re-duction potential is reduced to €1.89 billion. The total amount of dividend and interest payments is €547 billion per year. A full elimination of the three cost components implies a reduction in the cross-border cost of financing of 0.35 per cent (€1.89 billion as a share of €547 billion). According to the empirical cross-country study of Corbett and Jenkinson (1997) based on data from 1970-1994, around 80 per cent of new real investments are financed by retained earnings of companies.58 For this reason the estimated impact on the cost of capital would amount only to 0.07 per cent (20 per cent of the 0.35 per cent). Using their macroeconomic model they find that when the cost of capital is reduced by 1 per cent, the capi-tal stock increases by 1 per cent (elasticity equal to -1). This suggests that the 0.07 per cent reduction in the cost of capital increases the capital stock by 0.07 per cent. Furthermore, estimates from Ratto et al. (2004) show that 60 per cent of GDP is due to labour input and 40 per cent is due to capital input. This means that the 0.07 per cent increase in the capital stock will ulti-mately raise GDP by 0.028 per cent (40 per cent of the 0.07 per cent). With GDP in the current year reaching €12 trillion, this value leads to an estimated increase of €3.4 billion per year.
Source: Copenhagen Economics, the European Commission (2009) FISCO study and Corbett and Jenkings (1998) and Ratto et al. (2004).
58 For similar conclusions, see Mayer (1988), Rajan and Zingales (1995), Corbett et al.( 2004) and van Treck (2008). The latter is based on US data.

Taxation of cross-border dividend payments within the EU
105
We have used this methodology to quantify the macroeconomic impacts of the proposed op-
tions. Let us use Option 2 as an illustrative example of how the effect on GDP is calculated.
In Option 2, we find that the total reduced cost of cross-border portfolio equity investments
is €3.7 billion (including reduced tax burden, quantifiable compliance costs and liquidity
costs). Taking this as a share of total capital costs (dividends on all equity investments and
interest payments, which amounted to €547 billion according to FISCO) it results in 0.7 per
cent.59
The reduced cost of cross-border portfolio equity investments translates into a 0.14 per cent
reduction in the cost of capital and hence an increase in the capital stock of 0.14 per cent
(with an elasticity of 1). Consequently, we find that EU GDP increases by 0.05 per cent due
to the reduced cost of capital. The results for the other options can be seen from Table 5.2.
We note that our quantification of Option 6 excludes the reduced tax burden from crediting
corporate taxes in the source country, since we do not find the FISCO methodology suitable
to quantifying impacts of such changes. Moreover, in Option 7 we only consider the tax
burden reduction from reduced WHT rates. We do not consider the reduced tax burden
that comes from eliminating residence taxation. Option 7 therefore resembles Option 2,
where withholding taxes are fully eliminated.
Table 5.2 Impact on GDP from a reduction in cost of capital Impacts Option 2 Option 3 Option 5 Option 6 Option 7 1. 1. 1. 1. Reduced costs of cross-border portfolio equity investments
Liquidity costs reduced 16 0 13 16 16
Reduced tax burden due to re-duced or eliminated juridical dou-ble taxation* 3,706 3,585 1,746 3,706 8,044
Administrative costs of applying for refund reduced 14 0 11 14 14
Total reduced cost of investments that are affected (mill. EUR) 3,736 3,585 1,770 3,737 3,736
Total reduced costs as a share of to-tal dividends and interest pay-ments** 0.7% 0.7% 0.3% 0.7% 0.7%
2. Impact on the cost of capital 0.14% 0.13% 0.06% 0.14% 0.14%
3. Impact on the capital stock 0.14% 0.13% 0.06% 0.14% 0.14%
4. Impact on GDP 0.05% 0.05% 0.03% 0.05% 0.05%
Note: * Here we do not consider the reduced tax burden as a consequence of e.g. reduction in underlying corpo-rate tax or abolition of domestic dividend income tax as is the case in Option 6 and 7 respectively. ** The cost of capital is the dividends and interest payments associated with all equity and debt invest-ments in EU. Data is in million EUR.
Source: Copenhagen Economics based on the methodology in European Commission (2009), FISCO Report.
In absolute terms, we find that the impact in Option 2, Option 3, Option 6 and Option 7 is
relatively similar adding about €6 billion to EU GDP, cf. Figure 5.2. This is a gross gain and
59 Data in the FISCO study is based on data from 2006 but the basic assumptions in the methodology are based on underlying structural characteristics of the economy which suggests that the methodology remains valid.

Taxation of cross-border dividend payments within the EU
106
should be seen in the light of more general effects, such as e.g. a reduction in public spend-
ing (or tax increases in other areas) due to the loss of tax revenue from WHTs. The net gain
is therefore expected to be significantly lower than these estimates. The real benefit from re-
ducing distortions caused by double taxation comes from the fact that capital will be allocat-
ed better as the pre-tax required rates of return for investors will become more equal across
countries. This improves the overall rate of return on capital investments and will improve
productivity in EU Member States.
Figure 5.2 Macroeconomic impacts of the reduced cost of capital
Source: Copenhagen Economics.
Impacts of increased substitution with other investments
We have identified at least four ways in which an investor may respond to an increased rate
of return to portfolio equity investments in other EU countries compared to other invest-
ment locations or investment types. As explained in Section 2.4, there is very little empirical
evidence on the impact of withholding taxes on domestic and cross-border portfolio equity
investments. The impacts of substitution with other investments and the ultimate impact on
capital availability within the EU will therefore only be discussed qualitatively.
First, the wedge between the required rates of return on domestic equity investments and
equity investments in other EU countries (see Section 2.4) will be reduced. When the return
on equity investments in other EU countries increases the investor may shift away from do-
mestic investments to cross-border EU investments. This will reduce the home bias problem
but it will not make more capital available within the EU as a whole. It will only shift capital
between EU countries.

Taxation of cross-border dividend payments within the EU
107
Second, the wedge between the required rates of return on equity investments in other EU
countries compared to equity investments in third countries will be reduced. More capital
will become available when the EU investor shifts his equity investments from a third coun-
try to an EU country.
Third, portfolio equity investments will become more attractive relative to other types of in-
vestments. Taxation of portfolio equity investors will, for example, become more aligned to
direct equity investors as covered by the Parent-Subsidiary Directive. When taxation be-
comes more equal, this means that the incentive for investors to carry out foreign portfolio
debt investment rather than foreign portfolio equity investment is reduced. Under Option 7,
portfolio equity investors will face the same withholding taxes as direct equity investors, and
the incentive to invest in debt is removed This will benefit the EU economy because high
levels of debt increase the fragility of firms and discourages investments in more long term
projects with potential high returns for society.
Finally, capital may be drawn from less productive investment objects (e.g. such as real estate
and savings deposits). The consequence for capital availability within the EU depends on the
degree of substitutability between different types of investment objects. This is a highly
complicated issue and we have not quantified these substitution effects.
5.3. IMPACTS ON THIRD COUNTRIES Third countries are expected to be disadvantaged in at least two ways due to the reduction or
elimination of withholding taxes on intra-EU dividend payments. First, intra-EU portfolio
equity investments become more attractive in comparison with portfolio equity investments
in third countries. This impact can be expected to reduce capital flows outside the EU. Se-
cond, non-EU investors do not benefit from the simplified tax relief systems since EU tax
administrations will expectedly implement a two-tier tax relief system – one applicable for
EU investors and one applicable for non-EU investors.
5.4. IMPACTS ON THE INTERNAL MARKET The impacts on the Internal Market are mainly related to the issue of double taxation and to
distortions of the free flow of capital between EU Member States. Option 5 is the only op-
tion that does not fully eliminate juridical double taxation, while the more far-reaching Op-
tion 6 and Option 7 are the only options which reduce or fully eliminate economic double
taxation.
The proposed options concern mainly two distortions to the effective functioning of the In-
ternal Market. These impacts have not been quantified but have been assessed qualitatively:
� Distortion of the locational choice of crossDistortion of the locational choice of crossDistortion of the locational choice of crossDistortion of the locational choice of cross----border equity investments.border equity investments.border equity investments.border equity investments. Equity
investments respond to changes in the effective taxation of the return to such in-
vestments, and tax differences among EU Member States may therefore distort the

Taxation of cross-border dividend payments within the EU
108
locational choice of investors. Option 6 is the only option which does not remove
this distortion.
� Incentive to attract and lockIncentive to attract and lockIncentive to attract and lockIncentive to attract and lock----in companies.in companies.in companies.in companies. The issue refers to situations where
full tax relief is offered in the residence country so that the source country can
largely raise withholding taxes without adverse investment reaction. Option 3 and
4 have the adverse impact to increase the incentive to attract and lock-in compa-
nies.
Moreover, Option 2, 3, 6 and 7 are capable of solving the problem of CIV’s inability to
credit WHT in their residence country. The impacts are summarised in Table 5.3.
Table 5.3 Expected positive impact on the Internal Market of the proposed options Distortion Option 2 Option 3 Option 4 Option 5* Option 6** Option 7
Economic double taxation (credit for corporate tax paid in source country)
No No No No Partial Full
Juridical double taxation
Full Full Partial Partial Full Full
Choice of investment loca-tion
Full Full Full Full No Full
Incentive to distribute prof-its in forms other than divi-dends
Full Full No Partial Full Full
Distortion of individual in-vestors’ incentive to carry out portfolio equity invest-ments
Full Full Partial No Full Full
CIV’s inability to credit WHT in residence country
Investing in zero WHT country
N.R N.R N.R N.R N.R N.R
Investing in non-zero WHT country
Full Full No No Full Full
Improved compliance in res-idence country
No Yes No Yes Yes Yes
Improved co-operation be-tween tax authorities
No No No Yes No No
Note: N.R means Not Relevant. * Under the assumption of full information exchange. ** Assuming that treaty rates are not below 7.5 per cent. In these (rather few) situations there will be compliance costs associated with refunding excess WHT and liquidity costs
Source: Copenhagen Economics.
5.5. INTERACTION WITH THE PARENT SUBSIDIARY DIRECTIVE The Parent-Subsidiary Directive aims at reducing double taxation by eliminating withhold-
ing taxes on dividend payments between (most) associated entities in EU Member States, i.e.
investments where the ownership share is above 10 per cent.60 When Member States contin-
ue to impose withholding taxes on dividend payments on portfolio equity investment, i.e.
investments where the ownership share is below 10 per cent, they introduce an incentive for
60 The Parent-Subsidiary has certain conditions on the relief from withholding taxes related to ownership shares, holding periods and organisational form of the entities involved.

Taxation of cross-border dividend payments within the EU
109
firms to distort holding structures in order to qualify for the relief. Requirements related to
holding structure may consequently impose economic costs on firms in the event of restruc-
turings and mergers where flexibility may be severely limited. Eliminating withholding taxes
on dividend payments on portfolio equity investments may allow EU companies to move
closer to their preferred ownership structure.
If such a tax-planning behaviour is pronounced among EU Companies, we would expect to
observe a peek in the number of companies having an ownership share just above 10 per
cent. However, the bulk of parent companies have ownerships shares around 50 per cent or
above, so this distortion seems to be affecting only a very small number of companies, cf.
Figure 5.3. Factors other than the requirements in the Parent-Subsidiary Directive appear to
be driving the holding structure in EU companies.
Figure 5.3 The organisational structure of EU firms
Note: Estimated with 1000 holding links where both the parent company and the subsidiary have a legal form
that falls under the Parent-Subsidiary Directive. Source: Copenhagen Economics.
5.6. SENSITIVITY ANALYSIS We have undertaken a sensitivity analysis of the assumption that 100 per cent of the CIVs
are non-transparent. We have recalculated the CIV’s tax burden related to WHTs under the
assumption that only 80 per cent of the companies are non-transparent. In the current situa-
tion, the 80 per cent assumption would means that CIVs would face a small extra WHT
burden equal to €53 millions (or a 3 per cent change). A similar picture arises under Option
6 whereas the results under Option 2-Option 5 are insensitive to this assumption, cf. Table
5.4.

Taxation of cross-border dividend payments within the EU
110
Table 5.4 Sensitivity analysis on CIV’s treaty entitlements
CIVs WHT tax burden (100 pct treaty entitlements)
CIVs WHT tax burden (80 pct treaty entitlements)
CIVs WHT tax burden (60 pct treaty entitlements)
Option 1 1983 2043 2103
Option 2 0 0 0
Option 3 265 265 265
Option 5 1040 1040 1040
Option 6 120 124 124
Note: The model calculations has assumed that all CIV’s are eligible for treaty entitlements. This sensitivity anal-ysis shows that changing the treaty entitlement share to a lower amount does not change results by much.
Source: Copenhagen Economics.
Taxation of cross-border dividend payments within the EU
111
Copenhagen Economics (2010), “Impact of EU FDI on the EU Economy”, DG Trade.
Corbett J. and T. J. Jenkings (1998), “How is Investment Financed?” A Study of Germa-
ny, Japan, UK and US, Manchester School 15: 69-93.
Corbett, J., Edwards, J., Jenkinson, T., Mayer and C., Sussman, O. (2004), a response to
Hackethal and Schmidt (2003) “Financing Patterns: Measurement Concepts and
Empirical Results”, Said Business School, Oxford University: mimeo.
De Mooij A, and Enderveen S, (2006), “What a Difference Does it Make? Understanding
the Empirical Literature on Taxation and International Capital Flows”, paper pre-
pared for the workshop of DG ECFIN of the European Commission.
Demirguc-Kunt, A. and H. Huizinga (2001), “The Taxation of Domestic and Foreign
Banking”, Journal of Public Economics 79: pp. 429–453.
European Commission (2009), “The Economic Impact of the Commission Recommenda-
tion on Withholding Tax Relief Procedures and the FISCO Proposals”, DG Inter-
nal Market and Services, Commission staff working document.
European Commission (2010), “Simplified Withholding Tax Relief Procedures”, DG In-
ternal Market and Services, Brussels.
Faruqee, H., S. Li, and I. K. Yan (2004), “The Determinants of International Portfolio
Holdings and Home Bias”, IMF Research Department Working Paper WP/04/34.
Feld.P.L and Heckmeyer,H.J (2009), “FDI and Taxation; Meta Study”, Cesifo Working
Paper 2540.
Mayer, C. (1988), “New Issues in Corporate Finance”, European Economic Review 32:
pp. 1167–89.
Parikh, B. R., P. Jain and R. W. Spahr (2011), “The Impact of Double Taxation Treaties on
Cross-border Equity Flows, Valuations and Cost of Capital”.
Poterba, J. M. (2000), “Taxation and Portfolio Structure: Issues and Implications”, MIT
and NBER.
REFERENCES

Taxation of cross-border dividend payments within the EU
112
Rajan, R. and Zingales, L. (1995), “What Do We Know About Capital Structure? Some Ev-
idence from International Data”, Journal of Finance 50: pp. 1421–60.
Ratto, M., Röger, W. In’t Veld, J. And R. Girardi (2004), “An Estimated New Keynesian
Dynamic Stochastic General Equilibrium Model of the Euro Area”, European
Commission, Economic Papers no. 220.
Van Treck, T. (2008), “The Political Economy Debate on Financialisation’ – A Macroeco-
nomic Perspective”, IMK Working Paper 01.