taxation and state participation in nigeria ver...
TRANSCRIPT

Joint UNDP/World Bank Energy Sector Management Assistance Programme
(ESMAP)
Taxation and State Participation in Nigeria’s Oil and Gas Sector
August 2004
Pub
lic D
iscl
osur
e A
utho
rized
Pub
lic D
iscl
osur
e A
utho
rized
Pub
lic D
iscl
osur
e A
utho
rized
Pub
lic D
iscl
osur
e A
utho
rized
Pub
lic D
iscl
osur
e A
utho
rized
Pub
lic D
iscl
osur
e A
utho
rized
Pub
lic D
iscl
osur
e A
utho
rized
Pub
lic D
iscl
osur
e A
utho
rized

Copyright © 2004 The International Bank for Reconstruction and Development/THE WORLD BANK 1818 H Street, N.W. Washington, D.C. 20433, U.S.A. All rights reserved Manufactured in the United States of America First printing August 2004 ESMAP Reports are published to communicate the results of ESMAP’s work to the development community with the least possible delay. The typescript of the paper therefore has not been prepared in accordance with the procedures appropriate to formal documents. Some sources cited in this paper may be informal documents that are not readily available. The findings, interpretations, and conclusions expressed in this paper are entirely those of the author(s) and should not be attributed in any manner to the World Bank, or its affiliated organizations, or to members of its Board of Executive Directors or the countries they represent. The World Bank does not guarantee the accuracy of the data included in this publication and accepts no responsibility whatsoever for any consequence of their use. The Boundaries, colors, denominations, other information shown on any map in this volume do not imply on the part of the World Bank Group any judgement on the legal status of any territory or the endorsement or acceptance of such boundaries. Papers in the ESMAP Technical Series are discussion documents, not final project reports. They are subject to the same copyrights as other ESMAP publications. The material in this publication is copyrighted. Requests for permission to reproduce portions of it should be sent to the ESMAP Manager at the address shown in the copyright notice above. ESMAP encourages dissemination of its work and will normally give permission promptly and, when the reproduction is for noncommercial purposes, without asking a fee.

iii
CONTENTS
Acknowledgments......................................................................................................ix
Abbreviations and Acronyms ...................................................................................xi
Units of Measure........................................................................................................xii
Currency Equivalents................................................................................................xii
Executive Summary.....................................................................................................1
1. Introduction......................................................................................................5
Nigeria’s Resource Endowment........................................................................5
Economic Relevance.........................................................................................6
Taxation and Participation Roles.......................................................................7
2. Oil and Gas Taxation.......................................................................................9
Tax System Design............................................................................................9
Design Objectives..................................................................................9
Tax Instruments ...................................................................................11
Pretax Economic Environment............................................................14
Nigeria’s Existing Tax System.............................................................18
Evaluation of Tax Design.....................................................................23
Tax Administration...........................................................................................34
Objectives ............................................................................................34
Evaluation of Existing Administration ..................................................35
Sectorwide Analysis.........................................................................................38
Results 1994-1999...............................................................................38
Commentary ........................................................................................38
3. State Participation.........................................................................................41
Objectives ........................................................................................................41
Forms of Participation......................................................................................41
The Nigerian Joint Venture..............................................................................42
Future Options .................................................................................................43
4. Conclusions and Recommendations..........................................................47

iv
Oil Taxation ......................................................................................................47
Natural Gas Taxation.......................................................................................48
Tax Administration...........................................................................................49
Sectorwide Analysis.........................................................................................49
State Participation............................................................................................50
Annex 1 Principal Features of the Existing Tax/Royalty/MOU System......51
Annex 2 Principal Features of the New MOU/Technical Evaluation...........65
Annex 3 Summary of Production Sharing Contract Terms .........................69
Annex 4 Summary of Gas Terms ....................................................................73
Annex 5 Details of the Analysis ......................................................................77
Annex 6 New Approaches to Profit Sharing in Developing Countries.......83
Ad Hoc Approaches to Fiscal Flexibility..........................................................85
ROR-Based Profit Sharing ..............................................................................89
Advantages of ROR-Based Profit Sharing......................................................95
Criticisms of ROR-Based Profit Sharing .........................................................96
Conclusions .....................................................................................................98
Annex 7 Proposed Alternative Production Sharing Contract Terms .........99
List of Figures:
Figure 1.1: Oil Reserves (Billion barrels) .....................................................................5
Figure 1.2: Oil Production (MBD) .................................................................................6
Figure 1.3: Gas Reserves (Tcf) ....................................................................................6
Figure 1.4: Oil and the Budget—1996..........................................................................7
Figure 2.1: U.S. Gulf Crude Netback Prices (1999)...................................................15
Figure 2.2: Oil Price Volatility .....................................................................................15
Figure 2.3: Economic Cost Per Barrel........................................................................16
Figure 2.4: Pretax Rate of Return for Different Oil Project Scenarios .......................17
Figure 2.5: Pretax Rate of Return for Different Gas Projects ....................................18
Figure 2.6: Gas Flared, Reinjected and Marketed—International Comparison ........22
Figure 2.7: Broad-Based Development (Rate of Return) ..........................................24

v
Figure 2.8: Government Share of Rents—Oil Price US$18/bbl ................................25
Figure 2.9: Government Share of Rent—International Comparison .........................25
Figure 2.10: Progressivity—Government Take..........................................................26
Figure 2.11: Progressivity—Investor's ROR ..............................................................26
Figure 2.12: Investor’s ROR—Sensitivity to Operating Expenditures .......................28
Figure 2.13: Impact of Consolidation—Investor ROR................................................30
Figure 2.14: Impact of Gas Incentives .......................................................................32
Figure 2.15: Impact of Gas Incentives Consolidating with the Downstream Expenditures ....................................................................................................32
Figure 2.16: Government Share of Rents: International Comparison .......................33
Figure 2.17: Revised Incentives and Pricing..............................................................34
Figure 2.18: Impact of Tax Management ...................................................................36
Figure 2.19: Sectorwide Results, 1995–1999............................................................39
Figure 3.1: Financial Participation and Tax/PSC Alternatives ...................................43
Figure 3.2: Financial Participation : Alternative Uses of Funds .................................44
Figure A.2.1.: Comparison 1991 versus 1996 MOU Margins: High CapEx Margin .66
Figure A.2.2: Comparison 1991 versus 1996 MOU Margins: Low CapEx Margin....67
Figure A.2.3: Impact of the Tax Inversion Mechanism. Effective Tax Relief Rate ....68
Figure A.5.1: Sensitivity on Rate of Return: Small Oil Field – MOU 1991 ................77
Figure A.5.2: Sensitivity on Rate of Return: Medium Oil Field – MOU 1991 ............77
Figure A.5.3: Sensitivity on Rate of Return: Large Oil Field MOU 1991 ...................78
Figure A.5.4: Sensitivity on the Rate of Return: Onshore Oil Field – MOU 1991 .....78
Figure A.5.5: Sensitivity on Rate of Return : Small Oil Field – MOU “new” ..............78
Figure A.5.6: Sensitivity on Rate of Return : Medium Oil Field – MOU “new” ..........79
Figure A.5.7: Sensitivity on Rate of Return: Large Oil Field – MOU “new” ...............79
Figure A.5.8: Sensitivity on Rate of Return : Onshore Oil Field MOU “new” ............79
Figure A.5.9: Sensitivity on Rate of Return : Small Oil Field – PSC..........................80
Figure A.5.10: Sensitivity on Rate of Return: Medium Oil Field – PSC.....................80
Figure A.5.11: Sensitivity on Rate of Return : Large Oil Field – PSC .......................80
Figure A.5.12: Sensitivity on Rate of Return : Deep Offshore Oil Field – PSC.........81
Figure A.6.1: Schematic Representation of Fiscal Flexibility.....................................85

vi
Figure 6.1.2: Contractor ROR Sensitivities ................................................................96
Figure A.7.1: Project IRR Sensitivity (Medium Offshore) ........................................100
Figure A.7.2: Government Take Sensitivity .............................................................101 List of Tables:
Table 1.1: Nigerian Hydrocarbon Reserves.................................................................5
Table 1.2: Relative Petroleum Dependence ................................................................6
Table 1.3: Performance Indicators ...............................................................................7
Table 2.1: Technical Assumptions .............................................................................17
Table 2.2: Summary of Tax/Royalty/MOU .................................................................19
Table 2.3: Key Elements of the 1991 MOU ...............................................................19
Table 2.4: Differences between 1991 MOU and New MOU......................................21
Table 2.5: Summary of Production Sharing Contracts ..............................................22
Table 2.6: Summary of Upstream Fiscal Incentives for Gas .....................................23
Table 2.7: Summary of Downstream Fiscal Terms for Gas.......................................23
Table 2.8: Deterrents to Costs Containment..............................................................27
Table 2.9: Pre- and Post-Tax Operating Costs (US$/bbl) .........................................28
Table 2.10: Impact of ITA on Post-Tax Costs (US$/bbl) ...........................................28
Table 2.11: Impact of Accelerated Depreciation on Costs (US$/bbl) ........................29
Table 2.12: Impact of Consolidation on Costs (US$/bbl)...........................................29
Table 2.13 : Distribution of Fiscal Revenues .............................................................31
Table 2.14: Tax Payment Procedures........................................................................37
Table A.1.1: Current Royalty Rates ...........................................................................52
Table A.1.2: Annual Allowance Rate..........................................................................57
Table A.1.3: Investment Tax Credit............................................................................59
Table A.1.4: MOU Provisions .....................................................................................62
Table A.1.5: Reserves Addition Bonus ......................................................................63
Table A.2.1.: Oil Price < US$15/bbl ...........................................................................65
Table A.2.2: Oil Price > US$19/bbl ............................................................................66
Table A.2.3: Tax Inversion Mechanisms....................................................................67
Table A.3.1: Royalties ................................................................................................70

vii
Table A.3.2: Profit Sharing .........................................................................................71
Table A.5.1: Impact of the ITA and the RAB on Projects Economics .......................81
Table A.6.1: Sample Approaches to Fiscal-Flexibility* ..............................................86
Table A.6.2: Responsiveness of Fiscal Provisions to Determinants of Project Profitability .......................................................................................................88
Table A.6.3: Illustrative Computation of Two-Tier Rate-of-Return Profit Sharing .....92
Table A.6.4: Countries Where ROR-based Profit Sharing Is Used...........................94
Table A.7.1: Profit Sharing .........................................................................................99
Table A.7.2: Rate of Return......................................................................................100
Table A.7.3: Government Take ................................................................................100


ix
Acknowledgments
This report was prepared for the Federal Government of Nigeria at its request and presented to the Office of the Presidential Advisor on Petroleum in January 2000. Charles McPherson, Senior Adviser, Oil and Gas Policy Division, Oil, Gas, Mining, and Chemicals Department, World Bank Group, was the principal author of the report, with significant input in the preparation of project economics from Yoanis Mamar, Consultant. HIS Energy provided all underlying data. Esther Petrilli, Oil and Gas Policy Division, edited and formatted the report with the help of Carmen Pineda, Oil and Gas Policy Division. ESMAP provided the funding for printing the report. Ms. Marjorie Araya from ESMAP supervised production, printing, distribution and dissemination of this report. Any remaining errors are the sole responsibility of the author.


xi
Abbreviations and Acronyms AGFA Associated Gas Framework Agreement
CaPex Capital Expenditures CBN Central Bank of Nigeria
CGT Capital gains tax CGTA Capital Gains Tax Act
CIT Corporate income tax
CITA Companies Income Tax Act DCF Discounted cash flow DPR Department of Petroleum Resources
E&A Exploration and appraisal E&P Exploration and production
ESMAP Joint UNDP/World Bank Energy Sector Management Assistance Programme
FGN Federal Government of Nigeria FIRS Federal Inland Revenue Service
FOB Free on board GDP Gross domestic product GHG Greenhouse gas
IT Information technology ITA Investment tax allowance ITC Investment tax credit
JV Joint venture LNG Liquid natural gas MOU Memorandum of Understanding
NAPIMS National Petroleum Investment Management Strategy NCF Net cash flow
NLNG Nigeria liquefied natural gas
NNPC National Nigerian Petroleum Company OML Oil mining licenses
OMPADEC Oil Mineral Producing Areas Development Commission
OPEC Oil-Producing and Exporting Countries OpEx Operational Expenditures OPL Oil prospecting licenses
OPTS Oil producers trade sector OSP Official selling price

xii
PEPS Petroleum economics and policy solutions PPT Petroleum profits tax
PPTA Petroleum profits tax amendment PPTA Petroleum Profits Tax Act
PSC Production sharing contract
RAB Reserve addition bonus RGT Revised government take ROR Rate of return
Units of Measure bbl Barrels
Mbd Thousand barrels per day
Mcf Thousand cubic feet MMb Million barrels
MMbd Million barrels per day
Mmbd Thousand barrels per day Tcf Trillion cubic feet
Currency Equivalents
95 Naira (N) US$1.00

1
Executive Summary
Introduction
1. Oil and gas are critical to Nigeria’s economic and social performance. Oil alone accounts for 40 percent of the country’s GDP, 70 percent of budget revenues, and 95 percent of foreign exchange earnings. Nigeria’s dependence on petroleum is much greater than that of many other major producing countries.
2. Taxation and state participation are both designed to deliver benefits from the petroleum sector to the state and are the subject of this report. The report was prepared by World Bank staff at the request of the Federal Government of Nigeria (FGN) and is based on missions to Nigeria in January and July 2000. Earlier drafts were presented to and discussed with the government at that time. The report is one of four components of a wider petroleum sector review. The report’s principal conclusions and recommendations are given below.
Oil Taxation
3. Broadly speaking, both versions of the Tax/Royalty/Memorandum of Understanding (MOU) systems (the 1991 MOU and the proposed new MOU) and the current model Production Sharing Contracts (PSCs) meet most oil taxation objectives, including the provision of adequate incentives to invest, transfer of a major share of project rents to the government, a modestly progressive government take (in the case of the MOUs), and international competitiveness. A major revision of the existing levels or structure of oil taxation is not recommended, especially given the present need to retain and increase investor confidence in Nigeria.
4. However, several areas merit further discussion and review and could benefit from a revision of terms if mutually agreed between the government and the investor, or from the introduction of new terms in new licenses:
• Small Fields: Small field development is not commercially viable under existing terms. A revision in terms to make these projects interesting to investors represents a “win-win” opportunity. Not only would investors gain from the wider range of commercial possibilities, but the government would also stand to benefit from an expanded tax base.
• Deep Offshore: Incentive terms have been granted to “frontier” areas such as the deep offshore to compensate for risk and to attract first investors. Some of these areas are now beginning to mature, and a review of terms is probably warranted for new award rounds. This could involve not only a reassessment of the appropriate level of government take, but also improvements in the applicable PSC structure to increase its efficiency and its sensitivity to underlying project profitability. Certainly the use of

2 Taxation and State Participation in Nigeria
cumulative production thresholds to escalate government take should be reconsidered since these can be expected to act as a disincentive to incremental investment in existing fields or new fie lds.
• Cost Containment: Many of the provisions of the existing tax systems, while satisfying other objectives, counter the objective of cost containment. This sort of tension is not uncommon in tax systems and is certainly not unique to Nigeria. The provisions in question, for example, the investment allowance, accelerated depreciation, and consolidation, should be reviewed to see whether there is room for improvement in their design (the “tax inversion” clause in the new MOU is an interesting innovation in this respect), but probably the greater implication of this finding is the need for institutional capacity to monitor costs effectively.
• Complexity: The MOUs “work,” but their provisions are nontransparent to the uninitiated and the formulas required for their application are complex. This increases the difficulty and cost of tax administration and creates a need for renegotiation from time to time as the elaborate terms become outdated. New models, for example, systems of tax or take linked to the investor’s achieved rate of return, which are simpler and at the same time probably more sophisticated, should be considered for future operations. The same models could be used to improve the performance of PSCs in any future licensing rounds.
• New MOU: In a reasonably likely range of future oil prices, the proposed new MOU modestly improves expected returns for investors (one of the sought after “updates”) by increasing the minimum guaranteed margin and the margin for prices in excess of US$19 per barrel. By narrowing the band in which the guaranteed margin applies, it also shifts some risk back to investors. It provides a desirable incentive to contain operating costs by increasing the post-tax cost to contractors of costs in excess of a target threshold. And, finally, it removes the reserve addition bonus (RAB), which was successful in encouraging reserve additions (and consequently raising Nigeria’s OPEC quota), but had become very difficult to police against abuse and very costly in terms of reduced tax revenues. The new MOU should be finalized as soon as possible to put to rest present uncertainty over terms.
Natural Gas Taxation
5. Nigeria has given an intended and successful boost to gas development by offering very favorable fiscal incentives. In certain circumstances, however, the incentives can produce disturbing results. In particular, provisions which allow gas development costs to be consolidated with oil income which is taxed at an 85 percent rate while gas revenues are taxed at only a 30 percent rate can provide an investor with a post-tax rate of return which is greater than the project’s pretax rate of return. If the investor is

Executive Summary 3
allowed to consolidate his upstream gas development costs with oil revenues and the costs of the downstream industrial plant or power plant which consumes the gas, this undesirable effect is exaggerated. Clearly, gas incentives should be revised to prevent this sort of result in the future. To avoid damaging Nigeria’s credibility with investors, care will have to be exercised with respect to planned or ongoing projects in which investments have been committed or made on the basis of current incentives.
6. Gas pricing will be a key parameter in the successful promotion of investments for the domestic market. Acceptable gas prices in turn will depend critically on achieving power sector reform. Credible procedures for payment in both sectors will be as important as the price itself in attracting investment.
7. The whole area of gas fiscal penalties (flaring), incentives, and economic pricing is in need of a comprehensive review and strategy.
Tax Administration
8. The institutional capacity to administer petroleum taxes effectively is woefully lacking. Procedures, reinforced by third party audits, appear to ensure that taxes are paid and received albeit with potentially serious and costly internal lags. However, Nigeria lacks capacity (a) to assess the reasonableness of the returns submitted by taxpayers, including costs (b) to develop petroleum tax policy or (c) to assess or negotiate proposals for change. Staffing, skills, pay scales, and other funding, and computer and IT infrastructure, are all issues that need to be addressed urgently. These comments apply to each of the several agencies involved in oil and gas tax administration: FIRS, the Central Bank, NAPIMS, DPR, and the Ministry of Petroleum Resources. These findings are corroborated in a companion report prepared by the World Bank on the Flow of Funds in the Nigerian Petroleum Sector.
Sectorwide Analysis
9. Sectorwide analysis of results over the period from 1995–1999 suggests that tax design has had little adverse impact on the stability of oil tax revenues. As a result of the size and maturity of Nigeria's oil sector, the impacts of consolidation and similar provisions on the stability and timing of revenues, which are noticeable at the project level, have been smoothed out at the sector level. However, the behavior of oil prices is a much more important factor, when it comes to revenue instability. The significant instability that is observed argues strongly for the introduction of policies to stabilize the impact of price fluctuations on the macroeconomy, and, in the case of positive windfalls, for an orderly set-aside of some revenues for future national use.
10. The analysis also revealed that gross sector revenues were essentially fully accounted for by audited costs submitted for tax purposes, actual tax and royalty payments, and allowable oil producer margins. If taxes are being underpaid, non-compliance does not appear to be a major factor (although the Flow of Funds Review points to several discrepancies which need to be reviewed). The main focus of any

4 Taxation and State Participation in Nigeria
investigations in this area should probably be on verification of the reasonableness of costs used in tax calculations (hence the importance of the FGN's ongoing Value for Money Audit).
State Participation
11. National Nigerian Petroleum Company’s (NNPC) equity participation in upstream oil and gas projects is perceived as providing Nigeria with a number of nonfinancial benefits—greater control in a strategic sector, development of local capacity, and so forth. It is also seen as providing an attractive equity return, superior to that which might be earned in other sectors where public funds have been squandered. However, equity participation generates only a relatively small financial benefit relative to what would be collected through taxes with effective tax administration in any event. Further, that incremental benefit could be easily eroded by delays in project startup caused by NNPC failures to meet funding obligations in a timely manner or by interest costs, chargeable to NNPC, incurred by NNPC’s partners who borrow to meet NNPC’s shortfall. Further, the sums required to maintain NNPC’s financial participation at current levels are substantial, well in excess of funding going to other critical infrastructure and social sectors and can expose the government to significant technical and commercial risks.
12. Production Sharing Contracts, which entail no state financing, will solve the funding problem with respect to new licenses, but the joint venture licenses where NNPC does have obligations still account for 97 percent of production and can be expected to generate a number of near-term new development projects. While full disposal of the state's equity share in the near term seems improbable in the extreme and perhaps not even desirable, partial disposition at least merits discussion. Selling down a part of NNPC’s equity interests in these licenses could reduce future funding obligations to more manageable levels and release funds for other uses. It would also have the advantage of generating cash immediately for Nigeria the value of a net 10 percent sale is estimated at close to US$3.0 billion. Of course, the merits of shifting from equity to simple fiscal participation depend crucially on the ability to collect taxes. While there is ample room for improvement in tax administration, it appears that taxes and royalties are being collected in full.

5
1 Introduction
Nigeria’s Resource Endowment
1.1 Nigeria is blessed with a major hydrocarbon resource endowment, both in absolute terms and relative to other petroleum-producing countries.
Table 1.1: Nigerian Hydrocarbon Reserves
Oil Gas
Reserves 22 billion barrels 124 tcf
Production 2.2 mmbd 1300 bcfd (1/)
1.2 Nigeria’s oil reserves represent 6 percent of the world’s total outside the Middle East. Oil production is 4 percent of the world’s total excluding the Middle East.
Figure 1.1: Oil Reserves (Billion barrels)
6 %
3 %1 % 1 %
2 %
1 9 %
1 3 %
0
1 0
2 0
3 0
4 0
5 0
6 0
7 0
8 0
N i g e r i a N o r w a y I n d o n e s i a M a l a y s i a A l g e r i a V e n e z u e l a M e x i c o
B B b l % o f w o r l de x c l . M E
1.3 It is increasingly common to hear Nigeria referred to as more a gas province than an oil province. Nigeria’s gas reserves, conservatively estimated, account for 4 percent of the world’s total outside the Middle East.

6 Taxation and State Participation in Nigeria
Figure 1.2: Oil Production (MBD)
4 %
6 %
3 %
2 %
3 %
7 %7 %
0
5 0 0
1 0 0 0
1 5 0 0
2 0 0 0
2 5 0 0
3 0 0 0
3 5 0 0
4 0 0 0
N i g e r i a N o r w a y I n d o n e s i a M a l a y s i a A l g e r i a V e n e z u e l a M e x i c o
M B D
% o f w o r l de x c l . M E
Figure 1.3: Gas Reserves (Tcf)
3 . 6 %
1 . 2 %
2 . 1 %2 . 4 %
3 . 8 %4 . 2 %
1 . 9 %
0
2 0
4 0
6 0
8 0
1 0 0
1 2 0
1 4 0
1 6 0
N i g e r i a N o r w a y I n d o n e s i a M a l a y s i a A l g e r i a V e n e z u e l a M e x i c o
T C F% o f w o r l d
e x c l . M E
Economic Relevance
1.4 Not surprisingly, oil and gas are central to the Nigerian economy. Oil accounts for 40 percent of gross domestic product (GDP), 70 percent of government revenues, and 95 percent of the country’s foreign exchange earnings. In fact, Nigeria’s relative dependence on oil is much greater than that of many other oil-producing countries.
Table 1.2: Relative Petroleum Dependence
Petroleum accounts for % GDP % Gov Rev % Exports
Nigeria 40 70 95
Norway 10 15 50 Indonesia 10 25 15
Algeria 30 65 80
Venezuela 28 55 70 Mexico 2 30 6

Introduction 7
1.5 Budget revenues from oil are capable of funding critical social programs in Nigeria at well above current levels.
Figure 1.4: Oil and the Budget—1996
0
5 0
1 0 0
1 5 0
2 0 0
2 5 0
3 0 0
3 5 0
P e t r o l e u m R e v e n u e P e t r o l e u m S e c t o rA l l o c a t i o n
H e a l t h E d u c a t i o n T r a n s p o r t &C o m m u n i c a t i o n
B i l l i o n N a i r a
1.6 Unfortunately, Nigeria has failed to deliver on the most basic development targets, despite the enormous wealth its petroleum sector has generated over the past 25 years.
Taxation and Participation Roles
1.7 Translating oil and gas activity into economic development depends on: (a) capture for the budget of a significant share of the real and potential revenues generated by the sector; and (b) appropriate public expenditure programs. This report is about the former, namely the efficient capture of revenues through either taxation or direct state participation in the sector. The report concludes that this capture has been mostly successful which brings the importance of the latter, that is, appropriate public expenditure programs into sharp focus.
Table 1.3: Performance Indicators
Target Nigeria
GDP per capita (US$) 895.0 400.0 Population < US$2 per day (%) 0 60.0
Infant mortality /1000 5.0 78.0
Under 5’s malnutrition (%) 0 35.0 Female adult illiteracy (%) 0 53.0
Access to sanitation in cities (%) 100.0 61.0
CO2 (kg/(1997) US$ of GDP 0.3 2.7 GDP growth (average 90-96 (%) 7.1 2.6
Inflation (average 90-96) (%) 2.0 37.6
Oil Rents over the past the 25 years: US$300 Billion


9
2 Oil and Gas Taxation
2.1 The effectiveness of any oil and gas taxation system is a function of: (a) its design; and (b) its implementation. These topics are addressed in the sections on Tax System Design and Tax Administration below, with special emphasis on the case of Nigeria. The section on Sectorwide Analysis provides a sectorwide analysis of the results produced by the Nigerian taxation system over the past five years.
Tax System Design
Design Objectives
2.2 In designing or critiquing a tax system, it is essential to specify clearly the objectives which the system is meant to satisfy or against which it will be judged. The objectives discussed here are those most frequently referenced in the context of oil and gas taxation.
2.3 Broad Range of Activities: The tax system should encourage a broad range of oil and gas exploration and production activities, provided always that these are beneficial from society’s perspective. An activity will be socially beneficial if it generates pretax benefits or returns in excess of the costs associated with it, including an adequate return on capital and on any social or environmental costs.
2.4 Investors, however, base their decisions on post-tax rather than pretax returns. If it is to achieve a socially desirable allocation of resources, the tax system, to the maximum extent possible, should ensure that all projects with positive pretax returns show positive post-tax returns as well. The increased activity that such a system would encourage would be not only desirable in its own right, but would also be attractive from a fiscal perspective in that it would expand the tax base.
2.5 Fair Share for the State: The excess of a project’s pretax benefits over cost, including the minimum return on capital required to attract investment, is referred to as “economic rent.” It is generally accepted that a major share of project rents should go to the resource’s owner, typ ically the state. What is appropriate when it comes to the state’s share or “take” will depend on a number of considerations, including the taxing country’s existing resource base and prospects, perceived project or country risks, the level of take in other oil and gas producing states, and so forth. The correct way to

10 Taxation and State Participation in Nigeria
express take is as a percentage of the "full-cycle" project net cash flow, discounted at the minimum required return on capital. Full-cycle rates of take in international practice generally fall inside a range of 45– 50 percent at the low end, to 80–85 percent at the high end.1
2.6 Progressive Taxation: Most countries attempt to vary government take as a progressive function of project rent or profitability. Where the attempt is successful, it will increase government revenues without negatively impacting incentives to explore and produce. In practice, however, a positive correlation between take and profitability has proved difficult to achieve (see paragraphs 2.25, 2.26). As a result of choice of tax instruments, many oil and gas tax systems end up behaving regressively rather than progressively, that is, increasing rather than decreasing take as profitability declines and thus limiting the range of commercially viable exploration and production activity.
2.7 Cost Containment: High costs reduce the rent or profit available for sharing between government and investor, hence tax systems should give every incentive to the investor to contain costs. High marginal tax rates, resulting in low after-tax costs, loose definitions of recoverable cost, provisions for accelerated cost recovery, or recovery, of a multiple of costs, while serving other purposes, do erode incentives to control costs.
2.8 Timing and Stability of Tax Revenues: Governments typically have preferences as to the timing and predictability of tax revenues which may affect tax design. Most governments will place a premium on early revenues to address urgent budget issues or deliver on political promises. And for the sake of fiscal planning, they are likely to favor tax systems that will produce some minimum stability in tax revenues. These considerations are likely to be of greater importance to countries with smaller or newer oil sectors where the profile of sector revenues depends on only a few projects. Where the sector is larger and relatively mature, as in Nigeria, a mix of projects at various stages of development and tax exposure will tend to smooth out the flow of tax revenues.
2.9 Federal/Regional Revenue Sharing: Petroleum resources are often concentrated within one or two regions of a larger state or federation. This is certainly true in Nigeria. The tax system should provide for an appropriate, acceptable, and stable division of tax revenues among levels of government.
2.10 The strongest argument in favor of allocating oil and gas tax revenues to regional or local levels is because many of the social costs of exploiting these resources are localized. These include environmental degradation and demands for special infrastructure.
1 Rates of take are sometimes expressed in annual rather than full-cycle terms, that is, government revenues from taxes, royalties, and so forth, as a percent of annual cash flow or net income. These may be higher or lower than full-cycle returns depending on the stage in the project cycle at which measurement is taken. While annual rates of take may give an indication of the incentive to continue production or not, they do not say anything about the incentive to invest.

Oil and Gas Taxation 11
2.11 How tax revenues are finally shared will depend critically on politics, and in particular on the nature of federalism in the country involved, that is, the relative importance of federal and regional views.
2.12 In the final analysis, what is important to investors is that the sharing issue be clearly resolved and that there be substantial cooperation among the levels of government to ensure reasonable stability in the tax package imposed on the investor.
2.13 International Competitiveness: Petroleum is a global business. In establishing an oil and gas tax regime, the host country has to take into account the regime’s likely impact on the ability of the domestic sector to compete for investment capital with other oil and gas provinces. While many factors enter into the international competitiveness of a country’s petroleum sector, the tax regime is one of the most important for the investor. Both the level and structure of taxes will be of critical relevance, as will be the investor's ability to avoid double taxation, that is, taxation in both the host and home country. This latter factor is a function of tax design, and investor concerns can normally be accommodated without revenue loss to the host country.
2.14 What it takes to be competitive may change over time. Countries experiencing circumstances of extreme economic and political uncertainty will have to try harder than more settled petroleum-producing countries.
2.15 Over the past few years, the oil and gas industry has seen a strong increase in competition among governments to attract oil investors. This was caused by the opening up of new areas holding significant prospects such as the Caspian Sea and Angola, the low oil price environment experienced through mid-1999, and the limited availability of investment funds. To the extent that recent high prices can be maintained, this competitive challenge may become less important.
Tax Instruments
2.16 A wide range of tax instruments is currently applied to oil and gas production around the world. The next several paragraphs consider the relative merits of a selection of these instruments in meeting the objectives set out above.
2.17 Profit-Based Taxes: Profit-based taxes, as the name implies, are levied on the difference between revenues and costs. Under profit-based taxation, a project which shows a positive pretax return, will show a positive, albeit smaller, post-tax return, thus satisfying the important objective of encouraging a broad range of activities. This attribute of profit-based taxation is very persuasive and accounts for the widespread use of profit-based taxes.
2.18 Profit-based taxes come in a variety of forms. The Corporate Income Tax (CIT), Petroleum Profits Tax (PPT), and the production share currently applied in Nigeria are all profit-based taxes.

12 Taxation and State Participation in Nigeria
2.19 The principal disadvantage of profits taxation is the demand that it places on tax administration. Effective administration of profit-based taxes requires the collection, presentation, and audit of prices, volumes, and a sometimes bewildering variety of costs on a timely basis. Especially where tax administration is weak, profit-based taxes may offer taxpayers considerable scope for tax evasion through misrepresentation of revenues or cost inflation. Given the powerful economic arguments in favor of profits taxes, however, their administration’s difficulties argue for putting more resources into institutional capacity building, rather than for reducing reliance on profits taxes.
2.20 Revenue and Excise Taxes: Revenue taxes are expressed as a percentage of the production value. The royalties applied in Nigeria are revenue taxes. Excise taxes are expressed as a fixed charge per unit of production.
2.21 The main argument in favor of these taxes is the relative simplicity of their administration. A second argument in their support is that they provide early revenue. They apply the moment production begins and do not have to wait until the project begins to generate a profit.
2.22 The principal drawback of these taxes is their insensitivity to profit. Because they are not levied on profit, it is quite possible that established production or projects with positive pretax returns may not have positive post-tax returns, that is, the royalty or excise tax may equate to more than 100 percent of the pretax profit. The higher the revenue or excise tax and the more modest or marginal the pretax return, the more likely this outcome becomes, with the result that existing socially desirable production is suspended or abandoned and investment in new socially desirable production is deferred or cancelled.
2.23 A second important negative attribute of revenue and excise taxes can also be traced to their insensitivity to profit. Because these taxes are unaffected by profitability, they will increase as a percentage of profits as profits decline and decrease as profits increase, that is, their behavior with respect to profits is regressive rather than progressive. In the former case (declining profits), they will act to limit the range of commercially viable projects and erode the tax base; and in the latter case (increasing profits) they will cause potential tax revenues to be “left on the table.”
2.24 Appreciation of the disadvantages of revenue and excise taxes has led most mature petroleum-producing areas to either discontinue their use or restrict their effective rates to modest levels. Royalties at a 10 percent level are not uncommon.
2.25 Flexible Taxes: Most petroleum-producing countries have adjusted their tax systems to cause simple profit-based taxes to behave progressively and/or to reverse the regressive behavior of revenue and excise taxes. The mechanisms used to create flexible, progressive taxes vary considerably and may include one or more of the following:
Oil and Gas Taxation 13
• Simple Indicators. Tax or take levels are often tied to such simple indicators of profitability as location (onshore versus offshore, shallow versus deepwater, established versus frontier areas), perceptions of geological complexity, or operational difficulty.
• Price Levels. Government take is sometimes explicitly linked to price on the assumption of a predictable relationship between prices and profitability.
• Production. Government take may be escalated as a function of cumulative or daily production, reflecting an expected correlation between field size and project profitability.
• Costs. Tax systems may include cost recovery “uplifts” (that is, allowable deductions of some multiple of costs incurred. The investment credit is an example of this) or rapid write-offs of capital costs designed to shelter projects from high rates of government take until certain minimum profitability levels have been attained, on the presumption of a close correlation between profitability and the scale and timing of cost recovery.
2.26 As suggested earlier, few of these approaches have been successful in achieving progressivity. The root of the difficulty is that the indicators used to adjust take are only proxies for profitability, and may be very imperfect. This has led to an increased interest in the use of a project’s rate of return (ROR) as an adjustment mechanism. Under this scheme, government take is adjusted as a function of the rate of return actually achieved on investment in a project. The advantage of rate-of-return-based systems lies in the accuracy with which the rate of return automatically adjusts government take to all the determinants of profitability—prices, production, costs, the timing of receipts, and outlays and the cost of capital—since they all enter into its calculation.
2.27 Cost Recovery Provisions: Legal and contractual provisions addressing the scope and rate of cost recovery are critical to the impact of any oil and gas taxation system and often to the effectiveness of its administration. The tax design objectives listed above pull cost recovery provisions in different directions. Incentives to broad-based activity argue for a full definition of recoverable costs and for their early recovery through generous expense provisions, accelerated depreciation, consolidation, and so forth. Progressivity favors cost uplifts and early recovery. But cost containment and early revenues for government argue in opposite directions. What emerges invariably reflects a balancing of several objectives.
2.28 Bonuses: Bonuses come in several forms. They may be fixed or bid, payable upfront, or contingent on results. Relatively modest (US$1 million to US$5 million) fixed bonuses payable on the award of a license are common (signature bonuses). They provide early cash to the government and can defray the cost of licensing. Contingent bonuses, payable on discovery or achievement of certain annual or cumulative levels of production are typically larger. They may be fixed in advance or bid

14 Taxation and State Participation in Nigeria
by prospective licensees. In either case an attempt will be made to correlate the size of the bonus with the profitability expected to be associated with discovery or production. Problems may arise in their application as a result of either poor after-the-fact correlation of targeted production levels with profitability or attempts by investors to "tax-manage" by manipulating production levels. Perhaps the most interesting bonus is the upfront cash-bid bonus. The bid size will depend on the prospective licensee’s perception of the after-tax value in the license. In that sense, it represents an effective way to extract rents that the tax system might miss. However, the bid will also depend on perceptions of country and political risk, contract stability, and governance. Hence, it is not suited to all country circumstances. In countries where these risk perceptions are important, and Nigeria may well be one of them, bid bonuses will be cons trained and it is best then to combine them with other contingent rent collection instruments such as additional profit taxes or production shares.
2.29 Tax Packages: No system of oil and gas taxation relies on only one instrument. The number of instruments included in a petroleum tax “package” can run from as few as two or three to a dozen or more. The practice of putting together a package of tax instruments is understandable, given the different objectives of oil and gas taxation and the differing comparative advantages of tax instruments in meeting those objectives.
Pretax Economic Environment
2.30 In order to better evaluate the impact of any oil and gas tax system, it is important to be aware of the pretax economic environment. In Nigeria, this is particularly favorable, certainly for oil. The reserve and production base has already been referenced. The price and cost environment is briefly discussed below, together with its implications for pretax project economics.
2.31 Prices: Nigeria’s crude oil is very high quality. Because of this, and its relatively advantageous location relative to major markets, it commands premium prices and virtually sells itself.

Oil and Gas Taxation 15
Figure 2.1: U.S. Gulf Crude Netback Prices (1999)
1 0
1 2
1 4
1 6
1 8
2 0
2 2
2 4
2 6
A p r M a y J u n J u l A u g S e p t
$ / B b l B o n n y L tA r a b i a n L tD u b a iB r e n tW T I
2.32 A significant feature of all oil prices, and in Nigeria, is their volatility. The tax system should be evaluated against the virtual certainty that this volatility will continue into the future. Prices one year ago were in the vicinity of US$10 per barrel; prices today are hovering near US$30 per barrel. A base price of US$18 per barrel is used for purposes of analysis in this report, a price which will no doubt be regarded as conservative by some market observers.
Figure 2.2: Oil Price Volatility
0
5
1 0
1 5
2 0
2 5
3 0
3 5
4 0
76 77 78 79 80 81 82 83 84 85 86 87 88 89 90 91 92 93 94 95 96 97 98
Jan-J
un 99
Sep-9
9
$ / B b l F o r c a d o sW T IB r e n t
2.33 Gas pricing in Nigeria is more complicated since there is no developed market internationally or nationally for its gas. Gas exports (currently only as liquefied natural gas [LNG]) are established in a negotiated project context at levels sufficient to ensure the commercial viability of gas development. The tax terms to be applied to gas have been an integral part of project negotiations. Domestic gas prices are controlled by the government and so far have been set at levels which are generally considered to be uneconomic (US$0.30–US$0.50/MCF). However, ongoing price negotiations cover a wider and higher range (US$0.50–$2.50/MCF).

16 Taxation and State Participation in Nigeria
2.34 Costs: A good part of the attractiveness of Nigeria’s oil sector derives from its very favorable cost per barrel characteristics on average. These are attributable to major reserve accumulations per field, high well production rates, relatively shallow wells and a benign onshore and offshore development environment. Unfortunately, positive characteristics are being partially offset by costs attributable to social disruptions of oil operations and by escalating interest costs occasioned by the need to finance the national oil company arrears in joint venture operations. These costs are not reflected in Figure 2.3 or in the pretax economics in the paragraphs that follow.
2.35 Gas development costs are also low by world standards. (As with gas in many other petroleum-producing areas, it is the market that is the real issue.) A distinction needs to be made between the costs of gas developed as a byproduct of oil production (associated gas) and the cost of standalone gas development (nonassociated gas). Associated gas costs can be very low if little incremental investment is required beyond that which has already been made to develop the oil. The costs of associated gas can rise rapidly, however, if an extensive pipeline gathering system connecting several oil fields is needed to accumulate marketable gas volumes. Other factors may also increase associated gas development costs, for example, the need to add considerably to gas pressure if the gas is intended to be marketed as LNG.
Figure 2.3: Economic Cost Per Barrel
0 . 0 0 2 . 0 0 4 . 0 0 6 . 0 0 8 . 0 0 1 0 . 0 0 1 2 . 0 0 1 4 . 0 0 1 6 . 0 0
U S A
U K
N o r w a y
M a l a y s i a
I n d o n e s i a
A n g o l a
N i g e r i a O f f s h o r e
N i g e r i a O n s h o r e
1 9 9 9 $ /b l ( d i s c o u n t e d @ 1 5 % )
D e v e l o p m e n t C o s t s O p e r a t i n g C o s t s T r a n s p o r t a t i o n T a r i f f
2.36 Pretax Economics: The economics presented in this report were prepared using a collection of hypothetical but representative Nigerian oil and gas projects. The principal assumptions used are given below.

Oil and Gas Taxation 17
2.37 As shown in Figure 2.4, a wide range of oil projects in Nigeria are economic on pretax basis. At US$18 per barrel, all the projects have pretax returns greater than the minimum required to justify investment, assumed to be 20 percent. In the sense discussed earlier (paragraph 2.3), they are all socially desirable projects. Whether or not they will be developed depends on what their economics look like to investors after applying the relevant tax and contractual provisions, that is, on post-tax economics, which are evaluated starting at paragraph 2.50 below.
Figure 2.4: Pretax Rate of Return for Different Oil Project Scenarios
US$18/bbl
0%
20%
40%
60%
80%
Small Offshore Medium
Offshore Large Offshore Deep
Offshore Onshore
Table 2.1: Technical Assumptions
Oil Price: Base Case: U$18/bbl
Small Offshore
Medium Offshore
Large Offshore
Deep Water Onshore
Nonassociated Gas
Oil Reserves (MMbbl) 40 160 640 640 160 21
Gas Reserves (Bcf) 65 258 1032 1032 258 350 Water Depth (m) 50 50 50 750 N/A 50
Reservoir Depth (m) 1700 1700 1700 2100 2500 2500
American Petroleum Institute (API) 36 36 30 34 33 N/A
Productivity (MMbbl/well) 8 8 8 12 8 70 (Bcf/well)
Peak Well Flow (bbl/d) 2500 2500 2500 4000 711 23 (MMcf/d)
Capital Expenditures (US$million) 179 372 1,011 238 1,575 189
Operating Expenditures (US$/bbl PV @ 15%) 1.3 0.7 0.4 0.3 0.7 0.1 (US$/Mcf)

18 Taxation and State Participation in Nigeria
2.38 The story is similar for natural gas. At least at prices of US$1.0+/MCF, pretax returns for the different projects are above the 20 percent threshold.
Figure 2.5: Pretax Rate of Return for Different Gas Projects
Nigeria’s Existing Tax System
2.39 Nigeria’s tax systems for oil and gas are sufficiently different to merit separate discussion, starting with oil.
2.40 Oil Taxation: Taxation in this report refers to the overall fiscal package applicable to petroleum operations, including relevant contractual provisions, rather than the tax system narrowly defined. Nigeria has a formal petroleum tax law, the Petroleum Profits Tax (PPT) Law, but this is complemented importantly by two different contractual arrangements, creating two distinct fiscal packages: (a) the Tax/Royalty/MOU (Memorandum of Understanding) system; and (b) the Production Sharing Contract. While its application in practice seems clear, there may be some need to provide greater legal clarity to the status of the MOU system in relation to the PPT Law.
2.41 Tax/Royalty/MOU: The Tax/Royalty/MOU system applies to joint ventures between the national oil company, NNPC, and its international partners. This covers 97 percent of Nigeria’s current oil production and a substantial percentage of existing but as yet undeveloped oil reserves (that is, future production). Principal features of the Tax/Royalty/MOU system are summarized in Table 2.2, and further described in Annex 1.
RoR %
0%
10%
20%
30%
40%
50%
60%
$0.5/MCF $1.0/MCF $0.5/MCF $1.0/MCF $0.5/MCF $1.0/MCF
Medium Large

Oil and Gas Taxation 19
2.42 The distinguishing feature of the system is the MOU itself. The MOU governs the fiscal relations between the Nigerian Government and joint venture participants. Originally developed in 1986 to create new investment incentives in the wake of an oil price collapse, the MOU has since been through a number of revisions. The current version dates from 1991. Its key elements are listed in Table 2.3. More detail is provided in Annex 1.
2.43 The MOU calls for two tax calculations, one based on the PPT and Royalty without any adjustment, and a second, referred to as Revised Government Take (RGT), based on the provisions of the MOU. The taxpayer may choose the lower of the two. RGT calculations effectively guarantee an after-tax margin to the taxpayer if oil prices fall anywhere in a price band between US$12.50 and US$23 per barrel. The margin is adjusted by formula as a function of price when prices fall outside that range, and is further adjusted as a function of capital expenditures or investment per barrel. The actual formulas for calculating RGT are rather complicated and are given in Annex 1.
Table 2.3: Key Elements of the 1991 MOU
Guaranteed Margin For oil prices between US$12.50 and US$23.00/bbl:
US$2.30/bbl if CapEx < US$1.50/bbl US$2.50/bbl if CapEx > US$1.50 /bbl
Adjusted by formula if price outside the
US$12.50/bbl-US$23/bbl range
Reserves Addition Bonus (RAB)
Addition to margin based on added reserves
Determined by formula. Averages U$0.20/bbl
Table 2.2: Summary of Tax/Royalty/MOU
Tax (PPT) 85 percent
Depreciation : Five-year straight line
Deductions : OpEx CapEx Investment allowance (5–30%)
Consolidation All E&P expenditures in joint venture area Royalty : 20 percent onshore
0-18.5 percent offshore MOU: Guaranteed after tax margin of US$2.3 or US$2.5/bbl

20 Taxation and State Participation in Nigeria
2.44 The guaranteed margin proved a success in attracting investments, which was the primary purpose of the MOU. A second objective of the MOU, the reserves replacement was met by the Reserves Addition Bonus (RAB), an addition to the after tax margin based on reserves added and determined by formula as detailed in Annex 1. In practice, it has proved very difficult to monitor the RAB and claims have been large.
2.45 A new MOU draft (it actually dates from 1996) was approved by the Nigerian government’s Council of Ministers in December 1999. The intent of the draft is to update core features (guaranteed after-tax margins of the 1991 MOU) while strengthening incentives to contain costs (the so-called “tax inversion” clause), and removing certain provisions which have proved particularly troublesome or costly to the government (RAB). The main changes from the 1991 MOU to the 1996 new version are shown in Table 2.4. Additional technical comments and evaluation of the new MOU are given in Annex 2. Following review and consideration by the joint venture participants, the new version of the MOU came into effect January 1, 2000.
2.46 Production Sharing Contracts: The joint venture arrangements associated with the Tax/Royalty/MOU system require NNPC to advance funds for operations and new investments at an equal rate with its international partners. This has created an enormous drain on government resources urgently needed to address other competing economic and social issues and also has caused delays in the implementation of major projects in the oil sector when government funds have not been available. In reaction, the government has opted to award new petroleum exploration and production licenses under Production Sharing Contracts (PSCs).
2.47 Under PSCs the host country, while participating in the management of operations, has no funding obligation—all funds for exploration, development, and operating activities are advanced by the private sector participant. Production, once established, is shared between the government and the private sector contractor in accordance with an agreed formula, which allows for prior recovery of costs at a pre-established rate. The production sharing formula provides for an increasing share to the government as a function of production. For Niger Delta PSCs, the government's share increases as a function of daily production rates; for deepwater "frontier" areas, the government's share increases with cumulative production. Signature bonuses and bid bonuses are also included in Nigeria's PSC package. Bid bonuses appear to have been relatively modest to date, reflecting the comments in paragraph 2.28 above.2 The PSC contractor is liable to PPT at a 50 percent rate on its income from cost recovery and production share oil after deduc tion of costs in accordance with provisions of the PPT. Terms for a typical Nigerian PSC are summarized in Table 2.5, and detailed in Annex 3.
2 This preliminary observation should be qualified by the need to adjust for average block size when comparing Nigerian bids to bids received in other countries.

Oil and Gas Taxation 21
Table 2.4: Differences between 1991 MOU and New MOU
Guaranteed Margin Revised. For oil prices between US$15.00 and US$19.00/bbl:
US$2.50/bbl if CapEx < US$2.00/bbl
US$2.70/bbl if CapEx > US$2.00 /bbl
Adjusted by formula if price outside the
US$15.00/bbl-US$19/bbl range
Cost Saving Incentive (“Tax Inversion” Provision)
New. OpEx outside designated range charged versus PPT @35% rate instead of 85% Range is a function of production: U$1.70 to U$3.00 if <175 MBD U$1.70 to U$2.30 if >175 MBD
Reserve Addition Bonus Deleted.
2.48 Gas Taxation: As noted at the outset, Nigeria is endowed with world class reserves of natural gas. Substantial volumes are currently produced with oil. Unfortunately, almost all of this associated gas is flared, with a consequent loss in value estimated at US$2.5 billion per year. Figure 2.6 compares the ratio of gas flared to gas reinjected or marketed in Nigeria and other major gas countries. To end flaring and capture the economic value of the flared gas, Nigeria over the last few years has introduced a combination of tax penalties on flared volumes and tax incentives designed to encourage commercializing gas. Flared gas not only represents a loss of economic value, it also contributes importantly to greenhouse gas (GHG) emissions with consequent harm to the environment. The impact of GHG emissions is primarily global, however, raising questions as to who should "finance" any fiscal incentives designed to reduce flaring beyond those levels which might produce direct economic benefit to Nigeria.

22 Taxation and State Participation in Nigeria
Table 2.5: Summary of Production Sharing Contracts
Signature Bonus: US$0.50-1.00 MM/block
Bid Bonuses: US$10-30 MM/block Royalty Oil: Up to 16.67% (subject to water depth)
Cost Recovery: 100% after Royalty
Depreciation: 5 Year Straight Line Profit Oil: Niger Delta:
(Government Share) 60% (<30MBD) to 65% (>50MBD) “Frontier”: 20% (<350MMB) to 60% (>2BBl)
Tax (PPT): 50% Consolidation: Ringfence for PSC; All E&P for PPT
2.49 Incentives granted to the upstream development of gas are summarized in Table 2.6 and in more detail in Annex 4. As will become clear in the next section, these incentives are very generous by international standards. In addition to the five-year tax holiday and the royalty exemption, the ability to deduct costs associated with the recovery and processing of natural gas from oil income (which is taxed at an 85 percent rate while gas is taxed at only 30 percent) is particularly significant. Apparently, in some instances, investors have negotiated the right to consolidate the costs of the downstream plant consuming the gas as well. Otherwise downstream fiscal terms for gas are as noted in Table 2.7. Even without the consolidation provision, these, like upstream provisions, are generous. Incentives for the development of LNG for export are very project specific and are not addressed in this report. As a result of very high capital costs and flow margins, they too are generous.
Figure 2.6: Gas Flared, Reinjected and Marketed—International Comparison
05 0 0
1 0 0 01 5 0 0
2 0 0 02 5 0 03 0 0 03 5 0 04 0 0 04 5 0 0
5 0 0 0
N i g e r i a N o r w a y I n d o n e s i a M a l a y s i a A l g e r i a V e n e z u e l a M e x i c o
B C F / Y r F l a r e d
R e i n j e c t e d
T o M a r k e t

Oil and Gas Taxation 23
Table 2.6: Summary of Upstream Fiscal Incentives for Gas
Tax Rate CIT (30%) / 5-year tax holiday Deductions CapEx & OpEx deducted against PPT (85%)
Depreciation 60% first year / 20% thereafter
Investment Allowance 20% Royalty 5-7% (exempt if gas is transferred to downstream project)
Import Duties / VAT Exempt
Table 2.7: Summary of Downstream Fiscal Terms for Gas
Tax Rate CIT (30%) / 5-year tax holiday
Depreciation 60% first year / 20% thereafter
Investment Allowance 15% Import Duties / VAT Exemptions apply
Downstream includes: marketing, distribution, industrial, and power generation Evaluation of Tax Design
2.50 The evaluation that follows is made in terms of the oil and gas taxation objectives discussed earlier. The text below gives representative results.
2.51 Oil Taxation: The first objective was to encourage investment in a broad range of projects. Figure 2.7 shows that, with the exception of small offshore fields, the projects in Figure 2.5 which were on an economic pretax, are economic on a post-tax basis as well, that is, they will provide the investor with a post-tax financial return in excess of the 20 percent cost of capital threshold. This is a desirable result and appears to hold for both the current and proposed versions of the Tax/Royalty/MOU system and for PSCs. The new, proposed MOU produces slightly better incentives than the exis ting MOU, although it should be noted that it also shifts some price risk back from the government to the investor as a result of the narrowed band of guaranteed margins.
2.52 It is notable that offshore fields are economic before tax, but uneconomic after tax. Terms adjustments to promote commercial development of these fields represent a “win-win” opportunity—extending the range of commercially viable projects increases the overall attractiveness of Nigeria’s oil sector to potential investors, while extending Nigeria’s fiscal base. Smaller offshore oil fields are particularly relevant in the context of attracting new players to the sector and of developing indigenous capacity as such projects are likely to be the primary targets of international and emerging Nigerian “independents.”

24 Taxation and State Participation in Nigeria
2.53 While managing to encourage a reasonably broad range of projects, Nigeria’s fiscal systems for oil also retain a relatively high share of project rents for Nigeria, satisfying the second objective listed above. With the exception of the confiscatory rates of take which apply to small offshore fields and the incentive rates granted to deep offshore projects, government shares of project rents (measured as a percent of pretax or production share project Net Present Value at 15 percent) are in the 80–85 percent range (Figure 2.8), as one might expect of a major oil-producing province. These levels are comparable to the levels found in other producer countries (Figure 2.9), a finding which at least partly addresses the international competitiveness objective.
2.54 The third taxation objective was a progressive increase in government’s percentage take with increases in pretax project profitability. In a progressive system, the government’s share should be positively correlated with price and production, and negatively correlated with cost. Figure 2.10 shows how government take behaves under the two MOU systems and the PSC system in response to variations in oil price, an especially important consideration in the evaluation of any oil tax system as noted earlier. Figure 2.11 illustrates how an investor’s after-tax rate of return (ROR) responds to the same variations. As an encouragement to develop the more profitable projects first, the investor’s ROR should always increase as underlying project profitability increases. If the tax system is progressive, however, it should increase at a decreasing rate.
Figure 2.7: Broad-Based Development (Rate of Return)
0%
5%
10%
15%
20%
25%
30%
35%
40%
SmallOffshore
MediumOffshore
LargeOffshore
Deep Water Onshore
MOU 1991
MOU ("New")
PSC

Oil and Gas Taxation 25
2.55 Figures 2.10 and 2.11 relate to the development of a medium-size oil field in shallow water. Similar results are observed for other representative oil field development projects (Annex 5). As illustrated in the figures:
• MOU systems behave progressively in the range of the guaranteed margins. This is to be expected since fixed margins for investors will behave like fixed excise taxes in reverse. Where excise taxes result in regressive behavior, fixed margins produce progressive results. Outside the range of guaranteed margins, which is where prices are currently, the MOU systems produce mildly regressive results, resulting in the transfer of a declining, rather than increasing, share of recent price increases to the government.
Figure 2.8: Government Share of Rents—Oil Price US$18/bbl
Figure 2.9: Government Share of Rent—International Comparison
0%
20%
40%
60%
80%
100%
NigeriaOnshore
MOU
NigeriaOnshore PSC
Nigeria DeepOffshore
AngolaConcesion
Angola Indonesia Algeria U.S. U.K. Venezuela
% Project NPV
Deep 40%
60%
80%
100%
Small Offshore
Medium Offshore
Large Offshore Water
Onshore
MOU 1991 MOU "New" PSC

26 Taxation and State Participation in Nigeria
• In contrast to the MOU systems, Nigeria’s PSC causes the government take to behave regressively, reflecting the influence of the royalty and the weak correlation between annual or cumulative production levels and profitability.
• Under the MOU, investor ROR increases at a decreasing rate where margins are fixed, but accelerates outside that band. The ROR under PSC terms moves opposite to the desired direction.
Figure 2.10: Progressivity—Government Take
(Percent of Revenues NPV @15 percent) Sensitivity to Oil Price
G o v e r n m e n t T a k e ( % o f N P V @ 1 5 % )
8 0
8 5
9 0
9 5
100
1 0 1 5 2 0 2 5 3 0
Oil Price (U$/bbl)
M O U 1 9 9 1
M O U “ n e w ”
P S C
Figure 2.11: Progressivity—Investor's ROR
Sensitivity to Oil Price
1 0
1 2
1 4
1 6
1 8
2 0
2 2
2 4
2 6
2 8
3 0
1 0 1 5 2 0 2 5 3 0
O i l P r i c e ( U $ / b b l )
R o R ( % )
M O U 1 9 9 1
M O U “ n e w ”
P S C
2.56 Cost containment, the fourth tax objective, is a topic that has attracted a significant amount of attention in Nigeria and in other important producer countries. As noted earlier, an attractive feature of any fiscal system is that the system’s design encourages cost containment, complementing institutional enforcement. Unfortunately, a number of the Nigerian fiscal system’s provisions, listed in Table 2.8, act to deter cost containment.

Oil and Gas Taxation 27
2.57 A high marginal tax rate, 85 percent under Nigeria’s MOU system, 3 deters cost efficiency because, in the case where costs can be immediately deducted from taxable income (operating expenditures), a pretax cost of US$1.00 translates into a post-tax cost of only US$0.15 to the investor. The Nigerian taxpayer effectively "picks up" the remaining US$0.85 in the form of reduced tax revenues. Where the cost deduction of costs is deferred or spread out over time, the same phenomenon is observed except that the post-tax cost of a US$1.00 expenditure is greater than US$0.15, and increases the more the deduction is deferred.
Table 2.8: Deterrents to Costs Containment
Fiscal and Contractual Deterrents to Cost Containment: Nigerian Terms
Guaranteed Margins ü High Marginal Tax ü Cost Uplifts ü Investment Credits ü Accelerated Depreciation ü Generous Consolidation ü "Loose " HQ Overhead Provisions ü Sole Source Procurement ü
2.58 One of the notable changes in the MOU from the existing version to the proposed version is designed to address this negative impact on incentives to control costs. Under the so-called “tax inversion” clause, operating costs exceeding an indicated per barrel threshold are deducted against a 35 percent tax rate, rather than an 85 percent rate. Thus, once the threshold has been exceeded, the after-tax cost to the investor of a US$1.00 expenditure becomes US$0.65, rather than US$0.15. The favorable impact of the new clause on the investors’ incentives to control costs is illustrated in Figure 2.12, which shows the increased sensitivity of the investor’s ROR to changes in the operating cost level. Table 2.9, which compares assumed pretax operating costs to post-tax costs, with and without the tax inversion mechanism clause, tells the same story. One practical difficulty which may be anticipated with respect to the tax inversion clause relates to the likelihood of investor appeals fo r relief or exemption from its application, based on the virtual certainty that in many cases costs exceeding threshold levels will be attributable to factors outside the investor's control (for example, social unrest) rather than to inefficiency or waste.
3 Similar level for PSCs

28 Taxation and State Participation in Nigeria
Table 2.9: Pre- and Post-Tax Operating Costs (US$/bbl)
Pretax Post-Tax (w/o Inversion) Post-Tax (w. Inversion)
4.00 0.60 1.10
3.00 0.45 0.45 2.00 0.30 0.30
1.50 0.22 0.12
2.59 Each cost uplift, such as the Investment Tax Allowance (ITA) in Nigeria, accelerated depreciation and consolidation provisions compounds the negative influence of a high marginal tax rate on cost containment. Table 2.10 compares the pretax cost of development (discounted at 15 percent) of a selection of hypothetical Nigerian oil fields to the cost post-tax with and without the ITA.
Table 2.10: Impact of ITA on Post-Tax Costs (US$/bbl)
Project Pretax CapEx
Post-Tax (w/o ITA)
Post-Tax (w. ITA)
Small 3.30 0.49 0.38 Medium 1.59 0.24 0.18
Large 1.06 0.16 0.12
Deep Offshore 1.13 0.17 0.13 Onshore 1.71 0.26 0.20
2.60 Tables 2.11 and 2.12 represent similar exercises, showing the reduction in the effective cost to an investor, and hence in the incentive to contain costs, of an acceleration in depreciation from an assumed eight years straight line to five years, of
Figure 2.12: Investor’s ROR—Sensitivity to Operating Expenditures
1 5
2 0
2 5
3 0
- 6 0 % - 4 0 % - 2 0 % 0 % 2 0 % 4 0 % 6 0 %
V a r i a t i o n i n O p e x ( V a r i a t i o n t o t e c h n i c a l a s s u m p t i o n - S e e E x h i b i t 3 . 4 )
Inve
stor
RoR
(%
)
M O U 1 9 9 1
M O U " n e w "
P S C

Oil and Gas Taxation 29
Nigeria’s rate, and of consolidation provisions. Consolidation allows existing taxpayers to consolidate costs incurred for new projects with income from ongoing projects for tax purposes. This effectively lowers the cost of new projects and tends to dampen enthusiasm for cost efficiency.
Table 2.11: Impact of Accelerated Depreciation on Costs (US$/bbl)
Project Pretax Cost Post-Tax 8 years
Post-Tax 5 years
Small 3.30 1.90 1.62
Medium 1.59 0.92 0.78 Large 1.06 0.61 0.52
Deep Offshore 1.13 0.65 0.56
Onshore 1.71 0.99 0.84
Table 2.12: Impact of Consolidation on Costs (US$/bbl)
Project Pretax Cost
Post-Tax without
Consolidation
Post-Tax with
Consolidation
Small 3.30 1.62 0.75 Medium 1.59 0.78 0.36
Large 1.06 0.52 0.24
Deep Offshore 1.13 0.56 0.26 Onshore 1.71 0.84 0.39
2.61 Consolidation provisions are interesting not only for their impact on incentives to cost efficiency, but also because they favor existing taxpayers, that is, those with taxable income from which to deduct the costs of new operations. Figure 2.13 shows the beneficial impact of consolidation on an investor’s rate of return. That beneficial impact will only be available to existing taxpayers or “members of the club.” Newcomers will have to settle for less, a negative attribute of the provision in a context where the government places a premium on attracting new entrants and encouraging competition.

30 Taxation and State Participation in Nigeria
2.62 Cost uplifts, accelerated depreciation, and consolidation in the Nigerian tax system all also act against another tax objective, namely early revenues for the government—they all defer taxes. Whether or not this effect, which is certainly important at the individual project level, is important at the sector level depends, as noted earlier, on the size and maturity of the sector and the investment rhythm. While the scale of the Nigerian sector typically might be expected to smooth the impact of consolidation on revenues, its influence may be important to current and near-term tax revenue expectations in Nigeria because of recent increases in the pace and scale of investment, much of it attributable to gas projects in addition to the development of major new oil fields (see discussion in paragraphs 2.87 and 2.88 below). It is important to note that, while cost uplifts, accelerated depreciation, and consolidation may contribute negatively to the objectives of cost control and early tax revenues, they contribute positively to the objective of broad-based sector development and, in the case of uplifts, to progressivity. Hence, as suggested in the discussion of tax instruments, it is common to find a balanced use of these provisions in most tax systems.
2.63 The potential negative impact of "loose" headquarter overhead provisions and sole source procurement on cost containment is clear—both increase the risk of inappropriate cost inflation. Both need to be addressed through adequate institutional oversight which, unfortunately, is lacking in Nigeria (see paragraph 2.83 below).
2.64 While examination of federal/regional revenue sharing in Nigeria lies outside the scope of this report, it is noted that the Nigerian constitution establishes very clear rules for the distribution of oil and other tax revenues as shown in Table 2.13. The problems experienced in Nigeria in this context have much more to do with the actual experience of revenue distribution than with its definition. The 7.5 percent of petroleum fiscal revenues allocated to "special funds" included in the past controversial OMPADEC (Oil Mineral Producing Areas Development Commission) program for the economic
Figure 2.13: Impact of Consolidation—Investor ROR
0% 5%
10% 15% 20% 25% 30% 35% 40% 45%
Small Offshore
Medium Offshore
Large Offshore
Onshore
RoR With Consolidation Without Consolidation

Oil and Gas Taxation 31
development of oil producing areas. The revenue sharing formulas will have to be revised to reflect arrangements under the Niger Delta Development Commission Bill.
Table 2.13 : Distribution of Fiscal Revenues
Recipient % Share
FGN 48.5
States 24.0
Local Government 20.0 Special Funds 7.5
2.65 A final note on the oil tax system in relation to tax objectives—in addition to providing competitive results measured in terms of the impact on investor ROR and government take, the system's design appears to have afforded international oil companies the critical possibility to avoid double taxation, that is, tax in their home countries as well as Nigeria.
2.66 Gas Taxation: In the case of gas, the high priority that has been given to sector development reflects the very favorable fiscal terms reported on above. Figure 2.16 shows the post-tax RORs for three different gas projects, along with the pretax returns given earlier in Figure 2.4. All three projects are economic post-tax at prices of US$1.00/MCF. One interesting, but disturbing, feature of these results is that for associated gas projects, the investor’s post-tax economics are better than the underlying pretax returns. Effectively, the tax system is giving the investor more than the project is worth. This happens because the investor is able to deduct all his gas expenditures against an 85 percent oil tax liability, while paying only 30 percent tax on his gas revenues. In the case of the nonassociated gas project the investor’s post-tax returns are, as expected, below pretax returns. It has been assumed in this case that there is no oil revenue available against which the gas project’s costs might be consolidated.
2.67 The gas terms modeled in Figure 2.14 assume that only upstream costs—costs of development and production through treatment—can be consolidated with oil revenues for tax purposes. In some cases, however, it appears that investors have the right to consolidate downstream costs as well, that is, the costs of the power plant or industrial plant which consumes the gas. In such a case, the anomaly illustrated in Figure 2.14 becomes even more pronounced, as shown in Figure 2.15 where the costs of constructing a 560 MW power plant have been integrated into the gas project and written off against oil income. The fiscal terms for the power plant, other than the cost write-off against oil income, are those shown in Figure 2.15.

32 Taxation and State Participation in Nigeria
Figure 2.14: Impact of Gas Incentives
2.68 Not surprisingly, Nigeria’s gas development terms are considerably more generous than experienced in other oil and gas-producing countries Figure 2.16 plots the government share in rents for typical gas projects in each of the countries shown.
2.69 The type of subsidy illustrated in these tables and figures can be justified only if gas development in Nigeria produces significant positive "externalities," that is, benefits in excess of those reflected in the commercial value of the gas produced. Some have argued that such externalities exist in the shape of broad, gas-based industrial development. One would expect, however, that the benefits of gas-based industrial expansion would be reflected in gas prices, if established at levels reflecting the true economic value of gas (see paragraphs 2.70 and 2.71 below). Other externalities are probably global, rather than specific to Nigeria. Reduction in greenhouse gas (GHG) emissions, referred to in paragraph 2.48 above, is the most important of these. To the
Figure 2.15: Impact of Gas Incentives Consolidating with the Downstream Expenditures
0%
10%
20%
30%
40%
50%
60%
$0.5/MCF $1.0/MCF $0.5/MCF $1.0/MCF
Medium Large
70%
80%
Pre-Tax RoR
Post-Tax RoR w. Limited Consolidation
Post-Tax RoR w. Consolidation of Downstream
RoR
RoR %
0% 10% 20% 30% 40% 50% 60%
$0.5/MCF $1.0/MCF $0.5/MCF $1.0/MCF $0.5/MCF $1.0/MCF Medium Offshore
Large Offshore
Non Associated Gas Offshore
Pre Tax RoR Post Tax
RoR

Oil and Gas Taxation 33
extent that global externalities are important, the international community, rather than Nigeria, should bear a large share of the costs of capturing them. It is probably not realistic, however, to expect much relief from this quarter in the near term.
Figure 2.16: Government Share of Rents: International Comparison
0%
20%
40%
60%
80%
100%
Nigeria Angola Indonesia Malaysia UnitedKingdom
@ US$1.0/MCF
@ US$2.5/MCF
2.70 Figure 2.17 explores the potential for providing incentives to develop gas through appropriate pricing of gas rather than through current fiscal arrangements. The figure assumes that expenditures for the development of associated gas will continue to be deducted from taxable oil income, but that gas revenues will attract the same tax as oil, namely 85 percent, instead of the 30 percent that currently applies. Post-tax returns naturally decline (compare Figure 2.17 with Figures 2.14 and 2.15), and, as one would expect, post-tax returns are below pretax levels. However, with gas prices in the range of US$1.00–US$2.00 per MCF, post-tax returns are still sufficiently attractive (greater than 20 percent ) to attract investors. Higher gas prices could reflect internationally funded premiums for the environmental benefits of reduced gas flaring, subject to the caveat in paragraph 2.69 above, as well as more reasonable prices on the domestic market.
2.71 Getting acceptable prices for gas on the domestic market will depend critically on the power sector and the ability of that sector in turn to recover its costs in the market. Establishing an open tender process for the provision of power (largely gas-based in Nigeria) should provide an effective way of arriving at a realistic price for gas. Actual payment is an issue as well as the price level. Arrangements for putting in place credible assurances on payment should parallel work on achieving higher gas prices.

34 Taxation and State Participation in Nigeria
2.72 Additional options for commercializing gas through fiscal incentives are in a recent draft report prepared by the International Monetary Fund.4 While this report focuses on gas development for the domestic market, it should be noted that even under optimistic growth scenarios, this market is likely to absorb only 50 percent of Nigeria's production potential. Hence fiscal provisions for export projects will become equally important. The whole area of fiscal penalties (gas flaring) and incentives for natural gas, economic pricing, and regulation needs an urgent and comprehensive review and strategy.
Figure 2.17: Revised Incentives and Pricing
0%
10%
20%
30%
40%
50%
60%
70%
80%
US$0.5/MC US$1/MCF US$2.0/MC US$0.5/MC US$1/MCF US$2.0/MC
Pretax
Post-tax
Medium Offshore Large Offshore
Tax Administration
Objectives
2.73 In designing or evaluating any tax system, considerable importance should be attached to the ability to administer it efficiently and effectively.
2.74 To achieve this objective, the structure of the tax should be kept as transparent and simple as possible without seriously prejudicing other tax design goals. It should minimize the incentive to “tax manage,” that is, to shift cost or revenue reporting from one category to another to reduce tax obligations. It should be based on data which is readily available and easily monitored. It should be stable and perceived as reasonable, accommodating a wide range of project circumstances, thus reducing incentives to evade taxes and/or lobby for tax changes or exemptions. 4 Nigeria: Taxation of the Oil and Gas Sectors, IMF, February 25, 2000. Chapter IV.

Oil and Gas Taxation 35
2.75 Administrative procedures should also be kept transparent and simple, with responsibilities clearly defined. Staff should be well trained and adequately compensated. Staffing, funding, and other resources should be adequate to handle the anticipated work load. A system of audits and penalties should be in place and enforceable to encourage full compliance and prompt tax payments.
Evaluation of Existing Administration
2.76 Complexity of the Existing System: While most existing tax systems meet the tax objectives set out under the Tax Design Section above, they do pose problems from the administration’s standpoint, particularly the Tax/Royalty/MOU system. The MOU system is not transparent, and to the uninitiated, appears highly complex. It requires two tax calculations (Tax/Royalty and MOU) and their comparison. It adjusts government take independently to a number of different profitability indicators, including:
• Price (with three different sharing formulas applying depending on the price band involved).
• Investment Costs (triggering two different margin sharing schemes, depending on their level, and two different levels of “deemed technical cost,” again depending on their level, but with different levels applying).
• Operating Costs (under the proposed new MOU, three different tax rates apply, depending on the cost band).
• Production (under the new MOU, operating costs will be treated differently for tax purposes depending on whether they are above or below a fixed production threshold). Under the current MOU, tax offsets also come into play, most notably the RAB which allows the investor to claim tax credits for qualifying additions to reserves. All this is on top of more standard complexities such as cost uplifts ITAs.
2.77 The complexity of the MOU is bound to increase the cost and burden of tax administration, as are certain of its design features. For example, the either/or “knife-edge” triggers that move the taxpayer from one tax exposure to another create incentives to tax manage, again making life difficult for the administrators. Shifting expenditures from the operating category (T1) to the capital investment category (T2) can qualify the taxpayer for a higher deemed fiscal margin and a higher deemed technical cost both of which would result in a higher after-tax margin. As Figure 2.18 suggests, the benefit of this sort of shifting to the taxpayer is significant. Not surprisingly, perhaps, all joint venture taxpayers currently qualify for the higher after-tax margin.
2.78 A simpler document, the PSC should prove easier to administer than either version of the MOU. One design feature that could cause problems relates to the likely inaccuracy of production levels, either daily or cumulative as profitability indicators. If the relationship between production levels and profitability on which the PSC’s production sharing rates are based does not turn out as expected, tensions between the

36 Taxation and State Participation in Nigeria
government and the PSC taxpayer are certain to develop, creating pressures to renegotiate. Production levels can be unreliable profitability indicators because they ignore other influences on profit such as prices, varying cost conditions, and the time profile of production. Cumulative production poses the same problems as an indicator. In addition, basing the rate of production sharing on cumulative production thresholds will create disincentives for investment in field rehabilitation, secondary recovery, or, indeed, development of additional discoveries within the PSC contract area, once the highest threshold levels have been passed and government take is maximized.
Figure 2.18: Impact of Tax Management
2.79 The design problems of both the Tax/Royalty/MOU and PSC systems, complexity in the one case and inaccuracy in the other, stem from their attempts to link government take to project profitability successfully. As suggested in paragraph 2.26 above these problems might be avoided by introducing an ROR-based tax system. The PSC could be easily adapted to this format. Annex 6 reviews the merits of ROR-based profit sharing systems and outlines their basic design elements. Annex 7 describes a modified version of Angola's ROR-based PSC and, using the hypothetical project data summarized in Table 2.1, illustrates how it might perform under Nigerian conditions.
2.80 It must be stressed that these remarks are not intended as a recommendation to renegotiate existing agreements. Contract sanctity, the need to retain investor confidence, and that, at least based on hypothetical calculations, existing systems can deliver against many tax objectives, all argue for leaving existing arrangements in place for existing operations, unless otherwise mutually agreed. New arrangements might be usefully considered for new licenses; or even for new projects under existing licenses, again if mutually agreed and not too complex to design (the need to honor the benefits bestowed by existing consolidation provisions could prove to be a serious obstacle).
2.81 Procedures: The procedures for paying petroleum taxes in Nigeria, illustrated in Table 2.14, are reasonably clearly defined and straight forward. However, because of the requirement that taxes be paid first into an offshore federation account
0% 5%
10% 15% 20% 25% 30% 35% 40%
Small Medium Large Onshore
RoR
MOU 1991 Base Case MOU Base Shifting part of T1 to T2

Oil and Gas Taxation 37
managed by the Central Bank (CBN) before arriving at the Ministry of Finance, procedures are more complicated than in many other petroleum taxing jurisdictions.
Table 2.14: Tax Payment Procedures
Procedure PPT Royalty
Assessment FIRS, for whole year based on price/volume forecasts
DPR
Payments 1/12 of annual assessment each month. Paid to designated CBN offshore account
Monthly, based on market-based price and actual volumes
Filing End of tax year (March 31). Inspected by FIRS. Correction of over/underpayment
2.82 Monitoring procedures for upstream petroleum taxes also appear adequate, at least on paper. The PPT and royalty legislation contains strong audit and information powers and a tough penalty regime. Other procedures include the review and reconciliation of tax-related price and volume transactions by a Crude Oil Reconciliation Committee, composed of representatives from the several government agencies involved, such as the Ministry of Finance, Federal Inland Revenue Service (FIRS), the Central Bank (CBN), the National Petroleum Investment Management Service (NAPIMS), Customs, and so forth. In addition, the Department of Petroleum Resources (DPR), a branch of the Ministry of Petroleum Resources, screens all claims for RABs, and the NAPIMS, part of Nigerian National Petroleum Company (NNPC), audits the costs claimed by taxpayers. Finally, production is concentrated in the hands of a limited number of high profile, multinational oil companies subject to constant public and government attention both in Nigeria and internationally. This consideration, plus that these companies are subject to third party audit and scrutiny of costs by partners other than NNPC (NAPIMS), makes blatant exploitation of the Nigerian tax regime unlikely.
2.83 Institutional Capacity: It is at this level, the institutional capacity level, that tax administration really breaks down. There are serious problems in most key areas:
• Staffing. The lack of expertise in tax collection and in petroleum, and the low number of tax inspectors in the FIRS cause FIRS to be ineffective in verifying tax returns and ensuring the proper amount of PPT and royalty is collected. Pay scales are far (50–80 percent) below the scales that apply in NNPC and especially in the private sector, making it difficult to attract and retain qualified staff. The DPR and NAPIMS, while enjoying more favorable pay scales, have similar staffing problems. These could translate into a large amount of foregone tax revenue, if not on a direct basis

38 Taxation and State Participation in Nigeria
(noncompliance), then on an indirect basis through undetected and inappropriate cost inflation (see paragraph 2.88 below).
• Computerization. The lack of computerization across the various government agencies and the NNPC makes it difficult for them to provide meaningful and accurate data in a timely manner.
• IT Infrastructure. The lack of an IT infrastructure, especially in the CBN, results in the inability to reconcile and post amounts to the appropriate accounts on a timely basis. This results in considerable sums of money in transit and forgone interest on those funds.
2.84 These problems—staffing, training, compensation, infrastructure— require urgent attention not only because of their importance, but especially because of the lead time involved in remedying them.
2.85 Further discussion of oil and gas tax administration issues and recommendations can be found in a companion World Bank Report (Nigerian Petroleum Sector Flow of Funds Review) and in the IMF draft Report (Chapter 6) referred to in paragraph 2.72
Sectorwide Analysis
Results 1994–1999
2.86 The economic simulations in the section on Tax System Design are done on a project-specific basis. Calculations of this type are essential to understand the impact of a tax system on investment incentives, its efficiency, and its competitiveness versus other country tax systems. However, such calculations do not tell a government what to expect in terms of sectorwide tax revenues in any year. That figure, which is critical to a government for planning and budget management purposes, will depend on a consolidation of all sector activities, each in a different stage of the project cycle and consequently of different exposure to tax. Figure 2.19 shows sectorwide gross revenues, costs, actual royalty, PPT payments, and estimated allowable producer margins for the years 1995 through 1999.
Commentary
2.87 Figure 2.19 also illustrates the expected large sector smoothing out of individual project impacts on tax revenues (see paragraph 2.8 above). The T2 cost category (capital expenditures) reflects industry investment patterns and the influence of ITA and consolidation provisions. Its impact on total PPT plus royalty payments, however, is modest relative to the price impact.5 In other words, the design of the Nigerian tax regime does not appear to be a source of serious instability in tax revenues. The significant instability that is observed argues strongly for the introduction of policies
5 The gross revenue line primarily reflects movements in price, since production remained roughly constant through the evaluation period.

Oil and Gas Taxation 39
to stabilize the impact of price fluctuations on the macroeconomy, and, in the case of positive windfalls, for an orderly set-aside of some revenues for future national use.
Figure 2.19: Sectorwide Results, 1995–1999
0
1 0 0 0
2 0 0 0
3 0 0 0
4 0 0 0
5 0 0 0
6 0 0 0
7 0 0 0
8 0 0 0
1 9 9 5 1 9 9 6 1 9 9 7 1 9 9 8 1 9 9 9
$ M i l l i o n
T e c h . C o s t s , T 2 T e c h . C o s t s , T 1 R O Y + P P T ( a c t u a l )M O U M a r g i n G r o s s I n d . R e v e n u e
2.88 Figure 2.19 also suggests that gross revenue can be essentially fully accounted for by costs as accepted by the FIRS, actual tax payments, and allowable company margins. The margins shown in the figure are assumed to be at the US$2.50 per barrel level (the higher of the MOU guaranteed margin possibilities). In practice, margins may be slightly higher or lower for individual companies in any year depending on their actual investments in that year. The fact that gross revenues can be largely accounted for in this way suggests that there have been no significant fiscal shortfalls. The companion Flow of Funds Review, however, does identify a number of discrepancies which merit further investigation. Indirect underpayment of taxes may still occur as a result of cost inflation and/or the lack of capacity at either NAPIMS or the FIRS to challenge cost figures, hence the importance of institutional strengthening. Even absent challenges from NAPIMS or FIRS, however, other constraints on the cost inflation would still apply (paragraph 2.82).


41
3 State Participation
Objectives
3.1 Nonfinancial : The government may choose to participate directly in its country’s oil and gas sector, typically through a national oil company, for a variety of reasons. Nonfinancial objectives include: the development of indigenous capacity (acquisition of managerial and technical expertise and operating experience); influence over domestic procurement; superior access to industry information; and policy implementation. While these objectives are often debated, they are not the focus of this report which focuses on the financial aspects of state participation.
3.2 Financial: A government’s financial motivation for participating in the sector may include: an increase in its share of sector revenues beyond what the tax system would normally provide; and a considered judgment that participation represents a better investment option than available alternatives.
Forms of Participation
3.3 Noncontributing: Classic production sharing is the best known form of noncontributing participation. The national oil company participates in the PSC with a nonstate investor. Under the terms of the PSC, the government, through the national oil company, gains many of the nonfinancial and financial benefits of participation but contributes no money to the costs incurred under the agreement. In this case the production share should be considered as part of the government take, since the national oil company invested nothing to collect it.
3.4 Carried Interest: Carried interest participation usually involves a “carry” or nonpaying interest for the state during the exploration phase of operations, which becomes a paying interest (with or without reimbursement for the state’s share in exploration costs) once a commercial find has been established. In a sense the carried interest is a half-way house between a noncontributing interest and a full equity interest.

42 Taxation and State Participation in Nigeria
3.5 Full Equity: This is the current Nigerian joint venture model. NNPC, the state oil company, contributes its full share of all costs incurred in the context of joint venture operations with nonstate partners. NNPC’s share differs among the six international joint ventures in Nigeria, but averages 58 percent.
The Nigerian Joint Venture
3.6 Benefits: The financial arguments in favor of NNPC’s participation are those alluded to in paragraph 3.2—revenues in addition to tax, and the expectation of an attractive equity return, superior, some have argued, to that obtainable in other sectors where public funds have been squandered.
3.7 Costs: Financial arguments against participation are essentially the “flip-side” of arguments in favor. Participation requires the contribution of public money to meet substantial costs and the acceptance of often significant commercial and technical risks.
3.8 In recent years (since 1996), it has not been uncommon for NNPC to find itself in arrears versus its joint venture funding obligations. This is partly because of a mismatch between the timing of approvals of NNPC’s budget and commitments and resulting "cash-calls" under the joint venture. However, underfunding of NNPC out of the government’s budget also appears to have been an important contributing factor. Current NNPC arrears are reportedly approaching US$1.0 billion, a very substantial sum.6 This either delays the implementation of projects,7 deferring associated tax revenues and more general economic benefits, or results in the buildup of significant interest cost liabilities for NNPC, in the event that NNPC’s partners go ahead with the project, financing NNPC’s shortfall through bank loans as allowed under the Joint Operating Agreement which regulates relations between the joint venture partners. Figure 3.1 illustrates the impact of these two downside scenarios.
3.9 The left hand side of Figure 3.1 shows the total benefit to Nigeria from taxes and equity share (58 percent) from development of a hypothetical 160 million barrel oil field at US$18 per barrel. As might be expected, the lion’s share of benefits derives from the government’s tax take, not from equity participation. The first bar assumes NNPC meets its funding obligations on time and there is no delay in project startup. The second bar shows the reduced benefit which results if NNPC’s inability to meet a current financial obligation causes a one year delay in startup. The third bar shows the reduced net of interest benefit which results when assuming no delay in startup but loan finance at 20 percent interest coming out of NNPC’s share. The reduced benefits in
6 The precise amount of arrears has still to be agreed and is the subject of an ongoing Government Value-for-Money Audit. 7 Arrears have led to the deferral not only of new field development projects (as illustrated in Figure 2.1) but also of critical investments in the rehabilitation of existing production.

43
the equity participation cases caused by NNPC’s funding shortfall are less than the benefits Nigeria might have achieved through government take alone without equity
participation and assume the absence of any NNPC financing obligation which allows the project to start up on time, as represented by the bars on the right, and assume effective tax administration.
Figure 3.1: Financial Participation and Tax/PSC Alternatives
M e d i u m S h a l l o w W a t e r ( 1 6 0 m m b l s )
0
1 0 0
2 0 0
3 0 0
4 0 0
5 0 0
6 0 0
7 0 0
M O U B a s eC a s e
1 y e a rD e l a y
M O U w /0 % P . I .
P S A
Ben
efit
s to
Nig
eria
@15
%, $
MM
- 7 2 %
2 8 %
N N P C E q u i t y
G v t S h a r e
E q u i t y P a r t i c i p a t i o n ( 5 8 % ) N o E q u i t y / N o D e l a y
F i n a n c i n gO f N N P C ’ s
p o r t i o n
3.10 Simply put, there is good reason to rethink the merits of NNPC’s financial participation in projects. Most of the benefits from the projects will be extracted by existing fiscal arrangements and the relatively modest incremental benefit attributable to NNPC’s equity share could easily be eroded by any delay in startup which it may cause or by any interest charges it may accrue.
3.11 These reservations seem especially appropriate given the underfunding of critical social and infrastructure sectors relative to the funds required to meet NNPC’s current level of joint venture obligations (Figure 3.2).
Future Options
3.12 Production Sharing Contracts (PSCs): By replacing the joint venture arrangements with production sharing contracts as the model for relations with its partners, the Nigerian Government has avoided funding obligations for all new licenses, without, as the preceding analysis suggests, any significant prejudice to its expected benefits. As yet, however, PSCs account for only a small share of Nigeria’s oil production. The balance comes from the joint ventures. Further, the joint venture areas contain substantial proven but as yet undeveloped reserves (about 20 percent of total proven) which are likely to translate into a correspondingly high share of future near-term production. In other words, the funding issue will not be resolved in the near term by the shift to PSCs for new licenses.

44 Taxation and State Participation in Nigeria
3.13 Alternative Financing: A second option would be to pursue “Alternative Financing Arrangements.” Project finance has been considered. Under project finance, banks would advance to NNPC the funds required to meet NNPC’s equity obligations in exchange for a claim on future NNPC project revenues. Interest rates are bound to be high, and banks will not accept any commercial or technical risk under such arrangements. Further, the claim on state assets which project finance entails would reduce Nigeria’s capacity to raise debt to meet other pressing obligations.
3.14 Under a second version of alternative finance, NNPC’s joint venture partner(s) would fund NNPC’s share, temporarily taking on NNPC’s working interest in the joint venture. The partners would be repaid costs plus some premium out of the transferred working interest share, after which it would revert to NNPC. The advantages of this approach over pure project finance include the willingness of the funding partner to accept commercial risk and the likelihood of a lower rate since the funding partner is in fact the operator of the project(s).
3.15 Sale of Interest: Finally, Nigeria could sell all or a portion of its equity. Discounting future cash flows at 15 percent, the total value of NNPC’s joint venture equity is estimated at US$16.0 billion. Full sale of equity at any point in the near future seems highly unlikely given the nonfinancial objectives of participation (paragraph 3.1 above) that, although the model increasingly has been brought into question, sector structures which include state equity participation have worked in other countries. Partial disposition of equity, however, may merit discussion at this stage. The value of a net 10 percent sale, is estimated at close to US$3.0 billion. Sale of equity, in addition to reducing future funding obligations to more manageable levels and releasing funds for other uses, has the advantage of generating cash immediately for Nigeria. The political acceptability of any such transaction would depend importantly on the transparency of the sale and subsequent use of the proceeds. Further, the merits of shifting from equity participation to simple fiscal participation depend critically on the government's ability to collect taxes and royalties. So far, it seems that this can be done, although some
Figure 3.2: Financial Participation : Alternative Uses of Funds
FY 1999 Budget
0
5 0
1 0 0
1 5 0
2 0 0
2 5 0
3 0 03 5 0
4 0 0
N N P C J V H e a l t h E d u c a t i o n T r a n s p o r t
B i l l i o n N a i r a
A d d i t i o n a l R e q u i r e m e n t s
B u d g e t A l l o c a t i o n

State Participation 45
improvements in fiscal administrations are clearly desirable (paragraphs 2.83 to 2.85 above).
3.16 Work Program and Funding Procedures: At a minimum, the FGN, NNPC, and its joint venture partners should give careful consideration to the revision of current procedures for work program commitments under the joint ventures and the approval of NNPC's budget. At present, joint venture commitments are required several months in advance of the approval of NNPC's budget for the year in question, making a mismatch (typically an NNPC shortfall) almost inevitable. Ideally, the two events should be synchronized. Preferably, the budget allocation should come first, based on NNPC recommendations, and should not be subject to subsequent revisions. Having a dependable budget in hand in advance of deliberations on joint venture work programs would allow NNPC to avoid costly arrears.


47
4 Conclusions and Recommendations
Oil Taxation
4.1 Broadly speaking, both versions of the Tax/Royalty/MOU systems (the 1991 MOU and the proposed new MOU) and the current model PSC meet most objectives of oil taxation, including: the provision of adequate incentives to invest, transfer of a major sha re of project rents to the government, a modestly progressive government take (in the case of the MOUs), and international competitiveness. A major revision of the existing levels or structure of oil taxation is not recommended, especially given the current need to retain and increase investor confidence in Nigeria.
4.2 However, several areas merit further discussion and review and could benefit from either a revision of terms if mutually agreed upon by the government and the investor or from the introduction of new terms in new licenses:
• Small Fields: Small field development is not commercially viable under existing terms. A revision in terms to make these projects interesting to investors represents a “win-win” opportunity. Not only would investors gain from the wider range of commercial possibilities, but the government would also stand to benefit from an expanded tax base.
• Deep Offshore: Incentive terms have been granted to “frontier” areas such as the deep offshore to compensate for risk and attract first investors. Some of these areas are now beginning to mature, and a review of terms is probably warranted for new rounds of awards. This could involve not only a reassessment of the appropriate level of government take, but also improvements in the structure of the applicable PSC to increase its efficiency and its sensitivity to underlying project profitability. Certainly the use of cumulative production thresholds to escalate government take should be reconsidered since these can be expected to act as a disincentive to incremental investment in existing fields and/or new fields.
• Cost Containment : Many of the provisions of the existing tax systems, while satisfying other objectives, act counter to the objective of cost containment. This sort of tension is common in tax systems and is

48 Taxation and State Participation in Nigeria
certainly not unique to Nigeria. The provisions in question, for example, the investment allowance, accelerated depreciation, and consolidation, should be reviewed to see whether there is room for improvement in their design (the “tax inversion” clause in the new MOU is an interesting innovation in this respect), but probably the greater implication of this finding is the need for institutional capacity to monitor costs effectively.
• Complexity: The MOUs “work,” but their provisions are nontransparent to the uninitiated and the formulas required for their application are complex. This increases the difficulty and cost of tax administration and creates a need for renegotiation from time to time as the elaborate terms become outdated. New models, for example, tax or take systems linked to the investor’s achieved ROR which are simpler and at the same time probably more sophisticated, should be considered for future operations. The same models could be used to improve the performance of PSCs in any future licensing rounds.
• New MOU: In a reasonably likely range of future oil prices, the proposed new MOU modestly improves expected returns for investors (one of the sought after “updates”) by increasing the minimum guaranteed margin and the margin for prices in excess of US$19 per barrel. By narrowing the band in which the guaranteed margin applies, it also shifts some risk back to investors. It provides a desirable incentive to contain operating costs by increasing the post-tax cost to contractors of costs in excess of a target threshold. And, finally, it removes the RAB, which was successful in encouraging reserve additions (and consequently raising Nigeria’s OPEC quota), but had become very difficult to police against abuse and very costly in terms of reduced tax revenues. The new MOU should be formalized as soon as possible to put to rest current uncertainty over terms.
Natural Gas Taxation
4.3 Nigeria has given an intended and successful boost to gas development by offering very favorable fiscal incentives. In certain circumstances, however, the incentives can produce disturbing results. In particular, provisions which allow gas development costs to be consolidated with oil income, which is taxed at an 85 percent rate while gas revenues are taxed at only a 30 percent rate, can provide an investor with a post-tax ROR which is greater than the project’s pretax ROR. If the investor is allowed to consolidate his upstream gas development costs with oil revenues, and the costs of the downstream industrial plant or power plant which consumes the gas, this undesirable effect is exaggerated. Clearly, gas incentives should be revised to prevent this sort of result in the future. Care will have to be exercised with respect to planned or ongoing projects in which investments have been committed or made on the basis of current incentives, in order to avoid damaging Nigeria’s credibility with investors.

Conclusions and Recommendations 49
4.4 Higher gas prices could at least partly replace current incentives. Higher prices might reflect premiums paid by the international community in recognition of the environmental benefits of reduced gas flaring. A case can also be made for higher domestic gas prices. Gas pricing will be a key parameter in the successful promotion of investments for the domestic market. Acceptable gas prices in turn will critically depend on achieving power sector reform.
Tax Administration
4.5 The institutional capacity to administer petroleum taxes effectively is woefully lacking. Procedures, reinforced by third party audits, appear to ensure that taxes are paid and received albeit with potentially serious and costly internal lags. However, Nigeria lacks capacity (a) to assess the reasonableness of the returns submitted by taxpayers, including costs; (b) to develop petroleum tax policy; or (c) to assess or negotiate proposals for change. Staffing, skills, pay scales, other funding, and computer and IT infrastructure are all issues that need to be addressed urgently. These comments apply to each of the several agencies involved in oil and gas tax administration: FIRS, CBN, NAPIMS, DPR, and the Ministry of Petroleum Resources.
Sectorwide Analysis
4.6 Sectorwide analysis of results over the period from 1995–1999 suggests that tax design has had little adverse impact on the stability of oil tax revenues. As a result of the size and maturity of Nigeria's oil sector, the impacts of consolidation and similar provisions on the stability and timing of revenues, which are noticeable at the project level, have been smoothed out at the sector level. However, the behavior of oil prices is a much more important factor, when it comes to revenue instability. The significant instability that is observed argues strongly for the introduction of policies to stabilize the impact of price fluctuations on the macroeconomy, and, in the case of positive windfalls, for an orderly set-aside of some revenues for future national use.
4.7 The analysis also revealed that gross sector revenues were essentially fully accounted for by audited costs submitted for tax purposes, actual tax and royalty payments, and allowable oil producer margins. If taxes are being underpaid, non-compliance does not appear to be a major factor (although the Flow of Funds Review points to several discrepancies which need to be reviewed). The main focus of any investigations in this area should probably be on verification of the reasonableness of costs used in tax calculations (hence the importance of the FGN's ongoing Value for Money Audit).

50 Taxation and State Participation in Nigeria
State Participation
4.8 NNPC’s equity participation in upstream oil and gas projects is perceived as providing Nigeria with a number of nonfinancial benefits—greater control in a strategic sector, development of local capacity, and so forth. It is also seen as providing an attractive equity return, superior to that which might be earned in other sectors where public funds have been squandered. However, equity participation generates only a relatively small financial benefit relative to what would be collected through taxes with effective tax administration in any event. Further, that incremental benefit could be easily eroded by delays in project startup caused by NNPC failures to meet funding obligations in a timely manner or by interest costs, chargeable to NNPC, incurred by NNPC’s partners who borrow to meet NNPC’s shortfall. Further, the sums required to maintain NNPC’s financial participation at current levels are substantial, well in excess of funding going to other critical infrastructure and social sectors and can expose the government to significant technical and commercial risks.
4.9 Production Sharing Contracts, which entail no state financing, will solve the funding problem with respect to new licenses, but the joint venture licenses where NNPC does have obligations still account for 97 percent of production and can be expected to generate a number of near-term new development projects. While full disposal of the state's equity share in the near term seems improbable in the extreme and perhaps not even desirable, partial disposition at least merits discussion. Selling down a part of NNPC’s equity interests in these licenses could reduce future funding obligations to more manageable levels and release funds for other uses. It would also have the advantage of generating cash immediately for Nigeria the value of a net 10 percent sale is estimated at close to US$3.0 billion. Of course, the merits of shifting from equity to simple fiscal participation depend crucially on the ability to collect taxes. While there is ample room for improvement in tax administration, it appears that taxes and royalties are being collected in full.
4.10 At a minimum, the budgeting procedures for funding NNPC's obligations and the so-called "cash-call" procedures which generate those obligations should be reviewed and synchronized to minimize the likelihood of future costly NNPC arrears.

51
Annex 1 Principal Features of the Existing
Tax/Royalty/MOU System
A.1.1 The investor is assumed to be an OPTS (Oil Producers Trade Sector) joint venture partner which has sufficient ongoing taxable income to be able to offset all preproduction field development costs at an effective rate of 85 percent. All post-production costs are accounted for by the Revised Government Take formula.
References • Petroleum Act 1969, as amended (PA)
• Petroleum (Drilling and Production) Regulations 1969, as amended (PR)
• Petroleum Profits Tax Act 1959, as amended (PPTA)
• Petroleum (Amendment) Decree No. 23 on Marginal Fields August 1996 (MFD)
• 1991 Memorandum of Understanding (1991 MOU)
• 1998 Incentives for Utilization of Associated Gas under Section 10A of Petroleum Profits Tax Act (1998 PPTA Gas Incentives)
• 1998 Incentives to the Gas Industry under Section 28G of the Companies Income Tax Act (1998 CITA Gas Incentives)
Joint Ventures A.1.2 Six joint ventures (JVs) between foreign investors and NNPC have been in existence since the 1970s, and they currently account for over 95 percent of Nigerian crude oil production. Each partner lifts and sells its share of production, pays its share of costs, and is separately liable for royalty and taxes. All JV partners are governed by a royalty/tax regime which is comprised of:
• A royalty imposed under the Petroleum Act 1969, as amended—rates were last fixed in 1995 at 20 percent for oil and 7 percent for gas in onshore areas and from 18.5 percent falling to zero for oil and 5 percent for gas in offshore areas.

Taxation and State Participation in Nigeria
52
• A Petroleum profits tax under the Petroleum Profits Taxation Act 1959, as amended—the standard rate is 85 percent, however, a rate of 65.75 percent applies until the taxpayer has recovered preproduction expenditures.
• Additional taxes, including VAT, the Education Tax, and Import Duties.
ROYALTY
Liability for Royalty
1969 PR Sec 60
A.1.3 A royalty is levied on gross production less:
• That used for field operations or pumped to storage
• That reinjected or returned to the formation
• Reasonable pipeline or evaporation losses.
Royalty Rate
1995 Reg; 1969 PR Sec 60
A.1.4 Different royalty rates are payable for oil and condensate and for natural gas. Rates are fixed by amendment of the petroleum regulations.
A.1.5 Current rates, which came into effect on April 1, 1993 under a 1995 amendment, are as follows:
Table A.1.1: Current Royalty Rates
Water Depth (meters) Royalty Rate (%)
Onshore 20.00
Offshore Up to 100 101 - 200 201 - 500 501 - 800 801-1,000 Over 1,000
18.50 16.50 12.50 8.00 4.00 0.00
Companies operating mainly onshore but also having offshore leases or licenses may be allowed a concessionary royalty rate of 19.5 percent.
A.1.6 Effective April 1, 1993 the royalty rate for gas was set at 7 percent onshore and 5 percent offshore. However, in 1997 the government announced a package

Annex 1: Principal Features of the Existing Tax/Royalty/MOU System 53
of incentives for gas development which included the exemption of all gas from royalty. At the time of writing, clarification was being sought whether this incentive had yet been enacted in legislation.
Royalty Valuation
1995 Reg; 1969 PR Sec 60; 1991 MOU
A.1.7 The royalty and petroleum profits tax (PPT) are currently computed using a price which is “from time to time established by the Minister as its price for Nigerian Crude Oil of that gravity and quality” as stated in the 1995 amendment to the petroleum regulations. The chargeable value is the value of production using this price less the costs of oil mining license (OML) rentals, handling, treating, storing, and transporting the petroleum. Such costs have to be approved by DPR.
Note: Prior to the 1995 amendment all references were to a “posted” price, following a government directive contained in a letter dated June 14, 1994 (revising the previous directive which had been in force since December 31, 1985). Prior to this directive both the royalty and PPT were computed on an Official Selling Price (OSP) basis. The OSP was defined as the price FOB the Nigerian port of export. It was fixed by the government but was intended to reflect international market prices.
The OSP was calculated as the market value for the relevant quarter computed on the weighted average realized price in U.S. dollars obtained by NNPC for crude oil produced from the contract area in respect to each quantity of crude in the export market. The revised price basis was intended to reflect market conditions and was derived on a “netback” basis.
A.1.8 Under the terms of the 1991 MOU the revised government take (a proxy for the royalty and PPT providing the investor a guaranteed profit margin) is calculated using a formula based (at least in part) on netback values (see Income Tax).
Payment of Royalty
1969 PR Sec 60
A.1.9 Royalty for an accounting period is paid within 60 days of the last payment, that is every other month. Accounting periods are based on the calendar year. The licensee is permitted to pay royalties not more than one month after the due date.
A.1.10 In the event of a dispute as to the amount of royalty due for a quarter, the licensee or lessee:
• Must pay within the time limit whatever it admits to be due.
• Must pay any further amount agreed or found to be due within seven days of the settlement of the dispute by agreement, arbitration, or otherwise.

Taxation and State Participation in Nigeria
54
INCOME TAX
Income Tax Liability
PPTA Sec 8, 9, Petroleum Tax Regulation
A.1.11 Any company conducting petroleum operations is liable to pay Petroleum Profits Tax (PPT) and is expressly exempted from any liability to pay corporate income taxes, which apply to other business sectors.
A.1.12 Associated gas producers that supply associated gas for delivery to natural gas liquid extraction projects benefit from being able to include all capital expenditures associated with the associated gas facilities as oil-related assets for PPT purposes. Any associated gas revenue, however, is taxed under the Companies Income Tax Act (CITA) rather than the Petroleum Profits Tax Act (PPTA). The company must segregate from other costs all operating costs exclusively related to the supply of gas in order to determine taxable income under the CITA (see Income Tax Deductions and Depreciation).
A.1.13 Effective January 1997, gas marketing and distribution for commercial purposes, including LNG, benefit from tax incentives under the CITA. There is a tax holiday of three years from the first production date, which may be extended for a further two years. Incentives also include accelerated capital allowances. The annual capital allowance is 90 percent, with a 10 percent retention for investment in the plant and machinery, plus an additional 15 percent investment allowance which does not reduce the value of the asset.
Ringfence for Income Tax
PPTA Sec 12
A.1.14 There is a ringfence around a company's entire JV exploration and production activities in Nigeria for PPT purposes, preventing it from transferring any losses from downstream operations to upstream operations and the reverse.
A.1.15 In addition, any costs and revenues incurred within a production sharing contract area may not be offset against joint venture revenue, and the reverse.
Income Tax Rate
PPTA Sec 16, 1998 CITA Gas Incentives
A.1.16 The Petroleum Profits Tax (Amendment) Act No. 55 of 1977, effective from April 1, 1975, introduced a petroleum profits tax rate of 85 percent of the chargeable profit of the company. A reduced rate of 65.75 percent is available for companies which had not commenced making sale or bulk disposal of chargeable oil under a program of continuous production and sales as of April 1, 1977. This relief is available until all preproduction capitalized expenditure has been fully amortized. The 65.75 percent rate also applies to all local sales.

Annex 1: Principal Features of the Existing Tax/Royalty/MOU System 55
Note: Therefore, the lower rate of tax is applicable to new investors until they have depreciated all preproduction expenditures from their first development. In most cases this means that the lower tax rate will be applicable for the first five years of production.
Indigenous operators were, at the time of writing, campaigning for special incentives within the PPT rules. They were seeking "pioneer status," which is available under general corporate income tax rules and includes a five year tax holiday. They were also seeking a flat PPT rate of 50 percent (commensurate with the rate applicable to PSCs).
Companies were notified about the lower rate applicable to all domestic sales by NNPC in 1977. No amendment has been made to the PPTA. To date, however, only NNPC oil has been sold locally.
A.1.17 Revenue from associated and nonassociated gas production is taxed according to generally applicable corporate income tax rules (CITA). The current tax rate is 30 percent, reduced from 35 percent in 1996.
A.1.18 Downstream gas companies are also taxed according to the general income tax rules, although the Nigerian LNG project remains liable to PPT at a reduced rate of 45 percent.
Income Tax Deductions and Depreciation
PPTA Sec 10, Schedule 2
A.1.19 The following are deductible (that is, may be expensed in the year in which they are incurred) in calculating the “Adjusted Profit”:
• Rent paid for land or a building occupied for its petroleum operations or compensation incurred under an oil prospecting license or mining lease for disturbance of surface rights.
• Royalties on exported crude oil, the liability for which was incurred by the company during that period in respect of crude oil exported from Nigeria. A direct offset is offered on royalties paid on crude not exported. (See further below under Tax Offsets and PPTA Sec 17.2.)
• VAT payments.
• Education tax payments (since 1996 only).
• Interest on loans in which the lender is not an affiliate of the borrower company.
Note: The prior written approval of the Federal Finance Ministry may be required before a loan is raised.
• Repair costs of premises, plant, and machinery. Capital employed on improvements rather than repairs is capitalized.
• Bad and doubtful debts arising from the company’s petroleum operations.

Taxation and State Participation in Nigeria
56
• Any expenditure (including tangible expenditure) incurred in connection with exploration drilling and the drilling of the first two appraisal wells in a particular field.
• Intangible drilling costs directly incurred in connection with drilling an appraisal or development well.
A.1.20 Intangible Drilling Costs basically covers most categories of operating costs and is defined as all expenditures for labor, fuel, repairs, maintenance, handling, supplies and materials which are for or incidental to drilling, cleaning, deepening, or completing wells or the preparation thereof incurred in respect to:
• The determination of well location, geological studies, and topographical and geographical surveys preparatory to drilling
• Drilling, shooting, testing, and cleaning of wells
• Cleaning, draining, and leveling of land, road building and the laying of foundations, erections of tankage, assembly and installation of pipelines, and other plant and equipment required with preparation of drilling of wells producing petroleum.
Note: Prior to the 1997 budget capital investment in associated gas facilities could be charged as a capital allowance for PPT purposes and written off at the 85 percent rate, under the terms of the Associated Gas Framework Agreement (AGFA). Revenues and operating costs attributable to associated gas were taxed separately at the general corporate tax rate. However, investment costs attributable to associated gas facilities could not be included in the calculation of "capital costs per barrel" for purposes of the MOU calculation. (1998 CITA Gas Incentives)
A.1.21 A company's balance sheet depreciation charge is expressly disallowed as a deduction for calculating the adjusted profit. Instead, capital allowances are granted for "qualifying capital expenditure" incurred by a petroleum company for the purpose of its operations in an accounting period. Qualifying expenditure is defined as follows:
(a) Qualifying plant expenditure. Capital expenditure incurred for plant, machinery, or fixtures.
(b) Qualifying pipeline and storage expenditure. Capital expenditure incurred on pipelines and storage tanks.
(c) Qualifying building expenditure. Capital expenditure, otherwise than in (a) (b) and (d) incurred on the construction of building structures or work of a permanent nature.
(d) Qualifying drilling expenditure. Capital expenditure incurred in connection with petroleum operations in view of:

Annex 1: Principal Features of the Existing Tax/Royalty/MOU System 57
- The acquisition of, or of rights in or over, petroleum deposits;
- Searching for or discovering and testing petroleum deposits or winning access thereto; or
- The construction of any work or buildings which are likely to be of little or no value when the petroleum operations for which they were constructed cease.
Note: All drilling expenditure, apart from that which has been charged as a deduction in calculating the adjusted profit, is capitalized. Definitions of tangible and intangible drilling costs have, however, changed over the years. A detailed examination of the definitions may reveal some anomalies, an understanding of which would be necessary for detailed analysis of deductions and depreciation in this category.
A.1.22 The rate of the annual allowance (effectively straight- line depreciation) is as follows:
Table A.1.2: Annual Allowance Rate
Year Upstream Assets Depreciation Rate (%)
1 2 3 4 5
20 20 20 20
19% Year Downstream Gas Assets Depreciation Rate (5)
1 90 Year Nigerian LNG Assets Depreciation Rate (%)
1 2 3
33 33 33
A.1.23 When insufficient assessable profit is available, or is capped (see below) so that the full amount of capital allowances for the accounting period are unable to be taken, then the amount that has been unable to be deducted may be carried forward as an allowance for the following period. This carry forward is unlimited. (PPTA Sec 15.5)
A.1.24 Preproduction expenditures are treated as if they were incurred in the first accounting period, which is defined as the first year in which the company first makes a sale or bulk disposal of chargeable oil under a program of continuous production. (PPTA Section 2, Schedule 2.2)
A.1.25 There is a limit to the deduction of capital allowances from "assessable profits" in any one year. The deduction allowable shall be the lesser of:

Taxation and State Participation in Nigeria
58
• The full amount of capital allowances; or
• Eighty-five percent of assessable profits less 170 percent of the tax offsets (see below).
Income Tax Treatment of Home Office Overheads
1991 MOU Appendix 1
A.1.26 The PPTA is silent on the issue of home office overheads. It is understood that in practice 2½ percent of total capital expenditure is allowed each year for this purpose. The 1991 MOU includes guidelines on the allocation of overheads, based on levels of capital expenditure attributable to production operations (that is, total capital expenditure less exploration and other non-production related activities). It does not make any distinction between local and home office overheads either, however.
Income Tax Treatment of Interest
PPTA Schedule 10
A.1.27 Interest payable to third parties is deductible, subject to approval by the Board. Following an agreement between the producers and government in 1972, interest payable on intercompany loans is not deductible.
Income Tax Treatment of Decommissioning and Abandonment Costs
A.1.28 There are no specific provisions relating to the tax treatment of abandonment costs.
Other Income Tax Allowances
PPTA Sec 17
A.1.29 Chargeable tax, that is the amount actually due from the company (before revised government take considerations) for an accounting period is defined as the amount of assessable tax for that period after the deduction of tax offsets. Tax offsets include:
• Rents on nonproducing OMLs or OPLs (oil prospecting licenses)
• Royalty on oil sold to local refineries
• Customs or other similar duties on equipment essential for petroleum operations
• Investment tax credit (ITC)
• Offset for excess capital outlay (MOU only)
• Reserves additions bonus (MOU only)
A.1.30 Where the total amount of tax offsets exceeds the assessable tax for the period, or if there is no assessable tax for that period, then the excess is carried forward for deduction from the assessable tax of any future accounting period.

Annex 1: Principal Features of the Existing Tax/Royalty/MOU System 59
A.1.31 The 1995 budget redefined the fo llowing offsets from a tax credit to allowances for calculating assessable tax:
• Rents on nonproducing OMLs or OPLs
• Royalty on oil sold to local refineries
• Customs or other similar duties on equipment essential for petroleum operations
• Investment tax credit (ITC).
Note: The 1995 transition from tax credits to allowances is supported in the Finance Decree 1996 (Miscellaneous Taxation Provisions,) but, at the time of writing, had yet to be incorporated in an amendment to the PPTA.
A.1.32 The difference between the Investment Tax Credit (ITC) and the Investment Tax Allowance is that the ITC is deducted from the amount of tax payable, while the ITA is deducted from taxable income. For example, if net taxable income is 100 and the PPT rate is 50 percent, then tax payable with an ITC of 50 would be (100 * 50 percent) - 50 = 0; whereas tax payable with an ITA of 50 would be (100 - 50) * 50 percent = 25.
Investment Tax Credit
PPTA Schedule 2.5
A.1.33 The investment tax credit (ITC) is an additional tax offset as defined above. Under the Petroleum Profits (Amendment) Act (No. 24) 1979, effective from April 1977, all qualifying expenditures (see above) give rise to the ITC, the rate of which varies according to the location of the area and the recent introduction of incentives for gas operations as shown in Table A.1.3.
Table A.1.3: Investment Tax Credit
Location / Asset Type Rate (%) Onshore Oil 5.00 Offshore Oil Up to 100 m 101 - 200 m Over 200 m
10.00 15.00 20.00
Production Sharing Contracts 50.00 Downstream NGL and Gas to Liquids (GTL) Assets
35.00
Other Downstream Gas Assets 15.00 Nigerian LNG Assets 10.00

60
Note 1: The PPTA states that the base for capital allowances must be reduced by the value of any ITC claimed. It is understood, however, that the ITC has always been intended as an additional allowance and, in practice, the Revenue department has always allowed the ITC as such and does not reduce the base for capital allowances.
Note 2: Decree 9/1999 establishes (for PSC holders) that contracts signed between 1993 and 1998 will still benefit from the investment tax credit while PSCs signed after 1998 will receive the allowance instead.
Income Tax Loss Carry Forward and Carry Back
PPTA Sec 15
A.1.34 Losses incurred during any previous accounting period may be carried forward indefinitely. Any losses carried forward are added to the Adjusted Profit to derive the "Assessable Profit" for the accounting period.
Income Tax Treatment of Transfers
PPTA Schedule 2.9
A.1.35 The following section of the PPTA suggests that a company is liable to PPT on farm-outs:
"...where in any account period of a company, the company owning any asset in respect of which it has incurred qualifying expenditure wholly and exclusively for the purposes of petroleum operations carried on by it, disposes of that asset, the excess of the value of that asset, at the date of its disposal, over the residue of that expenditure at that date shall... be treated as income of the company of that accounting period."
Note: However, the question of the position of revenues received from assignment versus Capital Gains Tax is more important for oil companies. The question still has not been settled in Nigeria.
A.1.36 The Capital Gains Tax was introduced in the Capital Gains Tax Act 1969 (CGTA) and is chargeable on any gains accruing on a disposal of assets. Section 3 of the act states that all forms of property shall be assets for the purposes of the CGTA whether they are situated in Nigeria or not. CGT is currently charged at 10 percent (down from 20 percent in 1996) of any gain accruing to the taxpayer. The view held by the Federal Board of Inland Revenue in Nigeria is that when the parent company of a Nigerian subsidiary is acquired then, even if the direct ownership of the Nigerian company and its name are not changed, a disposal under the CGTA has taken place and the gains are chargeable to CGT. This was the view taken by the Inland Revenue relative to the Chevron acquisition of Gulf. CGT was computed on the difference between the open market price of the disposal and the going concern value of the company on the date of sale.
A.1.37 However, the wording of the CGTA is not clear on whether it is applicable to disposals made outside Nigeria, assets or shares situated outside Nigeria, or persons

Annex 1: Principal Features of the Existing Tax/Royalty/MOU System 61
outside Nigeria. At the time of writing, the dispute between Chevron and the Inland Revenue on this point was still not settled and remained before the Nigerian courts.
Valuation for Income Tax
PPTA Sec 9
A.1.38 Oil and gas are valued according to the rules for calculating royalty (see Royalty Valuation).
Payment of Income Tax
PPTA Sec 37-39
A.1.39 The Petroleum Profits Tax for any accounting period of 12 months is payable in 12 installments together with a final installment which is due and payable within 21 days of the date of service of the notice of assessment. The final installment is the amount of the assessment, less the sum already paid. Each monthly payment is due on the last day of the second month following, that is payment is lagged by 60 days, and is an amount equal to one-twelfth of the amount of tax estimated to be chargeable for the relevant accounting period. The fiscal year is the calendar year.
A.1.40 With respect to PPT, late payments are charged 5 percent interest, such penalty being payable with the installment due to be paid.
Operation Of The 1991 MOU Provisions
A.1.41 In lieu of the conventional royalty plus PPT calculations the investor is subject to the terms of the 1991 MOU which calculates the total government take on a per barrel basis as follows:
RGT = RP - ATC – AFM, where: RGT = Revised Government Take (US$/bbl) RP = Realized Price (based on an FOB netback formula to mirror the crude oil
values of Nigerian export grades) Actual Technical Costs (US$/bbl) = Operating costs plus exploration and appraisal (E&A) costs plus intangible development costs plus depreciation of tangible development costs over five years on a straight-line basis. In the fifth year, however, only 19 percent is allowed, thus leaving the investor with 1 percent of tangible development costs undepreciated at the end of the field life.
AFM = Actual Fiscal Margin ($/bbl), where : AFM = DFM + ((1-PPT) * (DTC - ATC)) + ITC - TE DFM = Deemed Fiscal Margin (US$/bbl) (see below). PPT = Petroleum Profits Tax rate = 85 percent DTC = Deemed Technical Costs = US$3.50/bbl (US$2.50 would apply if ongoing
capital investment was less than US$1.50/bbl. It is assumed that OPTS producers do have capex in excess of this each year).

Taxation and State Participation in Nigeria
62
ATC = Actual Technical Costs (US$/BBL), as above. ITC = Investment Tax Credit (US$/bbl) = 10 percent (5 percent onshore of
expenditure qualifying for capital allowances (namely, tangible development costs)
TE = Tax Erosion (VAT, Education Tax, customs duties, and so forth) 1. For oil prices between US$12.50 and US$23.00 per barrel, DFM
= US$2.50/bbl (US$2.30 would apply if ongoing capital investment was less than US$1.50/bbl. It is assumed that OPTS producers do have CapEx in excess of this each year).
2. For oil prices greater than US$23.00 per barrel, DFM = RP - DTC
- PRGT, where :
PRGT = Provisional Revised Government Take = OP - (PPT * TC) OP = RP * B B = K [(1-R) x T + R] K = 0.9869 (1.0042 would apply if the lower profit margin applied) R = Royalty rate =20 percent
3. For oil price lower than US$12.50/bbl, then the fixed M factors are replaced by the following:
M = (1 - (FC/RP)) * ((RP1 * a1) + (RP2 * a2) + (RP3 * a3)), and a = Company's percentage share of field profit, as shown in Table A.1.14.
Table A.1.4: MOU Provisions
Realizable Price (RP) Company Share
(i) if FC = US$2.50/b
(ii) if FC = US$3.50/b
0 < RP1 <= US$5.00/b a1 0.30 0.365
US$5.00/b < RP2 <= US$10.00/b a2 0.22 0.263
$10.00/b < RP3 <= US$12.50/b a3 0.11 0.131
Gas Flaring Tax
A.1.42 Gas flaring incurs a penalty of 10 naira per Mcf. (US$1 = 95 naira = US$0.10 per Mcf)
Ringfence
A.1.43 There is a ringfence around the JV for tax purposes.
Details of the Calculation of the Reserves Additions Bonus
1991 MOU Sec 2.9
A.1.44 An additional offset was introduced in the 1991 MOU as an incentive to reserve replacement for existing producers. The extent of the offset increases as the amount of reserves added during the year exceeds production. The bonus is calculated as follows:

Annex 1: Principal Features of the Existing Tax/Royalty/MOU System 63
Bonus = [(Ra1 * X1) + (Ra2 * X2) + (Ra3 * X3) + (Ra4 * X4)] * P * e,
where: P = Annual Production e = Equity Ratio Ra = Incremental reserve/production ratio (R - 1.0) X = Bonus rates for various values of R, where: R = [((P1 + P2) UR at year end) - ((P1 + P2) UR at year start)] / P, where: UR = Ultimate Recovery of crude oil and condensate P1 = Proven P2 = Probable
Table A.1.5: Reserves Addition Bonus
Reserves Addition / Production Ratio Applicable Bonus Rate (per incremental barrel)
1.00 < R1 < 1.25 X1 = US$0.10 1.25 < R2 < 1.50 X2 = US$0.25
1.50 < R3 < 1.75 X3 = US$0.40
R4 > 1.75 X4 = US$0.50


65
Annex 2 Principal Features of the New MOU/Technical
Evaluation
A.2.1 Guaranteed Margin:
• Revised for oil prices between U$15.00 and U$19.00/bbl:
US$2.50/bbl if CapEx < US$2.00/bbl
US$2.70/bbl if CapEx > US$2.00 /bbl • Adjusted by formula if price is outside the range of US$15.00/bbl–US$19/bbl.
Assumptions and Calculation:
Oil Price below US$15/bbl:
In a low oil price scenario, the formula below is valid: DFM = (a1xRP1+a2xRP2+a3xRP3)(1-FC*/RP) * FC: Fiscal Cost (US$4/bbl) This formula should ensure a DFM of US$2.50 at US$15/bbl: DFM=2.5=(a1x5+a2x5+a3x5)(1-4/15)
A.2.2 There is an infinite possibility for the (a1, a2, a3) factors to meet this formula. For purposes of this report, only the a3 factor in MOU 1991 was modified.
Hence,
Table A.2.1: Oil Price < US$15/bbl
MOU 1991 MOU “new” Low Margin High Margin Low Margin High Margin
a1 0.300 0.365 0.300 0.365
a2 0.220 0.263 0.220 0.263 a3 0.11 0.131 0.162 0.108

Taxation and State Participation in Nigeria
66
Table A.2.2: Oil Price > US$19/bbl
Solving for K under 1996 MOU
Oil Price 19 19
Fiscal Cost ($/b) 4.0 4.0
Fiscal Margin ($/b) 2.5 2.7 RGT=RP-Margin-FC 12.50 12.30
PPT rate (%) 85 85
(PPT*FC) 3.40 3.40 OP=RGT+(PPT*FC) 15.90 15.70
B=OP/RP 0.8368 0.8263
Royalty Rate (%) 20 20 Net Royalty Tax 0.88 0.88
K=B/Net Royalty Tax 0.9510 0.9390
Figure A.2.1.: Comparison 1991 versus 1996 MOU Margins: High CapEx Margin
0 . 0 0
0 . 5 0
1 . 0 0
1 . 5 0
2 . 0 0
2 . 5 0
3 . 0 0
3 . 5 0
4 . 0 0
4 . 5 0
5 . 0 0
5 6 7 8 9 1 0 1 1 1 2 1 3 1 4 1 5 1 6 1 7 1 8 1 9 2 0 2 1 2 2 2 3 2 4 2 5 2 6 2 7 2 8 2 9 3 0
O i l P r i c e ( $ / b )
Dee
med
Fis
cal M
argi
n ($
/b)
1 9 9 1 M O U 1 9 9 6 M O U ( a d a p t e d f r o m 1 9 9 1 )

Annex 2: Principal Features of the New MOU/Technical Evaluation 67
Table A.2.3: Tax Inversion Mechanisms
OpCost (T1) (US$/bbl) 1.00 1.50 1.70 2.00 2.50 3.00 3.50 4.00 4.50 5.00 5.50 6.00
TIT (minimum) 1.7 1.7 1.7 1.7 1.7 1.7 1.7 1.7 1.7 1.7 1.7 1.7 TIT (maximum) 3.0 3.0 3.0 3.0 3.0 3.0 3.0 3.0 3.0 3.0 3.0 3.0
TIT 1.7 1.7 1.7 2.0 2.5 3.0 3.0 3.0 3.0 3.0 3.0 3.0
Full Tax rate (%) 85 85 85 85 85 85 85 85 85 85 85 85 Tax Inversion Rate (%) 35 35 35 35 35 35 35 35 35 35 35 35
Full Tax * TIT 1.44 1.44 1.44 1.70 2.12 2.55 2.55 2.55 2.55 2.50 2.50 2.50
T1 - TIT -0.70 -0.20 - - - - 0.50 1.00 1.50 2.00 2.50 3.00 Tax Inversion *(T1-TIT) -0.24 -0.07 - - - - 0.17 0.35 0.52 0.70 0.87 1.05
Total Tax Relief (T1) 1.20 1.37 1.44 1.70 2.12 2.55 2.72 2.90 3.07 3.25 3.42 3.60
Effective Tax Relief Rate (%) 120 92 85 85 85 85 78 73 68 65 62 60 With TIT = Tax Inversion Threshold (either $3.00 if T1>3.00 or 1.70 if T1<1.70, assuming production is <175 mmbd)
Figure A.2.2: Comparison 1991 versus 1996 MOU Margins: Low CapEx Margin
0 . 0 0
0 . 5 0
1 . 0 0
1 . 5 0
2 . 0 0
2 . 5 0
3 . 0 0
3 . 5 0
4 . 0 0
4 . 5 0
5 . 0 0
5 6 7 8 9 1 0 1 1 1 2 1 3 1 4 1 5 1 6 1 7 1 8 1 9 2 0 2 1 2 2 2 3 2 4 2 5 2 6 2 7 2 8 2 9 3 0
O i l P r i c e ( $ / b )
Dee
med
Fis
cal M
arg
in ($
/b)
1 9 9 1 M O U 1 9 9 6 M O U ( a d a p t e d f r o m 1 9 9 1 )

Taxation and State Participation in Nigeria
68
Figure A.2.3: Impact of the Tax Inversion Mechanism. Effective Tax Relief Rate
E f f e c t i v e T a x R e l i e f R a t e
5 0 %
7 0 %
9 0 %
1 1 0 %
1 3 0 %
1.0 1.5 2 . 0 2.5 3.0 3.5 4.0 4.5 5.0 5.5 6.0
T 1 c o s t s ( U S $ / b b l )
Eff
ectiv
e Ta
x R
elie
f
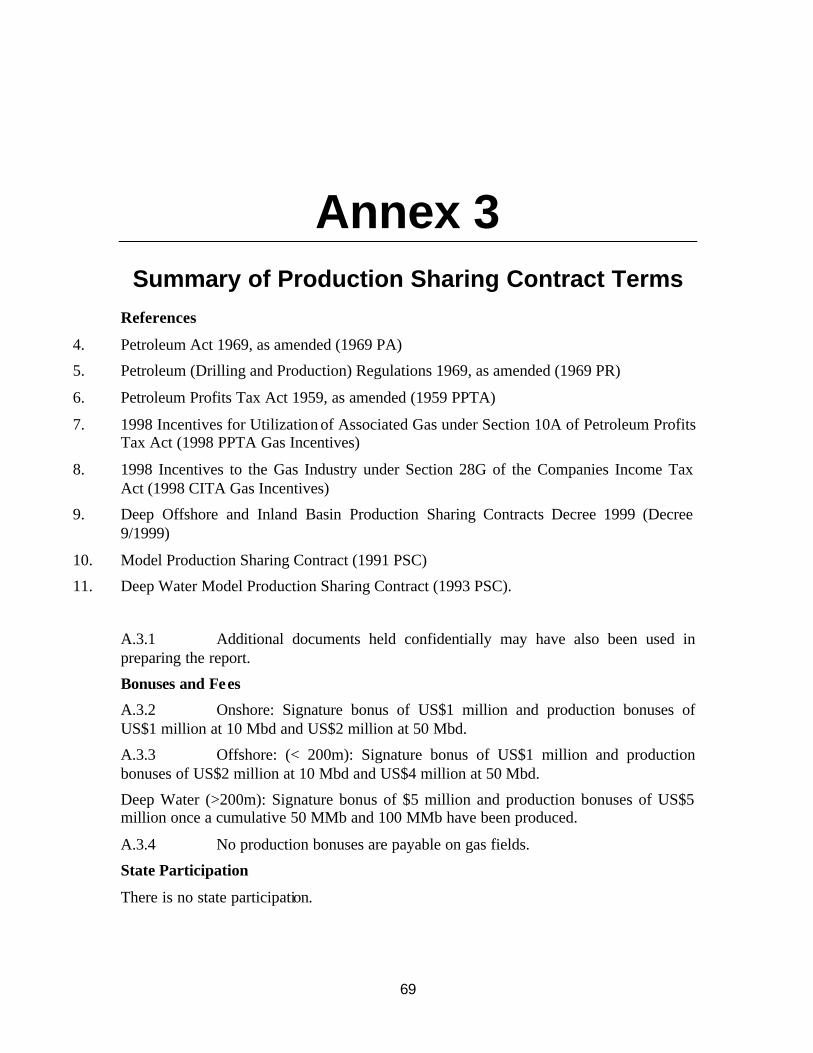
69
Annex 3 Summary of Production Sharing Contract Terms
References
4. Petroleum Act 1969, as amended (1969 PA)
5. Petroleum (Drilling and Production) Regulations 1969, as amended (1969 PR)
6. Petroleum Profits Tax Act 1959, as amended (1959 PPTA)
7. 1998 Incentives for Utilization of Associated Gas under Section 10A of Petroleum Profits Tax Act (1998 PPTA Gas Incentives)
8. 1998 Incentives to the Gas Industry under Section 28G of the Companies Income Tax Act (1998 CITA Gas Incentives)
9. Deep Offshore and Inland Basin Production Sharing Contracts Decree 1999 (Decree 9/1999)
10. Model Production Sharing Contract (1991 PSC)
11. Deep Water Model Production Sharing Contract (1993 PSC).
A.3.1 Additional documents held confidentially may have also been used in preparing the report.
Bonuses and Fees
A.3.2 Onshore: Signature bonus of US$1 million and production bonuses of US$1 million at 10 Mbd and US$2 million at 50 Mbd.
A.3.3 Offshore: (< 200m): Signature bonus of US$1 million and production bonuses of US$2 million at 10 Mbd and US$4 million at 50 Mbd.
Deep Water (>200m): Signature bonus of $5 million and production bonuses of US$5 million once a cumulative 50 MMb and 100 MMb have been produced.
A.3.4 No production bonuses are payable on gas fields.
State Participation
There is no state participation.

70
Royalty
Royalties are levied on gross revenue at a rate determined by water depth, as shown in the following table. (Note that there is no royalty on gas production.)
Table A.3.1: Royalties
Water Depth Royalty Rate (%)
Onshore 10 0 – 200 10
200 – 500 12
500 – 800 8 800 – 1,000 4
> 1,000 0
Note: Onshore and less than 200m are referred to as "Inland basins" in the regulations.
Cost Recovery
A.3.5 Production remaining after royalty is available for costs recovery. Operating costs, E&A costs, and intangible development costs are expensed and recovered immediately. Depreciation of tangible development costs is over five years on a straight- line basis. In the fifth year, however, only 19 percent is allowed, thus leaving the investor with 1 percent of tangible development costs undepreciated at the end of the field life.
Tax Oil
A.3.6 Fifty percent (30 percent for gas fields) of gross revenue remains after royalty and cost recovery plus an uplift of 50 percent of depreciated expenditure.
Profit Sharing
A.3.7 Production remaining after royalty, cost recovery and tax oil is shared between the state and the contractor on an incremental sliding scale as shown in Table A.3.2.

Annex 3: Summary of Production Sharing Contract Terms 71
Table A.3.2: Profit Sharing
Area Production (Mbd) State % Contractor %
Onshore > 100 100 - 200
> 200
52 57 60
48 43 40
Shallow Offshore (< 200m)
> 30 30 - 50 > 50
60 62 65
40 38 35
Area Cum. Production (MMb)
State % Contractor %
Deep Offshore (> 200m)
0 > 350 351 - 750
751 - 1,000 1,001 - 1,500
> 1,500
20 35 45 50 60
80 65 55 50 40
A.3.8 Profit sharing terms for nonassociated gas developments are negotiated on a case by case basis. We have assumed a 50:50 split in all cases.
Gas Flaring Tax
A.3.9 Gas flaring incurs a penalty of N10 per Mcf, or about US$0.10 per Mcf (US$1 = N95).
Withholding Tax
A.3.10 There is no withholding tax payable.
Ringfence
A.3.11 There is a ringfence around the contract area for cost recovery, profit sharing, and income tax purposes although it is believed that deepwater contract areas may be consolidated.
Quality
A.3.12 Bonuses, profit sharing, and uplift rates are negotiable—terms shown are our assumptions based on Niger Delta and deepwater contracts.


73
Annex 4 Summary of Gas Terms
Gas Operations
A.4.1 Virtually all gas produced in Nigeria is associated gas and nearly 85 percent of that is flared. To discourage flaring, both a tax on all gas flared and a series of incentives to promote the commercial development of associated gas reserves have been introduced in recent years. All capital investment incurred in utilizing associated gas may now be treated as part of the capital allowances of the oil field (accruing tax relief at the 85 percent rate) while revenues (less direct gas utilization operating costs) are taxed at the general corporate income tax rate (currently 30 percent) under the Companies Income Tax Act. Royalty on gas is zero-rated effective 1997.
A.4.2 A detailed description of each element of the fiscal regime follows. The section then concludes with a summary of the fiscal regime which includes (a) a schematic representation and (b) worked-out examples of the MOU regime for JVs and the royalty/tax regime for indigenous operators together with a summary of the main fiscal assumptions used. Further analysis of the fiscal regime and worldwide fiscal ratings and rankings are provided in the PEPS (Petroleum economics and policy solutions) Fiscal Analysis modules.
Gas Incentives
A.4.3 Incentives for utilization of associated gas were introduced in 1998 and further clarified in 1999. They enable the producer to obtain tax allowances under the Petroleum Profits Tax Act for facilities upstream of the delivery point built for purposes of supplying associated gas. In addition producers can offset gas-related operating costs against gas income for purposes of the Companies Income Tax Act. That act was amended, effective January 1997, to provide for a three-year tax holiday and accelerated allowances for companies engaged in marketing and distributing gas.
Associated Gas Producer
Associated Gas Utilization
1969 PA Schedule 1 Sec 34; 1969 PR Sec 42
A.4.4 When first introduced in 1969 the Petroleum Act made no special provision for gas other than to specify that the Minister could grant petroleum rights subject to special provisions relating to the discovery of gas. However, the regulations

Taxation and State Participation in Nigeria
74
specified that at least five years after the startup of oil production from any lease, the lessee must submit any proposals it may have for the utilization of any associated gas.
A.4.5 In 1973 the Petroleum Act was amended to specify that terms for gas shall include:
12. The right of the state to take associated gas free of charge at the flare or at an agreed cost without payment of royalty
13. The obligation of the lessee to obtain approval of the government for the price of any gas sold
14. An obligation to pay royalty on gas sold.
A.4.6 The legislation does not expressly allow the lessee to use gas in operations, including reinjection. In 1979 the government introduced the Associated Gas Reinjection Act to address the associated gas utilization. It required all companies to submit, by April 1, 1980, preliminary plans for viable associated gas utilization in industrial projects and for reinjection of associated gas not utilized in an industrial project, with detailed plans to follow by October 1, 1980. Any gas flaring after January 1, 1984, would require a flaring permit from the Minister. Flaring without permission or in breach of any conditions set in the flaring permit would result in revocation of the lease.
A.4.7 In the event, gas flaring could not be reduced to a significant extent (although the original deadline date was shifted back to January 1, 1985) and the act was amended in 1985 to introduce gas flaring penalties paid per standard cubic foot flared.
A.4.8 In 1990 a natural gas pricing policy was introduced establishing special prices for domestic gas utilization, depending on the category of user. The prices were N4.00/MCF for deliveries to the National Electric Power Authority, N3.00/MCF for nominated strategic industries and N5.24/MCF in all other cases. The price to strategic industries was to have been reviewed every two years, with a view to removing the implied subsidy within five years.
State Participation
A.4.9 NNPC takes 58 percent interest and fully pays its share of all costs.
Royalty
A.4.10 There is no royalty.
Income Tax
A.4.11 Revenue from gas sales less transportation costs is taxable at the prevailing general income tax rate of 30 percent. In addition a tax holiday sets the tax rate to zero for the first five years of production.
A.4.12 Capital costs incurred in the development of associated gas reserves are included in the oil capital allowances, plus an uplift of 15 percent of depreciated capital expenditure, for the purposes of the MOU calculation.

Annex 4: Summary of Gas Terms 75
Nonassociated Gas Producer
Nonassociated Gas Utilization
1969 PA Schedule 1 Sec 34
A.4.13 When first introduced in 1969 the Petroleum Act made no special provision for gas other than to specify that the Minister could grant petroleum rights subject to special provisions relating to the discovery of gas.
A.4.14 In 1973 the Petroleum Act was amended to specify that terms for gas shall include the obligation of the licensee or lessee to obtain the approval of the government for the price of any gas sold and an obligation to pay royalty on gas sold.
State Participation
A.4.15 NNPC takes 58 percent interest and fully pays its share of all costs.
Royalty
A.4.16 There is no royalty.
Income Tax
A.4.17 Income tax is calculated as 30 percent of gross revenue less royalty, operating costs, intangible development costs, depreciation of tangible development costs over five years on a straight- line basis (with 1 percent undepreciated), plus an investment tax credit equal to 15 percent of depreciated capital expenditure.
A.4.18 In addition a tax holiday sets the tax rate to zero for the first five years of production.
Note: Gas production serving the Nigeria Liquefied Natural Gas (NLNG) project is taxed at 45 percent but receives accelerated depreciation (at 33 percent per year over three years) and an investment tax credit of 10 percent. However, this has not been modeled,.


77
Annex 5 Details of the Analysis
Analysis of the 1991 MOU
Figure A.5.1: Sensitivity on Rate of Return
Small Oil Field – MOU 1991
Sensitivity on Rate of ReturnSmall Oil Field - MOU 1991
-
5
10
15
20
25
30
35
40
-100% -80% -60% -40% -20% 0% 20% 40% 60% 80% 100%
Total ProductionOil Price
Total Operating Expenses
Total Capital Expenditure
Figure A.5.2: Sensitivity on Rate of Return
Medium Oil Field – MOU 1991
Sensitivity on Rate of ReturnMedium Oil Field - MOU 1991
-
10
20
30
40
50
60
-100% -80% -60% -40% -20% 0% 20% 40% 60% 80% 100%
Total ProductionOil Price
Total Operating Expenses
Total Capital Expenditure

Taxation and State Participation in Nigeria
78
Figure A.5.4: Sensitivity on Rate of Return
Onshore Oil Field – MOU 1991
Sensitivity on Rate of ReturnOnshore Oil Field - MOU 1991
-10
203040
5060
708090
-100% -80% -60% -40% -20% 0% 20% 40% 60% 80% 100%
Total ProductionOil Price
Total Operating Expenses
Total Capital Expenditure
Analysis of the “New” MOUs
Figure A.5.5: Sensitivity on Rate of Return
Small Oil Field – MOU “new”
Sensitivity on Rate of ReturnSmall Oil Field - MOU " new"
-
510
1520
2530
3540
45
-100% -80% -60% -40% -20% 0% 20% 40% 60% 80% 100%
Total ProductionOil Price
Total Operating Expenses
Total Capital Expenditure
Figure A.5.3: Sensitivity on Rate of Return
Large Oil Field MOU 1991
Sensitivity on Rate of ReturnLarge Oil Field MOU 1991
-
10
20
30
40
50
60
-100% -80% -60% -40% -20% 0% 20% 40% 60% 80% 100%
Total ProductionOil Price
Total Operating Expenses
Total Capital Expenditure

Annex 5: Details of the Analysis 79
Figure A.5.8: Sensitivity on Rate of Return
Onshore Oil Field MOU “new”
Sensitivity on Rate of ReturnOnshore Oil Field MOU "new"
-102030405060708090
100
-100% -80% -60% -40% -20% 0% 20% 40% 60% 80% 100%
Total ProductionOil Price
Total Operating Expenses
Total Capital Expenditure
Figure A.5.6: Sensitivity on Rate of Return
Medium Oil Field – MOU “new”
Sensitivity on Rate of ReturnMedium Oil Field - MOU "new"
-
10
20
30
40
50
60
-100% -80% -60% -40% -20% 0% 20% 40% 60% 80% 100%
Total ProductionOil Price
Total Operating Expenses
Total Capital Expenditure
Figure A.5.7: Sensitivity on Rate of Return
Large Oil Field – MOU “new”
Sensitivity on Rate of ReturnLarge Oil Field - MOU "new"
-
10
20
30
40
50
60
-100% -80% -60% -40% -20% 0% 20% 40% 60% 80% 100%
Total ProductionOil Price
Total Operating Expenses
Total Capital Expenditure

Taxation and State Participation in Nigeria
80
Analysis of the PSC
Figure A.5.9: Sensitivity on Rate of Return
Small Oil Field – PSC
Sensitivity on Rate of ReturnSmall Oil Field - PSC
-
5
10
15
20
25
30
-100% -80% -60% -40% -20% 0% 20% 40% 60% 80% 100%
Total Production
Oil Price
Total Operating ExpensesTotal Capital Expenditure
Figure A.5.10: Sensitivity on Rate of Return
Medium Oil Field – PSC
Sensitivity on Rate of ReturnMedium Oil Field - PSC
-
10
20
30
40
50
60
-100% -80% -60% -40% -20% 0% 20% 40% 60% 80% 100%
Total ProductionOil Price
Total Operating Expenses
Total Capital Expenditure
Figure A.5.11: Sensitivity on Rate of Return
Large Oil Field – PSC
Sensitivity on Rate of ReturnLarge Oil Field - PSC
-
5
10
15
20
25
30
35
40
-100% -80% -60% -40% -20% 0% 20% 40% 60% 80% 100%
Total Production
Oil Price
Total Operating Expenses
Total Capital Expenditure

Annex 5: Details of the Analysis 81
Table A.5.1: Impact of the ITA and the RAB on Project Economics
w/o ITC w. ITC and w/o RAB w. RAB
IRR (%) Govt. Take IRR (%) Govt. Take IRR (%) Govt. Take
Small 11 2.31 14 2.15 15 2.09
Medium 18 2.97 23 2.87 24 2.81
Large 18 2.32 23 2.25 24 2.20 Onshore 30 4.04 32 4.00 33 3.93
The Central Column shows the base case:
• ITC taken into account
• No RAB as this analysis was done on a project per project basis.
Figure A.5.12: Sensitivity on Rate of Return
Deep Offshore Oil Field – PSC
Sensitivity on Rate of ReturnDeep Offshore Oil Field - PSC
-
10
20
30
40
50
60
-100% -80% -60% -40% -20% 0% 20% 40% 60% 80% 100%
Total ProductionOil Price
Total Operating Expenses
Total Capital Expenditure


83
Annex 6 New Approaches to Profit Sharing
in Developing Countries
Reproduced from the original article which appeared in the Oil & Gas Journal, June 25, 1984, with permission from the Oil & Gas Journal.
Charles P. McPherson8 Amoco Europe & West Africa Inc. London
Keith Palmer World Bank Washington, D.C.
A.6.1 Over the past 3–4 years the World Bank's oil and gas program has focused heavily on the promotion of increased private industry investment in petroleum exploration in developing countries.
A.6.2 To date the Bank has financed some 30 exploration promotion projects in as many countries. Exploration promotion projects are typically low cost, provide qualified consultant assistance to the host country in one or more of the following areas: the preparation of a promotion data package; technical support and training for the national petroleum entity; advice on contractual terms and conditions; and finally, assistance in the negotiation of exploration and production contracts with the international industry.
A.6.3 This article draws heavily on the authors' experience in implementing the contractual advice component.
A.6.4 Inevitably, as exploration promotion projects are prepared, host government attention has focused on the sensitive legal and contractual issues, and especially on arrangements for sharing the potential profits of exploration and production with oil company investors. Not surprisingly, oil companies have shared this concern.
A.6.5 Extended dialogue with both government and industry in individual country situations has persuaded us that one particular profit-sharing system has a great deal of promise and clear advantages over alternative systems in terms of reconciling host country and investor interests and stabilizing both initial country-company negotiations and subsequent contractual relations.
8 The views expressed in this article are those of the authors and do not necessarily reflect the views of their employers.

Taxation and State Participation in Nigeria
84
A.6.6 This particular system, which might be loosely referred to as rate-of-return or ROR-based profit sharing is now in place in at least 11 developing countries and under consideration in half-a-dozen others.9 More than 20 contracts have been signed under the ROR-based system, involving some 15 different international companies. Ten ROR-based contracts are currently in an advanced state of negotiation and when signed will bring the number of companies exposed to the new system to between 20 and 25.
A.6.7 Against this background a summary of the main elements of the system and a review of its perceived benefits and drawbacks seems timely. ROR-based profit sharing derives from two basic premises:
15. First, host governments, for a variety of reasons, will seek to increase their share of profits from a project in situations of exceptional project profitability.
16. Second, high rates of governments take (total government profit share from royalties, taxes, production shares, and so forth) cannot be applied in situations of high risk, high cost, or modest geological potential.
A.6.8 Industry has largely accepted the principle of an elevated government take for exceptionally profitable fields, whether this higher take is negotiated at the outset or is the subject of later discussions with government. It is certainly not accidental that the only countries without provisions for an elevated rate of take are those where commercial production has yet to be established. At the same time, most governments have come to realize the necessity of moderate fiscal terms for a broad range of less profitable prospects. This is especially true in many oil- importing developing countries where the most likely find is characterized by high risk, small reserves, and high per barrel cost. Countries failing to provide incentive terms in such circumstances have experienced rapid falloffs in industry exploration and development interest.
A.6.9 To reconcile these two premises or principles, fiscal systems applicable to petroleum must be flexible. The line labeled AA in Figure A.6.1(A) illustrates this desired flexibility: Government take is tailored to the underlying profitability of each project, increasing from low levels for projects of marginal profitability to high levels for projects of high profitability. The precise level of AA would no doubt vary from country to country, basin to basin, and so forth, but might reasonably be expected to fall inside a range of 45-55 percent at the low end and 75-85 percent at the higher end.
A.6.10 BB in Figure A.6.1(A) represents the kind of fiscal system that few countries can afford but that a surprisingly large number of countries have adopted. It fixes government take at unrealistically high levels and shows little sensitivity to underlying project profitability. Figure A.6.1(B) illustrates the influence of the fiscal systems described by AA and BB (Figure A.6.1[A]) on the behavior of an oil company contractor's rate of return and on the range of commercially viable projects.
9 The World Bank has sponsored exploration promotion projects in 8 of the 11 countries: Madagascar, Equatorial Guinea, Liberia, Kenya, Guinea-Bissau, Somalia, Senegal, and Pakistan. Tanzania, Mozambique, and Papua New Guinea also have adopted an ROR-based system. See Table 4 for more detail. It should be noted that while this article is based primarily on developing country experience, ROR-based profit sharing lids have been seriously recommended or considered in developed countries as well, e.g, in both the United Kingdom and Norway. Legislation of ROR-based profit sharing is pending in Australia and is one of several optional leasing mechanisms recommended in the U.S. OCS Lands Act Amendments of 1980.

Annex 6: New Approaches to Profit Sharing in Developing Countries 85
Figure A.6.1: Schematic Representation of Fiscal Flexibility
AA represents a flexible fiscal system: government take increases gradually as project profitability increases. .Shaded zone indicates range of reasonable locations for AA. BB represents an inflexible system: government take is high and either does not vary with underlying project profitability or varies in the wrong direction, decreasing as profitability increases.
AA represents the impact on contractor real rate of return of a flexible fiscal system. Shaded zone shows range of possible locations of AA depending on actual fiscal parameters applied. Contractor ROR increases continuously as project ROR increases but at a slower rate. Contractor views all projects with underlying profitability greater than X as commercially viable, since they allow him an ROR in excess of the minimum he requires. BB illustrates the impact of a rigid fiscal system applied at a high rate of government take. Contractor will undertake only those projects with underlying profitability in excess of Y.
A.6.11 Under fiscal flexibility (AA), low rates of government take assure the commercial viability of modestly profitable projects while an escalating government take moderates the rate of increase in the contractor's return as underlying project profitability increases. A high rate of take inflexible fiscal system (BB) dramatically reduces the range of commercially viable projects and does little to moderate the behavior of contractor return for those few projects which pass the commerciality test.
Ad Hoc Approaches to Fiscal Flexibility
A.6.12 The concept of fiscal flexibility is hardly a new one. Over the past 10 years policy makers in the petroleum sector have been preoccupied by the pursuit of fiscal flexibility.
A.6.13 Following the dramatic runup in world petroleum prices in 1973-74, many host governments sought to limit increases in industry profits. Simultaneously, or soon thereafter, a number of them recognized the parallel need to protect the economics of marginal or less profitable projects.

Taxation and State Participation in Nigeria
86
A.6.14 While the principle of flexibility may be widely accepted, the most appropriate formula for its implementation has yet to be agreed. Table A.6.1 provides a sampling of the wide variety of approaches to fiscal flexibility introduced over the past decade in developed and developing countries.
Table A.6.1: Sample Approaches to Fiscal-Flexibility*
Country Limit on 'upside' profit potential Protection of investment incentives Angola • Government "take" increases with
cumulative production. • 100% price cap (excise tax) on real
oil price increases.
• 25% per year write-off of most expenditure.
• 33?% "cost uplift" for development expenditures.
Indonesia • Government "take" 85% of profit oil.
• Domestic market supply obligation at US$50.20/bbl.
• 50 % exploration carried interest some contracts
• Double declining balance depreciation, intangibles expensed for cost oil and taxes.
• 20% "cost uplift" for capital costs for production sharing purposes
• New production has 5 year exemption from domestic market subsidy.
Malaysia • Royalty, government profit oil, price cap. Export tax and income tax give very high top marginal government "take."
• Not many, • 20-25% write off of expenditures as cost
oil. • Reduced state production shares for less
prospective areas. Norway • Sliding royalty 8–16% increasing
with daily production. • 85% combined corporate and
Special Petroleum taxes. • 50-80% sliding scale exploration
carried interest.
• Depreciation 6 years straight line • Annual "cost uplift" against Special Tax
equal to 6? % of capital costs incurred over preceding 15 years
Peru • Government 50% share of gross production.
• 68.5% tax on corporate income.
• Reduced sliding scale government share of gross production in new high cost areas.
• 30% investment tax "credit" against income tax.
United Kingdom
• Combined royalty, Petroleum Revenue Tax, and Corporation Tax give 85-90% top marginal rate.
• Immediate write-off of most expenditures for PRT and CT.
• 35% "cost uplift" for PRT. • Special "oil allowance" and "annual
limit" on PRT to protect marginal fields.
*The table is not intended as a complete description of country fiscal terms. It highlights selected instruments used to capture "excess profits" and to preserve incentives for marginal investment. Terms described are as of the date of writing, June 1984.
A.6.15 Until very recently, fiscal systems for petroleum almost without exception strove to adjust government take to profitability on the basis of an anticipated relationship between project profitability and some proxy (or combination of proxies) for that profitability. Table A.6.1 contains a number of popular provisions, among them:

Annex 6: New Approaches to Profit Sharing in Developing Countries 87
17. Royalty rates and government production shares which adjust as a function of cumulative or daily production, reflecting an expected link between field size and project profitability
18. Price caps and profits taxes levied on revenues in excess of some base price in anticipation of a predictable relationship between price and profitability.
19. Cost recovery "uplifts" (that is, allowable deductions of some multiple of costs incurred) and rapid write-offs of capital costs, designed to defer the timing of high rates of government take until certain levels of profitability have been attained, on the presumption of a close correlation between profitability and the scale and timing of cost recovery.
20. Variations in rates of government take depending on such factors as the location of exploration or production (frontier versus "oil patch"; deepwater versus shelf, offshore versus onshore, and so forth); the "vintage" of production (old versus new), or the nature of production (gas versus oil), on the expectation of links between these indicators and project profitability.
A.6.16 Unfortunately, almost all of these systems have experienced problems—problems related to a perceived imbalance in government/company take once a discovery is made or production has been established. Either government take is regarded (by the government) as insufficient, leading to adjustments in tax rates, the introduction of additional charges, or the initiation (sometimes unilaterally) of contract renegotiation. Or, government take turns out to be too great, resulting in restricted exploration programs, the cancellation of development projects or the early discontinuation of production (no new investment in work-overs, secondary recovery, incremental field development, and so forth).
A.6.17 The root of the difficulties experienced under the various profit sharing schemes summarized in Table A.6.1 is their dependence, as already indicated, first on anticipated relationships between proxies for profitability and actual profitability and, second, on the use of proxies for rather than actually measured profitability.
A.6.18 Anticipations are inaccurate more often than not, especially in the oil business, and proxies by definition are not precise indicators; in fact, some of those commonly used in the construction of fiscal systems for petroleum may be highly inaccurate. Table A.6.2 illustrates the potential for problems. Project profitability is determined by many different factors: reserve size, production profiles, prices, costs, the timing of cash inflows and outflows, and the cost of capital. As the matrix in Table A.6.2 points out, these factors are only partially or imperfectly reflected in popular proxies for profitability. For example:
21. Levels of cumulative or daily production are unreliable indicators of profitability, because they ignore the influence on profit of changing prices and varying cost conditions;
22. Price caps and taxes keyed to the behavior of base prices are not sensitive to reserves or production. And, while they may reflect general industry cost conditions through linkage

Taxation and State Participation in Nigeria
88
to industry cost indexes, they are not sensitive to the impact on profitability of project specific variations in cost;
23. The recovery of investment costs or some multiple thereof may vary considerably in its implications for profitability depending crucially on the precise time profile of investment outlays and cash inflows and on the cost of obtaining investment capital; and
24. Finally, the physical location of operations, production vintages, and the distinctions between gas and oil, have never been put forward as anything but very imperfect measures of expected profitability.
Table A.6.2: Responsiveness of Fiscal Provisions to Determinants of Project Profitability
Government "take" responsive to:
Government "take" linked to Reserves/
production Oil price change Costs
Timing of cash flows
Cost of capital
Production (daily or cumulative) Yes No No Partly No
Price (price caps or base prices) No Yes No Partly No
Revenue (price and production) Yes Yes No Partly No
Cost recovery (uplifts and write-off rates) No No Yes Partly Partly
Simple indicators (location, vintage, and so forth) Partly Partly Partly No No
Rate of return Yes Yes Yes Yes Yes
A.6.19 Where fiscal systems depend on the use of proxies of this type, it is almost certain that at one time or another one side of the contractual relationship, government or company, is going to be seriously disappointed, creating pressures for contract renegotiation and inhibiting desirable exploration/production programs.
A.6.20 This expectation of future problems also will complicate and prolong initial contract negotiations as each party strives to protect its interests against an imperfect knowledge of how things will turn out.
A.6.21 To date the response to these real or anticipated problems has tended to be ad hoc or piecemeal. In some countries, laws or contracts provide for “fiscal reopeners" on a discretionary or on a mutually agreeable basis to "retune" terms to new conditions. In practice, however, these provisions are rarely used. Industry has strongly resisted open-ended discretionary rights for government because of fears, based on experience, that such rights will be used only to tighten terms to the government's benefit.
A.6.22 And governments have been reluctant to relax terms on a discretionary basis out of concern (a) that data used to demonstrate the need for relief may not

Annex 6: New Approaches to Profit Sharing in Developing Countries 89
accurately reflect reality (that is, the government may grant relief unnecessarily) and (b) that one case of discretionary relief will attract an unreasonable number of applications for relief in less appropriate circumstances, placing an impossible burden on government administrators. More typically governments and companies have sought solutions to fiscal difficulties in the “refinement” of existing automatic or nondiscretionary systems of profit sharing: changing rates of taxation or write-off, adding or subtracting fiscal provisions, and so forth.
A.6.23 So far this approach seems only to have added to the complexity of profit sharing without achieving significant improvements in performance. In fact, our own analyses, as well as those of others,10 seem to suggest that, good intentions notwithstanding, government take in many countries remains poorly tuned to profitability over any significant range of projects or any extended period of time. It is precisely this kind of experience which has led to an interest in ROR-based profit sharing. We now turn to a description of some of the details of its construction and operation.
ROR-Based Profit Sharing
A.6.24 Under ROR-based profit sharing, government take is adjusted as a function of the oil company contractor's discounted cash flow (DCF) rate of return, as actually experienced, that is, as a function of profitability as it is conventionally measured for investment decision purposes and not as a function of a proxy for profitability, and as a function of actually achieved rather than estimated or anticipated profitability.
A.6.25 Not surprisingly, government take under ROR-based systems is responsive to all of the determinants of profitability shown in Table A.6.2.
A.6.26 Typically ROR-based profit sharing builds on an existing fiscal system of long standing or of general application, for example, a general corporate income tax and a modest royalty. 11 Government take under these levies might fall in the 45-55 percent range. No additional charges are levied until the oil company contractor has received sufficient revenue to recover his investment and an agreed predetermined ROR on his investment. This ROR is either established in legislation or, more commonly, negotiated and agreed in a petroleum contract before exploration and production expenditures begin. Once the initial ROR threshold has been reached, additional payments begin and government take may escalate incrementally in one or more steps as additional ROR thresholds are achieved.
A.6.27 The initial threshold ROR should be set to approximate the minimum risk adjusted rate of return required by investors to justify proceeding with the project at hand. Of course, the minimum required ROR will vary between companies and projects and will not usually be known by government policy makers. In practice, however, this has not turned out to be a critical problem, for several reasons.
10 For example, "Comparative Petroleum Taxation" by A.G. Kemp and David Rose, Petroleum Economist, February 1983. 11 Royalties run directly counter to the spirit of fiscal flexibility. Insensitive to profitability, they place a greater burden on marginal projects than on profitable projects, For this reason royalties should be kept low, although some royalty may be desirable to assure the government early revenues.

Taxation and State Participation in Nigeria
90
A.6.28 First, industry sources have, with increasing frequency, publicly quoted their minimum required returns for exploration investment. These are typically in the 15-20 percent range in real terms, that is, after correction for inflation. The same percentage range has been adopted as the initial threshold for additional profit sharing in those countries which have introduced ROR-based profit sharing.
A.6.29 Second, most countries with ROR-based fiscal systems have allowed for possible differences of opinion over the minimum required ROR by establishing several thresholds ranging from 15 to 20 percent up to 25 to 35 percent and have either invited bids or negotiated on the rates of additional profit sharing associated with each threshold. In this way, errors by the government in setting threshold RORs can be compensated; if the thresholds are set too low, then the rates of profit sharing agreeable to the investor will be correspondingly lower and the reverse where the thresholds are set too high.
A.6.30 As already indicated, the threshold RORs should be established in real terms to avoid erosion of real profitability in the event of rapid inflation. Adherence to this principle is achieved in practice in either of two ways. The simplest approach involves adding the annual rate of increase in a reliable inflation index, for example, the U.S. Consumer Price Index, to the established real ROR threshold. For example, if the real threshold rate is 15 percent and annual inflation has been consistent at 10 percent, then no additional profit sharing will take place until the investor has recouped a 25 percent DCF return on cash outlays in money-of-the-day. 12 An alternative approach involves adding the interest rate on a defined risk less investment (for example, the AAA corporate bond yield) to the agreed threshold ROR. The adjusted threshold will compensate for inflation since such interest rates incorporate investor estimates of future inflation. 13
A.6.31 Calculation of the investor's ROR for purposes of determining whether a given threshold has been attained is straightforward. It is no more complicated than keeping track of a simple savings account. Expenditures or cash outlays by the investor are debited against the account in the year incurred. Negative balances in the account accumulate compound interest annually at the agreed threshold ROR, adjusted as described above for the applicable inflation rate in that year. Cash outlays debited against the account include all payments to the government (income tax, royalty, and so forth) other than the government profit share which is being computed and interest payments on debt incurred. Interest payments are excluded from cash outlays to avoid double counting since the compounding of negative balances in the account effectively permits recovery of interest costs at the threshold ROR on all investor outlays (not just debt). When cash inflows are received they are credited to the account. When cumulative net cash flow has reached a sufficient level to reduce the negative balance in the account to zero, additional profit sharing begins. At that time the investor will have recovered his entire investment
12 Strictly speaking, the product of the agreed threshold ROR and the rate of inflation should be added to the agreed threshold to reflect the impact of inflation on interest itself. Thus, the adjusted ROR in the example should be 26.5 percent rather than 25 percent. If the inflation index is a dollar index, all cash flows would be computed in the same currency. 13 The riskless interest rate also incorporates a small real return, on the order of 2–3 percent. Where this mechanism of adjustment is adopted, the agreed real threshold ROR may be correspondingly lower reflecting only the investors required "risk premium."

Annex 6: New Approaches to Profit Sharing in Developing Countries 91
with interest at the threshold rate, that is, he will have reached a DCF rate of return equal to the threshold rate. Positive net cash flows beyond that point are subjected to sharing at a predetermined sharing rate. However, if the account subsequently becomes negative as a consequence of additional investments in, for example, workovers, secondary recovery, or the development of satellite fields, additional profit sharing is suspended until new investments have been recovered with interest at the threshold rate in the same manner as original investments were recovered. Where more than one threshold is involved, that is, where there is more than one tier of additional profit sharing, the calculations required to determine the moment at which the additional profit sharing accounts become positive are identical to those used with respect to the first sharing account except that: (a) interest accumulates at the higher threshold rates associated with each additional account, and (b) government profit shares paid with respect to earlier accounts are included as cash outlays in calculating the balance in any additional account.
A.6.32 An example of the computation of ROR-based profit shares is given in Table A.6.3. In this example, additional profit sharing does not begin until the investor has recouped a 15 percent after tax and royalty real DCF rate of return on total outlays. Thereafter, a 40 percent government profit share is applied to net cash flow increasing government take to 70 percent from an assumed initial tax and royalty level of 50 percent.14 The example assumes a second tier of additional profit sharing. Computation procedures for the second tier are analogous to those used for the first tier. When the investor has realized a 25 percent real return, a 33? percent government profit share is applied to net cash flow minus the first profit share. Total government take increases to 80 percent.
A.6.33 Additional investments in Year 11 of the example send cash flow negative in that year and both tiers of additional profit sharing are suspended until late in Year 12 when the incremental investment plus interest at the indicated threshold rates has been recovered from that year's positive cash flow. The average government take over the field life in this example is 65 percent, well below the top marginal rate of 80 percent. One significant policy question to be resolved with respect to ROR threshold calculation procedures relates to whether to include in such calculations costs and revenues beyond those directly attributable to the field or project in hand. ROR-based profit sharing should in principle be levied on a field by field basis, adjusting government take to levels, appropriate to the needs of the individual field without reference to developments elsewhere in the contract area, or indeed the country.
14 Fifty percent tax and royalty plus 40 percent of the remaining 50 percent or 20 percent equals 70 percent. Although properly levied on after-tax cash flow, additional payments under ROR-based systems have in a number of countries then been grossed up and converted to deductible pretax charges in order to comply with the U.S. Internal Revenue Service regulations on creditable foreign taxes. With the finalization of the 1983 proposed regulations this will no longer be necessary.

Taxation and State Participation in Nigeria
92
A.6.34 In practice, however, the administrative burden imposed by field by field profit sharing (cost allocation rules, and so forth). may prove unrealistic, especially in developing countries. Hence, in most countries where ROR-based profit sha ring has been adopted, it has been applied on a countrywide, or at least contract-area, basis. Consolidation of calculations in this way permits immediate expensing of all subsequent exploration and development expenditures within the country or contract area against the profit sharing base of the first field on production. Immediate expensing of abortive exploration expenditures through consolidation represents a potentially very favorable fiscal benefit.
A.6.35 Governments may seek to recoup it in either lower threshold rates of return or higher rates of government profit sharing. Alternatively, they may be content to leave these investor benefits uncorrected to the extent that they wish to provide a powerful incentive to a continued exploration effort.15 In contrast to the situation with exploration expenditures, the ability to consolidate development expenditures for ROR-based profit sharing calculations may have an uncertain impact on investor incentives. The earlier recovery of development cost made possible by consolidation is a plus and can be expected to increase the investor's rate of return from the project; however, depending on a variety of factors consolidation of development expenditures may sharply
15 It should be noted, however, that there may be other ways to achieve the same effect which will benefit newcomers as well as established producing companies.
Table A.6.3: Illustrative Computation of Two-Tier Rate-of-Return Profit Sharing
Year 1 2 3 4 5 6 7 8 9 10 11 12 13 14 15
(1) Receipts — — 50 200 200 200 200 200 200 200 200 200 200 200 200
(2) Payments 50 200 100 40 40 40 40 40 40 40 250 40 40 40 40
(3) Net cash flow (NCF) -50 -200 -50 160 160 160 160 160 160 160 -50 160 160 160 160(4) Accumulaated value of NCF (15% interest) -50 -257.5 -346.1 -238.0 -113.7 29.2 160 160 160 160 -50 102.5 160 160 160(5) Govt.profit share on returns over 15% threshold ROR at 40% rate — — — — — 11.7 64 64 64 64 — 41 64 64 64
(6) Adjusted NCF -50 -200 -50 160 160 148.3 96 96 96 96 -50 119 96 96 96(7) Accumulated value of NCF (25% interest) -50 -262.5 -378.1 -312.6 -230.8 -140.2 -79.3 -3.1 92.1 96 -50 56.5 96 96 96(8) Govt. profit share on returns over 25% threshold ROR at 33.3% rate — — — — — — — — 30.7 32 — 18.8 32 32 32
(9) Total govt. profit share — — — — — 11.7 64 64 94.7 96 — 59.8 96 96 96(10) Total govt. profit share at % of NCF — — 0 0 0 7 40 40 59 60 0 37 60 60 60(11) Total govt. "take" as % of NCF — — 50 50 50 53.5 70 70 79.5 80 50 68.5 80 80 80(1) - (2) (4). Accumulated value of NCF = NCF (1.15) + NCF. When accumulated value NCF is positive. NCF is zero for calculation of accumulated Value NCF. (5) Government profit share = 40% of (4) when accumulated value is positive. (6) Adjusted NCF = (3) - (5). (7) Same as (4) except accumulated of 25% and applied to adjusted NCF. (8) Government. profit share = 33?% of (7) when accumulated value is positive. (9) Total government. profit share = (5) + (8). Note 40% plus 33? % of 60 left over gives total rate of 60%. (11) Total take of 60% (11) Total take assumes royalty and income tax equal 50% of positive net cash flow.

Annex 6: New Approaches to Profit Sharing in Developing Countries 93
reduce the discounted cash flow or present value of the incremental project and limit investor interest correspondingly.16
A.6.36 ROR-based profit sharing can be implemented with identical financial consequences under any of the main contract types: tax and royalty concession agreements, production sharing, service contract, or participation agreements. Countries where ROR-based profit sharing has been adopted and the nature of the contractual framework or style applied are indicated in Table A.6.4.
A.6.37 In the concession arrangement ROR-based profit sharing is structured as an additional profits tax (for example, Papua New Guinea, Madagascar, and Guinea Bissau); in production sharing contracts it determines the government production share (Equatorial Guinea and Liberia); in service contracts, the contractor's remuneration fee; and in participation agreements it is structured as an additional nonvoting, noncontributing financial participation by the government (Kenya and Pakistan).
A.6.38 Whatever the contractual context of ROR-based profit sharing, the key element is that additional sharing is linked directly to the oil company contractor's actually achieved DCF return on investment.
16 See discussion of rate of return vs, present value emphasis of ROR-based profit sharing under criticisms of ROR-based Profit Sharing, Table A.6.4.

Taxation and State Participation in Nigeria
94
Table A.6.4: Countries Where ROR-based Profit Sharing Is Used17
Country Contractual style ROR content Status Equatorial Guinea
Production Sharing Contract
• Three tier sharing linked to pretax threshold ROR from 30% to 50%.
• Sharing rates negotiated • Combined with 10% royalty and 45%
income tax.
• Four contracts signed. • Eight companies.
Guinea-Bissau Supplementary Profits T ax
• Three tier tax linked to threshold real RORs of 15%, 20%, and 25%
• Sharing rates negotiated. • Combined with royal and income tax.
• Contracts signed on two offshore blocks
• Four companies.
Kenya Additional Non-contributing. Participation
• Two tier increments in non-contributing participation linked to threshold real ROR.
• Level of participation negotiated. • Combined with royalty and income
tax.
• Two contracts pending. • Three companies.
Liberia Production Sharing Contract
• Three tier sharing linked to threshold real RORs of 15%, 20%, and 25%.
• Sharing rates negotiated. • Combined with 12.5% royalty and
45% income tax.
• Contracts on two offshore blocks signed.
• One company
Madagascar Supplementary Profits Tax
• Three tier tax on net cash flow with rates of tax (25%, 50%, 75%) and threshold RORS (15%, 20%; 25%) in tax law.
• Combined with sliding scale royalty, 10%to 20%, and 45% income tax.
• Four contracts signed in initial offerings.
• Four companies • Two contracts under negotiation
Pakistan Additional Non-contributing Participation
• Two tier increments in non-contributing participation linked to threshold real RORs of 20% and 30%.
• Level of participation negotiated. • Combined with royalty and income tax
limited to 55 % taxable income.
• Three contracts at advanced stage of negotiation.
Papua New Guinea
Additional Profits Tax .
• Levied at 50% rate on net cash flows after recovery of 27% threshold ROR in money-of-the-day.
• Combined with 1.25% royalty, 50% income tax.
• Introduced 1977 • More than 20 contracts signed.
Senegal Additional Non- contribution Participation
• Two tier increments in noncontributing participation linked to threshold real RORs.
• Thresholds and level of participation subject to negotiation .
• Open to industry for application.
Somalia Supplementary Profits Tax
• Three tier tax with rates of tax, and threshold RORs subject to negotiation.
• Combined with royalty and income tax
• Two contracts signed covering 9 blocks
• Two companies
Tanzania Additional Profits Tax added to Production sharing. `
• Two tier tax with negotiated rates and thresholds.
• Combined with conventional negotiated production sharing
• Two contracts signed • One contract in advanced stage of
negotiation • Three companies
17 Descriptions of terms at time of writing, June 1984.

Annex 6: New Approaches to Profit Sharing in Developing Countries 95
Advantages of ROR-Based Profit Sharing
A.6.39 Advantages of ROR-profit sharing are the opposite of the drawbacks of non-ROR-based systems.
A.6.40 Just as the drawbacks of non-ROR-based systems derive from their inability to accurately adjust government take to profitability, the advantages of the ROR-based system lies in the accuracy with which it automatically adjusts government take to all the determinants of profitability: prices, costs, the timing of receipts and outlays, and the cost of capital. Once potential investors and government have agreed on a reasonable behavior of government take over a range of project profitability outcomes, they can rest assured that government take will in practice behave in this way.
A.6.41 If actual profitability turns out to be very high or higher than expected for whatever reason (large fields, price increases, low unit costs, and so forth) then government take will begin to escalate earlier than expected and will represent a higher share of project profit over the project life, in accordance with a schedule of take and profitability agreed in advance. If the project turns out to be marginal or less profitable than expected, again for whatever reason, escalation of the government's profit share will be deferred and will represent a much lower share of project profit over the project life, in accordance with the agreed schedule. And, as indicated above, ROR-based systems are designed to extend this behavior through the full exploration/production cycle. Government take will adjust in the manner described not only to the profitability of initial investments in exploration and development, but also to the profitability of subsequent investments in production maintenance or production extension.
A.6.42 Figure A.6.2 illustrates graphically the essential difference between ROR-based profit sharing (dotted lines) and alternative systems, here represented by a classic production sharing arrangement (solid lines); where government take is linked to annual production rates.18 Percentage changes in price or cost and delays in production start-up will typically result in significantly greater corresponding percentage variations in the contractor's rate of return under production sharing than under ROR-based sharing because government take under production sharing is not sensitive to prices, costs, or the timing of cash flows.
A.6.43 It is this potential for profitability to move away quickly from expected levels whenever the environment changes that creates problems under non ROR-based systems. The greater accuracy of ROR-based profit sharing in maintaining expected relationships between government take and profitability can be expected to:
25. Encourage contract stability
26. Accelerate and facilitate initial contract negotiations
18 Figure A.6.2 is a schematic summary of a large number of actual contract comparisons; it does not correspond precisely to any one of those comparisons but accurately represents the results obtained.

Taxation and State Participation in Nigeria
96
27. Promote more effective exploration development and production operations by assuring that marginal fields and incremental investments in prolonging project life or in extending the area of development are adequately sheltered from high rates of take.
A.6.44 One final advantage of ROR-based profit sharing derives from its emphasis on the contractor's early recovery of his minimum required return. This attribute is not unique to ROR-based profit sharing but it is a highly prized investment incentive among oil company investors and their bankers.
Criticisms of ROR-Based Profit Sharing
A.6.45 While there are signs of an increasing appreciation of the advantages of ROR-based profit sharing, our discussions with governments and industry have exposed certain criticisms and concerns about the system.
A.6.46 The most common criticism from industry is that ROR-based profit sharing amounts to utility type rate of return regulation which puts an unreasonable ceiling on upside profit potential. This criticism would be serious if it were valid, but, in our opinion, it is not. The appropriate response to this criticism runs along the following lines, which are partly repetitive of the description of ROR-based profit sharing given above:
28. While the contractor's rate of return is featured in ROR-based profit sharing, it appears as a floor or threshold rather than a ceiling. Escalation of government take does not begin until that threshold is crossed. Once the initial threshold has been crossed contractor profitability continues to increase with project profitability, albeit at a moderating rate.
29. The initial rate of return thresholds which trigger additional payments to government should be, and in practice have been, set at levels recognizing the risks of petroleum exploration and production, for example, 15–20 percent in real terms.
Figure 6.1.2: Contractor ROR Sensitivities
Dotted lines represent impact on Contractor ROR of changes in price and cost from base-case levels under ROR-based profit sharing. X shows impact of a one year's delay in production startup. Solid lines and point Y represent impact on Contractor ROR of same changes under classic production sharing.

Annex 6: New Approaches to Profit Sharing in Developing Countries 97
30. Rates of additional profit sharing are, in most of the recently introduced ROR-based systems, open to bidding or are negotiated with potential investors providing additional responsiveness to the investor's perceived requirements as to profitability.
A.6.47 In sum, the rate of return regulation criticism, if it is to be directed at any target, should be directed at fiscal flexibility in general, not at ROR-based profit sharing in particular. There is no reason, in principle or practice, why ROR-based profit sharing should not provide as much upside potential as any other system which provides for a positive correlation between government take and profitability.
A.6.48 A second criticism or concern relates to the emphasis under ROR-based profit sharing on rate of return over other profitability measures, especially over cash flow or discounted cash flow. Under ROR-based profit sharing the investor is provided with an early cash flow and a sheltered minimum rate of return in exchange for reductions in annual cash flow once the threshold rate of return has been achieved. As already noted, most investors prize an early return on their investment and are willing to trade subsequent cash flow to obtain it. Some investors, however, specifically those assigning a greater relative weight to cash flow in their investment decision, may be less enthusiastic than others. Under certain circumstances such investors may either:
31. Look for investment opportunities elsewhere, that is, in other nations, which while offering less in the form of rate of return, may promise more in the way of cash flow; or,
32. Seek to maintain cash flow under ROR-based profit sharing by maintaining expenditures at a level sufficient to avoid triggering additional profit sharing, a course of action now commonly referred to as "gold plating."
A.6.49 The likelihood of any investor seriously considering either of these options will be greater:
33. The lower the rate at which the investor discounts future cash flows;
34. The higher the government's share of additional profits; and
35. At least for gold plating, the higher the threshold rates of return which trigger additional profit sharing.
A.6.50 These potential difficulties or problems are not unique to ROR-based profit sharing. They exist in varying degrees in most alternatives to ROR-based profit sharing, and under ROR-based profit sharing can probably be kept at an acceptable level by (a) providing a reasonable range of additional profit sharing thresholds beginning at a level close to an average expected industry discount rate for exploration and development investments; (b) avoiding "excessive" marginal rates of government take (for example, greater than 85-90 percent); and (c) allowing room for expression of investor preferences through the negotiation of additional rates of profit sharing.
A.6.51 A third criticism of the system is that it is too complicated; too complicated to implement and too complicated to police. While the legal description of ROR profit sharing in tax legislation or in contracts may prove difficult to digest the first time around, actual implementation is extremely simple: required calculations are infrequent and, as noted earlier, are no different from those routinely performed by bank clerks in maintaining records on savings accounts, that is, entering deposits, calculating

Taxation and State Participation in Nigeria
98
interest earned and deducting withdrawals. Further, no new data are needed; all calculations are based on numbers routinely submitted by companies to the government as part of any corporate income tax exercise and regularly audited by the government or outside auditors. If ROR-based systems are regarded as too complicated, then an argument should be made for improving the accounting and auditing capabilities of the host country involved, not for a different profit sharing system.
Conclusions
A.6.52 ROR-based profit sharing is the logical conclusion of the ad hoc and often complex search for fiscal flexibility which has characterized the development of. petroleum laws and contracts over the 1970s.
A.6.53 Its accuracy in adjusting government take to project profitability in the manner agreed in advance by the contracting parties provides greater assurance that the objectives of fiscal flexibility will be met, facilitates contract negotiations, contributes to long run contract stability, and encourages the efficient conduct of exploration/production operations. The system seems to meet the objectives of both the government and the investor better than more familiar profit sharing alternatives. We believe that ROR-based profit sharing holds considerable promise for petroleum investments and operations in those developing countries which have recently adopted it.

99
Annex 7 Proposed Alternative Production Sharing
Contract Terms
Summary of Proposed Terms
Bonuses & Fees
Signature bonus of US$5 million.
State Participation
There is no state participation.
Royalty
The royalty is 10 percent.
Cost Recovery
Operating and E&A costs are expensed and recovered immediately while development costs are capitalized and recovered over five years on a straight- line basis.
Profit Sharing
Production remaining after cost recovery is shared between the state and the contractor on a sliding scale linked to the contractor's achieved rate of return as follows:
Table A.7.1: Profit Sharing
Contractor's Rate of Return Contractors Profit Share
< 20 70
20 – 25 50
25 – 30 40 > 30 20

Taxation and State Participation in Nigeria
100
Economic Analysis
Table A.7.2: Rate of Return
Project ERR* (%)
PSC Model (%)
Proposed PSC (%)
Small Offshore 32.3 13.0 21.0 Medium Offshore 49.6 22.0 29.6
Deep 39.3 27.0 21.2
Onshore 74.5 33.0 36.0
*ERR=Economic ate of return
Figure A.7.1: Project IRR Sensitivity (Medium Offshore)
Project Rate of Return
0 %
10%
20%
30%
40%
50%
60%
70%
80%
Small Offshore Medium Offshore Deep Onshore
ERR
PSC Model
Proposed PSC
Table A.7.3: Government Take
Project PSC Model (%)
Proposed PSC (%)
Small Offshore 99.0 72.0
Medium Offshore 82.0 71.9 Deep 62.0 85.3
Onshore 80.0 81.2

Annex 7: Proposed Alternative Production Sharing Contract Terms 101
Figure A.7.2: Government Take Sensitivity
(medium offshore)
10
20
30
40
-40% -30% -20% -10% 0% 10% 20% 30% 40%
Price
Tota l Operat ing Expenses
Total Capital Expenditure
Royalty: YesUplift/Ceil l ing: No
Project IRR Sensit iv i ty (Medium Offshore)
Income Tax
Income tax equals 50 percent of the contractor’s profit share.
Withholding Tax
None is assumed.
Ringfence
There is a ringfence around the contract area for recovery of E&A costs and around the field for recovery of development and production costs.