tax policy and environmental impact of fdi: empirical
TRANSCRIPT

TThhee EEccoonnoommiicc RReesseeaarrcchh GGuuaarrddiiaann –– VVooll.. 1111((11))22002211 SSeemmii--aannnnuuaall OOnnlliinnee JJoouurrnnaall,, wwwwww..eeccrrgg..rroo
IISSSSNN:: 22224477--88553311,, IISSSSNN--LL:: 22224477--88553311 Econ Res Guard 11(1): 144-155
Tax Policy and Environmental Impact of FDI: Empirical Evidence in Developing Countries
Muoi Mot Huynh Van Tra Vinh University, Tra Vinh, Vietnam E-mail: [email protected]
Trung Kien Tran University of Economics Ho Chi Minh City, Ho Chi Minh City, Vietnam E-mail: [email protected]
Abstract The paper empirically analyzes the role of tax policy in FDI-Environmental pollution nexus in developing countries from 2004 to 2016. In general, FDI has a significant effect to increase air pollution in these countries supporting the pollution haven hypothesis. Interestingly, the government plays a crucial role to adjust the environmental impacts of FDI. When the higher quality of institution helps to reduce air pollution, the tax policy has both the direct effect to reduce the level of environmental degradation and the indirect effect through mitigating the harmful environmental impact of FDI in this case.
Keywords: Environment Pollution, FDI, Tax policy, GMM, Developing countries
JEL classification: F21, F64, H20
Received: 3 February 2021; Received in revised form: 25 May 2021; Accepted: 25 May 2021
1. Introduction
Environmental pollution is becoming a major concern in many countries. However, factors affecting the level of environmental pollution are still unclear and controversial. In this study, we analyzes the role of tax policy in FDI-Environmental pollution nexus.
Although the environmental pollution is alarming, many developing countries focus on economic growth but ignore the environmental issues (Cole et al, 2006; Lan et al., 2012; Solarin et al., 2017; Welford, 1995, 2016; Zhang and Zhou, 2016). In order to promote growth and investment, these countries apply many policies to FDI’s attractiveness. However, as a part of t FDI’s attractiveness policies, some policies related to environmental protection are limited and inconsistent causing more serious pollution issues (Cole et al., 2006; Solarin et al., 2017).
Previous studies try to identify different factors affecting environmental pollution (Cole et al., 2006; Damania et al., 2003; Hill, 2010; Halkos and Paizanos, 2016; Ibrahim and Law, 2016; ; Lan et al., 2012; Victor, 2017; Wang et al., 2013; Wang and Chen, 2014). However, the direction, impact level as well as transmission channel of these factors are still unclear. Based on these
EEccoonn RReess GGuuaarrdd 114455 22002211
foundations, empirical studies explore the factors affecting the level of environmental pollution, but the results are still controversial, especially in developing countries (McGee, Clement, and Besek, 2015; Wang et al., 2011; York et al., 2003).
In this study, we re-examine the environmental impact of FDI. FDI is an important element of affluence and technology. While the majority of empirical studies have shown the positive effect of this factor on economic development, its impact on environmental pollution is inconsistent (Antweiler et al., 2001; Canh et al., 2018; Cole et al., 2006; Cole et al., 2017; Eskeland and Harrison, 2003; Grossman and Krueger, 1995, Wang et al., 2013, Zarsky, 1999). As Wang et al. (2013) and Canh et al. (2018) explain, the environmental impact of FDI is still controversial with two adverse hypotheses. On one hand, the pollution haven hypothesis implies that developing countries, which tend to attract more FDI inflows non-selectively, will gradually become "polluted paradise" of developed countries (Wheeler, 2001, Canh et al., 2018). On the other hand, FDI helps to improve environmental quality through importing green technology according to the pollution halo hypothesis (Antweiler et al., 2001; Eskeland and Harrison, 2003; Zarsky, 1999).
The difference in the effect of FDI on the level of environmental pollution depends on the role of government in each country (Cole et al., 2006; Damania et al., 2003; Dunning and Lundan, 2008; Gani and Scrimgeour, 2014; Halkos and Paizanos, 2016; Lopez et al., 2011; Lopez and Palacios, 2014; Selden and Song, 1994; Wang and Chen, 2014; Wang et al., 2013). In the early stage of researches on the role of government in the relationship between these two factors, pervious studies often focus on the institutional aspect. Some studies show the appropriateness of the institutional interpretation of the effects of FDI on the level of environmental pollution in developing and emerging countries (Dunning and Lundan, 2008; Peng et al., 2008). Some recent studies have gradually looked at the role of government in the policy aspect. Calbick and Gunton (2014) identify that policy factors play a crucial role in the change of environmental pollution in many countries. Through fiscal policies, governments regulate the economy towards development goals such as rising per capita income, thereby increasing people's demand for environmental quality (Halkos and Paizanos, 2016). Lopez et al. (2011) explain the main mechanisms by which fiscal policy can alter the environmental quality: First, higher income increases the need for environmental quality, which is often related to government spending. Lopez et al. (2011) and Adewuyi (2016) argue that public spending on public goods (education, health and social transfer, environmental protection, research and development) is not only creating a positive impact on economic growth but also having a significant effect on environment protection. Second, fiscal expansion also promotes human capital intensive activities. These activities are significantly less destructive to the environment than physical capital intensive activities (Halkos and Paizanos, 2016). Third, fiscal expansion improves labor efficiency relative to higher government spending on health, education and research (Adewuyi, 2016; Halkos and Paizanos, 2016). Finally, public spending can also have an income effect through subsidies to increased purchasing power households that make people consume more clean goods and the need for a cleaner environment (Adewuyi, 2016).
According to the author's understanding, previous studies analyzing the role of tax policy in environment protection are still very modest. In general, taxes have a direct effect on the level of environmental pollution and indirectly through different transmission channels. The direct impact of taxes on the environment is through behavior changes (Jones et al., 2020). Environmental pollution activities could be reduced as tax policies persuade individuals or corporations to change their behaviors by accolading or rewarding appropriate activities as well as penalizing inappropriate activities. The indirect impact of tax policy on environmental pollution through FDI transmission channel is mainly through the role of tax policy in attracting FDI

EEccoonn RReess GGuuaarrdd 114466 22002211
inflows. Amirahmadi and Wu (1994) emphasizes the importance of fiscal incentives to FDI attractiveness. A country's tax policy may influence the decision of multinationals to open a branch in that country by increasing or decreasing the advantages of ownership (Simmons, 2003). The host country's corporate income tax rate contributes to determining the comparative advantage it can offer international investors compared to other countries (Kersan-Škabić, 2015; Kransdorff, 2010; Simmons, 2003).
Consequently, in this study, we focus on analyzing the role of tax policy in FDI-Environmental pollution nexus in the case of developing countries. The research paper is structured as follows: Part 2 is an empirical model; Part 3 is the result and discussion; part 4 is the conclusion.
2. Models and data
To evaluate the effects of FDI on the level of environmental degradation in developing countries between 2004 and 2016, we use the dynamic model as follows:
where i and t represent country i and year t; CO2 is the level of environment degradation measured as the emission per capita in logarithmic form.; RGDP is income measured as real income per capita in logarithmic form.; FDI is foreign direct investment measured as FDI as a percentage of GDP.
Z consists of all controlled variables: domestic investment, trade openness, energy consumption, infrastructure development, industry and urbanization. The use of controlled variables is based on the theoretical foundation and literature review of many previous studies such as:
Domestic investment (DINV) is the annual aggregate domestic investment as a percentage of GDP. This factor is considered as the main source of environmental pollution as the expansion of investment in production may leads to more environment-damaged activities (Jorgenson et al., 2007; Jiang, 2015; Sapkota and Bastola, 2017).
Trade openness (OPEN) is measured as the total export as a percentage of GDP. Import and Export activities encourage both manufacturing and consumption so they affect considerably environmental pollution. Cole (2004) argued that trade openness may lower the level of pollution since many countries have access to environment-friendly technology. Nevertheless, the opposite effect may also occur. According to the theory of pollution haven, developed countries can export their dirty (environment-damaged) products such as fuel, cement manufacturing to developing countries. In this scenario, trade openness can worsen the pollution problem(Abdouli and Hammami, 2017; Abid, 2016; Solarin et al., 2017).
Energy consumption level (ENERGY): The Energy consumption-Environmental pollution nexus has been explained by many studies about climate change (Bollen et al., 2010; Canh et al., 2018; Ezzati et al., 2004; Jacobson, 2009; Tsuji et al., 2002). Consuming large amounts of energy is a main cause of greenhouse effect and contributes to climate change (Ezzati et al., 2004). Notably, the situation is particularly serious in developing countries. According to Chan and Yao (2008), excessive consumption of energy leads to serious pollution problems in megacities in China.
EEccoonn RReess GGuuaarrdd 114477 22002211
Infrastructure Level (INFRA) is measured as the average number of mobile phone users in 100 people in logarithmic form. The development of infrastructure both has a direct and indirect effect on the CO2 emission level. The direct effects come from building activities such as roads, highways, bridges, harbours, telecommunication infrastructures. Moreover, better infrastructure encourages more manufacturing due to better distribution and logistic systems (Bakhsh et al., 2017; Cole et al., 2006).
The level of urbanization (URBAN) and the level of industrialization (INDUSTRY) are measured as the percentage of the population living in urban centers and the proportion of value added by the main industries to the total GDP. Recent studies show that the level of urbanization and industrialization have a strong influence on the level of environmental degradation (Canh et al., 2018; Canh et al., 2019; Wu et al., 2016). The higher the level of urbanization and industrialization, the greater the economic activities. This process leads to a higher level of CO2 emission.
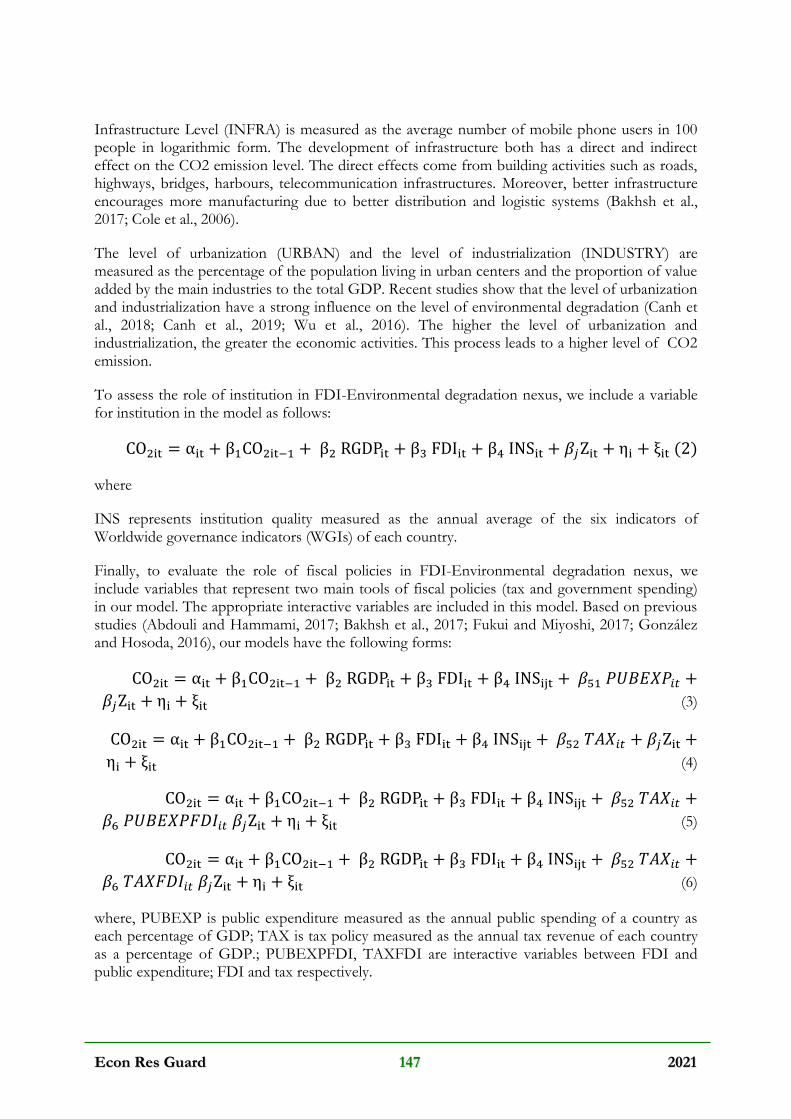
To assess the role of institution in FDI-Environmental degradation nexus, we include a variable for institution in the model as follows:
where
INS represents institution quality measured as the annual average of the six indicators of Worldwide governance indicators (WGIs) of each country.
Finally, to evaluate the role of fiscal policies in FDI-Environmental degradation nexus, we include variables that represent two main tools of fiscal policies (tax and government spending) in our model. The appropriate interactive variables are included in this model. Based on previous studies (Abdouli and Hammami, 2017; Bakhsh et al., 2017; Fukui and Miyoshi, 2017; González and Hosoda, 2016), our models have the following forms:
(3)
(4)
(5)
(6)
where, PUBEXP is public expenditure measured as the annual public spending of a country as each percentage of GDP; TAX is tax policy measured as the annual tax revenue of each country as a percentage of GDP.; PUBEXPFDI, TAXFDI are interactive variables between FDI and public expenditure; FDI and tax respectively.
EEccoonn RReess GGuuaarrdd 114488 22002211
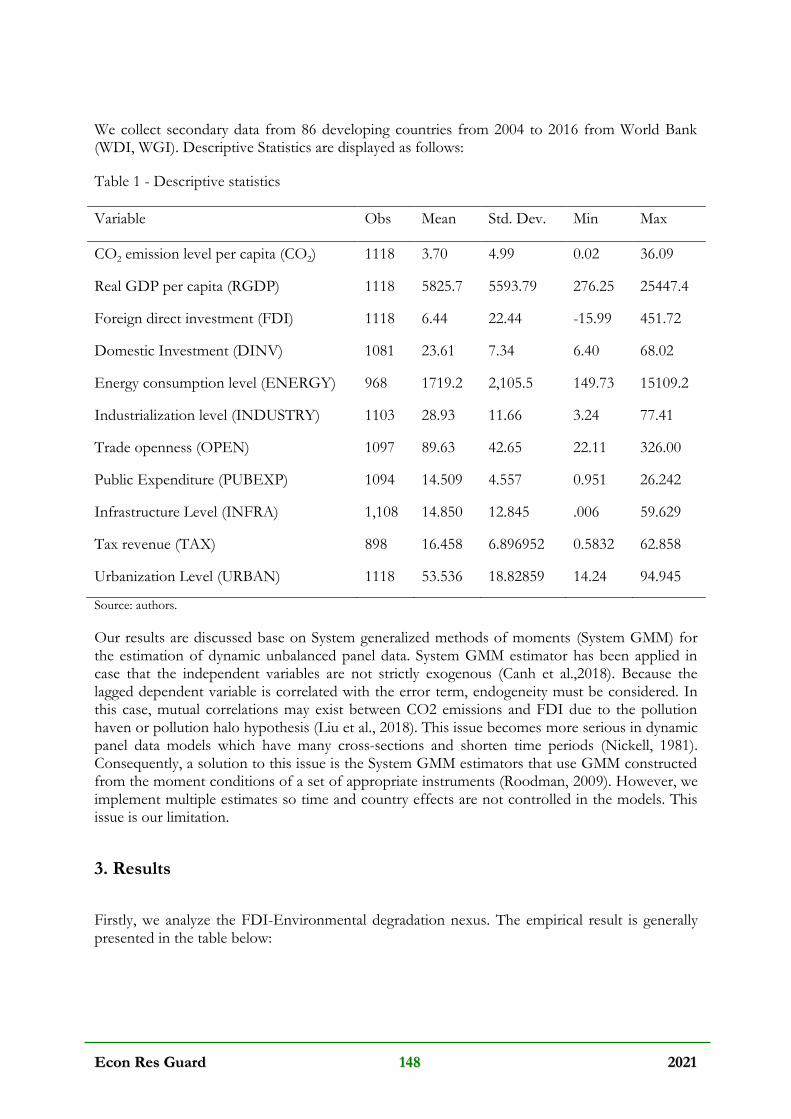
We collect secondary data from 86 developing countries from 2004 to 2016 from World Bank (WDI, WGI). Descriptive Statistics are displayed as follows:
Table 1 - Descriptive statistics
Variable Obs Mean Std. Dev. Min Max
CO2 emission level per capita (CO2) 1118 3.70 4.99 0.02 36.09
Real GDP per capita (RGDP) 1118 5825.7 5593.79 276.25 25447.4
Foreign direct investment (FDI) 1118 6.44 22.44 -15.99 451.72
Domestic Investment (DINV) 1081 23.61 7.34 6.40 68.02
Energy consumption level (ENERGY) 968 1719.2 2,105.5 149.73 15109.2
Industrialization level (INDUSTRY) 1103 28.93 11.66 3.24 77.41
Trade openness (OPEN) 1097 89.63 42.65 22.11 326.00
Public Expenditure (PUBEXP) 1094 14.509 4.557 0.951 26.242
Infrastructure Level (INFRA) 1,108 14.850 12.845 .006 59.629
Tax revenue (TAX) 898 16.458 6.896952 0.5832 62.858
Urbanization Level (URBAN) 1118 53.536 18.82859 14.24 94.945
Source: authors.
Our results are discussed base on System generalized methods of moments (System GMM) for the estimation of dynamic unbalanced panel data. System GMM estimator has been applied in case that the independent variables are not strictly exogenous (Canh et al.,2018). Because the lagged dependent variable is correlated with the error term, endogeneity must be considered. In this case, mutual correlations may exist between CO2 emissions and FDI due to the pollution haven or pollution halo hypothesis (Liu et al., 2018). This issue becomes more serious in dynamic panel data models which have many cross-sections and shorten time periods (Nickell, 1981). Consequently, a solution to this issue is the System GMM estimators that use GMM constructed from the moment conditions of a set of appropriate instruments (Roodman, 2009). However, we implement multiple estimates so time and country effects are not controlled in the models. This issue is our limitation.
3. Results
Firstly, we analyze the FDI-Environmental degradation nexus. The empirical result is generally presented in the table below:

EEccoonn RReess GGuuaarrdd 114499 22002211
Table 2 - The impact of FDI on the CO2 emission in developing countries
Variable FDI (1)
CO2 (-1) 0.9205** (0.0056)
RGDP 0.0196*** (0.0073)
DINV 0.0020*** (0.0003)
OPEN 0.0001 (0.00003)
INFRA 0.0026*** (0.0002)
ENERGY 0.0000*** (0.0001)
URBAN 0.0016*** (0.0003)
INDUSTRY 0.0011*** (0.0002)
FDI 0.0018*** (0.0001)
P-value Hansen Test 0.4472
P-value Sargan Test 0.5252
P-value AR(2) Test 0.9049
Countries 86
Ivs 71
Note: standard errors in parentheses. *** p<0.01, ** p<0.05, * p<0.1.
Source: authors.
The result shows that FDI has a significance that increases the level of CO2 emission in developing countries. This result is compatible with previous studies such as Abdouli and Hammami (2017), Behera and Dash (2017), Canh et al. (2018), Sapkota and Bastola (2017), Solarin et al. (2017). In developing countries, the increase of FDI causes the increase in degradation of the environment. This reflects the reality in these countries which are actively attracting FDI to spur economic growth. However, the activities created by these FDI firms

EEccoonn RReess GGuuaarrdd 115500 22002211
generate more CO2 emission and other environmental issues (Chan and Yao, 2008; Zhang and Zhou, 2016). That means many developing countries that are the destination of FDI have out-of-date manufacturing technology and weak environmental protection regulation. This type of transition not only leads to the restructure of the manufacturing but also changes the trade dynamics of countries (Cole and Elliott, 2003; Cole et al., 2017).
To assess the role of the government in this nexus in many dimensions, we respectively use the institution variable fiscal variables. The appropriate interaction variables are also considered. The results are presented in the table below:
Table 3 - The role of institution, fiscal policy on the level of CO2 emission in developing countries
Variable INS (2)
PUBEXP (3)
TAX (4)
FDI-PUBEXP (5)
FDI-TAX (6)
CO2 (-1) 0.9332*** (0.0056)
0.9455*** (0.0065)
0.9117*** (0.0037)
0.9359*** (0.0057)
0.9111*** (0.0045)
RGDP 0.014
(0.0098) 0.0167 (0.012)
0.0668*** (0.011)
0.0483*** (0.011)
0.0695*** (0.011)
DINV 0.0015*** (0.0003)
0.0010** (0.0004)
0.0027*** (0.0002)
0.0015*** (0.0004)
0.0028*** (0.0002)
OPEN 0.0002*** (0.0000)
0.0004*** (0.0000)
0.0004*** (0.0000)
0.0002*** (0.0000)
0.0004*** (0.000)
INFRA 0.0017*** (0.0000)
0.0011* (0.0006)
0.0012*** (0.0004)
0.0011** (0.0004)
0.0011*** (0.0004)
ENERGY 0.0001*** (0.0000)
0.0001 (0.0000)
0.0001 (0.0000)
0.0001** (0.0000)
0.0001 (0.0000)
URBAN 0.0007* (0.0000)
0.0003 (0.0001)
0.0002 (0.0003)
0.0003 (0.0003)
0.0001 (0.0003)
INDUSTRY 0.0007*** (0.0002)
0.0015*** (0.0003)
0.0023*** (0.0003)
0.0019*** (0.0004)
0.0024*** (0.0003)
FDI 0.0017*** (0.0001)
0.0021*** (0.0002)
0.0009*** (0.0009)
0.0104*** (0.0002)
0.0023*** (0.0003)
INS -0.0156*** (0.0040)
-0.0121* (0.0093)
-0.0173** (0.0086)
-0.0205** (0.0078)
-0.0149* (0.0080)
PUBEXP -0.0010* (0.0005)
-0.0012 (0.0010)
TAX -0.0027*** (0.0005)
-0.0018*** (0.0005)
PUBEXPFDI -0.0005 (0.0001)
TAXFDI -0.0001*** (0.0000)
P-value Hansen Test
0.4093 0.3699 0.4954 0.3722 0.4564
P-value Sargan Test
0.4988 0.5062 0.2857 0.4298 0.2161
P-value AR(2) Test
0.8785 0.9585 0.9749 0.906 0.7641

EEccoonn RReess GGuuaarrdd 115511 22002211
Countries 86 86 86 86 86
Ivs 72 68 72 70 72
Note: Note: standard errors in parentheses. *** p<0.01, ** p<0.05, * p<0.1.
Source: authors.
On one hand, the institution quality also has a negative correlation with CO2 emissions. The quality of institution plays a significant role in the formulation of environmental protection policies. As the institution quality increases, government strategies, policies and regulations related to FDI attractiveness become stricter, leading to high-quality FDI flows. It brings to host countries modern production technologies and management practice which are more efficient and environmentally-friendly for post-production waste treatment (Neequaye and Oladi, 2015). Weak institutions, on the other hand, create gaps for companies, including multinationals, to engage in environmentally harmful behavior. Damania et al. (2003) indicate that lack of control of corruption considerably distorts the implementation of environment-related policies. Civil servants, for personal gain, often ignore the regulations on environmental protection. Thereby, this creates opportunities for companies, instead of spending large amounts of money on technology improvement and management improvement, to carry out production activities that are harmful to the environment and not be punished.
On the other hand, the results show that fiscal policies (taxes and public spending) have negative effects on air pollution levels. In other words, the increase in taxes and public spending creates positives, helping to improve the environment. As Halkos and Paizanos (2016) explain, through fiscal policy, governments regulate the economy towards development goals such as rising per capita income, thereby, the need for a higher living environment is also enhanced. Therefore, the accountability and efficiency of government in the provision of public goods can have a positive effect on environmental issues. In terms of tax policy, it is implied that developing countries have paid more attention to environmental protection objective. According to Jones et al.(2020), governments use their tax systems to address not only macroeconomic objectives but also social concerns. One of the most widely recognized is environmental pollution. Environmental pollution activities could be reduced if individuals or corporations could be persuaded to change their behavior. Governments can promote behavioral change by imposing tax laws to reward desirable behavior or penalize undesirable behavior. The tax rewards are tax incentives or tax relief while the penalty may be a higher tax burden. This creates a direct impact, reducing environmental damage. Especially, tax has a significance to decrease the environmental effect of FDI in these countries. It means developing countries gradually use tax policies to restrict the harmful environmental activities of FDI companies.
4. Conclusions
Environmental pollution is becoming a serious problem on a global scale. In general, FDI has a strong influence that increases the level of CO2 emission in developing countries. This study focuses on the role of government in the relationship between FDI and pollution levels in developing countries in the period 2004-2016. In particular, the role of the government in this nexus is analyzed in both aspects: institutional and fiscal policies. The empirical results imply an important role of institution quality in the formulation of environmental protection policies. Although environmental protection is not the primary goal of fiscal policies, tax and public expenditure also have negative effects on CO2 emissions in developing countries. In other

EEccoonn RReess GGuuaarrdd 115522 22002211
words, the increase in taxes and public spending creates incentives to reduce environmental pollution in developing countries. Interestingly, tax policy has a significant impact to decrease the environmental effect of FDI in these countries. This result indicates that developing countries are gradually paying more attention to regulate the environment-related activities of FDI companies through tax policies.
References
Abdouli M, Hammami S (2017). Investigating the causality links between environmental quality, foreign direct investment and economic growth in MENA countries. International Business Review. 26(2): 264-278.
Abid M, Schilling J, Scheffran J, Zulfiqar F (2016). Climate change vulnerability, adaptation and risk perceptions at farm level in Punjab, Pakistan. Science of the Total Environment. 547: 447-460.
Adewuyi AO (2016). Effects of public and private expenditures on environmental pollution: A dynamic heterogeneous panel data analysis. Renewable and Sustainable Energy Reviews. 65: 489-506.
Antweiler W, Copeland R, Taylor S (2001). Is free trade good for the environment?. American Economic Review. 91(4): 877-908.
Bakhsh K, Rose S, Ali MF, Ahmad N, Shahbaz M (2017). Economic growth, CO2 emissions, renewable waste and FDI relation in Pakistan: New evidences from 3SLS. Journal of environmental management. 196: 627-632.
Bollen J, Hers S, Van der Zwaan B (2010). An integrated assessment of climate change, air pollution, and energy security policy. Energy Policy. 38(8): 4021-4030.
Canh NP, Nguyen NA, Schinckus C, Thanh SD (2018). The Ambivalent Role of Institutions in the CO2 Emissions: The Case of Emerging Countries. International Journal of Energy Economics and Policy. 8(5): 7-17.
Canh NP, Thanh SD, Schinckus C, Bensemann J, Thanh LT (2019). Global Emissions: A New Contribution from the Shadow Economy. International Journal of Energy Economics and Policy. 9(3): 320-337.
Chan CK, Yao X (2008). Air pollution in mega cities in China. Atmospheric environment. 42(1): 1-42.
Cole MA, Elliott RJ (2003). Determining the trade–environment composition effect: the role of capital, labor and environmental regulations. Journal of Environmental Economics and management. 46(3): 363-383.
Cole MA, Elliott RJ, Fredriksson PG (2006). Endogenous pollution havens: Does FDI influence environmental regulations?. Scandinavian Journal of Economics. 108(1): 157-178.
Cole MA, Elliott RJ, Zhang L (2017). Foreign direct investment and the environment. Annual Review of Environment and Resources. 42: 465-487.

EEccoonn RReess GGuuaarrdd 115533 22002211
Damania R, Fredriksson PG, List JA (2003). Trade liberalization, corruption, and environmental policy formation: theory and evidence. Journal of environmental economics and management. 46(3): 490-512.
Eskeland G, Harrison AE (2003). Moving to greener pasture? Multinationals and the Pollution Haven. Journal of development economics. 70(1): 1-23.
Ezzati M, Bailis R, Kammen DM, Holloway T, Price L, Cifuentes LA, Barnes B, Chaurey A, Dhanapala KN (2004). Energy management and global health. Annual Review of Environment and Resources. 29: 383-419.
Fukui H, Miyoshi C (2017). The impact of aviation fuel tax on fuel consumption and carbon emissions: The case of the US airline industry. Transportation Research Part D: Transport and Environment. 50: 234-253.
Gani A, Scrimgeour F (2014). Modeling governance and water pollution using the institutional ecological economic framework. Economic modelling. 42: 363-372.
González R, Hosoda EB (2016). Environmental impact of aircraft emissions and aviation fuel tax in Japan. Journal of Air Transport Management. 57: 234-240.
Grossman GM, Krueger AB (1995). Economic growth and the environment. The quarterly journal of economics. 110(2): 353-377.
Halkos GE, Paizanos EΑ (2016). The effects of fiscal policy on CO2 emissions: Evidence from the USA. Energy Policy. 88: 317-328.
Hill MK (2010). Understanding environmental pollution: Cambridge University Press.
Ibrahim MH, Law SH (2016). Institutional Quality and CO2 Emission–Trade Relations:
Evidence from Sub‐S aharan Africa. South African Journal of Economics. 84(2): 323-340.
Jones SM, Rhoades-Catanach SC, Lemler B (2020). Principles of taxation for business and investment planning 2020 Edition. McGraw-Hill Irwin.
Lan J, Kakinaka M, Huang X (2012). Foreign direct investment, human capital and environmental pollution in China. Environmental and Resource Economics. 51(2): 255-275.
Lopez R, Galinato GI, Islam A (2011). Fiscal spending and the environment: Theory and empirics. Journal of Environmental Economics and management. 62(2): 180-198.
Lopez R, Palacios A (2014). Why has Europe become environmentally cleaner? Decomposing the roles of fiscal, trade and environmental policies. Environmental and Resource Economics. 58(1): 91-108.
McGee JA, Clement, MT, Besek, JF (2015). The impacts of technology: a re-evaluation of the STIRPAT model. Environmental Sociology. 1(2): 81-91.
Roodman D (2009). How to do xtabond2: An introduction to difference and system GMM in Stata. The stata journal. 9(1): 86-136.

EEccoonn RReess GGuuaarrdd 115544 22002211
Selden TM, Song D (1994). Environmental quality and development: is there a Kuznets curve for air pollution emissions?. Journal of Environmental Economics and management. 27(2): 147-162.
Solarin SA, Al-Mulali U, Musah I, Ozturk I (2017). Investigating the pollution haven hypothesis in Ghana: an empirical investigation. Energy. 124: 706-719.
Tsuji H, Gupta AK, Hasegawa T, Katsuki M, Kishimoto K, Morita M (2002). High temperature air combustion: from energy conservation to pollution reduction: CRC press.
Victor PA (2017). Pollution: Economy and environment: Routledge.
Wang DT, Gu FF, David, KT, Yim CKB (2013). When does FDI matter? The roles of local institutions and ethnic origins of FDI. International Business Review. 22(2): 450-465.
Wang DT, Chen WY (2014). Foreign direct investment, institutional development, and environmental externalities: Evidence from China. Journal of environmental management. 135: 81-90.
Wang M, Che Y, Yang K, Wang M, Xiong L, Huan Y (2011). A local-scale low-carbon plan based on the STIRPAT model and the scenario method: The case of Minhang District, Shanghai, China. Energy Policy. 39(11): 6981-6990.
Welford R(1995). Environmental strategy and sustainable development: The corporate challenge for the twenty-first century. Routledge.
Welford R (2016). Corporate environmental management 1: systems and strategies: Routledge.
Wheeler D (2001). Racing to the bottom? Foreign investment and air pollution in developing countries. The Journal of Environment & Development. 10(3): 225-245.
Wu Y, Shen J, Zhang X, Skitmore M, Lu W (2016). The impact of urbanization on carbon emissions in developing countries: a Chinese study based on the U-Kaya method. Journal of Cleaner Production. 135: 589-603.
York R, Rosa EA, Dietz T (2003). STIRPAT, IPAT and ImPACT: analytic tools for unpacking the driving forces of environmental impacts. Ecological economics. 46(3): 351-365.
Zarsky L (1999). Havens, halos and spaghetti: untangling the evidence about foreign direct investment and the environment. Foreign direct Investment and the Environment. 13(8): 47-74.
Zhang C, Zhou X (2016). Does foreign direct investment lead to lower CO2 emissions? Evidence from a regional analysis in China. Renewable and Sustainable Energy Reviews. 58: 943-951.

EEccoonn RReess GGuuaarrdd 115555 22002211
Appendix
Table: List of developing countries analyzed
Id Country Id Country Id Country
1 Benin 31 Nicaragua 61 Mauritius
2 Burkina Faso 32 Nigeria 62 Namibia
3 Central African Republic 33 Pakistan 63 Paraguay
4 Congo, Dem. Rep. 34 Philippines 64 Peru
5 Liberia 35 Sri Lanka 65 Romania
6 Madagascar 36 Tunisia 66 Russian Federation
7 Mali 37 Ukraine 67 South Africa
8 Nepal 38 Vietnam 68 St. Lucia
9 Sierra Leone 39 Algeria 69 Suriname 10 Togo 40 Angola 70 Thailand
11 Uganda 41 Azerbaijan 71 Turkey
12 Armenia 42 Belarus 72 Bahrain
13 Banglsdesh 43 Belize 73 Barbodos 14 Bhutan 44 Bosnia &Herzegovina 74 Chile
15 Cambodia 45 Malaysia 75 Congo, Rep.
16 Cote d'Ivoire 46 Brazil 76 Estonia
17 Egypt, Arab Rep. 47 Bulgaria 77 Hungary 18 El Salvador 48 China 78 Latvia
19 Ghana 49 Colombia 79 Lithuania
20 Guatemala 50 Costa Rica 80 Malta
21 Honduras 51 Dominican Republic 81 Oman
22 India 52 Fiji 82 Poland
23 Indonesia 53 Georgia 83 Slovak Republic
24 Kenya 54 Iran, Islamic Rep. 84 Slovenia
25 Kyrgyz Republic 55 Jamaica 85 Trinidad and Tobago
26 Lao PDR 56 Jordan 86 Uruguay
29 Morocco 59 Croatia 30 Botswana 60 Czech Republic