tax incentives to enhance investment growth · tax incentives to enhance investment growth sixth...
TRANSCRIPT

TAX INCENTIVES TO ENHANCE INVESTMENT GROWTH
Sixth IMF-Japan High-Level Tax Conference For Asian Countries in Tokyo
1
7th April 2015
Presented by: ASTERA PRIMANTO BHAKTI
Assistant Minister for State Revenue Ministry of Finance
Indonesia
2
-
5,000.0
10,000.0
15,000.0
20,000.0
25,000.0
30,000.0
35,000.0
2004 2005 2006 2007 2008 2009 2010 2011 2012 2013 2014
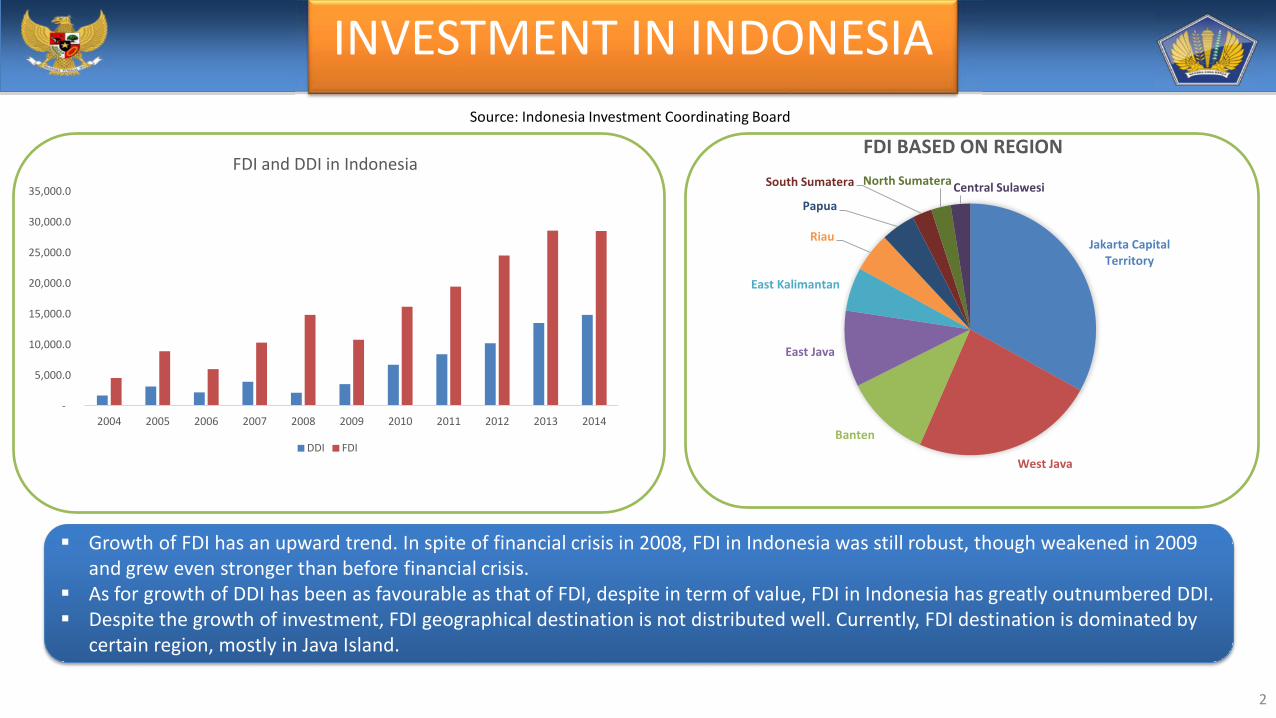
FDI and DDI in Indonesia
DDI FDI
INVESTMENT IN INDONESIA Source: Indonesia Investment Coordinating Board
Jakarta Capital Territory
West Java
Banten
East Java
East Kalimantan
Riau
Papua
South Sumatera North Sumatera Central Sulawesi
FDI BASED ON REGION
Growth of FDI has an upward trend. In spite of financial crisis in 2008, FDI in Indonesia was still robust, though weakened in 2009 and grew even stronger than before financial crisis.
As for growth of DDI has been as favourable as that of FDI, despite in term of value, FDI in Indonesia has greatly outnumbered DDI. Despite the growth of investment, FDI geographical destination is not distributed well. Currently, FDI destination is dominated by
certain region, mostly in Java Island.

FDI BY SECTOR IN INDONESIA
Transport, Storage &
Communication 25%
Mining 15%
Chemical & Pharmaceutical
Industry 11%
Metal, Machinery &
Electronic Industry
11%
Food Industry 9%
Motor vehicles & Other Transport Equip. Industry
8%
Electricity, Gas & Water Supply
6%
Food Crops & Plantation
6%
Trade & Repair 5%
Construction 4%
In period 2004 to 2014, FDI to Indonesia dominated by transport, storage, and communication industries. Followed by mining industries. Total FDI to Indonesia for the last 11 years reached 173,004.3 million USD.
in million USDSector 2012 2013 2014 SumTransport, Storage & Communication 2,808.2 1,449.9 3,000.8 35,754.0Mining 4,255.4 4,816.4 4,665.1 20,659.6Chemical & Pharmaceutical Industry 2,769.8 3,142.3 2,323.4 15,925.6Metal, Machinery & Electronic Industry 2,452.6 3,327.1 2,472.0 15,074.8Food Industry 1,782.9 2,117.7 3,139.6 12,468.9Motor vehicles & Other Transport Equip. Industry 1,840.0 3,732.2 2,061.3 11,754.1Electricity, Gas & Water Supply 1,514.6 2,221.8 1,248.8 8,959.2Food Crops & Plantation 1,601.9 1,605.3 2,206.7 8,581.4Trade & Repair 503.8 606.5 866.8 6,863.9Construction 239.6 526.8 1,383.6 5,922.5
For the last three years, mining sector has been the primary destination for investors. Motor vehicles & other transport equipment industry was the second highest in 2013. Food industry followed mining as the main sector of industry in 2014.
Source: Indonesia Investment Coordinating Board
Average FDI from 2004 to 2014
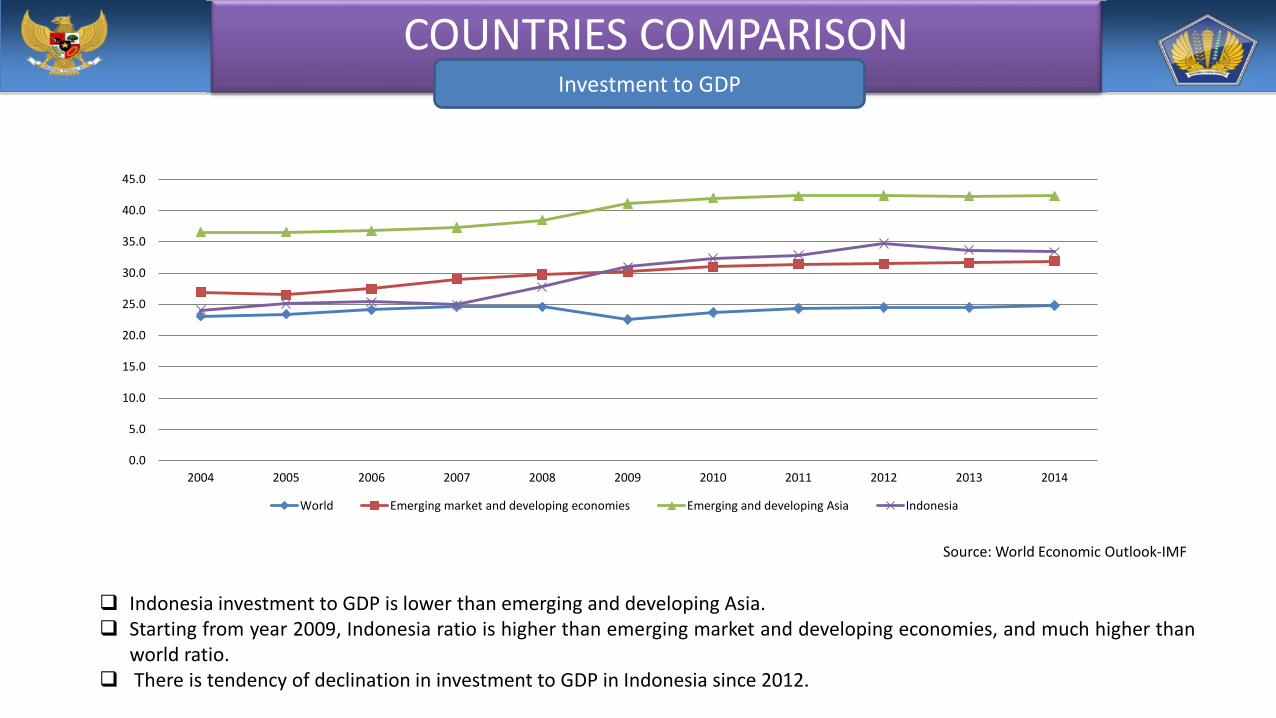
COUNTRIES COMPARISON
Indonesia investment to GDP is lower than emerging and developing Asia. Starting from year 2009, Indonesia ratio is higher than emerging market and developing economies, and much higher than
world ratio. There is tendency of declination in investment to GDP in Indonesia since 2012.
Source: World Economic Outlook-IMF
Investment to GDP
0.0
5.0
10.0
15.0
20.0
25.0
30.0
35.0
40.0
45.0
2004 2005 2006 2007 2008 2009 2010 2011 2012 2013 2014
World Emerging market and developing economies Emerging and developing Asia Indonesia

COUNTRIES COMPARISON Corporate Income Tax Rate
Indonesia reduce its corporate income tax rate from maximal 30% to a flat rate 28% year 2008 and 25% started in year 2009. Worldwide trend shows that corporate income tax rate is declining. Compare to other countries, Indonesia corporate tax rate is on track. Compare to some ASIAN countries, Indonesia tax rate is moderate.

TRADE BALANCE CHALLENGE in INDONESIA
-
20,000.00
40,000.00
60,000.00
80,000.00
100,000.00
120,000.00
140,000.00
2004 2005 2006 2007 2008 2009 2010 2011 2012 2013 2014
Export by Sector
Agriculture Industry Mining Others
-
20,000.00
40,000.00
60,000.00
80,000.00
100,000.00
120,000.00
140,000.00
160,000.00
180,000.00
200,000.00
2004 2005 2006 2007 2008 2009 2010 2011 2012 2013 2014
Import Based on Commodity (mil USD)
Consumption Goods Raw Material Support Capital Goods
Import of Indonesia is dominated by highly needed raw material (intermediate goods) which are required by industries. Yet, since 2012, growth of export delivered by industry sector has gone downward which resulted deficit in Indonesia Trade Balance.
Concerning the condition of trade balance, Indonesia still needs to support investment on : Industries which substitute import of intermediate goods Export oriented Industries
To attract investment in such industries, Government of Indonesia offers tax incentives as sweetener for investment.
Source: Ministry of Trade
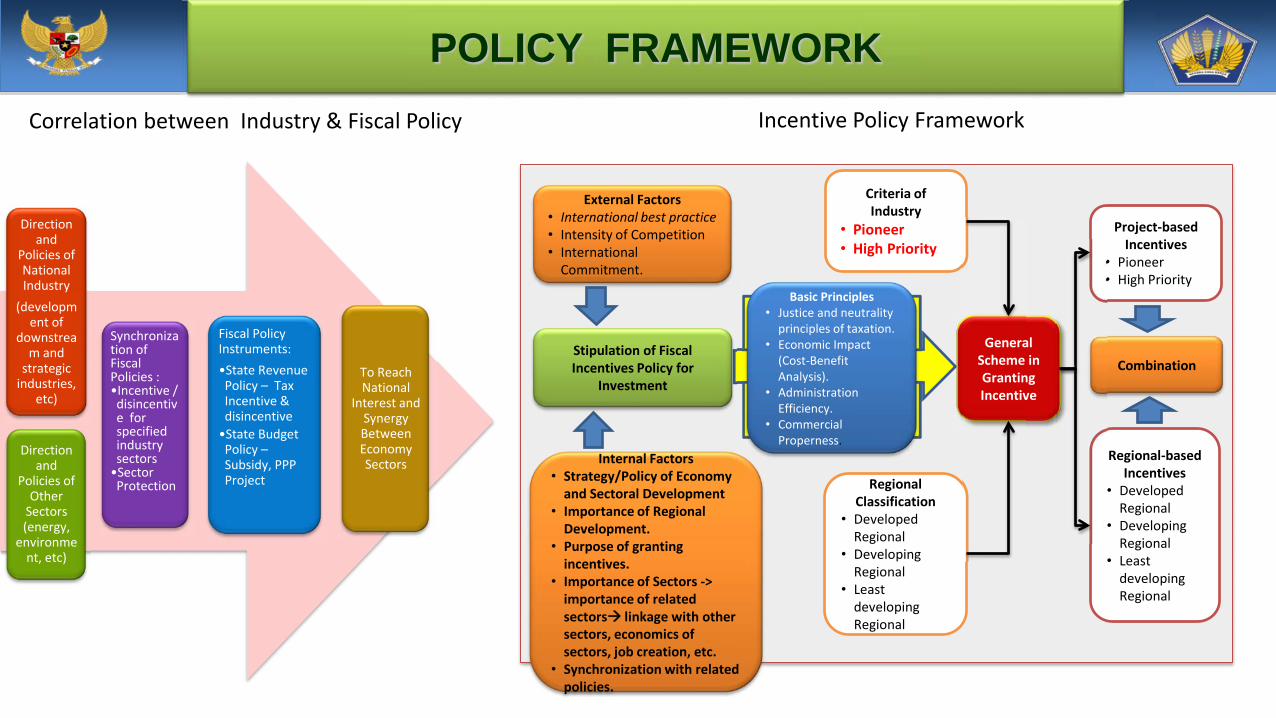
POLICY FRAMEWORK
7
Direction and
Policies of National Industry
(development of
downstream and
strategic industries,
etc)
Direction and
Policies of Other
Sectors (energy,
environment, etc)
Synchronization of Fiscal Policies : •Incentive / disincentive for specified industry sectors •Sector Protection
Fiscal Policy Instruments: •State Revenue Policy – Tax Incentive & disincentive •State Budget Policy – Subsidy, PPP Project
To Reach National
Interest and Synergy Between Economy Sectors
External Factors • International best practice • Intensity of Competition • International
Commitment.
Internal Factors • Strategy/Policy of Economy
and Sectoral Development • Importance of Regional
Development. • Purpose of granting
incentives. • Importance of Sectors ->
importance of related sectors linkage with other sectors, economics of sectors, job creation, etc.
• Synchronization with related policies.
Stipulation of Fiscal Incentives Policy for
Investment
Basic Principles • Justice and neutrality
principles of taxation. • Economic Impact
(Cost-Benefit Analysis).
• Administration Efficiency.
• Commercial Properness.
General Scheme in Granting Incentive
Regional Classification
• Developed Regional
• Developing Regional
• Least developing Regional
Criteria of Industry
• Pioneer • High Priority
Project-based Incentives
• Pioneer • High Priority
Combination
Regional-based Incentives
• Developed Regional
• Developing Regional
• Least developing Regional
Correlation between Industry & Fiscal Policy Incentive Policy Framework
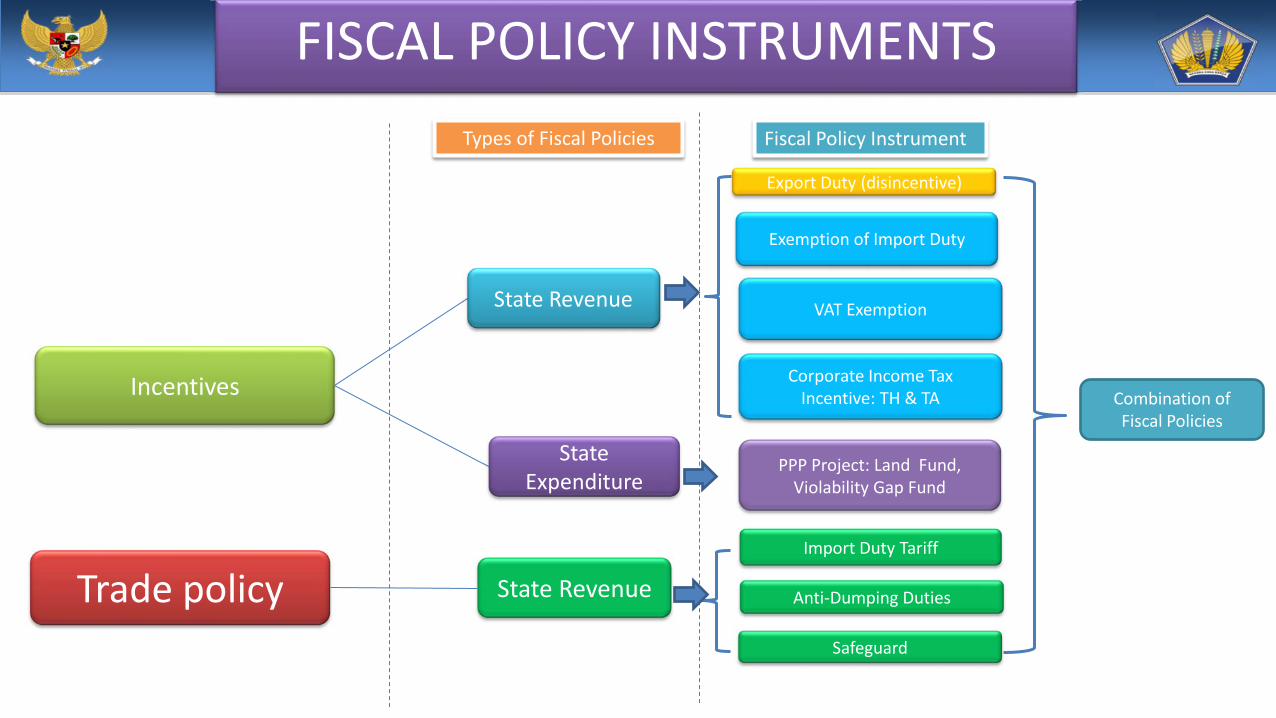
FISCAL POLICY INSTRUMENTS Types of Fiscal Policies Fiscal Policy Instrument
Incentives
Trade policy
State Revenue
State Expenditure
State Revenue
Export Duty (disincentive)
Exemption of Import Duty
VAT Exemption
Corporate Income Tax Incentive: TH & TA
Safeguard
Anti-Dumping Duties
Combination of Fiscal Policies
Import Duty Tariff
PPP Project: Land Fund, Violability Gap Fund
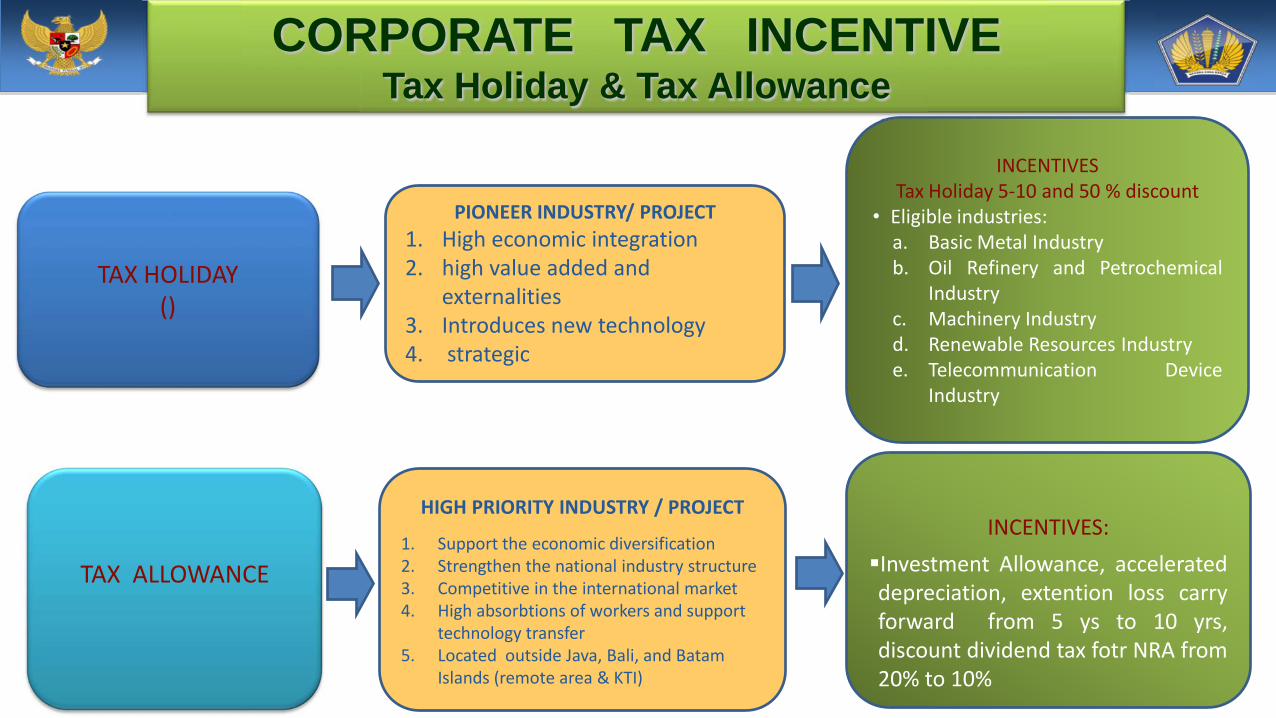
TAX HOLIDAY ()
PIONEER INDUSTRY/ PROJECT
1. High economic integration 2. high value added and
externalities 3. Introduces new technology 4. strategic
TAX ALLOWANCE
HIGH PRIORITY INDUSTRY / PROJECT
1. Support the economic diversification 2. Strengthen the national industry structure 3. Competitive in the international market 4. High absorbtions of workers and support
technology transfer 5. Located outside Java, Bali, and Batam
Islands (remote area & KTI)
INCENTIVES Tax Holiday 5-10 and 50 % discount
• Eligible industries: a. Basic Metal Industry b. Oil Refinery and Petrochemical
Industry c. Machinery Industry d. Renewable Resources Industry e. Telecommunication Device
Industry
INCENTIVES: Investment Allowance, accelerated depreciation, extention loss carry forward from 5 ys to 10 yrs, discount dividend tax fotr NRA from 20% to 10%
CORPORATE TAX INCENTIVE Tax Holiday & Tax Allowance
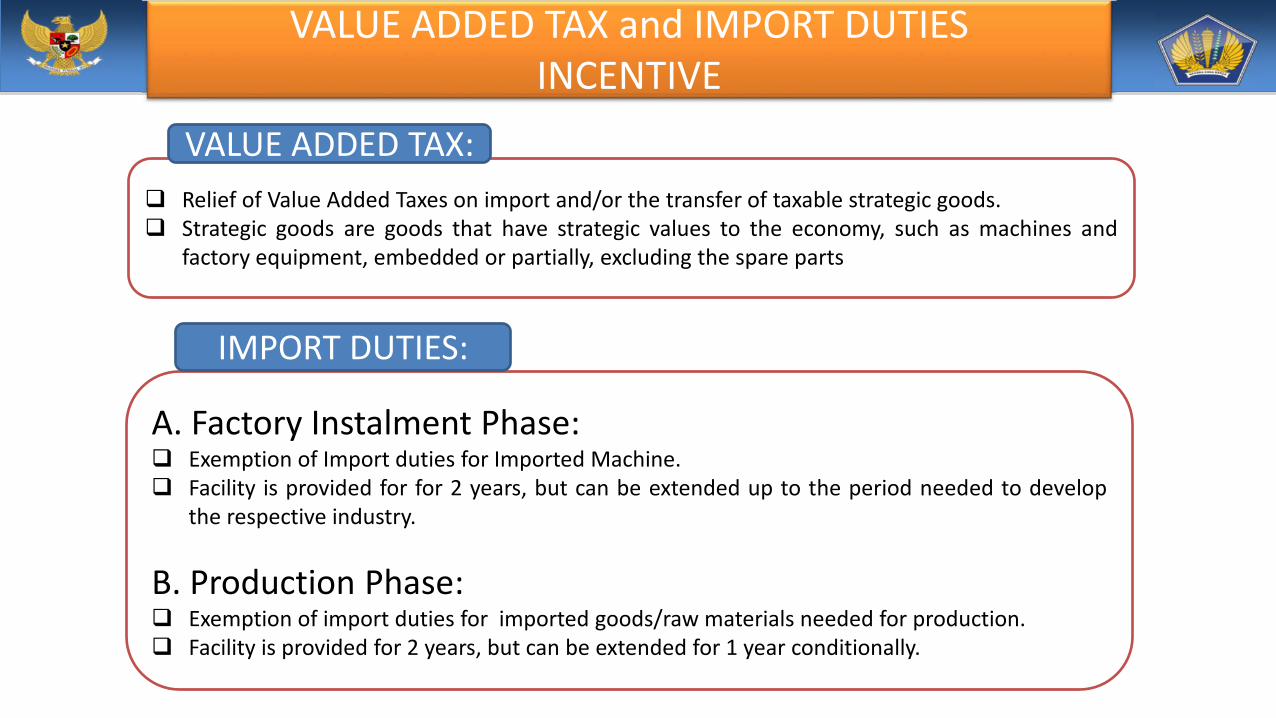
VALUE ADDED TAX and IMPORT DUTIES INCENTIVE
Relief of Value Added Taxes on import and/or the transfer of taxable strategic goods. Strategic goods are goods that have strategic values to the economy, such as machines and
factory equipment, embedded or partially, excluding the spare parts
A. Factory Instalment Phase: Exemption of Import duties for Imported Machine. Facility is provided for for 2 years, but can be extended up to the period needed to develop
the respective industry.
B. Production Phase: Exemption of import duties for imported goods/raw materials needed for production. Facility is provided for 2 years, but can be extended for 1 year conditionally.
VALUE ADDED TAX:
IMPORT DUTIES:
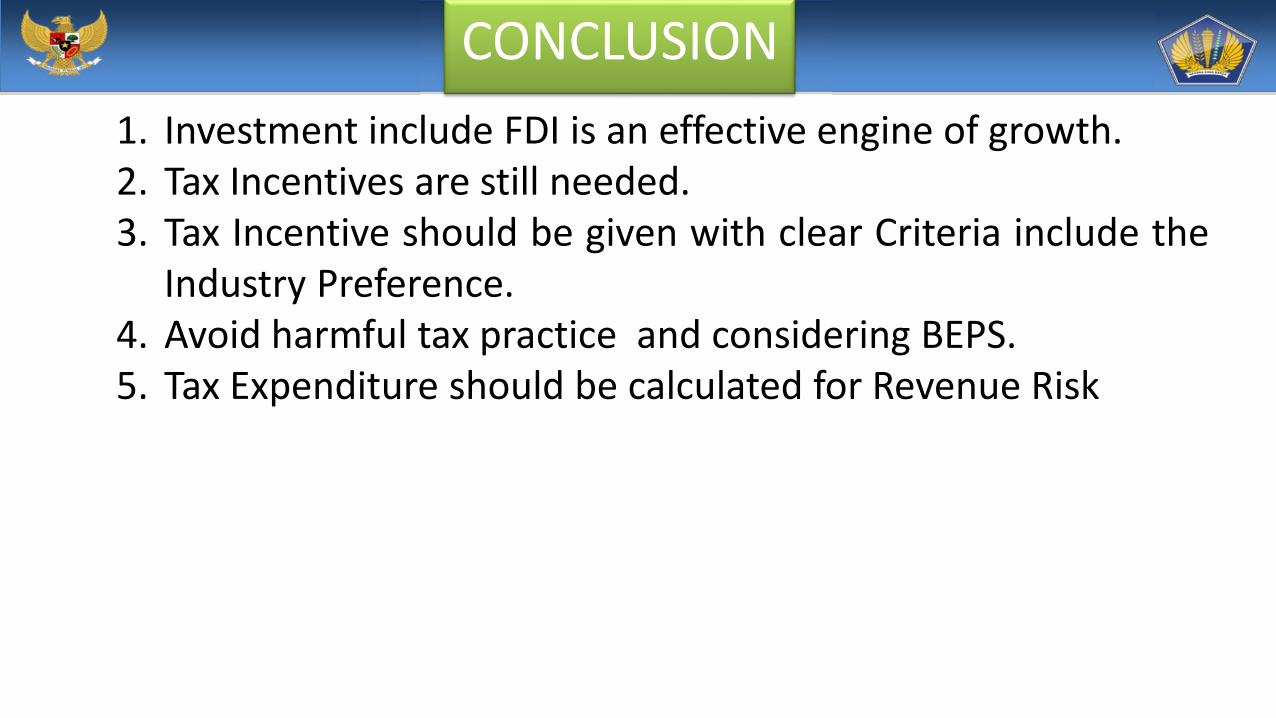
CONCLUSION 1. Investment include FDI is an effective engine of growth. 2. Tax Incentives are still needed. 3. Tax Incentive should be given with clear Criteria include the
Industry Preference. 4. Avoid harmful tax practice and considering BEPS. 5. Tax Expenditure should be calculated for Revenue Risk

END
Thank You
12