tax incentive review council (tirc)
TRANSCRIPT

www.FranklinCountyAuditor.com
2020TAX INCENTIVE REVIEW
COUNCIL (TIRC) ANNUAL REPORT

Among the duties and responsibilities of County Auditors under Ohio law is the duty to serve as the statutory chair of Tax Incentive Review Council (TIRC) for each municipality that has passed legislation authorizing the establishment of tax incentives.
As the TIRC Chair, I along with appropriate TIRC board members conduct meetings across the county where we review tax incentives granted to businesses and communities.
Due to the many inquiries that arise around tax incentives throughout Franklin County and with the goal of making your Auditor’s office transparent and accountable, this publication serves as a very first TIRC report — summarizing the various agreements and evaluations that were received during the 2020 TIRC season.
As represented in this report, there remains a variety of incentives throughout the county. The Auditor’s Office goal is to make the compilation of the data used for TIRC and community review be clear and transparent.
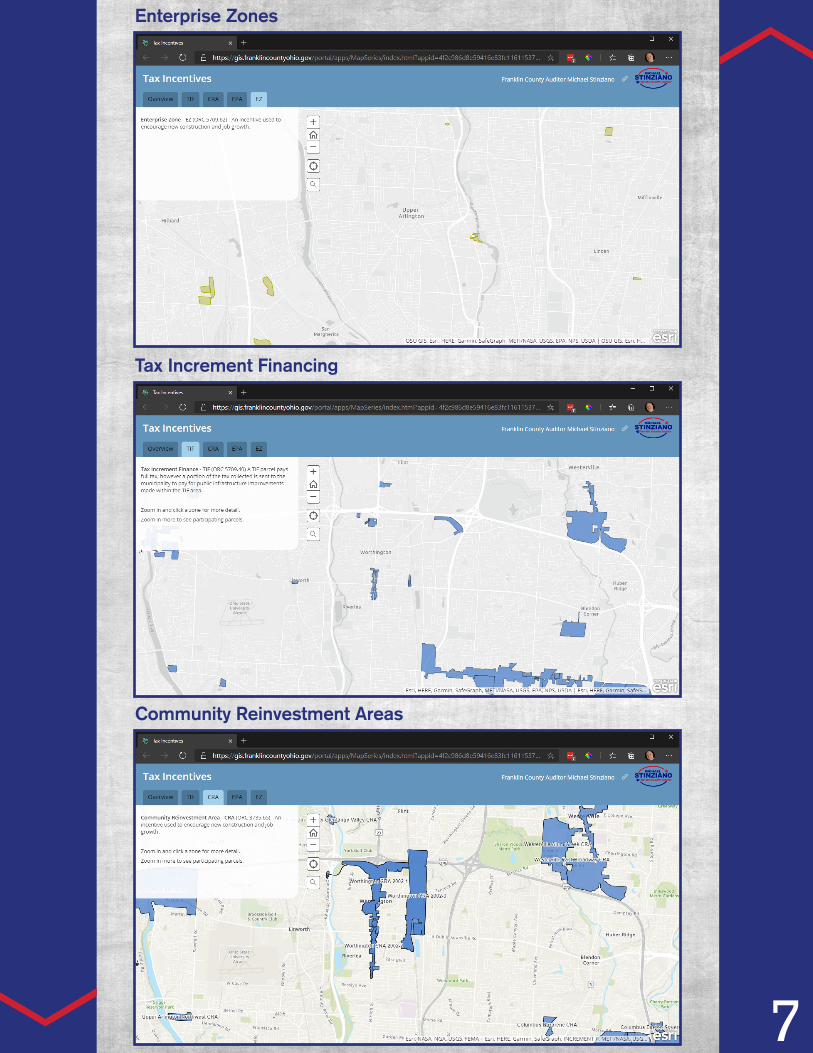
In addition to the publication of this report with all current year meeting data, the Franklin County Auditor’s office is launching a new web tool for tax inventive review. This tool is an interactive map that allows you to see where incentives are used in the county and the primary source documents that created these incentives. The tool can be found at www.franklincountyauditor.com/tirctool.
Tax incentives have a role in developing our communities and are pervasive not only throughout Franklin County but among all 50 states. The goal of the office and this report is to ensure each incentive and its ongoing status are transparent and providing the benefits promised to our communities (and if not, having a record of why).
I hope this report and the new web tool will provide you with insight on how the various tax incentive programs are working in your community and throughout Franklin County.
In addition, the goal of the Franklin County Auditor’s office is to continue to address issues that arise in the community and to further share the work and analysis of the office. Never hesitate to provide me with additional feedback of areas for clarity or further analysis.
Michael Stinziano Franklin County Auditor
In 2019, the Franklin County Auditor’s office along with the Columbus City Council engaged with Regionomics to assess property abatements and establish a tool for abatement evaluations. While the tool continues to be developed, the report can be found at www.franklincountyauditor.com/tirctool
L E T T E R F R O M Y O U R F R A N K L I N C O U N T Y A U D I T O R
1

F R A N K L I N C O U N T Y M A PO F T A X I N C E N T I V E S
2
Enterprise Zone (EZ): Offers companies property tax exemption on new real property.
Environmental Protection Abatement (EPA): Property tax incentives created to encourage the cleanup of brown fields and other environmental hazards in our communities. The Auditor’s Office manages this program but oversight is conducted by the Ohio Environmental Protection Agency, not the TIRC.
Tax Increment Financing (TIF): Designates a parcel or multiple parcels as within a project.
Community Reinvestment Areas (CRA): Provide real property tax exemptions to property owners who make improvements to their property.

State and local governments use a variety of tax incentives to attract and retain business investment,create jobs, reduce blight, and pursue other goals. Incentives are widely used in Franklin County, and
the expectation is that each granted incentive results in increased property value, investment, employment and/or payroll, or other economic development benefit. The Tax Incentive Review Council processes and monitors the status of each incentive and makes a recommendation to the local municipality as to the efficacy of the incentive.
In 2020, 20 municipalities throughout Franklin County had active tax incentives that required review. Thereview consisted of 532 abated or TIF projects. For tax year 2020, there were a total of 4,070 abated
parcels in the county, with 447 parcels returning to the tax rolls and 482 parcels becoming abated.
This 2020 TIRC report is a compilation of the incentives that exist throughout the county and the dataused to evaluate each existing incentive. Tax incentives have a role in developing our communities, but
we must ensure they are transparent and are providing the benefits promised to our communities.
KEY FACTS ABOUT THE 2020 TIRC MEETINGS IN FRANKLIN COUNTY:
Total Number of Abated Projects Reviewed: 324
Total Number of TIF Projects Reviewed: 208
Total Reported Number of Jobs Created or Retained: 35,976
Total Reported Payroll: $1,864,514,834.00
Total Reported Real Estate Investment: $3,450,789,664.00
Total Foregone Tax: $108,073,260.95
Previously in 2017 the Franklin County Auditor’s office released a report that concluded, among other analysis, that the existing property tax abatements resulted in a tax savings in the annual tax bill for a residential property owner.
E X E C U T I V E S U M M A R Y
3
Along with information included in this report,a new web tool on tax incentives can be found at
www.franklincountyauditor.com/tirctool for use by residents of Franklin County to see where incentives are used in the county and the primary source documents that created these incentives.

I N T R O D U C T I O N
State and local governments use a variety of tax incentives to attract and retain business investment, createjobs, reduce blight, and pursue other goals. These programs are widely used in Franklin County, with 20
separate municipalities having at least one tax incentive program at the conclusion of 2019.
While tax incentives can provide for economic growth, transparency is needed to ensure that taxpayers aregetting the deal they were promised. The expectation for each property tax incentive that has been granted
is some increase in property value, investment, employment and/or payroll, or other economic development benefit. The Tax Incentive Review Council processes and monitors whether a promised increase occurs.
All data in this 2020 report has been provided by the individual municipalities to the 2020 TIRC. FranklinCounty Auditor’s Office (FCAO) staff has aggregated the data in some instances to assist in clarity. The
meeting packets for each municipality are included and contain all reports provided to the TIRC.
The Ohio Revised Code requires that each municipality utilizing tax incentives must review these incentivesannually. The municipalities are charged with forming their TIRC each year. Statute names the County
Auditor as chair of each TIRC and appoints representatives from impacted townships and school districts, as well as citizens to serve as part of this annual review.
There is always a discussion as to whether the tax incentive was needed to have the growth occur. Determiningthis is often difficult — if not impossible. While the TIRC cannot determine if the bargain should have been
struck to begin with, it can help ensure that the promises of the bargain are met.
Included in this report is a summary of the 2020 TIRC reporting as well as a review of the tax incentives and therole of the TIRC. In addition, the report contains a sample of the TIRC progress report required for submission
by each municipality to the TIRC members. While the depth and size of these vary based on municipality and the complexity of the tax incentives they utilize, all packets have the same general format.
BELOW IS A LIST OF WHAT YOU WILL FIND.Agenda — Including membership roster, minutes from the prior meeting.
TIRC progress report — Municipalities fill these out for each abatement they have. This includes historical information (in some cases photos) and comparison of the most recent data with the terms of the agreement. This side-by-side comparison allows taxpayers to see if the deal is being met.
TIF report — Municipalities provide a report for each TIF project they have. This includes collection and expenditure of funds. Please note that a TIF project will have more than one parcel within it — for example, a municipality may include all commercial parcels on a strip of road and use the funds to upgrade street lights and sewage.
Ordinance — By ORC, the municipality’s legislative body (city/village council or township trustees) must accept or amend the TIRC’s recommendations. These ordinances are accepting the 2019 TIRC recommendations. The 2020 ordinances are being passed currently.
This report seeks to promote transparency and accountability by letting Franklin County residents see how taxincentives are working in their community. By providing this information, taxpayers can see for themselves
how incentives are working and can determine if they benefit their community.
4

F R A N K L I N C O U N T Y 2 0 2 0 T I R C R E P O R T I N G
*All population figures are 2019 estimates from the U.S. Census Bureau. Under the OhioRevised Code, counties can are eligible to create tax incentive programs in unincorporatedareas. They do this via legislation utilizing the same process as other municipalities.
Number of Municipalities Required to Hold a TIRC: 20
Number of Abatements by Municipality (and Municipality Population*) Holding a TIRC in 2020:
Bexley — 3 (pop. 13,770)
Canal Winchester — 15 (pop. 8,818)
Columbus — 82 (pop. 898,553)
Dublin — 1 (pop. 49,037)
Franklin County Commissioners — 6 (county pop. 1,316,756)
Gahanna — 27 (pop. 35,483)
Grandview Heights — 3 (pop. 8,333)
Grove City — 85 (pop. 41,820)
Groveport — 33 (pop. 5,621)
Hilliard — 11 (pop. 36,534)
New Albany — 17 (pop. 10,933)
Obetz — 13 (pop. 5,196)
Upper Arlington — 1 (pop. 35,366)
Urbancrest — 18 (pop. 993)
Westerville — 4 (pop. 41,103)
Whitehall — 3 (pop. 18,926)
Worthington — 2 (pop. 14,692)
Total Number of Abated Projects Reviewed: 324
Total CRA Abated Parcels: 4,021
Total EZ Abated Parcels: 49
Total CRA Foregone Tax: $101,000,621
Total CRA Abated Value: $3,524,601,100
Total EZ Foregone Tax: $7,072,639.11
Total EZ Abated Value: $242,455,400
Total Reported Number of Jobs Created or Retained: 35,976
Total Reported Payroll: $1,864,514,834
Total Reported Real Estate Investment: $3,450,789,664
Total Number of TIF Projects Reviewed: 208
Total Number of TIF Parcels (as of Dec. 31, 2019): 21,068
5
K E Y F E A T U R E S O F2 0 2 0 T A X I N C E N T I V E S
Community Reinvestment Areas, Enterprise Zones, and TIFs
While there are a variety of tax incentives and other development programs available to municipalitiesacross Franklin County, TIRCs monitor three specific kinds of programs — Community Reinvestment
Areas (CRAs), Enterprise Zones (EZ), and Tax Increment Finance (TIF) projects. CRAs and EZs can be established either by counties or municipalities.
Community Reinvestment Areas provide real property tax exemptions to property owners who makeimprovements to their property. CRAs are available for residential, commercial, and industrial remodeling
or new construction. The regulation for CRAs was changed dramatically in the mid-1990s. For that reason, you will see CRAs labeled pre- and post-1994. That tells us under what set of programing rules the abatement was created.
Pre-1994 CRAs designated specific geographic regions for eligibility. For example, a pre-1994 CRAmight designate all of the parcels in a historic downtown area as eligible and be used to maintain local
businesses and the historic characteristics of that specific geographic area. By contrast, post-1994 CRAs designate specific projects for eligibility and might be geared toward encouraging a specific corporate headquarters to come to your area regardless of the exact geographic location in your community. These post-1994 CRAs have specific agreements for each project. The agreements contain terms such as what percentage of tax is abated, the number of years the abatement lasts, requirements for job creation or retention, total payroll dollars, and total real estate investment.
Although the law was changed in 1994, pre-1994 CRA zones still exist because the zones created canexist indefinitely. The clock for the CRA does not start until an abated project begins. The abatements are
time-limited but the zones themselves can exist indefinitely. While these zones still exist, no new pre-1994 CRA zones may be established.
Post-1994 CRAs are more flexible in terms of geographic location and amount of tax abated but have stricterproject requirements. For example, property tax abatement for residential remodeling must be 100 percent
for a pre-1994 CRA but can be any percentage up to 100 percent for a post-1994 CRA. However, post-1994 CRAs must have an agreement that includes details on promised real estate investment (construction or remodeling investment), new or retained jobs, and estimated payroll. In addition, if the abatement is over 50%, local school boards must also approve the agreement.
The Enterprise Zone program offers companies property tax exemption on new real property. Exemptionsare granted only for commercial and industrial properties; residential properties are not eligible. EZs can
either be established as distressed-based zones or non-distressed-based zones. They can be designated either by a city or by a county. Once a zone is certified, a municipality or county can enter agreements with qualifying enterprises for incentives tied to investment and hiring.
ATIF project designates a parcel or multiple parcels as within a project. They are established by legislationfrom the appropriate local government. TIFs are different than an abatement because they do not change
the total amount of money a taxpayer pays. A TIF instead changes how that money is distributed once it is collected. A common example of this would be utilizing a TIF for infrastructure improvements. A community may want to improve sidewalks and street lights, so it makes upgrades by taking out a loan. Then for each year of the TIF a certain portion of its collected real estate taxes will be earmarked toward paying off the loan. While it does not impact the bill an individual property owner pays, the redistribution does impact the amount of funding received by property-tax-dependent organizations like schools, libraries, or senior citizen levies.
Additional information about these and other tax incentive programs as well as historical data can be foundon our website.
6
7
Enterprise Zones
Tax Increment Financing
Community Reinvestment Areas
R E V I E W O F T A X I N C E N T I V E S& T H E R O L E O F T H E T I R C
The expectation for each property tax incentive granted is some increase in property value, investment,employment and/or payroll, or other economic development benefit. The concept is simple — but for this tax
incentive the growth would not have occurred. While the concept is straightforward, what is much more difficult to determine is whether such an economic impact would have taken place absent the incentive. While tax policy certainly impacts where a business decides to locate or expand, it is not the only factor involved. For example, ties to a local community, the ability to get the labor needed, or natural resources also drive business decisions. Additionally, items other than pure growth can drive a local government’s decision to utilize tax incentives. Examples of this include a policy decision to maintain a historic downtown core of local businesses or the need to attract a grocery store to a community that currently exists in a food desert. These are both worthy policy goals but tracking and measuring them can prove difficult and subjective in nature.
Per the Ohio Revised Code, municipalities must provide the TIRC with “any information necessary to performits review.” In Franklin County, a “progress report” is filled out annually on each incentive and submitted to the
TIRC. These progress reports include information on scope of project, type of incentive, jobs created, payroll, and real estate investment. For TIFs municipalities provide information on collections, expenditures, and fund balances. This information is available in this report by opening up the TIRC Meeting Packet for each municipality. (See page 10 for a key on how to read the progress reports included in this report.)
Each year the TIRC reviews the prior tax year’s performance data for each incentive. This data is collected andcompiled by the municipality and provided to the members of the TIRC.
For abatements, the data provided shows whether the entity receiving the tax abatement is complying with theterms of the agreement. Simply put, is the company receiving the tax break doing what it said it was going to
do? Has it hired the employees it said it would? Has it invested in construction in the way it promised? The TIRC receives information on the number of jobs created or retained, total payroll, real estate investment (new structures or upgrades), and construction payroll.
After reviewing this information, a recommendation is made to find the agreement either in compliance or not incompliance. If the terms of the agreement are substantially being met, the members of the TIRC will vote to
find the agreement in compliance. That means that the business getting the tax abatement has met its part of the bargain.
Sometimes, the terms of agreement are not being met and, in such cases, the TIRC would recommend to findthe agreement not in compliance. When a motion for non-compliance is made, it contains a recommended next
step for the municipality. Those next steps vary based on the specific situation. If this is the first time there has been a problem or if the business is close to meeting the terms of the agreement, the recommendation might be to reach out and see what assistance can be provided to help the project meet the original goals. If the project is consistently off target, the TIRC might recommend modification of the original agreement. For example, if a property is 100% abated but regularly only meets 75% of the terms of the agreement, the recommendation might be to change the tax abatement from 100% to 75% and make the goals 75% of the original agreement, thus in line with what is actually happening with the project. Finally, in extreme cases, the TIRC may recommend the municipality cancel the abatement altogether.
Once the TIRC makes recommendations, they are presented to the municipality’s legislative body for acceptance,rejection, or modification. The legislative body must vote on the TIRC’s recommendations within 60 days of
that municipality’s TIRC meeting. The Auditor’s office tracks the passage of the reports as well as any required follow-up by the municipality in regard to the previous year’s TIRC recommendations. As the chair of every TIRC in Franklin County, the Auditor is able to see how incentives are being used across our communities and collects important information on the performance of these programs. To further our goal of transparency in government, we have compiled the performance data that was collected from the most recent TIRC meetings.
8

R E V I E W O F T A X I N C E N T I V E S & T H E R O L E O F T H E T I R C
Franklin County TIRC Progress Report KeyProgress reports are for post-1994 CRA and EZ abatements only
General information: Name of the municipality holding the TIRC, the date of the TIRC meeting
Information on the company receiving the abatement
Information on the abatement terms and a history of the project including a photo of the project
Compliance history for the abatement, which indicates if this project has historically stayed on track with agreement terms
Agreement benchmarks – These are the terms that must be met per the abatement agreement. They include jobs retention/creation, payroll, and real estate investment.
As verified – This is the data provided by the abatement recipient to the municipality. As part of the terms of abatements, companies must provide municipalities and the state with certain data. The data provided should match up with agreement benchmarks, thus providing a picture of whether the project is on track to meet goals.
Notes – This allows a municipality to provide any additional information about the project it thinks is important for the TIRC to know about this project.
TIRC PROGRESS REPORTName of TIRC:
Community Reinvestment Area:
Company Name:
Project Details/History:
Compliance History:
In Compliance
In Compliance
AGREEMENT BENCHMARKS
Real Estate Only Investment:
Investment Completion Date:
Number of Jobs Retained:
Payroll Dollars Retained:
Number of New Jobs Created:
New Yearly Payroll Created:
Jobs/Payroll Created By:
Building Description/Use:
Community Involvement:
Other Agreement Benchmarks:
Date of TIRC:
General Agreement Terms
CRA Type: New Construction 0.0%
No. Years
Tenants:
Parcel #(s):
AS VERIFIED
Real Estate Only Invested:
Date Investment Completed:
Actual Retained Jobs: Payroll
Dollars Retained: Number of
New Jobs Created: New
Payroll Dollars Created:
Total Appraised Value:
Total Value Abated:
Annual Tax Paid:
Foregone Tax:
Delinquent Tax:
Notes: Vacancies___________ 9
Sample TIRC
Progress Report

E C O N O M I C & F I S C A L I M P A C TO F 2 0 2 0 T I R C
10
As noted earlier and in the 2017 Lincoln Institute of Land Policy evaluation, it is difficult to discern whether an economicdevelopment project would have occurred but for the provided incentive.
When companies are deciding where to conduct their business, factors including workforce needs, availability ofresources, and connections to the community are as much a part of the decision as potential tax incentives. While
TIRCs cannot answer the question of whether incentives were required to create and attract these developments, the review process can show direct and indirect impacts on communities. In addition, competition between neighboring communities across Franklin County to attract companies and developments can be fierce.
What can currently be analyzed is the total foregone property tax from abatements, the total jobs created and retained,and payroll associated with the projects. For 2020, 4070 parcels in Franklin County received, or were continuing
to receive, a tax abatement. These abatements resulted in $110 million in foregone tax but also created or retained nearly 36,000 jobs and almost $1.9 billion in payroll. Abatements are responsible for more than just property taxes lost. Bringing new or higher-paying jobs brings increased income taxes based on retained or created payroll. Sales tax revenues grow from construction materials needed to build and construct the new development. Multiple projects in the county have also become destinations, thus drawing in additional visitors to the region in a way that is difficult to directly calculate but still provides an economic benefit to Franklin County communities. The businesses, investments, and long-term increase in taxable property within a community from these projects will persist after the immediate cost of the abatement has ended. In 2020, just under $3.5 billion in real estate investment has resulted in more than $3.75 billion of value currently abated, but forever part of the fabric of our communities.
As noted in the 2017 Lincoln Institute of Land Policy evaluation, “What is much more difficult to ascertain is whether such aneconomic impact would have taken place absent the property tax abatement. For example, consider an entrepreneur with
strong family ties to a community in the Columbus metro area. If that entrepreneur were considering a business opportunity, it might be a foregone conclusion that the establishment of the new business occurs in that community. For that entrepreneur, a property tax abatement would be a welcome, but certainly not a decisive, factor in his or her location decision. On the other hand, an entrepreneur with no family ties to the Columbus area, making decisions about the location of generic office space, might find property tax abatement an important determinant of a location decision. Determining whether property tax abatements on balance are causing firms to locate in a certain community and thus increase property value is a question beyond the realm of the TIRC process.”
The 2017 study and subsequent regression analysis found “that the use of property tax abatements in Franklin Countydid have a positive impact on property values.” For example, in school districts we found that a one-percentage-point
increase in the use of CRA and EZ abatements as a percentage of the market value of a Franklin County school district’s property exerted about a 1.5 percent increase in the total market value of the school district’s property.
Again, as noted in the Lincoln evaluation, “although seldom recognized in the popular press, providing tax incentivesfor economic development can have either a positive or negative impact on the community providing the abatements
(see Kenyon, Langley, and Paquin 2012). As we have previously mentioned, a crucial distinction is whether the activity the abatement (or other incentive) is designed to stimulate would have occurred if the abatement had not been offered. If it clearly would not have, the positive side of the abatement is the revenue gain from expanded economic activity attributable to the incentive which yields increased property tax revenue and/or reduced property tax rates. If the activity attributable to an abatement would have occurred even without the abatement, then a negative side of abatement is a loss in taxable property value and the subsequent loss in property tax revenue and/or increase in the rate of property taxation this necessitates. Other potential effects are increased public service costs due to the new businesses attracted or the potential for a multiplier effect whereby attraction of one business in turn attracts other businesses.”
The 2020 TIRC process builds upon the prior work of the Franklin County Auditor’s Office to understand and presentthe broader impact of incentives. A 2020 review found, “This analysis has made clear that there are both benefits and
significant costs in granting incentives. There are also costs in not doing so.” Moving forward, the TIRC for each community will continue to review, analyze, and oversee the implementation of incentive programs. As data becomes more readily available, the Franklin County Auditor’s Office will continue to provide information to the businesses and residents of Franklin County on the use and efficacy of various incentive programs across the county.

Tax incentives continue to be widely used throughout the county. In addition, the majority of the projects are CRAs,and upon review, the majority of projects are meeting the goals set forth in the initial agreement as passed by the
local municipality.
For those projects that are not meeting the goals set forth in the initial agreement, proactive steps are being takento try to ensure taxpayers are getting the benefits they agreed to. These steps vary by municipality and situation
but for 2020 included written reminders of agreement terms and meetings to discuss renegotiation of the agreements to better reflect the reality of the project. Businesses were also asked to submit plans to bring themselves into compliance. Over the next several months, economic development staff within the various municipalities will work to address issues identified by the TIRC in the hopes of improving the return on investment for citizens.
As these tax incentives continue to be used throughout our communities, your Franklin County Auditor’s officeremains committed to expanding transparency of their use and impact. Tax incentives are not automatically good
or bad but are merely a tool in the tool kit for creating economic growth and sustainability. The key to the proper use of tax incentives is helping taxpayers understand the agreements and giving them the ability to monitor the incentives’ performance.
The information in this report will allow Franklin County residents to see what incentives have been created on theirbehalf, and whether they provide a benefit that improves their community. It is our goal to promote transparency
and accountability for the use of tax incentives to the residents and businesses of our county.
11
C O N C L U S I O N

BexleyTotal Abatements by Type
• CRAs — 3
Total Reported Jobs Created/Retained — 111
Total Reported Payroll — $7,038,126.00
Total Reported Real Estate Investment —
$30,250,500.00
Total TIF Projects — 1
2020 TIRC Meeting Packet
Blendon TownshipTotal Abatements by Type
• Pre-1994 CRAs — 0
• CRAs — 0
• EZ — 0
Total TIF Projects — 1
2020 TIRC Meeting Packet
Canal WinchesterTotal Abatements by Type
• Pre-1994 CRAs — 15
• CRAs — 0
• EZ — 0
Total Reported Jobs Created/Retained — 648 Total Reported Payroll — N/A
Total Reported Real Estate Investment — N/A Total TIF Projects — 1
2020 TIRC Meeting Packet
ColumbusTotal Abatements by Type
• Pre-1994 CRAs — 0
• CRAs — 10
• EZ — 72
Total Reported Jobs Created/Retained — 13,183
Total Reported Payroll — $1,033,880,108.00
Total Reported Real Estate Investment — $1,119,797,598.00
Total TIF Projects — 55
2020 TIRC Meeting Packet
T I R C R E P O R T S B Y M U N I C I P A L I T Y
12
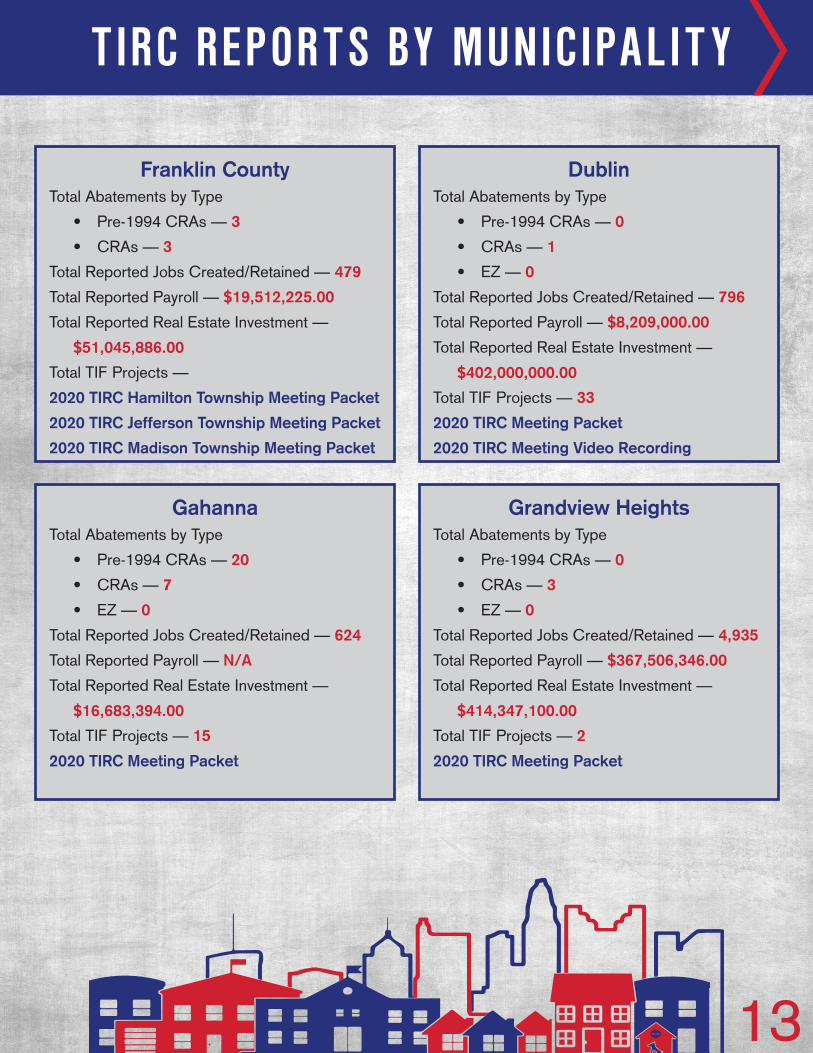
GahannaTotal Abatements by Type
• Pre-1994 CRAs — 20
• CRAs — 7
• EZ — 0
Total Reported Jobs Created/Retained — 624
Total Reported Payroll — N/A
Total Reported Real Estate Investment —
$16,683,394.00
Total TIF Projects — 15
2020 TIRC Meeting Packet
Grandview HeightsTotal Abatements by Type
• Pre-1994 CRAs — 0
• CRAs — 3
• EZ — 0
Total Reported Jobs Created/Retained — 4,935
Total Reported Payroll — $367,506,346.00
Total Reported Real Estate Investment —
$414,347,100.00
Total TIF Projects — 2
2020 TIRC Meeting Packet
Franklin CountyTotal Abatements by Type
• Pre-1994 CRAs — 3
• CRAs — 3
Total Reported Jobs Created/Retained — 479
Total Reported Payroll — $19,512,225.00
Total Reported Real Estate Investment —
$51,045,886.00
Total TIF Projects —
2020 TIRC Hamilton Township Meeting Packet
2020 TIRC Jefferson Township Meeting Packet
2020 TIRC Madison Township Meeting Packet
DublinTotal Abatements by Type
• Pre-1994 CRAs — 0
• CRAs — 1
• EZ — 0
Total Reported Jobs Created/Retained — 796
Total Reported Payroll — $8,209,000.00
Total Reported Real Estate Investment —
$402,000,000.00
Total TIF Projects — 33
2020 TIRC Meeting Packet
2020 TIRC Meeting Video Recording
T I R C R E P O R T S B Y M U N I C I P A L I T Y
13

Grove CityTotal Abatements by Type
• Pre-1994 CRAs — 85
• CRAs — 0
• EZ — 0
Total Reported Jobs Created/Retained — N/A
Total Reported Payroll — N/A
Total Reported Real Estate Investment — N/A
Total TIF Projects — 5
2020 TIRC Meeting Packet
GroveportTotal Abatements by Type
• Pre-1994 CRAs — 33
• CRAs — 0
• EZ — 0
Total Reported Jobs Created/Retained — 5,472
Total Reported Payroll — N/A
Total Reported Real Estate Investment — N/A
Total TIF Projects — 3
2020 TIRC Meeting Packet
HilliardTotal Abatements by Type
• Pre-1994 CRAs — 0
• CRAs — 11
• EZ — 0
Total Reported Jobs Created/Retained — 657
Total Reported Payroll — $57,921,994.00
Total Reported Real Estate Investment —
$554,495,200.00
Total TIF Projects — 42
2020 TIRC Meeting Packet
Jefferson TownshipTotal Abatements by Type
• Pre-1994 CRAs — 0
• CRAs — 0
• EZ — 0
Total TIF Projects — 3
2020 TIRC Meeting Packet
T I R C R E P O R T S B Y M U N I C I P A L I T Y
14
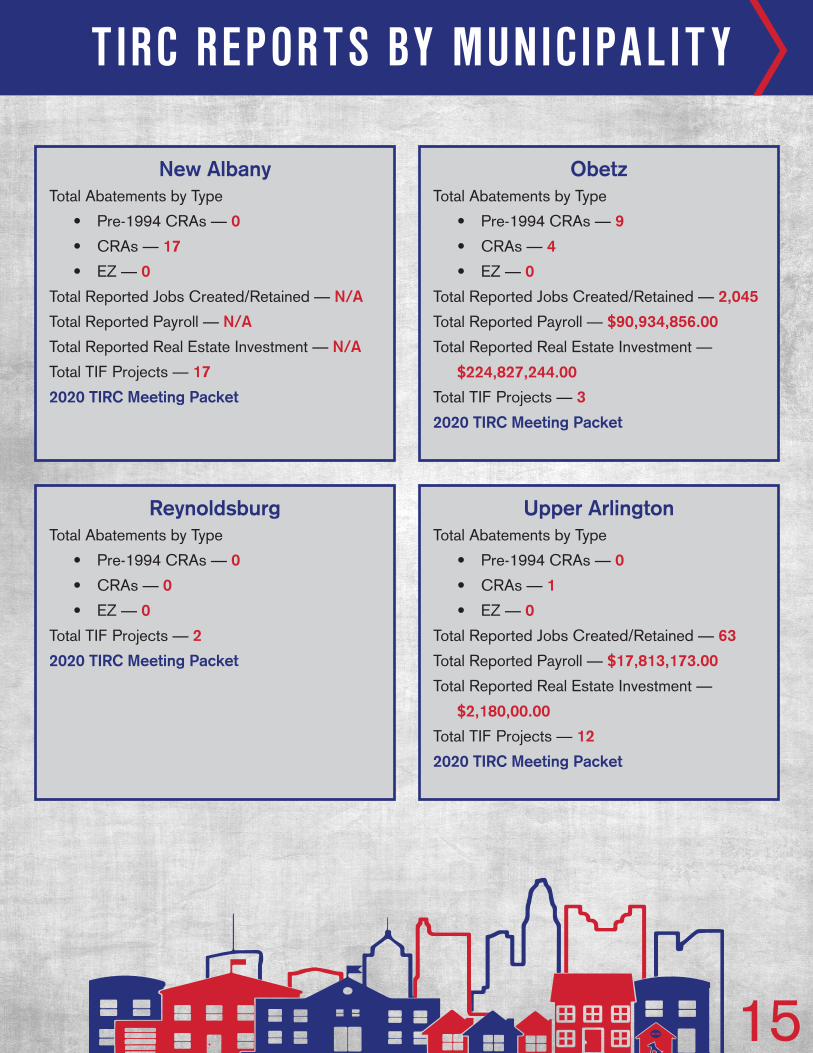
New AlbanyTotal Abatements by Type
• Pre-1994 CRAs — 0
• CRAs — 17
• EZ — 0
Total Reported Jobs Created/Retained — N/A
Total Reported Payroll — N/A
Total Reported Real Estate Investment — N/A
Total TIF Projects — 17
2020 TIRC Meeting Packet
ObetzTotal Abatements by Type
• Pre-1994 CRAs — 9
• CRAs — 4
• EZ — 0
Total Reported Jobs Created/Retained — 2,045
Total Reported Payroll — $90,934,856.00
Total Reported Real Estate Investment —
$224,827,244.00
Total TIF Projects — 3
2020 TIRC Meeting Packet
ReynoldsburgTotal Abatements by Type
• Pre-1994 CRAs — 0
• CRAs — 0
• EZ — 0
Total TIF Projects — 2
2020 TIRC Meeting Packet
Upper ArlingtonTotal Abatements by Type
• Pre-1994 CRAs — 0
• CRAs — 1
• EZ — 0
Total Reported Jobs Created/Retained — 63
Total Reported Payroll — $17,813,173.00
Total Reported Real Estate Investment —
$2,180,00.00
Total TIF Projects — 12
2020 TIRC Meeting Packet
T I R C R E P O R T S B Y M U N I C I P A L I T Y
15

WhitehallTotal Abatements by Type
• Pre-1994 CRAs — 0
• CRAs — 3
• EZ — 0
Total Reported Jobs Created/Retained — 155
Total Reported Payroll — $11,632,345.00
Total Reported Real Estate Investment —
$19,900,000.00
Total TIF Projects — 7
2020 TIRC Meeting Packet
WorthingtonTotal Abatements by Type
• Pre-1994 CRAs — 0
• CRAs — 2
• EZ — 0
Total Reported Jobs Created/Retained — 40
Total Reported Payroll — $2,263,338.00
Total Reported Real Estate Investment —
$6,752,800.00
Total TIF Projects — 7
2020 TIRC Meeting Packet
UrbancrestTotal Abatements by Type
• Pre-1994 CRAs — 0
• CRAs — 18
• EZ — 0
Total Reported Jobs Created/Retained — 977 Total Reported Payroll — $42,553,242.00 Total Reported Real Estate Investment —
$47,767,300.00
Total TIF Projects — 0
2020 TIRC Meeting Packet
WestervilleTotal Abatements by Type
• Pre-1994 CRAs — 0
• CRAs — 4
• EZ — 0
Total Reported Jobs Created/Retained — 228
Total Reported Payroll — $14,290,222.00
Total Reported Real Estate Investment —
$23,808,241.00
Total TIF Projects — 2
2020 TIRC Meeting Packet
T I R C R E P O R T S B Y M U N I C I P A L I T Y
16