tax cuts and jobs act of 2017 cuts and jobs act of 2017 december 19, 2017 michael cembalest chairman...
TRANSCRIPT

Tax Cuts and Jobs Act of 2017
December 19, 2017
Michael Cembalest Chairman of Market and Investment Strategy, J.P. Morgan Asset & Wealth Management
INVESTMENT AND INSURANCE PRODUCTS ARE: ● NOT FDIC INSURED ● NOT INSURED BY ANY FEDERAL GOVERNMENT AGENCY ● NOT A DEPOSIT OR OTHER OBLIGATION OF, OR GUARANTEED BY, JPMORGAN CHASE BANK, N.A. OR ANY OF ITS AFFILIATES
● SUBJECT TO INVESTMENT RISKS, INCLUDING POSSIBLE LOSS OF THE PRINCIPAL AMOUNT INVESTED

1
Tax Cut and Jobs Act (TCJA): key provisions and timing
Individual tax provision Effective date Type
Individual tax rates 1/1/18 Sunsets (12/31/25)
Higher standard deduction 1/1/18 Sunsets (12/31/25)
Itemized deduction limits 1/1/18 Sunsets (12/31/25)
Lower rate on pass through entities 1/1/18 Sunsets (12/31/25)
Doubling of gift/estate/GST tax exemptions 1/1/18 Sunsets (12/31/25)
Corporate tax provision Effective date Type
Lower corporate tax rate 1/1/18 Permanent
Expensing of capital equipment 9/28/17 Temporary; 100% expensing for 5 years, phased-out by 2026
Cap on business interest deduction 1/1/18 Permanent; EBITDA test for 2018-2021, stricter EBIT test thereafter
Territoriality 1/1/18 Permanent
Repatriation 12/31/17 One time tax (8% or 15.5%)

2
Today’s agenda
• What it means for the economy
• What it means for the stock market
• What it means for you
3
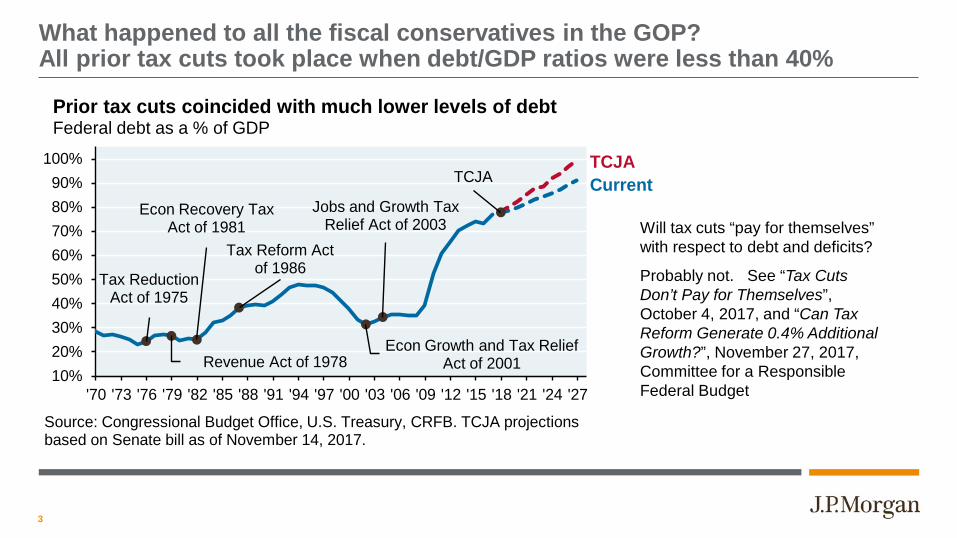
What happened to all the fiscal conservatives in the GOP? All prior tax cuts took place when debt/GDP ratios were less than 40%
Tax Reduction Act of 1975
Revenue Act of 1978
Econ Recovery Tax Act of 1981
Tax Reform Act of 1986
Econ Growth and Tax Relief Act of 2001
Jobs and Growth Tax Relief Act of 2003
TCJA
10%20%30%40%50%60%70%80%90%
100%
'70 '73 '76 '79 '82 '85 '88 '91 '94 '97 '00 '03 '06 '09 '12 '15 '18 '21 '24 '27
Source: Congressional Budget Office, U.S. Treasury, CRFB. TCJA projections based on Senate bill as of November 14, 2017.
Prior tax cuts coincided with much lower levels of debt Federal debt as a % of GDP
TCJACurrent
Will tax cuts “pay for themselves” with respect to debt and deficits?
Probably not. See “Tax Cuts Don’t Pay for Themselves”, October 4, 2017, and “Can Tax Reform Generate 0.4% Additional Growth?”, November 27, 2017, Committee for a Responsible Federal Budget

4
As a reminder, the budget deficit is already growing again, which is unusual for this point in the business cycle (when it is usually improving)
-$1,100
-$1,000
-$900
-$800
-$700
-$600
-$500
-$400
2013 2014 2015 2016 2017Source: US Treasury. November 2017.
An unusual late-cycle decline in the US federal budgetUS$ billion, rolling12 months

5
TCJA is one of the larger tax cuts since 1969, with the exception of 1981; however, some benefits fade over time while others sunset
Nov
-45
Apr
-48
Jan-
54Fe
b-64
Dec
-69
Dec
-71
Mar
-75
May
-77
Nov
-78
Aug
-81
Oct
-86
Aug
-97
Jun-
01M
ar-0
2M
ay-0
3Fe
b-09
2019
E
-4.0%
-3.5%
-3.0%
-2.5%
-2.0%
-1.5%
-1.0%
-0.5%
0.0%
Source: "A Narrative Analysis of Post-war Tax Changes," Romer and Romer. 2009. 2019E based on JCT scoring of Conference Agreement.
Tax Cuts as a share of GDP, 1945 - 2019E% of US nominal GDP

6
TCJA sprung from desire to cut corporate taxes and improve competitiveness, but individual tax cuts are now 3x as large. Tail wags dog.
-1,400 -1,000 -600 -200 200 600 1,000
Increased child tax credit
AMT modification
New brackets
Increase in std deduction
Lower pass through income
Repeal of itemized deductions
Personal exemption repeal
All other individual provisions
Net individual tax cut
Tax reform for individualsEstimated revenue effects of TCJA (2018-2027), US$ billionsTax reform for individualsEstimated revenue effects of TCJA (2018-2027), US$ billions
Source: Joint Committe on Taxation (based on Conference Agreement). 12/18/17.
-1,400 -1,000 -600 -200 200 600 1,000
21% corporate rate
100% bonus depreciation
Interest deduction limit
Net international provisions
All other domestic provisions
Net business tax cut
Source: Joint Committe on Taxation (based on Conference Agreement). 12/18/17.
Tax reform for businessesEstimated revenue effects of TCJA (2018-2027), US$ billions
7
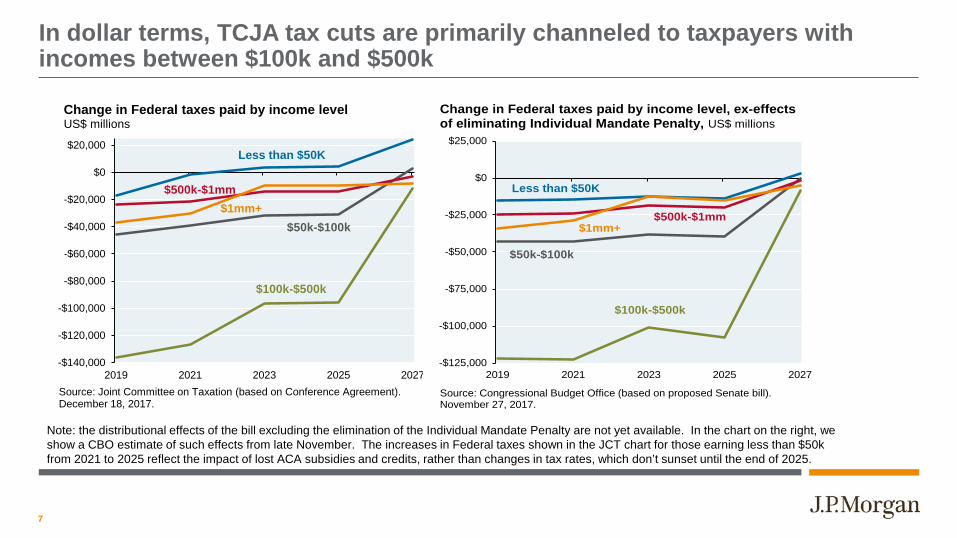
In dollar terms, TCJA tax cuts are primarily channeled to taxpayers with incomes between $100k and $500k
-$125,000
-$100,000
-$75,000
-$50,000
-$25,000
$0
$25,000
2019 2021 2023 2025 2027
Source: Congressional Budget Office (based on proposed Senate bill). November 27, 2017.
Change in Federal taxes paid by income level, ex-effects of eliminating Individual Mandate Penalty, US$ millions
Less than $50K
$500k-$1mm$1mm+
$50k-$100k
$100k-$500k
Note: the distributional effects of the bill excluding the elimination of the Individual Mandate Penalty are not yet available. In the chart on the right, we show a CBO estimate of such effects from late November. The increases in Federal taxes shown in the JCT chart for those earning less than $50k from 2021 to 2025 reflect the impact of lost ACA subsidies and credits, rather than changes in tax rates, which don’t sunset until the end of 2025.
-$140,000
-$120,000
-$100,000
-$80,000
-$60,000
-$40,000
-$20,000
$0
$20,000
2019 2021 2023 2025 2027Source: Joint Committee on Taxation (based on Conference Agreement). December 18, 2017.
Change in Federal taxes paid by income levelUS$ millions
Less than $50K
$500k-$1mm$1mm+
$50k-$100k
$100k-$500k

8
Larger percentage increases in after-tax income accrue to the top quintile and decile of taxpayers
Low
est q
uint
ile
Seco
nd q
uint
ile
Third
qui
ntile
Four
th q
uint
ile
Top
quin
tile
95-9
9 pe
rcen
tile
Top
1%
0.0%
0.5%
1.0%
1.5%
2.0%
2.5%
3.0%
3.5%
4.0%
Source: Urban Institute-Brookings Tax Policy Center. Based on Conference Agreement, 12/15/17. Includes impact of increased estate tax exemption.
Distribution of federal tax change by income quintileChange in after-tax income, 2018
9
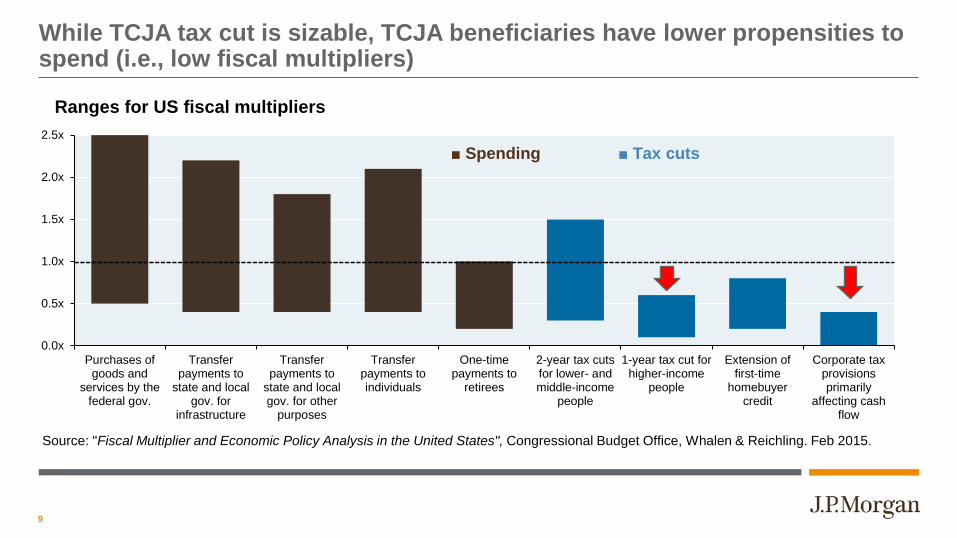
While TCJA tax cut is sizable, TCJA beneficiaries have lower propensities to spend (i.e., low fiscal multipliers)
0.0x
0.5x
1.0x
1.5x
2.0x
2.5x
Purchases ofgoods and
services by thefederal gov.
Transferpayments to
state and localgov. for
infrastructure
Transferpayments to
state and localgov. for other
purposes
Transferpayments toindividuals
One-timepayments to
retirees
2-year tax cutsfor lower- andmiddle-income
people
1-year tax cut forhigher-income
people
Extension offirst-time
homebuyercredit
Corporate taxprovisionsprimarily
affecting cashflow
Source: "Fiscal Multiplier and Economic Policy Analysis in the United States", Congressional Budget Office, Whalen & Reichling. Feb 2015.
Ranges for US fiscal multipliers
■ Spending ■ Tax cuts
10
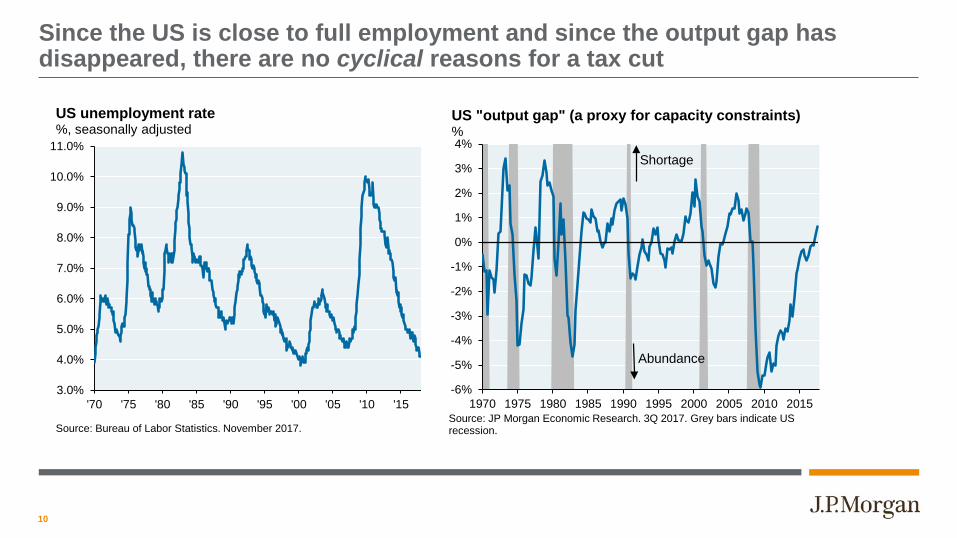
Since the US is close to full employment and since the output gap has disappeared, there are no cyclical reasons for a tax cut
3.0%
4.0%
5.0%
6.0%
7.0%
8.0%
9.0%
10.0%
11.0%
'70 '75 '80 '85 '90 '95 '00 '05 '10 '15
Source: Bureau of Labor Statistics. November 2017.
US unemployment rate%, seasonally adjusted
-6%
-5%
-4%
-3%
-2%
-1%
0%
1%
2%
3%
4%
1970 1975 1980 1985 1990 1995 2000 2005 2010 2015Source: JP Morgan Economic Research. 3Q 2017. Grey bars indicate US recession.
US "output gap" (a proxy for capacity constraints)%
Abundance
Shortage
11
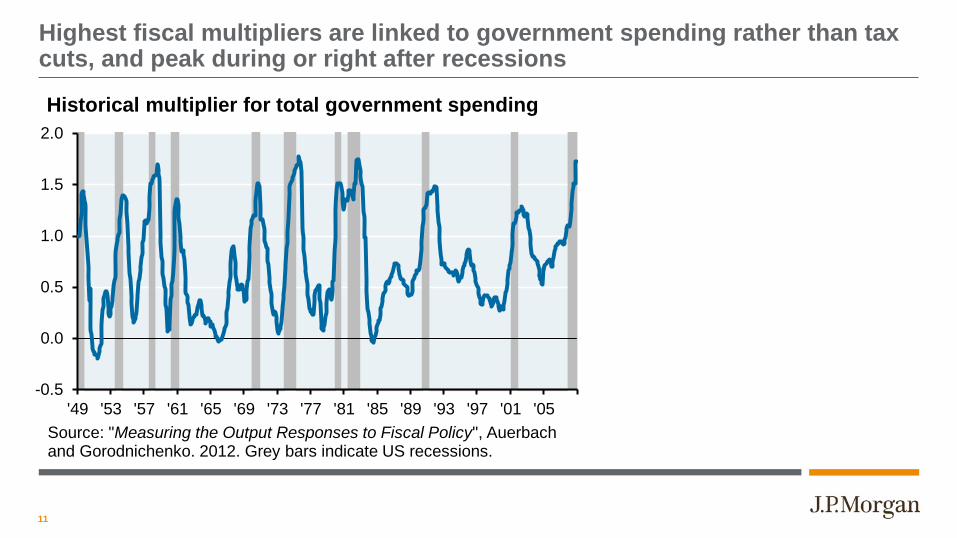
Highest fiscal multipliers are linked to government spending rather than tax cuts, and peak during or right after recessions
-0.5
0.0
0.5
1.0
1.5
2.0
'49 '53 '57 '61 '65 '69 '73 '77 '81 '85 '89 '93 '97 '01 '05
Historical multiplier for total government spending
Source: "Measuring the Output Responses to Fiscal Policy", Auerbach and Gorodnichenko. 2012. Grey bars indicate US recessions.
12
Given corporate and high income beneficiaries of the bill, and ample current liquidity, we don’t envision much of an immediate boost to GDP from TCJA
• We envision higher US GDP growth of ~3% in 2018, but are not making major changes to growth, capital spending or employment forecasts due to TCJA
• While the TCJA’s territorial system is more restrictive than in other countries, its anti-abuse provisions have been watered down
• Minimum tax on foreign profits only applies to “excess profits” over “routine levels”, and allow aggregation across jurisdictions*
• Larger projected Federal budget deficits and modestly higher interest rates in the long run
• Increased potential for interstate migration, and more pressure on “blue state” spending and unfunded pensions
* “Republican tax bills have too many loopholes for sending jobs overseas”, TheHill.com, Pozen (MIT), Rosenthal (Tax Policy Center), 11/29/2017
13
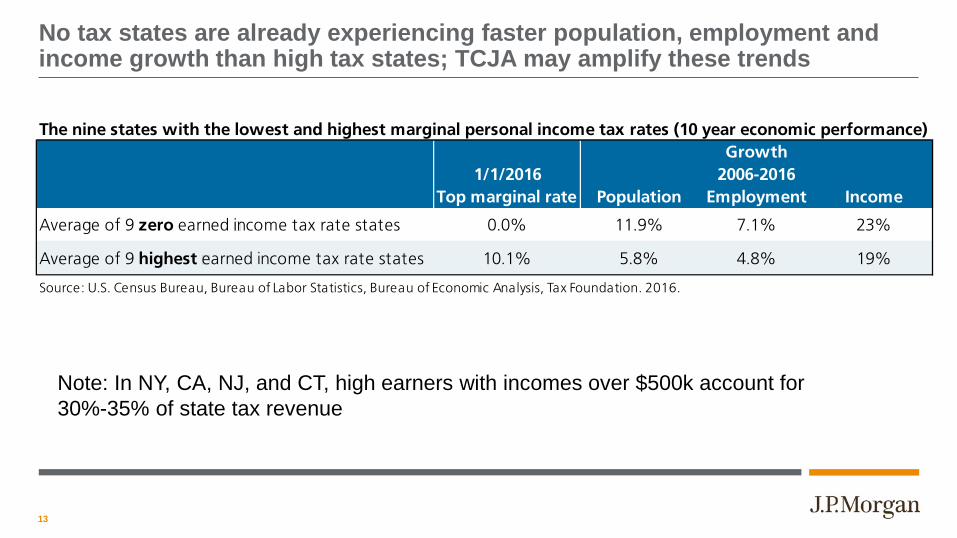
No tax states are already experiencing faster population, employment and income growth than high tax states; TCJA may amplify these trends
Note: In NY, CA, NJ, and CT, high earners with incomes over $500k account for 30%-35% of state tax revenue
The nine states with the lowest and highest marginal personal income tax rates (10 year economic performance)
1/1/2016Top marginal rate Population Employment Income
Average of 9 zero earned income tax rate states 0.0% 11.9% 7.1% 23%
Average of 9 highest earned income tax rate states 10.1% 5.8% 4.8% 19%
Source: U.S. Census Bureau, Bureau of Labor Statistics, Bureau of Economic Analysis, Tax Foundation. 2016.
Growth2006-2016

14
States with the largest unfunded pension and retiree healthcare obligations are often “blue” high-tax states, but there are exceptions
Link to our 2017 muni paper “The ARC & the Covenants”
State tax rate 5.0% 9.0% 7.0% 6.0% 8.3% 7.2% 5.8% 0.0% 5.1% 6.6% 13.3% 3.1%Clinton vote share 55% 55% 55% 33% 62% 48% 60% 43% 60% 53% 62% 47%
0%
5%
10%
15%
20%
25%
30%
35%
40%
45%
50%
IL NJ CT KY HI ME MD TX MA DE CA PA
Source: "The Arc and the Covenants 3.0: US cities and counties", JPMAM, Sep 2017.
12 states with the highest ratio of unfunded obligations to income% of state revenues required to pay interest on net direct debt, state share of unfunded pension and healthcare liabilities, and defined contribution plan payments

15
TCJA increases incentives to move for some individuals, but not others
Analysis assumes a move from a high tax state (10% state/local tax, 2% property tax) to low tax state (0% state/local tax, 1% property tax)
The incentive to move is based on the effective cost of state and local income and property taxes, which is reduced when they can be deducted against Federal taxes.
Under current law, the incentive reflects the interplay between the respective entry and exit points for the AMT in both states, and marginal tax rates.
Under the TCJA, the incentive is simpler, since it reflects the cap on deductibility across all ranges of income.
The gap between the two series shows the extent to which the TCJA increases incentives to move.
-12%
-10%
-8%
-6%
-4%
-2%
0%
$25k
$50k
$100
k$1
50k
$200
k$2
50k
$300
k$3
50k
$400
k$4
50k
$500
k$5
50k
$600
k$6
50k
$700
k$7
50k
$800
k$8
50k
$900
k$9
50k
$1,0
00k
$2,0
00k
$3,0
00k
$4,0
00k
Salaried workerChange in effective tax rate from moving from high tax to low tax state, %
Current
TCJA
income level
Less incentive

16
TCJA increases incentives to move for some individuals, but not others
Analysis assumes a move from a high tax state (10% state/local tax, 2% property tax) to low tax state (0% state/local tax, 1% property tax)
-12%
-10%
-8%
-6%
-4%
-2%
0%
$25k
$50k
$100
k$1
50k
$200
k$2
50k
$300
k$3
50k
$400
k$4
50k
$500
k$5
50k
$600
k$6
50k
$700
k$7
50k
$800
k$8
50k
$900
k$9
50k
$1,0
00k
$2,0
00k
$3,0
00k
$4,0
00k
Private equity principalChange in effective tax rate from moving, %
Current
TCJAincome level
Less incentiveThe incentive to move is based on the effective cost of state and local income and property taxes, which is reduced when they can be deducted against Federal taxes.
Under current law, the incentive reflects the interplay between the respective entry and exit points for the AMT in both states, and marginal tax rates.
Under the TCJA, the incentive is simpler, since it reflects the cap on deductibility across all ranges of income.
The gap between the two series shows the extent to which the TCJA increases incentives to move.
17
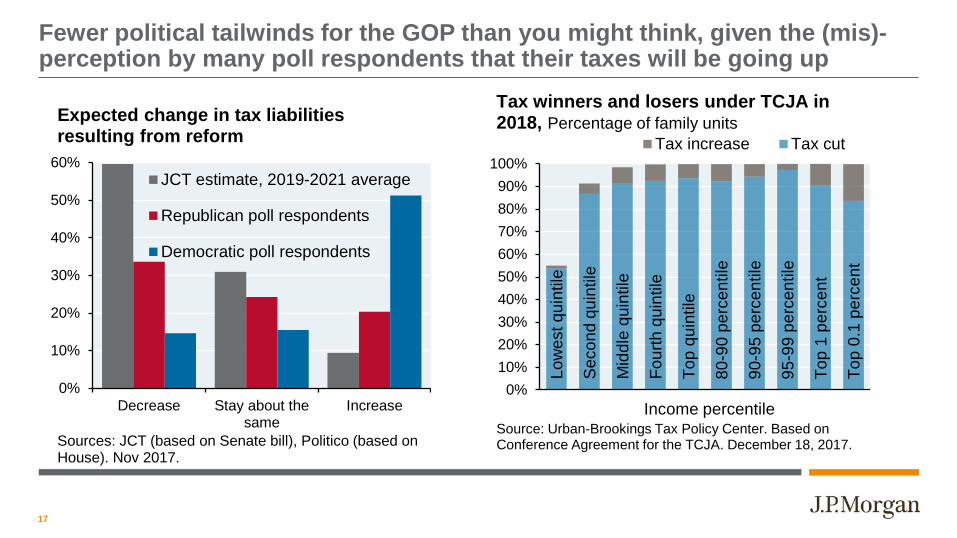
Fewer political tailwinds for the GOP than you might think, given the (mis)-perception by many poll respondents that their taxes will be going up
0%
10%
20%
30%
40%
50%
60%
Decrease Stay about thesame
Increase
JCT estimate, 2019-2021 average
Republican poll respondents
Democratic poll respondents
Sources: JCT (based on Senate bill), Politico (based on House). Nov 2017.
Expected change in tax liabilities resulting from reform
Low
est q
uint
ile
Sec
ond
quin
tile
Mid
dle
quin
tile
Four
th q
uint
ile
Top
quin
tile
80-9
0 pe
rcen
tile
90- 9
5 pe
rcen
tile
95-9
9 pe
rcen
tile
Top
1 pe
rcen
t
Top
0.1
perc
ent
0%10%20%30%40%50%60%70%80%90%
100%
Income percentile
Tax increase Tax cut
Source: Urban-Brookings Tax Policy Center. Based on Conference Agreement for the TCJA. December 18, 2017.
Tax winners and losers under TCJA in 2018, Percentage of family units

18
Today’s agenda
• What it means for the economy
• What it means for the stock market
• What it means for you

19
US equity markets are now pricing in benefits from tax reform Our sense is that 50%-60% is priced in as of today’s call
85
90
95
100
105
110
115
Nov-16 Jan-17 Mar-17 May-17 Jul-17 Sep-17 Nov-17
Source: JP Morgan Equity Strategy. December 15, 2017.
Markets starting to price in corporate tax reformOutperformance of tax cut winners vs losers, 11/8/2016 = 100

20
TCJA likely to result in 5%-8% EPS growth, since more of the Senate version prevailed during reconciliation
Tax scenario analysis: potential impact to S&P 500 EPSHOUSE plan SENATE plan
21% rate 21% rateA S&P 500 Consensus 2018 EPS $146.00 $146.00B + Reduction in corporate tax rate + $12.90 + $12.90C - Limiting interest expense deductibility - $1.00 - $2.80D - One-time repatriation tax on foreign earnings - $3.80 - $4.00E + Cash repatriation induced buybacks + $2.50 + $2.40F Total benefit from tax reform (B + C + D + E) + $10.60 + $8.50
Upside to consensus 2018 EPS + 7.3% + 5.8%G S&P 500 EPS impact (A + F) $156.60 $154.50H + Immediate expensing of capex (CF benefit) + $3.80 + $3.80I Total cash flow benefit (G + H) $160.40 $158.30Source: JP Morgan Equity Strategy. December 14, 2017.
The 5%-8% increase from the TCJA would be in addition to the 8%-10% increase in US EPS growth that we already project for 2018

21
EPS gains from the tax bill are focused on domestically oriented companies with large capital spending needs and normal levels of leverage
Source: “Assessing the Impact of the Proposed House Tax Plan”, JP Morgan Equity Strategy, 11/8/2017.
22
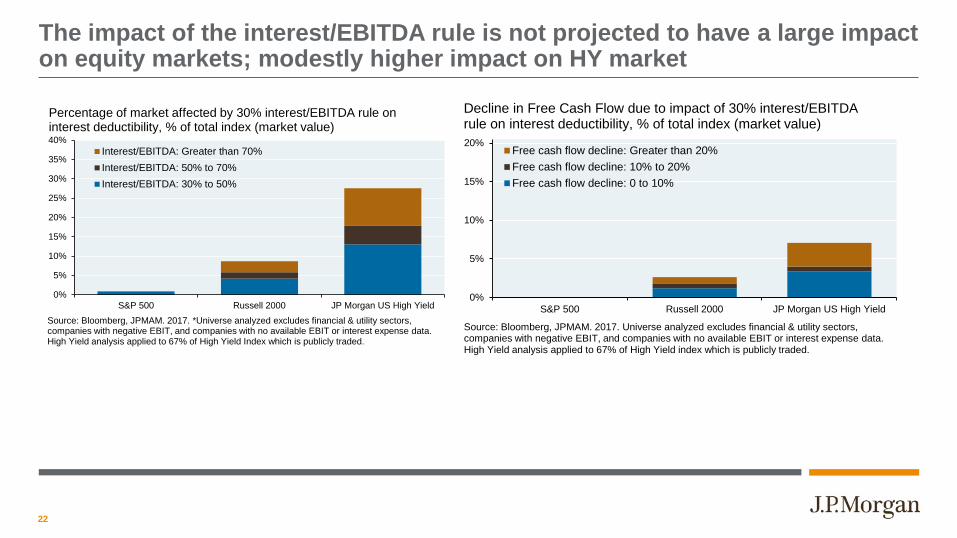
The impact of the interest/EBITDA rule is not projected to have a large impact on equity markets; modestly higher impact on HY market
0%
5%
10%
15%
20%
25%
30%
35%
40%
S&P 500 Russell 2000 JP Morgan US High Yield
Interest/EBITDA: Greater than 70%Interest/EBITDA: 50% to 70%Interest/EBITDA: 30% to 50%
Source: Bloomberg, JPMAM. 2017. *Universe analyzed excludes financial & utility sectors, companies with negative EBIT, and companies with no available EBIT or interest expense data. High Yield analysis applied to 67% of High Yield Index which is publicly traded.
Percentage of market affected by 30% interest/EBITDA rule on interest deductibility, % of total index (market value)
0%
5%
10%
15%
20%
S&P 500 Russell 2000 JP Morgan US High Yield
Free cash flow decline: Greater than 20%Free cash flow decline: 10% to 20%Free cash flow decline: 0 to 10%
Source: Bloomberg, JPMAM. 2017. Universe analyzed excludes financial & utility sectors, companies with negative EBIT, and companies with no available EBIT or interest expense data. High Yield analysis applied to 67% of High Yield index which is publicly traded.
Decline in Free Cash Flow due to impact of 30% interest/EBITDA rule on interest deductibility, % of total index (market value)
23
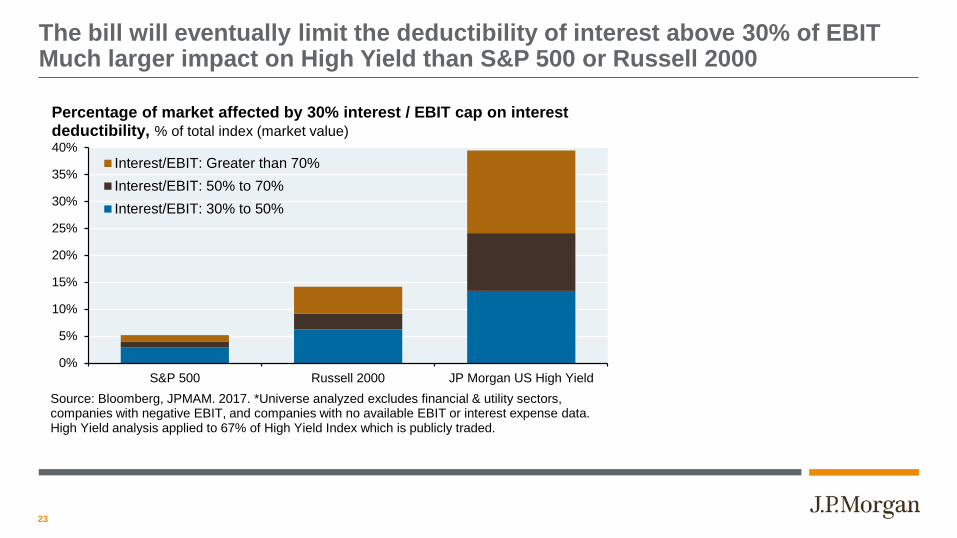
The bill will eventually limit the deductibility of interest above 30% of EBIT Much larger impact on High Yield than S&P 500 or Russell 2000
0%
5%
10%
15%
20%
25%
30%
35%
40%
S&P 500 Russell 2000 JP Morgan US High Yield
Interest/EBIT: Greater than 70%Interest/EBIT: 50% to 70%Interest/EBIT: 30% to 50%
Source: Bloomberg, JPMAM. 2017. *Universe analyzed excludes financial & utility sectors, companies with negative EBIT, and companies with no available EBIT or interest expense data. High Yield analysis applied to 67% of High Yield Index which is publicly traded.
Percentage of market affected by 30% interest / EBIT cap on interest deductibility, % of total index (market value)

24
Analyzing the impact on free cash flow from the new rule Much bigger negative impact on HY market than the S&P or Russell 2000
Risks would be magnified in the next downturn: • Interest/EBIT ratios will rise • Tax shield is reduced • Tax payments rise • Free cash flow falls further
Risks from linking interest deductibility to market variables: • Glover, Gomes and Yarons,
"Corporate Taxes, Leverage, And Business Cycles" (St. Louis Fed 2011): limiting interest deductibility increases default frequency and average credit spreads
0%
5%
10%
15%
20%
S&P 500 Russell 2000 JP Morgan US High Yield
Free cash flow decline: Greater than 20%Free cash flow decline: 10% to 20%Free cash flow decline: 0 to 10%
Source: Bloomberg, JPMAM. 2017. Universe analyzed excludes financial & utility sectors, companies with negative EBIT, and companies with no available EBIT or interest expense data. High Yield analysis applied to 67% of High Yield index which is publicly traded.
Decline in Free Cash Flow due to impact of 30% interest / EBIT cap on interest deductibility, % of total index (market value)

25
TCJA reduces marginal effective tax rates on new projects, improving US competitiveness
US
(Cur
rent
)
Mex
ico
Afric
a
Asia
-Oce
ania
Can
ada
Euro
pe
US
(TC
JA)
M. E
ast a
nd N
. Afri
ca
0%
5%
10%
15%
20%
25%
30%
35%
40%
Source: University of Calgary School of Public Policy, Mintz & Bazel. Corporate tax rates are GDP weighted. December 17, 2017.
Corporate tax rate%, combined central-sub-national corporate tax rates
US
(Cur
rent
)
Asia
-Oce
ania
Euro
pe
Can
ada
Mex
ico
US
(TC
JA)
Afric
a
M. E
ast a
nd N
. Afri
ca
0%
5%
10%
15%
20%
25%
30%
35%
40%
Source: University of Calgary School of Public Policy, Mintz & Bazel. Corporate tax rates are GDP weighted. December 17, 2017.
Marginal effective tax rate%, effective tax rate on new investment in manufacturing & services

26
Competitiveness improvements by sector
0% 5% 10% 15% 20% 25% 30% 35% 40% 45%
Aggregate
Other services
Communications
Wholesale trade
Retail trade
Oil and gas
Construction
Manufacturing
Forestry
Elect. power, gas & water
Transportation & storage
Current Tax RateTCJA
Source: "U.S. Tax Reform: Implications", University of Calgary School of Public Policy, Mintz. December 4, 2017.
Marginal effective tax rates by sector

27
Given lower tax rates and a 100% dividends received deduction, TCJA would reduce incentives for US companies to invert overseas
0
2
4
6
8
10
12
10%15%20%25%30%35%40%45%50%55%
'81 '83 '85 '87 '89 '91 '93 '95 '97 '99 '01 '03 '05 '07 '09 '11 '13 '15Source: Mercatus Center at George Mason University. 2016.Note: Pending inversions shown for 2016.
Tax rates and inversions out of the USCorporate income tax rate, % Number of US inversions
OECD ex-US
US
# of US inversions

28
What will companies do with repatriated cash?
0 10 20 30 40 50 60 70
Pay down debt
Share repurchases
M&A
Capex
Dividends
Fund pension
Other
Source: BoA Merrill Lynch Corporate Risk Management Survey. July 2017.
How would the proceeds of repatriated earnings be used?# of companies (N = 302)

29
Debt paydown is a popular answer, since rising foreign cash balances are often accompanied by rising debt
0%
50%
100%
150%
200%
250%
300%
2000 2002 2004 2006 2008 2010 2012 2014 2016
Source: Bridgewater Associates. November 2017.
Companies with large foreign cash balances% of trend EBITDA
Cash
Debt
Cash less debt

30
Since most companies are not cash constrained and credit markets are liquid, TCJA impact on capital spending is likely to be modest
• Debt paydown, stock buybacks and dividends likely to benefit. After 2004 repatriation holiday, a similar time of liquid credit and ample free cash flow, buybacks rose while hiring, R&D and capital spending were mostly unchanged
• Accelerated depreciation already available at a time of low interest rates, mitigating benefit of immediate expensing
• While the TCJA impact on capex may be modest, capex surveys are already elevated based on global business cycle improvement and positive response to deregulatory efforts
-5%
0%
5%
10%
15%
20%
25%
Onshore job growth R&D growth Increase in stockrepurchases
Top 15 repatriating companiesSource: US Senate Permanent Subcommittee on Investigations. 2011.
Repatriation holiday boosted buybacks, not jobs or R&DAverage increase in payrolls, R&D and buybacks for top 15 repatriating US multinational companies, 2005 to 2007
5%
10%
15%
20%
25%
30%
2010 2011 2012 2013 2014 2015 2016 2017
Source: JP Morgan Economic Research, Regional Fed surveys. Nov 2017.
Rising capital spending plans % of respondents planning to increase capital expenditures

31
Increased stock buybacks would be taking place at a time when growth in net equity supply is already low
-200
0
200
400
600
800
1,000
1,200
1,400
'99 '01 '03 '05 '07 '09 '11 '13 '15 '17
Source: MSCI, JP Morgan Equity Strategy. 2017.
Global net equity supplyUS$ bn per year, based on expansion of MSCI All country world

32
Today’s agenda
• What it means for the economy
• What it means for the stock market
• What it means for you

33
Key provisions: individual tax rates
Changes
Modest reductions to some tax brackets
Limitations on state income tax, property tax and mortgage deductions
Changes in AMT rules reducing its impact
Lower tax rate on “pass through” income
Increased exclusions for estate/GST/gift taxes
Like-kind exchanges limited to real property 0%
5%
10%
15%
20%
25%
30%
35%
40%
$0 $100,000 $200,000 $300,000 $400,000 $500,000 $600,000 $700,000
Current law brackets
TCJA brackets
Marginal tax rates and brackets
AMT changesAMT exemption increased from $86k to $109kAMT exemption phase-out level increased from $164k to $1,000,000
Source: JP Morgan Asset Management. 2017.
income level

34
Key provisions: individual tax rates
No Changes
Capital gains and qualified dividend taxation
ACA taxes on earned and unearned income
Traditional municipal bond exemption
Charitable contribution and business/investment interest deductions
401k plan and IRA contribution limits
Non qualified deferred compensation

35
Our interactive TCJA website
36
Our interactive TCJA website
While most taxpayers will see their effective tax rates decline in 2018, the details will depend on your deduction and income characteristics
• Example: for NY residents, there is a complex interplay among lower deductions, lower tax rates, extended brackets and changing AMT rules
We have created an interactive website to provide examples of the TCJA impact on different taxpayer types
• 20 different taxpayer scenarios included • Click here to visit our interactive website

37
Using our interactive effective tax rate website
• Step 1: select from 9 taxpayer types • Salaried worker, hedge fund principal, retiree, private equity principal, pass
through owner or investor, etc whose income characteristics differ (wages, unearned ordinary income, capital gains, pass through income, etc).
• Step 2: indicate high or low deductions • Applies to state/local tax rate, property tax rate, charitable contribution rate and
home price to income ratio
• Step 3: for pass through entity taxpayers, specify the degree of wage intensity of the pass through business (affects phase-out of the pass through deduction)
• Charts compare Current vs TCJA effective tax rates, and assess incentives to move under the TCJA

38
Some sample charts
For taxpayers with low deductions whose income is primarily wages and salaries, the benefits of TCJA are consistent across income levels
JPMorgan Chase & Co. and its affiliates do not provide tax, legal or accounting advice. This material has been prepared for informational purposes only, and is not intended to provide, and should not be relied on, for tax, legal or accounting advice. Clients should consult their personal tax, legal and accounting advisors for advice before engaging in any transaction.
39
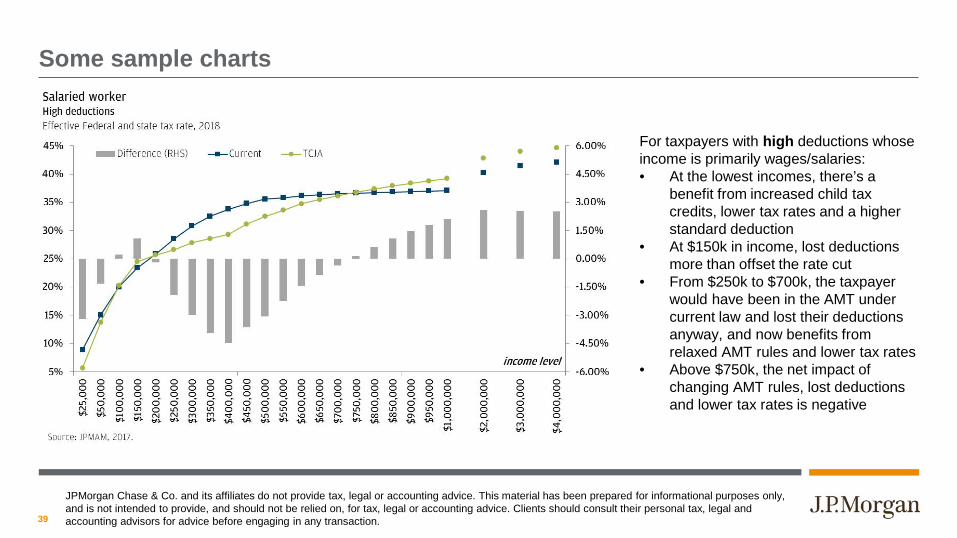
Some sample charts
For taxpayers with high deductions whose income is primarily wages/salaries: • At the lowest incomes, there’s a
benefit from increased child tax credits, lower tax rates and a higher standard deduction
• At $150k in income, lost deductions more than offset the rate cut
• From $250k to $700k, the taxpayer would have been in the AMT under current law and lost their deductions anyway, and now benefits from relaxed AMT rules and lower tax rates
• Above $750k, the net impact of changing AMT rules, lost deductions and lower tax rates is negative
JPMorgan Chase & Co. and its affiliates do not provide tax, legal or accounting advice. This material has been prepared for informational purposes only, and is not intended to provide, and should not be relied on, for tax, legal or accounting advice. Clients should consult their personal tax, legal and accounting advisors for advice before engaging in any transaction.

40
Some sample charts
For taxpayers with high deductions whose income is heavily composed of long term gains and qualified dividends, the taxpayer benefits from relaxed AMT rules and lower tax rates until $1mm in income. From $1mm to $4mm in income, the taxpayer is in the AMT under TCJA, just as under current law, and loses their deductions in both cases.
JPMorgan Chase & Co. and its affiliates do not provide tax, legal or accounting advice. This material has been prepared for informational purposes only, and is not intended to provide, and should not be relied on, for tax, legal or accounting advice. Clients should consult their personal tax, legal and accounting advisors for advice before engaging in any transaction.
41
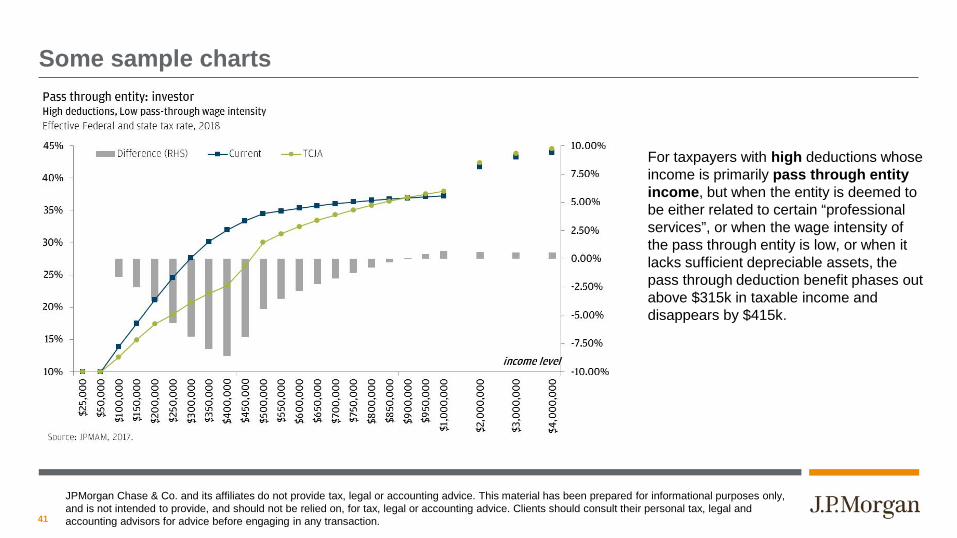
Some sample charts
For taxpayers with high deductions whose income is primarily pass through entity income, but when the entity is deemed to be either related to certain “professional services”, or when the wage intensity of the pass through entity is low, or when it lacks sufficient depreciable assets, the pass through deduction benefit phases out above $315k in taxable income and disappears by $415k.
JPMorgan Chase & Co. and its affiliates do not provide tax, legal or accounting advice. This material has been prepared for informational purposes only, and is not intended to provide, and should not be relied on, for tax, legal or accounting advice. Clients should consult their personal tax, legal and accounting advisors for advice before engaging in any transaction.

42
Planning for 2017-2018 and beyond – Consider: • By year-end:
• Paying 2017 state and local income taxes due (but don’t tip into AMT) • Paying property taxes (with an invoice from the tax assessor) • Exercising in-the-money options or realizing other discretionary ordinary income (mostly for
those in AMT) • Making or delaying donations to charity (depending on, e.g., expected 2017/18 marginal rates,
character of ‘17/’18 income, patterns of giving, residence, effect of repealed Pease limitation) • Early in 2018:
• Using gift tax exclusion (increase from $5.49MM to $11.2MM) via gifts to or in trust for family • Reviewing estate plans and life insurance coverage (for, e.g., liquidity for estate taxes) • Reviewing investments in light of changed tax treatment of some assets (e.g., REITs, MLPs) • If possible, reorganizing closely-held businesses
P.S. Don’t worry about the proposed FIFO rule – it didn’t make the cut
JPMorgan Chase & Co. and its affiliates do not provide tax, legal or accounting advice. This material has been prepared for informational purposes only, and is not intended to provide, and should not be relied on, for tax, legal or accounting advice. Clients should consult their personal tax, legal and accounting advisors for advice before engaging in any transaction.

43
JPMorgan Chase & Co., its affiliates, and employees do not provide tax, legal or accounting advice. This material has been prepared for informational purposes only, and is not intended to provide, and should not be relied on for tax, legal or accounting advice. You should consult your own tax, legal and accounting advisors before engaging in any transaction.
The views contained herein are not to be taken as advice or a recommendation to buy or sell any investment in any jurisdiction, nor is it a commitment from J.P. Morgan Asset Management or any of its subsidiaries to participate in any of the transactions mentioned herein. Any forecasts, figures, opinions or investment techniques and strategies set out are for information purposes only, based on certain assumptions and current market conditions and are subject to change without prior notice. All information presented herein is considered to be accurate at the time of production. This material does not contain sufficient information to support an investment decision and it should not be relied upon by you in evaluating the merits of investing in any securities or products. In addition, users should make an independent assessment of the legal, regulatory, tax, credit and accounting implications and determine, together with their own professional advisers, if any investment mentioned herein is believed to be suitable to their personal goals. Investors should ensure that they obtain all available relevant information before making any investment. It should be noted that investment involves risks, the value of investments and the income from them may fluctuate in accordance with market conditions and taxation agreements and investors may not get back the full amount invested. Both past performance and yield are not a reliable indicator of current and future results.
J.P. Morgan Asset Management is the brand for the asset management business of JPMorgan Chase & Co. and its affiliates worldwide. This communication is issued by the following entities: in the United Kingdom by JPMorgan Asset Management (UK) Limited, which is authorized and regulated by the Financial Conduct Authority; in other EEA jurisdictions by JPMorgan Asset Management (Europe) S.à r.l.; in Hong Kong by JF Asset Management Limited, or JPMorgan Funds (Asia) Limited, or JPMorgan Asset Management Real Assets (Asia) Limited; in Singapore by JPMorgan Asset Management (Singapore) Limited (Co. Reg. No. 197601586K), or JPMorgan Asset Management Real Assets (Singapore) Pte Ltd (Co. Reg. No. 201120355E); in Taiwan by JPMorgan Asset Management (Taiwan) Limited; in Japan by JPMorgan Asset Management (Japan) Limited which is a member of the Investment Trusts Association, Japan, the Japan Investment Advisers Association, Type II Financial Instruments Firms Association and the Japan Securities Dealers Association and is regulated by the Financial Services Agency (registration number “Kanto Local Finance Bureau (Financial Instruments Firm) No. 330”); in Korea by JPMorgan Asset Management (Korea) Company Limited; in Australia to wholesale clients only as defined in section 761A and 761G of the Corporations Act 2001 (Cth) by JPMorgan Asset Management (Australia) Limited (ABN 55143832080) (AFSL 376919); in Brazil by Banco J.P. Morgan S.A.; in Canada for institutional clients’ use only by JPMorgan Asset Management (Canada) Inc., and in the United States by JPMorgan Distribution Services Inc. and J.P. Morgan Institutional Investments, Inc., both members of FINRA/SIPC.; and J.P. Morgan Investment Management Inc.
JPMorgan Chase Bank, N.A. and its affiliates (collectively “JPMCB”) offer investment products, which may include bank managed accounts and custody, as part of its trust and fiduciary services. Other investment products and services, such as brokerage and advisory accounts, are offered through J.P. Morgan Securities LLC (JPMS), a member of FINRA and SIPC. Annuities are made available through Chase Insurance Agency, Inc. (CIA), a licensed insurance agency, doing business as Chase Insurance Agency Services, Inc. in Florida. JPMCB, JPMS and CIA are affiliated companies under the common control of JPMorgan Chase & Co. Products not available in all states.
Copyright 2017 JPMorgan Chase & Co. All rights reserved.
Important information