tax credits for growing businesses a 2015 … article 3j... · department of commerce ... including...
TRANSCRIPT

TAX CREDITS FOR GROWING BUSINESSES ACT 2015 REPORT
June 1, 2015
State of North Carolina Department of Commerce
Labor & Economic Analysis Division
Secretary John E. Skvarla, III

2
INTRODUCTION As required by G.S. 105-129.82, this report analyzes the Article 3J tax credit program, describes the development tier designation factors, analyzes the Department of Commerce’s business expansion-related and recruitment efforts, and identifies the use of incentives in other states. The report contains two major components required by statute: an Equity Study and an Impact Study. The Equity Study reviews:
1. The tier designation formula, including alternative measures for more equitable treatment of counties in similar economic circumstances;
2. Tier assignments and whether the applicable thresholds are equitable for smaller counties; and 3. Data on whether expanding North Carolina businesses receive fewer benefits than out-of-state
businesses that locate to North Carolina. The Impact Study analyzes:
1. Distribution of Article 3J tax credits across new and expanding businesses 2. Direct costs and benefits of the Article 3J tax credits; 3. Department of Commerce’s assigned and announced business recruitment and expansion-related
activities since 2005 by county, industry, investment, and job; and 4. Use of incentives by other states.
This report assesses annual reports from Process Years (PY) 2013 and 2014 by the North Carolina Department of Revenue and announced business recruitment and expansion-related data from the Department of Commerce’s former Business and Industry Division. The data covers the two-year period since the previous biennial report. G.S. 105-129.82(a) repealed the Article effective for business activities that occur on or after January 1, 2014, however credits may be generated and taken for qualified business activities that occurred before January 1, 2014.
ARTICLE 3J TAX CREDITS FOR GROWING BUSINESSES: PROGRAM OVERVIEW The Article 3J Tax Credits for Growing Businesses program went into effect on January 1, 2007 and was allowed to sunset for business activity on or after January 1, 2014. Tax credits are awarded to eligible taxpayers that undertake qualifying activities in North Carolina: job creation; investment in business property; and investment in real property. Additional tax credits may be earned for projects in Urban Progress and Agrarian Growth Zones.1 These credits may be combined to offset up to 50 percent of the taxpayer’s state income, franchise, or gross premium tax liability. The following is a brief summary of the Article 3J program’s eligibility requirements and eligible activities, tier assignments, and Urban Progress and Agrarian Growth Zones. Eligibility To qualify for Article 3J Credits, the following eligibility requirements must be met:
1. The primary activity at the business establishment must be one of the following: a) aircraft maintenance and repair;
1 Municipalities with a population of at least 10,000 have the ability to define qualifying areas of poverty as Urban Progress Zones. Counties that do not have a municipality with a population of at least 10,000, have the ability to define qualifying areas of poverty as Agrarian Growth Zones. Projects located within these zones receive enhanced Article 3J Credits.

3
b) air courier services hub; c) company headquarters that creates at least 75 new headquarters jobs; d) customer service call centers; e) electronic shopping and mail order houses; f) information technology and services; g) manufacturing; h) motorsports facilities and motorsports racing teams; i) research and development; and j) warehousing and wholesale trade.
2. The average wage of all full-time workers employed by the taxpayer at the establishment during the taxable year must meet or exceed the applicable wage standard of the county in which the establishment is located. There is no wage standard in Tier 1 counties.
3. The taxpayer must offer qualifying health insurance for all full-time positions at the establishment and pay at least 50 percent of employee premiums.
4. The taxpayer certifies that, at the time the taxpayer claims the credit, there has not been a final determination unfavorable to the taxpayer with respect to an environmental disqualifying event.
5. The taxpayer certifies that, as of the time the taxpayer claims the credit at the establishment with respect to which the credit is claimed, the taxpayer has no citations under the Occupational Safety and Health Act that have become a final order within the past three years for willful serious violations or for failing to abate serious violations.
6. The taxpayer may not have overdue taxes. County Tier Designations General Statute 143B-437.08 requires that the Department of Commerce annually rank the state’s 100 counties based on economic well-being and assign a tier designation to each. The development factor is based on 12-month average unemployment rate, median household income, 36-month population growth rate, and per capita adjusted assessed property value. These tier designations affect the financial value of the Article 3J tax credits. The 40 most distressed counties are designated as Tier 1, the next 40 are Tier 2, and the 20 least distressed are Tier 3. There are several caveats in the statute that affect tier designation. Any county that has a population of fewer than 12,000 people is automatically designated as a Tier 1 county. Any county with a population of fewer than 50,000 is automatically ranked one of the 80 most distressed counties. Any county with a population fewer than 50,000 people, and with more than 19 percent of its population below the federal poverty level, according to the most recent Federal decennial census, is automatically designated a Tier 1 county. Any county designated as a development Tier 1 area is automatically ranked one of the 40 most distressed counties until it has been a development Tier 1 area for at least two consecutive years. Urban Progress Zones (UPZ) and Agrarian Growth Zones (AGZ) As part of North Carolina’s Article 3J tax credits program, the Agrarian Growth Zone and the Urban Progress Zones provide economic incentives to stimulate new investment and job creation in economically distressed areas. Municipalities with a population of at least 10,000 have the ability to define qualifying areas of poverty as Urban Progress Zones (G.S. 143B-437.09). Counties that do not have a municipality with a population of at least 10,000 have the ability to define qualifying areas of poverty as Agrarian Growth Zones (G.S. 143B-437.010). Business development projects located within these zones receive enhanced Article 3J credits. Credit for Creating Jobs Eligible taxpayers that meet a minimum threshold of new full-time jobs created during the taxable year may claim a credit for each new job created. The credit is taken in equal installments over four years following the year the jobs are created. The job threshold and the credit amount per job are determined by the tier

4
designation of the county in which the jobs are created. When jobs are created in Urban Progress Zones or Agrarian Growth Zones, the credit is increased by $1,000. If a resident of a zone or a long-term unemployed person2 is hired, the company is eligible for an additional $2,000 credit.
Table 1. Article 3J Job Creation Tax Credit Tier Designations
Tier 1 Tier 2 Tier 3 UPZ / AGZ
Job Threshold 5 10 15 5
Credit per Job $12,500 $5,000 $750 + $1,000
Credit for Investing in Business Property Eligible taxpayers may claim a credit based on a percentage of the cost of capitalized business property that is placed in service during the taxable year in excess of an applicable threshold. This credit is taken in equal installments over four years beginning the year after the property is first placed in service. The credit percentage and threshold are based on the tier designation of the county where the property is placed in service.
Table 2. County Tier Designation and Investment Threshold for Business Property Tax Credit
Tier 1 Tier 2 Tier 3 UPZ / AGZ
Threshold $0 $1 million $2 million $0
Credit % 7% 5% 3.5% 7%
Credit for Investment in Real Property Eligible taxpayers that invest at least $10 million in real property within a three-year period and create at least 200 new jobs within two years at an establishment located in a Tier 1 county are allowed a credit equal to 30 percent of the eligible real property investment. This credit is taken in equal installments over seven years beginning the year after the property is used by an eligible business. To qualify for this credit, the taxpayer must obtain a written determination from the Department of Commerce.
2 A long-term unemployed worker is an individual who has been totally unemployed for at least the preceding 26 consecutive weeks as
defined by the N.C. Department of Commerce, Division of Employment Security.

5
EQUITY STUDY G.S. 105-129.82(b) directs the Department of Commerce to study the reexamine the formula in G.S. 143B-437.08 used to define development tiers and to consider alternative measures for more equitable treatment of counties in similar economic circumstances, as well as to consider whether the assignment of tiers and applicable thresholds are equitable for smaller counties.
TIER DESIGNATION CRITERIA Each November, the Department of Commerce must release updated county tier designations for the following calendar year. These rankings are based on economic criteria specifically required by the statute. G.S. 143B-437.08 defines the “Development Factor” as the sum of rankings across four economic criteria:
1. 12-Month Average Unemployment Rate – Counties are ranked by average rate of unemployment from lowest to highest for the most recent 12 months for which data are available.
2. Median Household Income – Counties are ranked by median household income from highest to lowest for the most recent 12 months for which data are available.
3. 36-Month Population Growth Rates – Counties are ranked by percentage growth in population from highest to lowest for the most recent 36 months for which data are available. For the purposes of this section, population statistics do not include people incarcerated in federal or state prisons.
4. Per Capita Adjusted Assessed Property Value – Counties are ranked by adjusted assessed property value per capita as published by the Department of Public Instruction, from highest to lowest, for the most recent taxable year.
The most recent tier designations, in addition to the data used for each economic criterion and a discussion of county changes from the previous year are available at the Department of Commerce’s website.3
REEXAMINATION OF TIER FORMULA AND ALTERNATIVE MEASURES In response to Section 15.10B of S.L. 2014-100, the Department of Commerce studied factors that could be used to adjust a county's development tier designation regardless of the county's actual development factor assigned
under G.S. 143B‑437.08(b). The adjustment factors considered include events or occurrences that negatively impact a county's rate of unemployment, median household income, percentage growth in population, and assessed value per capita. The Department also considered aligning the State's development tier designations with the U.S. Housing and Urban Development entitlement designations. This study was provided to the Joint Legislative Commission on Governmental Operations, the House of Representatives Appropriations Subcommittee on Natural and Economic Resources, the Senate Appropriations Committee on Natural and Economic Resources, and the Fiscal Research Division. A copy of the study is attached to this report.
DISTRIBUTION OF ARTICLE 3J TAX INCENTIVES ACROSS NEW AND EXISTING BUSINESSES G.S. 105-129.82(b) also asks the Department of Commerce to compile any available data on whether expanding North Carolina businesses receive fewer benefits under Article 3J than out-of-state businesses that locate to North Carolina.
3 See http://www.nccommerce.com/research-publications/incentive-reports/county-tier-designations. PDF version available at
http://www.nccommerce.com/Portals/0/Incentives/CountyTier/2015%20Development%20Tier%20Rankings.pdf.

6
Article 3J tax credits are awarded to North Carolina companies based on their hiring and investment decisions. The tax forms necessary to claim Article 3J tax credits do not collect information on whether a business is new to North Carolina or expanding within the state. Any company meeting the specific program eligibility criteria may apply for the tax credits. The N.C. Department of Commerce does collect information on new and expanding businesses for its economic development projects, which is available in the following section.

7
IMPACT STUDY
DISTRIBUTION OF ARTICLE 3J TAX INCENTIVES ACROSS NEW AND EXISTING BUSINESSES Article 3J tax credits are awarded to North Carolina companies based on their hiring and investment decisions. The tax forms necessary to claim Article 3J tax credits do not collect information on whether a business is new to North Carolina or expanding within the state. Any company meeting the specific program eligibility criteria may apply for the tax credits. The N.C. Department of Commerce does collect information on new and expanding businesses for its economic development projects, which is available in the following section.
DIRECT COSTS AND BENEFITS OF ARTICLE 3J This section provides an overview of the jobs and investment created and credits generated by the Article 3J Tax Credits for Growing Businesses Program. The N.C. Department of Revenue produces annual reports of credits generated and credits taken based on tax returns from PY 2013 and PY 2014.4 The summary information provided here is not intended to be a comprehensive cost-benefit analysis as only direct costs and benefits are described. A summary of the dollar value of credits generated and taken by qualifying activity is presented, as well as the associated jobs and investment created. While Article 3J is not entirely or solely responsible for these impacts, economic development tools such as Article 3J tax credits can incentivize business expansion and recruitment. Summary of Credits and Benefits by Qualifying Activity Over the two year period of PY 2013 and PY 2014, Article 3J tax credits are associated with the creation of 17,010 jobs, over $5.8 billion in business property investment5, and $42.1 million in real property investment. This activity generated $393.9 million in tax credits for eligible taxpayers. During this time period a total of $103.6 million of credits were taken for previously generated credits. There is an important distinction between credits generated and credits taken. Credits are generated based on taxpayers’ hiring and investment activity during a specific reporting period. Credits taken are the amount that taxpayers actually use based on credits generated in previous years. The amounts taken will depend on each taxpayer’s tax liability, required installment schedules, and potential carryforwards. The Article 3J tax credits limit credits taken each year to 50 percent of the amount of tax against which it is claimed, reduced by the sum of all other tax credits allowed against that tax. In addition, credits for job creation and business property investment must be taken in equal installments over four years while credits for investing in real property must be taken in equal installments over seven years provided the taxpayer has sufficient tax liability to take the full amount of the installment. Unused credits may be carried forward for five years in the case of job creation and business investment credits, and for up to fifteen years for real property investment credits. Credit for Creating Jobs During PY 2013 and PY 2014, a total of 17,010 jobs were created by companies that applied for Article 3J tax credits, generating $75.7 million in tax credits for businesses. The majority of credits were generated in those counties identified as most distressed—Tier 1 counties. Job creation activity in Tier 2 counties generated $20.9 million in credits. Tier 3 counties generated $9.1 million in tax credits.
4 Available in full at http://www.dor.state.nc.us/publications/incentives/2013/ and http://www.dor.state.nc.us/publications/incentives/2014/ 5 In excess of applicable thresholds as described in Table 2.

8
Table 3. Article 3J Jobs Created and Credits Generated by Tier Designation
PY 2013 PY 2014 Total
County Tier
Jobs Created
Credits Generated
Jobs Created
Credits Generated
Jobs Created
Credits Generated
1 2,645 $33,108,500 1,068 $12,680,500 3,713 $45,789,000
2 2,716 $13,969,000 1,376 $6,905,250 4,092 $20,874,250
3 5,542 $4,760,313 3,663 $4,326,250 9,205 $9,086,563
10,903 $51,837,813 6,107 $23,912,000 17,010 $75,749,813
Source: N.C. Department of Revenue Credit for Investing in Business Property For the two years that data are available (PY 2013 and PY 2014), over $5.8 billion was invested in business property related to Article 3J tax credits in excess of the applicable threshold amounts. During this period, over $1.6 billion was invested in Tier 1 counties. In Tier 2 counties, businesses investment totaled $1.3 billion, and Tier 3 counties accounted for $2.9 billion of business investment. The $5.8 billion of investment generated $305.5 million in tax credits for businesses. Tier 3 counties generated $126 million, followed by Tier 1 counties with $113.6 million in credits. Tier 2 counties accounted for the remaining $65.9 million in tax credits.
Table 4. Article 3J Investment in Business Property and Credits Generated by Tier Designation
PY 2013 PY 2014 Total
County Tier Investment
Credits Generated Investment
Credits Generated Investment
Credits Generated
1 $1,448,005,739 $101,360,406 $174,579,973 $12,220,596 $1,622,585,712 $113,581,002
2 $393,726,391 $21,734,803 $863,917,796 $44,123,607 $1,257,644,187 $65,858,410
3 $2,243,917,212 $91,278,088 $688,563,163 $34,759,263 $2,932,480,375 $126,037,351
$4,085,649,342 $214,373,297 $1,727,060,932 $91,103,466 $5,812,710,274 $305,476,763
Source: N.C. Department of Revenue
Credit for Investing in Real Property Only large investments in Tier 1 counties are eligible for the credit for investing in real property. The taxpayer must purchase and use at least $10 million of real property in an eligible business within a three-year period and create at least 200 new jobs within two years of the time the property is first used. The tax credit is 30 percent of the total investment amount and is claimed over a seven year period. In PY 2013, $42.1 million of eligible investment in real property was made in Tier 1 counties, generating $12.6 million in credits. No credits were generated in PY 2014. Article 3J Credits Taken Credits taken represent only that amount which a particular taxpayer may take in a given tax year based on tax liability, required installment schedules, and potential carryforwards. Article 3J limits credits taken each year to 50 percent of the amount of tax against which it is claimed, reduced by the sum of all other tax credits allowed against that tax. In addition, credits for job creation and business property investment must be taken in equal

9
installments over four years while credits for investing in real property must be taken in equal installments over seven years provided the taxpayer has sufficient tax liability to take the full amount of the installment. Unused credits may be carried forward for five years in the case of job creation and business investment credits, and for up to fifteen years for real property investment credits. During PY 2013 and PY 2014, a total of $103,556,147 was taken in credits.
Table 5. Value of Article 3J Credits Taken
Year Job Creation
Business Property
Investment Real Property
Investment Totals
PY 2013 $13,382,285 $46,710,024 $709,312 $60,801,621
PY 2014 $11,215,224 $31,509,216 $30,086 $42,754,526
Totals $24,597,509 $78,219,240 $739,398 $103,556,147
Source: N.C. Department of Revenue

10
BUSINESS RECRUITMENT AND EXPANSION-RELATED ACTIVITIES SINCE 2005 This section assesses the Department of Commerce’s assigned and announced business recruitment and expansion-related activities for 2005 through 2013 by county, industry type, investment, and job creation.6 The following review of economic development activities — which is broader than Article 3J tax credit activity — encompasses projects and companies tracked by the Department of Commerce’s former Business and Industry Division. The Department of Commerce measures business recruitment and expansion-related activities in two ways. The first method tracks the number of projects assigned to business developers in any given year. Since business developers often work on individual projects for several years, the number of projects assigned annually is only a portion of their total activity. The second method tabulates announced capital investment and job creation for new and existing businesses. Assigned Business Development Projects Since 2007, North Carolina has assigned an average of 414 new and expansion projects per year (Graph 1) to its business and industry developers. A project is designated as “new” if the business does not currently have any operations in North Carolina. An “expansion-related” project is defined as growth in workforce (including job retention) or investment at an existing company in the State. Companies new to North Carolina make up over half of all projects assigned.
Source: North Carolina Department of Commerce
6 Due to the transition of business recruitment activities from the Department of Commerce to the Economic Development Partnership of North Carolina near the end of 2014, 2013 is the most recent full year for which this data is available.
2005 2006 2007 2008 2009 2010 2011 2012 2013
309 284235
279 255 270 244 237 220
145139
156
160178 167
155 152141
New Projects Expansion-Related Projects
454423
391
439 433 437
Graph 1: Department of Commerce, North Carolina Assigned Business Projects by Type
399 389361

11
Announced Business Development Projects In 2013, the Department of Commerce announced 140 business projects (Graph 2). Of these announcements, 63 percent were expansions of existing businesses. Apart from 2006, expansion-related projects have consistently accounted for the majority of project announcements.
Source: North Carolina Department of Commerce
Announced business investment in 2013 totaled $2.80 billion (Graph 3). 2012 represented the third highest investment over the past eight years. In most years since 2005, expansion-related projects within existing companies have been responsible for the majority of announced investment. This was again true in 2013.
Source: North Carolina Department of Commerce
2005 2006 2007 2008 2009 2010 2011 2012 2013
98 9364 68 62 60 72 66 52
10585
100 81 86 96
119
8188
New Projects Expansion-Related Projects
Graph 2: Department of Commerce,North Carolina Announced Business Projects by Type
178164
149 148 156
191
147
203
140
2005 2006 2007 2008 2009 2010 2011 2012 2013
$2.88
$2.41 $2.57
$5.12
$2.89
$3.99
$3.07$3.48
$2.80
Graph 3: Department of Commerce, North Carolina Announced Business Investment by Year ($ billions)

12
The low point of job creation announcements in recent years was in 2007 – at the onset of the recession. Projects from 2009 to 2012 produced fairly consistent numbers – with an average of 16,700 announced jobs per year – but fewer than in the years leading up to economic crisis. More jobs were announced in 2013 than in any year since 2008. Over the past three years, the total number of new jobs announced were evenly divided between new and expanding firms.
Source: North Carolina Department of Commerce
2005 2006 2007 2008 2009 2010 2011 2012 2013
18,230
20,846
14,711
19,490
16,840 17,38016,184 16,506
18,486
Graph 4: Department of Commerce, North Carolina Total Announced Jobs by Year

13
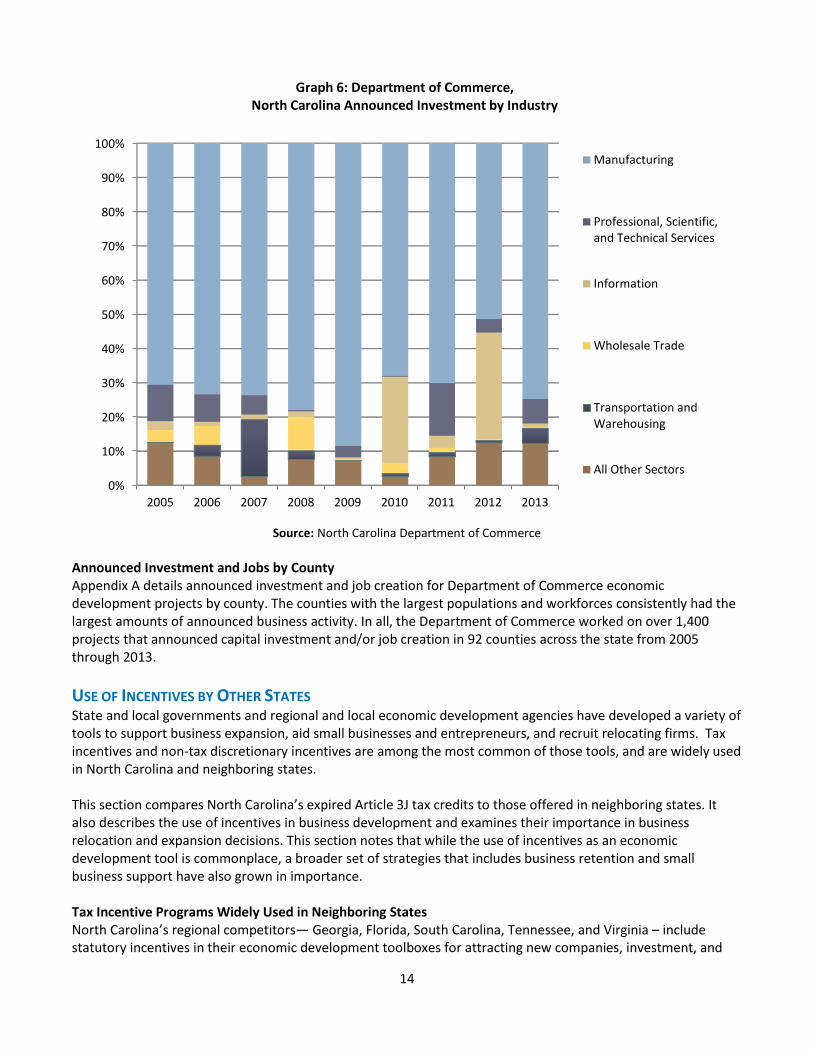
Announced Investment and Jobs by Industry Manufacturing constitutes the largest share of business recruitment and expansion projects in North Carolina since 2005. From 2005 through 2013, manufacturing accounted for 72 percent of the announced investment and 61 percent of the announced new jobs under projects led by the Department of Commerce. Between 2005 and 2013, the following sectors have also been significant contributors to announced investments: Information (9%); Professional, Scientific, & Technical Services (5%); Wholesale Trade (3%); and Transportation & Warehousing (3%). Over the same time horizon, the following industries contributed to announced job creation: Professional, Scientific, & Technical Services (10%); Administrative & Support & Waste Management (5%); Finance & Insurance (5%); Information (4%); and Wholesale Trade (3%). In 2013, 75 percent of announced investment and 50 percent of announced jobs originated from the manufacturing sector. Graph 5 illustrates the ratio of announced job creation by sector since 2005. Graph 6 illustrates the ratio of announced investment by sector.
Source: North Carolina Department of Commerce
0%
10%
20%
30%
40%
50%
60%
70%
80%
90%
100%
2005 2006 2007 2008 2009 2010 2011 2012 2013
Manufacturing
Professional, Scientific, andTechnical Services
Administrative and Support /Waste Mgmt
Information
Transportation andWarehousing
Wholesale Trade
All Other Sectors
Graph 5: Department of Commerce, North Carolina Announced Job Creation by Industry
14
Source: North Carolina Department of Commerce
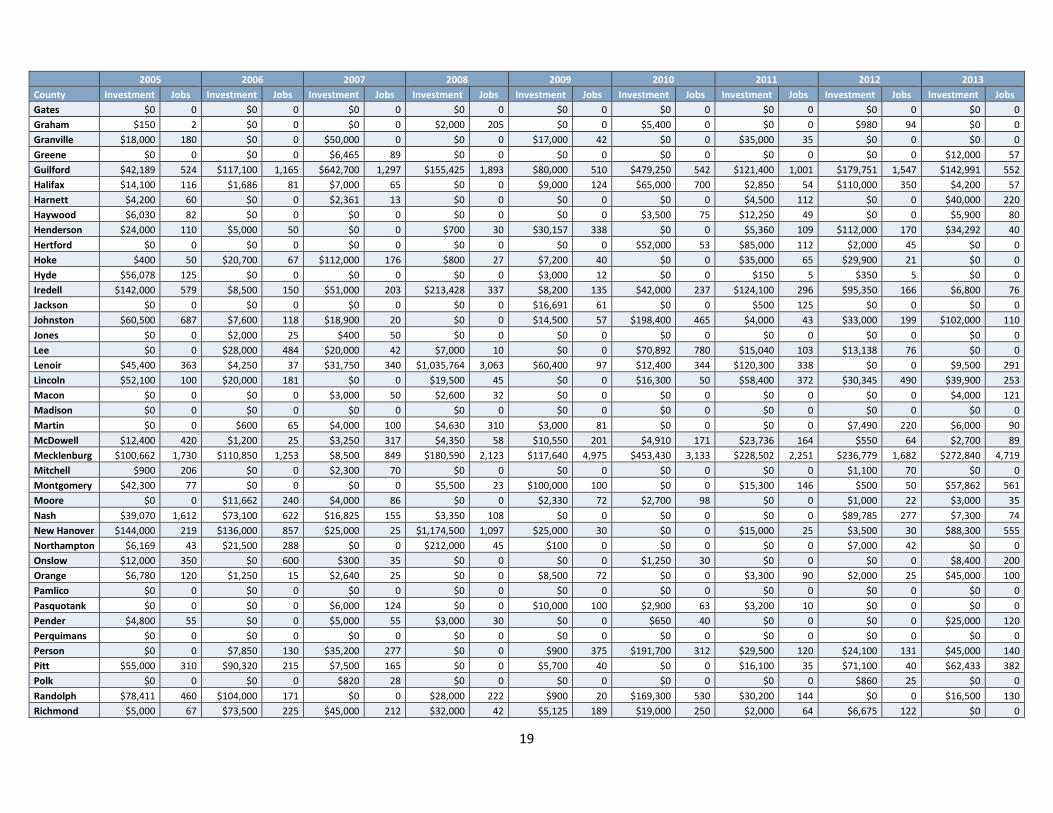
Announced Investment and Jobs by County Appendix A details announced investment and job creation for Department of Commerce economic development projects by county. The counties with the largest populations and workforces consistently had the largest amounts of announced business activity. In all, the Department of Commerce worked on over 1,400 projects that announced capital investment and/or job creation in 92 counties across the state from 2005 through 2013.
USE OF INCENTIVES BY OTHER STATES State and local governments and regional and local economic development agencies have developed a variety of tools to support business expansion, aid small businesses and entrepreneurs, and recruit relocating firms. Tax incentives and non-tax discretionary incentives are among the most common of those tools, and are widely used in North Carolina and neighboring states. This section compares North Carolina’s expired Article 3J tax credits to those offered in neighboring states. It also describes the use of incentives in business development and examines their importance in business relocation and expansion decisions. This section notes that while the use of incentives as an economic development tool is commonplace, a broader set of strategies that includes business retention and small business support have also grown in importance. Tax Incentive Programs Widely Used in Neighboring States North Carolina’s regional competitors— Georgia, Florida, South Carolina, Tennessee, and Virginia – include statutory incentives in their economic development toolboxes for attracting new companies, investment, and
0%
10%
20%
30%
40%
50%
60%
70%
80%
90%
100%
2005 2006 2007 2008 2009 2010 2011 2012 2013
Manufacturing
Professional, Scientific,and Technical Services
Information
Wholesale Trade
Transportation andWarehousing
All Other Sectors
Graph 6: Department of Commerce, North Carolina Announced Investment by Industry

15
jobs. The types of tax credits provided through Article 3J to eligible taxpayers in North Carolina—Credit for Job Creation, Credit for Investment in Business Property, and Credit for Real Property Investment—were similar to those offered in neighboring states. Table 6 shows North Carolina’s neighboring states with statutory incentives that are functionally equivalent to North Carolina’s Article 3J.
Table 6: State Corporate Income Tax Credits Similar to North Carolina’s 3J Credits
Job Creation Tax Credit – Most Southeastern states offer an incentive for job creation but the size, duration, and eligible industries vary. For example, the Qualified Target Industry Tax Refund is Florida’s most widely used job creation incentive. Georgia, on the other hand, has three commonly used job credits: the Quality Job Tax Credit for companies that create jobs that pay wages at least 110% of the county average, the Mega Project Tax Credit for projects making particularly large investments in the state, and the Job Tax Credit which incents businesses differently depending upon the number of jobs a business creates and where those jobs are located. Capital Investment Tax Credit – The goal of these credits is to encourage firms to expand and/or purchase equipment. However, the size and duration of capital investment tax credits differ across states. A common strategy is restricting the length of time a company needs to exist before receiving the incentive. For example, the Tennessee Industrial Machinery Tax Credit is three years, but may be expanded to five years for businesses investing less than $1 billion and to seven years for businesses investing $1 billion or more. Real Property Tax Credit – Several states provide incentives for real property investment. These incentives are sometimes tied to capital investment tax credits or are only offered in an enterprise zone (or county tier) program. In Virginia and Florida, for instance, real property credits are associated with enterprise zones – specific, distressed geographic areas targeted for economic revitalization. Other Tiered Systems – Like North Carolina, Georgia and South Carolina determine the size of incentive awards using a county tier system, which ranks counties based upon their level of economic distress.
Job Creation Tax Credit Capital Investment Tax Credit Real Property Tax Credit
North Carolina 3J Credit for Creating Jobs 3J Credit for Investing in Business
Property 3J Credit for Investment in Real
Property
Georgia Job Tax Credit, Quality Jobs Tax Credit,
Mega Project Tax Credit Investment Tax Credit N/A
Florida
Enterprise Zone Jobs Tax Credit, Qualified Target Industry Tax Refund, Urban Job Tax Credit, Rural Job Tax
Credit, Jobs for the Unemployed Tax Credit, Qualified Defense & Space
Contractor Tax Refund
Capital Investment Tax Credit Enterprise Zone Property Tax
Credit
South Carolina Job Tax Credit, Corporate Headquarters
Credit Economic Impact Zone Investment Credit, Property Investment Credit
Corporate Headquarters Credit
Tennessee
Job Tax Credit, Rural Opportunity Initiative Enhanced Job Tax Credit, Job
Tax Super Credit, Headquarters Tax Credit
Industrial Machinery Tax Credit, Data Center Tax Credit
Headquarters Tax Credit
Virginia Major Business Facility Job Tax Credit, Enterprise Zone Job Creation Grant,
Green Job Creation Tax Credit Recycling Equipment Tax Credit,
Enterprise Zone Real Property Investment Grant

16
Role of Incentives in the Economic Development Process Tax incentives remain a key focus of economic development policy. Area Development magazine’s 29th Annual Corporate Survey and 11th Annual Consultant Survey provide insight into the most important factors business executives and consultants consider when making site location decisions.7 Slightly more than half (55 percent) of executives say their companies have received and utilized incentives in the past. According to the survey, 73 percent of executives felt that incentives were “important” or “very important” when making location decisions. This is down from 82 percent in 2013. Among the particular types of incentives considered, tax incentives (such as tax credits and exemptions) were rated as the most important when making a location decision. Fifty-four percent of consultants said incentives have always been of great importance to their clients, while 38 percent responded that incentives were more important now than in the past. Of the types of incentives clients considered when making a location decision, 86 percent of consultants believe their clients consider cash grants important. Incentives such as subsidies and infrastructure support ranked second on the list (75%) and tax incentives ranked third (68%). These findings suggest that tax incentives have become less influential in the site selection process among executives during the past five years, falling from the 3rd most important factor in 2011 to the 11th most important factor in 2014. Several other factors have consistently taken precedence over incentives, including concerns about poor highway access, lack of skilled labor, and high energy and occupancy costs. This suggests that while tax incentives remain an important factor in states’ economic development portfolios, there are other factors that may be more impactful in persuading businesses to locate in North Carolina. Recognizing the need for a more comprehensive approach to economic development, North Carolina has also made broad use of performance-based discretionary incentives, such as the One North Carolina Fund and the Job Development Investment Grant (JDIG) program. Recent project announcements from North Carolina’s competitor states suggest the use of discretionary incentives remains a highly relevant part of economic development decisions. Florida, South Carolina, and Virginia (for instance) all utilize performance-based discretionary grant programs similar to North Carolina’s JDIG program. Such programs link grant awards to the jobs and business investment associated with particular projects. In addition to these programs, competitor states also deploy other discretionary incentives, including job retention and job training grants. Additional information on the types of incentives available for businesses can be found through the Council for Community and Economic Research’s State Business and Incentives Database (http://www.stateincentives.org) This resource is a database of incentive programs used by states to attract businesses and can be searched by program category, program type, geographic focus, and business need. Use of Incentive Increasing or Declining North Carolina is certainly not alone in its use of tax credits and discretionary grant programs to support business expansion and recruitment. Nevertheless, it is difficult to determine the extent to which states’ use of incentives is increasing or declining. Attempts to aggregate state incentives data have been made. For instance, Good Jobs First has developed Subsidy Tracker (http://www.goodjobsfirst.org/subsidy-tracker), which tracks economic development subsidies and other forms of financial assistance across states. However, these data sources are not comprehensive and do not track states’ incentives over consistent timelines, making it impossible to truly compare incentive programs across states.
7 The surveys included 143 executives, the majority of whom represented manufacturing firms. The number of site consultants was not reported. Available at http://www.areadevelopment.com/Corporate-Consultants-Survey-Results/Q1-2015/annual-corporate-executive-business-expansion-survey-287775.shtml And http://www.areadevelopment.com/Corporate-Consultants-Survey-Results/Q1-2015/11th-site-selection-consultants-corporate-RE-survey-8802177.shtml
17
Several issues arise when attempting to collect data on state incentive programs. First, the transparency and comprehensive nature of incentives reporting varies significantly across states. Some states report on certain economic development incentives, while neglecting others, resulting in an incomplete picture of incentives use. For instance, Virginia reports on business incentive payments and corporate income tax incentives, but fails to provide information on sales and use tax exemptions. Furthermore, incentives data are not considered public information in every state. Second, the methodology used to evaluate tax incentives differs widely by state. Some states use tax returns processed from previous years to generate actual costs associated with tax incentives, while other states project future values of tax expenditures. Third, determining what constitutes an economic development incentive is subjective. Most observers would consider cash grants to companies relocating jobs and investment to a particular state to be an economic development incentive. However, other incentives present a more nuanced approach to economic development, such as the exemption of certain business activities from sales taxes or the provision of job training funding to ensure that new or expanding businesses are able to properly staff new operations. Opinions may differ concerning the inclusion of these (and other) types of expenditures in an economic development or business incentives category. While these factors make it difficult to directly compare incentive programs from one state to the next, it is possible to identify overall trends in the strategies that states are using to spur economic growth. In particular, research conducted by the National Governors Association suggests that six important trends have emerged in state economic development since 2012. These trends are listed below.
1. States are devising broader, regional initiatives through bottom-up strategic planning initiatives. 2. States are fostering job creation from within the state by providing specialized support for start-ups
and high growth companies. 3. States are bolstering assistance for advanced manufacturing. 4. States are fostering partnerships between companies and higher education institutions to address
industry’s talent demands. 5. States are encouraging universities to commercialize their research into patents, products, and
companies. 6. States are focusing on how they can help companies connect to new markets and customers outside
the United States. Detailed information about each of these trends can be found here: http://www.nga.org/files/live/sites/NGA/files/pdf/2013/1308TopTrendsinStateEconDevPaper.pdf

18
APPENDICES APPENDIX A: Announced Investment and Jobs for Dept. of Commerce Economic Development Projects (investment in thousands)
2005 2006 2007 2008 2009 2010 2011 2012 2013
County Investment Jobs Investment Jobs Investment Jobs Investment Jobs Investment Jobs Investment Jobs Investment Jobs Investment Jobs Investment Jobs
Alamance $7,600 190 $9,700 159 $33,500 130 $86,500 81 $7,000 42 $12,200 381 $0 0 $34,275 399 $118,000 500
Alexander $12,000 65 $0 0 $0 0 $275 65 $13,900 168 $0 0 $0 0 $0 0 $0 0
Alleghany $0 46 $0 0 $0 0 $0 0 $0 0 $0 0 $0 0 $0 0 $0 15
Anson $0 0 $0 0 $0 0 $10,300 87 $5,500 115 $0 0 $0 0 $0 0 $0 0
Ashe $40,400 307 $0 0 $26,000 0 $0 0 $0 0 $0 0 $4,600 58 $0 0 $65,180 105
Avery $0 0 $0 0 $0 0 $0 0 $0 0 $0 0 $0 0 $9,000 25 $0 0
Beaufort $164,407 506 $5,500 65 $18,510 293 $14,000 270 $1,950 46 $9,650 738 $4,000 32 $15,600 172 $3,000 159
Bertie $500 3 $0 0 $0 0 $0 0 $500 7 $0 0 $7,500 48 $0 0 $0 0
Bladen $21,950 186 $81,300 251 $3,000 120 $1,500 79 $0 0 $0 0 $0 0 $0 0 $15,500 25
Brunswick $78,550 135 $12,000 34 $52,300 883 $0 0 $0 0 $4,800 8 $9,500 84 $33,000 105 $2,665 93
Buncombe $80,000 123 $30,000 264 $23,000 220 $1,700 50 $9,845 136 $195,200 780 $117,446 611 $205,335 564 $89,930 183
Burke $113,400 761 $14,050 102 $19,300 61 $33,400 243 $3,750 109 $7,920 348 $27,986 301 $13,300 242 $10,351 52
Cabarrus $200,000 0 $46,526 712 $2,150 50 $15,000 500 $0 0 $83,800 246 $184,550 1,678 $47,000 200 $0 0
Caldwell $0 380 $23,100 287 $15,000 509 $62,000 872 $14,385 127 $19,790 357 $3,330 68 $15,660 359 $52,930 259
Camden $0 0 $0 0 $6,600 60 $0 0 $0 0 $0 0 $0 0 $0 0 $0 0
Carteret $13,000 60 $0 0 $0 0 $0 0 $0 0 $0 0 $0 0 $0 0 $0 0
Caswell $0 0 $2,100 24 $500 50 $0 0 $0 0 $0 0 $0 0 $0 0 $0 0
Catawba $52,700 728 $121,125 745 $0 0 $10,940 1,848 $1,008,500 799 $24,750 613 $26,900 505 $40,205 131 $3,300 162
Chatham $25,500 65 $0 0 $1,000 14 $142,000 104 $1,000 24 $2,000 30 $0 0 $2,910 86 $0 0
Cherokee $1,000 25 $0 0 $19,050 99 $0 0 $2,000 40 $0 0 $5 28 $0 0 $0 0
Chowan $3,700 62 $0 0 $6,000 41 $0 0 $5,400 44 $1,500 15 $5,000 46 $0 0 $0 0
Clay $1,000 10 $0 0 $250 15 $450 12 $0 0 $0 0 $0 0 $0 0 $0 0
Cleveland $16,500 60 $71,240 956 $8,800 310 $29,350 222 $11,979 129 $342,700 362 $185,870 102 $916,300 638 $70,000 373
Columbus $10,200 158 $32,700 230 $66,800 74 $4,060 72 $4,400 92 $0 0 $25,000 38 $26,600 64 $15,500 145
Craven $24,000 123 $12,250 237 $5,000 50 $12,000 100 $53,000 6 $4,700 350 $52,030 149 $1,691 38 $0 0
Cumberland $81,100 15 $3,900 30 $200,000 50 $204,500 75 $117,748 784 $3,500 3 $7,000 79 $63,536 548 $1,500 119
Currituck $0 0 $0 0 $0 0 $0 0 $0 0 $0 0 $0 0 $0 0 $0 0
Dare $0 0 $0 0 $0 0 $0 0 $0 0 $0 0 $0 0 $2,000 71 $235 4
Davidson $12,500 80 $4,100 200 $32,700 788 $1,000 100 $12,000 328 $35,900 393 $2,000 225 $5,500 10 $45,555 379
Davie $27,000 40 $10,500 143 $0 0 $4,000 24 $850 128 $31,700 169 $55,950 222 $107,300 750 $4,900 81
Duplin $0 0 $0 0 $0 0 $0 0 $0 0 $18,407 94 $6,000 0 $0 0 $0 0
Durham $197,500 1,003 $342,872 1,518 $102,929 932 $653,450 493 $448,283 1,726 $248,600 1,483 $226,200 612 $214,500 332 $346,050 590
Edgecombe $0 0 $4,410 133 $7,000 100 $0 0 $5,650 155 $6,600 485 $142,980 672 $0 0 $2,200 29
Forsyth $86,950 139 $26,306 171 $25,000 24 $50,358 501 $65,150 322 $426,000 392 $2,620 575 $286,100 1,270 $10,600 31
Franklin $1,000 10 $5,500 0 $28,850 130 $3,300 10 $9,100 72 $0 0 $0 0 $11,167 0 $10,000 821
Gaston $209,000 700 $0 0 $0 0 $0 0 $0 0 $5,700 41 $73,500 186 $7,000 83 $132,500 125
19
2005 2006 2007 2008 2009 2010 2011 2012 2013
County Investment Jobs Investment Jobs Investment Jobs Investment Jobs Investment Jobs Investment Jobs Investment Jobs Investment Jobs Investment Jobs
Gates $0 0 $0 0 $0 0 $0 0 $0 0 $0 0 $0 0 $0 0 $0 0
Graham $150 2 $0 0 $0 0 $2,000 205 $0 0 $5,400 0 $0 0 $980 94 $0 0
Granville $18,000 180 $0 0 $50,000 0 $0 0 $17,000 42 $0 0 $35,000 35 $0 0 $0 0
Greene $0 0 $0 0 $6,465 89 $0 0 $0 0 $0 0 $0 0 $0 0 $12,000 57
Guilford $42,189 524 $117,100 1,165 $642,700 1,297 $155,425 1,893 $80,000 510 $479,250 542 $121,400 1,001 $179,751 1,547 $142,991 552
Halifax $14,100 116 $1,686 81 $7,000 65 $0 0 $9,000 124 $65,000 700 $2,850 54 $110,000 350 $4,200 57
Harnett $4,200 60 $0 0 $2,361 13 $0 0 $0 0 $0 0 $4,500 112 $0 0 $40,000 220
Haywood $6,030 82 $0 0 $0 0 $0 0 $0 0 $3,500 75 $12,250 49 $0 0 $5,900 80
Henderson $24,000 110 $5,000 50 $0 0 $700 30 $30,157 338 $0 0 $5,360 109 $112,000 170 $34,292 40
Hertford $0 0 $0 0 $0 0 $0 0 $0 0 $52,000 53 $85,000 112 $2,000 45 $0 0
Hoke $400 50 $20,700 67 $112,000 176 $800 27 $7,200 40 $0 0 $35,000 65 $29,900 21 $0 0
Hyde $56,078 125 $0 0 $0 0 $0 0 $3,000 12 $0 0 $150 5 $350 5 $0 0
Iredell $142,000 579 $8,500 150 $51,000 203 $213,428 337 $8,200 135 $42,000 237 $124,100 296 $95,350 166 $6,800 76
Jackson $0 0 $0 0 $0 0 $0 0 $16,691 61 $0 0 $500 125 $0 0 $0 0
Johnston $60,500 687 $7,600 118 $18,900 20 $0 0 $14,500 57 $198,400 465 $4,000 43 $33,000 199 $102,000 110
Jones $0 0 $2,000 25 $400 50 $0 0 $0 0 $0 0 $0 0 $0 0 $0 0
Lee $0 0 $28,000 484 $20,000 42 $7,000 10 $0 0 $70,892 780 $15,040 103 $13,138 76 $0 0
Lenoir $45,400 363 $4,250 37 $31,750 340 $1,035,764 3,063 $60,400 97 $12,400 344 $120,300 338 $0 0 $9,500 291
Lincoln $52,100 100 $20,000 181 $0 0 $19,500 45 $0 0 $16,300 50 $58,400 372 $30,345 490 $39,900 253
Macon $0 0 $0 0 $3,000 50 $2,600 32 $0 0 $0 0 $0 0 $0 0 $4,000 121
Madison $0 0 $0 0 $0 0 $0 0 $0 0 $0 0 $0 0 $0 0 $0 0
Martin $0 0 $600 65 $4,000 100 $4,630 310 $3,000 81 $0 0 $0 0 $7,490 220 $6,000 90
McDowell $12,400 420 $1,200 25 $3,250 317 $4,350 58 $10,550 201 $4,910 171 $23,736 164 $550 64 $2,700 89
Mecklenburg $100,662 1,730 $110,850 1,253 $8,500 849 $180,590 2,123 $117,640 4,975 $453,430 3,133 $228,502 2,251 $236,779 1,682 $272,840 4,719
Mitchell $900 206 $0 0 $2,300 70 $0 0 $0 0 $0 0 $0 0 $1,100 70 $0 0
Montgomery $42,300 77 $0 0 $0 0 $5,500 23 $100,000 100 $0 0 $15,300 146 $500 50 $57,862 561
Moore $0 0 $11,662 240 $4,000 86 $0 0 $2,330 72 $2,700 98 $0 0 $1,000 22 $3,000 35
Nash $39,070 1,612 $73,100 622 $16,825 155 $3,350 108 $0 0 $0 0 $0 0 $89,785 277 $7,300 74
New Hanover $144,000 219 $136,000 857 $25,000 25 $1,174,500 1,097 $25,000 30 $0 0 $15,000 25 $3,500 30 $88,300 555
Northampton $6,169 43 $21,500 288 $0 0 $212,000 45 $100 0 $0 0 $0 0 $7,000 42 $0 0
Onslow $12,000 350 $0 600 $300 35 $0 0 $0 0 $1,250 30 $0 0 $0 0 $8,400 200
Orange $6,780 120 $1,250 15 $2,640 25 $0 0 $8,500 72 $0 0 $3,300 90 $2,000 25 $45,000 100
Pamlico $0 0 $0 0 $0 0 $0 0 $0 0 $0 0 $0 0 $0 0 $0 0
Pasquotank $0 0 $0 0 $6,000 124 $0 0 $10,000 100 $2,900 63 $3,200 10 $0 0 $0 0
Pender $4,800 55 $0 0 $5,000 55 $3,000 30 $0 0 $650 40 $0 0 $0 0 $25,000 120
Perquimans $0 0 $0 0 $0 0 $0 0 $0 0 $0 0 $0 0 $0 0 $0 0
Person $0 0 $7,850 130 $35,200 277 $0 0 $900 375 $191,700 312 $29,500 120 $24,100 131 $45,000 140
Pitt $55,000 310 $90,320 215 $7,500 165 $0 0 $5,700 40 $0 0 $16,100 35 $71,100 40 $62,433 382
Polk $0 0 $0 0 $820 28 $0 0 $0 0 $0 0 $0 0 $860 25 $0 0
Randolph $78,411 460 $104,000 171 $0 0 $28,000 222 $900 20 $169,300 530 $30,200 144 $0 0 $16,500 130
Richmond $5,000 67 $73,500 225 $45,000 212 $32,000 42 $5,125 189 $19,000 250 $2,000 64 $6,675 122 $0 0

20
2005 2006 2007 2008 2009 2010 2011 2012 2013
County Investment Jobs Investment Jobs Investment Jobs Investment Jobs Investment Jobs Investment Jobs Investment Jobs Investment Jobs Investment Jobs
Robeson $41,100 840 $37,250 463 $21,200 205 $13,500 187 $750 25 $30,786 306 $4,500 342 $0 0 $38,687 451
Rockingham $49,600 275 $35,800 267 $115,113 389 $5,400 37 $3,840 45 $42,200 245 $10,417 249 $7,400 55 $40,000 517
Rowan $2,000 135 $31,000 752 $82,000 45 $600 46 $49,224 529 $30,800 387 $63,600 114 $71,108 1,579 $242,500 476
Rutherford $8,900 97 $8,168 551 $27,155 254 $3,100 1,300 $5,000 55 $463,497 95 $364,300 601 $19,200 707 $10,637 76
Sampson $1,650 30 $775 10 $4,200 130 $200,000 100 $0 0 $12,511 65 $12,250 128 $4,250 90 $163,000 65
Scotland $23,125 58 $0 0 $0 0 $19,300 175 $13,200 133 $600 45 $24,000 41 $59,650 187 $34,400 122
Stanly $0 0 $9,000 87 $0 0 $21,400 182 $0 0 $11,300 74 $4,400 197 $0 0 $3,800 25
Stokes $0 0 $0 0 $71,000 65 $30,000 0 $0 0 $0 0 $0 0 $0 0 $1,000 5
Surry $34,500 238 $5,200 146 $0 0 $140,030 82 $10,895 351 $4,500 38 $100,103 443 $8,420 45 $23,500 160
Swain $0 0 $0 0 $0 0 $0 20 $0 0 $0 0 $0 0 $0 0 $0 0
Transylvania $20,000 110 $0 0 $0 0 $0 0 $0 0 $0 0 $500 15 $18,000 105 $0 0
Tyrrell $0 0 $0 0 $0 0 $0 0 $0 0 $0 0 $0 0 $0 0 $0 0
Union $0 0 $41,760 451 $267,900 347 $4,000 4 $600 5 $27,350 101 $2,200 24 $2,300 36 $0 0
Vance $9,300 220 $2,000 100 $1,750 18 $16,000 5 $2,314 345 $3,000 152 $89,700 256 $0 0 $0 0
Wake $218,440 1,037 $473,900 3,628 $143,700 3,036 $120,050 1,498 $430,400 1,966 $47,110 491 $143,400 956 $89,950 1,237 $117,278 2,865
Warren $0 0 $0 0 $0 0 $0 0 $0 0 $0 0 $0 0 $0 0 $0 0
Washington $250 1 $0 0 $0 0 $0 0 $5,330 144 $0 0 $0 0 $0 0 $0 0
Watauga $0 0 $0 0 $0 0 $0 0 $0 0 $0 0 $1,080 10 $0 0 $0 0
Wayne $11,500 436 $6,200 182 $2,000 58 $7,875 122 $0 0 $0 0 $17,914 137 $3,000 44 $16,700 96
Wilkes $1,500 42 $4,000 0 $0 0 $3,000 12 $0 0 $28,800 200 $4,800 114 $16,350 339 $7,959 226
Wilson $6,300 84 $50,300 884 $5,300 123 $108,000 92 $0 0 $0 0 $15,400 85 $60,458 32 $59,000 100
Yadkin $0 0 $0 0 $13,000 170 $7,000 120 $27,000 172 $8,000 20 $48,700 285 $0 0 $0 0
Yancey $0 0 $0 0 $0 0 $0 0 $0 0 $0 0 $0 0 $0 0 $0 0
Totals $2,882,261 18,230 $2,411,199 20,846 $2,569,468 14,711 $5,124,475 19,490 $2,886,336 16,840 $3,986,852 17,380 $3,067,918 16,184 $3,477,317 16,506 $2,800,272 18,486
Source: North Carolina Department of Commerce, Business & Industry Division

21
APPENDIX B: Legislative Requirements for Tax Credits for Growing Businesses Act § 105-129.82. (See notes) Sunset; studies.
(a) Sunset. – This Article is repealed effective for business activities that occur on or after January 1, 2014. (b) Equity Study. – The Department of Commerce shall study the effect of the tax incentives provided in this Article on tax equity. This study shall include the following:
(1) Reexamining the formula in G.S. 143B-437.08 used to define development tiers, to include consideration of alternative measures for more equitable treatment of counties in similar economic circumstances. (2) Considering whether the assignment of tiers and the applicable thresholds are equitable for smaller counties. (3) Compiling any available data on whether expanding North Carolina businesses receive fewer benefits than out-of-State businesses that locate to North Carolina.
(c) Impact Study. – The Department of Commerce shall study the effectiveness of the tax incentives provided in this Article. This study shall include:
(1) Studying the distribution of tax incentives across new and expanding businesses and industries. (2) Examining data on economic recruitment for the period from 2005 through the most recent year for which data are available by county, by industry type, by size of investment, and by number of jobs, and other relevant information to determine the pattern of business locations and expansions before and after the enactment of this Article. (3) Measuring the direct costs and benefits of the tax incentives. (4) Compiling available information on the current use of incentives by other states and whether that use is increasing or declining.
(d) Report. – The Department of Commerce shall report the results of these studies and its recommendations to the General Assembly biennially with the first report due by June 1, 2009. (2006-252, s. 1.1; 2010-147, s. 1.1; 2012-36, s. 5.)