task force finding and rationale statement: obesity ... · obesity prevention and control:...
TRANSCRIPT

Obesity Prevention and Control: Behavioral Interventions that Aim to Reduce Recreational Sedentary Screen Time Among Children
Task Force Finding and Rationale Statement
Table of Contents Context ................................................................................................................................................................................ 2
Intervention Definition ....................................................................................................................................................... 2
Task Force Finding ............................................................................................................................................................... 3
Rationale ............................................................................................................................................................................. 3
Basis of Finding ............................................................................................................................................................... 3
Applicability and Generalizability Issues ....................................................................................................................... 11
Data Quality and Study Design Issues ........................................................................................................................... 12
Other Benefits and Harms............................................................................................................................................. 12
Economic Evidence ....................................................................................................................................................... 12
Considerations for Implementation .............................................................................................................................. 13
Evidence Gaps ............................................................................................................................................................... 14
References ........................................................................................................................................................................ 15
Disclaimer .......................................................................................................................................................................... 16

Task Force Finding and Rationale Statement
2
Task Force Finding and Rationale Statement
Context Childhood obesity has been associated with time spent watching TV (Marshall et al. 2004, Tremblay et al. 2011). The
American Academy of Pediatrics (AAP) recommends no more than 2 hours per day of screen time for children 2 years
and older and none for children younger than 2 years (American Academy of Pediatrics 2001). In the U.S., children aged
8-18 years report an average of 7 hours of screen time per day, of which 3.5 hours are spent watching TV/DVDs
(Rideout, et al. 2010). Children aged 5 years and younger spend an average of 2 hours per day with screen media (i.e.,
TV, DVDs, videos, video/computer games), of which approximately 1.5 hours are spent watching TV or videos (Rideout
2011).
Intervention Definition Behavioral interventions that aim to reduce recreational (i.e., neither school-related nor work-related) sedentary screen
time teach behavior change self-management skills to initiate or maintain behavior change.
Behavioral screen time interventions are classified into two types:
1. Screen-time-only interventions only focus on reducing recreational sedentary screen time.
2. Screen-time-plus interventions focus on reducing recreational sedentary screen time and increasing physical
activity and/or improving diet.
Screen-time-only and screen-time-plus interventions teach behavior change self-management skills through one or
more of the following components:
Classroom-based education
Tracking and monitoring
Coaching or counseling sessions
Family-based or peer social support
Interventions may include one or more additional components: use of an electronic monitoring device to limit screen
time; TV Turnoff Challenge; screen time contingent on physical activity; or small media.
Screen-time-only and screen-time-plus interventions are stratified by intensity:
High-intensity interventions must include use of an electronic monitoring device to limit screen time or at least
three personal or computer-tailored interactions. Interactions must focus on screen time and may be in person
or by phone or computer.
Low-intensity interventions include two or fewer personal or computer-tailored interactions..

Task Force Finding and Rationale Statement
3
Task Force Finding (August 2014)
The Community Preventive Services Task Force recommends behavioral interventions to reduce recreational sedentary
screen time among children aged 13 years and younger. This finding is based on strong evidence of effectiveness in
reducing recreational sedentary screen time, increasing physical activity, improving diet, and improving or maintaining
weight-related outcomes. Evidence includes studies of interventions that focus only on reducing recreational sedentary
screen time (screen-time-only) and studies that focus on reducing recreational sedentary screen time and improving
physical activity and/or diet (screen-time-plus). Limited evidence was available to assess the effectiveness of these
interventions among adults.
Rationale
Basis of Finding
The Task Force finding of strong evidence of effectiveness is based on evidence from a Community Guide systematic
review completed in 2008 (7 studies with 9 study arms, search period 1966–July 2007) combined with an updated
search for evidence in 2013 (42 studies with 53 study arms, search period April 2007–June 2013). Of the 49 included
studies, 12 evaluated screen-time-only interventions (14 study arms) and 37 evaluated screen-time-plus interventions
(48 study arms). The follow-up period for all studies ranged from just under 1 month to 4 years (median 6 months).
Among the studies included in the review, two targeted adults specifically and two targeted families (i.e., parents and
children), and the remainder considered program effects on children aged 13 years and younger. No included studies
looked at adolescents aged 14-18 years. Given the limited evidence on adults and lack of evidence for adolescents, the
remainder of this document reports data for children aged 13 years and younger, including child data from the two
family studies.
Evidence indicates that behavioral screen time interventions are effective in reducing recreational sedentary screen time
(47 study arms), improving physical activity (42 study arms), improving diet (37 study arms), and improving or
maintaining weight status (38 study arms). These interventions reduce obesity prevalence (11 study arms) and
disparities in weight status between children of high and low socioeconomic status (4 study arms). Results are detailed
in the table below.
Recreational sedentary screen time was assessed by TV time alone or composite screen time. Composite screen time
was calculated by adding TV viewing to at least one other form of screen time such as video game playing or computer
use. Physical activity and nutrition were assessed using multiple outcome measures. Weight was assessed by BMI, BMI
for age-and-sex percentile, BMI z-score, percent body fat, or obesity prevalence.

Task Force Finding and Rationale Statement
4
Effectiveness of Behavioral Interventions that Aim to Reduce Recreational Sedentary Screen Time Among Children
Outcome
(# of Study ArmsA) ResultsB
Composite Screen Time
(34)
Screen-Time-Only and Screen-Time-Plus (34 study arms):
Median decrease of 26.4 minutes/day (IQI: -74.4 to -12.0 minutes/day)
Screen-Time-Only
High Intensity (7 study arms)
Median decrease of 82.2 minutes/day (IQI: -117.6 to -67.2 minutes/day)
Low Intensity (4 study arms)
Median decrease of 51.6 minutes/day (range: -116.4 to -23.4 minutes/day)
Screen-Time-Plus
High Intensity (17 study arms)
Median decrease of 21.6 minutes/day (IQI: -44.4 to -10.8 minutes/day)
Low Intensity (6 study arms)
Median decrease of 19.2 minutes/day (IQI: -28.2 to 10.8 minutes/day)
Commercial TV Viewing
(27)
Screen-Time-Only and Screen-Time-Plus (27 study arms):
Median decrease of 22.2 minutes/day (IQI: -76.8 to -0.6 minutes/day)
Screen-Time-Only
High Intensity (6 study arms)
Median decrease of 46.8 minutes/day (IQI: -208.8 to -34.8 minutes/day)
Low Intensity (3 study arms)
Median decrease of 0.6 minutes/day (range: -120.6 to 0 minutes/day)
Screen-Time-Plus
High Intensity (13 study arms)
Median decrease of 13.8 minutes/day (IQI: -52.2 to 6.0 minutes/day)
Low Intensity (5 study arms)
Median decrease of 18 minutes/day (IQI: -77.4 to 0.6 minutes/day)

Task Force Finding and Rationale Statement
5
Outcome
(# of Study ArmsA) ResultsB
Accelerometer Counts of
Physical Activity
(11)
Screen-Time-Only
High Intensity (1 study arm)
Decrease of 7.5 counts/minute
Screen-Time-Plus
High Intensity
Screen time contingent on physical activity (3 study arms):
Median increase of 130.0 counts/day (range: 127.8 to 150.0 counts/day)
Screen time not contingent on physical activity (7 study arms)
Median increase of 66.0 counts/day (range: 40.8 to 115.0 counts/day; 4 study arms)
Median increase of 3.6 counts/minute (range: -12.3 to 18.0; 3 study arms)
Pedometer Steps of Physical
Activity
(9)
Screen-Time-Only
High Intensity (2 study arms)
Increases of 1150 steps/day and 298 steps/day
Low Intensity (1 study arm)
Increase of 992 steps/day
Screen-Time-Plus
High Intensity (4 study arms)
Median increase of 1359.5 steps/day (range: -258.0 to 4972.0 steps/day)
Low Intensity (2 study arms)
Increase of 239 steps/day (1 study arm); decrease of 993 steps/day (1 study arm)

Task Force Finding and Rationale Statement
6
Outcome
(# of Study ArmsA) ResultsB
Score on Fitness Test
(9)
Screen-Time-Only
High Intensity (1 study arm)
Increase of 0.87 laps, 20 meter shuttle run
Screen-Time-Plus
High Intensity (6 study arms)
Significant increase (3 study arms); general improvement (3 study arms); various fitness
tests used
Low Intensity (2 study arms)
Significant increase (1 study arm) and no change (1 study arm); various fitness measures
used
Duration of Physical Activity
(18)
Screen-Time-Only
High Intensity (2 study arms)
Increase of 30.0 minutes/day (1 study arm); decrease of 2.4 minutes/day (1 study arm)
Low Intensity (1 study arm)
Decrease of 70.6 minutes/day (baseline was 201.4 minutes/day)
Screen-Time-Plus
High Intensity (9 study arms)
Median increase of 1.2 minutes/day (IQI: -4.5 to 20.2 minutes/day)
Low Intensity (4 study arms)
Median increase of 5.1 minutes/day (range: -2.5 to 15.4 minutes/day)
Total Energy Intake
(6)
Screen-Time-Only
High Intensity (1 study arm)
Decrease of 75 kcal/day
Screen-Time-Plus
High Intensity (5 study arms)
Median decrease of 117.9 kcal/day (IQI: -373.1 to 28.5 kcal/day)

Task Force Finding and Rationale Statement
7
Outcome
(# of Study ArmsA) ResultsB
Eating or Snacking with the
TV On
(11)
Screen-Time-Only
High Intensity (3 study arms)
All studies reported a decrease; various measures used
Low Intensity (4 study arms)
All studies reported a decrease; various measures used
Screen-Time-Plus
High Intensity (4 study arms)
All studies reported a decrease; various measures used
Snack Intake
(14)
Screen-Time-Only
High Intensity (1 study arm)
Decrease in snack intake of 233.6 kcal/day
Low Intensity (1 study arm)
Decrease in snack intake of 123.7 kcal/day
Screen-Time-Plus
High Intensity (6 study arms)
Median increase of 0.01 servings/day (range: -0.38 to 0.19 servings/day; 3 study arms)
Decrease in snack intake (significant decrease in 1 of 3 study arms); various measures
used
Low Intensity (6 study arms)
Median decrease of 0.19 servings/day (range: -0.80 to 0.30 servings/day; 4 study arms)
Decrease in snack intake (2 study arms); various measures used

Task Force Finding and Rationale Statement
8
Outcome
(# of Study ArmsA) ResultsB
Sugar Sweetened Beverage
(SSB) Intake
(16)
Screen-Time-Only
Not reported
Screen-Time-Plus
High Intensity (10 study arms)
Relative decrease of 17.2% (IQI: -54.9 to -9.2%; 8 study arms)
Decrease in SSB intake (2 study arms); various measures used
Low Intensity (6 study arms)
Relative decrease of 1.6% (IQI: -40.9 to 5.4%)
Fruit and Vegetable Intake
(20)
Screen-Time-Only
Not reported
Screen-Time-Plus
High Intensity (12 study arms)
Median increase of 0.16 servings/day (IQI: -0.25 to 0.43 servings/day; 9 study arms)
Increase in fruit and vegetable intake (3 study arms); various measures used
Low Intensity (8 study arms)
Median increase of 0.50 servings/day (IQI: -0.85 to 1.04 servings/day; 5 study arms)
Significant increase (1 study arm); general improvement (2 study arms); various measures
used

Task Force Finding and Rationale Statement
9
Outcome
(# of Study ArmsA) ResultsB
Body Mass Index (BMI)
(15)
Screen-Time-Only
High Intensity (3 study arms)
Median decrease of 0.44 kg/m2 (or -2.6 pounds; range -0.45 to -0.04 kg/m2)
Low Intensity (1 study arm)
Decrease of 0.09 kg/m2
Screen-Time-Plus
High Intensity (9 study arms)
Median decrease of 0.21 kg/m2 (or -1.3 pounds; IQI: -0.65 to -0.07 kg/m2)
Low Intensity (2 study arms)
Increases of 0.10 kg/m2 and 0.16 kg/m2
BMI-for-age-and-sex
percentile
(2)
Screen-Time-Only
Not reported
Screen-Time-Plus
High Intensity (2 study arms)
Decrease of 0.92% (1 study arm); increase of 1.7% (1 study arm)
BMI z-score (BMIz)
(17)
Screen-Time-Only
High Intensity (1 study arm)
Significant decrease of 0.20 standard deviations
Low Intensity (1 study arm)
No change
Screen-Time-Plus
High Intensity (10 study arms)
Median decrease of 0.11 standard deviations (IQI -0.19 to 0.02 standard deviations; 7
study arms);
no change (3 study arms)
Low Intensity (5 study arms)
Median decrease of 0.20 standard deviations (IQI -0.34, -0.02 standard deviations)

Task Force Finding and Rationale Statement
10
Outcome
(# of Study ArmsA) ResultsB
Body Fat
(11)
Screen-Time-Only
High Intensity (2 study arms)
Significant decrease in skinfold thickness of 1.5 mm (1 study arm)
Significant reduction in percent body fat of 2.5 percentage points (1 study arm)
Screen-Time-Plus
High Intensity (7 study arms)
Median decrease in percent body fat of 4.9 percentage points (IQI -5.9 to -2.8 percentage
points; 5 study arms)
Decrease in skinfold thickness of 0.52 mm and 0.41 mm (2 study arms)
Low Intensity (2 study arms)
Decrease in percent body fat of 0.83 percentage points (1 study arm);
Increase of 0.08 percentage points (1 study arm)
Obesity Prevalence
(11)
Screen-Time-Only
Not reported
Screen-Time-Plus
High Intensity (9 study arms)
Median decrease of 2.0 percentage points (IQI: -2.8 to -1.1 percentage points)
Low Intensity (2 study arms)
Decreases of 1.1 and 2.0 percentage points
Task Force Finding and Rationale Statement
11
Outcome
(# of Study ArmsA) ResultsB
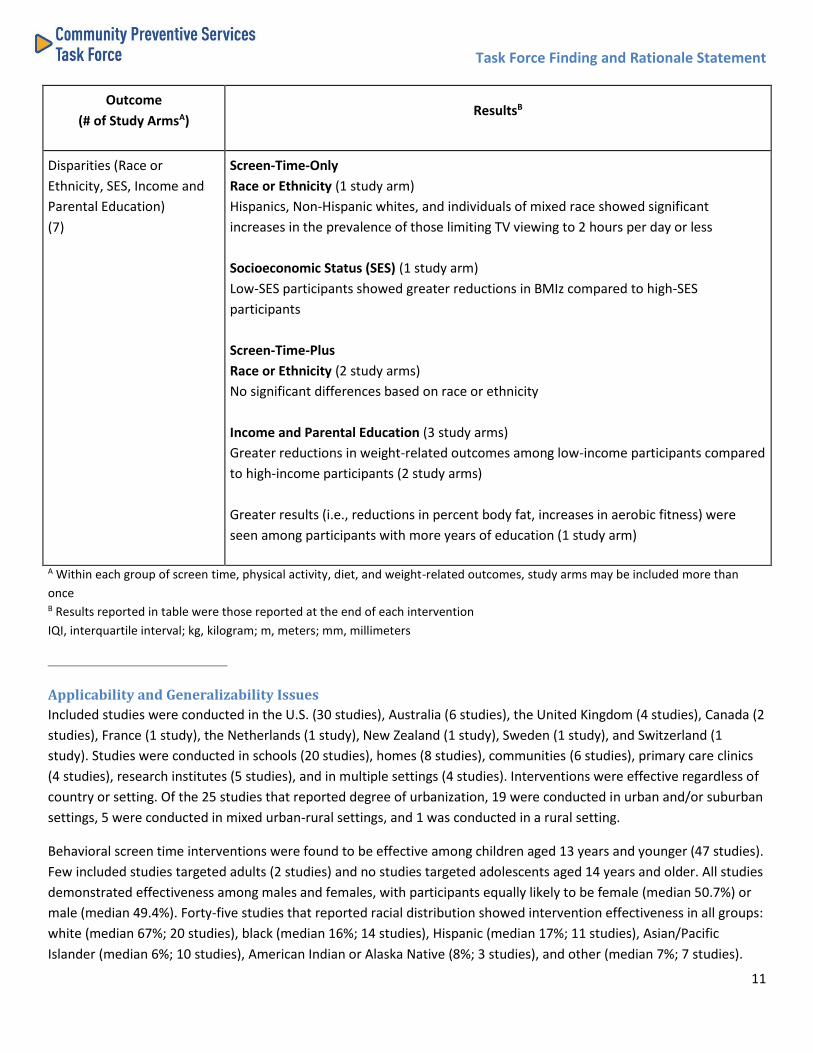
Disparities (Race or
Ethnicity, SES, Income and
Parental Education)
(7)
Screen-Time-Only
Race or Ethnicity (1 study arm)
Hispanics, Non-Hispanic whites, and individuals of mixed race showed significant
increases in the prevalence of those limiting TV viewing to 2 hours per day or less
Socioeconomic Status (SES) (1 study arm)
Low-SES participants showed greater reductions in BMIz compared to high-SES
participants
Screen-Time-Plus
Race or Ethnicity (2 study arms)
No significant differences based on race or ethnicity
Income and Parental Education (3 study arms)
Greater reductions in weight-related outcomes among low-income participants compared
to high-income participants (2 study arms)
Greater results (i.e., reductions in percent body fat, increases in aerobic fitness) were
seen among participants with more years of education (1 study arm)
A Within each group of screen time, physical activity, diet, and weight-related outcomes, study arms may be included more than
once B Results reported in table were those reported at the end of each intervention
IQI, interquartile interval; kg, kilogram; m, meters; mm, millimeters
Applicability and Generalizability Issues
Included studies were conducted in the U.S. (30 studies), Australia (6 studies), the United Kingdom (4 studies), Canada (2
studies), France (1 study), the Netherlands (1 study), New Zealand (1 study), Sweden (1 study), and Switzerland (1
study). Studies were conducted in schools (20 studies), homes (8 studies), communities (6 studies), primary care clinics
(4 studies), research institutes (5 studies), and in multiple settings (4 studies). Interventions were effective regardless of
country or setting. Of the 25 studies that reported degree of urbanization, 19 were conducted in urban and/or suburban
settings, 5 were conducted in mixed urban-rural settings, and 1 was conducted in a rural setting.
Behavioral screen time interventions were found to be effective among children aged 13 years and younger (47 studies).
Few included studies targeted adults (2 studies) and no studies targeted adolescents aged 14 years and older. All studies
demonstrated effectiveness among males and females, with participants equally likely to be female (median 50.7%) or
male (median 49.4%). Forty-five studies that reported racial distribution showed intervention effectiveness in all groups:
white (median 67%; 20 studies), black (median 16%; 14 studies), Hispanic (median 17%; 11 studies), Asian/Pacific
Islander (median 6%; 10 studies), American Indian or Alaska Native (8%; 3 studies), and other (median 7%; 7 studies).

Task Force Finding and Rationale Statement
12
Interventions were effective in low-income populations (9 studies) and targeted low-income African-American children
(3 studies), Special Supplemental Nutrition Program for Women, Infants, and Children (WIC) participants (2 studies),
Head Start program participants (1 study), and disadvantaged children (3 studies). Studies that targeted overweight or
obese populations (6 studies) also were shown to be effective.
The effectiveness of behavioral screen time interventions in socioeconomic status was examined by five studies that
performed stratified analyses (analyses did not account for the potential ceiling effect phenomenon or regression
toward the mean). Four of these studies examined the impact of interventions on weight-related outcomes, and three
of these showed greater reductions (e.g., BMI, obesity prevalence) in low-income populations compared to high-income
populations. One study examined the impact on a screen time outcome. This study was conducted in WIC clinics and
reported the proportion of non-high school graduates who limited their children's TV viewing time to 2 hours or less per
day increased more for than parents who graduated from high school.
Data Quality and Study Design Issues
Included studies were conducted as randomized controlled trials (RCT) or group RCTs (37 studies), single group before-
after studies (5 studies), before-after studies with a comparison group (4 studies), and a non-randomized trial (1 study).
Common limitations across studies included sampling methods, loss to follow-up, and not controlling for potential
confounders.
Calculating an effect estimate was often difficult because inconsistent measures were used for physical activity and diet-
related outcomes. Further, 15 of 38 study arms that reported a weight-related outcome for children reported BMI,
which does not account for their growth. CDC recommends reporting children's BMI-for-age-and-sex percentile or BMI
z-score, which provide greater validity than BMI because they account for children's growth (Centers for Disease Control
and Prevention 2014, Must and Anderson 2006).
Other Benefits and Harms
One RCT reported that reducing television, videotape, and video game use in third- and fourth-grade students also
decreased aggressive behavior (Robinson, et al. 2001).
No harms of the intervention were identified.
Economic Evidence
The economic review included three models from two studies based on randomized controlled trials included in the
effectiveness review. Both trials targeted children. The search for economic evaluations included the search conducted
for the effectiveness review and an additional search in the EconLit and CRD-York databases (search period January 1966
- January 2014). One study modeled cost-effectiveness outcomes (cost per quality-adjusted life year) for a screen-time-
plus intervention. The second study developed a cost-effectiveness model with alternate specifications for the same
screen-time-plus intervention and developed another model for a screen-time-only intervention. A general conclusion
about cost-effectiveness could not be determined because the results from this small body of evidence were mixed.
The models estimated intervention cost based on descriptions of activities and resources from the trials. Intervention
benefits were measured as quality-adjusted life years (QALYs) and averted healthcare costs, based on reduced morbidity
and mortality from overweight-related diseases and conditions. Researchers used modeling to estimate cost-
effectiveness because the interventions targeted children and the diseases and conditions for which overweight is a risk
factor occur in adulthood. All monetary values are reported in 2013 U.S. dollars.

Task Force Finding and Rationale Statement
13
Intervention cost: The studies estimated intervention cost by enumerating the resources used from the description of
interventions and assigning per-unit cost to each resource.
The cost per person per year was $43 for the screen-time-plus intervention. The following components were included in
the cost estimation: counseling or education sessions; training for staff; supplies and equipment; and education
materials.
The cost per person per year was $248 for the screen-time-only intervention. The following components were included
in the cost estimation: counseling or education sessions; tracking and monitoring; electronic monitoring device; training
for staff; supplies and equipment; and small media.
The higher cost for the screen-time-only intervention was partially explained by the inclusion of the electronic
monitoring device, a greater number of sessions, and labor costs associated with tracking and monitoring outcomes.
Further, while the screen-time-plus intervention included educational materials, the cost for this component was
smaller because it was incorporated into the regular academic curriculum.
Healthcare cost and QALY: Healthcare costs are averted and QALYs are saved when the intervention reduces morbidity
and mortality associated with overweight-related diseases and conditions.
The models used in both the screen-time-plus and screen-time-only studies assumed that each prevented case of
overweight in adulthood would avert about $4000 in healthcare cost, and increase QALY saved by 0.71. Both estimates
were drawn from longitudinal data gathered in U.S national surveys.
Cost-effectiveness: Cost-effectiveness is measured as net cost (intervention cost minus healthcare cost averted) per
QALY saved.
In both models, the following variables were included as major determinants for cost-effectiveness estimates: size of
intervention group; cases of overweight prevented attributable to intervention; transition of weight status to adulthood;
intervention cost per person; and 50% relapse to overweight.
The two models for the screen-time-plus intervention estimated the cost per QALY saved to be $7,578 without relapse
and $22,870 with relapse, indicating the intervention was cost-effective either way, based on a conservative $50,000
threshold.
The RCT for the screen-time-only intervention did not capture reduction in overweight prevalence. The modeling
assumed 5%, 10%, 15%, and 20% reductions in overweight prevalence and generated estimates of cost per QALY saved
ranging from $10,196 to $57,503 without relapse and $25,965 to $120,580 with 50% relapse. Because the higher end
values exceed the $50,000 per QALY threshold, it is difficult to make a definitive statement about cost-effectiveness of
this intervention.
Considerations for Implementation
When selecting a screen-time intervention, time, resources, intensity, and deliverer are all important considerations.
Evidence from this review demonstrates that screen-time-only and screen-time-plus interventions are effective at
reducing recreational sedentary screen time. Although both are effective, screen-time-only interventions showed
greater reductions in TV viewing and composite screen time compared to screen-time-plus interventions. Although

Task Force Finding and Rationale Statement
14
intervention intensity appeared important for screen-time-only studies, it was not as important among screen-time-plus
studies.
Family-based social support was the most common intervention component used in the included studies. This highlights
the importance of family and parental support in changing sedentary screen time behavior among children. Family-
based social support, in combination with electronic monitoring devices, was found to be highly effective, especially in
screen-time-only studies. Electronic monitoring devices, which allowed users to set time limits for TV, DVD, and/or
videogame use, were distributed across all settings and usually installed at home by parents.
Availability of electronic monitoring devices for various digital media has increased in recent years. For example, parents
can limit screen time through low-cost apps that can be installed on mobile devices, and some cable providers and e-
readers offer time controls. Because younger children have less autonomy, these types of devices might be more
successful among younger children than adolescents. Parents' ability to limit their child's sedentary screen time is likely
to diminish as the child gets older.
Schools were the most common setting for included studies. Most school interventions (90%) were screen-time-plus.
Many programs incorporated intervention materials into regular classroom curricula, and most U.S. programs trained
existing classroom teachers to deliver the intervention. The review team identified competing demands with other
school subjects as a barrier to implementation. This was supported by Salmon and colleagues (2011), who interviewed
teachers that delivered a separate screen time intervention. The teachers reported not having enough time to deliver all
of the intervention lessons and suggested integrating the program into existing curricula.
Among the included studies were two large-scale community-wide, multi-setting interventions conducted in Australia. A
screen-time-plus intervention targeting children aged 0-5 years and their families was implemented in school,
community, and primary care clinic settings. Components included a TV Turnoff Challenge, tracking and monitoring,
family-based social support, coaching and counseling, environmental changes, classroom-based education, and mass
media.
Researchers in the U.S. are in the process of conducting similar large-scale studies. In 2010, the National Institutes of
Health initiated the Childhood Obesity Prevention and Treatment Research (COPTR) Consortium, a 7-year project to
examine the many influences on childhood and adolescent obesity and to intervene at multiple levels of influence,
including home, school, neighborhood, and pediatric primary care settings (National Institutes of Health 2014). In 2011,
CDC initiated the Childhood Obesity Demonstration Project, a 4-year project to address nutrition and physical activity
behaviors in health care clinics, schools, early care and education settings, communities, and homes (Centers for Disease
Control and Prevention 2014). In 2012, three grantees (two universities and one state health department) began
implementing and evaluating multi-setting, multicomponent interventions. A multi-setting, multicomponent
intervention may represent a future approach for addressing childhood obesity.
Evidence Gaps
Although evidence shows that behavioral interventions to reduce recreational sedentary screen time are effective,
important research questions remain. Future studies should examine which combinations of components are most
effective and which components are critical to success. In addition, research should be done to explore the effect of
program intensity and duration on key outcomes. For example, does a low-intensity, 1-year intervention show greater
effectiveness than a high-intensity, 3-month intervention? Follow-up research also should be done to determine how
long intervention effects last after an intervention stops.

Task Force Finding and Rationale Statement
15
Behavioral interventions aimed at reducing sedentary screen time should be applicable in most populations, though
more research is needed on the varying effectiveness of interventions by age group and degree of urbanization. Because
time spent with screen media increases dramatically with age, additional research is needed among middle- and high-
school-aged adolescents. Children aged 0-6 years average just over 2 hours of screen time per day, whereas 8-18-year-
olds average 7.5 hours of screen time per day, not including time spent with screen media for school work (Rideout
2011, Rideout, et al. 2010). Research also is needed for adult populations, which may require a different intervention
approach. In addition, studies should consider degree of urbanization. Most included studies were implemented in
urban or suburban settings, and it remains unknown how successful similar interventions would be in rural settings,
where the barriers to physical activity are different.
Hypothesized mechanisms for the relationship between screen time and weight include food and drink advertising,
eating while watching TV, and displacement of physical activity. Does the importance of these mechanisms change
depending on the form of screen media being used? For example, does eating while watching TV have a stronger
association with weight than being exposed to digital advertising on a mobile device, which is often tailored to
individuals?
It also would be beneficial for researchers to consider other benefits and implications of reduced screen time. For
example, when screen time decreases, do other sedentary behaviors increase (e.g., reading for leisure, arts and crafts,
listening to music)? And do reductions in screen time lead to other health benefits, such as improved sleep quality and
duration?
Technology is evolving rapidly, and evidence about the impact of newer technologies such as tablets or smartphones
rarely was reported in the body of evidence in this review. Thus, the extent to which these mobile devices are associated
with increased sedentary behavior and obesity is unknown, as are the effects of changes in their use on outcomes
included in this review. The number of studies using mobile devices is increasing, and the literature should be
monitored.
There are very few economic evaluations of interventions that aim to reduce recreational sedentary screen time. It is
important that evaluations report at least the cost of the intervention. Also, more studies are needed that model the
outcomes from overweight or obesity reduction to expected savings in healthcare cost, productivity, and QALYs. This
evidence is particularly important for interventions that target children. Averted healthcare cost, improved academic
productivity, and increased quality of life during the childhood years owing to reduced screen time need more attention
in economic models.
The data presented here are preliminary and are subject to change as the systematic review goes through the scientific
peer review process.
References American Academy of Pediatrics. 2001. American Academy of Pediatrics. Children, adolescents, and television. Pediatrics
107: 423-26
Centers for Disease Control and Prevention. About BMI for Children and Teens. Atlanta (GA): CDC;2014. Available at
URL: http://www.cdc.gov/healthyweight/assessing/bmi/childrens_BMI/about_childrens_BMI.html.

Task Force Finding and Rationale Statement
16
Centers for Disease Control and Prevention. Childhood Obesity Demonstration Project. Atlanta (GA): CDC; 2014.
Available at URL: http://www.cdc.gov/obesity/childhood/researchproject.html.
Marshall SJ, Biddle SJ, Gorely T, Cameron N, Murdey I. Relationships between media use, body fatness and physical
activity in children and youth: a meta-analysis. Int J Obes Relat Metab Disord 2004;28: 1238-46.
Must A, Anderson SE. Body mass index in children and adolescents: considerations for population-based applications. Int
J Obes 2006;30: 590-94.
National Institutes of Health, National Hearth, Lung, and Blood Institute. Addressing childhood obesity where children
live, learn, and play. U.S. Department of Health and Human Services; 2014. Available at URL:
http://www.nhlbi.nih.gov/news/spotlight/fact-sheet/addressing-childhood-obesity-where-children-live-learn-and-
play.html.
Rideout V. Zero to Eight: Children's Media Use in America. Common Sense Media; 2011.
Rideout VJ, Foehr UG, Roberts DF. GENERATION M2: Media in the lives of 8- to 18-Year-Olds. Menlo Park (CA): The Henry
J. Kaiser Family Foundation; 2010.
Robinson TN, Wilde ML, Navracruz LC, Haydel KF, Varady A. Effects of reducing children's television and video game use
on aggressive behavior: a randomized controlled trial. Arch Pediatr Adolesc Med 2001;155: 17-23.
Tremblay MS, LeBlanc AG, Kho ME, Saunders TJ, Larouche R, et al. Systematic review of sedentary behaviour and health
indicators in school-aged children and youth. Int J Behav Nutr Phys Act 2011;8: 98.
Disclaimer The findings and conclusions on this page are those of the Community Preventive Services Task Force and do not necessarily
represent those of CDC. Task Force evidence-based recommendations are not mandates for compliance or spending. Instead, they
provide information and options for decision makers and stakeholders to consider when determining which programs, services, and
policies best meet the needs, preferences, available resources, and constraints of their constituents.
Document last updated August 12, 2015