task 2.1.1 development of baselines of marine litter
TRANSCRIPT

Page 1 of 45
Task 2.1.1 Development of baselines of marine litter - Report on the analysis of compiled beach litter data and proposals for setting
preliminary beach litter baselines in the Baltic Sea
Authors: Tamara Zalewska, Włodzimierz Krzymiński
Institute of Meteorology and Water Management – National Research Institute, Maritime Branch, Waszyngtona 42, 81-342 Gdynia, POLAND
Contributors: Arūnas Balčiūnas1; Eva Blidberg2, Dennis Gräwe3, Per Nilsson4, Marek Press5, Marta Ruiz6, Outi Setälä7, Jakob Strand8, Janis Ulme9
1 Klaipeda University, Open Access Centre for Marine Research, H. Manto str. 84, LT 92294, Klaipeda, Lithuania
2 Håll Sverige Rent, Besöks- och postadress: Rosterigränd 4, 117 61 Stockholm, Sweden
3 State Agency for Environment, Nature Conservation and Geology, Mecklenburg-Vorpommern, Division 3 Geology, Water and Soil, Department 330 Water Quality Inland- and Coastal Water, Goldberger Straße 12, 18273 Güstrow, Germany
4 University of Gothenburg, Department of Marine Sciences, Carl Skottsbergs gata 22 B, 413 19 Göteborg, Sweden
5 Keep the Estonian Sea Tidy, Estonia
6 HELCOM Secretariat, Katajanokanlaituri 6 B, FI-00160 Helsinki, Finland
7 Finnish Environment Institute (SYKE), Marine Research Centre/Marine Assessments and Management, Mechelininkatu 34a, FI-00260 Helsinki
8 Aarhus University, National Centre for Environment and Energy (DCE) Frederiksborgvej 399, 4000 Roskilde, Denmark
9 Foundation for Environmental Education, Margrietas iela 16 - 3, Rīga, LV-1046, Latvia

Page 2 of 45
Contents
1. Summary.......................................................................................................................................... 3
2. Introduction ..................................................................................................................................... 4
3. Data collection ................................................................................................................................. 4
4. Data evaluation ............................................................................................................................... 7
5. Results and discussion ..................................................................................................................... 8
6. Proposals for setting preliminary beach litter baselines ............................................................... 40
Page 3 of 45
1. Summary 1. Beach litter monitoring carried out in HELCOM countries covers different periods. In most of the countries (Estonia, Finland, Germany, Latvia and Sweden) monitoring started in 2012 and has continued until now. In Denmark and Poland it started in 2015, while in Lithuania the monitoring period covered only period 2012-2013.
2. Monitoring programmes in the Baltic Sea area also take into account seasonal variations. In most of the countries monitoring is conducted in three seasons: spring, summer, autumn. Regular monitoring in winter is conducted in Germany and Poland, while in Latvia monitoring is carried out only in summer. Additionally, several sites are monitored seasonally in Latvia as an instrument of verification and in-depth local research.
3. Monitoring of beach litter is conducted in the countries with different individual litter items categorization methods, which makes it difficult to compare results and perform statistical calculations. It would be optimal to adopt one litter item categorization method or to synchronize methods to compare the results of monitoring conducted in different areas. At the same time, it would make it easier to link individual types of items to potential sources.
4. The monitored beach litter is assigned to agreed eight main material categories: artificial polymer materials, rubber, cloth/textile, paper/cardboard, processed/worked wood, metal, glass/ceramics and unclassified.
The report contains the results of statistical analysis of monitoring data from the Baltic Sea countries and the basic unit used for the calculations is the number of items in each category per 100 m. statistical analysis considered different ways of aggregation: time (period, year, season), spatial (country, sub-basins) and the type of beach (urban, rural, peri-urban, reference).
5. Litter items accounted to the category of artificial polymer materials were the most common ones with a mean value of 95.5 / 100m (specific to the Baltic Sea region), which accounted for as much as 75% of all beach litter items. In all countries, the dominant type of litter items was artificial polymer material, which percentage remained in the range from approx. 50% to approx. 80%.
6. The aggregation of all data for each material category for all seasons revealed that for all categories, except processed/worked wood, the biggest number of items per 100 m was found in summer, which should be linked primarily to the intensification of tourist activity both on land and at sea areas.
7. Significant differences between the mean number of items per material category and the sum of litter items per 100m as calculated for distinguished beach types were identified. As expected, items from all material categories on reference beaches appeared with the least frequently, while the most numerous litter items were identified on urban beaches.
8. The preliminary baselines for beach litter in the Baltic Sea area should be understood as statistics parameters such as mean, median, standard deviation and relative standard deviation determined for each category of litter material and a sum of all items for specific beach types. Proposals for preliminary baselines for beach litter in the Baltic Sea area were set for two periods: 2012-2016 and 2015-2016 and for each of the main types of beaches: reference, urban and rural

Page 4 of 45
ones. Data analysis shows the significant differences between different types of beaches in terms of number of litter items, but the differences between periods were not so visible.
2. Introduction The main objective of this report is to analyse the situation in terms of the amount and type of
marine beach litter occurring on the coasts of the Baltic Sea region and to develop preliminary baselines for beach litter for the Baltic Sea. The report was prepared as part of the realization of the project "Implementation of the second cycle of the Marine Strategy Framework Directive: achieving coherent, coordinated and consistent updates of the determinations of Good Environmental Status, initial assessments and environmental targets”, Theme 2: Marine litter baselines and assessment in the Baltic Sea. This report is based on monitoring data covering the period 2012-2016 provided by the HELCOM countries.
3. Data collection Monitoring of beach litter in the Baltic Sea area is carried out by Denmark, Estonia, Finland, Germany, Latvia, Lithuania, Poland and Sweden (Map 1, Table 1). In six countries monitoring started in 2012, in five of them data were collected in the period 2012-2016. In Denmark and Poland monitoring started in 2015.

Page 5 of 45
Map 1 Beach litter monitoring stations.
The number of monitored stations varies by country. The smallest number of stations is monitored in Denmark (3) and Lithuania (4), while the largest number of stations is monitored in Latvia (42). The main types of monitored beaches are urban and rural, but in some countries reference stations have been identified (where the anthropogenic impact is minimal) as well as peri-urban beaches. The total length of the monitored beaches ranges from 100 to 3000m, but the most common monitored length is 100m, which is the only length that is used in up to seven countries (Table 1).
In four countries, monitoring is conducted in three seasons, excluding winter. In the case of Denmark, only one survey was conducted in winter. In Germany and Poland regular monitoring is conducted in the four seasons. In Latvia monitoring is carried out in the summer season. Additionally, several sites are monitored seasonally as an instrument of verification and in-depth local research.
The monitored beach litter is assigned to eight main material categories: artificial polymer materials, rubber, cloth/textile, paper/cardboard, processed/worked wood, metal, glass/ceramics and unclassified. Some countries have identified two additional categories: food waste and chemicals such as e.g. paraffin, wax, oil or tar, which, according to the new Commission Decision (2017/848), is

Page 6 of 45
mandatory for assessing the status of the marine environment for those HELCOM countries being EU members and should therefore be included in monitoring programs.
At the same time, the categorization of individual litter items occurs in different countries according to different rules (UNEP 2009, OSPAR 2010, JRC 2013, MARLIN 2013). Task Group Master List (TG ML) (JRC 2013) is used in Denmark and Poland, the MARLIN / UNEP classification methodology is used in four countries: Estonia, Finland, Latvia and Sweden, while Germany uses the OSPAR compliant classification (Table 1).
Table 1. Summary of beach litter monitoring: spatial, temporal and categorization method
Country Monitoring period
Number of monitoring
sections
Length of monitored section (m)
Beach types (number)
Frequency of monitoring
per year
Seasons (total number of visits)
Marine litter items
categorization
Denmark 2015 - 2016 3 100 reference
(rural) (3) 3(4)
spring (6), summer (6), autumn (6), winter (1)
TG ML Master list
Estonia 2012 - 2016 10
100 (litter
items 2.5-50 cm)
740, 380, 450, 222, 437, 295, 223, 400, 336, 220
(litter items >50)
peri-urban (5), urban (1),
rural (4) 3
spring (32), summer (42), autumn (32)
MARLIN/ UNEP/IOC
Finland 2012 - 2016 12
100, 110, 152, 320,
326
peri-urban (3), urban (5),
rural (4) 3
spring (45), summer (42), autumn (42)
MARLIN/ UNEP
Germany 2012 - 2016 26 100
reference (11), urban
(1), rural (14)
4
spring (96), summer (102), autumn (101),
winter (79)
OSPAR-Guideline for Monitoring
Marine Litter on the
Beaches, with slight
adaptations
Latvia 2012 - 2016 42 100
reference (2); urban (10),
peri-urban(17), rural (13)
1 summer (175) MARLIN/ UNEP
Lithuania 2012 - 2013 4 100
urban (1) rural (1)
semi-urban (1)
touristic (1)
4
spring (8), summer (8), autumn (8), winter (8)
Poland 2015 - 2016 15 1000 urban (7),
rural (8) 4
spring (30), summer (30), autumn (30), winter (30)
TG ML Master list
Page 7 of 45
Sweden 2012 - 2016 10 100 peri-urban(6),
rural (4) 3 spring (37),
summer (37), autumn (39)
MARLIN/ UNEP
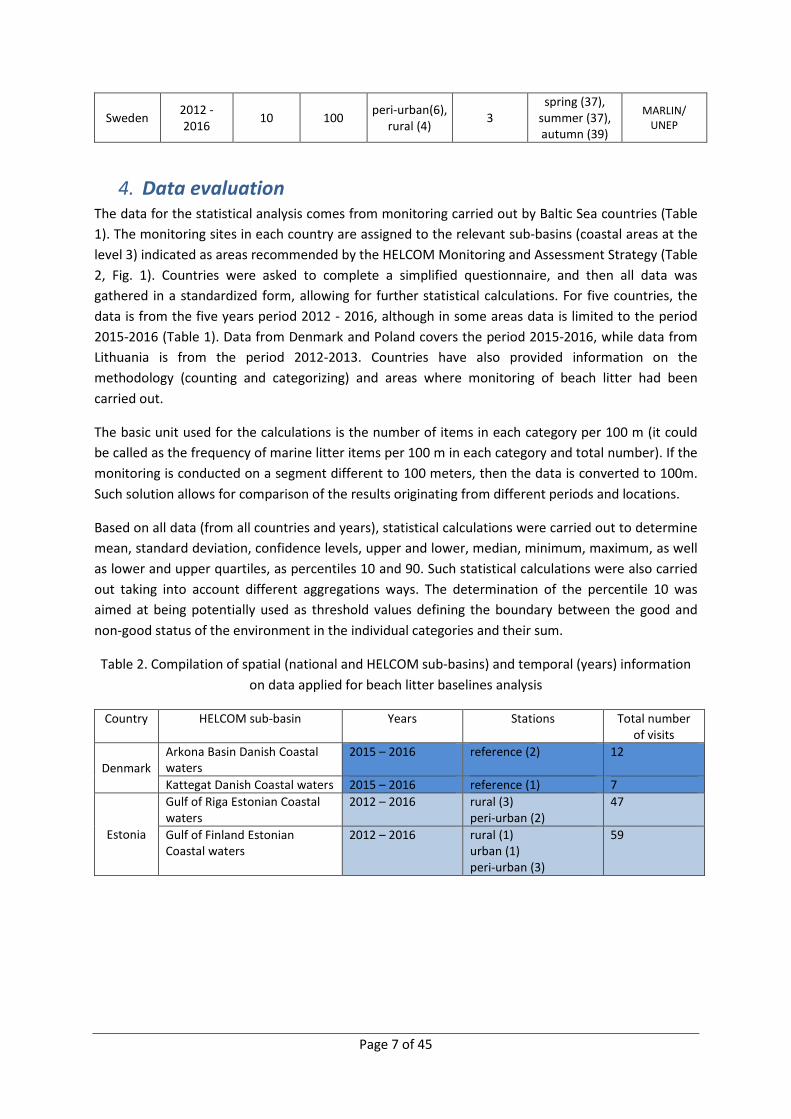
4. Data evaluation The data for the statistical analysis comes from monitoring carried out by Baltic Sea countries (Table 1). The monitoring sites in each country are assigned to the relevant sub-basins (coastal areas at the level 3) indicated as areas recommended by the HELCOM Monitoring and Assessment Strategy (Table 2, Fig. 1). Countries were asked to complete a simplified questionnaire, and then all data was gathered in a standardized form, allowing for further statistical calculations. For five countries, the data is from the five years period 2012 - 2016, although in some areas data is limited to the period 2015-2016 (Table 1). Data from Denmark and Poland covers the period 2015-2016, while data from Lithuania is from the period 2012-2013. Countries have also provided information on the methodology (counting and categorizing) and areas where monitoring of beach litter had been carried out.
The basic unit used for the calculations is the number of items in each category per 100 m (it could be called as the frequency of marine litter items per 100 m in each category and total number). If the monitoring is conducted on a segment different to 100 meters, then the data is converted to 100m. Such solution allows for comparison of the results originating from different periods and locations.
Based on all data (from all countries and years), statistical calculations were carried out to determine mean, standard deviation, confidence levels, upper and lower, median, minimum, maximum, as well as lower and upper quartiles, as percentiles 10 and 90. Such statistical calculations were also carried out taking into account different aggregations ways. The determination of the percentile 10 was aimed at being potentially used as threshold values defining the boundary between the good and non-good status of the environment in the individual categories and their sum.
Table 2. Compilation of spatial (national and HELCOM sub-basins) and temporal (years) information on data applied for beach litter baselines analysis
Country HELCOM sub-basin Years Stations Total number of visits
Denmark Arkona Basin Danish Coastal waters
2015 – 2016 reference (2)
12
Kattegat Danish Coastal waters 2015 – 2016 reference (1) 7
Estonia
Gulf of Riga Estonian Coastal waters
2012 – 2016 rural (3) peri-urban (2)
47
Gulf of Finland Estonian Coastal waters
2012 – 2016 rural (1) urban (1) peri-urban (3)
59

Page 8 of 45
Finland
Northern Baltic Proper Finnish Coastal waters
2012 – 2016 rural (3) urban (2) peri-urban (1)
76
Gulf of Finland Finnish Coastal waters
2012 – 2016 rural (1) urban (1) peri-urban (2)
46
Bothnian Bay Finnish Coastal waters
2015 – 2016 urban (1) 7
Germany
Arkona Basin German Coastal waters
2012 - 2016 rural (7) urban (1) reference (8)
262
Mecklenburg Bight German Coastal waters
2012 - 2016 rural (7) reference (1)
97
Bornholm Basin German Coastal waters
2012 - 2016 reference (2) 19
Latvia
Gulf of Riga Latvian Coastal waters
2012 - 2016 rural (13) urban (10) peri-urban (17) rural (13)
175
Lithuania
Eastern Gotland Basin Lithuanian Coastal waters
2012 - 2013 urban (1) rural (1) semi-urban (1) touristic (1)
32
Poland
Eastern Gotland Basin Polish Coastal waters
2015 - 2016 rural (2)
16
Bornholm Basin Polish Coastal waters
2015 - 2016 rural (2) urban (5)
56
Gdansk Basin Polish Coastal waters
2015 - 2016 rural (4) urban (2)
48
Sweden
The Sound Swedish Coastal waters
2015 - 2016 rural (1) 5
Western Gotland Basin Swedish Coastal waters
2012 - 2016 rural (1) peri-urban(1)
21
Bornholm Basin Swedish Coastal waters
2012 - 2016 peri-urban (1) 15
Northern Baltic Proper Swedish Coastal waters
2012 - 2016 rural (1) 15
Arkona Basin Swedish Coastal waters
2015 - 2016 peri-urban (1) 6
Bothnian Bay Swedish Coastal waters
2014 - 2016 rural (1) 7
Eastern Gotland Basin Swedish Coastal waters
2012 - 2016 urban (1) 15
Kattegat Swedish Coastal waters
2012 - 2016 rural (1) 15
Bothnian Sea Swedish Coastal waters
2012 - 2016 peri-urban (1) 14
5. Results and discussion The lowest mean number of items per 100m taking for the whole period 2012-2016 and the entire Baltic area was specific to categories of rubber (2.3 / 100m), cloth / textile (2.4) and unclassified waste (2.39 / 100m). (Fig.1a). The processed / worked wood items were found with slightly higher frequency (3.28 / 100m). Paper/cardboard, metal and glass/ceramics litter items remained in the

Page 9 of 45
range from 6.5 to 7.3 / 100m. Items from the category of artificial polymer materials were the most common ones with a mean value of 95.5 / 100m, which accounted for as much as 75% of all beach litter items (Fig. 1b).
Compilation of all statistical data for the entire Baltic area in the periods 2012-2016 and 2015-2016 (mean value, median, standard deviation, upper and lower confidence levels, minimum and upper quartiles, and 10th and 90th percentiles) is presented in the Appendix (Tab. 1).
The most visible differences between these two periods are in the average number of artificial polymer materials and the sum of all categories per 100 m. Significant differences also exist for maximum beach litter items per 100 m, clearly indicating that the larger number of items within categories of artificial polymer materials, cloth/textile, metal and sum of all categories occurred in the period up to 2014. Taking into account the values of the 10th percentile, for all categories except artificial polymer materials, they are equal to 0. For plastics, the differences for both analyzed periods are not significant (3.6 for 2015-2016 and 4.9 for 2012-2016). A little more difference was noted for the mean average number for all items.
Fig. 1a. Mean number of items within categories and unclassified per 100m aggregated for the whole Baltic Sea
Fig. 1b. Mean number of plastic items and sum of all categories items per 100m aggregated for the whole Baltic Sea
0
2
4
6
8
Mea
n nu
mbe
r of i
tem
s / 1
00m
020406080
100120140
Artificial polymer materials Sum
Mea
n nu
mbe
r of i
tem
s /
100
m

Page 10 of 45
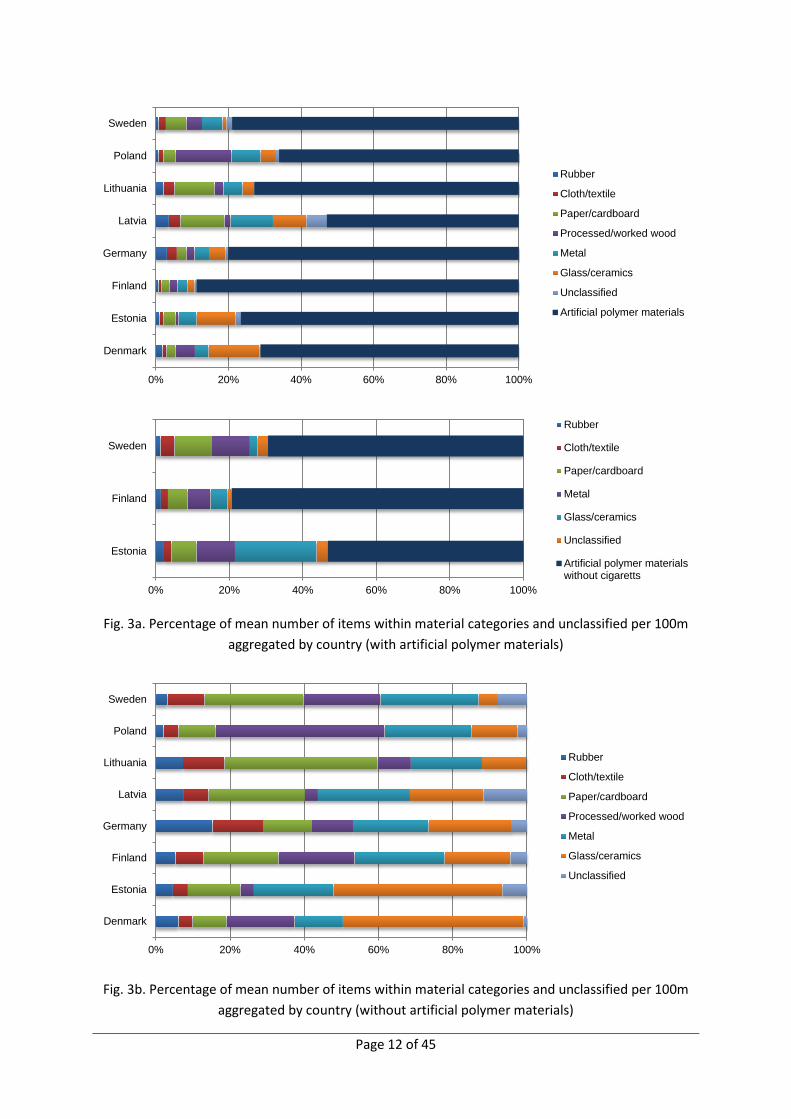
Figures 2a and 2b present the mean number of items for each category per 100 m as aggregated for countries, calculated using all national reported data, this is data from different periods. The largest mean number of all beach litter items (354.4/100m) was found at the Finnish beaches and this is directly related to the largest number of plastic items found in Finland (314.8/100m) (Fig. 2a). The smallest mean number of all types of items (33.7/100m) was found at the Polish coast. This may be related to the fact that a significant part of the Polish coast is regularly cleaned to increase tourist attractiveness. In the case of Germany the mean number of all items per 100m was 61.7, 99.4 in Denmark, 88.1 in Sweden, 114.8 in Estonia, 222.3 in Lithuania and 180.2 in Latvia. In all countries, the most numerous beach litter items are artificial polymer materials (Fig. 2a and 3a). Their smallest contribution of plastics was recorded in Latvia (53%) and the largest one in Finland (close to 90%).
While discussing the plastic items figures, it is important to draw ones attention on how cigarette butts are counted. In some countries they are counted within sampling area 10mx10m (according to MARLIN classification method), and they have to be recalculated to the area of 100 m lengths by multiplying by ten. Such method may considerably affect the increase of the total number of plastic items, which mostly occur in the case of Finnish results (Figure 2a).
In order to check the influence of the recalculated number of cigarettes on the total number of plastic items, the number of artificial polymer items with and without cigarettes was compared in the case of three countries (Fig. 2a). In the case of Finland, the number of plastic items after cigarettes exclusion has dropped to 121, thus affecting the average amount of litter that fell to 161. In the case of Estonia, the exclusion of cigarettes resulted in a decrease in average plastic items per 100m from 87.9 to 29.4. In the case of Sweden, the fall of the average number of plastic items was double. This resulted in a decrease in the share of plastic items from 78 to 70% for Sweden, from about 78 to about 52% for Estonia and from around 90 to about 79% for Finland.
The largest aggregated mean numbers of items of other categories (exceeding 80/100m) occurred in Latvia (Figure 2b).
Apart from plastics litter, the most numerous items these are belonging to the material category glass/ceramics in Denmark and Estonia, paper/cardboard in Lithuanian areas and processed/worked wood in Poland (Figure 3b).

Page 11 of 45
Fig. 2a. Mean number of plastic items and sum of all categories per 100m aggregated by country
Fig. 2b. Mean number of items within material categories and unclassified per 100m aggregated by country
0 50 100 150 200 250 300 350 400
Denmark
Estonia
Finland
Germany
Latvia
Lithuania
Poland
Sweden
Mean number of items / 100m
Sum withoutcigarette
Artificial polymermaterials withoutcigaretteSum
Artificial polymermaterials
0 10 20 30 40 50 60 70 80 90
Denmark
Estonia
Finland
Germany
Latvia
Lithuania
Poland
Sweden
Mean number of items / 100m
Rubber
Cloth/textile
Paper/cardboard
Processed/workedwoodMetal
Glass/ceramics
Unclassified
Page 12 of 45
Fig. 3a. Percentage of mean number of items within material categories and unclassified per 100m aggregated by country (with artificial polymer materials)
Fig. 3b. Percentage of mean number of items within material categories and unclassified per 100m aggregated by country (without artificial polymer materials)
0% 20% 40% 60% 80% 100%
Denmark
Estonia
Finland
Germany
Latvia
Lithuania
Poland
Sweden
Rubber
Cloth/textile
Paper/cardboard
Processed/worked wood
Metal
Glass/ceramics
Unclassified
Artificial polymer materials
0% 20% 40% 60% 80% 100%
Estonia
Finland
Sweden
Rubber
Cloth/textile
Paper/cardboard
Metal
Glass/ceramics
Unclassified
Artificial polymer materialswithout cigaretts
0% 20% 40% 60% 80% 100%
Denmark
Estonia
Finland
Germany
Latvia
Lithuania
Poland
Sweden
Rubber
Cloth/textile
Paper/cardboard
Processed/worked wood
Metal
Glass/ceramics
Unclassified

Page 13 of 45
Figures 4a and 4b show the mean number of items in each material category and sum per 100m yearly aggregated for the whole Baltic Sea area. The biggest mean number of plastic items occurred in 2012 (159.3/100m). In the next year it fell to 126.6 and in 2014 even to 88.5. In the years 2015 and 2016, the mean number of plastic items per 100m was at similar level 67.0 and 74.0, respectively. Such changes in the number of plastic items have influenced the mean of the sum of all items from all material categories.
Three beach litter categories showed a statistically significant decreasing trend. These are glass/ceramics and cloth/textile categories, for which p values are below 0.05 and equal to 0.0260 and 0.0302 respectively (Fig. 5a). The statistically significant decreasing trend also occurred in the case of artificial polymer materials (p = 0.0205) and therefore it was applicable to the mean value of items from all material categories per 100 m (Fig. 5b). This is because plastics items, due to its abundance, have the biggest impact on variations of the sum of all items. Unfortunately, the observed trends can not be considered as representative for the Baltic Sea area. This is due to the fact that in other years other areas were monitored. In 2012- 2014, only some of the countries monitored beach litter on their coastline (Table 1). In 2015 some countries as Denmark and Poland started their monitoring and other countries expanded their monitoring to new areas, which continued also in 2016. In the areas included in the monitoring since 2015, the number of beach litter items was lower than in other areas where the monitoring started earlier. This has affected the average value of beach litter items in all categories, which are lower for most categories in 2015 and 2016 (see Appendix Table 2). Such observations could be the basis for recommending the period 2015-2016 as a baseline for any further analysis for the whole Baltic Sea area. For other spatial scales: (i) subregional - subbasins and (ii) national, other periods may be accepted depending on data availability.
Fig. 4a. Mean number of items within material categories and unclassified per 100m aggregated for the whole Baltic Sea vs. years
0
2
4
6
8
10
12
14
Mea
n nu
mbe
r of i
tem
s / 1
00m
2012
2013
2014
2015
2016

Page 14 of 45
Fig. 4b. Mean number of artificial polymer items and sum of all categories items per 100m aggregated for the whole Baltic Sea vs. years.
Fig. 5a. Mean number of items within material categories per 100m aggregated for the whole Baltic
Sea vs. years – statistical significance
0
50
100
150
200
250
Artificial polymer materials Sum
Mea
n ny
mbe
r of i
tem
s / 1
00m
2012
2013
2014
2015
2016
2011 2012 2013 2014 2015 2016 2017
Year
0
2
4
6
8
10
12
14
16
18
Mea
n nu
mbe
r of i
tem
s / 1
00m
Rubber (p = 0.3253; r = -0.561; r2 = 0.315) Paper/carbord (p = 0.1502; r = -0.743; r2 = 0.552) Processed/worked wood (p = 0.4314; r = -0.464; r2 = 0.215) Metal (p = 0.1404; r = -0.755; r2 = 0.570) Glass/ceramics (p = 0.0260; r = -0.922; r2 = 0.850) Cloth/texti le (p = 0.0302; r = -0.913; r2 = 0.834)
Page 15 of 45
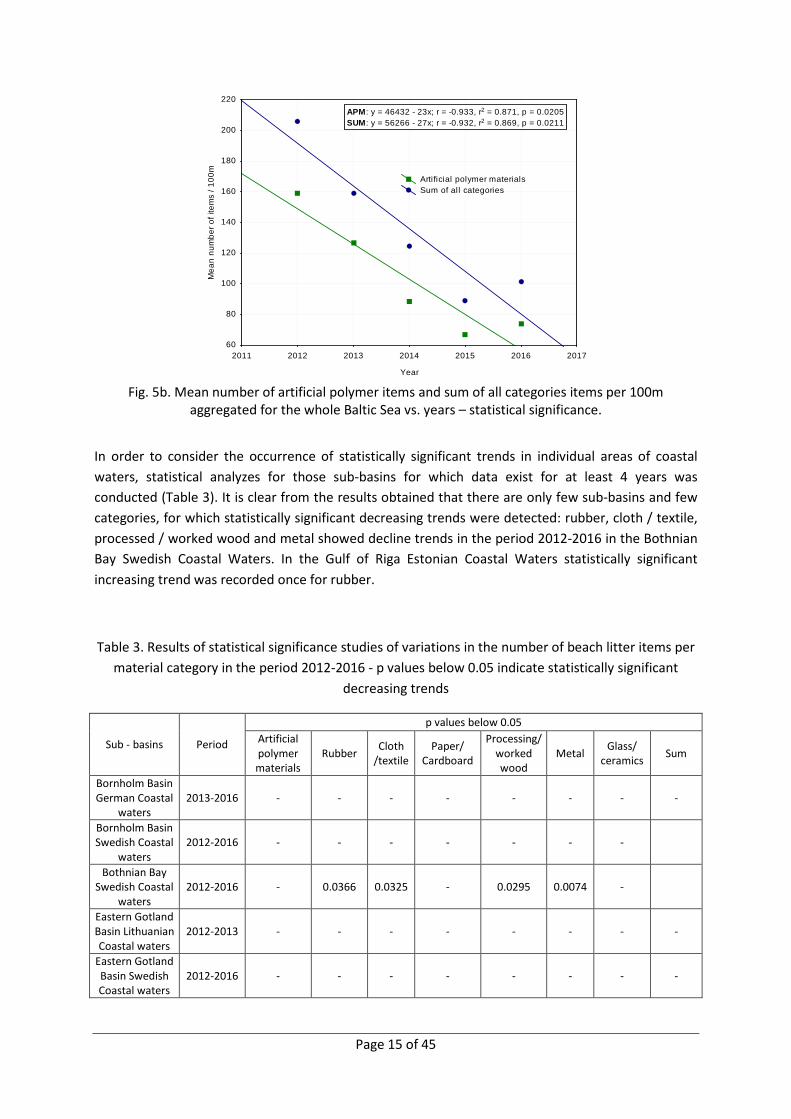
Fig. 5b. Mean number of artificial polymer items and sum of all categories items per 100m
aggregated for the whole Baltic Sea vs. years – statistical significance.
In order to consider the occurrence of statistically significant trends in individual areas of coastal waters, statistical analyzes for those sub-basins for which data exist for at least 4 years was conducted (Table 3). It is clear from the results obtained that there are only few sub-basins and few categories, for which statistically significant decreasing trends were detected: rubber, cloth / textile, processed / worked wood and metal showed decline trends in the period 2012-2016 in the Bothnian Bay Swedish Coastal Waters. In the Gulf of Riga Estonian Coastal Waters statistically significant increasing trend was recorded once for rubber.
Table 3. Results of statistical significance studies of variations in the number of beach litter items per material category in the period 2012-2016 - p values below 0.05 indicate statistically significant
decreasing trends
Sub - basins Period
p values below 0.05 Artificial polymer materials
Rubber Cloth /textile
Paper/ Cardboard
Processing/worked wood
Metal Glass/ ceramics Sum
Bornholm Basin German Coastal
waters 2013-2016 - - - - - - - -
Bornholm Basin Swedish Coastal
waters 2012-2016 - - - - - - -
Bothnian Bay Swedish Coastal
waters 2012-2016 - 0.0366 0.0325 - 0.0295 0.0074 -
Eastern Gotland Basin Lithuanian Coastal waters
2012-2013 - - - - - - - -
Eastern Gotland Basin Swedish Coastal waters
2012-2016 - - - - - - - -
2011 2012 2013 2014 2015 2016 2017
Year
60
80
100
120
140
160
180
200
220
Mea
n nu
mbe
r of i
tem
s / 1
00m
APM: y = 46432 - 23x; r = -0.933, r2 = 0.871, p = 0.0205SUM: y = 56266 - 27x; r = -0.932, r2 = 0.869, p = 0.0211
Artificial polymer materials Sum of all categories

Page 16 of 45
Gulf of Finland Estonian
Coastal waters 2012-2016 - - - 0.0228 - - - -
Gulf of Finland Finnish Coastal
waters 2012-2016 - - - 0.0433 - - - -
Gulf of Riga Estonian
Coastal waters 2012-2016 - 0.0117* - - - - 0.0047 -
Gulf of Riga Latvian national
waters 2012-2016 - - - - - - - -
Kattegat Swedish Coastal
waters 2012-2016 - - 0.0420 0.0095 - - - -
Mecklenburg Bight German Coastal waters
2012-2016 - - 0.0387 - - - - -
Northern Baltic Proper Finnish Coastal waters
2012-2016 - - - - - 0.0279 - -
Northern Baltic Proper Swedish Coastal waters
2012-2016 - - 0.0405 - - - - -
*increasing trend
The aggregation of all data for each material category for all seasons showed that for all categories, except processed/worked wood, the biggest number of items per 100 m was found in summer, which should be linked primarily to the intensification of tourist activity both on land and at sea areas (Figs 6a and 6b). The mean number of beach litter items recorded in spring was higher than in the autumn and increased to the maximum in summer. Then there was a significant decrease in autumn, which in most cases was continued in winter.
It should be noted, however, that not all countries carry out monitoring in the winter season due to snow cover or other climatological conditions that prevent winter monitoring (see Tab. 1). However, this does not change the general tendencies.
Fig. 6a. Mean number of items within categories and unclassified per 100m aggregated for the whole Baltic Sea vs. season
0
2
4
6
8
10
12
14
Spring Summer Autumn Winter
Mea
n nu
mbe
r of I
tem
s/1
00 m
Rubber
Cloth/textile
Paper/cardboard
Processed/worked wood
Metal
Glass/ceramics
Unclassified

Page 17 of 45
Fig. 6b. Mean number of artificial polymer and sum of all categories items per 100m aggregated for the whole Baltic Sea vs. season
According to the proposed recommendations concerning the monitoring of beach litter, there is a need to define the kind of beach where monitoring is performed. Due to the fact that different types of beaches are subject to different pressures, it is possible to identify potential sources of litter. The main types of beaches are: (i) references (areas hard to reach beaches which are frequented by few visitors), (ii) urban (artificially-created environment in an urban setting which simulates a public beachfront, through the use of sand, beach umbrellas, and seating elements), (iii) peri-urban (beaches with (many) visitors but which are not in or very close to a city) and (iv) rural (beaches located outside the urban environment; not readily accessible by public transport and have virtually no facilities).
Some countries have identified also other types of beaches like semi-urban, rural /remote and touristic ones. Statistical analysis of aggregated data in respect to the type of monitored beaches was conducted for beaches: reference, urban, peri-urban and rural. Reference beaches have been selected in Denmark Germany and Latvia; other types (urban and rural) are found in all countries except Denmark, where monitoring is only conducted on reference beaches. Peri-urban beaches are monitored in four countries: Estonia, Finland, Latvia and Sweden. The results are shown in Figs. 7a and 7b and in Table 3 (Appendix).
020406080
100120140160180
Spring Summer Autumn Winter
Mea
n nu
mbe
r of i
tem
s /
100m
Artificial polymermaterials
Sum

Page 18 of 45
Fig. 7a. Mean number of items within material categories and unclassified per 100m aggregated by types of beaches
Fig. 7b Mean number of artificial polymer items and sum of all categories items per 100m aggregated by types of beaches
Significant differences between the mean number of items per material category and the sum of litter items per 100m calculated for discriminated beach types were identified. As expected, items from all material categories on reference beaches appeared with the least frequently. The average number of rubber items per 100m was 1.8, 1.6 for cloth / textile and paper, 1.8 for wood, 2.1 for metal, 3.6 for glass and only 0.2 for unclassified litter items (Fig. 7a). The average number of items per 100m on rural beaches was only slightly higher than those recorded on reference beaches: rubber - 1.5, glass - 3.1, cloth / textile - 1.6, paper - 3.4, wood - 2.0, metal - 2.6, unclassified -1.6. The
0
2
4
6
8
10
12
14
16
18M
ean
num
ber o
f ite
ms
/ 100
m
reference
rural
urban
peri-urban
0
50
100
150
200
250
300
Artificial polymer materials SUM
Mea
n nu
mbe
r of i
tem
s / 1
00m
reference
rural
urban
peri-urban

Page 19 of 45
most visible differences were observed in the case of urban beaches: rubber - 4.5, cloth / textile - 4.2, paper - 13.2, wood - 7.6, metal - 11.2, glass - 6.1, unclassified -5.5. Significant differences were also observed in the case of artificial polymer items and thus the sum of all items. On the reference beaches, the average number of plastic items per 100 m was 3469, 50.8 on the rural beaches and 6 times higher and equal to 230.4 in the urban beaches (see Appendix - Table 3). In the case of peri-urban beaches, the average values of plastic items (108.0), paper (11.7) and processed/worked wood (3.2) per 100 m was visibly lower than those observed on urban beaches and apparently higher than those observed on rural beaches. The mean number of rubber items (2.3) as well as cloth ones (3.1) per 100 m was at a similar level than the one found at rural beaches, while in the case of glass (15.5) it was unexpectedly high, compared to urban beaches.
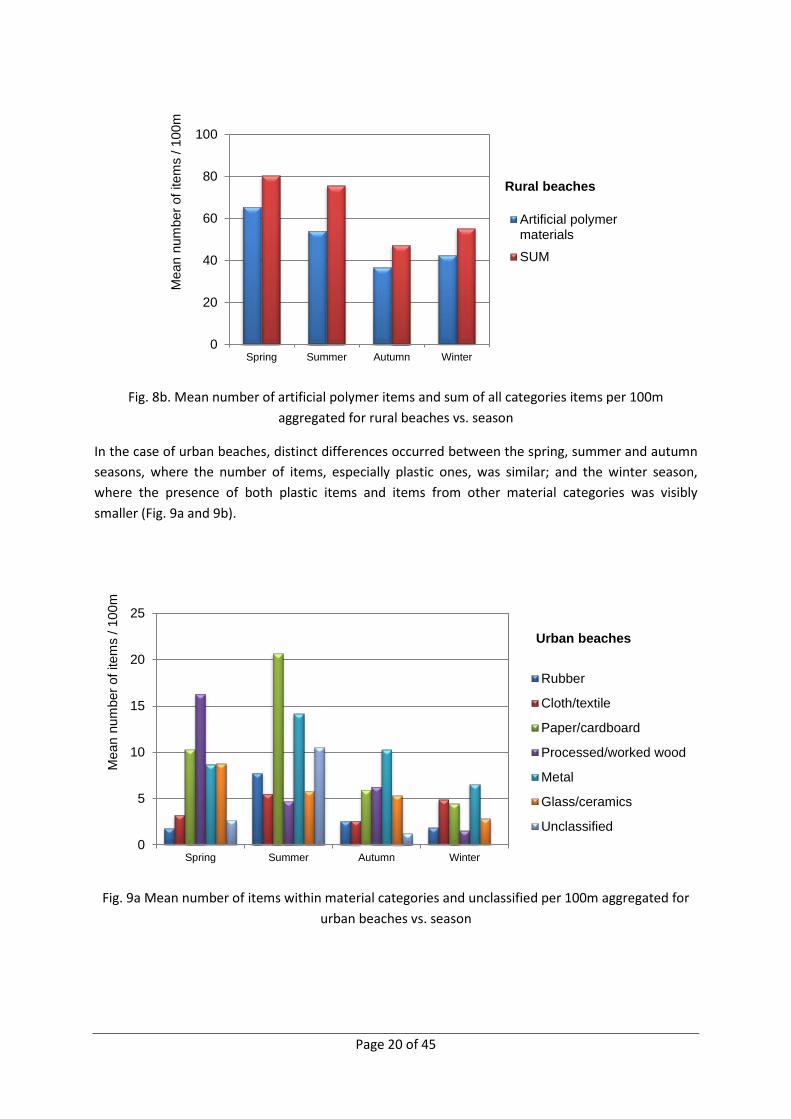
Seasonal changes observed on different types of beaches are not as clear as in the case of all aggregated data. In the case of rural beaches only slightly more processed wood and glass items were recorded in the spring season, and more paper, rubber, cloth and metal items in the summer season (Figs 8a and 8b). The number of plastic items in the summer and spring also increased.
Fig. 8a. Mean number of items within material categories and unclassified per 100m aggregated for rural beaches vs. season
0
1
2
3
4
5
6
Spring Summer Autumn Winter
Mea
n nu
mbe
r of i
tem
s / 1
00m
Rural beaches
Rubber
Cloth/textile
Paper/cardboard
Processed/worked wood
Metal
Glass/ceramics
Unclassified
Page 20 of 45
Fig. 8b. Mean number of artificial polymer items and sum of all categories items per 100m aggregated for rural beaches vs. season
In the case of urban beaches, distinct differences occurred between the spring, summer and autumn seasons, where the number of items, especially plastic ones, was similar; and the winter season, where the presence of both plastic items and items from other material categories was visibly smaller (Fig. 9a and 9b).
Fig. 9a Mean number of items within material categories and unclassified per 100m aggregated for urban beaches vs. season
0
20
40
60
80
100
Spring Summer Autumn Winter
Mea
n nu
mbe
r of i
tem
s / 1
00m
Rural beaches
Artificial polymermaterialsSUM
0
5
10
15
20
25
Spring Summer Autumn Winter
Mea
n nu
mbe
r of i
tem
s / 1
00m
Urban beaches
Rubber
Cloth/textile
Paper/cardboard
Processed/worked wood
Metal
Glass/ceramics
Unclassified
Page 21 of 45
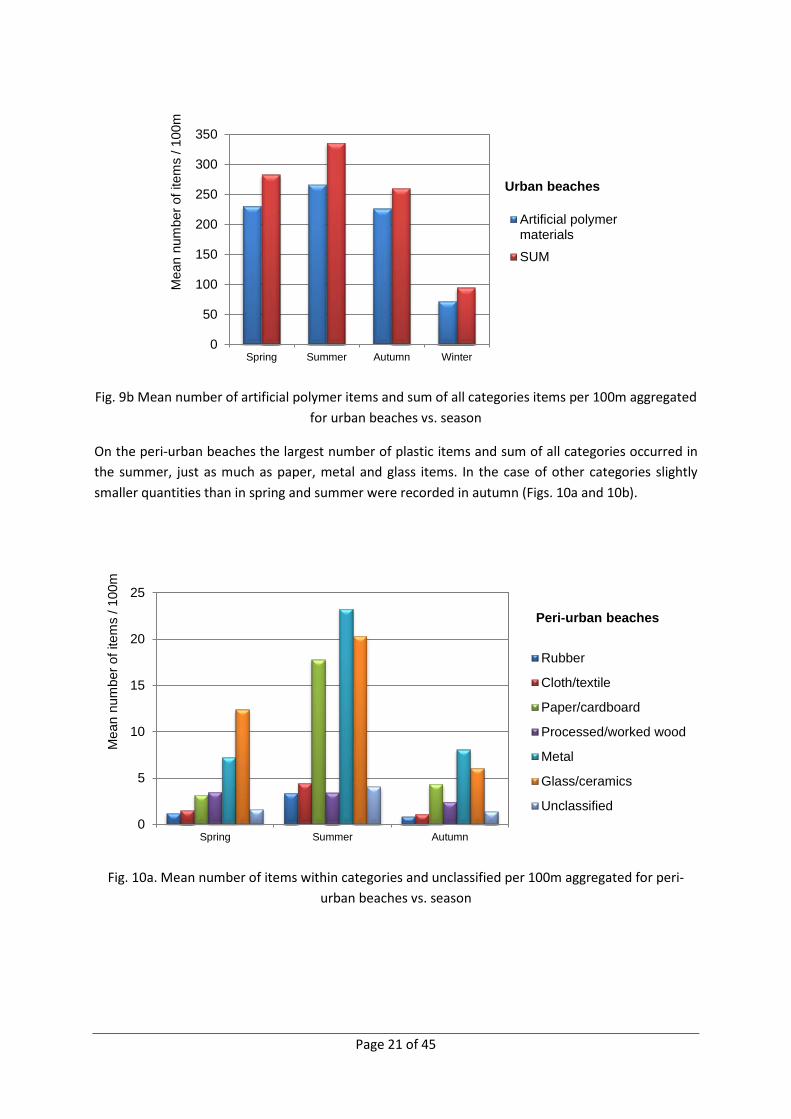
Fig. 9b Mean number of artificial polymer items and sum of all categories items per 100m aggregated for urban beaches vs. season
On the peri-urban beaches the largest number of plastic items and sum of all categories occurred in the summer, just as much as paper, metal and glass items. In the case of other categories slightly smaller quantities than in spring and summer were recorded in autumn (Figs. 10a and 10b).
Fig. 10a. Mean number of items within categories and unclassified per 100m aggregated for peri-urban beaches vs. season
0
50
100
150
200
250
300
350
Spring Summer Autumn Winter
Mea
n nu
mbe
r of i
tem
s / 1
00m
Urban beaches
Artificial polymermaterialsSUM
0
5
10
15
20
25
Spring Summer Autumn
Mea
n nu
mbe
r of i
tem
s / 1
00m
Peri-urban beaches
Rubber
Cloth/textile
Paper/cardboard
Processed/worked wood
Metal
Glass/ceramics
Unclassified

Page 22 of 45
Fig. 10b. Mean number of artificial polymer items and sum of all categories items per 100m aggregated for peri-urban beaches vs. season.
The most different situation was found in the case of references beaches where the biggest number of all types of items was found in spring (Figs. 11a and 11b).
Fig. 11a. Mean number of items within material categories and unclassified per 100m aggregated for reference beaches vs. season
0
50
100
150
200
250
Spring Summer Autumn
Mea
n nu
mbe
r of i
tem
s / 1
00m
Peri-urban beaches
Artificial polymermaterialsSUM
0
1
2
3
4
5
Spring Summer Autumn Winter
Mea
n nu
mbe
r of i
tem
s / 1
00m
Reference beaches
Rubber
Cloth/textile
Paper/cardboard
Processed/worked wood
Metal
Glass/ceramics
Unclassified

Page 23 of 45
Fig. 11b. Mean number of artificial polymer items and sum of all categories items per 100m aggregated for reference beaches vs. season
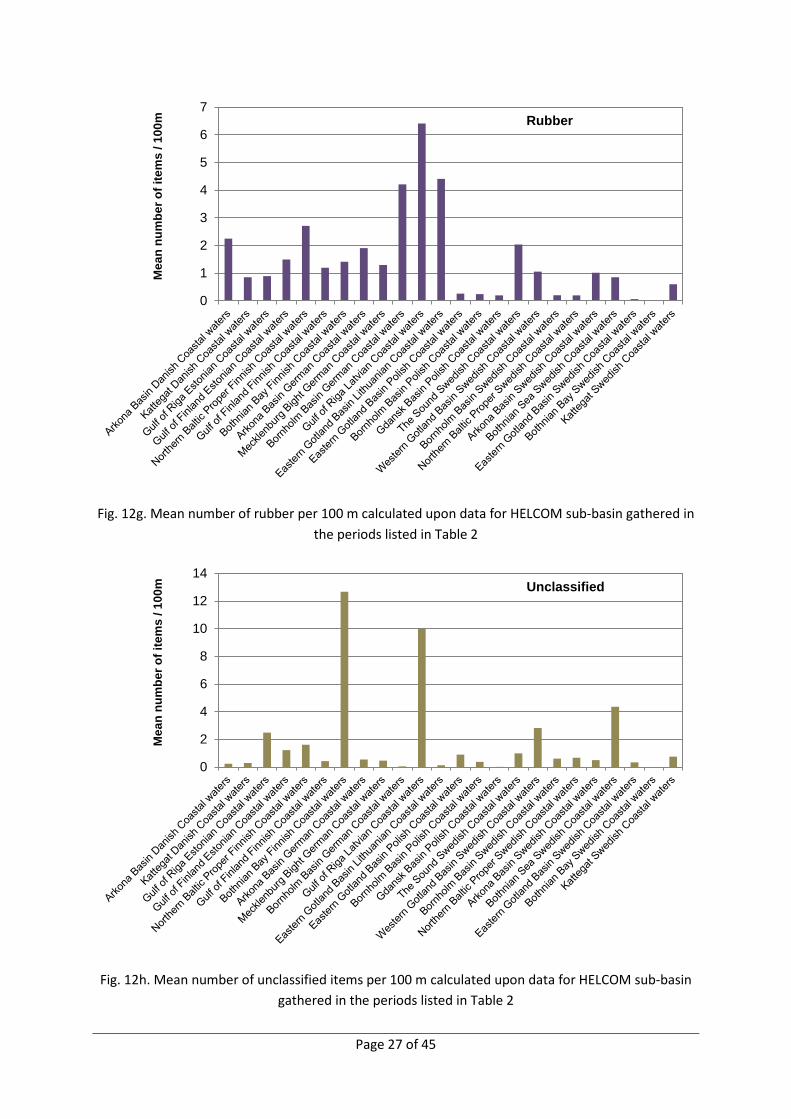
To be able to compare beach litter frequencies (mean number of items/100 m) between sub-regions, the following statistical parameters were calculated: mean, standard deviation, median, minimum, maximum, lower and upper quartile and the 10th and 90th percentile for individual material categories in each sub-basin (Table 7). The calculation was carried out for different periods depending on data availability for discriminated sub-basins, but taking into account the whole period 2012-2016 (Figs 12a-12i, Table 4 – Appendix). The same calculation was carried out also for the period 2015-2016 (Table 5 – Appendix).
Additionally, the temporal changes in the mean number of items within material categories and sum of all items per material categories per 100m during the years monitored for each sub-basin are shown in Fig. 13 -39.
0
10
20
30
40
50
60
70
Spring Summer Autumn Winter
Mea
n nu
mbe
r of i
tem
s / 1
00m
Reference beaches
Artificial polymermaterialsSUM

Page 24 of 45
Fig. 12a Mean number of artificial polymer items per 100 m calculated upon data for HELCOM sub-basin gathered in the periods listed in Table 2
Fig. 12b. Mean number of cloth/textile items per 100 m calculated upon data for HELCOM sub-basin gathered in the periods listed in Table 2
0
50
100
150
200
250
300
350
Mea
n nu
mbe
r of i
tem
s / 1
00m Artificial polymer materials
0
1
2
3
4
5
6
7
8
Mea
n nu
mbe
r of i
tem
s / 1
00m Cloth/textile

Page 25 of 45
Fig. 12c. Mean number of glass/ceramics items per 100 m calculated upon data for HELCOM sub-basin gathered in the periods listed in Table 2
Fig. 12d. Mean number of metal items per 100 m calculated upon data for HELCOM sub-basin gathered in the periods listed in Table 2
0
5
10
15
20
25
Mea
n nu
mbe
r of i
tem
s / 1
00m Glass/ceramics
0
5
10
15
20
25
Mea
n nu
mbe
r of i
tem
s / 1
00m Metal

Page 26 of 45
Fig. 12e. Mean number of paper/cardboard items per 100 m calculated upon data for HELCOM sub-basin gathered in the periods listed in Table 2
Fig. 12f. Mean number of processed/worked wood items per 100 m calculated upon data for HELCOM sub-basin gathered in the periods listed in Table 2
0
5
10
15
20
25
30
Mea
n nu
mbe
r of i
tem
s / 1
00m Paper/cardboard
0
2
4
6
8
10
12
Mea
n nu
mbe
r of i
tem
s / 1
00m Processed/worked wood
Page 27 of 45
Fig. 12g. Mean number of rubber per 100 m calculated upon data for HELCOM sub-basin gathered in the periods listed in Table 2
Fig. 12h. Mean number of unclassified items per 100 m calculated upon data for HELCOM sub-basin gathered in the periods listed in Table 2
0
1
2
3
4
5
6
7
Mea
n nu
mbe
r of i
tem
s / 1
00m Rubber
0
2
4
6
8
10
12
14
Mea
n nu
mbe
r of i
tem
s / 1
00m Unclassified

Page 28 of 45
Fig. 12i. Mean number of sum of items per 100 m calculated upon data for HELCOM sub-basin gathered in the periods listed in Table 2
Fig. 13. Mean number of items in each category, unclassified and sum per 100 m in the Arkona Basin Danish Coastal Waters in 2015 – 2016.
0
50
100
150
200
250
300
350
400
Mea
n nu
mbe
r of i
tem
s / 1
00m Sum
0
50
100
150
Artificial polymer materials sum
2015
2016
05
10152025303540
2015
2016

Page 29 of 45
Fig. 14. Mean number of items in each category, unclassified and sum per 100 m in the Kattegat Danish Coastal Waters in 2015 – 2016.
Fig. 15. Mean number of items in each category, unclassified and sum per 100 m in the Gulf of Riga Estonian Coastal Waters in 2012 – 2016.
0
20
40
60
80
100
Artificial polymer materials sum
2015
2016
0
2
4
6
8
10
12
2015
2016
0
50
100
150
200
250
Artificial polymer materials sum
2012
2013
2014
2015
2016
05
1015202530354045
2012
2013
2014
2015
2016

Page 30 of 45
Fig. 16. Mean number of items in each category, unclassified and sum per 100 m in the Gulf of Finland Estonian Coastal Waters in 2012 – 2016.
Fig. 17 Mean number of items in each category, unclassified and sum per 100 m in the Gulf of Finland Finnish Coastal Waters in 2012 – 2016.
0
50
100
150
200
Artificial polymer materials sum
2012
2013
2014
2015
2016
02468
101214
2012
2013
2014
2015
2016
0100200300400500600
Artificial polymer materials sum
2012
2013
2014
2015
2016
02468
10121416
2012
2013
2014
2015
2016
Page 31 of 45
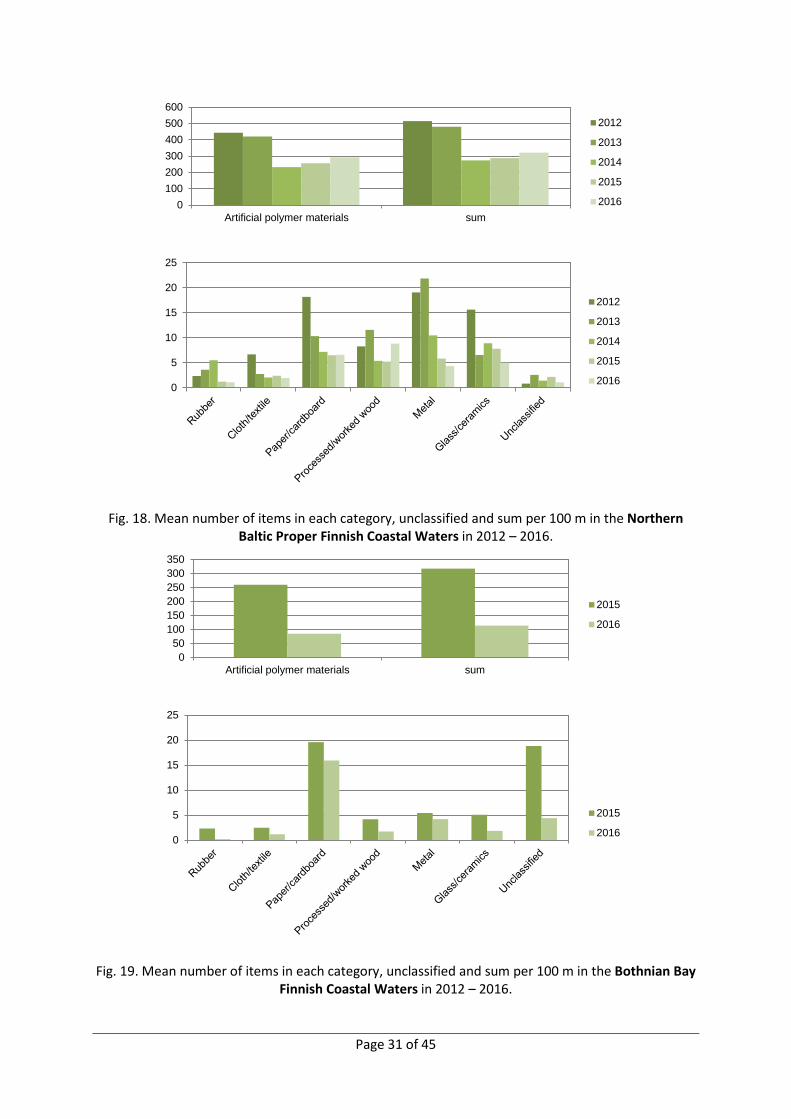
Fig. 18. Mean number of items in each category, unclassified and sum per 100 m in the Northern Baltic Proper Finnish Coastal Waters in 2012 – 2016.
Fig. 19. Mean number of items in each category, unclassified and sum per 100 m in the Bothnian Bay Finnish Coastal Waters in 2012 – 2016.
0100200300400500600
Artificial polymer materials sum
2012
2013
2014
2015
2016
0
5
10
15
20
25
2012
2013
2014
2015
2016
050
100150200250300350
Artificial polymer materials sum
2015
2016
0
5
10
15
20
25
2015
2016

Page 32 of 45
Fig. 20. Mean number of items per material category, unclassified and sum per 100 m observed in the Arkona Basin German Coastal Waters in 2012 – 2016.
Fig. 21. Mean number of items per material category, unclassified and sum per 100 m in the Mecklenburg Bight German Coastal Waters in 2012 – 2016.
0
50
100
150
200
Artificial polymer materials sum
2012
2013
2014
2015
2016
0
1
2
3
4
5
6
2012
2013
2014
2015
2016
0
50
100
150
200
Artificial polymer materials sum
2012
2013
2014
2015
2016
0
5
10
15
20
25
2012
2013
2014
2015
2016

Page 33 of 45
Fig. 22. Mean number of items per material category, unclassified and sum per 100 m in the Bornholm Basin German Coastal Waters in 2013 – 2016.
Fig. 23. Mean number of items per material category, unclassified and sum per 100 m in the Gulf of Riga Latvian Coastal Waters in 2012 – 2016.
0
20
40
60
80
100
Artificial polymer materials sum
2013
2014
2015
2016
0
2
4
6
8
10
2013
2014
2015
2016
0
50
100
150
200
250
Artificial polymer materials sum
2012
2013
2014
2015
2016
0
10
20
30
40
50
2012
2013
2014
2015
2016

Page 34 of 45
Fig. 24 Mean number of items per material category, unclassified and sum per 100 m in the Eastern Gotland Basin Lithuanian Coastal Waters in 2012 – 2013.
Fig. 25 Mean number of items per material category, unclassified and sum per 100 m in the Bornholm Basin Polish Coastal Waters in 2015 – 2016.
050
100150200250300
Artificial polymer materials sum
2012
2013
0
5
10
15
20
25
30
2012
2013
0102030405060
Artificial polymer materials sum
2015
2016
02468
101214
2015
2016
Page 35 of 45
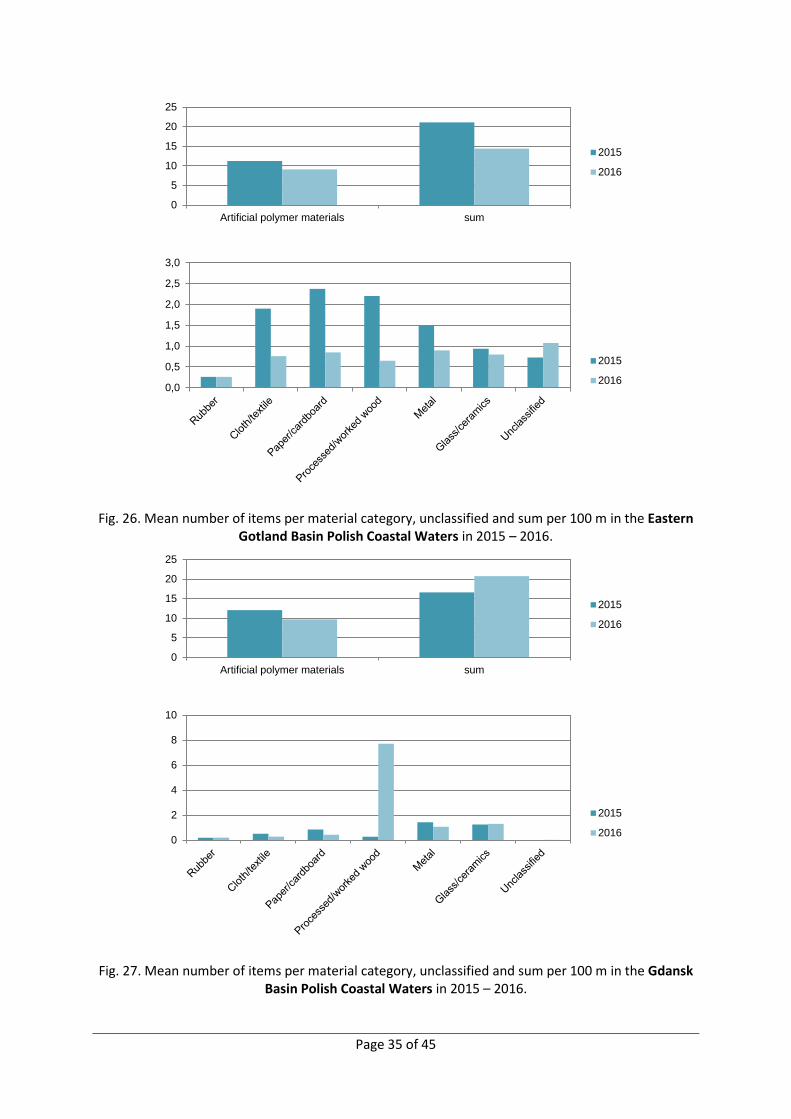
Fig. 26. Mean number of items per material category, unclassified and sum per 100 m in the Eastern Gotland Basin Polish Coastal Waters in 2015 – 2016.
Fig. 27. Mean number of items per material category, unclassified and sum per 100 m in the Gdansk Basin Polish Coastal Waters in 2015 – 2016.
0
5
10
15
20
25
Artificial polymer materials sum
2015
2016
0,0
0,5
1,0
1,5
2,0
2,5
3,0
2015
2016
0
5
10
15
20
25
Artificial polymer materials sum
2015
2016
0
2
4
6
8
10
2015
2016
Page 36 of 45
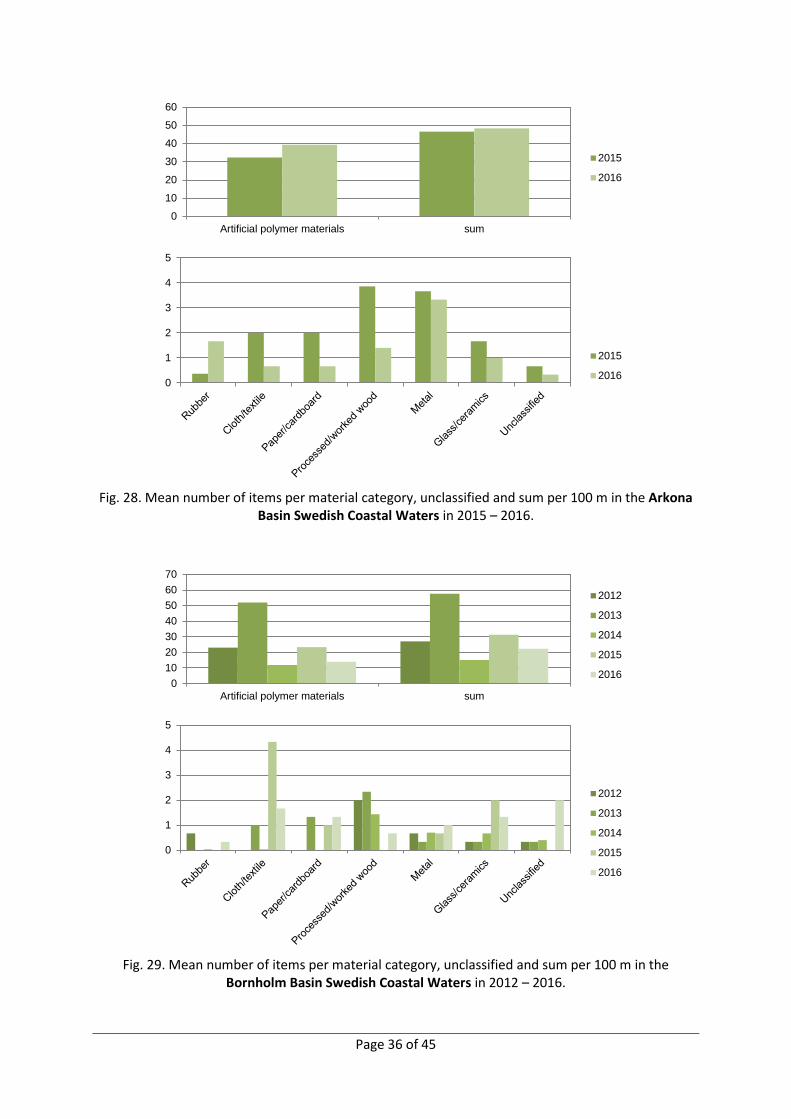
Fig. 28. Mean number of items per material category, unclassified and sum per 100 m in the Arkona
Basin Swedish Coastal Waters in 2015 – 2016.
Fig. 29. Mean number of items per material category, unclassified and sum per 100 m in the
Bornholm Basin Swedish Coastal Waters in 2012 – 2016.
0102030405060
Artificial polymer materials sum
2015
2016
0
1
2
3
4
5
2015
2016
010203040506070
Artificial polymer materials sum
2012
2013
2014
2015
2016
0
1
2
3
4
5
2012
2013
2014
2015
2016

Page 37 of 45
Fig. 30. Mean number of items per material category, unclassified and sum per 100 m in the
Bothnian Bay Swedish Coastal Waters in 2014 – 2016.
Fig. 31. Mean number of items per material category, unclassified and sum 100 m in the Bothnian
Sea Swedish Coastal Waters in 2012 – 2016.
0
10
20
30
40
50
Artificial polymer materials Sum
2014
2015
2016
0
1
2
3
4
5
6
2014
2015
2016
050
100150200250300350
Artificial polymer materials sum
2012
2013
2014
2015
2016
05
1015202530354045
2012
2013
2014
2015
2016
Page 38 of 45
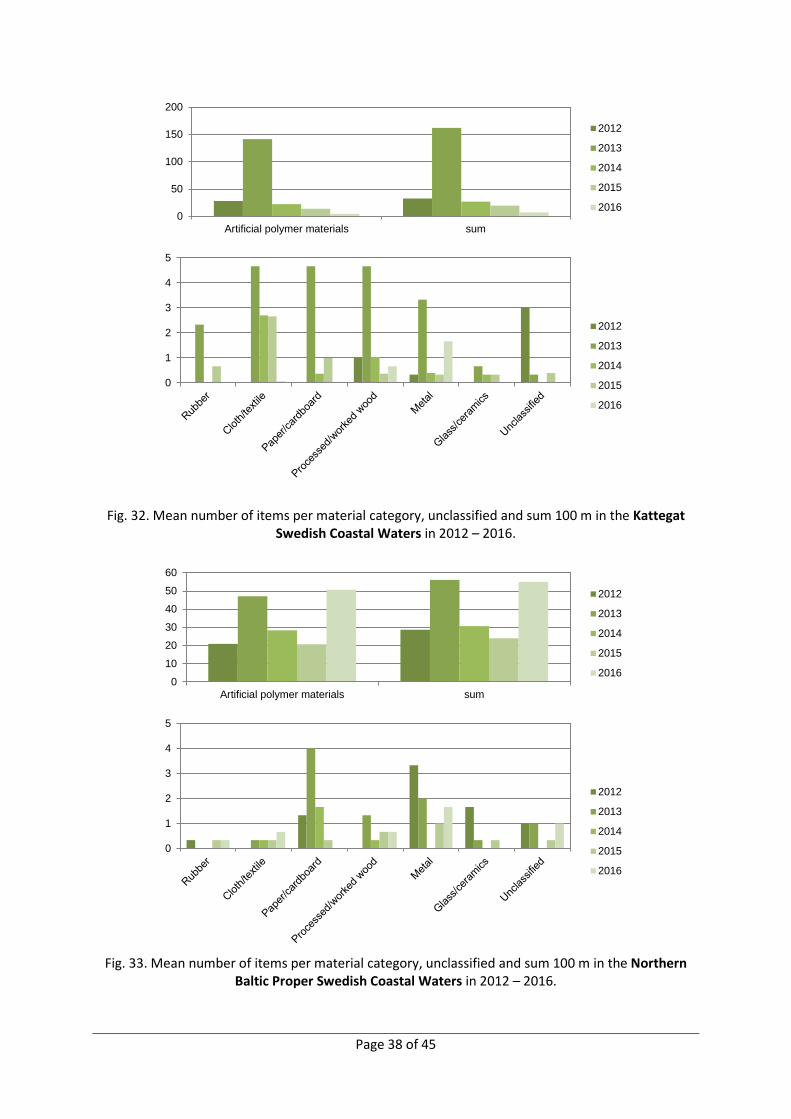
Fig. 32. Mean number of items per material category, unclassified and sum 100 m in the Kattegat Swedish Coastal Waters in 2012 – 2016.
Fig. 33. Mean number of items per material category, unclassified and sum 100 m in the Northern
Baltic Proper Swedish Coastal Waters in 2012 – 2016.
0
50
100
150
200
Artificial polymer materials sum
2012
2013
2014
2015
2016
0
1
2
3
4
5
2012
2013
2014
2015
2016
0102030405060
Artificial polymer materials sum
2012
2013
2014
2015
2016
0
1
2
3
4
5
2012
2013
2014
2015
2016
Page 39 of 45
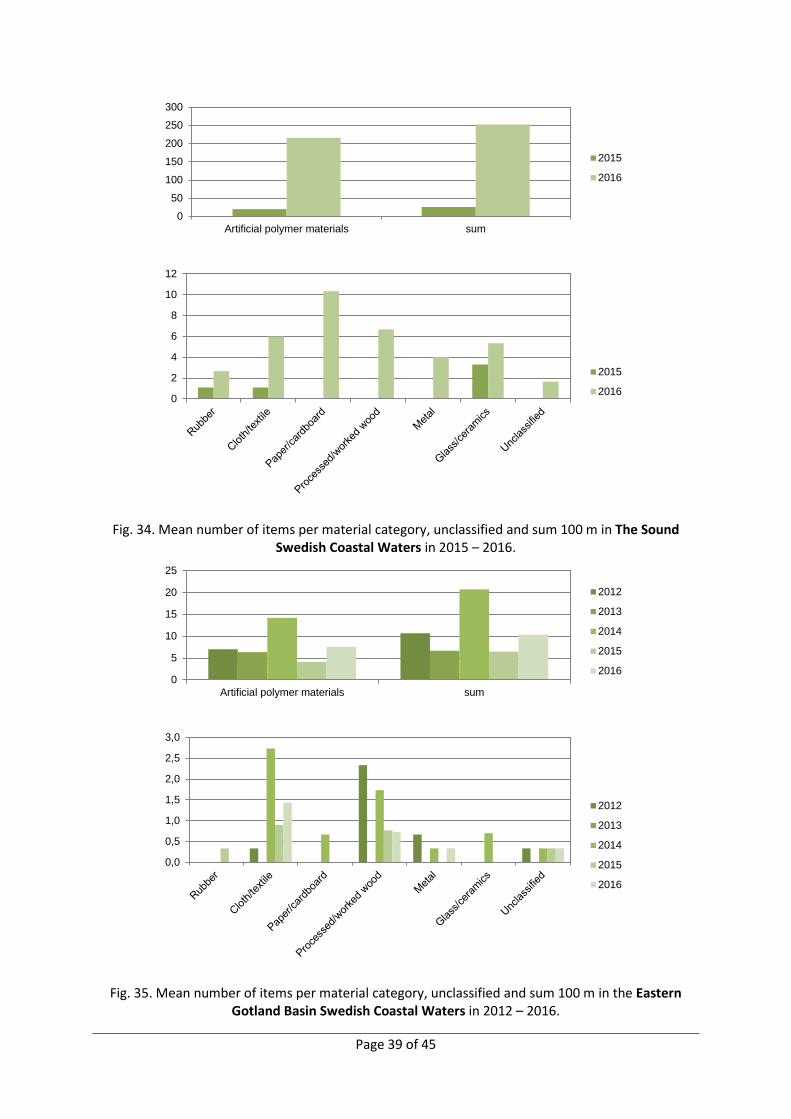
Fig. 34. Mean number of items per material category, unclassified and sum 100 m in The Sound Swedish Coastal Waters in 2015 – 2016.
Fig. 35. Mean number of items per material category, unclassified and sum 100 m in the Eastern Gotland Basin Swedish Coastal Waters in 2012 – 2016.
050
100150200250300
Artificial polymer materials sum
2015
2016
0
2
4
6
8
10
12
2015
2016
0
5
10
15
20
25
Artificial polymer materials sum
2012
2013
2014
2015
2016
0,0
0,5
1,0
1,5
2,0
2,5
3,0
2012
2013
2014
2015
2016

Page 40 of 45
Fig. 36. Mean number of items per material category, unclassified and sum 100 m in the Western Gotland Basin Swedish Coastal Waters in 2012 – 2016.
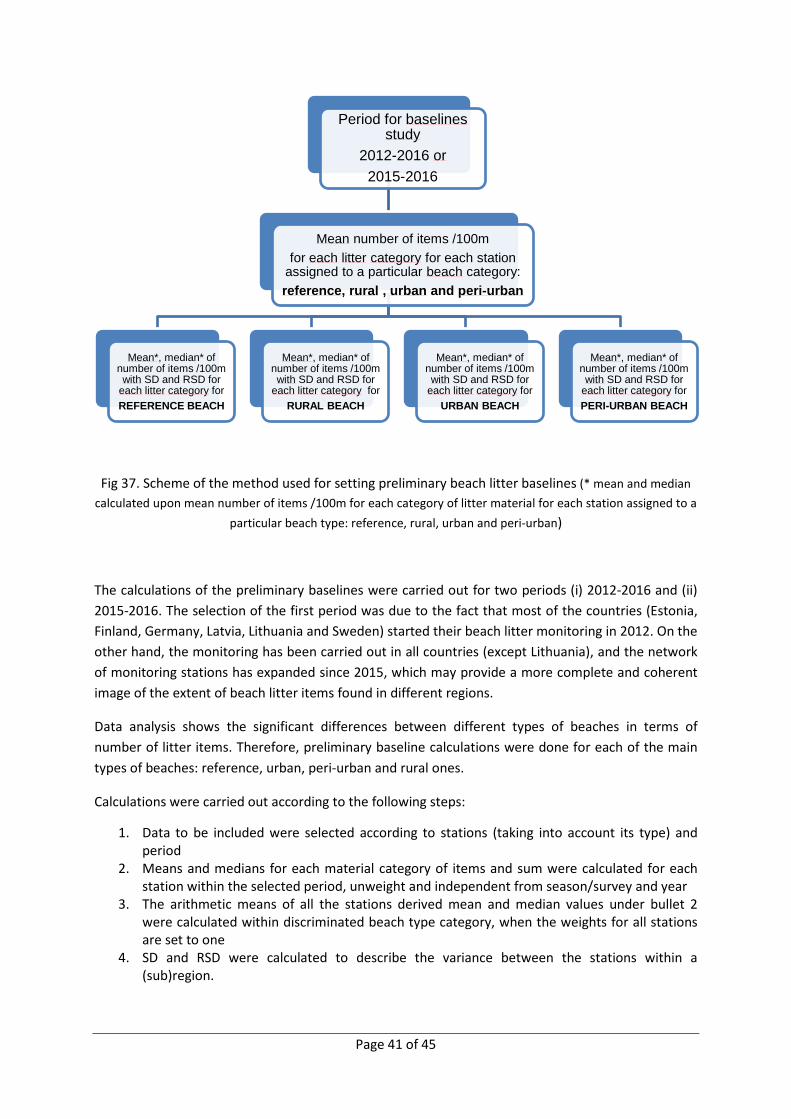
6. Proposals for setting preliminary beach litter baselines Baseline according to definition (after TG ML) is “a starting point that provides a first large scale comprehensive quantitative characterization of marine litter in a specific year and location”.
The calculations to determine the preliminary baseline for beach litter in the Baltic Sea region, which were based on monitoring data from all Contracting Parties, were done with the method proposed by Danish experts. The preliminary baselines for beach litter in the Baltic Sea area presented in this report should be understood as statistical parameters such as mean, median, standard deviation and relative standard deviation as determined for each category of litter material and a sum of all items for specific beach types. The method used for determining these preliminary baselines is presented in the form of a scheme (Fig. 37).
0
100
200
300
400
Artificial polymer materials sum
2012
2013
2014
2015
2016
0
10
20
30
40
50
2012
2013
2014
2015
2016
Page 41 of 45
Fig 37. Scheme of the method used for setting preliminary beach litter baselines (* mean and median calculated upon mean number of items /100m for each category of litter material for each station assigned to a
particular beach type: reference, rural, urban and peri-urban)
The calculations of the preliminary baselines were carried out for two periods (i) 2012-2016 and (ii) 2015-2016. The selection of the first period was due to the fact that most of the countries (Estonia, Finland, Germany, Latvia, Lithuania and Sweden) started their beach litter monitoring in 2012. On the other hand, the monitoring has been carried out in all countries (except Lithuania), and the network of monitoring stations has expanded since 2015, which may provide a more complete and coherent image of the extent of beach litter items found in different regions.
Data analysis shows the significant differences between different types of beaches in terms of number of litter items. Therefore, preliminary baseline calculations were done for each of the main types of beaches: reference, urban, peri-urban and rural ones.
Calculations were carried out according to the following steps:
1. Data to be included were selected according to stations (taking into account its type) and period
2. Means and medians for each material category of items and sum were calculated for each station within the selected period, unweight and independent from season/survey and year
3. The arithmetic means of all the stations derived mean and median values under bullet 2 were calculated within discriminated beach type category, when the weights for all stations are set to one
4. SD and RSD were calculated to describe the variance between the stations within a (sub)region.
Period for baselinesstudy
2012-2016 or2015-2016
Mean number of items /100m for each litter category for each station
assigned to a particular beach category:reference, rural , urban and peri-urban
Mean*, median* of number of items /100m with SD and RSD for
each litter category forREFERENCE BEACH
Mean*, median* of number of items /100m with SD and RSD for
each litter category for RURAL BEACH
Mean*, median* of number of items /100m with SD and RSD for
each litter category forURBAN BEACH
Mean*, median* of number of items /100m with SD and RSD for
each litter category forPERI-URBAN BEACH

Page 42 of 45
The results of the calculations are given in Tables 3 and 4, which also include information on the number of stations in the category included in the calculation. The results show significant differences in the average number of litter items in each material category between the different types of beaches, which justifies the calculation methodology used. This is particularly noticeable for artificial polymer materials and the sum of all beach litter items. In the period 2012-2016, at reference beaches the mean of all items per 100 m is 65.4, which is lower than on rural beaches (81.6), while on urban beaches it is as high as 225.2. The result obtained for peri-urban beaches (145.1 / 100 m) is located between the number of all items on rural and urban beaches. The determined median values are generally lower than the averages. Significant relative standard deviation values indicating significant differences in the number of items found on various surveyed locations should be also noted.
The results of the calculations done for the period 2015-2016 do not differ significantly from the results for the five-year period. The average sum of all beach litter items of all categories of material per 100 m on the reference beaches is 65.4 and it is slightly higher than that observed in 2012-2016, which also the case for rural beaches (92.3). The most visible differences are found in the urban and peri-urban areas, where the average values of all items of all categories of material are 225.2 and 145.1, which is by c.a. 20 -30 lower than in the five-year period.

Page 43 of 45
Table 3. Results (mean, median, SD and RSD) of preliminary baseline calculations for the period 2012-2016
Beach type Litter category
2012-2016
Number of
stations
Mean number of items /100 m
SD RSD
Median of
number of items /100 m
SD RSD
Reference
Artificial polymer materials
16
44.5 47.5 107.6 37.6 47.2 125.4 Cloth/textile 1.9 2.4 130.9 1.2 2.1 184.1
Glass/ceramics 5.2 10.0 192.3 3.4 6.6 191.6 Metal 2.8 3.4 119.7 2.1 3.5 164.0
Paper/cardboard 2.6 5.9 224.4 2.0 5.9 301.1 Processed/worked wood 2.2 2.0 91.6 1.6 2.0 122.4
Rubber 2.0 1.9 95.7 1.6 1.7 104.5 Unclassified 0.3 0.4 151.3 - - -
Sum 61.4 62.6 101.9 51.7 62.2 120.2
Rural
Artificial polymer materials
48
58.7 84.4 143.8 54.5 97.7 179.4 Cloth/textile 2.2 2.6 122.1 1.4 2.0 137.6
Glass/ceramics 3.4 3.6 106.4 2.3 2.4 107.5 Metal 3.0 2.5 84.0 2.5 2.5 101.1
Paper/cardboard 5.1 7.7 151.4 4.4 7.8 177.0 Processed/worked wood 2.7 5.0 186.8 1.6 3.9 243.1
Rubber 2.0 2.2 113.1 1.7 1.9 117.9 Unclassified 2.9 7.9 270.8 - - -
Sum 79.8 96.7 121.2 72.3 112.2 155.1
Urban
Artificial polymer materials
26
179.4 235.2 131.1 139.2 147.9 106.3 Cloth/textile 4.2 4.5 108.1 3.5 4.4 125.6
Glass/ceramics 5.7 7.7 135.1 4.6 7.5 164.8 Metal 12.4 14.3 115.2 10.9 13.4 122.8
Paper/cardboard 19.5 22.4 114.8 18.7 24.2 128.9 Processed/worked wood 7.3 9.7 133.6 4.6 8.3 177.9
Rubber 12.9 41.5 320.8 12.2 41.6 342.0 Unclassified 16.6 43.9 265.0 14.5 43.3 299.7
Sum 257.9 285.6 110.7 218.8 215.1 98.3
Peri-urban
Artificial polymer materials
30
95.9 54.5 56.8 77.1 38.3 49.7 Cloth/textile 4.0 4.2 107.4 2.6 2.6 101.1
Glass/ceramics 20.6 34.7 168.4 15.8 25.9 164.5 Metal 22.0 45.6 207.1 10.5 12.1 114.8
Paper/cardboard 15.6 15.7 101.1 12.5 13.3 106.9 Processed/worked wood 3.1 2.8 91.3 2.0 2.3 114.7
Rubber 3.3 3.2 98.2 2.6 2.5 97.5 Unclassified 4.1 8.8 216.3 2.5 6.5 261.2
Sum 168.5 94.7 56.2 146.1 99.0 67.7 SD – standard deviation RSD – relative standard deviation (%)

Page 44 of 45
Table 4. Results (means, medians, SD and RSD) of preliminary baseline calculations for the period 2015-2016.
Beach type Litter category
2015-2016
Number of
stations
Mean number of items /100 m
SD RSD
Median of
number of items /100 m
SD RSD
Reference
Artificial polymer materials
14
47.2 70.6 149.6 42.9 69.2 161.5 Cloth/textile 1.9 3.7 193.0 1.5 3.7 251.8
Glass/ceramics 4.7 10.8 227.0 3.4 7.1 212.4 Metal 3.1 6.3 202.8 2.6 6.3 241.4
Paper/cardboard 4.1 11.5 279.7 3.5 11.7 330.2 Processed/worked wood 2.1 2.3 113.1 1.6 2.3 137.4
Rubber 2.0 2.7 133.7 1.9 2.7 141.8 Unclassified 0.3 0.6 177.2 0.2 0.6 270.2
Sum 65.4 98.1 149.9 59.9 97.3 162.4
Rural
Artificial polymer materials
43
63.4 125.0 197.0 57.2 124.5 217.7 Cloth/textile 2.0 2.9 143.4 1.8 2.9 167.4
Glass/ceramics 2.7 3.4 126.1 2.4 3.3 138.2 Metal 2.5 2.1 83.1 2.2 2.1 91.9
Paper/cardboard 4.8 7.9 164.6 4.4 8.0 182.0 Processed/worked wood 2.1 3.5 168.4 1.5 3.3 226.9
Rubber 1.8 2.2 122.0 1.7 2.3 133.3 Unclassified 1.8 5.5 302.7 1.5 5.4 366.8
Sum 81.1 135.0 166.5 74.6 134.9 180.7
Urban
Artificial polymer materials
26
153.0 222.2 145.2 130.3 189.5 145.4 Cloth/textile 2.6 2.8 104.9 2.4 2.5 107.9
Glass/ceramics 4.9 8.3 167.4 4.4 8.2 184.7 Metal 9.7 12.9 132.7 9.1 13.0 142.9
Paper/cardboard 17.3 22.3 128.8 16.7 22.5 134.7 Processed/worked wood 7.6 9.7 128.2 5.1 8.3 163.6
Rubber 12.3 42.5 345.3 12.2 42.5 348.5 Unclassified 17.7 46.2 261.2 16.8 46.3 275.9
Sum 225.2 272.3 120.9 200.3 249.9 124.7
Peri-urban
Artificial polymer materials
30
78.6 52.7 67.1 73.2 49.9 68.2 Cloth/textile 3.8 4.8 127.1 3.8 4.8 128.2
Glass/ceramics 20.5 37.5 182.8 20.2 37.7 186.1 Metal 16.1 33.9 211.1 15.7 34.0 216.2
Paper/cardboard 14.6 19.0 130.2 14.3 19.1 133.7 Processed/worked wood 3.1 3.3 107.2 2.6 2.8 107.4
Rubber 3.4 3.8 111.9 3.3 3.9 118.5 Unclassified 5.2 11.8 228.4 5.0 11.9 238.5
Sum 145.1 86.5 59.6 139.8 87.0 62.2 SD – standard deviation RSD – relative standard deviation (%)

Page 45 of 45
References
JRC. 2013. Guidance on Monitoring of Marine Litter in European Seas.
MARLIN. 2013. Final report of Baltic marine litter project MARLIN - litter monitoring and raising awareness. Online 28.8.2017 http://www.cbss.org/wp-content/uploads/2012/08/marlin-baltic-marine-litter-report.pdf
OSPAR. 2010. Guideline for Monitoring Marine Litter on the Beaches in the OSPAR Maritime Area. Online 28.8.2017 https://www.ospar.org/ospar-data/10-02e_beachlitter%20guideline_english%20only.pdf
UNEP/IOC. 2009. UNEP/IOC Guidance on Survey and Monitoring of Marine Litter. Online 28.8.2017 http://wedocs.unep.org/bitstream/handle/20.500.11822/10739/MarineLitterSurveyandMonitoringGuidelines.pdf?sequence=1&isAllowed=y
Appendix to the Report on the analysis of compiled beach litter data and proposals for setting preliminary beach litter baselines in the Baltic Sea
Appendix
Table 1. Statistical analysis results for aggregated data within categories and sum for the whole Baltic Sea area calculated for two periods (i) 2012-2016 and (ii) 2015-2016.
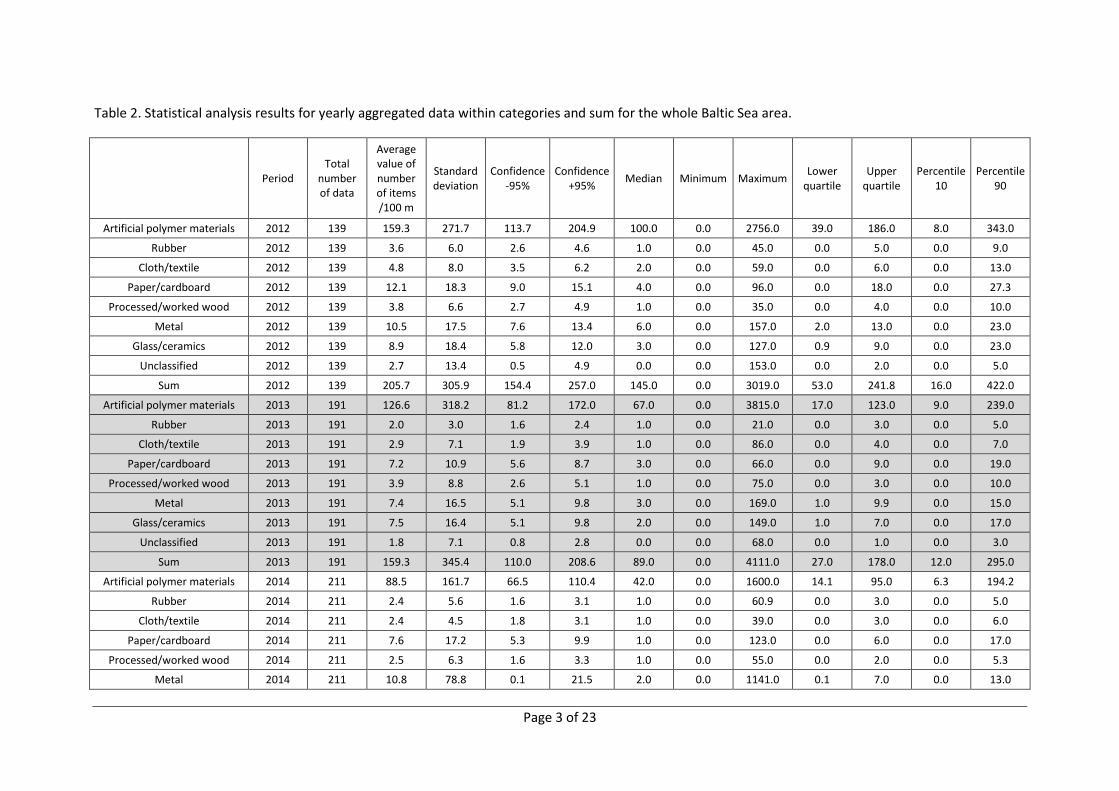
Table 2. Statistical analysis results for yearly aggregated data within categories and sum for the whole Baltic Sea area.
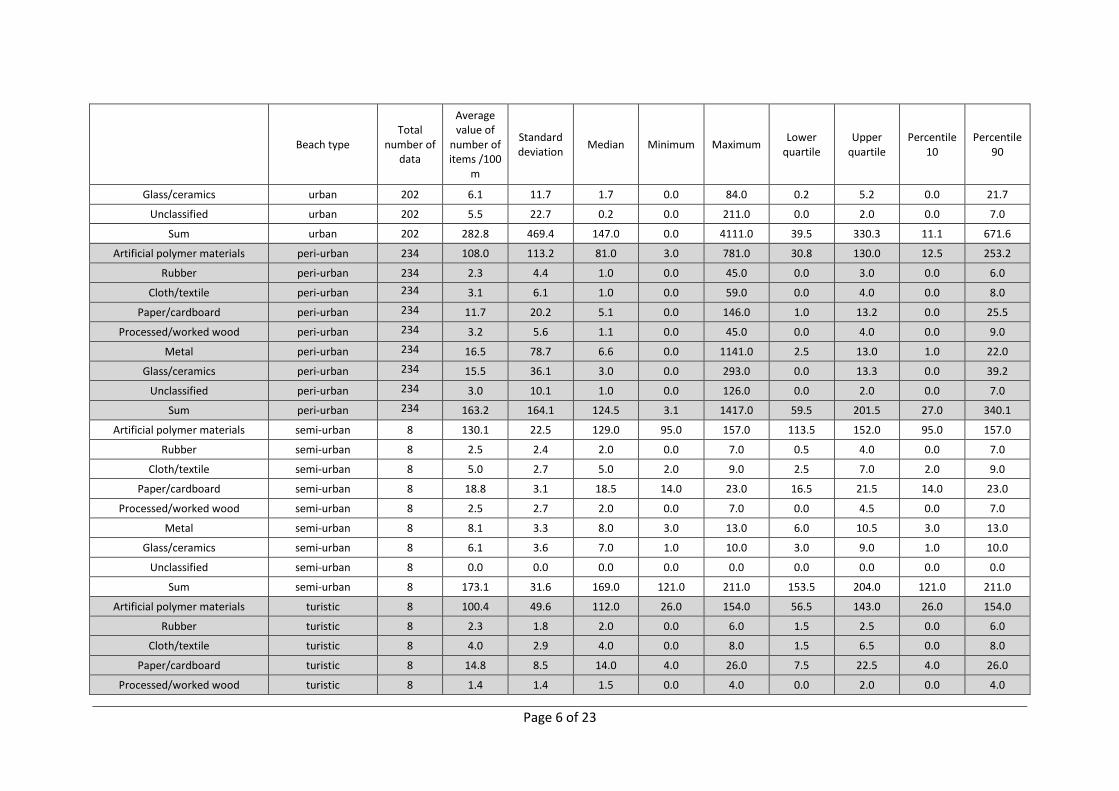
Table 3. Statistical analysis results for aggregated data according to beach type within categories and sum for the whole Baltic Sea area.
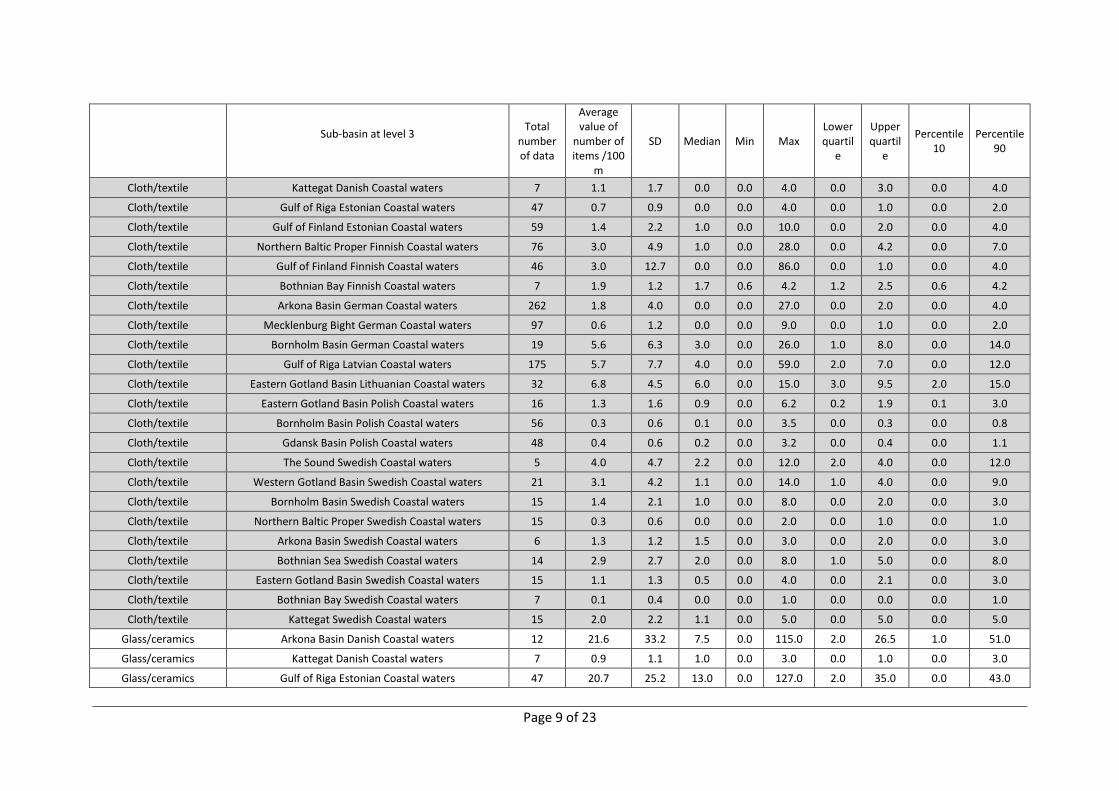
Table 4. Statistical analysis results for sub-basins aggregated data within categories for different monitoring periods depending on data availability.
Table 5. Statistical analysis results for sub-basins aggregated data within categories for monitoring period 2015-2016.

Page 2 of 23
Table 1. Statistical analysis results for aggregated data within categories and sum for the whole Baltic Sea area calculated for two periods (i) 2012-2016 and (ii) 2015-2016.
Period Total
number of data
Average value of
number of items /100
m
Standard deviation
Confidence -95%
Confidence +95% Median Minimum Maximum Lower
quartile Upper
quartile Percentile
10 Percentile
90
Artificial polymer materials
2015 - 2016 531 70.3 156.9 56.9 83.7 24.0 0.0 1964.0 8.7 79.0 3.6 151.0
2012 - 2016 1072 95.5 214.0 82.6 108.3 38.7 0.0 3815.0 12.0 101.0 4.9 216.0
Rubber 2015 - 2016 531 2.1 10.2 1.2 3.0 0.4 0.0 211.0 0.0 2.0 0.0 4.0
2012 - 2016 1072 2.3 8.0 1.8 2.8 1.0 0.0 211.0 0.0 3.0 0.0 5.1
Cloth/textile 2015 - 2016 531 1.7 3.5 1.4 2.0 0.3 0.0 47.0 0.0 2.0 0.0 4.0
2012 - 2016 1072 2.4 5.3 2.1 2.8 1.0 0.0 86.0 0.0 3.0 0.0 7.0
Paper/cardboard 2015 - 2016 531 5.3 13.2 4.1 6.4 1.0 0.0 146.0 0.0 4.6 0.0 13.0
2012 - 2016 1072 6.9 14.6 6.1 7.8 1.5 0.0 146.0 0.0 7.0 0.0 19.0
Processed/worked wood
2015 - 2016 530 3.2 11.6 2.3 4.2 0.9 0.0 175.1 0.0 2.6 0.0 7.0
2012 - 2016 1071 3.3 9.7 2.7 3.9 1.0 0.0 175.1 0.0 3.0 0.0 7.1
Metal 2015 - 2016 531 5.0 17.8 3.5 6.5 1.9 0.0 373.0 0.3 5.0 0.0 12.0
2012 - 2016 1072 7.3 38.3 5.0 9.6 2.0 0.0 1141.0 0.7 7.0 0.0 14.0
Glass/ceramics 2015 - 2016 531 5.0 17.2 3.5 6.4 1.0 0.0 290.0 0.0 3.0 0.0 9.0
2012 - 2016 1072 6.5 19.2 5.4 7.7 1.7 0.0 293.0 0.0 5.0 0.0 15.0
Unclassified 2015 - 2016 531 2.5 14.5 1.3 3.8 0.0 0.0 211.0 0.0 1.0 0.0 4.0
2012 - 2016 1072 2.4 12.5 1.6 3.1 0.0 0.0 211.0 0.0 1.0 0.0 4.0
Sum 2015 - 2016 531 95.1 179.2 79.8 110.3 38.0 0.0 2118.0 14.0 107.0 6.0 214.0
2012 - 2016 1072 126.6 242.9 112.1 141.2 58.1 0.0 4111.0 20.0 146.0 8.7 288.0
Page 3 of 23
Table 2. Statistical analysis results for yearly aggregated data within categories and sum for the whole Baltic Sea area.
Period Total
number of data
Average value of number of items /100 m
Standard deviation
Confidence -95%
Confidence +95% Median Minimum Maximum Lower
quartile Upper
quartile Percentile
10 Percentile
90
Artificial polymer materials 2012 139 159.3 271.7 113.7 204.9 100.0 0.0 2756.0 39.0 186.0 8.0 343.0
Rubber 2012 139 3.6 6.0 2.6 4.6 1.0 0.0 45.0 0.0 5.0 0.0 9.0
Cloth/textile 2012 139 4.8 8.0 3.5 6.2 2.0 0.0 59.0 0.0 6.0 0.0 13.0
Paper/cardboard 2012 139 12.1 18.3 9.0 15.1 4.0 0.0 96.0 0.0 18.0 0.0 27.3
Processed/worked wood 2012 139 3.8 6.6 2.7 4.9 1.0 0.0 35.0 0.0 4.0 0.0 10.0
Metal 2012 139 10.5 17.5 7.6 13.4 6.0 0.0 157.0 2.0 13.0 0.0 23.0
Glass/ceramics 2012 139 8.9 18.4 5.8 12.0 3.0 0.0 127.0 0.9 9.0 0.0 23.0
Unclassified 2012 139 2.7 13.4 0.5 4.9 0.0 0.0 153.0 0.0 2.0 0.0 5.0
Sum 2012 139 205.7 305.9 154.4 257.0 145.0 0.0 3019.0 53.0 241.8 16.0 422.0
Artificial polymer materials 2013 191 126.6 318.2 81.2 172.0 67.0 0.0 3815.0 17.0 123.0 9.0 239.0
Rubber 2013 191 2.0 3.0 1.6 2.4 1.0 0.0 21.0 0.0 3.0 0.0 5.0
Cloth/textile 2013 191 2.9 7.1 1.9 3.9 1.0 0.0 86.0 0.0 4.0 0.0 7.0
Paper/cardboard 2013 191 7.2 10.9 5.6 8.7 3.0 0.0 66.0 0.0 9.0 0.0 19.0
Processed/worked wood 2013 191 3.9 8.8 2.6 5.1 1.0 0.0 75.0 0.0 3.0 0.0 10.0
Metal 2013 191 7.4 16.5 5.1 9.8 3.0 0.0 169.0 1.0 9.9 0.0 15.0
Glass/ceramics 2013 191 7.5 16.4 5.1 9.8 2.0 0.0 149.0 1.0 7.0 0.0 17.0
Unclassified 2013 191 1.8 7.1 0.8 2.8 0.0 0.0 68.0 0.0 1.0 0.0 3.0
Sum 2013 191 159.3 345.4 110.0 208.6 89.0 0.0 4111.0 27.0 178.0 12.0 295.0
Artificial polymer materials 2014 211 88.5 161.7 66.5 110.4 42.0 0.0 1600.0 14.1 95.0 6.3 194.2
Rubber 2014 211 2.4 5.6 1.6 3.1 1.0 0.0 60.9 0.0 3.0 0.0 5.0
Cloth/textile 2014 211 2.4 4.5 1.8 3.1 1.0 0.0 39.0 0.0 3.0 0.0 6.0
Paper/cardboard 2014 211 7.6 17.2 5.3 9.9 1.0 0.0 123.0 0.0 6.0 0.0 17.0
Processed/worked wood 2014 211 2.5 6.3 1.6 3.3 1.0 0.0 55.0 0.0 2.0 0.0 5.3
Metal 2014 211 10.8 78.8 0.1 21.5 2.0 0.0 1141.0 0.1 7.0 0.0 13.0

Page 4 of 23
Period Total
number of data
Average value of number of items /100 m
Standard deviation
Confidence -95%
Confidence +95% Median Minimum Maximum Lower
quartile Upper
quartile Percentile
10 Percentile
90
Glass/ceramics 2014 211 7.9 25.5 4.5 11.4 2.0 0.0 293.0 0.0 5.0 0.0 15.0
Unclassified 2014 211 2.3 9.8 1.0 3.7 0.0 0.0 111.0 0.0 1.0 0.0 4.0
Sum 2014 211 124.4 206.6 96.4 152.5 61.0 1.0 1735.0 21.4 126.3 10.0 307.0
Artificial polymer materials 2015 278 67.0 128.4 51.8 82.2 23.0 0.0 1265.0 9.0 67.0 3.8 151.0
Rubber 2015 278 1.8 5.9 1.1 2.5 0.8 0.0 89.0 0.0 2.0 0.0 4.0
Cloth/textile 2015 278 1.7 3.0 1.3 2.0 0.9 0.0 24.0 0.0 2.0 0.0 4.6
Paper/cardboard 2015 278 3.9 7.3 3.0 4.7 1.0 0.0 55.0 0.0 4.0 0.0 11.0
Processed/worked wood 2015 277 3.1 10.3 1.9 4.3 0.7 0.0 150.0 0.0 3.0 0.0 7.0
Metal 2015 278 5.0 22.8 2.3 7.7 2.0 0.0 373.0 0.4 4.0 0.0 11.0
Glass/ceramics 2015 278 5.0 13.7 3.4 6.7 1.0 0.0 136.0 0.0 3.1 0.0 11.0
Unclassified 2015 278 1.8 7.8 0.8 2.7 0.0 0.0 89.0 0.0 0.9 0.0 3.0
Sum 2015 278 89.2 146.2 71.9 106.5 41.6 0.0 1390.0 15.0 102.0 6.0 206.0
Artificial polymer materials 2016 253 74.0 183.3 51.2 96.7 24.8 0.0 1964.0 8.4 79.0 3.0 160.0
Rubber 2016 253 2.5 13.4 0.8 4.1 0.3 0.0 211.0 0.0 2.0 0.0 5.0
Cloth/textile 2016 253 1.7 4.0 1.2 2.1 0.2 0.0 47.0 0.0 2.0 0.0 4.0
Paper/cardboard 2016 253 6.8 17.5 4.6 9.0 1.0 0.0 146.0 0.0 5.0 0.0 18.0
Processed/worked wood 2016 253 3.4 12.8 1.8 5.0 0.9 0.0 175.1 0.0 2.0 0.0 6.0
Metal 2016 253 5.0 9.8 3.7 6.2 1.8 0.0 74.0 0.3 5.0 0.0 12.0
Glass/ceramics 2016 253 4.9 20.5 2.3 7.4 1.0 0.0 290.0 0.0 3.0 0.0 9.0
Unclassified 2016 253 3.4 19.4 1.0 5.8 0.0 0.0 211.0 0.0 1.0 0.0 4.0
Sum 2016 253 101.5 209.7 75.5 127.5 34.8 0.0 2118.0 13.0 113.0 5.4 216.7

Page 5 of 23
Table 3. Statistical analysis results for aggregated data according to beach type within categories and sum for the whole Baltic Sea area.
Beach type Total
number of data
Average value of
number of items /100
m
Standard deviation Median Minimum Maximum Lower
quartile Upper
quartile Percentile
10 Percentile
90
Artificial polymer materials reference 174 34.6 50.6 16.0 0.0 305.0 6.0 41.8 1.0 92.5
Rubber reference 174 1.8 2.8 1.0 0.0 18.0 0.0 2.3 0.0 5.0
Cloth/textile reference 174 1.6 3.3 0.0 0.0 26.0 0.0 2.0 0.0 5.0
Paper/cardboard reference 174 1.6 5.2 0.0 0.0 45.0 0.0 1.0 0.0 3.5
Processed/worked wood reference 174 1.8 2.7 1.0 0.0 16.0 0.0 2.3 0.0 5.0
Metal reference 1774 2.1 3.9 1.0 0.0 26.0 0.0 2.0 0.0 6.0
Glass/ceramics reference 174 3.6 10.7 1.0 0.0 115.0 0.0 3.0 0.0 8.0
Unclassified reference 174 0.2 0.5 0.0 0.0 3.0 0.0 0.0 0.0 1.0
Sum reference 174 47.2 65.4 23.5 0.0 402.0 9.0 57.8 3.0 128.0
Artificial polymer materials rural 446 50.8 78.5 24.3 0.0 803.0 10.0 61.3 4.0 113.0
Rubber rural 446 1.5 2.4 1.0 0.0 15.0 0.0 2.0 0.0 4.0
Cloth/textile rural 446 1.6 3.2 0.2 0.0 39.0 0.0 2.0 0.0 5.0
Paper/cardboard rural 446 3.4 6.7 1.0 0.0 60.0 0.0 4.0 0.0 9.0
Processed/worked wood rural 446 2.0 5.0 0.1 0.0 55.0 0.0 2.0 0.0 5.0
Metal rural 446 2.6 3.3 1.4 0.0 22.0 0.2 4.0 0.0 7.0
Glass/ceramics rural 446 3.1 6.1 1.1 0.0 63.0 0.0 4.0 0.0 7.3
Unclassified rural 446 1.6 8.9 0.0 0.0 153.0 0.0 1.0 0.0 3.0
Sum rural 446 66.7 90.1 34.4 0.0 861.0 16.0 81.0 7.0 152.0
Artificial polymer materials urban 202 230.4 431.3 96.5 0.0 3815.0 18.8 255.6 6.1 529.8
Rubber urban 202 4.5 17.0 0.9 0.0 211.0 0.0 4.0 0.0 9.0
Cloth/textile urban 202 4.2 8.3 1.7 0.0 86.0 0.2 5.0 0.0 11.0
Paper/cardboard urban 202 13.2 20.3 4.0 0.0 123.0 0.8 17.3 0.0 40.8
Processed/worked wood urban 202 7.6 19.3 2.0 0.0 175.1 0.3 6.0 0.0 17.6
Metal urban 202 11.2 19.6 5.5 0.0 169.0 1.3 13.0 0.1 24.7
Page 6 of 23
Beach type Total
number of data
Average value of
number of items /100
m
Standard deviation Median Minimum Maximum Lower
quartile Upper
quartile Percentile
10 Percentile
90
Glass/ceramics urban 202 6.1 11.7 1.7 0.0 84.0 0.2 5.2 0.0 21.7
Unclassified urban 202 5.5 22.7 0.2 0.0 211.0 0.0 2.0 0.0 7.0
Sum urban 202 282.8 469.4 147.0 0.0 4111.0 39.5 330.3 11.1 671.6
Artificial polymer materials peri-urban 234 108.0 113.2 81.0 3.0 781.0 30.8 130.0 12.5 253.2
Rubber peri-urban 234 2.3 4.4 1.0 0.0 45.0 0.0 3.0 0.0 6.0
Cloth/textile peri-urban 234 3.1 6.1 1.0 0.0 59.0 0.0 4.0 0.0 8.0
Paper/cardboard peri-urban 234 11.7 20.2 5.1 0.0 146.0 1.0 13.2 0.0 25.5
Processed/worked wood peri-urban 234 3.2 5.6 1.1 0.0 45.0 0.0 4.0 0.0 9.0
Metal peri-urban 234 16.5 78.7 6.6 0.0 1141.0 2.5 13.0 1.0 22.0
Glass/ceramics peri-urban 234 15.5 36.1 3.0 0.0 293.0 0.0 13.3 0.0 39.2
Unclassified peri-urban 234 3.0 10.1 1.0 0.0 126.0 0.0 2.0 0.0 7.0
Sum peri-urban 234 163.2 164.1 124.5 3.1 1417.0 59.5 201.5 27.0 340.1
Artificial polymer materials semi-urban 8 130.1 22.5 129.0 95.0 157.0 113.5 152.0 95.0 157.0
Rubber semi-urban 8 2.5 2.4 2.0 0.0 7.0 0.5 4.0 0.0 7.0
Cloth/textile semi-urban 8 5.0 2.7 5.0 2.0 9.0 2.5 7.0 2.0 9.0
Paper/cardboard semi-urban 8 18.8 3.1 18.5 14.0 23.0 16.5 21.5 14.0 23.0
Processed/worked wood semi-urban 8 2.5 2.7 2.0 0.0 7.0 0.0 4.5 0.0 7.0
Metal semi-urban 8 8.1 3.3 8.0 3.0 13.0 6.0 10.5 3.0 13.0
Glass/ceramics semi-urban 8 6.1 3.6 7.0 1.0 10.0 3.0 9.0 1.0 10.0
Unclassified semi-urban 8 0.0 0.0 0.0 0.0 0.0 0.0 0.0 0.0 0.0
Sum semi-urban 8 173.1 31.6 169.0 121.0 211.0 153.5 204.0 121.0 211.0
Artificial polymer materials turistic 8 100.4 49.6 112.0 26.0 154.0 56.5 143.0 26.0 154.0
Rubber turistic 8 2.3 1.8 2.0 0.0 6.0 1.5 2.5 0.0 6.0
Cloth/textile turistic 8 4.0 2.9 4.0 0.0 8.0 1.5 6.5 0.0 8.0
Paper/cardboard turistic 8 14.8 8.5 14.0 4.0 26.0 7.5 22.5 4.0 26.0
Processed/worked wood turistic 8 1.4 1.4 1.5 0.0 4.0 0.0 2.0 0.0 4.0

Page 7 of 23
Beach type Total
number of data
Average value of
number of items /100
m
Standard deviation Median Minimum Maximum Lower
quartile Upper
quartile Percentile
10 Percentile
90
Metal turistic 8 10.4 8.5 10.5 1.0 23.0 2.0 17.0 1.0 23.0
Glass/ceramics turistic 8 4.5 3.6 4.0 0.0 10.0 1.5 7.5 0.0 10.0
Unclassified turistic 8 0.1 0.4 0.0 0.0 1.0 0.0 0.0 0.0 1.0
Sum turistic 8 137.8 69.9 152.0 35.0 211.0 73.0 203.0 35.0 211.0
Table 4. Statistical analysis results for sub-basins aggregated data within categories for different monitoring periods depending on the data availability (see Report Table 2).
Sub-basin at level 3
Total number of data
Average value of
number of items /100
m
SD Median Min Max Lower quartil
e
Upper quartil
e
Percentile 10
Percentile 90
Artificial polymer materials Arkona Basin Danish Coastal waters 12 75.5 52.4 62.5 15.0 180.0 44.0 96.0 18.0 168.0
Artificial polymer materials Kattegat Danish Coastal waters 7 62.6 57.7 31.0 19.0 151.0 19.0 140.0 19.0 151.0
Artificial polymer materials Gulf of Riga Estonian Coastal waters 47 76.5 91.1 49.0 3.0 386.1 18.0 81.0 10.0 207.0
Artificial polymer materials Gulf of Finland Estonian Coastal waters 59 97.0 89.6 83.1 3.3 462.0 31.1 119.0 11.2 211.0
Artificial polymer materials Northern Baltic Proper Finnish Coastal waters 76 324.6 617.0 100.6 0.0 3815.0 25.0 354.7 11.6 725.0
Artificial polymer materials Gulf of Finland Finnish Coastal waters 46 318.3 368.2 175.5 4.0 1600.0 85.0 377.0 51.0 781.0
Artificial polymer materials Bothnian Bay Finnish Coastal waters 7 184.5 182.7 129.5 7.7 547.6 29.8 248.0 7.7 547.6
Artificial polymer Arkona Basin German Coastal waters 262 55.5 96.3 20.0 0.0 785.0 7.0 61.0 2.0 141.0

Page 8 of 23
Sub-basin at level 3
Total number of data
Average value of
number of items /100
m
SD Median Min Max Lower quartil
e
Upper quartil
e
Percentile 10
Percentile 90
materials
Artificial polymer materials Mecklenburg Bight German Coastal waters 97 31.6 33.8 18.0 2.0 217.0 11.0 36.0 7.0 73.0
Artificial polymer materials Bornholm Basin German Coastal waters 19 55.8 35.8 45.0 10.0 120.0 26.0 91.0 19.0 119.0
Artificial polymer materials Gulf of Riga Latvian Coastal waters 175 95.3 79.1 83.0 6.0 516.0 44.0 112.0 25.0 161.0
Artificial polymer materials Eastern Gotland Basin Lithuanian Coastal waters 32 162.1 70.8 152.0 26.0 311.0 120.5 207.5 76.0 284.0
Artificial polymer materials Eastern Gotland Basin Polish Coastal waters 16 10.2 5.5 9.8 4.4 24.5 5.4 12.6 4.7 16.3
Artificial polymer materials Bornholm Basin Polish Coastal waters 56 35.4 56.6 15.4 0.0 251.4 5.0 39.3 3.1 92.5
Artificial polymer materials Gdansk Basin Polish Coastal waters 48 10.9 22.6 5.6 0.0 149.8 2.7 10.8 0.6 17.7
Artificial polymer materials The Sound Swedish Coastal waters 5 137.4 196.1 48.0 14.0 480.7 26.4 118.0 14.0 480.7
Artificial polymer materials Western Gotland Basin Swedish Coastal waters 21 130.6 143.1 85.0 0.7 492.0 18.6 194.2 4.3 329.2
Artificial polymer materials Bornholm Basin Swedish Coastal waters 15 24.8 32.6 19.0 3.0 139.0 11.6 26.0 5.0 30.0
Artificial polymer materials Northern Baltic Proper Swedish Coastal waters 15 33.6 32.6 24.0 0.0 123.0 8.0 54.0 3.0 67.0
Artificial polymer materials Arkona Basin Swedish Coastal waters 6 35.8 18.0 25.0 25.0 68.0 25.0 47.0 25.0 68.0
Artificial polymer materials Bothnian Sea Swedish Coastal waters 14 171.8 108.6 140.5 31.0 314.0 87.2 303.0 33.7 310.0
Artificial polymer materials Eastern Gotland Basin Swedish Coastal waters 15 7.8 5.8 5.0 1.0 19.1 4.0 13.6 1.1 16.0
Artificial polymer materials Bothnian Bay Swedish Coastal waters 7 26.8 26.1 14.0 6.3 80.0 11.0 40.4 6.3 80.0
Artificial polymer materials Kattegat Swedish Coastal waters 15 42.1 76.5 20.0 0.0 306.0 4.0 43.0 2.0 75.0
Cloth/textile Arkona Basin Danish Coastal waters 12 1.1 1.6 0.0 0.0 5.0 0.0 2.0 0.0 3.0
Page 9 of 23
Sub-basin at level 3
Total number of data
Average value of
number of items /100
m
SD Median Min Max Lower quartil
e
Upper quartil
e
Percentile 10
Percentile 90
Cloth/textile Kattegat Danish Coastal waters 7 1.1 1.7 0.0 0.0 4.0 0.0 3.0 0.0 4.0
Cloth/textile Gulf of Riga Estonian Coastal waters 47 0.7 0.9 0.0 0.0 4.0 0.0 1.0 0.0 2.0
Cloth/textile Gulf of Finland Estonian Coastal waters 59 1.4 2.2 1.0 0.0 10.0 0.0 2.0 0.0 4.0
Cloth/textile Northern Baltic Proper Finnish Coastal waters 76 3.0 4.9 1.0 0.0 28.0 0.0 4.2 0.0 7.0
Cloth/textile Gulf of Finland Finnish Coastal waters 46 3.0 12.7 0.0 0.0 86.0 0.0 1.0 0.0 4.0
Cloth/textile Bothnian Bay Finnish Coastal waters 7 1.9 1.2 1.7 0.6 4.2 1.2 2.5 0.6 4.2
Cloth/textile Arkona Basin German Coastal waters 262 1.8 4.0 0.0 0.0 27.0 0.0 2.0 0.0 4.0
Cloth/textile Mecklenburg Bight German Coastal waters 97 0.6 1.2 0.0 0.0 9.0 0.0 1.0 0.0 2.0
Cloth/textile Bornholm Basin German Coastal waters 19 5.6 6.3 3.0 0.0 26.0 1.0 8.0 0.0 14.0
Cloth/textile Gulf of Riga Latvian Coastal waters 175 5.7 7.7 4.0 0.0 59.0 2.0 7.0 0.0 12.0
Cloth/textile Eastern Gotland Basin Lithuanian Coastal waters 32 6.8 4.5 6.0 0.0 15.0 3.0 9.5 2.0 15.0
Cloth/textile Eastern Gotland Basin Polish Coastal waters 16 1.3 1.6 0.9 0.0 6.2 0.2 1.9 0.1 3.0
Cloth/textile Bornholm Basin Polish Coastal waters 56 0.3 0.6 0.1 0.0 3.5 0.0 0.3 0.0 0.8
Cloth/textile Gdansk Basin Polish Coastal waters 48 0.4 0.6 0.2 0.0 3.2 0.0 0.4 0.0 1.1
Cloth/textile The Sound Swedish Coastal waters 5 4.0 4.7 2.2 0.0 12.0 2.0 4.0 0.0 12.0
Cloth/textile Western Gotland Basin Swedish Coastal waters 21 3.1 4.2 1.1 0.0 14.0 1.0 4.0 0.0 9.0
Cloth/textile Bornholm Basin Swedish Coastal waters 15 1.4 2.1 1.0 0.0 8.0 0.0 2.0 0.0 3.0
Cloth/textile Northern Baltic Proper Swedish Coastal waters 15 0.3 0.6 0.0 0.0 2.0 0.0 1.0 0.0 1.0
Cloth/textile Arkona Basin Swedish Coastal waters 6 1.3 1.2 1.5 0.0 3.0 0.0 2.0 0.0 3.0
Cloth/textile Bothnian Sea Swedish Coastal waters 14 2.9 2.7 2.0 0.0 8.0 1.0 5.0 0.0 8.0
Cloth/textile Eastern Gotland Basin Swedish Coastal waters 15 1.1 1.3 0.5 0.0 4.0 0.0 2.1 0.0 3.0
Cloth/textile Bothnian Bay Swedish Coastal waters 7 0.1 0.4 0.0 0.0 1.0 0.0 0.0 0.0 1.0
Cloth/textile Kattegat Swedish Coastal waters 15 2.0 2.2 1.1 0.0 5.0 0.0 5.0 0.0 5.0
Glass/ceramics Arkona Basin Danish Coastal waters 12 21.6 33.2 7.5 0.0 115.0 2.0 26.5 1.0 51.0
Glass/ceramics Kattegat Danish Coastal waters 7 0.9 1.1 1.0 0.0 3.0 0.0 1.0 0.0 3.0
Glass/ceramics Gulf of Riga Estonian Coastal waters 47 20.7 25.2 13.0 0.0 127.0 2.0 35.0 0.0 43.0

Page 10 of 23
Sub-basin at level 3
Total number of data
Average value of
number of items /100
m
SD Median Min Max Lower quartil
e
Upper quartil
e
Percentile 10
Percentile 90
Glass/ceramics Gulf of Finland Estonian Coastal waters 59 5.5 9.3 3.0 0.0 63.0 1.0 7.0 0.0 13.0
Glass/ceramics Northern Baltic Proper Finnish Coastal waters 76 8.5 15.1 1.0 0.0 84.0 0.0 9.6 0.0 28.0
Glass/ceramics Gulf of Finland Finnish Coastal waters 46 5.2 10.0 1.0 0.0 54.0 0.0 4.0 0.0 20.0
Glass/ceramics Bothnian Bay Finnish Coastal waters 7 3.7 3.9 2.5 0.3 11.9 0.6 5.1 0.3 11.9
Glass/ceramics Arkona Basin German Coastal waters 262 1.8 4.0 1.0 0.0 42.0 0.0 2.0 0.0 4.0
Glass/ceramics Mecklenburg Bight German Coastal waters 97 5.1 6.4 3.0 0.0 36.0 1.0 6.0 0.0 12.0
Glass/ceramics Bornholm Basin German Coastal waters 19 4.9 5.9 2.0 0.0 19.0 0.0 8.0 0.0 16.0
Glass/ceramics Gulf of Riga Latvian Coastal waters 175 16.8 39.5 4.0 0.0 293.0 1.0 14.0 0.0 37.0
Glass/ceramics Eastern Gotland Basin Lithuanian Coastal waters 32 7.2 5.8 6.0 0.0 24.0 2.5 9.0 2.0 11.0
Glass/ceramics Eastern Gotland Basin Polish Coastal waters 16 0.9 0.6 1.0 0.0 1.8 0.4 1.3 0.0 1.7
Glass/ceramics Bornholm Basin Polish Coastal waters 56 1.7 3.4 1.0 0.0 24.3 0.4 1.7 0.2 3.2
Glass/ceramics Gdansk Basin Polish Coastal waters 48 1.3 1.7 0.6 0.0 6.4 0.2 1.8 0.0 3.6
Glass/ceramics The Sound Swedish Coastal waters 5 4.5 5.5 3.0 0.0 13.0 0.0 6.6 0.0 13.0
Glass/ceramics Western Gotland Basin Swedish Coastal waters 21 2.2 2.6 1.0 0.0 8.0 0.0 4.0 0.0 6.0
Glass/ceramics Bornholm Basin Swedish Coastal waters 15 0.9 1.4 0.0 0.0 4.0 0.0 2.0 0.0 3.0
Glass/ceramics Northern Baltic Proper Swedish Coastal waters 15 0.5 0.8 0.0 0.0 3.0 0.0 1.0 0.0 1.0
Glass/ceramics Arkona Basin Swedish Coastal waters 6 1.3 1.2 1.5 0.0 3.0 0.0 2.0 0.0 3.0
Glass/ceramics Bothnian Sea Swedish Coastal waters 14 0.5 1.1 0.0 0.0 4.0 0.0 1.0 0.0 1.1
Glass/ceramics Eastern Gotland Basin Swedish Coastal waters 15 0.1 0.5 0.0 0.0 2.1 0.0 0.0 0.0 0.0
Glass/ceramics Bothnian Bay Swedish Coastal waters 7 0.0 0.0 0.0 0.0 0.0 0.0 0.0 0.0 0.0
Glass/ceramics Kattegat Swedish Coastal waters 15 0.3 0.6 0.0 0.0 2.0 0.0 0.0 0.0 1.0
Metal Arkona Basin Danish Coastal waters 12 4.2 2.9 4.0 1.0 12.0 2.0 5.0 1.0 6.0
Metal Kattegat Danish Coastal waters 7 3.0 4.2 1.0 0.0 12.0 1.0 4.0 0.0 12.0
Metal Gulf of Riga Estonian Coastal waters 47 5.7 4.6 4.0 0.0 17.1 2.0 9.0 1.0 12.0
Metal Gulf of Finland Estonian Coastal waters 59 5.9 7.8 3.0 0.0 46.0 2.0 7.0 0.0 14.0
Metal Northern Baltic Proper Finnish Coastal waters 76 11.8 24.4 3.2 0.0 169.0 0.0 11.8 0.0 32.0

Page 11 of 23
Sub-basin at level 3
Total number of data
Average value of
number of items /100
m
SD Median Min Max Lower quartil
e
Upper quartil
e
Percentile 10
Percentile 90
Metal Gulf of Finland Finnish Coastal waters 46 6.8 7.0 5.0 0.0 30.0 2.0 9.0 0.0 17.0
Metal Bothnian Bay Finnish Coastal waters 7 4.9 3.4 5.5 0.0 9.3 1.8 8.5 0.0 9.3
Metal Arkona Basin German Coastal waters 262 2.5 3.9 1.0 0.0 24.0 0.0 3.0 0.0 7.0
Metal Mecklenburg Bight German Coastal waters 97 2.5 3.4 2.0 0.0 22.0 0.0 3.0 0.0 5.0
Metal Bornholm Basin German Coastal waters 19 2.2 2.0 1.0 0.0 7.0 1.0 4.0 0.0 6.0
Metal Gulf of Riga Latvian Coastal waters 175 21.1 91.4 7.0 0.0 1141.0 4.0 14.0 2.0 22.0
Metal Eastern Gotland Basin Lithuanian Coastal waters 32 11.6 8.0 10.5 1.0 35.0 6.0 13.0 3.0 23.0
Metal Eastern Gotland Basin Polish Coastal waters 16 1.2 1.1 0.9 0.0 3.5 0.4 1.7 0.1 3.5
Metal Bornholm Basin Polish Coastal waters 56 4.3 6.2 1.8 0.0 31.6 0.8 4.0 0.5 13.4
Metal Gdansk Basin Polish Coastal waters 48 1.3 1.8 0.6 0.0 8.4 0.3 1.5 0.0 2.7
Metal The Sound Swedish Coastal waters 5 2.4 2.6 2.0 0.0 6.0 0.0 4.0 0.0 6.0
Metal Western Gotland Basin Swedish Coastal waters 21 14.4 16.3 6.0 0.0 50.0 1.1 25.0 0.0 41.0
Metal Bornholm Basin Swedish Coastal waters 15 0.7 0.9 0.0 0.0 2.0 0.0 2.0 0.0 2.0
Metal Northern Baltic Proper Swedish Coastal waters 15 1.6 1.6 2.0 0.0 4.0 0.0 3.0 0.0 4.0
Metal Arkona Basin Swedish Coastal waters 6 3.5 1.6 3.5 1.0 6.0 3.0 4.0 1.0 6.0
Metal Bothnian Sea Swedish Coastal waters 14 11.0 7.1 10.1 2.0 25.0 6.0 17.2 3.0 21.0
Metal Eastern Gotland Basin Swedish Coastal waters 15 0.3 0.5 0.0 0.0 1.0 0.0 1.0 0.0 1.0
Metal Bothnian Bay Swedish Coastal waters 7 0.9 1.2 0.0 0.0 3.0 0.0 2.0 0.0 3.0
Metal Kattegat Swedish Coastal waters 15 1.2 1.5 1.0 0.0 5.0 0.0 2.0 0.0 3.0
Paper/cardboard Arkona Basin Danish Coastal waters 12 2.6 2.7 2.0 0.0 8.0 0.0 4.0 0.0 7.0
Paper/cardboard Kattegat Danish Coastal waters 7 2.6 2.9 1.0 0.0 7.0 0.0 6.0 0.0 7.0
Paper/cardboard Gulf of Riga Estonian Coastal waters 47 3.7 4.2 2.0 0.0 14.0 0.0 6.0 0.0 11.0
Paper/cardboard Gulf of Finland Estonian Coastal waters 59 3.9 4.0 3.0 0.0 18.0 1.0 7.0 0.0 10.0
Paper/cardboard Northern Baltic Proper Finnish Coastal waters 76 9.4 15.7 4.0 0.0 96.0 0.0 11.4 0.0 27.0
Paper/cardboard Gulf of Finland Finnish Coastal waters 46 4.2 4.7 2.5 0.0 18.0 1.0 7.0 0.0 10.0
Paper/cardboard Bothnian Bay Finnish Coastal waters 7 18.0 11.9 11.0 7.6 33.1 7.7 29.8 7.6 33.1
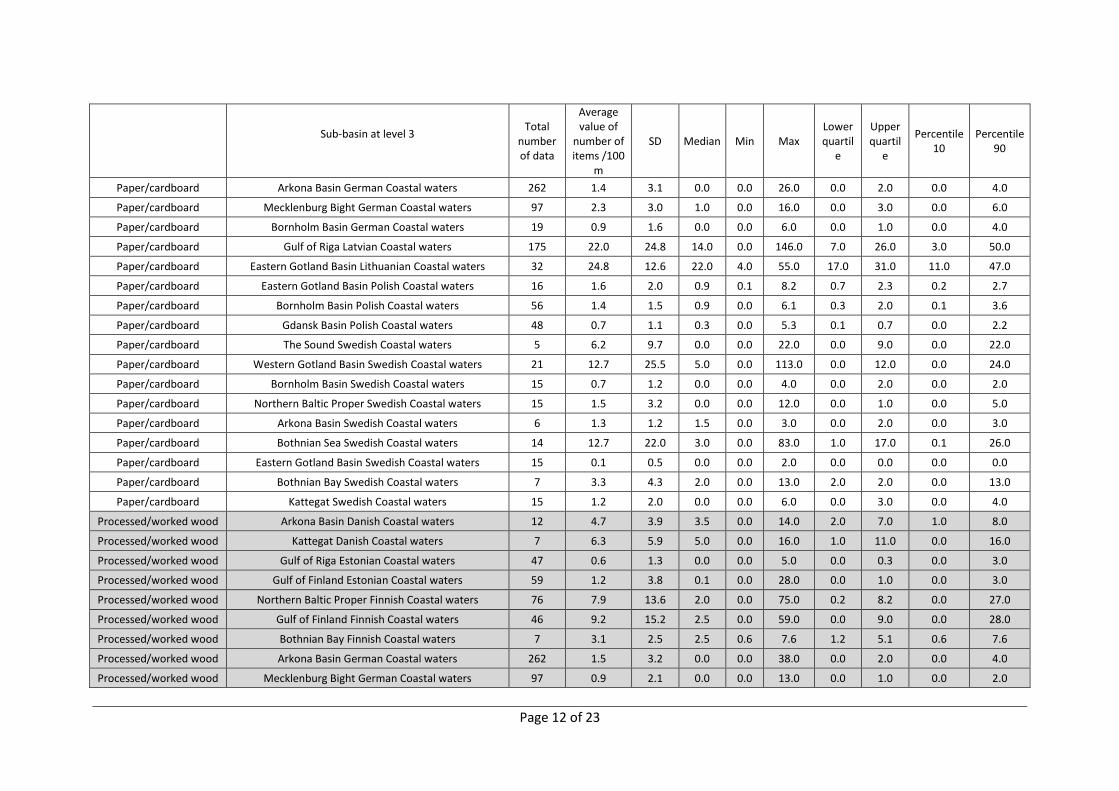
Page 12 of 23
Sub-basin at level 3
Total number of data
Average value of
number of items /100
m
SD Median Min Max Lower quartil
e
Upper quartil
e
Percentile 10
Percentile 90
Paper/cardboard Arkona Basin German Coastal waters 262 1.4 3.1 0.0 0.0 26.0 0.0 2.0 0.0 4.0
Paper/cardboard Mecklenburg Bight German Coastal waters 97 2.3 3.0 1.0 0.0 16.0 0.0 3.0 0.0 6.0
Paper/cardboard Bornholm Basin German Coastal waters 19 0.9 1.6 0.0 0.0 6.0 0.0 1.0 0.0 4.0
Paper/cardboard Gulf of Riga Latvian Coastal waters 175 22.0 24.8 14.0 0.0 146.0 7.0 26.0 3.0 50.0
Paper/cardboard Eastern Gotland Basin Lithuanian Coastal waters 32 24.8 12.6 22.0 4.0 55.0 17.0 31.0 11.0 47.0
Paper/cardboard Eastern Gotland Basin Polish Coastal waters 16 1.6 2.0 0.9 0.1 8.2 0.7 2.3 0.2 2.7
Paper/cardboard Bornholm Basin Polish Coastal waters 56 1.4 1.5 0.9 0.0 6.1 0.3 2.0 0.1 3.6
Paper/cardboard Gdansk Basin Polish Coastal waters 48 0.7 1.1 0.3 0.0 5.3 0.1 0.7 0.0 2.2
Paper/cardboard The Sound Swedish Coastal waters 5 6.2 9.7 0.0 0.0 22.0 0.0 9.0 0.0 22.0
Paper/cardboard Western Gotland Basin Swedish Coastal waters 21 12.7 25.5 5.0 0.0 113.0 0.0 12.0 0.0 24.0
Paper/cardboard Bornholm Basin Swedish Coastal waters 15 0.7 1.2 0.0 0.0 4.0 0.0 2.0 0.0 2.0
Paper/cardboard Northern Baltic Proper Swedish Coastal waters 15 1.5 3.2 0.0 0.0 12.0 0.0 1.0 0.0 5.0
Paper/cardboard Arkona Basin Swedish Coastal waters 6 1.3 1.2 1.5 0.0 3.0 0.0 2.0 0.0 3.0
Paper/cardboard Bothnian Sea Swedish Coastal waters 14 12.7 22.0 3.0 0.0 83.0 1.0 17.0 0.1 26.0
Paper/cardboard Eastern Gotland Basin Swedish Coastal waters 15 0.1 0.5 0.0 0.0 2.0 0.0 0.0 0.0 0.0
Paper/cardboard Bothnian Bay Swedish Coastal waters 7 3.3 4.3 2.0 0.0 13.0 2.0 2.0 0.0 13.0
Paper/cardboard Kattegat Swedish Coastal waters 15 1.2 2.0 0.0 0.0 6.0 0.0 3.0 0.0 4.0
Processed/worked wood Arkona Basin Danish Coastal waters 12 4.7 3.9 3.5 0.0 14.0 2.0 7.0 1.0 8.0
Processed/worked wood Kattegat Danish Coastal waters 7 6.3 5.9 5.0 0.0 16.0 1.0 11.0 0.0 16.0
Processed/worked wood Gulf of Riga Estonian Coastal waters 47 0.6 1.3 0.0 0.0 5.0 0.0 0.3 0.0 3.0
Processed/worked wood Gulf of Finland Estonian Coastal waters 59 1.2 3.8 0.1 0.0 28.0 0.0 1.0 0.0 3.0
Processed/worked wood Northern Baltic Proper Finnish Coastal waters 76 7.9 13.6 2.0 0.0 75.0 0.2 8.2 0.0 27.0
Processed/worked wood Gulf of Finland Finnish Coastal waters 46 9.2 15.2 2.5 0.0 59.0 0.0 9.0 0.0 28.0
Processed/worked wood Bothnian Bay Finnish Coastal waters 7 3.1 2.5 2.5 0.6 7.6 1.2 5.1 0.6 7.6
Processed/worked wood Arkona Basin German Coastal waters 262 1.5 3.2 0.0 0.0 38.0 0.0 2.0 0.0 4.0
Processed/worked wood Mecklenburg Bight German Coastal waters 97 0.9 2.1 0.0 0.0 13.0 0.0 1.0 0.0 2.0

Page 13 of 23
Sub-basin at level 3
Total number of data
Average value of
number of items /100
m
SD Median Min Max Lower quartil
e
Upper quartil
e
Percentile 10
Percentile 90
Processed/worked wood Bornholm Basin German Coastal waters 19 1.9 2.5 1.0 0.0 10.0 0.0 3.0 0.0 6.0
Processed/worked wood Gulf of Riga Latvian Coastal waters 175 3.0 4.4 2.0 0.0 36.0 1.0 4.0 0.0 6.0
Processed/worked wood Eastern Gotland Basin Lithuanian Coastal waters 32 5.4 6.8 3.0 0.0 24.0 1.0 6.0 0.0 18.0
Processed/worked wood Eastern Gotland Basin Polish Coastal waters 16 1.4 1.9 0.5 0.0 6.5 0.2 2.1 0.1 4.0
Processed/worked wood Bornholm Basin Polish Coastal waters 56 7.3 21.1 1.2 0.0 150.0 0.4 5.0 0.1 17.9
Processed/worked wood Gdansk Basin Polish Coastal waters 48 4.0 25.2 0.1 0.0 175.1 0.0 0.4 0.0 0.9
Processed/worked wood The Sound Swedish Coastal waters 5 4.0 5.9 0.0 0.0 13.0 0.0 7.0 0.0 13.0
Processed/worked wood Western Gotland Basin Swedish Coastal waters 20 7.9 11.7 4.2 0.0 45.0 0.8 8.6 0.0 23.0
Processed/worked wood Bornholm Basin Swedish Coastal waters 15 1.3 1.6 0.2 0.0 4.0 0.0 3.0 0.0 4.0
Processed/worked wood Northern Baltic Proper Swedish Coastal waters 15 0.6 0.9 0.0 0.0 2.0 0.0 2.0 0.0 2.0
Processed/worked wood Arkona Basin Swedish Coastal waters 6 2.6 2.1 2.0 0.2 6.3 2.0 3.3 0.2 6.3
Processed/worked wood Bothnian Sea Swedish Coastal waters 14 11.0 8.5 9.5 0.1 29.0 7.0 14.1 1.0 27.0
Processed/worked wood Eastern Gotland Basin Swedish Coastal waters 15 1.1 1.8 0.1 0.0 6.0 0.0 2.1 0.0 4.1
Processed/worked wood Bothnian Bay Swedish Coastal waters 7 1.6 2.1 0.0 0.0 5.0 0.0 4.0 0.0 5.0
Processed/worked wood Kattegat Swedish Coastal waters 15 1.5 2.8 1.0 0.0 11.0 0.0 2.0 0.0 3.0
Rubber Arkona Basin Danish Coastal waters 12 2.3 1.4 2.0 0.0 4.0 1.5 3.5 0.0 4.0
Rubber Kattegat Danish Coastal waters 7 0.9 0.9 1.0 0.0 2.0 0.0 2.0 0.0 2.0
Rubber Gulf of Riga Estonian Coastal waters 47 0.9 1.1 0.1 0.0 4.0 0.0 2.0 0.0 3.0
Rubber Gulf of Finland Estonian Coastal waters 59 1.5 1.9 1.0 0.0 9.0 0.0 2.0 0.0 4.0
Rubber Northern Baltic Proper Finnish Coastal waters 76 2.7 7.6 0.9 0.0 60.9 0.0 2.0 0.0 5.0
Rubber Gulf of Finland Finnish Coastal waters 46 1.2 2.8 0.0 0.0 13.0 0.0 1.0 0.0 5.0
Rubber Bothnian Bay Finnish Coastal waters 7 1.4 2.0 0.6 0.0 5.1 0.0 3.4 0.0 5.1
Rubber Arkona Basin German Coastal waters 262 1.9 3.4 1.0 0.0 29.0 0.0 2.0 0.0 5.0
Rubber Mecklenburg Bight German Coastal waters 97 1.3 1.7 1.0 0.0 8.0 0.0 2.0 0.0 3.0
Rubber Bornholm Basin German Coastal waters 19 4.2 4.4 3.0 0.0 18.0 2.0 5.0 0.0 11.0
Rubber Gulf of Riga Latvian Coastal waters 175 6.4 17.7 3.0 0.0 211.0 2.0 6.0 0.0 11.0

Page 14 of 23
Sub-basin at level 3
Total number of data
Average value of
number of items /100
m
SD Median Min Max Lower quartil
e
Upper quartil
e
Percentile 10
Percentile 90
Rubber Eastern Gotland Basin Lithuanian Coastal waters 32 4.4 4.1 3.0 0.0 17.0 2.0 6.5 1.0 9.0
Rubber Eastern Gotland Basin Polish Coastal waters 16 0.3 0.2 0.3 0.0 0.8 0.1 0.4 0.0 0.6
Rubber Bornholm Basin Polish Coastal waters 56 0.2 0.3 0.1 0.0 1.8 0.0 0.4 0.0 0.6
Rubber Gdansk Basin Polish Coastal waters 48 0.2 0.3 0.1 0.0 1.2 0.0 0.3 0.0 0.6
Rubber The Sound Swedish Coastal waters 5 2.0 2.1 2.2 0.0 5.0 0.0 3.0 0.0 5.0
Rubber Western Gotland Basin Swedish Coastal waters 21 1.1 1.2 1.0 0.0 4.0 0.0 2.0 0.0 3.0
Rubber Bornholm Basin Swedish Coastal waters 15 0.2 0.4 0.0 0.0 1.0 0.0 0.1 0.0 1.0
Rubber Northern Baltic Proper Swedish Coastal waters 15 0.2 0.4 0.0 0.0 1.0 0.0 0.0 0.0 1.0
Rubber Arkona Basin Swedish Coastal waters 6 1.0 1.2 0.6 0.0 3.0 0.0 2.0 0.0 3.0
Rubber Bothnian Sea Swedish Coastal waters 14 0.9 1.7 0.0 0.0 6.0 0.0 2.0 0.0 2.0
Rubber Eastern Gotland Basin Swedish Coastal waters 15 0.1 0.3 0.0 0.0 1.0 0.0 0.0 0.0 0.0
Rubber Bothnian Bay Swedish Coastal waters 7 0.0 0.0 0.0 0.0 0.0 0.0 0.0 0.0 0.0
Rubber Kattegat Swedish Coastal waters 15 0.6 1.5 0.0 0.0 6.0 0.0 1.0 0.0 1.0
Sum Arkona Basin Danish Coastal waters 12 112.1 61.5 101.5 34.0 215.0 66.5 158.5 43.0 203.0
Sum Kattegat Danish Coastal waters 7 77.6 70.8 39.0 23.0 192.0 31.0 167.0 23.0 192.0
Sum Gulf of Riga Estonian Coastal waters 47 111.2 105.4 68.1 10.2 457.2 42.0 149.3 23.0 252.0
Sum Gulf of Finland Estonian Coastal waters 59 117.7 94.9 102.2 5.1 497.2 52.1 155.4 20.2 239.0
Sum Northern Baltic Proper Finnish Coastal waters 76 369.6 669.2 135.2 0.0 4111.0 27.0 397.3 13.1 793.3
Sum Gulf of Finland Finnish Coastal waters 46 348.3 394.3 194.5 7.0 1735.0 87.0 448.0 60.0 809.0
Sum Bothnian Bay Finnish Coastal waters 7 230.3 216.2 168.5 19.0 677.3 69.0 261.5 19.0 677.3
Sum Arkona Basin German Coastal waters 262 66.9 107.5 27.0 0.0 854.0 11.0 79.0 5.0 158.0
Sum Mecklenburg Bight German Coastal waters 97 44.7 43.1 28.0 5.0 233.0 19.0 53.0 12.0 99.0
Sum Bornholm Basin German Coastal waters 19 75.7 40.2 63.0 21.0 147.0 42.0 120.0 29.0 136.0
Sum Gulf of Riga Latvian Coastal waters 175 180.2 169.4 135.0 14.0 1417.0 92.0 206.0 56.0 334.0
Sum Eastern Gotland Basin Lithuanian Coastal waters 32 222.3 98.5 209.5 35.0 422.0 161.5 292.0 110.0 385.0
Sum Eastern Gotland Basin Polish Coastal waters 16 17.8 12.2 14.2 5.8 52.5 8.8 21.7 6.3 33.0

Page 15 of 23
Sub-basin at level 3
Total number of data
Average value of
number of items /100
m
SD Median Min Max Lower quartil
e
Upper quartil
e
Percentile 10
Percentile 90
Sum Bornholm Basin Polish Coastal waters 56 51.1 63.1 32.4 0.9 275.8 11.5 56.7 5.3 130.8
Sum Gdansk Basin Polish Coastal waters 48 18.7 38.6 9.9 1.0 216.7 4.5 13.8 2.7 27.0
Sum The Sound Swedish Coastal waters 5 161.6 202.5 86.0 14.0 509.7 37.4 161.0 14.0 509.7
Sum Western Gotland Basin Swedish Coastal waters 21 174.4 190.2 108.0 1.7 647.6 25.2 265.6 4.4 411.2
Sum Bornholm Basin Swedish Coastal waters 15 30.7 33.2 29.0 3.1 145.0 12.3 31.1 9.0 34.0
Sum Northern Baltic Proper Swedish Coastal waters 15 38.9 34.3 27.0 0.0 128.0 15.0 56.4 3.0 77.0
Sum Arkona Basin Swedish Coastal waters 6 47.5 19.0 40.7 30.2 77.0 32.1 64.3 30.2 77.0
Sum Bothnian Sea Swedish Coastal waters 14 215.2 128.7 199.5 36.0 417.0 107.3 330.0 46.7 368.0
Sum Eastern Gotland Basin Swedish Coastal waters 15 11.0 7.0 8.6 3.0 23.3 5.0 18.0 3.0 21.4
Sum Bothnian Bay Swedish Coastal waters 7 32.7 27.1 18.0 6.3 84.0 15.0 47.4 6.3 84.0
Sum Kattegat Swedish Coastal waters 15 49.7 80.0 20.0 3.2 320.0 9.0 66.0 4.5 89.0
Unclassified Arkona Basin Danish Coastal waters 12 0.3 0.6 0.0 0.0 2.0 0.0 0.0 0.0 1.0
Unclassified Kattegat Danish Coastal waters 7 0.3 0.5 0.0 0.0 1.0 0.0 1.0 0.0 1.0
Unclassified Gulf of Riga Estonian Coastal waters 47 2.5 5.9 0.0 0.0 31.0 0.0 2.0 0.0 6.0
Unclassified Gulf of Finland Estonian Coastal waters 59 1.2 1.7 1.0 0.0 7.0 0.0 2.0 0.0 4.0
Unclassified Northern Baltic Proper Finnish Coastal waters 76 1.6 2.8 0.3 0.0 14.0 0.0 2.3 0.0 5.0
Unclassified Gulf of Finland Finnish Coastal waters 46 0.4 0.9 0.0 0.0 4.0 0.0 0.0 0.0 2.0
Unclassified Bothnian Bay Finnish Coastal waters 7 12.7 24.9 3.1 0.3 68.6 0.6 10.2 0.3 68.6
Unclassified Arkona Basin German Coastal waters 262 0.5 1.8 0.0 0.0 16.0 0.0 0.0 0.0 2.0
Unclassified Mecklenburg Bight German Coastal waters 97 0.5 1.5 0.0 0.0 12.0 0.0 0.0 0.0 1.0
Unclassified Bornholm Basin German Coastal waters 19 0.1 0.2 0.0 0.0 1.0 0.0 0.0 0.0 0.0
Unclassified Gulf of Riga Latvian Coastal waters 175 10.0 28.7 2.0 0.0 211.0 0.0 6.0 0.0 17.0
Unclassified Eastern Gotland Basin Lithuanian Coastal waters 32 0.1 0.4 0.0 0.0 2.0 0.0 0.0 0.0 0.0
Unclassified Eastern Gotland Basin Polish Coastal waters 16 0.9 1.6 0.3 0.0 6.0 0.0 0.9 0.0 3.1
Unclassified Bornholm Basin Polish Coastal waters 56 0.4 1.2 0.0 0.0 6.7 0.0 0.2 0.0 0.8
Unclassified Gdansk Basin Polish Coastal waters 48 0.0 0.1 0.0 0.0 0.3 0.0 0.0 0.0 0.1
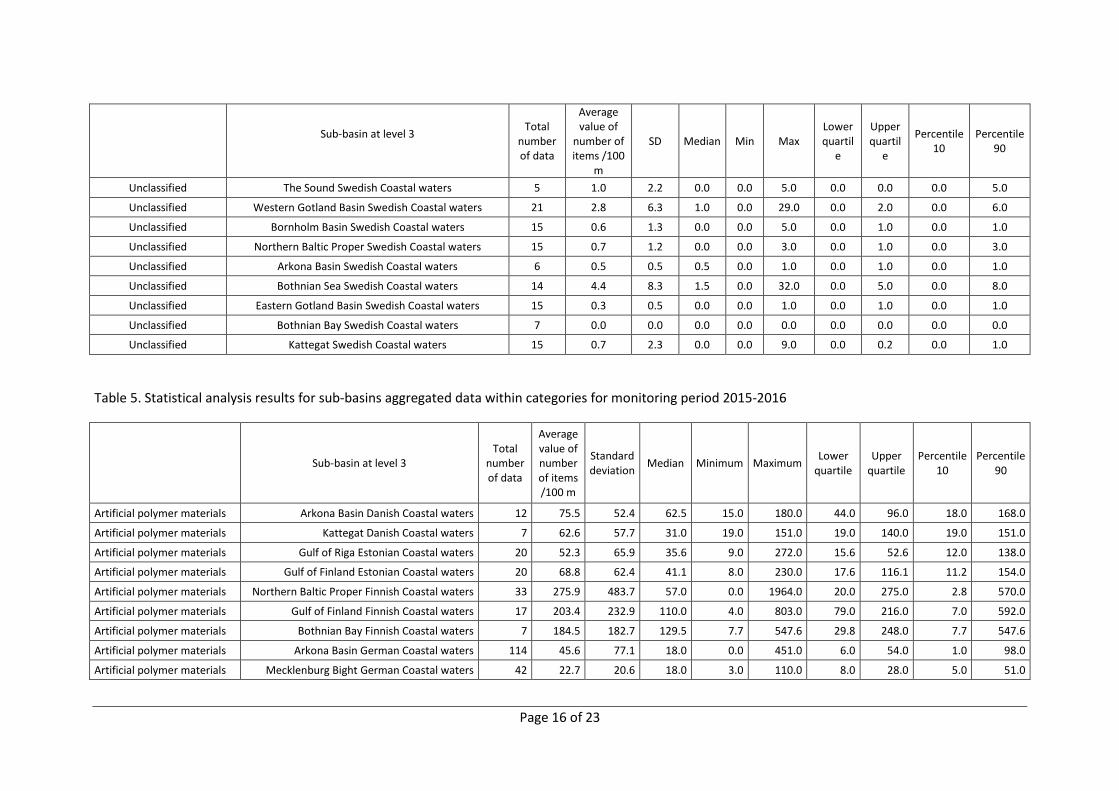
Page 16 of 23
Sub-basin at level 3
Total number of data
Average value of
number of items /100
m
SD Median Min Max Lower quartil
e
Upper quartil
e
Percentile 10
Percentile 90
Unclassified The Sound Swedish Coastal waters 5 1.0 2.2 0.0 0.0 5.0 0.0 0.0 0.0 5.0
Unclassified Western Gotland Basin Swedish Coastal waters 21 2.8 6.3 1.0 0.0 29.0 0.0 2.0 0.0 6.0
Unclassified Bornholm Basin Swedish Coastal waters 15 0.6 1.3 0.0 0.0 5.0 0.0 1.0 0.0 1.0
Unclassified Northern Baltic Proper Swedish Coastal waters 15 0.7 1.2 0.0 0.0 3.0 0.0 1.0 0.0 3.0
Unclassified Arkona Basin Swedish Coastal waters 6 0.5 0.5 0.5 0.0 1.0 0.0 1.0 0.0 1.0
Unclassified Bothnian Sea Swedish Coastal waters 14 4.4 8.3 1.5 0.0 32.0 0.0 5.0 0.0 8.0
Unclassified Eastern Gotland Basin Swedish Coastal waters 15 0.3 0.5 0.0 0.0 1.0 0.0 1.0 0.0 1.0
Unclassified Bothnian Bay Swedish Coastal waters 7 0.0 0.0 0.0 0.0 0.0 0.0 0.0 0.0 0.0
Unclassified Kattegat Swedish Coastal waters 15 0.7 2.3 0.0 0.0 9.0 0.0 0.2 0.0 1.0
Table 5. Statistical analysis results for sub-basins aggregated data within categories for monitoring period 2015-2016
Sub-basin at level 3 Total
number of data
Average value of number of items /100 m
Standard deviation Median Minimum Maximum Lower
quartile Upper
quartile Percentile
10 Percentile
90
Artificial polymer materials Arkona Basin Danish Coastal waters 12 75.5 52.4 62.5 15.0 180.0 44.0 96.0 18.0 168.0
Artificial polymer materials Kattegat Danish Coastal waters 7 62.6 57.7 31.0 19.0 151.0 19.0 140.0 19.0 151.0
Artificial polymer materials Gulf of Riga Estonian Coastal waters 20 52.3 65.9 35.6 9.0 272.0 15.6 52.6 12.0 138.0
Artificial polymer materials Gulf of Finland Estonian Coastal waters 20 68.8 62.4 41.1 8.0 230.0 17.6 116.1 11.2 154.0
Artificial polymer materials Northern Baltic Proper Finnish Coastal waters 33 275.9 483.7 57.0 0.0 1964.0 20.0 275.0 2.8 570.0
Artificial polymer materials Gulf of Finland Finnish Coastal waters 17 203.4 232.9 110.0 4.0 803.0 79.0 216.0 7.0 592.0
Artificial polymer materials Bothnian Bay Finnish Coastal waters 7 184.5 182.7 129.5 7.7 547.6 29.8 248.0 7.7 547.6
Artificial polymer materials Arkona Basin German Coastal waters 114 45.6 77.1 18.0 0.0 451.0 6.0 54.0 1.0 98.0
Artificial polymer materials Mecklenburg Bight German Coastal waters 42 22.7 20.6 18.0 3.0 110.0 8.0 28.0 5.0 51.0

Page 17 of 23
Artificial polymer materials Bornholm Basin German Coastal waters 8 65.3 35.9 56.0 23.0 120.0 36.5 97.0 23.0 120.0
Artificial polymer materials Gulf of Riga Latvian national waters 12 123.0 150.3 84.5 7.0 516.0 35.0 109.5 25.0 334.0
Artificial polymer materials Gulf of Riga Latvian Coastal waters 60 91.5 66.5 81.5 6.0 323.0 41.5 111.5 21.0 175.5
Artificial polymer materials Eastern Gotland Basin Polish Coastal waters 16 10.2 5.5 9.8 4.4 24.5 5.4 12.6 4.7 16.3
Artificial polymer materials Bornholm Basin Polish Coastal waters 56 35.4 56.6 15.4 0.0 251.4 5.0 39.3 3.1 92.5
Artificial polymer materials Gdansk Basin Polish Coastal waters 48 10.9 22.6 5.6 0.0 149.8 2.7 10.8 0.6 17.7
Artificial polymer materials The Sound Swedish Coastal waters 5 137.4 196.1 48.0 14.0 480.7 26.4 118.0 14.0 480.7
Artificial polymer materials Western Gotland Basin Swedish Coastal waters 12 88.6 120.1 19.9 0.7 329.2 5.7 182.6 2.0 254.1
Artificial polymer materials Bornholm Basin Swedish Coastal waters 6 18.7 7.0 20.0 6.0 26.1 17.0 23.0 6.0 26.1
Artificial polymer materials Northern Baltic Proper Swedish Coastal waters 6 35.7 45.1 23.0 0.0 123.0 5.0 40.0 0.0 123.0
Artificial polymer materials Arkona Basin Swedish Coastal waters 6 35.8 18.0 25.0 25.0 68.0 25.0 47.0 25.0 68.0
Artificial polymer materials Bothnian Sea Swedish Coastal waters 6 139.8 131.3 80.6 31.0 310.0 33.7 303.0 31.0 310.0
Artificial polymer materials Eastern Gotland Basin Swedish Coastal waters 6 5.8 4.2 5.0 1.1 13.6 4.0 6.3 1.1 13.6
Artificial polymer materials Bothnian Bay Swedish Coastal waters 6 30.3 26.9 19.6 11.0 80.0 11.0 40.4 11.0 80.0
Artificial polymer materials Kattegat Swedish Coastal waters 6 9.3 13.8 4.5 0.0 37.0 2.0 8.0 0.0 37.0
Cloth/textile Arkona Basin Danish Coastal waters 12 1.1 1.6 0.0 0.0 5.0 0.0 2.0 0.0 3.0
Cloth/textile Kattegat Danish Coastal waters 7 1.1 1.7 0.0 0.0 4.0 0.0 3.0 0.0 4.0
Cloth/textile Gulf of Riga Estonian Coastal waters 20 0.5 0.8 0.0 0.0 2.1 0.0 1.0 0.0 2.0
Cloth/textile Gulf of Finland Estonian Coastal waters 20 0.8 1.1 0.5 0.0 3.0 0.0 1.0 0.0 3.0
Cloth/textile Northern Baltic Proper Finnish Coastal waters 33 2.2 3.2 1.0 0.0 16.0 0.0 3.0 0.0 5.3
Cloth/textile Gulf of Finland Finnish Coastal waters 17 1.2 3.2 0.0 0.0 13.0 0.0 1.0 0.0 4.0
Cloth/textile Bothnian Bay Finnish Coastal waters 7 1.9 1.2 1.7 0.6 4.2 1.2 2.5 0.6 4.2
Cloth/textile Arkona Basin German Coastal waters 114 1.3 3.0 0.0 0.0 24.0 0.0 1.0 0.0 3.0
Cloth/textile Mecklenburg Bight German Coastal waters 42 0.5 0.8 0.0 0.0 3.0 0.0 1.0 0.0 2.0
Cloth/textile Bornholm Basin German Coastal waters 8 4.4 5.5 2.5 0.0 14.0 0.5 7.5 0.0 14.0
Cloth/textile Gulf of Riga Latvian national waters 12 5.3 5.5 2.0 0.0 19.0 2.0 8.5 1.0 10.0
Cloth/textile Gulf of Riga Latvian Coastal waters 60 5.3 6.7 3.5 0.0 47.0 2.0 7.5 1.0 11.5
Cloth/textile Eastern Gotland Basin Polish Coastal waters 16 1.3 1.6 0.9 0.0 6.2 0.2 1.9 0.1 3.0
Cloth/textile Bornholm Basin Polish Coastal waters 56 0.3 0.6 0.1 0.0 3.5 0.0 0.3 0.0 0.8
Cloth/textile Gdansk Basin Polish Coastal waters 48 0.4 0.6 0.2 0.0 3.2 0.0 0.4 0.0 1.1

Page 18 of 23
Cloth/textile The Sound Swedish Coastal waters 5 4.0 4.7 2.2 0.0 12.0 2.0 4.0 0.0 12.0
Cloth/textile Western Gotland Basin Swedish Coastal waters 12 2.1 2.7 1.0 0.0 9.0 0.0 4.0 0.0 4.0
Cloth/textile Bornholm Basin Swedish Coastal waters 6 3.0 2.6 2.5 1.0 8.0 1.0 3.0 1.0 8.0
Cloth/textile Northern Baltic Proper Swedish Coastal waters 6 0.5 0.8 0.0 0.0 2.0 0.0 1.0 0.0 2.0
Cloth/textile Arkona Basin Swedish Coastal waters 6 1.3 1.2 1.5 0.0 3.0 0.0 2.0 0.0 3.0
Cloth/textile Bothnian Sea Swedish Coastal waters 6 1.0 0.8 1.0 0.0 2.0 0.0 1.7 0.0 2.0
Cloth/textile Eastern Gotland Basin Swedish Coastal waters 6 1.2 1.2 0.9 0.0 3.0 0.2 2.0 0.0 3.0
Cloth/textile Bothnian Bay Swedish Coastal waters 6 0.2 0.4 0.0 0.0 1.0 0.0 0.0 0.0 1.0
Cloth/textile Kattegat Swedish Coastal waters 6 1.4 2.1 0.1 0.0 5.0 0.0 3.0 0.0 5.0
Glass/ceramics Arkona Basin Danish Coastal waters 12 21.6 33.2 7.5 0.0 115.0 2.0 26.5 1.0 51.0
Glass/ceramics Kattegat Danish Coastal waters 7 0.9 1.1 1.0 0.0 3.0 0.0 1.0 0.0 3.0
Glass/ceramics Gulf of Riga Estonian Coastal waters 20 13.2 14.7 5.0 0.0 41.0 1.0 26.0 0.0 37.0
Glass/ceramics Gulf of Finland Estonian Coastal waters 20 2.5 2.7 1.5 0.0 8.0 0.0 4.5 0.0 7.0
Glass/ceramics Northern Baltic Proper Finnish Coastal waters 33 6.3 12.3 0.6 0.0 45.0 0.0 5.9 0.0 28.0
Glass/ceramics Gulf of Finland Finnish Coastal waters 17 4.3 7.8 1.0 0.0 25.0 0.0 4.0 0.0 20.0
Glass/ceramics Bothnian Bay Finnish Coastal waters 7 3.7 3.9 2.5 0.3 11.9 0.6 5.1 0.3 11.9
Glass/ceramics Arkona Basin German Coastal waters 114 1.2 1.7 1.0 0.0 11.0 0.0 2.0 0.0 3.0
Glass/ceramics Mecklenburg Bight German Coastal waters 42 4.8 6.9 3.0 0.0 33.0 1.0 5.0 0.0 10.0
Glass/ceramics Bornholm Basin German Coastal waters 8 1.6 1.9 1.0 0.0 5.0 0.0 3.0 0.0 5.0
Glass/ceramics Gulf of Riga Latvian national waters 12 38.7 82.0 12.5 1.0 290.0 2.0 23.0 1.0 78.0
Glass/ceramics Gulf of Riga Latvian Coastal waters 60 11.6 23.5 3.0 0.0 136.0 1.0 9.0 0.0 33.0
Glass/ceramics Eastern Gotland Basin Polish Coastal waters 16 0.9 0.6 1.0 0.0 1.8 0.4 1.3 0.0 1.7
Glass/ceramics Bornholm Basin Polish Coastal waters 56 1.7 3.4 1.0 0.0 24.3 0.4 1.7 0.2 3.2
Glass/ceramics Gdansk Basin Polish Coastal waters 48 1.3 1.7 0.6 0.0 6.4 0.2 1.8 0.0 3.6
Glass/ceramics The Sound Swedish Coastal waters 5 4.5 5.5 3.0 0.0 13.0 0.0 6.6 0.0 13.0
Glass/ceramics Western Gotland Basin Swedish Coastal waters 12 2.1 3.0 0.0 0.0 8.0 0.0 4.0 0.0 7.0
Glass/ceramics Bornholm Basin Swedish Coastal waters 6 1.7 1.9 1.5 0.0 4.0 0.0 3.0 0.0 4.0
Glass/ceramics Northern Baltic Proper Swedish Coastal waters 6 0.2 0.4 0.0 0.0 1.0 0.0 0.0 0.0 1.0
Glass/ceramics Arkona Basin Swedish Coastal waters 6 1.3 1.2 1.5 0.0 3.0 0.0 2.0 0.0 3.0
Glass/ceramics Bothnian Sea Swedish Coastal waters 6 1.0 1.5 0.5 0.0 4.0 0.0 1.1 0.0 4.0
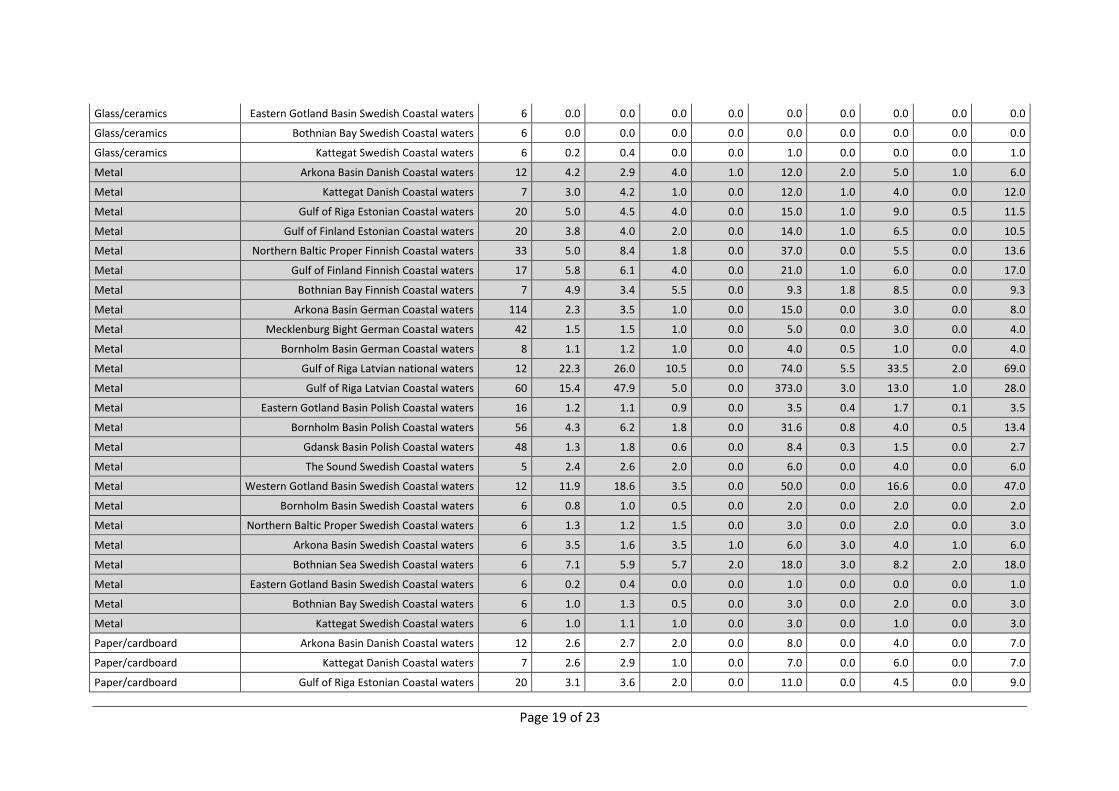
Page 19 of 23
Glass/ceramics Eastern Gotland Basin Swedish Coastal waters 6 0.0 0.0 0.0 0.0 0.0 0.0 0.0 0.0 0.0
Glass/ceramics Bothnian Bay Swedish Coastal waters 6 0.0 0.0 0.0 0.0 0.0 0.0 0.0 0.0 0.0
Glass/ceramics Kattegat Swedish Coastal waters 6 0.2 0.4 0.0 0.0 1.0 0.0 0.0 0.0 1.0
Metal Arkona Basin Danish Coastal waters 12 4.2 2.9 4.0 1.0 12.0 2.0 5.0 1.0 6.0
Metal Kattegat Danish Coastal waters 7 3.0 4.2 1.0 0.0 12.0 1.0 4.0 0.0 12.0
Metal Gulf of Riga Estonian Coastal waters 20 5.0 4.5 4.0 0.0 15.0 1.0 9.0 0.5 11.5
Metal Gulf of Finland Estonian Coastal waters 20 3.8 4.0 2.0 0.0 14.0 1.0 6.5 0.0 10.5
Metal Northern Baltic Proper Finnish Coastal waters 33 5.0 8.4 1.8 0.0 37.0 0.0 5.5 0.0 13.6
Metal Gulf of Finland Finnish Coastal waters 17 5.8 6.1 4.0 0.0 21.0 1.0 6.0 0.0 17.0
Metal Bothnian Bay Finnish Coastal waters 7 4.9 3.4 5.5 0.0 9.3 1.8 8.5 0.0 9.3
Metal Arkona Basin German Coastal waters 114 2.3 3.5 1.0 0.0 15.0 0.0 3.0 0.0 8.0
Metal Mecklenburg Bight German Coastal waters 42 1.5 1.5 1.0 0.0 5.0 0.0 3.0 0.0 4.0
Metal Bornholm Basin German Coastal waters 8 1.1 1.2 1.0 0.0 4.0 0.5 1.0 0.0 4.0
Metal Gulf of Riga Latvian national waters 12 22.3 26.0 10.5 0.0 74.0 5.5 33.5 2.0 69.0
Metal Gulf of Riga Latvian Coastal waters 60 15.4 47.9 5.0 0.0 373.0 3.0 13.0 1.0 28.0
Metal Eastern Gotland Basin Polish Coastal waters 16 1.2 1.1 0.9 0.0 3.5 0.4 1.7 0.1 3.5
Metal Bornholm Basin Polish Coastal waters 56 4.3 6.2 1.8 0.0 31.6 0.8 4.0 0.5 13.4
Metal Gdansk Basin Polish Coastal waters 48 1.3 1.8 0.6 0.0 8.4 0.3 1.5 0.0 2.7
Metal The Sound Swedish Coastal waters 5 2.4 2.6 2.0 0.0 6.0 0.0 4.0 0.0 6.0
Metal Western Gotland Basin Swedish Coastal waters 12 11.9 18.6 3.5 0.0 50.0 0.0 16.6 0.0 47.0
Metal Bornholm Basin Swedish Coastal waters 6 0.8 1.0 0.5 0.0 2.0 0.0 2.0 0.0 2.0
Metal Northern Baltic Proper Swedish Coastal waters 6 1.3 1.2 1.5 0.0 3.0 0.0 2.0 0.0 3.0
Metal Arkona Basin Swedish Coastal waters 6 3.5 1.6 3.5 1.0 6.0 3.0 4.0 1.0 6.0
Metal Bothnian Sea Swedish Coastal waters 6 7.1 5.9 5.7 2.0 18.0 3.0 8.2 2.0 18.0
Metal Eastern Gotland Basin Swedish Coastal waters 6 0.2 0.4 0.0 0.0 1.0 0.0 0.0 0.0 1.0
Metal Bothnian Bay Swedish Coastal waters 6 1.0 1.3 0.5 0.0 3.0 0.0 2.0 0.0 3.0
Metal Kattegat Swedish Coastal waters 6 1.0 1.1 1.0 0.0 3.0 0.0 1.0 0.0 3.0
Paper/cardboard Arkona Basin Danish Coastal waters 12 2.6 2.7 2.0 0.0 8.0 0.0 4.0 0.0 7.0
Paper/cardboard Kattegat Danish Coastal waters 7 2.6 2.9 1.0 0.0 7.0 0.0 6.0 0.0 7.0
Paper/cardboard Gulf of Riga Estonian Coastal waters 20 3.1 3.6 2.0 0.0 11.0 0.0 4.5 0.0 9.0

Page 20 of 23
Paper/cardboard Gulf of Finland Estonian Coastal waters 20 2.6 3.1 1.0 0.0 10.0 0.0 5.5 0.0 7.0
Paper/cardboard Northern Baltic Proper Finnish Coastal waters 33 6.5 11.0 3.3 0.0 53.6 0.0 6.0 0.0 17.0
Paper/cardboard Gulf of Finland Finnish Coastal waters 17 2.5 2.2 2.0 0.0 7.0 1.0 4.0 0.0 6.0
Paper/cardboard Bothnian Bay Finnish Coastal waters 7 18.0 11.9 11.0 7.6 33.1 7.7 29.8 7.6 33.1
Paper/cardboard Arkona Basin German Coastal waters 114 1.3 2.6 0.0 0.0 17.0 0.0 1.0 0.0 4.0
Paper/cardboard Mecklenburg Bight German Coastal waters 42 2.2 2.8 1.0 0.0 11.0 0.0 4.0 0.0 6.0
Paper/cardboard Bornholm Basin German Coastal waters 8 1.0 2.1 0.0 0.0 6.0 0.0 1.0 0.0 6.0
Paper/cardboard Gulf of Riga Latvian national waters 12 44.9 51.6 18.5 1.0 146.0 11.0 78.0 7.0 131.0
Paper/cardboard Gulf of Riga Latvian Coastal waters 60 19.5 17.3 13.5 0.0 84.0 6.5 28.5 3.0 43.5
Paper/cardboard Eastern Gotland Basin Polish Coastal waters 16 1.6 2.0 0.9 0.1 8.2 0.7 2.3 0.2 2.7
Paper/cardboard Bornholm Basin Polish Coastal waters 56 1.4 1.5 0.9 0.0 6.1 0.3 2.0 0.1 3.6
Paper/cardboard Gdansk Basin Polish Coastal waters 48 0.7 1.1 0.3 0.0 5.3 0.1 0.7 0.0 2.2
Paper/cardboard The Sound Swedish Coastal waters 5 6.2 9.7 0.0 0.0 22.0 0.0 9.0 0.0 22.0
Paper/cardboard Western Gotland Basin Swedish Coastal waters 12 4.8 7.3 1.5 0.0 24.0 0.0 8.0 0.0 12.0
Paper/cardboard Bornholm Basin Swedish Coastal waters 6 1.2 1.6 0.5 0.0 4.0 0.0 2.0 0.0 4.0
Paper/cardboard Northern Baltic Proper Swedish Coastal waters 6 0.2 0.4 0.0 0.0 1.0 0.0 0.0 0.0 1.0
Paper/cardboard Arkona Basin Swedish Coastal waters 6 1.3 1.2 1.5 0.0 3.0 0.0 2.0 0.0 3.0
Paper/cardboard Bothnian Sea Swedish Coastal waters 6 4.9 8.9 2.0 0.0 23.0 0.1 2.0 0.0 23.0
Paper/cardboard Eastern Gotland Basin Swedish Coastal waters 6 0.0 0.0 0.0 0.0 0.0 0.0 0.0 0.0 0.0
Paper/cardboard Bothnian Bay Swedish Coastal waters 6 3.8 4.5 2.0 2.0 13.0 2.0 2.0 2.0 13.0
Paper/cardboard Kattegat Swedish Coastal waters 6 0.5 1.2 0.0 0.0 3.0 0.0 0.0 0.0 3.0
Processed/worked wood Arkona Basin Danish Coastal waters 12 4.7 3.9 3.5 0.0 14.0 2.0 7.0 1.0 8.0
Processed/worked wood Kattegat Danish Coastal waters 7 6.3 5.9 5.0 0.0 16.0 1.0 11.0 0.0 16.0
Processed/worked wood Gulf of Riga Estonian Coastal waters 20 0.6 1.2 0.0 0.0 4.1 0.0 0.6 0.0 2.9
Processed/worked wood Gulf of Finland Estonian Coastal waters 20 0.4 0.8 0.0 0.0 3.0 0.0 0.1 0.0 1.6
Processed/worked wood Northern Baltic Proper Finnish Coastal waters 33 7.2 12.1 1.3 0.0 50.0 0.0 7.3 0.0 22.0
Processed/worked wood Gulf of Finland Finnish Coastal waters 17 7.4 14.3 2.0 0.0 59.0 0.0 8.0 0.0 21.0
Processed/worked wood Bothnian Bay Finnish Coastal waters 7 3.1 2.5 2.5 0.6 7.6 1.2 5.1 0.6 7.6
Processed/worked wood Arkona Basin German Coastal waters 114 1.2 2.0 0.0 0.0 14.0 0.0 2.0 0.0 3.0
Processed/worked wood Mecklenburg Bight German Coastal waters 42 0.7 1.2 0.0 0.0 6.0 0.0 1.0 0.0 2.0

Page 21 of 23
Processed/worked wood Bornholm Basin German Coastal waters 8 0.9 1.4 0.5 0.0 4.0 0.0 1.0 0.0 4.0
Processed/worked wood Gulf of Riga Latvian national waters 12 4.6 5.5 2.0 0.0 18.0 1.0 7.0 1.0 11.0
Processed/worked wood Gulf of Riga Latvian Coastal waters 60 3.2 5.4 2.0 0.0 36.0 0.0 4.0 0.0 7.0
Processed/worked wood Eastern Gotland Basin Polish Coastal waters 16 1.4 1.9 0.5 0.0 6.5 0.2 2.1 0.1 4.0
Processed/worked wood Bornholm Basin Polish Coastal waters 56 7.3 21.1 1.2 0.0 150.0 0.4 5.0 0.1 17.9
Processed/worked wood Gdansk Basin Polish Coastal waters 48 4.0 25.2 0.1 0.0 175.1 0.0 0.4 0.0 0.9
Processed/worked wood The Sound Swedish Coastal waters 5 4.0 5.9 0.0 0.0 13.0 0.0 7.0 0.0 13.0
Processed/worked wood Western Gotland Basin Swedish Coastal waters 11 6.6 13.1 1.5 0.0 45.0 0.1 7.3 0.0 9.4
Processed/worked wood Bornholm Basin Swedish Coastal waters 6 0.3 0.8 0.0 0.0 2.0 0.0 0.0 0.0 2.0
Processed/worked wood Northern Baltic Proper Swedish Coastal waters 6 0.7 1.0 0.0 0.0 2.0 0.0 2.0 0.0 2.0
Processed/worked wood Arkona Basin Swedish Coastal waters 6 2.6 2.1 2.0 0.2 6.3 2.0 3.3 0.2 6.3
Processed/worked wood Bothnian Sea Swedish Coastal waters 6 5.9 5.3 5.7 0.1 14.1 1.0 9.0 0.1 14.1
Processed/worked wood Eastern Gotland Basin Swedish Coastal waters 6 0.8 1.1 0.1 0.0 2.2 0.0 2.1 0.0 2.2
Processed/worked wood Bothnian Bay Swedish Coastal waters 6 1.8 2.2 1.0 0.0 5.0 0.0 4.0 0.0 5.0
Processed/worked wood Kattegat Swedish Coastal waters 6 0.5 0.8 0.1 0.0 2.0 0.0 1.0 0.0 2.0
Rubber Arkona Basin Danish Coastal waters 12 2.3 1.4 2.0 0.0 4.0 1.5 3.5 0.0 4.0
Rubber Kattegat Danish Coastal waters 7 0.9 0.9 1.0 0.0 2.0 0.0 2.0 0.0 2.0
Rubber Gulf of Riga Estonian Coastal waters 20 1.1 1.2 1.0 0.0 4.0 0.0 2.0 0.0 3.0
Rubber Gulf of Finland Estonian Coastal waters 20 1.5 1.8 1.0 0.0 8.0 0.0 2.0 0.0 3.0
Rubber Northern Baltic Proper Finnish Coastal waters 33 1.2 1.6 0.9 0.0 6.0 0.0 1.3 0.0 4.0
Rubber Gulf of Finland Finnish Coastal waters 17 1.1 2.5 0.0 0.0 9.0 0.0 0.0 0.0 5.0
Rubber Bothnian Bay Finnish Coastal waters 7 1.4 2.0 0.6 0.0 5.1 0.0 3.4 0.0 5.1
Rubber Arkona Basin German Coastal waters 114 1.7 2.4 1.0 0.0 12.0 0.0 2.0 0.0 5.0
Rubber Mecklenburg Bight German Coastal waters 42 1.0 1.5 1.0 0.0 8.0 0.0 1.0 0.0 3.0
Rubber Bornholm Basin German Coastal waters 8 3.4 2.8 3.0 0.0 9.0 1.5 4.5 0.0 9.0
Rubber Gulf of Riga Latvian national waters 12 5.2 4.4 4.0 0.0 14.0 2.0 8.0 1.0 11.0
Rubber Gulf of Riga Latvian Coastal waters 60 9.5 29.0 4.0 0.0 211.0 1.0 6.5 0.0 12.0
Rubber Eastern Gotland Basin Polish Coastal waters 16 0.3 0.2 0.3 0.0 0.8 0.1 0.4 0.0 0.6
Rubber Bornholm Basin Polish Coastal waters 56 0.2 0.3 0.1 0.0 1.8 0.0 0.4 0.0 0.6
Rubber Gdansk Basin Polish Coastal waters 48 0.2 0.3 0.1 0.0 1.2 0.0 0.3 0.0 0.6
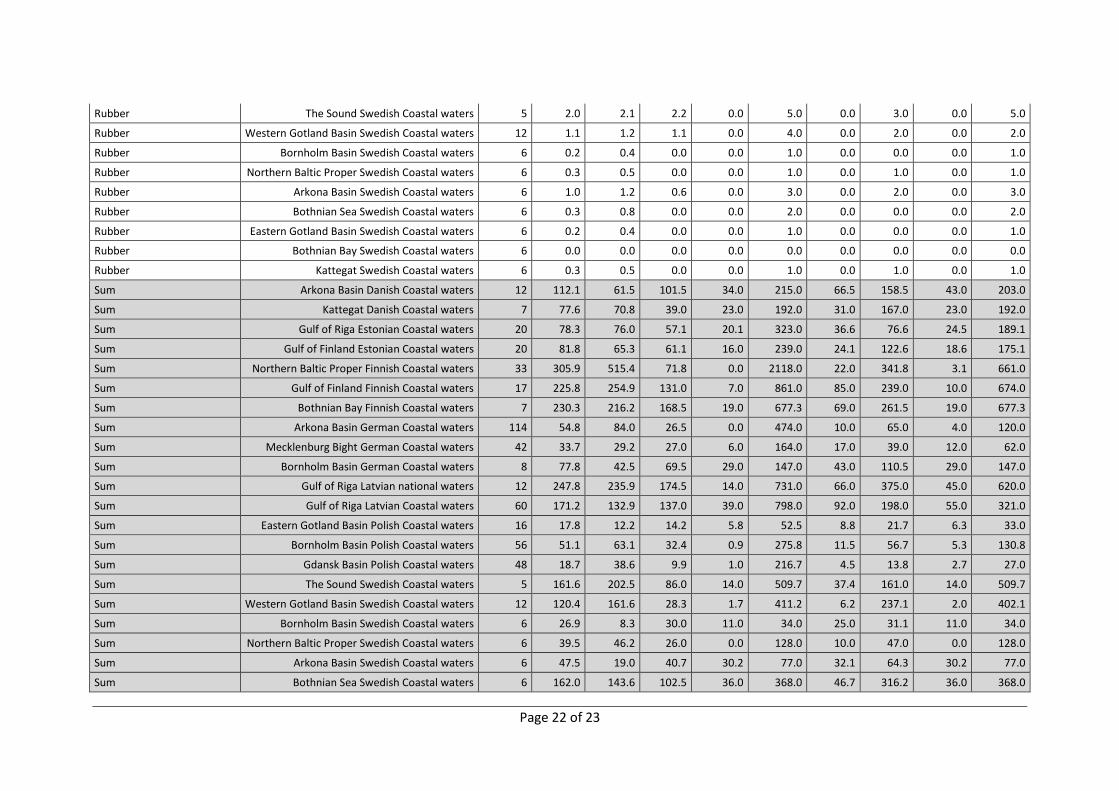
Page 22 of 23
Rubber The Sound Swedish Coastal waters 5 2.0 2.1 2.2 0.0 5.0 0.0 3.0 0.0 5.0
Rubber Western Gotland Basin Swedish Coastal waters 12 1.1 1.2 1.1 0.0 4.0 0.0 2.0 0.0 2.0
Rubber Bornholm Basin Swedish Coastal waters 6 0.2 0.4 0.0 0.0 1.0 0.0 0.0 0.0 1.0
Rubber Northern Baltic Proper Swedish Coastal waters 6 0.3 0.5 0.0 0.0 1.0 0.0 1.0 0.0 1.0
Rubber Arkona Basin Swedish Coastal waters 6 1.0 1.2 0.6 0.0 3.0 0.0 2.0 0.0 3.0
Rubber Bothnian Sea Swedish Coastal waters 6 0.3 0.8 0.0 0.0 2.0 0.0 0.0 0.0 2.0
Rubber Eastern Gotland Basin Swedish Coastal waters 6 0.2 0.4 0.0 0.0 1.0 0.0 0.0 0.0 1.0
Rubber Bothnian Bay Swedish Coastal waters 6 0.0 0.0 0.0 0.0 0.0 0.0 0.0 0.0 0.0
Rubber Kattegat Swedish Coastal waters 6 0.3 0.5 0.0 0.0 1.0 0.0 1.0 0.0 1.0
Sum Arkona Basin Danish Coastal waters 12 112.1 61.5 101.5 34.0 215.0 66.5 158.5 43.0 203.0
Sum Kattegat Danish Coastal waters 7 77.6 70.8 39.0 23.0 192.0 31.0 167.0 23.0 192.0
Sum Gulf of Riga Estonian Coastal waters 20 78.3 76.0 57.1 20.1 323.0 36.6 76.6 24.5 189.1
Sum Gulf of Finland Estonian Coastal waters 20 81.8 65.3 61.1 16.0 239.0 24.1 122.6 18.6 175.1
Sum Northern Baltic Proper Finnish Coastal waters 33 305.9 515.4 71.8 0.0 2118.0 22.0 341.8 3.1 661.0
Sum Gulf of Finland Finnish Coastal waters 17 225.8 254.9 131.0 7.0 861.0 85.0 239.0 10.0 674.0
Sum Bothnian Bay Finnish Coastal waters 7 230.3 216.2 168.5 19.0 677.3 69.0 261.5 19.0 677.3
Sum Arkona Basin German Coastal waters 114 54.8 84.0 26.5 0.0 474.0 10.0 65.0 4.0 120.0
Sum Mecklenburg Bight German Coastal waters 42 33.7 29.2 27.0 6.0 164.0 17.0 39.0 12.0 62.0
Sum Bornholm Basin German Coastal waters 8 77.8 42.5 69.5 29.0 147.0 43.0 110.5 29.0 147.0
Sum Gulf of Riga Latvian national waters 12 247.8 235.9 174.5 14.0 731.0 66.0 375.0 45.0 620.0
Sum Gulf of Riga Latvian Coastal waters 60 171.2 132.9 137.0 39.0 798.0 92.0 198.0 55.0 321.0
Sum Eastern Gotland Basin Polish Coastal waters 16 17.8 12.2 14.2 5.8 52.5 8.8 21.7 6.3 33.0
Sum Bornholm Basin Polish Coastal waters 56 51.1 63.1 32.4 0.9 275.8 11.5 56.7 5.3 130.8
Sum Gdansk Basin Polish Coastal waters 48 18.7 38.6 9.9 1.0 216.7 4.5 13.8 2.7 27.0
Sum The Sound Swedish Coastal waters 5 161.6 202.5 86.0 14.0 509.7 37.4 161.0 14.0 509.7
Sum Western Gotland Basin Swedish Coastal waters 12 120.4 161.6 28.3 1.7 411.2 6.2 237.1 2.0 402.1
Sum Bornholm Basin Swedish Coastal waters 6 26.9 8.3 30.0 11.0 34.0 25.0 31.1 11.0 34.0
Sum Northern Baltic Proper Swedish Coastal waters 6 39.5 46.2 26.0 0.0 128.0 10.0 47.0 0.0 128.0
Sum Arkona Basin Swedish Coastal waters 6 47.5 19.0 40.7 30.2 77.0 32.1 64.3 30.2 77.0
Sum Bothnian Sea Swedish Coastal waters 6 162.0 143.6 102.5 36.0 368.0 46.7 316.2 36.0 368.0

Page 23 of 23
Sum Eastern Gotland Basin Swedish Coastal waters 6 8.4 5.1 7.6 3.7 18.1 5.0 8.6 3.7 18.1
Sum Bothnian Bay Swedish Coastal waters 6 37.1 26.8 29.6 15.0 84.0 17.0 47.4 15.0 84.0
Sum Kattegat Swedish Coastal waters 6 13.4 14.2 9.0 3.2 42.0 7.1 10.2 3.2 42.0
Unclassified Arkona Basin Danish Coastal waters 12 0.3 0.6 0.0 0.0 2.0 0.0 0.0 0.0 1.0
Unclassified Kattegat Danish Coastal waters 7 0.3 0.5 0.0 0.0 1.0 0.0 1.0 0.0 1.0
Unclassified Gulf of Riga Estonian Coastal waters 20 2.7 5.7 0.0 0.0 23.0 0.0 3.0 0.0 9.0
Unclassified Gulf of Finland Estonian Coastal waters 20 1.6 1.9 1.0 0.0 7.0 0.0 2.5 0.0 4.0
Unclassified Northern Baltic Proper Finnish Coastal waters 33 1.6 2.9 0.0 0.0 14.0 0.0 2.0 0.0 4.6
Unclassified Gulf of Finland Finnish Coastal waters 17 0.1 0.5 0.0 0.0 2.0 0.0 0.0 0.0 0.0
Unclassified Bothnian Bay Finnish Coastal waters 7 12.7 24.9 3.1 0.3 68.6 0.6 10.2 0.3 68.6
Unclassified Arkona Basin German Coastal waters 114 0.2 0.7 0.0 0.0 4.0 0.0 0.0 0.0 1.0
Unclassified Mecklenburg Bight German Coastal waters 42 0.3 0.9 0.0 0.0 5.0 0.0 0.0 0.0 1.0
Unclassified Bornholm Basin German Coastal waters 8 0.1 0.4 0.0 0.0 1.0 0.0 0.0 0.0 1.0
Unclassified Gulf of Riga Latvian national waters 12 3.8 5.6 1.5 0.0 17.0 0.0 6.0 0.0 12.0
Unclassified Gulf of Riga Latvian Coastal waters 60 15.3 39.8 2.5 0.0 211.0 0.5 8.5 0.0 27.0
Unclassified Eastern Gotland Basin Polish Coastal waters 16 0.9 1.6 0.3 0.0 6.0 0.0 0.9 0.0 3.1
Unclassified Bornholm Basin Polish Coastal waters 56 0.4 1.2 0.0 0.0 6.7 0.0 0.2 0.0 0.8
Unclassified Gdansk Basin Polish Coastal waters 48 0.0 0.1 0.0 0.0 0.3 0.0 0.0 0.0 0.1
Unclassified The Sound Swedish Coastal waters 5 1.0 2.2 0.0 0.0 5.0 0.0 0.0 0.0 5.0
Unclassified Western Gotland Basin Swedish Coastal waters 12 3.8 8.3 0.5 0.0 29.0 0.0 4.0 0.0 6.0
Unclassified Bornholm Basin Swedish Coastal waters 6 1.0 2.0 0.0 0.0 5.0 0.0 1.0 0.0 5.0
Unclassified Northern Baltic Proper Swedish Coastal waters 6 0.7 1.2 0.0 0.0 3.0 0.0 1.0 0.0 3.0
Unclassified Arkona Basin Swedish Coastal waters 6 0.5 0.5 0.5 0.0 1.0 0.0 1.0 0.0 1.0
Unclassified Bothnian Sea Swedish Coastal waters 6 2.0 3.0 1.0 0.0 8.0 0.0 2.0 0.0 8.0
Unclassified Eastern Gotland Basin Swedish Coastal waters 6 0.3 0.5 0.0 0.0 1.0 0.0 1.0 0.0 1.0
Unclassified Bothnian Bay Swedish Coastal waters 6 0.0 0.0 0.0 0.0 0.0 0.0 0.0 0.0 0.0
Unclassified Kattegat Swedish Coastal waters 6 0.2 0.4 0.0 0.0 1.0 0.0 0.2 0.0 1.0