taseko prosperity gold-copper project
TRANSCRIPT

Taseko Prosperity Gold-Copper Project
Appendix 3-6-J


CONCENTRATED EXPLORATION LIMITED PARTNERSHIP PROSPERITY PROJECT
REPORT ON GEOTECHNICAL PARAMETERS FOR THE PLANT SITE FOUNDATION DESIGN
(REF. NO. 10173/12-3)
This report was prepared by Knight Piésold Ltd. for the account of Concentrated
Exploration Limited Partnership. The material in it reflects Knight Piésold’s best
judgement in light of the information available to it at the time of preparation. Any
use which a third party makes of this report, or any reliance on or decisions to be
made based on it, are the responsibility of such third parties. Knight Piésold accepts
no responsibility for damages, if any, suffered by any third party as a result of
decisions made or actions based on this report.

- i - 10173/12-3
December 22, 1998
CONCENTRATED EXPLORATION LIMITED PARTNERSHIP PROSPERITY PROJECT
REPORT ON GEOTECHNICAL PARAMETERS FOR THE PLANT SITE FOUNDATION DESIGN
(REF. NO. 10173/12-3)
TABLE OF CONTENTS PAGE
SECTION 1.0 INTRODUCTION 1
SECTION 2.0 FIELD WORK 2
2.1 GENERAL 2
2.2 TEST PIT PROGRAM 2
2.3 DRILLING PROGRAM 3
2.4 MONITORING INSTALLATIONS 3
SECTION 3.0 SITE CONDITIONS 4
3.1 GENERAL 4
3.2 MATERIAL TYPES 4
3.3 FOUNDATION CONDITIONS 5
3.3.1 Primary Crusher Site 5
3.3.2 Conveyors 5
3.3.3 Mill Building and Service Complex 6
3.3.4 Coarse Ore Stockpile 8
SECTION 4.0 GEOTECHNICAL PARAMETERS AND FACTORS 10
INFLUENCING FOUNDATION DESIGN
4.1 GENERAL 10
4.2 ALLOWABLE BEARING PRESSURES, 10
SETTLEMENT CALCULATIONS AND
MODULUS OF SUBGRADE REACTION
4.2.1 Assumptions and Methodology 10
4.2.2 Allowable Bearing Pressures 12

- ii - 10173/12-3
December 22, 1998
4.2.3 Settlement Calculations 12
4.2.4 Modulus of Subgrade Reaction 13
4.3 DEPTH OF FROST PENETRATION 14
4.4 GROUNDWATER AND DRAINAGE 15
REQUIREMENTS
4.5 SEISMICITY 15
4.6 SHEAR STRENGTH PARAMETERS 16
4.7 EARTH PRESSURE COEFFICIENTS 16
4.8 SOIL PROPERTIES FOR DYNAMIC ANALYSIS 17
4.9 COEFFICIENT OF BASE FRICTION 18
4.10 DESIGN CRITERIA FOR ROCK ANCHORS 18
4.11 BACKFILL MATERIAL TYPES AND 19
COMPACTION REQUIREMENTS
4.12 ROCK TYPES AND EXCAVATION 21
RESTRICTIONS
SECTION 5.0 REFERENCES 22
TABLES
Table 2.1 Summary of Stand Pipe Piezometers at the Plant Site
Table 3.1 Summary of Lab Test Results for the 1998 Site Investigation
Program
Table 3.2 Summary of SPT Results for Drill Hole DH98-272
(Non-cohesive soil)
Table 3.3 Summary of SPT Results for Drill Hole DH98-273
(Non-cohesive soil)
Table 3.4 Summary of SPT Results for Drill Hole DH98-273
(Cohesive soil)
Table 3.5 Summary of SPT Results for Drill Hole DH98-275
(Non-cohesive soil)
Table 3.6 Summary of SPT Results for Drill Hole DH98-274
(Non-cohesive soil)
Table 3.7 Summary of SPT Results for Drill Hole DH98-274
(Cohesive soil)

- iii - 10173/12-3
December 22, 1998
Table 4.1 Allowable Bearing Pressures for Native Soil (Glacial Till)
Table 4.2 Allowable Bearing Pressures for Structural Fill
Table 4.3 Allowable Bearing Pressures for Bedrock at Primary Crusher
Site
Table 4.4 Predicted Settlement For Various Pad Footings on Native Soil
(Square Footing, L=B)
Table 4.5 Predicted Settlement For Various Pad Footings on Native Soil
(Rectangular Footing, L=1.5B)
Table 4.6 Predicted Settlement For Various Pad Footings on Native Soil
(Rectangular Footing, L=2B)
Table 4.7 Predicted Settlement For Various Pad Footings on Native Soil
(Strip Footing, L=10,000B)
Table 4.8 Predicted Settlement For Various Pad Footings on Structural Fill
(Square Footing, L=B)
Table 4.9 Predicted Settlement For Various Pad Footings on Structural Fill
(Rectangular Footing, L=1.5B)
Table 4.10 Predicted Settlement For Various Pad Footings on Structural Fill
(Rectangular Footing, L=2B)
Table 4.11 Predicted Settlement For Various Pad Footings on Structural Fill
(Strip Footing, L=10,000B)
Table 4.12 Predicted Settlement For Various Pad Footings on Bedrock at
Primary Crusher Site (Square Footing, L=B)
Table 4.13 Predicted Settlement For Various Pad Footings on Bedrock at
Primary Crusher Site (Rectangular Footing, L=1.5B)
Table 4.14 Predicted Settlement For Various Pad Footings on Bedrock at
Primary Crusher Site (Rectangular Footing, L=2B)
Table 4.15 Predicted Settlement For Various Pad Footings on Bedrock at
Primary Crusher Site (Strip Footing, L=10,000B)
Table 4.16 Dynamic Shear Modulus For Native Soil
FIGURES Figure 3.1 Gradation Results For 1998 Site Investigation
Figure 4.1 Gradation Limits for Frost Susceptible Soils

- iv - 10173/12-3
December 22, 1998
Figure 4.2 Dynamic Shear Modulus Versus Depth in Structural Fill
Figure 4.3 Gradation Limits For Granular A Material
Figure 4.4 Gradation Limits For Granular B Material
Figure 4.5 Gradation Limits For Select Subgrade Material
DRAWINGS
10173-12-0140 Plant Site - Site Investigation Plan
10173-12-0141 Plant Site - East/West Geological Section
10173-12-0142 Plant Site - North/South Geological Section
APPENDICES
Appendix A Relevant Correspondence From Kilborn International
Appendix B Relevant Correspondence From Knight Piésold
Appendix C1 Test Pit Logs
Appendix C2 Overburden Drill Hole Logs
Appendix C3 Bedrock Drill Hole Logs
Appendix C4 Well Completion Details
Appendix D Detailed Laboratory Test Results (Supplied by Golder Associates)
Appendix E Photographs

- 1 - 10173/12-3
December 22, 1998
CONCENTRATED EXPLORATION LIMITED PARTNERSHIP PROSPERITY PROJECT
REPORT ON GEOTECHNICAL PARAMETERS FOR THE PLANT SITE FOUNDATION DESIGN
(REF. NO. 10173/12-2)
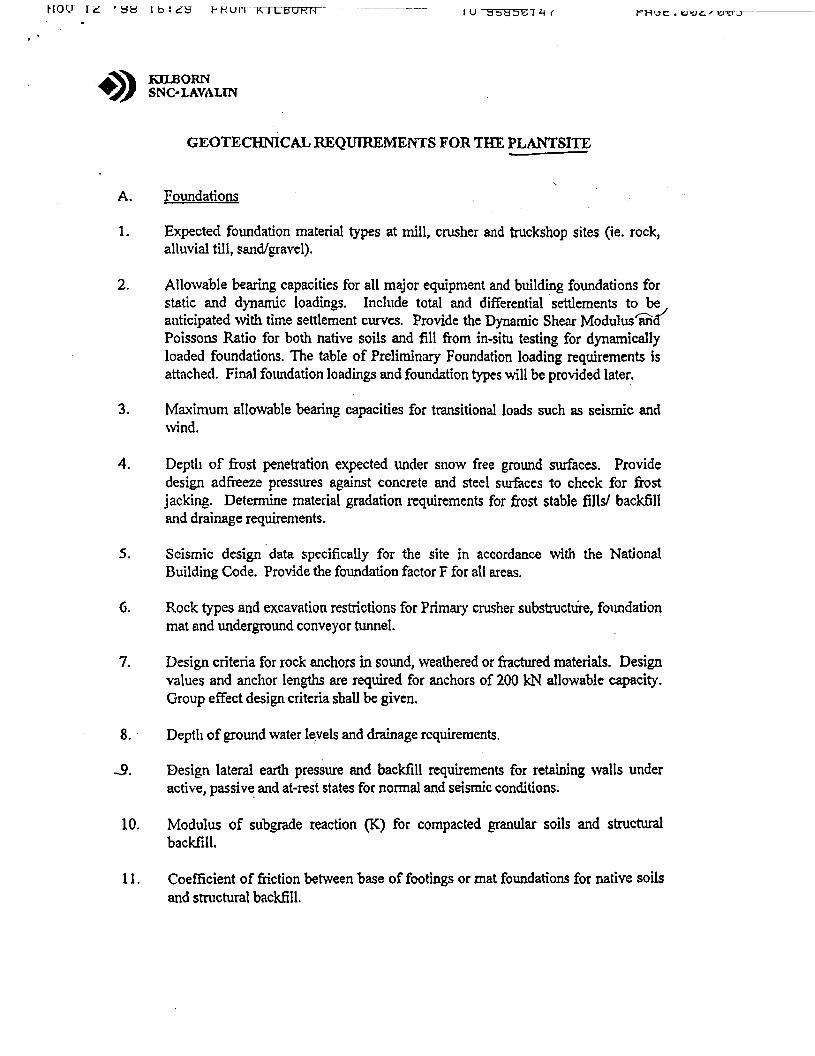
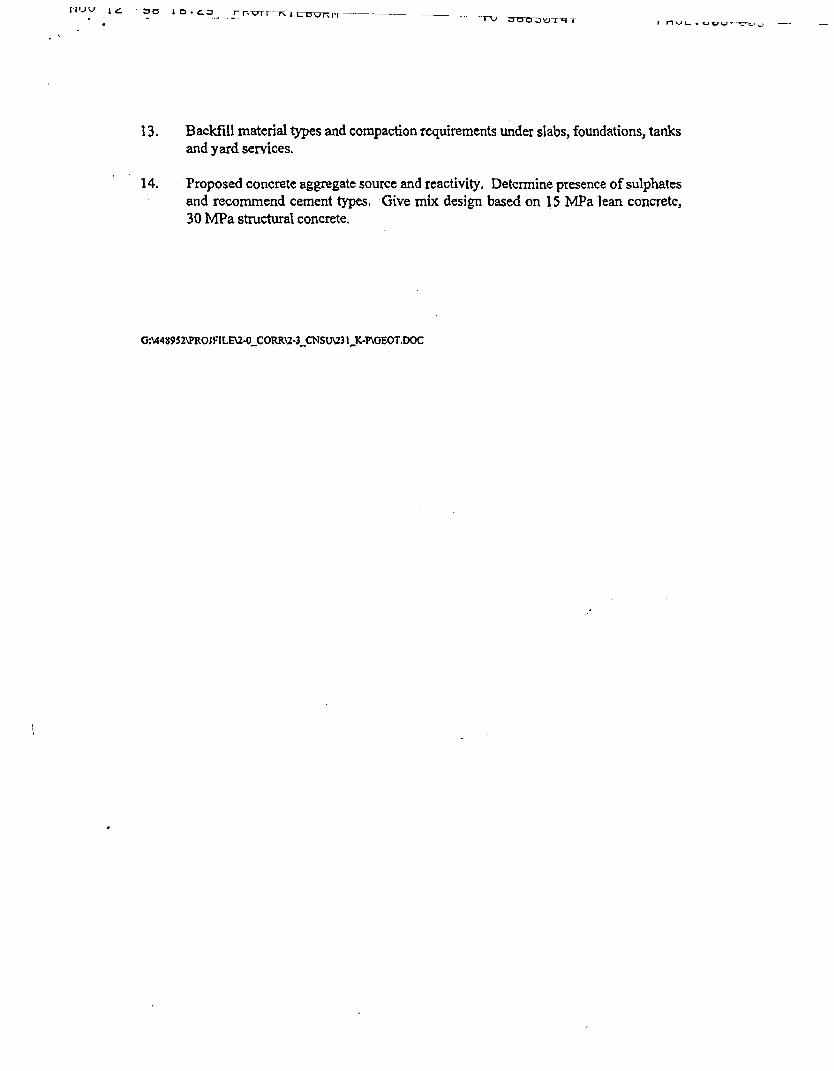
SECTION 1.0 - INTRODUCTION
Knight Piésold conducted a site investigation at the proposed new plant site location
in October and November, 1998, to collect geotechnical and hydrogeological
information in order to provide the geotechnical parameters required for foundation
design. The geotechnical parameters required for the plant site foundation design
were outlined in a fax by Kilborn International and are included in Appendix A. A
Summary Report of the geotechnical parameters and foundation conditions was
forwarded to Kilborn from Knight Piésold on December 7, 1998, and is included in
Appendix B. This report supersedes the Summary Report.
The site investigation for the plant site included drilling and sampling using Standard
Penetration Testing (SPT), bedrock coring, and test pit excavations. Select soil
samples were analyzed at a commercial laboratory in Vancouver, B.C. The results of
the investigation program were used to provide estimates for allowable bearing
pressures, settlements, and relevant geotechnical parameters and factors affecting
foundation design.
All design recommendations presented in this report are based on the assumption that
an adequate level of inspection and quality control testing will be completed during
construction and that all construction will be carried out by a suitably qualified
contractor experienced in foundation and earthworks construction. A qualified
Engineer will be required to provide the necessary inspections and approvals for all
phases of construction.
- 2 - 10173/12-3
December 22, 1998
SECTION 2.0 - FIELD WORK
2.1 GENERAL
A site investigation was conducted in October and November, 1998, to determine the
geotechnical conditions for the new plant site location. The site investigation
program comprised the following aspects of work:
• Test pitting.
• Overburden drilling and sampling.
• Bedrock coring.
• Piezometer installations.
• Laboratory testing.
The test pit and drill locations from the 1998 field work are shown on Drawing
10173-12-0140. Geologic sections have been developed across the site and are
shown on Drawings 10173-12-0141 and 10173-12-0142. Geological logs for the test
pits and drill holes, along with well completion details, are presented in Appendix C.
2.2 TEST PIT PROGRAM
A total of thirty-three (33) test pits (TP98-1 to 33) were excavated at the proposed
project component sites. The test pit program was conducted to investigate the type
and distribution of surficial materials and evaluate near surface foundation
conditions. The location of the test pits are shown on Drawing 10173-12-0140. The
test pit program comprised the following aspects of work.
• Pioneering of access trail with a Kubota KX41.
• Excavation of test pits with a Kubota KX41.
• Logging of the excavation, including photographs.
• Bulk sampling of various materials.
• Backfilling the test pit.
Detailed logs from the test pit program are included in Appendix C.

- 3 - 10173/12-3
December 22, 1998
2.3 DRILLING PROGRAM
A total of five (5) drill holes (DH98-272 to 276) were drilled at the plant site to
investigate the foundation conditions, overburden depths, material types and bedrock
conditions. The drill hole locations are shown on Drawing 10173-12-0140.
The drilling program comprised the following aspects of work:
• Manual construction of drill pads to minimize impact on environment.
• NQ (3) drilling through overburden and bedrock.
• Standard Penetration Testing (SPT) at the following intervals:
0 - 10 m depth, SPT every 1.5 m
10 - 25 m depth, SPT every 3 m
greater than 25 m depth, SPT every 6 m
• Installation of standpipe piezometers.
Detailed logs from the drilling program are included in Appendix C.
2.4 MONITORING INSTALLATIONS
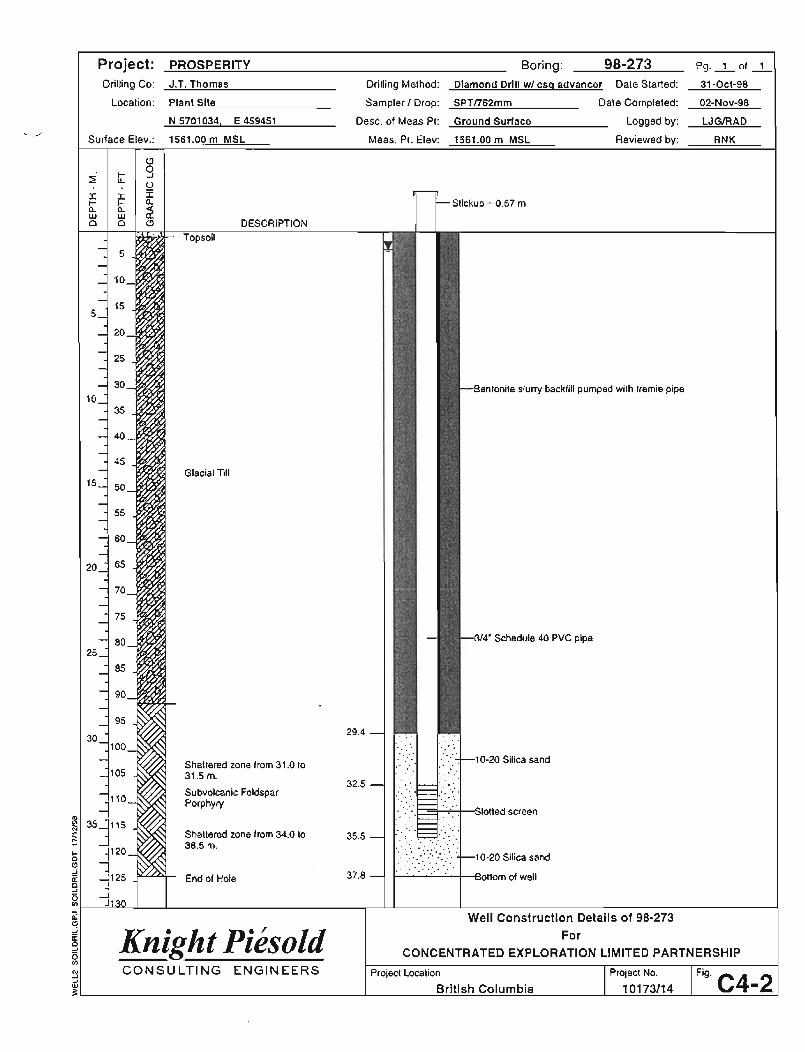
A total of five (5) ¾” diameter SCH 40 PVC flush threaded standpipe piezometers
were installed in the drill holes (DH98-272 to 276) at the new plant site location. The
groundwater monitoring results, as of November 26, 1998, are summarized in Table
2.1. The well completion details are provided in Appendix C.

- 4 - 10173/12-3
December 22, 1998
SECTION 3.0 - SITE CONDITIONS
3.1 GENERAL
Geotechnical site investigation work completed at the plant site area focused on
obtaining information on the material types and near surface foundation conditions.
The predominant surficial material type encountered at the plant site was a dense to
very dense non-cohesive to slightly cohesive glacial till comprised of SAND, some
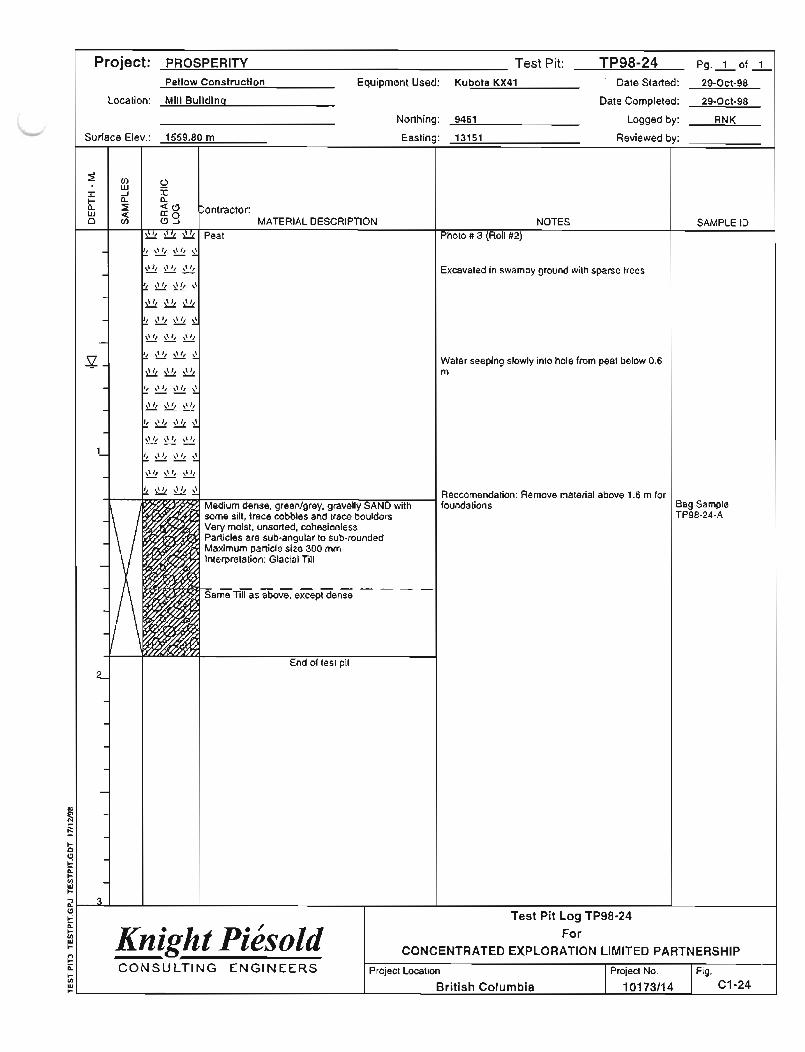
silt, trace clay, some gravel, trace cobbles and trace boulders. Swampy areas were
encountered across the site and contain up to 1.6 m of peat overlying a soft layer of
wet, lacustrine material. The approximate locations of these swampy areas are
included on Drawing 10173-12-0140. Beneath the lacustrine material is the medium
dense to dense glacial till, as described above. A sub-excavation of 3-4 m is
recommended within the swampy areas to remove the softer material. Eskers are also
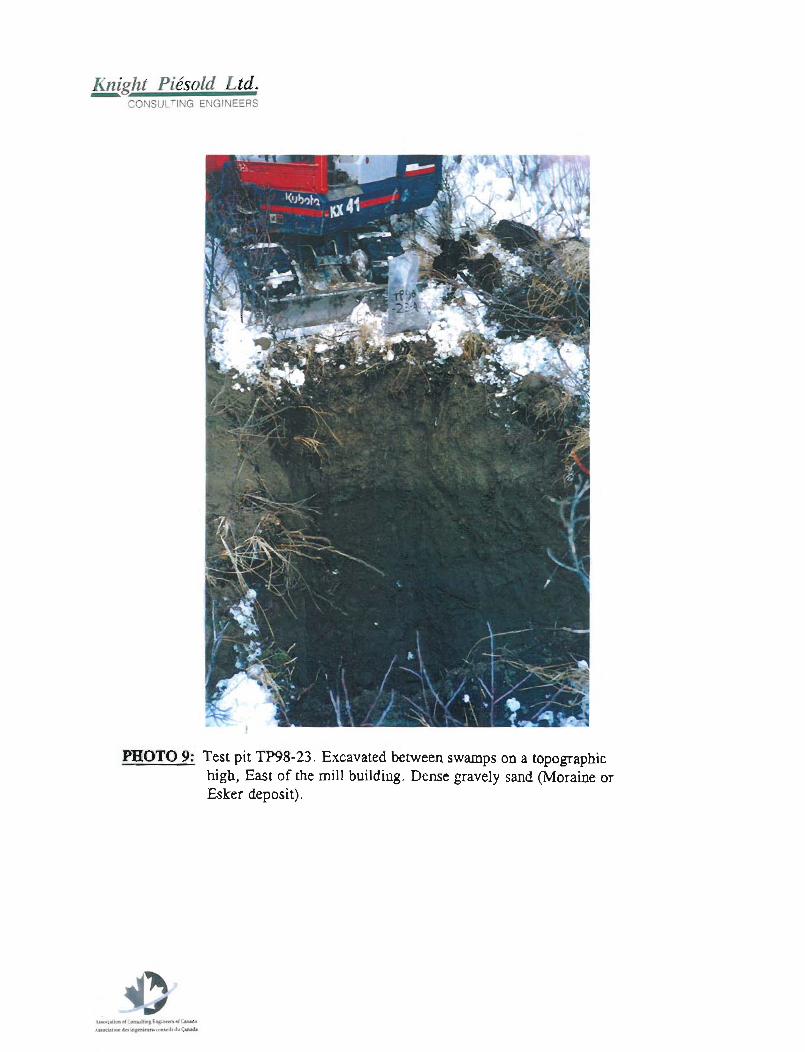
dominant land features within the plant site area. Photographs of selected test pits
showing the various surficial conditions encountered across the plant site are included
in Appendix E.
Bedrock (Feldspar Porphyry) was encountered at a depth of 4.5 m at drillhole DH98-
272 (inside the mill building footprint) while the basalt flow was encountered at a
depth of 1.5 m at drillhole DH98-276 (located at the SW corner of the service
complex). The depth to bedrock (or basalt) was found to range between 1.4 m and
27.5 m in the general vicinity of the mill building and service complex.
3.2 MATERIAL TYPES
The predominant material encountered during the 1998 site investigation was a dense
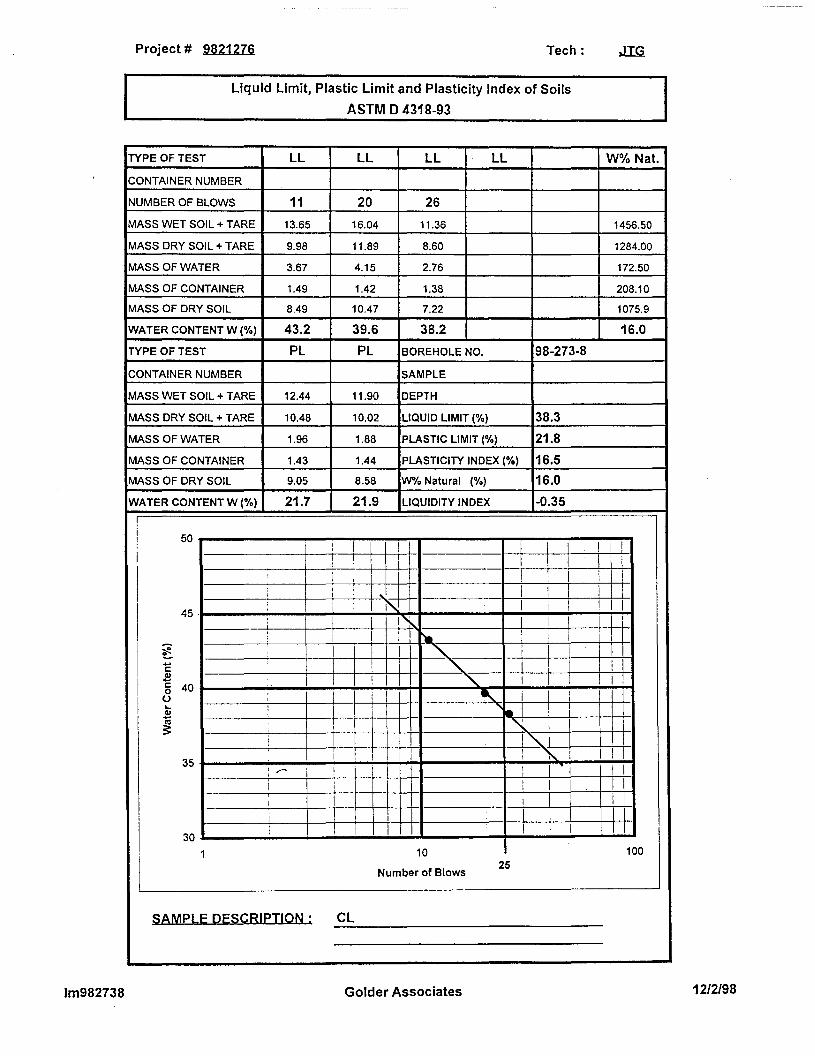
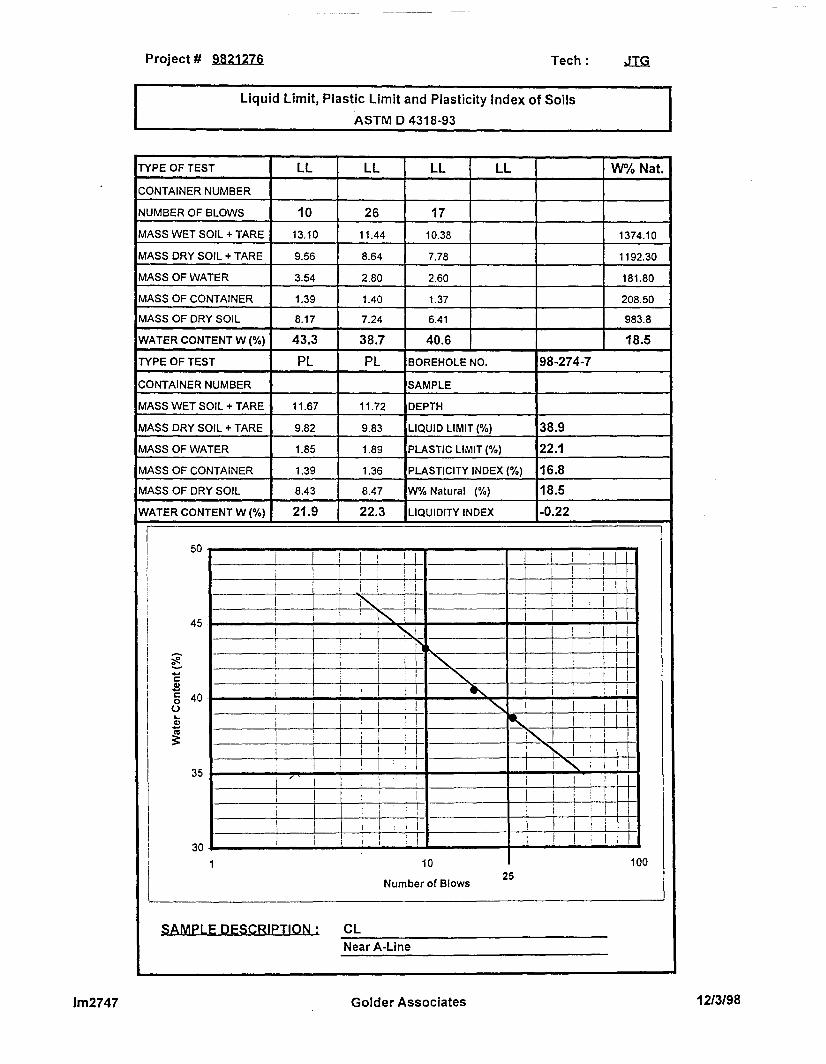
to very dense glacial till. Index testing was performed to characterize this material
and the results of the laboratory testwork are summarized in Table 3.1. The tests
included the following:
• Natural moisture content - 15 samples.
• Particle size distributions - 15 samples.
• Hydrometer Analyses - 7 samples.
• Atterberg Limits - 7 samples.

- 5 - 10173/12-3
December 22, 1998
• Modified Proctor Compaction Test - 1 sample.
3.3 FOUNDATION CONDITIONS 3.3.1 Primary Crusher Site
One drillhole (DH94-139) was drilled at the primary crusher site in 1994.
The hole is located below the plant site at the bottom of the valley, as shown
on Drawing 10173-12-0140. Details of the hole are as follow:
Drillhole No. Depth to Bedrock Total Hole Depth
DH94-139 1.8 m (6 ft) 32.3 m (106 ft)
Results indicate a thin veneer of dark brown, sandy glacial till overlying rust
coloured micro-diorite bedrock. The bedrock is very competent with high to
very high RQD values. A 0.3 m thick zone of very fractured rock was
intersected at a depth of 8.7 m. Bedrock discontinuities are characterized as
rough, moderately steep to flat dipping, planar to irregular joints with
occasional calcite and limonite veins and a trace of red/orange clay on some
joint surfaces.
3.3.2 Conveyors
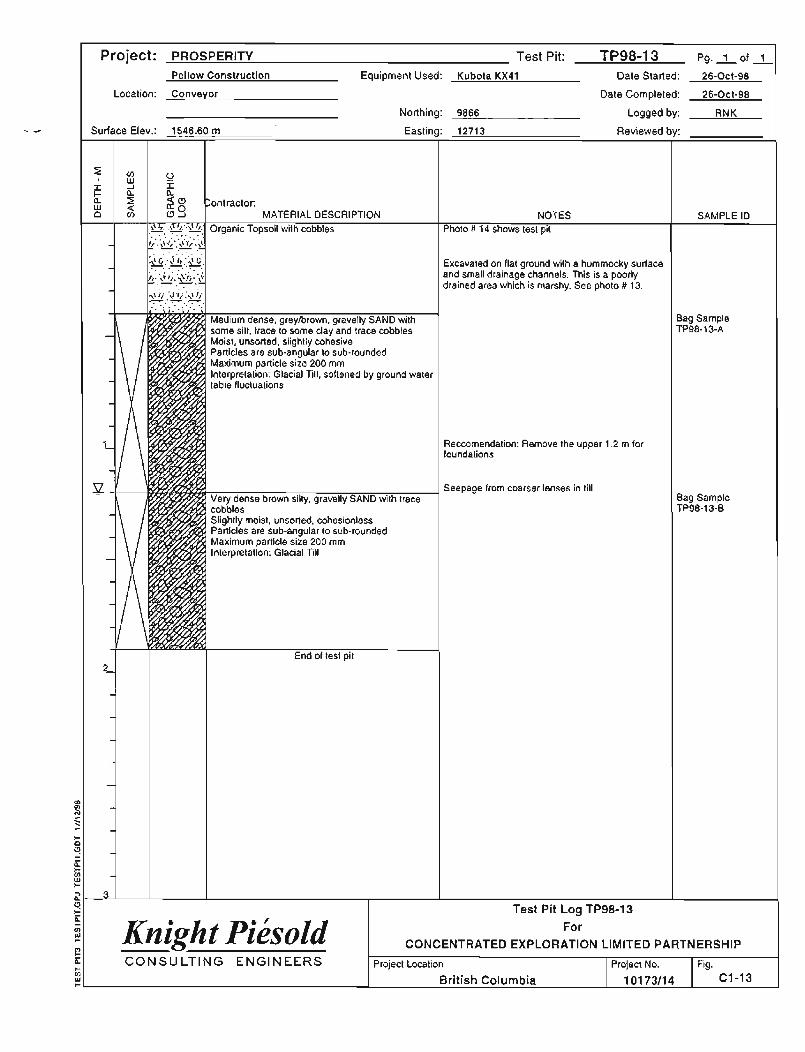
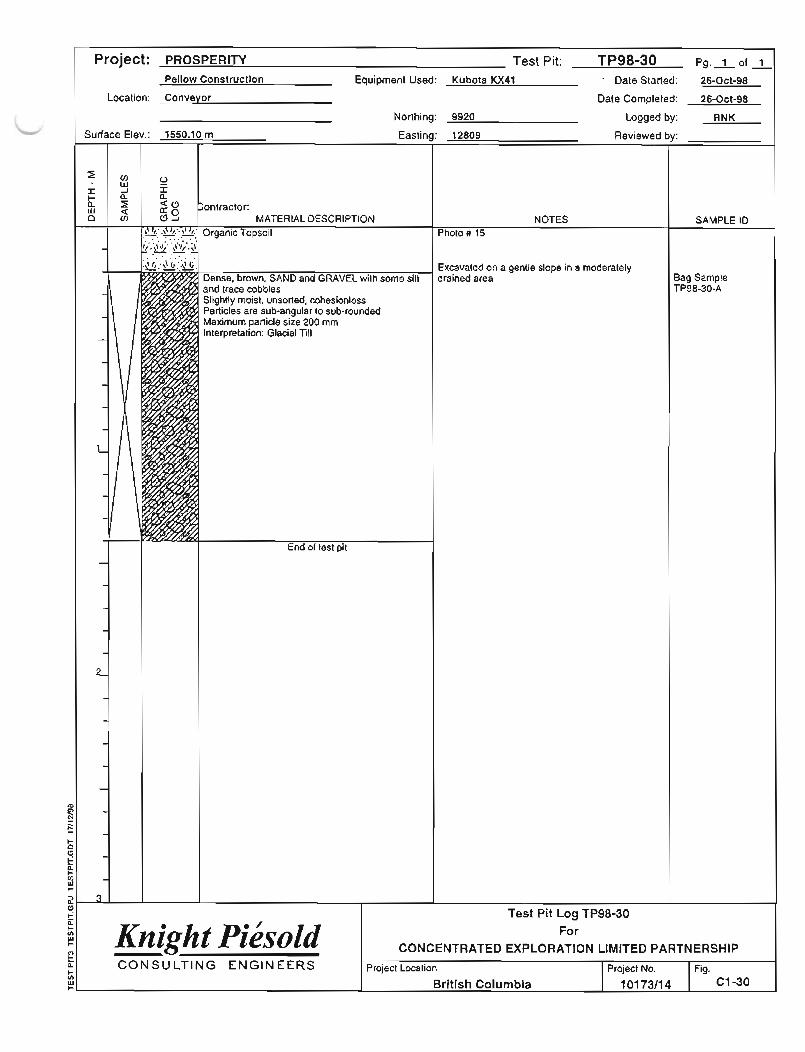
A total of 15 test pits (TP98-1-14 & 30) were excavated along the proposed
conveyor alignments. Test pits TP98-1 to 7 were excavated along the south
conveyor alignment, while test pits TP98-8 to 14 and TP98-30 were
excavated along the North conveyor alignment. The predominant material
type encountered along both conveyor alignments was a near surface dense to
very dense glacial till comprised of SAND, some silt, some gravel, trace
cobbles and trace boulders. Test pits TP98-4, 6 and 13 encountered a softer
glacial till to a depth of approximately 1.2 m. This material has been softened
by ground water table fluctuations and will require sub-excavation. The
location of the test pits excavated along the conveyor alignments are shown
on Drawing 10173-12-0140.

- 6 - 10173/12-3
December 22, 1998
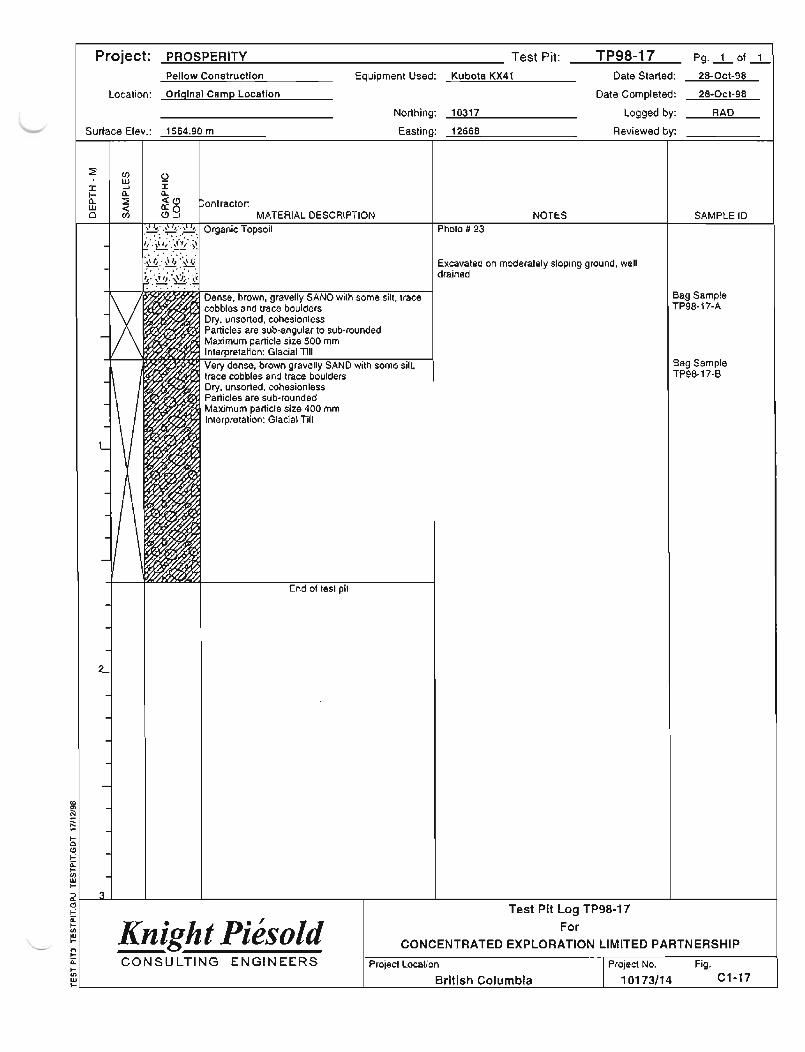
3.3.3 Mill Building and Service Complex
A total of nine (9) test pits (TP98-21 to 29) were excavated at the mill
building and service complex area. The predominant material type
encountered was a dense to very dense glacial till comprised of SAND, trace
clay, some silt, some gravel, trace cobbles and trace boulders. Test pits
TP98-21, 22, 27 and 28 encountered bedrock at less than 2.0 meters depth.
A total of four (4) drill holes (DH98-272, 273, 275 & 276) were drilled at the
mill building and service complex area.
Drill hole DH98-272 was drilled within the mill building footprint. The
stratigraphic sequence may be summarized as follows:
Depth Stratigraphy
0 to 1 m Topsoil
1 to 4.5 m Very dense, brown, silty SAND, some gravel (Glacial
Till)
4.5 to 12.2 m Feldspar Porphyry, mostly with zero RQD values
12.2 to 30.4 m Feldspar Porphyry
Standard penetration testing (SPT) results for drill hole DH98-272 reflect the
dense to very dense ground conditions. Corrected SPT ‘N’ values ranged
from 79 to 89 between 1.5 and 3.0 meters. The SPT results for DH98-272 are
presented on Table 3.2.
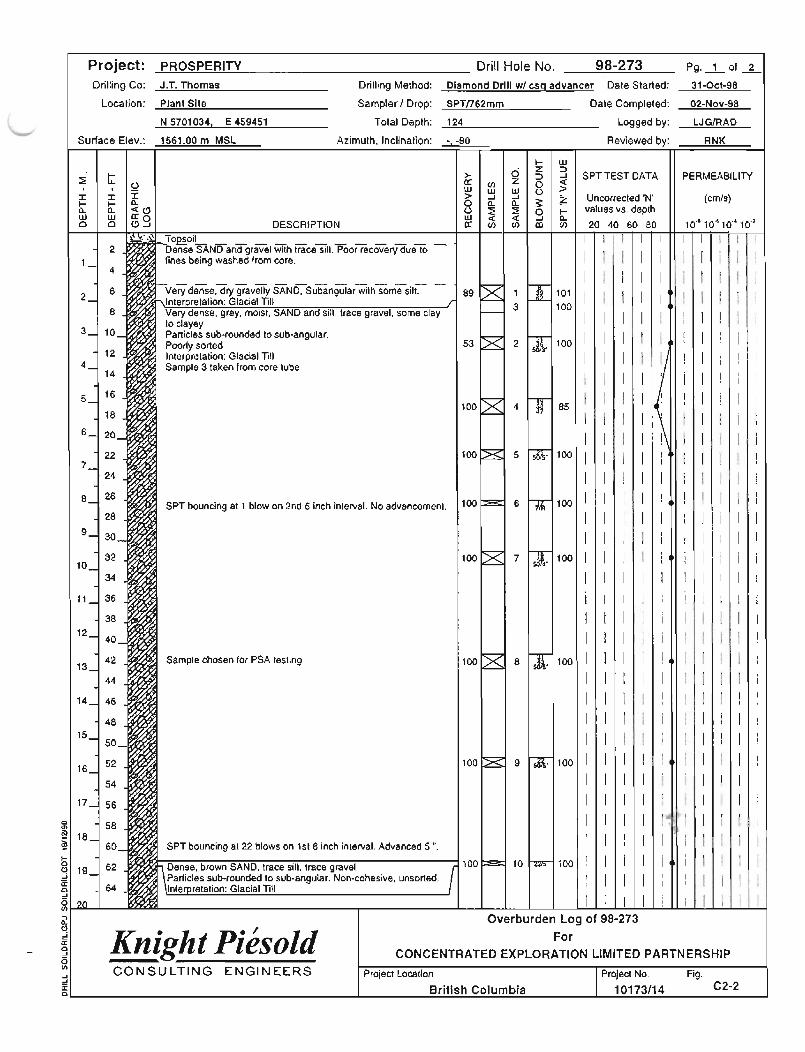
Drill hole DH98-273 was drilled at the Eastern edge of the plant site. The
stratigraphic sequence may be summarized as follows:
Depth Stratigraphy
0 to 0.3 m Topsoil

- 7 - 10173/12-3
December 22, 1998
0.3 to 2.0 m Dense, gravelly SAND, some silt (Glacial Till)
2.0 to 18.5 m Very dense, grey, moist, SAND and silt, trace gravel,
some clay to clayey (Glacial Till).
18.5 to 27.8 m Very dense, brown, clean SAND, some brown, very
stiff, silty, plastic clay.
27.8 to 37.8 m Feldspar Porphyry (some shattered zones)
Standard penetration testing (SPT) results for drill hole DH98-273 reflect the
dense to very dense ground conditions. Corrected SPT ‘N’ values ranged
from 60 to 118 between 1.5 and 15.5 meters. A corrected ‘N’ value of 37
was encountered at a depth of 21.6 m. The SPT results for DH98-273 are
presented on Table 3.3 (non-cohesive soil) and Table 3.4 (cohesive soil).
Drill hole DH98-275 was drilled at the South end of the plant site. The
stratigraphic sequence may be summarized as follows:
Depth Stratigraphy
0 to 1.0 m Topsoil
1.0 to 15.2 m Very dense, trace to silty SAND, (Glacial Till)
15.2 to 30.0 m Basalt
32.0 to 32.0 Sediments
Standard penetration testing (SPT) results for drill hole DH98-275 reflect the
dense to very dense ground conditions. Corrected SPT ‘N’ values ranged
from 46 to 118 between 1.5 and 14.0 meters. The SPT results for DH98-275
are presented on Table 3.5.
Drill hole DH98-276 was drilled at the South end of the service complex.
The stratigraphic sequence may be summarized as follows:
Depth Stratigraphy
0 to 0.3 m Topsoil

- 8 - 10173/12-3
December 22, 1998
0.3 to 1.5 m Dense, brown silty SAND, some gravel, trace clay
(Glacial Till)
1.5 to 19.8 m Basalt
19.8 to 25.2 m Gravel
25.2 to 30.4 m Feldspar Porphyry
No SPT testing was carried out at DH98-276.
3.3.4 Coarse Ore Stockpile
A total of three (3) test pits (TP98-14, 20 & 21) were excavated at the
proposed coarse ore stockpile area. Test pits TP98-20 and 21 were excavated
in swamps and encountered up to 0.7 m of peat overlying a soft layer of wet,
lacustrine material. Beneath the lacustrine material is a medium dense to
dense glacial till comprised of SAND, trace clay, some silt, some gravel, trace
cobbles and trace boulders. Test pit TP98-14 was excavated on top of a 4 m
high ridge (esker) and encountered 0.2 m of topsoil overlying 0.8 m of gravel
with some sand, some cobbles, with trace silt. Beneath the gravel material
was 0.6 m of gravelly sand with trace silt and trace cobbles.
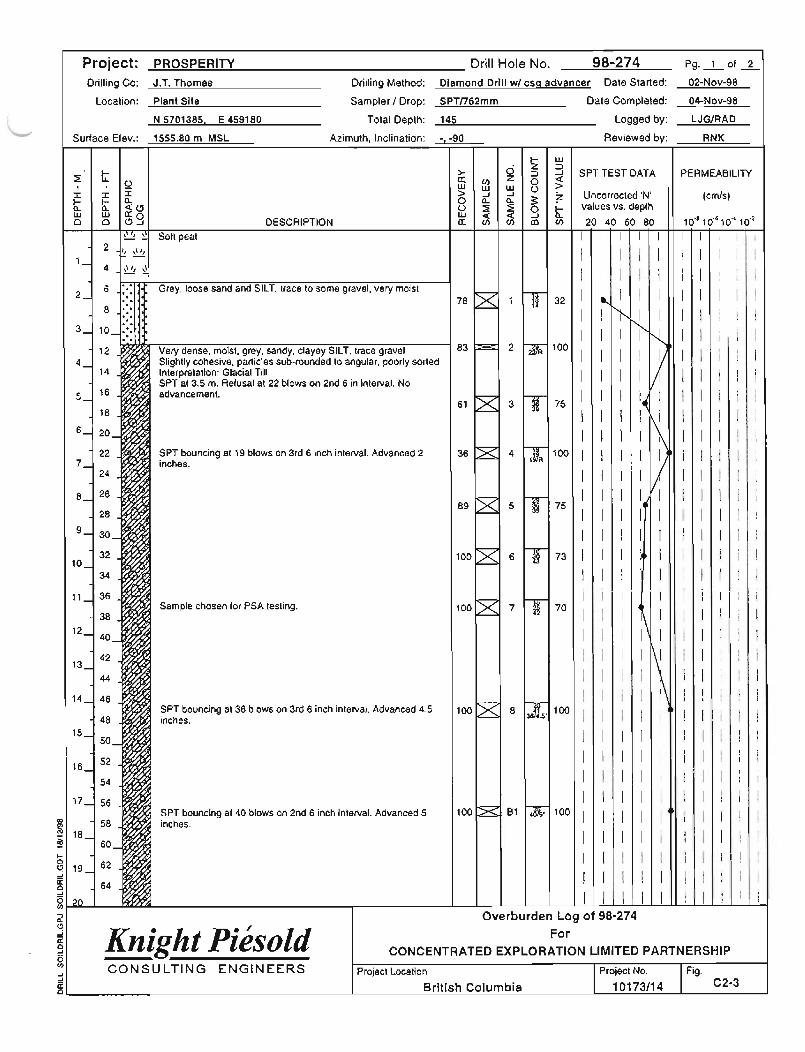
A total of one (1) drill hole (DH98-274) was drilled at the coarse ore
stockpile area.
Drill hole DH98-274 was drilled within a swampy area and the stratigraphic
sequence may be summarized as follows:
Depth Stratigraphy
0 to 1.5 m Soft Peat
1.5 to 3.3 m Very moist, loose sand and silt, trace to some gravel
3.3 to 29.5 m Very dense, moist, grey, sandy, clayey silt, trace gravel.
29.5 to 33.0 m Dense sand, stratified with very stiff plastic clay.
33.0 to 37.0 m Very dense material. Probably glacial till.

- 9 - 10173/12-3
December 22, 1998
37.0 to 44.2 m Heavily weathered and oxidized bedrock. Possibly
residual soil.
Standard penetration testing (SPT) results for drill hole DH98-274 reflect the
dense to very dense ground conditions. Corrected SPT ‘N’ values ranged
from 55 to 67 between 4.9 and 23.2 meters. The SPT results for DH98-274
are presented on Table 3.6 (non-cohesive soil) and Table 3.7 (cohesive soil).

- 10 - 10173/12-3
December 22, 1998
SECTION 4.0 - GEOTECHNICAL PARAMETERS AND FACTORS INFLUENCING FOUNDATION DESIGN
4.1 GENERAL
The geotechnical parameters required for foundation design are summarized below:
• Allowable bearing pressures.
• Settlement calculations.
• Modulus of subgrade reaction for structural fill.
• Depth of frost penetration estimates.
• Groundwater and drainage requirements.
• Seismicity.
• Shear strength parameters.
• Earth pressure coefficients.
• Soil properties for dynamic analyses.
• Coefficients of base friction.
• Design criteria for rock anchors.
Descriptions of the assumptions and methodologies as well as the results are
presented in the following sections.
4.2 ALLOWABLE BEARING PRESSURES, SETTLEMENT
CALCULATIONS AND MODULUS OF SUBGRADE REACTION
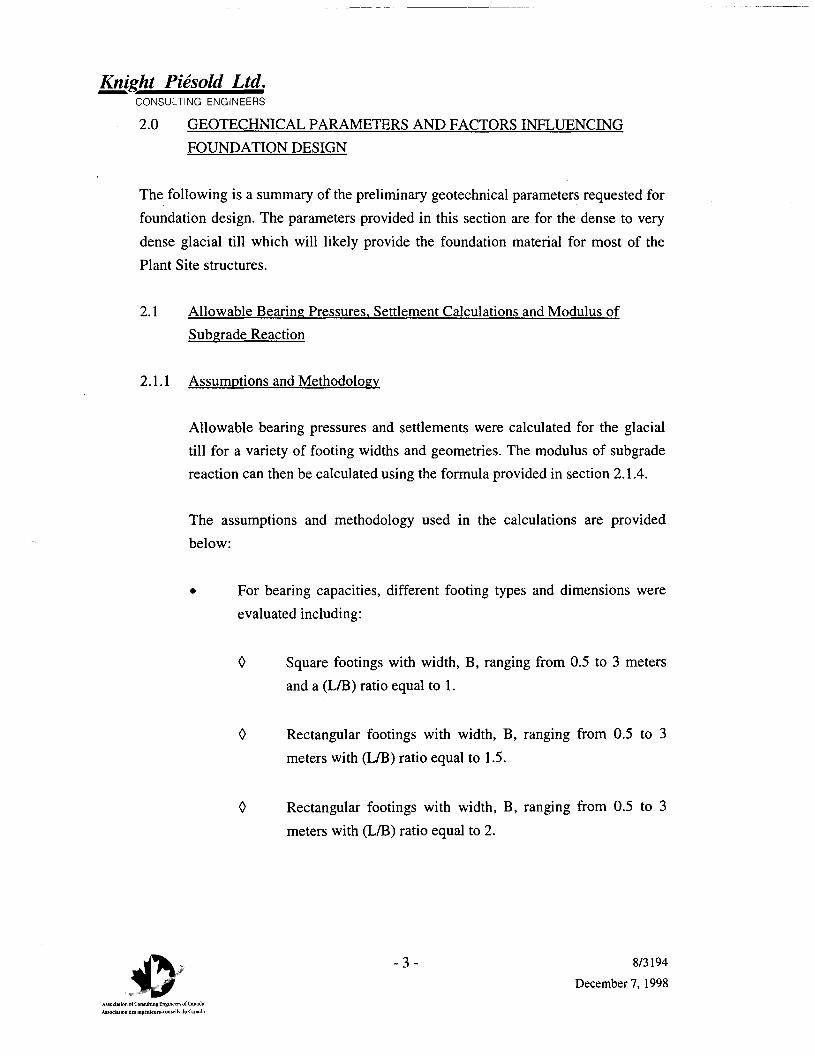
4.2.1 Assumptions and Methodology
Allowable bearing pressures and settlements were calculated for the native
soil (glacial till) and structural fill for a variety of footing widths and
geometries. The modulus of subgrade reaction for footings and slabs can
then be estimated using the techniques provided in section 4.2.4.
The assumptions and methodology used in the calculations are provided
below:

- 11 - 10173/12-3
December 22, 1998
For bearing capacities, different footing types and dimensions were evaluated
including:
• Square footings with width, B, ranging from 0.5 to 3 meters and a (L/B)
ratio equal to 1.
• Rectangular footings with width, B, ranging from 0.5 to 3 meters with
(L/B) ratio equal to 1.5.
• Rectangular footings with width, B, ranging from 0.5 to 3 meters with
(L/B) ratio equal to 2.
• Strip footings with width, B, ranging from 0.5 to 3 meters, (9 m for the
conveyor tunnel) with (L/B) ratio equal to 10,000, or infinity .
Footing depths ranged from 0 to 2.5 m.
For settlement calculations, the above footing types and dimensions were
evaluated with the following relative depths:
1. The thickness of the compressible layer, z, is equal to the width of the
footing, B (Relative depth z/B = 1).
2. The thickness of the compressible layer, z, is equal to 2 times the
width of the footing, B (Relative depth z/B = 2).
3. The thickness of the compressible layer, z, is equal to 4 times the
width of the footing, B (Relative depth z/B = 4).
Different footing widths were evaluated ranging between 0 and 10 meters.
The shear strength values used in the bearing capacity analyses were φ′ = 38
degrees for the native soil and φ′ = 36 degrees for the structural fill. The
apparent modulus of elasticity was estimated at Es = 100 MPa for the
structural fill and Es = 500 MPa for the native soil.

- 12 - 10173/12-3
December 22, 1998
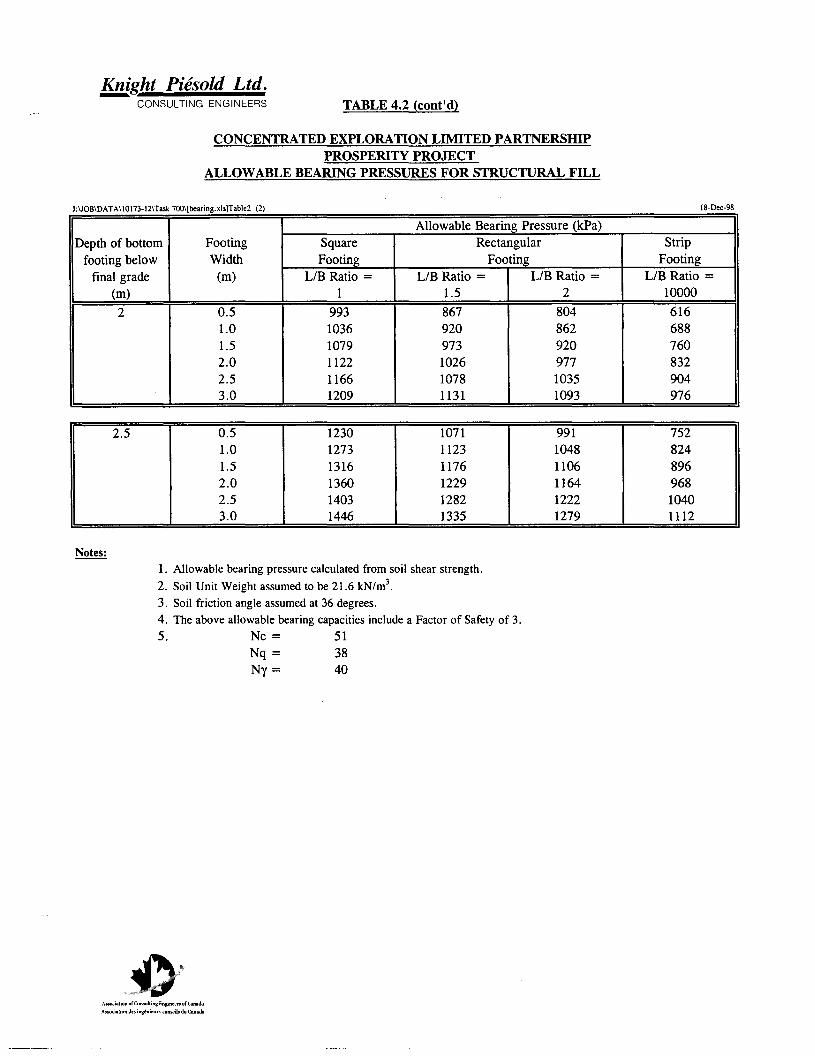
4.2.2 Allowable Bearing Pressures
The allowable bearing pressures for various footing geometries on native soil
and structural backfill have been estimated using conservative soil shear
strength values and a factor of safety of 3.0. The results for footings placed at
depths varying between 0 and 2.5 meters are summarized on Table 4.1 for
native soil and 4.2 for structural fill. The allowable bearing capacities for the
primary crusher site (rock foundation) have been calculated from the point
load test results. The results are summarized on Table 4.3.
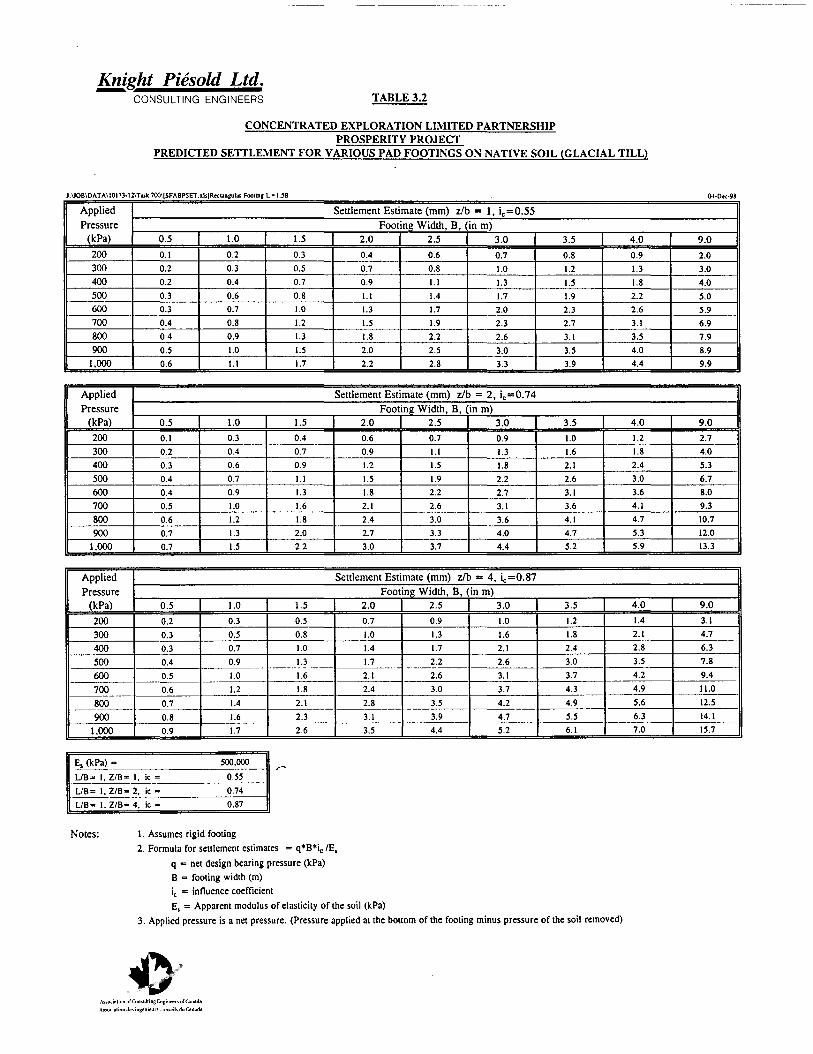
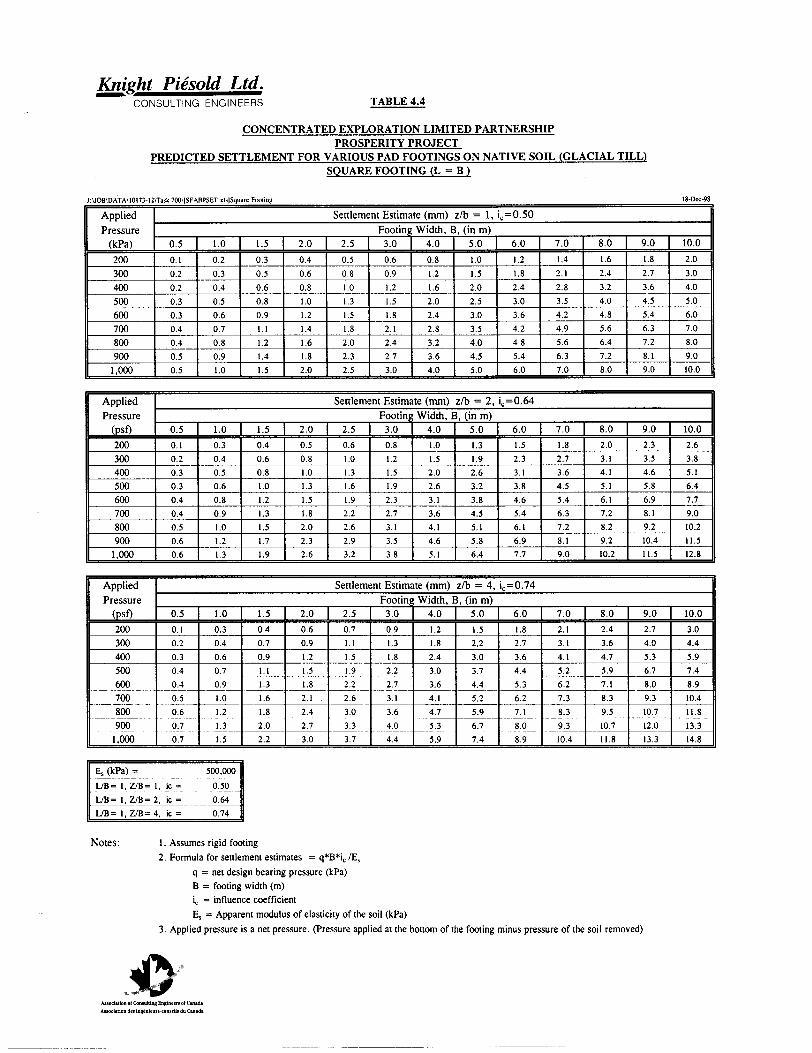
4.2.3 Settlement Calculations
The estimated settlements for various footing geometries under various
conditions are provided on Tables 4.4, 4.5, 4.6 and 4.7 for square, rectangular
(L=1.5B), rectangular (L=2B), and strip footing geometries on native soil and
Tables 4.8, 4.9, 4.10 and 4.11 for square, rectangular (L=1.5B), rectangular
(L=2B), and strip footing geometries on structural fill. Settlement estimates
for various footing geometries and various compressible thicknesses have
been completed for the glacial till material using the stress calculation
technique. The settlements are expected to be primarily elastic and will occur
rapidly, likely during initial construction and loading of the structures. Some
longer term consolidation settlements are also likely where more fine-grained
overburden soils are present. However, the results of site investigations
completed to date indicate that the magnitude of any long-term consolidation
settlements will not be significant.
The estimated settlements for various footing geometries under various
conditions are provided on Tables 4.12, 4.13, 4.14 and 4.15 for square,
rectangular (L=1.5B), rectangular (L=2B), and strip footing geometries for
the bedrock encountered at the primary crusher site.

- 13 - 10173/12-3
December 22, 1998
4.2.4 Modulus of Subgrade Reaction
The modulus of subgrade reaction is a relationship between the soil pressure
and deflection. This parameter is often used in the structural analysis of
foundation members such as footings, mats and slabs. The modulus of
subgrade reaction is not an independent soil parameter derived from lab
testing; it is dependent on the geometry of the structural member under
analysis.
The modulus of subgrade reaction for the glacial till can be estimated for
various footing widths, geometries and conditions using the formula below:
ksp = Net applied pressure/resulting settlement
where ksp = modulus of subgrade reaction (kN/m3).
Net applied pressure = intensity of the soil pressure (kPa).
unit settlement = settlement as a result of the net applied pressure (m).
As an example calculation, for a net applied pressure of 300 kPa on a
rectangular footing with a dimension of 2 meters by 4 meters (L=2B), use
Table 4.6 to determine the estimated settlements for three different
relationships between the width of the footing and the thickness of the
compressible layer (z/b) for z/b ratios of 1, 2, and 4. In the above example,
the compressible native soil layers would be 2, 4, and 8 meters thick
respectively. The resulting modulus of subgrade reaction for the three cases
outlined above are 429,000, 300,000 and 273,000 kN/m3 respectively.
The modulus of subgrade reaction for a mat or slab can easily incorporate
size effects by using a formula proposed by Vesic (1961a, 1961b) that
simplifies to:
ksp = Es / (B * (1-μ2))

- 14 - 10173/12-3
December 22, 1998
where ksp = modulus of subgrade reaction (kN/m3).
Es = modulus of elasticity (kPa)
B = width of the slab (m)
μ = Poisson’s ratio
Poisson’s ratio for a non-cohesive material typically ranges between 0.25 and 0.35.
A reasonable number to use is 0.30.
4.3 DEPTH OF FROST PENETRATION
Based on meteorological data, the depth of freeze is estimated to be 2.5 metres. All
structures must be covered with a minimum 2.5 metre thick layer of free-draining,
non-frost susceptible (NFS) material such as clean gravel or course sand, as required
to prevent frost heave from occurring. All pipeworks and services should be covered
with a minimum 3.0 meter thick layer of NFS material.
Drainage for the NFS around foundation footings should be provided to depress the
water table and greatly reduce the potential for the development of ice lenses
resulting in frost heave.
Gradation requirements for the NFS are presented in Figure 4.1.
Adfreeze pressures against concrete and steel surfaces are affected by soil type,
moisture content, soil temperature, and rate and magnitude of heave at the surface.
Adfreeze stresses are generally higher against steel relative to soil, wood, and
concrete. However the surface roughness is also a contributing factor to the
magnitude of the adfreeze bond. The Canadian Foundation Engineering Manual
suggests that average adfreeze bond stresses, determined from field tests typically
range from 65 kPa for fine grained soils frozen to wood or concrete to 100 kPa for
steel. Peak bond strengths are in the 130 to 230 kPa range.
Frost heave and frost jacking are the two most troublesome consequences of soil
freezing. The components which cause heaving to occur are as follows: freezing
temperatures in soils, a water source, a frost-susceptible soil. Common approaches to
mitigating this problem are sufficient foundation depth, over-excavation and
replacement with non-frost susceptible backfill (including proper drainage), thermal
protection, and footing enlargements to resist heave forces.

- 15 - 10173/12-3
December 22, 1998
4.4 GROUNDWATER AND DRAINAGE REQUIREMENTS
The depth to groundwater at the 5 drillhole locations is summarized as follows:
Drillhole Location Depth to Groundwater
(as measured in Piezometer)
(m)
Material Piezometer Founded In
Elevation of Groundwater
(m) 98-272 13 072 N, 9 560 E 2.1 Bedrock 1558.5
98-273 13 226 N, 9 581 E 1.0 Bedrock 1560.0
98-274 12 952 N, 9 929 E 12.1 Glacial Till 1543.7
98-275 13 122 N, 9 359 E 10.1 Glacial Till 1552.4
98-276 12 817 N, 9 339 E 12.0 Basalt Flow 1548.2
The depth to groundwater as measured in drillholes 98-272 and 98-273 is
representative of artesian conditions rather than a shallow water table.
The plant and crusher sites should be well drained during construction and operations
to prevent standing water from ponding in the vicinity of the foundations. Surface
runoff from building roofs and access roads, etc., must also be diverted or directed
well away from the foundations to minimize seepage and infiltration into the
foundation soils.
4.5 SEISMICITY
The Prosperity Project site is located in the north-eastern edge of the Coast
Mountains source zone, an area with low seismic activity. The Design Basis
Earthquake (DBE) for the project may be conservatively chosen as the 1 in 475 year
return period event. This corresponds to a maximum bedrock acceleration of 0.072g
and maximum ground velocity of 0.104 m/s. The foundation factor, F, is equal to 1.0
for the glacial till. These values are recommended for the design of all site buildings
and structures, consistent with the National Building Code (NBC) of Canada. The
above ground motion parameters place the site in seismic zone 1 for acceleration (Za
= 0.05) and zone 2 for velocity (Zv = 0.10). These parameters are based on a seismic

- 16 - 10173/12-3
December 22, 1998
hazard calculation previously carried out by the Pacific Geoscience Centre for the
site.
4.6 SHEAR STRENGTH PARAMETERS
Shear strength parameters for the glacial till and structural fill were based on existing
information and experience with similar materials on other projects. These
parameters may be used for both in-situ and compacted materials and represent the
lower bound values. The results are summarized as follows:
Material Description
Internal angle of friction φ′ (degrees)
Cohesion ( c’) (kPa)
Glacial till 38 0
Structural Fill 33 0
4.7 EARTH PRESSURE COEFFICIENTS
The coefficients of lateral earth pressure for the glacial till and structural fill are
tabulated below. These values have been calculated based on the estimated frictional
strength characteristics of the specific material types and are applicable for both the
in-situ condition and as structural fill material. These calculations assume that the
retaining wall is vertical and the backfill is placed and sufficiently compacted in
horizontal lifts. Other wall or fill configurations will result in different coefficients of
lateral earth pressure.
Design Parameters Glacial Till Structural Backfill
Friction Angle, Phi 38 ° 33 °
Coefficient of Earth Pressure at Rest, Ko 0.38 0.46
Coefficient of Active Earth Pressure, Ka 0.24 0.29
Coefficient of Passive Earth Pressure, Kp 4.2 3.39
- 17 - 10173/12-3
December 22, 1998
4.8 SOIL PROPERTIES FOR DYNAMIC ANALYSIS
Dynamic soil parameters were determined for structural fill assuming a cohesionless
granular material (sands and gravels).
The dynamic shear modulus for a cohesionless granular sand and gravel was
calculated using the following relationship proposed by Seed et al (1986):
Gmax = 22(K2)Pa(sm’/Pa)1/2
where Gmax = dynamic shear modulus
K2 = the soil modulus coefficient
(for dense sand and gravel this value typically ranges between 90
and 180 based on published information)
sm’= mean effective stress
Pa = atmospheric pressure
The dynamic shear modulus for structural fill up to a thickness of 10 meters was
calculated assuming a dense free draining granular sand and gravel with zero pore
pressure. These calculations included two cases, an upper and lower bound solution,
to illustrate the range of dynamic shear modulus for a selected depth. The results are
summarized on Figure 4.2.
The dynamic shear moduli for the native soil were also determined from the above
equation. Estimates of the soil modulus coefficient (K2) were calculated using the
corrected SPT ‘N’ values and the following equation:
K2 = F x 20 (N1)601/3
where F = 0.8 for silty sands glacial till.
The results are for the dynamic shear modulus for the native soil are summarized on
Table 4.16.
- 18 - 10173/12-3
December 22, 1998
4.9 COEFFICIENT OF BASE FRICTION
The coefficient of base friction (tan δ) is a term used in the design of retaining walls
and refers to the friction between the soil and the base. For footings or mat
foundations use a coefficient of base friction (tan δ) of 0.55.
4.10 DESIGN CRITERIA FOR ROCK ANCHORS
The general design criteria for rock anchors are based on rock quality and on an
allowable capacity of 200 kN required for each anchor, as specified by Kilborn.
These criteria are general only and will require re-evaluation for site specific
conditions if rock anchors are used.
The preliminary design criteria and general recommendations for rock anchors are as
follows:
• Drillhole diameters for the anchor holes should be 76 mm dia. for 36 mm dia.
anchors and should be completed using percussion drilling methods, such as the
down-hole hammer.
• Drillholes should be drilled with an additional 0.3 m sump (void) below the base
of the anchor installation and should be flushed prior to anchor installation and
grouting.
• Drillholes should be tested for water tightness for its entire length, or in stages, at
a pressure equivalent to a head of 3.65 m of water above the top of the drillhole.
If the leakage over a 15 minute period exceeds 1.2 litres/metre of the tested
length, the hole shall be consolidation grouted and re-drilled. This process should
be repeated until the leakage is reduced to the acceptable rate.
• Double-corrosion protection should be used for permanent anchor installations as
the anchors will be below the groundwater table.

- 19 - 10173/12-3
December 22, 1998
The following are preliminary recommended anchor bond lengths and minimum
spacings for rock anchors in sound bedrock and fractured rock or weathered bedrock:
Ground Condition
Anchor Bond Length (m)
Minimum Anchor Spacing (m)
Sound Rock 1.5 1.2
Fractured Rock 2.8 1.2
4.11 BACKFILL MATERIAL TYPES AND COMPACTION REQUIREMENTS
As no specifications were received from Kilborn Engineering regarding backfill,
specifications from previous projects that Kilborn has been involved with (Carmacks
Copper and East Boulder Project) have been adopted for this project.
The following are general recommendations for backfill materials and fill slopes:
• Granular A Material shall be used for structural backfill for the interior of
structures directly beneath the slabs. Granular A Material shall be classified
as non-frost susceptible, as defined on Figure 4.1, and shall be durable,
competent, free draining, granular material with a maximum particle size of 1
inch. The material should be placed, spread and levelled and compacted in
lifts not exceeding 6 inches in thickness so as to achieve 95% of the Modified
Proctor maximum dry density. A minimum of 6 inches of Granular A
Material shall be placed above Granular B Material, where required.
Selective borrowing, blending, screening, crushing and/or washing may be
required to meet the gradation requirements. This material should be free of
organics, ash or deleterious material and should be placed at the designated
moisture content to achieve the compaction objectives. The gradation
requirements for Granular A Material are shown on Figure 4.3.
• Granular B Material shall be used for structural backfill at the exterior of
structures, as well as under Granular A Material for the interior of structures.
Granular B Material shall be classified as non-frost susceptible, as defined on
Figure 4.1, and shall be durable, competent, free draining, granular material

- 20 - 10173/12-3
December 22, 1998
with a maximum particle size of 3 inches. The material shall be placed,
spread, levelled and compacted in lifts not exceeding 12 inches in thickness
so as to achieve 95% of the Modified Proctor maximum dry density.
Selective borrowing, blending, screening, crushing and/or washing may be
required to meet the gradation requirements. This material should be free of
organics, ash or deleterious material and should be placed at the designated
moisture content to achieve the compaction objectives. The gradation
requirements for Granular A Material are shown on Figure 4.4.
• Select Subgrade Material may be used for general backfill adjacent and
outside of the structural fills (Granular A and/or Granular B Materials). The
general backfill may comprise glacial till, or alluvial sand and gravel deposits
produced from the various excavations provided that the material satisfies the
grading requirement for Select Subgrade Material. The material should be
placed, spread and levelled into lifts not exceeding 18 inches so as to achieve
90% of the Modified Proctor maximum dry density. This material should be
free of organics, ash or deleterious material and should be placed at the
designated moisture content to achieve the compaction objectives. The
gradation requirements for Select Subgrade Material are shown on Figure 4.5.
• Provision should be made for including drainage around the perimeter for all
foundations.
• Backfill should be capped with less permeable soil and graded to direct runoff
away from foundations and building structures.
Permanent fill slopes for glacial till, alluvial sand and gravel should be 2H:1V or
shallower. Temporary fill slopes for structural fill may be 1.5H:1V provided the fill
is maintained in a free draining condition.

- 21 - 10173/12-3
December 22, 1998
4.12 ROCK TYPES AND EXCAVATION RESTRICTIONS
• The bedrock encountered at the Primary Crusher Site was moderately strong
to strong microdiorite bedrock with high to very high RQD values. Bedrock
was encountered at a depth of 1.8 m in drillhole 94-139.
• The excavation for the underground conveyor tunnel will be in dense to very
dense glacial till and in the Feldspar Porphyry. The depth of overburden
(Till) at the coarse ore stockpile is at approximately 37 m (DH98-274), while
weathered rock was encountered at 1.7 m at TP98-21, located between the
coarse ore stockpile area and the mill building.

- 22 - 10173/12-3
December 22, 1998
SECTION 5.0 - REFERENCES
Reference documents include:
1. Canadian Foundation Engineering Manual, 1992. Third Edition. Canadian
Geotechnical Society, Technical Committee on Foundations, 512 pp.
2. Bowles, J.E. 1996. Foundation Analysis and Design, Fifth Edition. The
McGraw-Hill Companies Inc. 1175 pp.
3. Eranti, E., Lee, G.C., 1986. Cold Region Structural Engineering, McGraw-
Hill Book Company, 529 pp.
4. Smith, D.W. (Technical Editor.), 1996. Cold Climate Utilities Monograph,
Canadian Society for Civil Engineering, Montreal, Quebec.
5. Cold Regions Engineering Short Course Manual, 1997.
6. Seed et al. Moduli and Damping Factors for Dynamic Analyses of
Cohesionless Soils. Journal of Geotechnical Engineering, Vol. 112, No.11,
November, 1986.

TA
BL
ES


FIG
UR
ES


DR
AW
ING
S