tariff support for wind power and rooftop solar pv in ... · tariff support for wind power and...
TRANSCRIPT

i
TARIFF SUPPORT FOR WIND POWER AND ROOFTOP SOLAR PV IN INDONESIA
Prepared for the Government of Indonesia by the Asian Development Bank
March 2015

ii
TABLE OF CONTENTS List of Tables ............................................................................................................................... iv List of Figures .............................................................................................................................. vi List of Box .................................................................................................................................... vii List of Stakeholder Comments ................................................................................................ vii Abbreviations ............................................................................................................................ viii Currency ........................................................................................................................................ ix Acknowledgments ........................................................................................................................ x Executive Summary ..................................................................................................................... xi 1. Introduction ................................................................................. 1 1.1 Background and Objectives .............................................................................................. 1 1.2 Support for RE in Indonesia ............................................................................................. 1 1.3 Relevant lessons of past Indonesian Renewable Energy experience ....................... 4 2. Options for the Design of RE support tariffs ....................... 6 2.1 General Principles of Renewable Energy Tariff design .............................................. 6 2.2 Options for indonesia ........................................................................................................ 9 3. Methodology ............................................................................. 11 3.1 Avoided energy costs ....................................................................................................... 12 3.2 Avoided Capacity Costs ................................................................................................... 16 3.3 Avoided costs of GHG emissions .................................................................................. 17 3.4 Local environmental externalities ................................................................................. 19 3.5 Local Economic Development ........................................................................................ 20 3.6 Energy Security Premium ................................................................................................ 20 3.7 System Integration Costs ................................................................................................. 20 3.8 Avoided transmission losses .......................................................................................... 20 3.9 Tariffs based on benefits ................................................................................................. 21 4. Recommended Tariffs and Implementation Schemes ...... 23 4.1 Rooftop PV ......................................................................................................................... 23 4.2 Wind .................................................................................................................................... 30 5. Impact on MoF and Consumers ............................................ 37 5.1 Impact of the Rooftop PV FIT ........................................................................................ 37 5.2 Impact of the wind FIT .................................................................................................... 40 5.3 Summary ............................................................................................................................. 44 Annex I: Rooftop PV ...................................................................... 45 I.1 The Solar Resource ............................................................................................................ 45 I.2 The Indonesian Rooftop PV Program ........................................................................... 46 I.3 Potential for Rooftop PV .................................................................................................. 47 I.4 Technical Considerations for Rooftop PV .................................................................... 48 I.5 PV Technology ................................................................................................................... 49 I.6 Overview of International experience with Rooftop PV Incentive Programs ...... 51

iii
1.7 Feed-in Tariffs ................................................................................................................... 53 I.8 Net Metering vs Gross Metering .................................................................................... 55 I.9 Ownership Models ............................................................................................................ 58 I.10 Metering options for Indonesia ..................................................................................... 61 I.11 The impact of Rooftop PV ............................................................................................... 64 I.12 Financial modelling .......................................................................................................... 65 Annex II: Wind Power ................................................................... 69 II.1 The resource and project pipeline ................................................................................ 69 II.2 International experience with Wind ............................................................................ 71 II.3 Relevant Lessons of the International Experience .................................................... 71 II.4 The Benefits of Wind Power .......................................................................................... 72 II.5 Project costs ....................................................................................................................... 73 II.6 Implementation models ................................................................................................. 77

iv
LIST OF TABLES Table 1.1: Geothermal support tariffs (USc/kWh) ................................................................................................................ 2 Table 1.2: Regional adjustment factors for the small hydro FIT .................................................................................... 2 Table 1.3: FIT for biomass/biogas ............................................................................................................................................... 4 Table 1.4 : Incentive for load following projects .................................................................................................................... 4 Table 2.1: Advantages and disadvantages of production cost-‐based FITs ................................................................. 7 Table 2.2: Advantages and disadvantages of FIT based on benefits ............................................................................. 9 Table 3.1: PLN’s fuel cost assumptions: Java ........................................................................................................................ 13 Table 3.2: Netback price for domestic gas, $/mmBTU ..................................................................................................... 13 Table 3.3: Value of displaced energy at border prices (Sulawesi, 200MW wind, 2016) .................................... 16 Table 3.4: Value of displaced energy at border prices (Sulawesi, 200 MW wind, 2020) .................................. 16 Table 3.5: Impact of GHG valuations ........................................................................................................................................ 17 Table 3.6: Benefits of Wind, Sulawesi, USc/kWh(1) .......................................................................................................... 21 Table 3.7: Benefits of wind: central Java, USc/kWh .......................................................................................................... 21 Table 3.8: Benefits of wind: Sumba ........................................................................................................................................... 22 Table 3.9: Benefits of Roof top PV, Jakarta, 250MW ......................................................................................................... 22 Table 4.1: Baseline FIT Schedule for Rooftop solar ........................................................................................................... 25 Table 4.2: Commercial Scale Only FIT ..................................................................................................................................... 26 Table 4.3: Baseline FIT Quotas for Rooftop PV Program ................................................................................................ 27 Table 4.4: FIT Quotas for Commercial Scale Only Rooftop PV Program .................................................................. 27 Table 4.5: FIT for small projects (and ceilings for competitive bid projects) ........................................................ 30 Table 5.1: Rooftop PV: Impact on Stakeholders, $USm in 2024 ................................................................................... 37 Table 5.2: Impact of the proposed rooftop PV program on consumers: 250MW by 2024 ............................... 38 Table 5.3: Avoided cost of carbon .............................................................................................................................................. 38 Table 5.4: Impact of PV where it displaces oil ..................................................................................................................... 39 Table 5.5: Impact of wind on Sulawesi, 200MW by 2024 ............................................................................................... 40 Table 5.6: Impact on the consumer, Sulawesi wind ........................................................................................................... 41 Table 5.7: Cost of avoided carbon, Sulawesi wind .............................................................................................................. 41 Table 5.8: 2024 Impact of wind on Java ................................................................................................................................. 41 Table 5.9: 2024 Impact on the consumer, 100MW wind on Java ................................................................................ 42 Table 5.10: Cost of avoided carbon, Wind on Java ............................................................................................................. 42 Table 5.11: Impact of 20MW wind projects on Eastern Islands ................................................................................... 42 Table 5.12: Consumer impact, eastern Islands wind projects ....................................................................................... 43 Table 5.13: Avoided cost of carbon, Eastern Islands wind ............................................................................................. 44 Table 5.14: Comparison of Rooftop PV and wind FITs ..................................................................................................... 44 Table I.1: Summary of Solar Resource in Indonesia (kWh/m2/day) ......................................................................... 45 Table I.2: Generation Characteristics of Rooftop PV Systems ....................................................................................... 48 Table I.3: Network Impacts of Rooftop PV Systems ........................................................................................................... 48 Table I.4: PV Module costs: Imported vs. Local .................................................................................................................... 50 Table I.5: PV Module Assembly ................................................................................................................................................... 51 Table I.6: Six-‐monthly caps for Malaysia’s Solar PV FIT,2013-‐2014 ......................................................................... 54 Table I.7: Thailand Rooftop installation FIT rates for cap of up to 200MW total ............................................... 54 Table I.8: Community Ground-‐mount FIT rates for cap of up to 800 MW total .................................................... 54 Table I.9: FIT rates in Karnataka state in India .................................................................................................................. 55 Table I.10: Electricity tariff rates and FIT rates and configurations in different countries ............................ 58 Table I.11: PV System Installation Costs: on grid ............................................................................................................... 66 Table I.12: Assumptions for the financial analysis ............................................................................................................ 67 Table I.13: FIT requirements, Gross metered ....................................................................................................................... 67 Table I.14: Percentage of capital cost required to be subsidized to achieve 15% Return ................................ 68 Table II.1: The project pipeline: utility scale projects ....................................................................................................... 70 Table II.2: Tariffs and Implementation models in selected countries ....................................................................... 71 Table II.3: Wind support mechanisms ..................................................................................................................................... 71 Table II.4: Cost of diesel generation on Sumba ................................................................................................................... 72

v
Table II.5: Calculation of levelised tariff (Sulawesi Wind Tariff) ................................................................................ 73 Table II.6: Cost assumptions for utility scale projects ...................................................................................................... 73 Table II.7: Cost assumptions for small scale wind projects ............................................................................................ 74 Table II.8: Financial assumptions .............................................................................................................................................. 74 Table II.9: Capacity factor assumptions: ................................................................................................................................ 74 Table II.10: Results of production-‐cost based tariff that satisfy the financial conditions. ............................... 74 Table II.11: Tariff proposals of the developers .................................................................................................................... 75 Table II.12: Levelised tariffs as proposed by developers ................................................................................................. 75 Table II.13: Cost assumptions for grid integration costs ................................................................................................ 77 Table II.14: MEMR permits and licenses. ................................................................................................................................ 78 Table II.15: Regency and Province level permits ................................................................................................................ 79 Table II.16: Other licenses and agreements required for a wind project. ................................................................ 79

vi
LIST OF FIGURES Figure 3.1: Sulawesi Dispatch 2016, week 11 ..................................................................................................................... 14 Figure 3.2: Sulawesi 2016, week 11 dispatch with wind ................................................................................................ 14 Figure 3.3: 2016 Sulawesi Wind Displacement ................................................................................................................... 15 Figure 4.1: Comparison of proposed wind FIT with proposed production costs of the developers .............. 30 Figure 4.2. Illustration of the one-‐stop-‐shop ........................................................................................................................ 36 Figure I.1: Monthly Global Irradiance at 6 Urban sites (kWh/m2/day .................................................................... 45 Figure I.2: Average Irradiance with Diffuse vs Direct Breakdown ............................................................................. 46 Figure I.3: PV Module price curve ............................................................................................................................................. 49 Figure I.4 PV system Costs ............................................................................................................................................................ 50 Figure I.5: Gross Metering Configuration .............................................................................................................................. 56 Figure I.6: Net Metering Configuration .................................................................................................................................. 56 Figure I.7: Import v. export under gross and net metering ............................................................................................ 57 Figure I.8: Summary of Consumer Side Implementation Models ................................................................................ 58 Figure I.9: PLN Meter Configuration ........................................................................................................................................ 62 Figure I.10: Capacity Limitations for Net Metered PV Systems ................................................................................... 63 Figure I.11: Comparison of Jakarta Network Profile with PV Generation Profile ................................................ 64 Figure I.12: Average off-‐set of 1GW PV on Jakarta Network daily load profile .................................................... 64 Figure I.13: PV System Installation cost break down ....................................................................................................... 66 Figure II.1: Realizable wind potential in Indonesia, as of 2015 ................................................................................... 69 Figure II-‐2: Hourly and seasonal wind speed variations ................................................................................................. 70 Figure II.3: Production cost based tariffs ............................................................................................................................... 76 Figure II.4: Results of studies of wind integration costs versus wind capacity penetration in various regions of the US ............................................................................................................................................................................... 76 Figure II.5: Environmental Procedures ................................................................................................................................... 80

vii
LIST OF BOXES Box 1: The Malaysian PV tariff ...................................................................................................................................................... 8 Box 2: Global social cost of carbon (GSCC) ............................................................................................................................ 18 Box 3: Special considerations for small projects ................................................................................................................. 31 Box 4: Flat versus tiered tariffs ................................................................................................................................................... 32 Box 5: Competition in the Wind FIT program ...................................................................................................................... 33 Box 6: Streamlining the licensing process: One stop shop .............................................................................................. 35
LIST OF STAKEHOLDER COMMENTS Stakeholder comment #1: VAT Exemption ........................................................................................................................... 12 Stakeholder comment #2: Oil Price Forecasts ..................................................................................................................... 15 Stakeholder comment #3: Definition of Rooftop PV ......................................................................................................... 24 Stakeholder comment #4: Metering configurations ......................................................................................................... 28 Stakeholder comment #5: IPP licences ................................................................................................................................... 29 Stakeholder comment #6: The rationale for a feed-‐in tariff? ....................................................................................... 31 Stakeholder comment #7: Implementation milestones ................................................................................................... 32 Stakeholder comment #8: The need for competition ....................................................................................................... 34 Stakeholder comment #9: Wind resource potential ......................................................................................................... 69 Stakeholder comment #10: Storage at Wind farms .......................................................................................................... 77 Stakeholder comment #11: Change in ownership of projects ...................................................................................... 78

viii
ABBREVIATIONS
ADB Asian Development Bank BTU British thermal unit CAPEX Capital expenditure CCGT Combined cycle gas turbine COD Commercial operation date ERR Economic rate of return EU European Union FIRR Financial internal rate of return FIT Feed-in tariff FS Feasibility Study FTP Fast Track Programme GAR gross as received (coal price basis) GDP Gross domestic product GoI Government of Indonesia GSCC Global social cost of carbon HBA Harga Batubara Acuan (coal price index published monthly by GoI) HFO heavy fuel oil IBRD International Bank for Reconstruction and Development ICI Indonesian coal index (published by Argus) IDC Interest during construction IEA International Energy Agency IFC International Finance Corporation IFI International financial institution (World Bank, Asian Development Bank) IPP Independent power producer LNG Liquefied natural gas LRMC Long run marginal cost MEMR Ministry of Energy and Mineral Resources MFO marine fuel oil MUV Manufacture unit value (index) NAR net as received (coal price basis) NPV Net present value ORB OPEC reference barrel PLN Perusahaan Listrik Negara PM-10 Particulate matter less than 10 microns in diameter PPA Power purchase agreement PPP purchase power parity PSO Public service obligation T&D Transmission & distribution ToP Take-or-Pay USC Ultra super critical (coal power generation project) WB World Bank WEO World Energy Outlook (of the IEA) WTP Willingness to pay

ix
CURRENCY
All references to dollars and $ refer to United States Dollars.
Unless stated otherwise, the exchange rate used in this report is:
$1 = 12,500 Indonesian Rupiah (Rp)

x
ACKNOWLEDGMENTS
This study was led by Peter Meier (Economist, Consultant, ADB) and a team comprised of Pramod Jain (Wind Technology Specialist, Consultant, ADB), Paul Rodden (Solar PV Specialist, Consultant, ADB), Djoko Prasetijo (Power Systems Engineer, Consultant, ADB) and Berliana Yusuf (Power Systems Analyst, Consultant) with additional contributions from Agung Hariyanto (Power Systems Modeling Specialist, Consultant, ADB). Pradeep Tharakan (Senior Climate Change Specialist, ADB) directed the study and Maura Lillis (Consultant, ADB) provided additional assistance. Funding for this work was provided by Australia’s Department of Foreign Affairs and Trade (DFAT) through the Sustainable Infrastructure Assistance Program (SIAP), administered by the ADB (TA-8484). The work was initiated in response to a request from the Government of Indonesia’s Ministry of Energy and Mineral Resources (MEMR) to develop a new tariff regime for wind power and explore the possibility of a solar PV rooftop program in Indonesia. This report is based on analysis and stakeholder consultations conducted from October 2014 to February 2015.

xi
EXECUTIVE SUMMARY
Background
Indonesia faces rapidly increasing electricity demand. PLN’s most recent long-term plan (RUPTL) forecasts an annual electricity sales growth rate of 7%, from 219 TWh sales in 2015 to 464 TWh by 2024. At the same time, the Government of Indonesia has set ambitious 2025 targets to achieve a national electrification ratio of 95 percent and to increase the share of renewable energy in the primary energy mix to 23%. In particular the government has set 2025 targets to increase the country’s total installed wind capacity to 970 MW and national solar capacity to 800-1,000 MW. Two potential areas for renewable energy growth exist in wind energy and rooftop solar PV systems, but neither of these has been formally addressed by government regulations to date. This report was prepared at the request of Ministry of Energy and Mineral Resources (MEMR) to advise on a proposed tariff issuance for rooftop solar PV and wind. Funding for this work was provided by Australia’s Department of Foreign Affairs and Trade (DFAT) through the Sustainable Infrastructure Assistance Program (SIAP), administered by the Asian Development Bank (ADB).
Recommended Approach And Main Findings The recommended pricing mechanism is based on the principle that costs should not exceed the benefits to Indonesia. Such benefits include the avoided economic cost of fossil fuel displaced by the renewable technology, and the avoided cost of greenhouse gas emissions. The scope of the project was limited to wind generation in Java, Sulawesi and eastern islands, and rooftop solar PV in Jakarta. Benefits in other locations and benefits of other renewable energy technologies may be computed using the same methodology. The study was also informed by a series of stakeholder consultations.
The recommended approach and methodology are based on international practice, economic reasoning, and MEMR’s 2014 approach to development of geothermal tariff ceilings. The highlights of the approach are: • Estimate the economic benefits of wind and rooftop solar PV, which are specific to the main
thermal fuel displaced on the island in question. The primary benefit is the avoided economic energy cost of thermal generation; the next most important benefit is the value of avoided GHG emissions. Other benefits such as energy security, local environmental benefits and local economic development are also estimated. The benefits are adjusted for any incremental system integration costs (in the case of wind) and avoided T&D losses (in the case of PV). These benefits were established for the short, medium and long term (2016, 2020 and 2024) using a detailed production cost model (ProSym) of the relevant grids.
• Propose a tariff ceiling for each technology for a specific island based on benefits to Indonesia. The purpose is to ensure that any competitively bid tariff is below the economic benefit and therefore in the economic interest of Indonesia to implement.
• Establish the likely range of wind and PV developers’ production costs, and assess whether the technology can be delivered at or below the benefits – in which case the technology can be considered economic.
• Assess the implementation issues, especially the need for competition for large projects and a fixed feed-in tariff (FIT) for small projects.

xii
Our findings can be summarised as follows: • Rooftop Solar PV is not economically viable in Jakarta because it displaces electricity
generated by gas, and because the estimated benefits (including the value of avoided GHG emissions) are significantly less than the cost of producing energy using this technology.
• However, solar PV on eastern Islands, where it displaces oil, is highly economic and “win-win.” The benefits exceed the cost of production, and solar PV delivers financial cost savings to PLN and its consumers and reduces GHG emissions at no incremental cost.
• Wind projects are economic: significant capacity can be delivered at or below the benefits in all three of the regions (Java, Sulawesi and eastern islands) studied.
Rooftop PV
The tariff required to enable rooftop PV projects in Jakarta is significantly above the estimated benefits. At a valuation of $30/ton for avoided GHG emissions, the resulting estimate of benefits is around 16 USc/kWh. This can be compared to production costs of 20 USc/kWh for large PV systems (>1MW) and as much as 25-30 USc/kWh for small systems. Solar PV is not economically viable when it displaces gas. In fact, to justify solar PV against gas, GHG emissions would need to be valued at over $140/ton of CO2. This valuation would far exceed the damage cost estimates even of the Intergovernmental Panel in Climate Change (IPCC) or other authorities such as the Stern report (few of which assess valuations above $80/ton of CO2). Indeed, at such incremental costs, even carbon capture and storage (estimated at $100/ton of CO2 for Indonesian conditions) would be a better approach to reduce its carbon emissions. It also follows that the impact of the rooftop solar PV program on PLN and the MoF, or on consumers once retail electricity tariffs are fully cost-reflective, is substantial. The cost would be of the order of $33 million per year for a rooftop program of 250 MW. However, solar PV is economic when it displaces oil and diesel. This is the case on Indonesia’s eastern small islands, or for off-grid electrification. In these applications, solar PV delivers fuel cost savings to PLN in excess of the levelized cost of rooftop solar PV, and GHG emission reductions at no incremental cost (and is therefore “win-win”). Nevertheless, the report discusses how a feed-in tariff should be structured if indeed the Government decides to proceed with a renewable energy (RE) option that is not economically viable. MEMR needs to consider why it should proceed with a support tariff for rooftop PV under these circumstances. This is particularly true since Indonesia has other renewable energy resources – notably geothermal – that have a much lower levelized cost of production. In any event, if MEMR did decide to proceed with a PV program, we would recommend that the initial focus of such a program be on larger-scale PV systems (>100 kW). In larger-scale systems, the financial and administrative burden can be more easily managed and the interest of developers more strongly kindled. One possible argument for a Rooftop Solar PV support tariff for Jakarta based on production costs is that, by enabling a large volume of PV, it may support the development of the domestic PV suppliers. These suppliers would then be in a better position to supply more cost-effectively the smaller PV systems for off-grid and eastern Island applications where PV is economic. However, whether such benefits are sufficient to offset the high costs is questionable (detailed consideration of which goes beyond the current terms of reference of this study).
Wind
By contrast, we find that grid-connected wind projects can be economic – i.e. the economic benefits to Indonesia exceed the costs. We estimate the benefit at 15.7 USc/kWh for Sulawesi, 16.0 USc/kWh for Java, and 28.0 USc/kWh for eastern islands. These are comparable to tariff

xiii
estimates proposed by developers based on their production costs; so such a FIT would likely enable the development of a significant number of wind projects.
Aggregate impacts of wind and rooftop solar PV
We estimate the total net economic benefit of a wind program of 200 MW on Sulawesi, 100 MW on Java, and 20 MW of small projects on eastern islands enabled by the proposed tariffs at $11.7 million/year.1 However the net economic loss of the 200 MW Jakarta Rooftop program is $21.7 million/year. The avoided costs of carbon for the wind programs are in the range of $6.4 to $13.7 ton CO2 e. The total impact of the wind projects is a 2024 tariff increase of 0.65 Rp/kWh.
System Integration Issues
For both wind and rooftop PV, we see few, if any, system integration problems related to their intermittency. The established international experience is that significant impacts on the stability and operation of the grid are experienced only after the penetration level exceeds 20%: modern wind turbines manage intermittency and uncertainty of wind resource with sophisticated plant-level and turbine-level controls that enable stable and well-behaved performance of grids with high levels of wind power penetration. Keeping this figure in mind, 250 MW of PV plus 100 MW wind on Java by 2024 would account for 0.2% of total energy, and 1.3% of gas generation. 200 MW of wind on Sulawesi would account for 5.4% of 2024 gross peak demand. Indeed, the systems integration studies for Sulawesi already conducted in connection with the proposed Jeneponto and Sidrap projects reveal no significant problems relating to intermittency. Even on Sulawesi, we find there is adequate quick response capacity – diesel, open cycle or combined cycle, as well as some daily storage hydro – to absorb the variability of the renewable energy output. With low levels of penetration, heat rate penalties associated with additional ramping and part load operation of gas projects are negligible. However, if 200 MW were to be commissioned already by 2018, when peak demand is 2,200 MW, and off-peak demand is no more than 1,300 MW, then the penetration level is more significant, and will require careful attention. In the interest of conservative assumption we have made an adjustment for such system integration costs in the calculation of benefits for Sulawesi ($5/MWh). We also recommend that system integration studies be undertaken for small projects on small islands (since in such systems, even a small wind project may easily exceed the 20% threshold, and may impose more significant costs on the rest of the system).
Implementation Issues Regular review
Renewable energy tariffs (and tariff ceilings) need regular review, a well-established international practice. The importance of this was noted in the stakeholder consultation meetings while discussing the volatility of international energy markets: calculating the benefits of renewable energy obviously depends upon the value of the thermal fuels displaced, and the value society places on carbon and other emissions from fossil fuels. We therefore recommend that MEMR review the tariffs annually: if there is in fact no major change in the assumptions over the previous year’s forecasts, then the ceilings can be left in place until the next annual review.
1 By “net” economic benefit we here mean the net gain to Indonesia of replacing thermal generation
by renewable energy.

xiv
Any change in ceiling price would only apply to new projects, and does not affect projects with a signed PPA for which the ceiling price that applies is the one in force at the time of PPA signature.
Competition for large wind projects
The extent to which projects should be competitively tendered has been hotly debated, and some developers have doubted its efficacy. However, there is no question that the international experience confirms the value of competition for larger renewable energy projects, although the transaction costs of competitive tenders for small projects may well exceed the achievable benefits. MoF also requires competition (and is reluctant to provide any guarantees to larger projects not selected competitively). Consequently, the main issues are to set an appropriate project size threshold, below which the FIT is available to all, above which the FIT serves as a ceiling. Special consideration is proposed for projects that have already started development.
Little credence needs to be given to developers’ assertions that competitive tenders would always converge at the value of the ceiling, and consequently there is no need for competition. In fact, international experience shows that the main problem in competitive systems is that winning bids may be unrealistically low, at which projects cannot be delivered in practice. Indeed, this has been the problem for Indonesian geothermal projects: the appropriate remedy is to insist on rigorous pre-qualification for both technical and financial capacity, and impose a substantial bid bond. Given that 10 MW has already been set as the threshold for eligibility for the FIT for small hydro and biomass, we also recommend 10 MW as the ceiling for wind projects. Projects above 10 MW would be subject to competitive tender. The report outlines the measures that would be required to make competition for wind projects effective. We assess the likely quantity of financially feasible utility-scale (project of size > 10 MW) wind potential is in the range of 300 to 500 MW. Of this total potential, we assess that currently 250 MW of wind projects are in late-stage development (200 MW in South Sulawesi and 50 MW in Java). These projects have been under development for 2 to 5 years by 2 or 3 private developers. We recommend that special consideration should be given to these pioneering projects in the country by awarding a fixed FIT equal to the benefits of wind to Indonesia. International experience shows that competition is effective only after a few projects have been developed in the country so that most of the unknowns (regulatory, licensing, grid impacts, logistics, etc.) have been sorted out. Our recommendation is that projects >10 MW which are in late-stage development, or the first 250 MW of projects with a signed PPA (whichever is less), be exempt from competition. The report proposes strict criteria for defining what constitutes “late-stage development”, but MEMR may prefer the simple 250 MW signed PPA threshold exemption.
Even if wind integration issues can be solved for some individual projects, unsolicited proposals for larger wind projects pose problems for PLN’s long term planning. Ideally, therefore, MEMR/PLN need to develop their own master plan for wind power development, which should identify the areas and timing for competitive tenders that are best suited for wind power development from PLN’s and the national policy perspectives. International experience shows this is also the best approach for ensure timely planning and construction of any required transmission infrastructure.

xv
General Matters Of Energy Policy Our examination of the potential benefits of both Rooftop PV and wind raise a number of general policy issues, which require attention for renewable energy targets to be met.
Performance based regulation (PBR)
There appears to be some concern about how the impending introduction of performance-based regulation (PBR) on PLN’s operations will impact renewables, since PLN will be given targets to reduce its operational costs. However, purchases of energy from IPPs where (i) the tariff is determined by competitive tender and does not exceed the tariff ceiling, or (ii) purchases under a fixed feed-in tariff issued by MEMR, should be treated as a pass-through. These two expenses should therefore not be included in the cost-base and hence should not be subject to cost reduction and efficiency improvement targets. However, at high levels of penetration of intermittent renewables, the penalties consequent to more part load operation and increased ramping requirements may have small detrimental impact on heat rates at PLN-operated projects. This requires further study, and, if necessary, appropriate adjustments need to be made to PLN’s efficiency improvement targets.
Gas pricing policy
At present, PLN benefits from a wide range of prices for domestic pipeline gas, ranging from as little as $2.52/mmBTU to $8.12/mmBTU). At the same time, PLN has expressed concern about the future availability of additional sources of gas, and low gas prices generally do not incentivize adequate investment in new domestic supplies. Moreover, PLN has been purchasing LNG at $16/mmBTU for its Jakarta gas power plants (though spot LNG prices have fallen sharply over the past year). We understand that the Government is considering a new gas pricing policy, which is important from the perspective of renewables. In our study we have used international market prices for LNG, and an import parity price for domestic pipeline gas, for the valuation of benefits of renewables. However, if the financial price of gas to PLN continues to be much lower than the import parity price, then renewables will appear to be more expensive than they really are.
Take-or-pay constraints on gas supply
There is also some concern about the possible impact of take-or-pay (ToP) requirements on PLN’s gas supply contracts. If these ToPs have no flexibility, then it is conceivable that intermittent renewables would in fact replace coal – because backing down gas power plants during peak hours would need to be offset against increased generation during off-peak hours, when they would replace coal. With coal at $4/mmBTU rather than gas at $10-$16/mmBTU, wind would become economically unviable (and unlike geothermal wind has little or no capacity benefit). However, the impact on total gas consumption, especially on Java, is extremely small – 250 MW of PV plus 100 MW of wind would displace just 1.3% of total gas consumption. Most ToP contracts allow some carryover to subsequent years, and given the small volumes involved it should not be difficult for PLN to manage its gas supply contracts accordingly. However, in reality, the load dispatch centre sometimes finds it difficult to absorb the make-up volume especially when the make-up volume is monthly.

1
1. INTRODUCTION ___________________________________________________________________________
1.1 BACKGROUND AND OBJECTIVES
1. Indonesia faces rapidly increasing electricity demand. PLN’s most recent long-term plan (RUPTL) forecasts an annual electricity sales growth rate of 7%, from 219 TWh sales in 2015 to 464 TWh by 2024. At the same time, the Government of Indonesia has set ambitious 2025 targets to achieve a national electrification ratio of 95 percent and to increase the share of renewable energy in the primary energy mix to 23%. 2. Over the past few years, in support of this objective the Ministry of Energy and Mineral Resources (MEMR) has issued a number of regulations for tariff support for specific renewable energy technologies, including small hydro, biomass and biogas, and geothermal. The Ministry now desires to issue similar support tariffs for wind energy and for a rooftop solar PV program. 3. To this end, the Ministry has initiated a stakeholder consultation process and has requested the Asian Development Bank (ADB) to provide technical assistance. This report has been prepared by ADB’s technical experts. Although the main emphasis is on the structure and level of support tariffs required to enable additional renewable energy, the report notes that a series of additional actions and regulations are required to complement the tariff.
1.2 SUPPORT FOR RE IN INDONESIA 4. As noted, support tariffs are already in place for several renewable energy technologies, as follows:
Geothermal
5. The original Geothermal Law required competitive tenders in the award of geothermal work area to developers. However, in 2012 MEMR issued a FIT in an effort to unlock the sector. With prices fixed, competitive tenders would then have become a beauty contest in which price was no longer a criterion. But the tariff was not successful because so many other obstacles to geothermal development were still in place. However, with a new geothermal law under discussion, in June 2014 MEMR issued a new regulation that restored the old tender mechanism, but now subject to tariff ceilings based on benefits (avoided costs).2 These tariff ceilings were based on benefits, and therefore provided for three tariffs depending on the type of connection: those to a large grid where geothermal would displace coal (Java-Bali, Sumatera); connections to smaller grids where base-load would otherwise be provided by small coal projects, and connection to small grids where the only other option is oil (Table 1.1).
2 ADB and World Bank, Unlocking Indonesia’s Geothermal Potential, February 2015

2
Table 1.1: Geothermal support tariffs (USc/kWh)
COD year
Region 1 (displacing large coal in large grids)
Region 2 (displacing
small coal in small grids)
Region 3 (displacing oil-
fired generation on small islands)
2015 11.8 17.0 25.4 2016 12.2 17.6 25.8 2017 12.6 18.2 26.2 2018 13.0 18.8 26.6 2019 13.4 19.4 27.0 2020 13.8 20.0 27.4 2021 14.2 20.6 27.8 2022 14.6 21.3 28.3 2023 15.0 21.9 28.7 2024 15.5 22.6 29.2 2025 15.9 23.3 29.6
Source: Ministry of Energy and Mineral Resources (Ministerial Regulation No. 17/2014)
Small Hydro
6. The Ministerial Regulation 12/2014 introduced a tiered FIT for small hydro projects of not greater than 10MW of Rp 1,075/kWh for the first 8 years, and Rp.750/kWh for years 9-20, adjusted by a regional weighting factor as shown in Table 1.2.3 The tiered structure suggests that the rationale for the FIT is based on the cost structure of IPPs, who require a higher tariff in the early years to secure adequate debt service cover ratios (DSCR) for financing.
Table 1.2: Regional adjustment factors for the small hydro FIT
Voltage of Electricity Network (Generating Capacity)
Location/Area Purchase Price (Rp.Kwh) F Factor Year #1 to Year #8
Year #9 to Year #20
F Factor
Medium Voltage (up to 10 MW)
Java, Bali, and Madura 1,075.0 x F 750.0 x F 1.00 Sumatera 1,075.0 x F 750.0 x F 1.10 Kalimantan and Sulawesi 1,075.0 x F 750.0 x F 1.20 Nusa Tenggara Barat and Nusa Tenggara Timur
1,075.0 x F 750.0 x F 1.25
Maluku and North Maluku 1,075.0 x F 750.0 x F 1.30 Papua and Papua Barat 1,075.0 x F 750.0 x F 1.60
Low Voltage (up to 250 kW)
Java, Bali, and Madura 1,270.0 x F 770.0 x F 1.00 Sumatera 1,270.0 x F 770.0 x F 1.10 Kalimantan, and Sulawesi 1,270.0 x F 770.0 x F 1.20 Nusa Tenggara Barat and Nusa Tenggara Timur
1,270.0 x F 770.0 x F 1.25
Maluku and North Maluku 1,270.0 x F 770.0 x F 1.30 Papua and Papua Barat 1,270.0 x F 770.0 x F 1.60
3 The previous Ministerial Regulation (4/2012) provided for a single tariff of Rp 1,004/kWh for
projects connected to low voltage, Rp 656/kWh for projects connected to medium voltage (22kV); plus regional multipliers F=1 for Java-Bali, 1.2 Sumatera and Sulawesi, 1.3 for Kalimanthan, NTB, NTT, 1.5 for Maluku and Papua.

3
7. The 2010 tariff for small hydro was based on avoided cost, since the rate of remuneration was set as a fraction of PLN’s production costs.4 However, the 2012 regulations then set fixed tariffs no longer dependent on a PLN calculation for the region in question, and the 2014 regulation introduced the tiered structure.
Solar PV
8. The primary driver for the deployment of PV systems installation in Indonesia is PLN’s plan to install 620 MW of PV by 2020.5 With the formation of a new Government in 2014 the initial indications are these may be further increased. To date the deployment of solar photovoltaic (PV) based power generation in Indonesia has been relatively modest. The installed total PV capacity across the country in 2014 is estimated to be around 30-40MW. The majority of this capacity has been installed either in off grid systems or in weak grid areas in Java, Bali and South Sumatra. This installed PV has been deployed largely through programmes directly run or supported by the Ministries of the Government of Indonesia or through associated government agencies such as PLN. 9. The three primary initiatives deployed in Indonesia for increasing the uptake of PV are as follows: Photovoltaic Village Power (PV-VP): Dec 2012 to Mar2013
• EBTKE funded rural electrification in off-grid communities • 112 small (15kW) standalone PV/battery systems • A total of 21 supply and installation contracts were awarded to 11 local contractors • Generally successful program but some significant issues at some sites with installation
quality, land acquisition, and community engagement. • This is essentially a grant program, without a tariff and cost recovery
PLN Thousand Islands: Diesel Generation Replacement (2013-2014)
• PT Perusahaan Listrik (PLN) program • Aim is to reduce diesel consumption in many of their small remote diesel power plants
through hybrid solar power solutions. • The initial pilot phase consists of 94 locations in Nusa Tenggara Timur (NTT) with
capacities of 200 kW on average. • Financing assistance through German government-owned development bank KfW for
pilot sites • Local and international companies to be invited to participate in tenders in late 2014. • The rollout of this program has only just commenced and only a handful of systems have
been installed. Solar PV PP Tariff (MEMR Regulation No 17 Year 2013)
• Ceiling Feed in Tariff of 0.25 USD/kWh with bonus 0.05 USD/kWh for local content > 40%
• Ceiling price applied through online bidding process based on annual capacity quota • 20 year PPAs with PLN • Focus is on network support and diesel generation reduction for small to medium
networks
4 Ministerial Regulation 4/2010
5 PLN Development Plan. Presentation: Moch. Sayan. PT PLN (Persero), Solar Workshop, Jakarta 8th February 2013

4
• Initial target of 140MW across 80 locations in western and eastern regions with Java excluded
• Sites and maximum capacity per site selected by PLN and the capacity per site not expected to exceed 5MW
• These systems are grid connected without energy storage. • Uptake of the program by IPPs has been slow and to some extent this has been as a result
of problems with site selection, lack of solar resource data availability, grid interconnection, and limited bid preparation time. In late 2014 only 5 sites, each of 1MW were installed and operating.
Biomass/biogas
10. Government of Indonesia has obliged PLN to buy electricity from renewable energy power plants with up to 10 MW capacity, including biomass and biogas power plants. The energy tariff for Biomass (PLTBm) and Biogas (PLTBg) power plant (up to 10 MW) based on MEMR Regulation 27/2014, is shown in Table 1.3.
Table 1.3: FIT for biomass/biogas
Biomass (PLTBm) Biogas (PLTBg) Medium Voltage 1,150/kWh x F 1,050 x F Low Voltage 1,500/kWh x F 1,400 x F
Where the regional adjustment factor F is: F = 1 for Java F = 1.15 for Sumatera F= 1.25 for Sulawesi F = 1.3 for Kalimantan F= 1.5 for Bali, Bangka Belitung, and Lombok F = 1.6 for Riau Islands, Papua, and other islands.
11. For load following power plants, the additional incentive (ILF/Incentive for Load Follower) is given as shown in Table 1.4.
Table 1.4 : Incentive for load following projects
Biomass (PLTBm) Biogas (PLTBg) Medium Voltage Rp. 80/kWh Rp. 70 x F Low Voltage Rp. 100/kWh Rp. 90 x F
12. The tariff is valid for 20 years following the commercial operation date (COD). PLN may purchase electricity from PLTBm/PLTBg at higher price, which is based on the Self-Estimated Price (HPS) determined by PLN, with the approval from the Minister.
1.3 RELEVANT LESSONS OF PAST INDONESIAN RENEWABLE ENERGY
EXPERIENCE 13. The past experience in Indonesia allows several important lessons:
• Stakeholder consultations: The 2012 FIT for geothermal was promulgated without meaningful stakeholder consultation. The importance of such consultation has now been recognised, and the issuance of the 2014 geothermal tariff benefitted greatly from a series of stakeholder consultation meetings. A similar process is now also underway for the wind and solar PV tariffs.
• MoF: MoF is a particularly important stakeholder because until such time as a fully cost-reflective tariff is achieved, MoF bears the incremental costs of renewable energy. Its

5
views are therefore critical to the success (or lack of success) of a support tariff. The recent experience with the geothermal tariff shows that the main concern is not so much the actual level of the tariff, but that there is transparency, accountability and preferably competition in setting them.
• Size thresholds: The recent experience with the solar programme, where each small project was been individually tendered, suggests the need for a more careful balancing of the benefits of competition against the transaction costs. Size thresholds are already in place for small hydro and biomass projects, below which a fixed tariff is available without the need for competition.
• Need for adjustment: For both small hydro and biomass/biogas, the FITs have been revised every few years to reflect the changing circumstances, and inflation. The tariff for wind and Rooftop PV will need similar regular review and adjustment.

6
2. OPTIONS FOR THE DESIGN OF RE SUPPORT TARIFFS ______________________________________________________________________________________
2.1 GENERAL PRINCIPLES OF RENEWABLE ENERGY TARIFF DESIGN 14. The general principles of renewable energy tariff design are well understood:
• Promoting the development of a particular resource with a preferential tariff simply because renewable energy resource exists is not a rational objective: one must always evaluate a resource in the context of other options that may serve the objective (such as carbon reduction) at lower cost.
• The methodology for tariff issuance should be transparent (and documented as part of a tariff issuance)
• The methodology should promote economic efficiency (though mindful of the tradeoffs between benefits of competition and transaction costs)
• Stakeholders should be consulted (consensus is not always achievable, but concerns should be addressed)
• Impacts on stakeholders should be understood (and wherever possible, quantified) • Recovery of any incremental costs should be transparent and credible to lenders • Should be consistent with legislative requirements • Should be adaptable to changed circumstances (methodology should provide for review
and updating) 15. Renewable energy tariffs fall into four main categories:
• Tariffs defined by Ad hoc project-by-project negotiation. • Published tariff based on estimated production costs • Published tariff based on avoided costs (i.e. based on benefits) • Tariff based on competitive tender (that may or may not be subject to ceilings)
16. Several options for providing access to a preferential tariff are in use:
• All served: the best example is that of Germany, whose wind feed-in tariff is available to anyone who meets the technical standards for connection. If the tariff is generous the result may be much larger quantities of renewable energy than expected, which may result in very high incremental costs to be absorbed by Government or by consumers (in the form of a surcharge).6 This is the approach used in Indonesia for small hydro and biogas.
• First come, first served (until a predetermined quote is met): where a maximum MW or GWh target is set to limit the incremental costs. Under this system, licences to connect are awarded on a first come, first served basis until the quota is filled. This is economically inefficient because there is no guarantee that the best projects are registered first. Nevertheless, because it avoids the transaction costs of competitive tenders, this approach is in widespread use (Sri Lanka, Vietnam, Philippines).
• Access limited to the winners of competitive tender – the system for Indonesia geothermal, and also widely encountered in international practice (Latin America, South Africa, and China before introduction of feed-in tariff).
6 In Germany, residential consumers now pay almost 5USc/kWh just for recovery of the FIT, and so
pay a total tariff of almost 25USc/kWh.

7
The general lessons of the international experience
17. The following lessons can be drawn from the general international experience
• Recovery of incremental costs: transparency in how the incremental costs of renewable energy are recovered is essential. In Indonesia this is well established at the present time: MoF absorbs the incremental costs by increasing the subsidy to PLN. However, as cost-reflective tariffs are introduced, these costs will be absorbed by the consumers. There are no plans in Indonesia for a renewable energy “Fund” to cover the incremental costs (as for example is the case in Malaysia, where the incremental costs of the FIT are covered by a consumer levy)7
• Competitive tenders: Most countries have size thresholds below which competitive tenders are not required. The major problem with competitive tenders is not collusion to fix prices at levels close to any announced ceiling, but unrealistically low bids, that result in projects that are un-bankable at the bid price (a problem encountered small geothermal projects) This also was a major problem in China, and many doubt whether the low prices bid in recent Brazilian and Peruvian wind power auctions can actually be implemented at the bid price). The best mitigant to avoid low bids from unqualified parties is to impose significant bid bonds (consistent with the generally recommended procurement guidelines of ADB and the World Bank)
• Avoid ad hoc negotiations with developers – instead adopt a simple published tariff applicable to all, with a standardized PPA. Both Sri Lanka and Vietnam are successful examples of where an avoided cost tariff and a standardised PPA replaced ad hoc negotiation.
• The Government should take the lead in the development of high quality natural resource data – and make it available in the public domain – to make realistic assessments of potential.
• Tariff setting is not a one-time exercise – there must be a process, involving stakeholders – not just for the initial tariff-setting, but for regular updates.
Feed-in tariff design
18. Two approaches are in general use for setting feed-in tariffs: based either on estimated production costs for the technology in question, or based on the benefits of the technology. Both have advantages and disadvantages. 19. The production cost approach requires the Government to estimate costs of production, and then add a “reasonable” rate of return. But required rates of return depend upon risk assessment, and may be difficult for Government to assess. Table 2.1 summarises the advantages and disadvantages of production cost based FITs
Table 2.1: Advantages and disadvantages of production cost-based FITs
Advantages Disadvantages Quick way to reach high targets What is a “reasonable” rate of return? Favoured by developers Information asymmetry (Government can never know
what production costs really are) Set tariff too high, developers make large profits. Set tariff
too low, no takers Economically inefficient (no guarantee that costs are less
than benefits). Difficult to control supply
7 The costs of the FIT are recovered by a 1% levy on all electricity customers who consume more than
300kWh/month, or whose bills exceed 37 Ringit/month ($10.60).

8
20. One issue for production cost based FITs for intermittent renewable energy – and especially wind – is the absence of any capacity benefit because wind farms may not be producing during peak hours. It is sometimes observed that wind is competitive with thermal energy because levelised costs of production are comparable – but this takes no account of the incremental costs imposed on the buyer to add additional capacity to cover peak periods. 21. A further problem is that generation costs of renewable energy are highly dependent upon the quality of the resource – where wind speeds are good, the levelised production cost is low, where wind speeds are poor, production costs are high. This is a problem for a production-cost based FIT, which therefore requires a tariff that is itself a function of achievable capacity factor, an approach first used in Germany. 22. But this is not economically efficient, because it makes no economic sense to reward the development of poor sites with a high tariff, and good sites with a low tariff. Indeed, this was adopted in Germany for reasons of equity, to spread the impact of incremental costs among the regions.8 This is a luxury of the rich: for a developing country such as Indonesia the incentive must be to develop the best sites first. Consequently we recommend against a capacity factor dependent FIT in Indonesia. 23. Production cost-based FITs are also adjusted to reflect other Government objectives – such as bonuses for particular variants of a technology, for local assembly or manufacture of equipment components, or for particular regions whose development the Government wishes to prioritise (see Box 1 for the Malaysian example of such incentives).
Box 1: The Malaysian PV tariff
The Malaysian Renewable Energy Act of 2011 (Act 725) introduced FITs for a range of renewable energy technologies (but not wind). The basic rate for solar PV, to be offered for 21years, is as follows capacity of: Ringgit/kWh USc/kWh <=4kW 1.23 35.4 >4kW-24kW 1.20 34.5 >24kW-72MW 1.18 33.9 >72KW-1MW 1.14 32.8 >1-30MW 0.95 27.3 >10-30MW 0.85 24.4 Exchange Rate: 1$US = 0.2875 Ringgit In additional there are bonuses payable for any of the following Ringgit/kWh USc/kWh use as installations in buildings or building structures 0.26 7.48 use as building materials 0.25 7.19 use of locally manufactured or assembled solar PV modules 0.03 0.86 use of locally manufactured or assembled solar inverters 0.01 0.29 The FITs are also subject to a fixed annual rate of degression of 8%
24. A similar problem relates to scale. Many RE technologies are subject to significant economies of scale, so in a desire to avoid “excess” profits that would arise with a single one-size- 8 The bulk of Germany’s wind capacity was built in the Northwest coast, where the wind regime is
best: the new provisions were designed to encourage development in the interior regions of Germany, where the wind regime is less good.

9
fits-all tariff, the FIT is gradated by size categories – again as exemplified by the Malaysian solar PV tariff (see Box 1). 25. These problems are avoided by a FIT based on benefits. There are several components to benefits: the avoided financial cost of generation, GHG emissions reduction, energy security, local environmental premium and local economic development. The avoided cost of thermal generation is the largest component of the total benefit.
Table 2.2: Advantages and disadvantages of FIT based on benefits
Advantages Disadvantages Economically efficient (costs never exceed benefits): will prevent the development of some high cost projects.
Sometimes misunderstood (as in 2012 Indonesia FIT for geothermal)
PLN’s costs (the avoidance of which constitutes a financial benefit to renewable energy) are known much better by Government than the actual costs of the RE technology.
Prices may be volatile (but can be mitigated by cap & collars)
Technology neutral, direct link to objective Avoids Government’s need to determine “reasonable” rates of return
26. This approach can be used both to set tariff ceilings (for competitively bid projects), as well as to set a FIT (for non-competitive project allocation) – in either case it assures that costs do not exceed benefits. We recommend this approach for both Indonesian wind and Rooftop PV projects. 27. The calculation of benefits, specifically the avoided cost of generation, should be in terms of economic rather than financial prices. For example, on Java, wind as well as PV projects will mainly displace gas generation. But in the absence of a formal gas-pricing framework, PLN has negotiated many different gas supply agreements (GSA), whose prices are significantly below international prices.9 Even if domestic pipeline gas cannot be equated to the international market price that PLN pays for LNG, at the very least the price of domestic gas should reflect the depletion premium.
2.2 OPTIONS FOR INDONESIA The following questions must be answered for the support tariff (and indeed these apply not just for the recommended benefits-based approach, but apply equally to production cost based FITs):
• The Numeraire: Should the tariff be issued in Rupiah or in US$. Tariffs in US$ in effect passes the foreign exchange risk to the buyer. Geothermal projects and large thermal generators have PPAs with PLN denominated in US$, small renewables (<10MW) in Rupiah
• Transition arrangements: If a new tariff is to be issued, how will this be applied to projects that are already under development, and which may already be in negotiations with PLN for a PPA?
• Size thresholds: In the case of small hydro and biomass, the FIT is offered only to projects below some size threshold, above which tariffs are negotiated. Should this also be applied to Wind and Rooftop PV?
9 See detailed discussion in Section 3

10
• Competition: There are significant transaction costs associated with competitive tenders. The international experience confirms that for small projects, the benefits of competitive tenders rarely exceed the transaction costs (an experience confirmed by the problems with the Indonesian PV program).
• Transmission connection: The ADB/World Bank recommendation in the case of geothermal projects is that the transmission connection from the generating station to the nearest grid substation be the responsibility of the developer, with cost recovery in additional to the agreed bid tariff (as a non-escalating adder for 5-10 years). This also protects developer against the possibility that the line is not ready on the COD of the generating project. The question is whether there should be some threshold distance to the connection point, beyond which the costs are not included in any bid price or FIT. There is no reason why this approach should not also apply to wind projects. However the basic economic problem for transmission lines for wind projects is low capacity factors – need evacuation capacity for maximum output, but average capacity factors may only be 20-35%, compared to 90% for geothermal.

11
3. METHODOLOGY ___________________________________________________________________________________ 28. The recommended methodology rests on the following principles
• For competitively tendered projects, the bid price shall not exceed a tariff ceiling that should be set on the basis of the island-specific economic benefits.
• For projects with PPAs that are currently under negotiation (if any), the negotiated tariff shall not exceed the same ceiling price.
• For small projects to benefit from a fixed FIT, the FIT shall be also based on the island-specific economic benefits
• The threshold for competitively bid projects shall be capacity greater than 10MW 29. This Section describes the methodology by which the economic benefits are to be established. This follows closely the methodology for the geothermal tariff issued in June 2014. However, because both PV and wind are intermittent, the composition of benefits will be somewhat different to geothermal, which has base load characteristics. 30. The benefits of renewable energy to Indonesia consist of the following:
• The avoided cost of energy displaced. • The avoided cost of capacity displaced (if any) • The avoided cost of greenhouse gas emissions • The avoided cost of local air pollutants (PM10, SOx, NOx) • The avoided costs of any transmission & distribution losses (which are relevant in the
case of rooftop PV) • A premium for local economic development multiplier effects (to reflect the
importance assigned by Government particularly to eastern island economic development).
• A premium for energy security 31. As noted, in all cases the avoided costs should be measured at economic rather than financial prices. In other words, where PLN purchases fossil fuels at a price lower than the border or import parity price, there is a loss to the Government, in effect a subsidy to PLN and its consumers – the avoidance of which is a further benefit to Indonesia that should be reflected in the tariff. Thus the avoided costs of energy displaced consist of two parts – PLN’s avoided financial cost of fuel and the Government’s avoided subsidy. 32. The above-listed benefits must be offset by the following incremental costs
• The costs of grid integration (if any) • The cost of incremental transmission costs
33. This approach of setting tariffs equal to benefits avoids the need for Government to estimate production costs and to set a “fair” rate of return, and avoids the need to deal with all of the other complexities of estimating production costs.

12
3.1 AVOIDED ENERGY COSTS 34. The avoided energy cost of thermal energy is the largest single component of benefit. But the mix of thermal energy that is displaced by renewable energy will vary from place to place. In Java and Sumatra, wind and roof-top energy will mainly displace gas; in Sulawesi, a mix of oil and gas; and in most of the small eastern Islands, mainly oil. For example on Sumba – an Island for which wind power is being considered, wind power would displace mainly energy produced by diesel generators running HSD.
Stakeholder comment #1: VAT Exemption
Comment (from a wind developer) We understand the difficulties in assessing the net tax impact for GoI taking into account reduced revenue sharing benefits on displaced fuels. However, as the displaced fossil fuel does not disappear but can be sold elsewhere or at another time, we suspect there is a net positive impact for the government. As such, we ask for a recommendation for a full and automatic VAT exemption for wind farms which makes sense (a) because it is otherwise not recoverable (no VAT on PPA) so it is a negative incentive and (b) it is not related to the amount of fuel displaced by wind energy Reply VAT exemption would indeed make wind energy projects more attractive under a fixed tariff, and make bid tariffs lower in a competitive tender. However, ad hoc VAT exemptions, no matter how worthy an individual cause may be, is never good public policy. If a VAT exemption were granted for wind, then why not also for large hydro, geothermal and other forms of renewable energy? A general VAT exemption for all renewable energy may however be considered (for example, as was recently introduced in Tanzania). 35. What matters is to determine the marginal (highest cost) thermal generator that will be backed down when renewable energy generation enters the system. This has been determined by running the PROSYM optimal dispatch model used by PLN, for each of the systems most likely to be affected by renewable energy. These marginal generation costs are critically dependant upon fuel costs. The hourly wind10 and PV11 data is then superimposed on the dispatch results to determine the avoided thermal energy that is the basis for estimating the benefits: in effect the wind generation is treated as negative load. 36. Table 3.1 shows the fuel price assumptions for Java. One observes a very wide range of prices for domestic pipeline gas, in 2016 from as little as $2.67/mmBTU to a high of $8.60/mmBTU. Some of these prices are set to increase in 2020 and 2024, but it is clear that even if these prices reflect historical production costs, they are unlikely to reflect the long run marginal cost of production (i.e. the production costs of additional gas), much less reflect a depletion premium that should apply to any finite domestic resource. In other words, these financial prices underestimate the true economic cost to Indonesia, and hence undervalue the economic benefit of renewable energy. It may be noted that Indonesian coal purchased by PLN is now priced at international price levels, and any rational pricing framework for gas should be based on similar principles.
10 Hourly wind data for Java, South Sulawesi and Sumba were obtained from 3Tier. This data is
based on upper atmospheric measurements and numerical weather models. For South Sulawesi, the 3Tier wind data time series was adjusted based on on-ground wind measurements by Asia Green Capital (AGC) in Jeneponto. The South Sulawesi data series used for simulation was verified by AGC. A similar adjustment was performed for Sumba based on on-ground measurements by Winrock International.
11 Irradiance data used for PV modelling sourced from SolarGIS © 2014 GeoModel Solar

13
Table 3.1: PLN’s fuel cost assumptions: Java
2014 2016 2020 2024 MFO Rp/litre 5,893 5,893 5,893 5,893
US$/litre 0.5893 0.5893 0.5893 0.5893 US$/bbl 93.7 93.7 93.7 93.7 KCal/litre 9,095 9,095 9,095 9,095 $/mmBTU 16.3 16.3 16.3 16.3
HSD Rp/litre 8,440 8,954 10,078 11,343 US$/litre 0.844 0.8954 1.0078 1.1343 US$/bbl 134 142 160 180 KCal/litre 9,598 9,598 9,598 9,598 $/mmBTU 22.2 23.5 26.5 29.8
LNG $/mmBTU 16.63 16.63 16.63 16.63 Gas Muaratawar $/mmBTU 5.41 5.74 6.09 6.09 Priok $/mmBTU 5.75 6.69 6.97 6.97 CLGON $/mmBTU 6.23 10.61 11.26 11.26 MkarangGU $/mmBTU 8.12 8.61 8.61 8.61 CKRNG $/mmBTU 6.05 6.42 6.42 6.42 Muarakarang $/mmBTU 7.23 9.14 9.41 9.41 Tambaklo $/mmBTU 2.52 2.67 2.84 2.84 Grati2 $/mmBTU 6.55 6.30 6.69 6.69 Gresik34 $/mmBTU 8.60 10.30 10.30 10.30 Mkrng $/mmBTU 7.95 7.95 7.95 7.95 Gresik23 $/mmBTU 7.84 7.84 7.84 7.84 Gresik 1 $/mmBTU 7.84 7.84 7.84 7.84 Grati $/mmBTU 7.84 7.84 7.84 7.84 Coal Rp/kCal 143 151.7 170.7 192.2
kCal/kg 5,100 5,100 5,100 5,100 Rp/kg 729 774 871 980 $/ton 73 77 87 98 $/mmBTU 3.40 3.61 4.07 4.58
37. Gas supplies on some Islands are considered too small for liquefaction and export as LNG. But in the past few years small-scale gas liquefaction facilities have been developed even down to the scale of biogas plants, and several small scale LNG projects are in operation in China and even in Norway. For example, on Sulawesi, instead of feeding PLN’s gas fired generating plants, the gas could be piped instead to a coastal location, liquefied, and provided with sufficient storage to enable export shipment in economic quantities. 38. Table 3.2 shows the assumptions to calculate the import parity price. Normally at large scale projects, liquefaction costs are less than $1.5/mmBTU, but for small scale projects this can rise to $5.0/mmBTU (the assumption used for Sulawesi) On Java we assume a slightly lower liquefaction cost of $4.5/mmBTU.
Table 3.2: Netback price for domestic gas, $/mmBTU
Sulawesi Java LNG cost to PLN (at international prices) 16.6 16.6 Incremental transportation & storage -1.0 -0.5 Liquefaction -5.0 -4.5 Netback value 10.6 13.6

14
39. To illustrate the methodology, consider the 2016 Sulawesi grid. Week 11 is the windiest week of the year. Figure 3.1 shows the dispatch by generation type, taken from the ProSym model output. There is extensive use of MFO and HSD to meet the peaks, but gas is used throughout, even at night.
Figure 3.1: Sulawesi Dispatch 2016, week 11
40. If we superimpose the hourly output of 200 MW of wind generation, shown in Figure 3.2 in green at the top of the stack, this will displace the most expensive generation at the top of the stack – so HSD first (the most expensive), then MFO, and then gas.
Figure 3.2: Sulawesi 2016, week 11 dispatch with wind
41. Figure 3.3A shows the fuels displaced each hour of the week – the wind projects are seen to be operating at close to installed capacity (of 200 MW) for a substantial fraction of the time. By comparison, in Figure 3.3B we show the same chart for the least windy week (49)
0
200
400
600
800
1000
1200
1400
1 9 17 25 33 41 49 57 65 73 81 89 97 105 113 121 129 137 145 153 161
MW
COAL HYDRO GEO GASCC LNGCC GASOC LNGOC MFO HSD
0
200
400
600
800
1000
1200
1400
1 9 17 25 33 41 49 57 65 73 81 89 97 105 113 121 129 137 145 153 161
MW
COAL HYDRO GEO GASCC LNGCC GASOC LNGOC MFO HSD wind

15
Figure 3.3: 2016 Sulawesi Wind Displacement
A. Windiest week (11) B. Least windy week (49)
Stakeholder comment #2: Oil Price Forecasts
Comment: Given the recent decline in the world oil price, the $75/bbl oil price assumed for 2016 seems high. Reply: Forecasting oil prices is very difficult, and the track record of self-appointed experts often quoted in the media is poor. What one can say is that short-term price volatility is a poor guide to long term trends, which are shaped by the fundamentals of global energy demand and supply. We believe that the Government policy should be guided by the consensus long-term forecasts of the annual World Energy Outlook reports published by the International Energy Agency, which are relatively free from self-serving forecasts of producers, investment banks and some country Governments. That does not mean that the IEA forecasts will be correct, but only that they represent a reasoned view of the global community. Such forecasts do vary from year to year to reflect changes in the long term supply demand balance, so indeed tariffs should be updated annually to reflect these trends. In the absence of an official long-term oil price forecast by the Government of Indonesia (say by BAPPENAS or MoF), we therefore recommend the IEA “new policies” forecast as the basis (IEA also issues a forecast for “current policies” and the “450ppm scenario”, which can be used in any sensitivity analysis). We see as likely the gradual recovery of the oil price to $75 by 2016, and reverting to the IEA long-term price forecast by 2020. It is true that low prices may persist longer than this forecast proposes. However, there are any number of geopolitical scenarios that may cause prices to rise sharply, but as shown by the history of past oil price bubbles, they are as likely to burst and return to the long-term price trajectory as price collapses are likely to recover. 42. From these results follow the aggregate economic benefits of wind power on Sulawesi, using economic prices for the displaced fuels.
0
50
100
150
200
250
1 9 17 25 33 41 49 57 65 73 81 89 97 105 113 121 129 137 145 153 161
MW
COAL HYDRO GEO GASCC LNGCC GASOC LNGOC MFO HSD
0
50
100
150
200
250
1 9 17 25 33 41 49 57 65 73 81 89 97 105 113 121 129 137 145 153 161
MW
COAL HYDRO GEO GASCC LNGCC GASOC LNGOC MFO HSD

16
Table 3.3: Value of displaced energy at border prices (Sulawesi, 200MW wind, 2016)
HSD MFO LNGOC GASOC LNGCC GASCC COAL total displaced by wind MWh 426,228 117,470 0 0 0 81,825 0 625,552 [%] 68.1% 18.8% 0.0% 0.0% 0.0% 13.1% 0.0% fuel cost $/mmBTU 23.5 16.3 16.6 10.6 16.6 10.6 4.5 efficiency efficiency 0.34 0.34 0.36 0.36 0.45 0.45 0.36 heat rate BTU/kWh 10,035 10,035 9,478 9,478 7,582 7,582 9,478 cost/kWh USc/kWh 23.6 16.4 15.8 10.1 12.6 8.1 4 $million 100.5 19.2 0.0 0.0 0.0 6.6 0.0 95.2 Average cost USc/kWh 15.22 GHG emissions USc/kWh 2.4 2.54 1.78 1.78 1.21 1.21 2.73 2.24
43. However, by 2020, much of the diesel will have been replaced, and therefore wind will now displace mainly gas (combined cycle pipeline gas 69.4%, and 27.5% open cycle LNG). The average avoided cost falls to 10.1 USc/kWh (Table 3.4). Little changes by 2024, the proportions displaced by wind remaining much the same, with 11.6 USc/kWh as the average avoided cost. 44. It should be noted that these avoided cost calculations for 2016, 2020 and future years are based on projected changes in fuel mix as specified in PLN’s RUPTL-2014 document. Between 2016 and 2020 the fuel mix changes in Sulawesi are substantial as all HSD and MFO generation is phased out: if these favourable fuel mix changes are not realized, then the avoided cost will be much higher. Table 3.4 shows the mix of energy displaced in Sulawesi by 2020 – very little oil (MFO and HSD) remains (just 356MWh of HSD and no MFO).
Table 3.4: Value of displaced energy at border prices (Sulawesi, 200 MW wind, 2020)
HSD MFO LNGOC GASOC LNGCC GASCC COAL total displaced by wind MWh 356 0 172,192 0 12,679 434,206 6,089 625,522 [%] 0.1% 0.0% 27.5% 0.0% 2.0% 69.4% 1.0% fuel cost $/mmBTU 23.5 16.3 16.6 11.6 16.6 11.6 4.1 efficiency efficiency 0.34 0.34 0.36 0.36 0.5 0.5 0.36 heat rate BTU/kWh 10,035 10,035 9,478 9,478 6,824 6,824 9,478 cost/kWh USc/kWh 23.6 16.4 15.8 11.0 11.3 7.9 4 $million 0.1 0.0 27.1 0.0 1.4 34.5 0.2 63.4 Average cost USc/kWh 10.1 GHG premium USc/kWh 2.4 2.54 1.78 1.78 1.21 1.21 2.73 1.38
3.2 AVOIDED CAPACITY COSTS 45. Neither PV nor wind is dispatchable, and therefore cannot be assumed to contribute to meeting the system peak load. This is unlike geothermal energy, which as base load (geothermal plants have annual load factors of 90%) will replace base load capacity. The extent of the capacity value for intermittent renewables is controversial, and will depend on a number of factors such as the level of penetration of the renewable energy, the characteristics of the load curve, and the extent of diversity in renewable generation. However, in Indonesia, the prudent assumption for setting tariffs is that the capacity value is zero.

17
3.3 AVOIDED COSTS OF GHG EMISSIONS 46. The basis for the avoided global externality benefit should not be the current market price for CO2 in global carbon markets, because these prices are highly volatile, and do not reflect the actual global social cost of carbon (GSCC). 47. Since many larger renewable energy projects in Indonesia will benefit from concessionary finance offered by the global community, it is reasonable that the value of avoided GHG used in the tariff calculation is consistent with typical GSCC valuations used by the World Bank and ADB, currently around $30/ton CO2. This value has already been adopted in setting the geothermal avoided cost tariff, and should therefore also be used for the wind and solar PV tariffs. 48. As shown in Table 3.5, the valuation in US¢/kWh will depend on the fuel and the heat rate. At $30/ton CO2, this ranges from 3.99 US¢/kWh in inefficient small coal projects now being considered in the Eastern Islands, to 1.21 US¢/kWh for gas combined cycle. 49. It is reasonable to ask why Indonesia should bear the cost of GHG emission reductions. Under the Kyoto Protocol, Indonesia is not an Annex I country, and is not therefore obliged under the treaty to reduce its GHG emissions. However, even if not mandated by international treaty: • Recognising the strong increase in GHG emissions due to increased coal use, and as a
responsible global citizen, Indonesia has made public commitments to reduce its GHG emissions.
• When funding geothermal projects, global climate funds, and the multilateral development banks through which they are usually routed, generally require commitments to reduce GHG emissions, and an implicit or explicit valuation of these benefits.
Table 3.5: Impact of GHG valuations
large coal small coal gas combined
cycle
gas open cycle
MFO diesel HSD
USc/kWh USc/kWh USc/kWh USc/kWh USc/kWh USc/kWh IPCC default emission Kg/GJ 96.1 96.1 56.1 56.1 80 74.1
efficiency 0.38 0.26 0.50 0.34 0.34 0.34 Heat rate KJ/kWh 9,474 13,846 7,200 10,588 10,588 10,588
Kg/kWh 0.910 1.331 0.404 0.594 0.847 0.785 $/ton 0 0.00 0.00 0.00 0.00 0.00 0.00
10 0.91 1.33 0.40 0.59 0.85 0.78 20 1.82 2.66 0.81 1.19 1.69 1.57 30 2.73 3.99 1.21 1.78 2.54 2.35 40 3.64 5.32 1.62 2.38 3.39 3.14 50 4.55 6.65 2.02 2.97 4.24 3.92 60 5.46 7.98 2.42 3.56 5.08 4.71

18
Box 2: Global social cost of carbon (GSCC)
The literature on the GSCC is growing, with estimates ranging from a small net benefit to costs of several hundred dollars a ton. Thus almost any estimate would find some support. Tol’s 2008 meta-analysis of the peer-reviewed literature12, which updated an earlier 2005 meta analysis, cites 211 studies, and found an average estimate of 120 $/ton carbon ($33/ton CO2) for studies published in 1996-2001, and $88/ton carbon ($24/ton CO2) for studies published since 2001. Tol concluded in the 2005 study that “it is unlikely that the marginal damage costs of emissions exceeds $50/ton carbon ($14ton/CO2) and are likely to be substantially lower than that”. Much of the economics literature on the subject is highly technical, particularly with respect to the choice of discount rate and assumptions about future global economic growth and income inequalities: in general one can say that the lower the discount rate, the higher is the social cost of carbon (a value that may also change over time). The high valuation of the Stern Report (“the current social cost of carbon might be around $85/ton CO2”)13 is largely a consequence of the use of a very low discount rate. 14 The 2007 IPCC report highlighted the wide range of values of the GSCC in the literature as being in the range of 4 – 95 $/ton CO2. Carbon valuations in World Bank studies and project appriasals
Country $/ton CO2
Study Reference
India 32 Policy study (2010) G. Sargsyan et al., Unleashing the Potential of Renewable Energy in India, World Bank, 2011
Vietnam 30 Trung Son hydro project World Bank Project Appraisal Document, 2010 South Africa 29 Medupi coal project World Bank Project Appraisal Document, 2011. Morocco 30 Ourzazate I CSP World Bank Project Appraisal Document, 2011
In the United States, regulatory impact analysis requires consideration of the social cost of carbon,15 using a range of discount rates (from 2.5% to 5%), with values that increase over time. For example, at 5% discount rate the valuation is $12/ton in 2015, rising to $27/ton by 2050; at 2.5% discount rate the valuation rises from $58 to $98/ton by 2050. In the UK, the Department of Environment recommended in 2007 a value of £25/tonCO2 ($37/ton);16 this was subsequently updated to a time-dependent system ranging from £23/ton CO2 in 2015 rising to £48/ton by 2025 ($36 – 76/ton CO2) The World Bank has recently issued guidance for the value of social cost of carbon to be used in project appraisal, which calls for $30/ton in 2015, increasing to $50/ton in 2030, and $80/ton in 2025 (expressed at constant 2014 prices).17
12 R. Tol, The Social Cost of Carbon: Trends, Outliers and Catastrophes, Economics e-Journal 2008. R. Tol, R.
The Marginal Damage Costs of Carbon Dioxide Emissions: An Assessment of the Uncertainties, Energy Policy, 33, 2064-2074, 2005
13 N. Stern, 2007. The Economics of Climate Change: the Stern Review, Cambridge University Press.
14 For a good discussion of these issues, and a review of the assumptions in the Stern Review, see, e.g., C. Hope and D. Newbery, Calculating the Social Cost of Carbon, Cambridge University Electricity Policy Research Group 2007 (also in Michael Grubb, Tooraj Jamasb and Michael G. Pollitt,, editors, Delivering a Low Carbon Electricity System: Technologies, Economics and Policy, Cambridge University Press)
15 Interagency Working Group, Technical Update of the Social Cost of Carbon for Regulatory Impact Analysis under executive Order 12866, May 2013
16 DEFRA, The social cost of carbon and the shadow price of carbon, December 2007; Department of Energy & Climate Change, 2011. Carbon Appraisal in UK Policy Appraisal: A Revised Approach :A brief guide to the new carbon values and their use in economic appraisal.
17 World Bank, Guidance Note on the Social Value of Carbon in Project Appraisal, CCGCE, September 2014

19
50. Note that this valuation of the global social cost of carbon (GSCC) is unrelated to any financial benefit that may accrue to the developer from the sale of carbon credits under the Clean Development Mechanism (or any successor to it). The GSCC is included in the calculation of the avoided cost ceiling regardless of whether the developer benefits from any carbon revenue - which should be to his benefit (although subject to whatever taxes are levied by the Designated National Authority (DNA) on sales of certified emission reductions, and any income tax levied on the additional profit derived from their sale). Most countries with standardised PPAs for renewable energy stipulate that any carbon sales revenue as may be collected by the developer are for the developer to keep, and does not reduce the tendered price. 51. It may be supposed that this raises the potential issue of double counting – since the avoided cost of GHG emissions is already included in the tariff ceiling (and paid for by Government in the higher tariff), should not any CER revenue accrue to the Government rather than the developer? However, there are several reasons why CER revenue should accrue to the developer:
i. If the CER revenue accrues to Government, there is no incentive for a developer to incur the significant transaction costs of CDM registration.
ii. At the time of tender it is hard to gauge what CER revenue would actually be realised, so many years in advance.
iii. Even if the ceiling price includes the avoided cost of GHG emissions, this is only the ceiling price – bid prices may be significantly lower.
3.4 LOCAL ENVIRONMENTAL EXTERNALITIES 52. It is widely acknowledged that fossil fuel combustion also results in local environmental impacts, particularly from the local air emissions (NOx, SOx and particulates). However, the valuation of the damages is controversial, because the main share of the impact is human health, which in turn depends on monetisation of mortality and morbidity. 53. The question of the extent to which avoided local environmental impacts can be monetized has been discussed in some detail in our geothermal tariff report.18 In the case of geothermal, which displaces coal, the pollutants of concern include particulates, SOx and NOx. But on Java, wind and rooftop PV will displace gas, whose emissions of SOx and particulates are very small, so the avoided local damage cost will also be small. Only on the Eastern Islands, where mainly diesel oil is displaced, would particulates be an issue, and, depending on sulphur content, SOx emissions. 54. On this question we conclude as follows:
• Until there is a credible health damage assessment conducted for Indonesia, that is based on local epidemiological and health data, valuations of the local environmental impact based on the benefit transfer method are unreliable and not credible.
• In the case where the avoided fuel is mainly oil, a de minimus charge of 0.1 US¢/kWh may be included, in recognition that the avoided environmental impacts are not zero, and as a placeholder for possible future inclusion.19 Where the displaced fuel is mainly gas, no premium is added.
• The potential impact of such a de minimus charge on PLN’s purchase costs is negligible. 18 ADB and World Bank, Unlocking Indonesia’s Geothermal Potential, March 2015.
19 We take this as zero where the avoided thermal fuel is gas, in recognition that emissions from oil plants are significantly higher than from gas.

20
3.5 LOCAL ECONOMIC DEVELOPMENT 55. In 2014 when the geothermal tariff was under consideration by MEMR, it was determined that geothermal projects on the eastern islands would induce local economic development, through multiplier effects associated with expenditures in the region. For geothermal projects in eastern Islands, this calculated to 1 USc/kWh, and 1.8 USc for Java and Sumatera. This was lower in the eastern Islands, because it was judged that a substantial portion of the expenses in Indonesian currency would in fact be sourced from suppliers in Java and not directly benefit the local economy where the generation project is located. 56. Wind projects are much less employment intensive than geothermal. Based on the international literature, O&M employment per MW for geothermal is around 1.7 jobs/MW, compared to 0.15-0.4 jobs/MW for wind.20 Capital costs are also much lower for wind than geothermal, so local construction outlays are much lower. No detailed Indonesian studies are available, but we estimate that the local development benefits for wind will be around one third of those for geothermal. Therefore the wind FIT premiums calculate to 0.6 USc/kWh for Java (assuming these would be built on the South Coast of Java), and 0.3 USc/kWh for Sulawesi and small eastern islands. In the case of Rooftop PV on Jakarta, no local economic development premium is justified.
3.6 ENERGY SECURITY PREMIUM 57. The geothermal tariff included a premium to reflect energy security, calculated as MoF’s avoided costs of dealing with fuel price volatility: this was estimated at 0.68 USc/kWh (as being the cost of dealing with unexpected changes in the level of subsidy to PLN as a consequence of forecasting errors in face of price volatility in international energy markets).21 We assume that by 2020, the retail tariff will be fully cost reflective, and that MoF no longer needs to provide such subsidy: so from 2020 this premium is zero.
3.7 SYSTEM INTEGRATION COSTS 58. System integration costs are discussed in Annex I for PV and Annex II for wind In the case of PV and wind on Java, since the scale compared to the installed capacity on Java (and in the Jakarta region) is miniscule, we expect no material costs that need to be reflected in the tariff. For wind projects in Sulawesi we estimate these costs at $5/MWh (0.5USc/kWh), and $10/MWh for small eastern Islands (see table II.16 and discussion in Annex II).
3.8 AVOIDED TRANSMISSION LOSSES 59. Every kWh of electricity from urban rooftop PV displaces more than 1 kWh at the gas-fired generating plants because one also avoids the transmission and distribution losses normally 20 See, e.g., See, e.g., R. Bacon and Masami Kojima, Issues in Estimating the Employment Generated by
Energy Sector Activities, World Bank, Sustainable Energy Department, June 2011; or M. Wei, S. Patadia and D. Kammen, Putting Renewables and Energy Efficiency to Work: How Many Jobs can the Clean Energy Industry Generate in the USA, Energy Policy, 38 (2010) 919-931.
21 The logic is as follows: when fuel costs are underestimated, then additional funds have to be mobilized (borrowed) at short notice, which entails a financial cost to MoF. When fuel costs are overestimated, the funds set aside for the additional subsidy remain idle, and Indonesia loses the economic benefit of having invested these funds in some more productive use.

21
incurred between a generator and the consumer. These losses are estimated at 11% for the Jakarta metropolitan area, so the corresponding entry in the tariff table will be 0.11 of the avoided energy cost.
3.9 TARIFFS BASED ON BENEFITS 60. Based on these principles, the benefits of wind and PV have been calculated as shown on Table 3.6 to Table 3.9 below. These are all at constant 2015 price levels, except for column [4], which is the levelised nominal tariff (or tariff ceiling) as would apply to PPAs signed in 2016,22 and column [5], which shows the 2024 impact in $US million. The methodology for calculating the nominal levelised tariff is explained in Annex II.
Table 3.6: Benefits of Wind, Sulawesi, USc/kWh(1)
2016 2020 2024 levelised 2024 impact
[1] [2] [3] [4] [5] USc/kWh USc/kWh USc/kWh USc/kWh $USm Avoided fixed cost 0.00 0.00 0.00 0.00 0.0 Avoided variable cost 15.20 10.10 11.60 13.89 85.2 GHG emission premium 2.20 1.38 1.38 1.81 11.1 Local environmental premium 0.10 0.00 0.00 0.02 0.2 Local economic development 0.30 0.30 0.30 0.35 2.1 Energy security premium 0.68 0.00 0.00 0.17 1.0 Integration costs -0.50 -0.50 -0.50 -0.58 -3.6 Avoided transmission losses 0.00 0.00 0.00 0.00 0.0 Total benefit or ceiling 17.98 11.28 12.78 15.66 96.0
Note: (1) Assuming 200 MW at 35% capacity factor in place by 2024 61. Table 3.7 and 3.8 show the wind tariffs for Java and small eastern Islands. The wind tariff for Java is somewhat higher than Sulawesi because most of the displaced gas generation is in (older) open cycle projects, whereas on Sulawesi the displaced generation is in combined cycle projects (except for a few years until all HSD and MFO is phased out). There are also no significant system integration costs on Java.
Table 3.7: Benefits of wind: central Java, USc/kWh
2016 2020 2024 Levelised 2024 impact [$USm]
(1) USc/kWh USc/kWh USc/kWh USc/kWh $USm
Avoided fixed cost 0.00 0.00 0.00 0.00 Avoided variable cost 8.50 11.30 13.00 13.45 30.6 GHG emission premium 1.78 1.78 1.78 2.08 4.7 Local environmental premium 0.00 0.00 0.00 0.00 0.0 Local economic development 0.60 0.60 0.60 0.70 1.6 Energy security premium 0.68 0.00 0.00 0.17 0.4 System integration costs 0.00 0.00 0.00 0.00 0.0 Avoided transmission losses 0.00 0.00 0.00 0.00 0.0 Total benefit/ceiling 11.56 13.68 15.38 16.40 37.3
Note: (1) Assuming 100 MW at 26% capacity factor operating by 2024 22 This tariff is slightly higher than that presented for Sulawesi at the Stakeholder Consultation
meetings of February 2015 (14.2 USc/kWh). The reason is the revised methodology for calculating the tariff (now based on levelised values at the 10% discount rate rather than a simple average): this gives more weight to the early years when oil is displaced. The tariff for Java is marginally smaller (16.4 USc/kWh rather than the 16.7 USc/kWh of the preliminary estimate)

22
Table 3.8: Benefits of wind: Sumba
2014 2016 2020 2024 levelised 2024 impact $USm
(1) USc/kWh USc/kWh USc/kWh USc/kWh USc/kWh $USm Avoided fixed cost 0.0 0.0 0.0 0.0 0.00 0.0 Avoided variable cost 16.4 16.4 21.1 27.0 26.86 14.1 GHG emission premium 2.4 2.4 2.4 2.4 2.74 1.4 Local environmental premium 0.1 0.1 0.1 0.1 0.00 0.0 Local economic development 0.3 0.3 0.3 0.3 0.29 0.2 Energy security premium 0.7 0.7 0.0 0.0 0.17 0.1 Integration costs -2.0 -2.0 -2.0 -2.0 -2.05 -1.1 Avoided transmission losses 0.0 0.0 0.0 0.0 0.00 0.0 Total benefit/ceiling 17.8 17.8 21.8 27.7 28.01 14.7 Assumptions World oil price $/bbl 70.0 90.0 115.0 Delivered price to Sumba USc/litre 0.59 0.76 0.97 Diesel generation price $/kWh 0.16 0.21 0.27
(1) Assuming 20MW of small Eastern Island projects at 30% capacity factor 62. The benefits of wind on Sumba are strongly dependant on the diesel price, in turn dependent on the world oil price. We assume that the present oil price of $50/bbl slowly increases, reaching an average of 70 $/bbl in 2016, and returning to the IEA World Energy Outlook price forecast by 2024 (in real terms). Such forecasts are of course subject to high uncertainty, which underscores the need for MEMR to review the tariffs on a regular (annual) basis.
Table 3.9: Benefits of Roof top PV, Jakarta, 250MW
2016 2020 2024 levelised 2024 impact $USm
(1) USc/kWh USc/kWh USc/kWh USc/kWh $USm Avoided fixed cost 0.00 0.00 0.00 0.00 0.00 Avoided variable cost 8.50 11.30 13.00 13.45 41.24 GHG emission premium 1.20 1.20 1.20 1.40 4.29 Local environmental premium 0.00 0.00 0.00 0.00 0.00 Local economic development 0.00 0.00 0.00 0.00 0.00 Energy security premium 0.68 0.00 0.00 0.17 0.52 System integration costs 0.00 0.00 0.00 0.00 0.00 Avoided transmission losses 0.94 1.24 1.43 0.90 2.76 Total benefit/ceiling 11.32 13.74 15.63 15.92 48.80
(1) Assuming 250 MW Rooftop PV at 14% annual capacity factor

23
4. RECOMMENDED TARIFFS AND IMPLEMENTATION SCHEMES ___________________________________________________________________________
4.1 ROOFTOP PV 63. Solar Rooftop PV in Jakarta (or in other large cities on Java) is not economically viable; at a benefits-based tariff, no rooftop PV projects would be enabled; the production costs are significantly above benefits where the main thermal generation that is displaced is gas. Even large projects (>1MW) have production costs of 20 USc/kWh, some 6.4USc/kWh above the value of benefits (assuming a valuation of the avoided costs of CO2 emissions of $30/ton. Smaller scale projects would require even higher FITs to enable a significant number of projects. 64. It should be noted that solar PV is economic in many other applications where diesel fuel is replaced. On Eastern Islands, PV is economic both for grid-connected applications and for remote off-grid systems.
Justification for Rooftop PV
65. As shown in Section 5, because the difference between a tariff that will enable projects and a tariff based on benefits is so great, the impact on PLN, MoF or consumers will be high – some $33 million per year for a 250 MW program by 2024. In other words, PV is not economically viable when it displaces gas. In fact, to justify PV against gas requires valuations of GHG emission in excess of $143/ton, far in excess of the damage cost estimates even of IPCC or other authorities such as the Stern report (few of which imply valuations above $80/ton). Indeed, at such incremental costs, even carbon capture and storage would be a better approach for Indonesia to reduce its carbon emissions. 66. MEMR needs to consider why it should proceed with a support tariff for rooftop PV under these circumstances – particularly when Indonesia has other renewable energy resources – notably geothermal – that have a much lower incremental cost. One plausible case for a Rooftop solar PV support tariff based on production costs is that by enabling a large volume of PV, it will support the development and expertise of the domestic PV suppliers, who would then be in a better position to supply more cost-effectively the smaller PV systems for off-grid and eastern island applications, where PV is economic. However, such a rationale would need more careful consideration of whether the expectations of benefits were realistic and cost-effective (the assessment of which goes beyond the current terms of reference for our study). 67. That said, in the sections that follow, we provide the details of the recommended FIT design, if in fact MEMR decides to proceed with a rooftop PV program.
Feed in Tariff (FIT) design
68. The relatively high cost of PV generation and the low cost of electricity for consumers in urban areas of Indonesia means that without additional incentives a Rooftop PV program will see little uptake. The international experience shows that there is a range of incentive options available for deployment and that the selection of the appropriate options should be catered to suit the unique needs and circumstances under which they are deployed.

24
Stakeholder comment #3: Definition of Rooftop PV
Comment: In the context of a possible Rooftop PV program, MEMR requires that the term “Rooftop PV” should be more clearly defined. Reply: The term “Rooftop PV” is opened to a range of interpretations. The definition of “Rooftop PV” as provided in the body of this report is as follows:
A grid connected distributed photovoltaic power system on a residential, commercial or industrial premise.
In terms of Rooftop PV Program however such a definition still has very limited application. Rather, it is more useful to focus on the eligibility criteria that would be applied to a program. Detailed eligibility criteria will need to be determined by the agency who manages the program and will need to reflect the both overall goals of the program and clearly target the sectors of the community that will have access to any incentives that are deployed.
Examples of general eligibility criteria include that the Rooftop PV system should:
• Utilize approved PV system components • Meet all relevant Indonesian electrical standards • Be a minimum PV array size of 100kWp • Have approval by PLN for connection to the PLN network • Be connected to the PLN network via an approved meter • Be installed at the premise at which it is being metered • Be owned by the owner of the premise upon which it is installed or • Be owned by a third party who has the permission of the owner of the premise upon
which it is installed. 69. The following recommendations are based upon the premise that for the Indonesian market the Rooftop PV Program should deploy a set of incentives that are
• Effective at encouraging uptake of Rooftop PV • Easy to understand and administer for all stakeholders • Simple and transparent • Provide ongoing flexibility for program administrators to adapt as circumstances change
70. The establishment of an effective Rooftop PV program requires that broader regulatory and institutional frameworks be established. For the rollout of PV to be successful all key stakeholders must understand the program approach and have the necessary capabilities to meet the program requirements. These stakeholders include Government of Indonesia, PLN, financiers and the broader PV industry. The speed of the rollout of the program should not exceed the existing capabilities of these stakeholders and where deficiencies in capability are identified (i.e. policy, regulation, standards, skills, knowledge or training), efforts should be made to address these issues directly.
Feed in Tariff
71. The fundamental incentive for the Rooftop PV program should be a Feed in Tariff, which has three fundamental components:
1. FIT Rate. 2. FIT Quota 3. Metering Configuration

25
Proposed FIT Rate 72. The proposed schedule for FIT that is provided below is based upon financial modelling across a range of system sizes to determine the minimum FIT rates required to provide sufficient incentive for rooftop owners or third party investors to participate in a Rooftop PV program. The proposed FITs are significantly higher than the projected avoided cost benefit for Rooftop PV systems, however without this additional “gap” coverage, there is insufficient incentive for the broad investment in Rooftop PV.
Table 4.1: Baseline FIT Schedule for Rooftop solar
System Capacity (kWp) FIT (USD/kWh) FIT (IDR/kWh) 1-10 0.30 3,690
10-50 0.28 3,450 50-200 0.25 3,080
200-1000 0.22 2,710 > 1000 0.20 2,460
73. The quantum of the FIT varies depending on the kW capacity of the Rooftop PV System. The larger the PV system the, lower the FIT. This variability reflects the economies of scale that can be achieved on larger PV systems. Table 4.1 shows the minimum FITs required to stimulate involvement in the program for residential, commercial, and institutional investors alike. 74. The required FIT for small-scale (residential) PV systems is significantly higher than for commercial scale systems. If the focus of the GoI for the Rooftop PV program is on residential uptake, then the total cost for supporting the program would be significantly higher than for a commercial scale only program. Another hurdle to residential uptake of PV is the high upfront cost of PV systems. Even with a generous FIT the high capital cost may be a major constraint for residential customers, whose access to low cost finance is generally more difficult than for commercial scale system owners. 75. For a range of reasons, it would however be advisable for a Rooftop PV Program to initially focus on the larger commercial scale end of the market rather than on the smaller residential systems. Constraining access to PV systems of a minimum capacity of 100 kW has the following advantages
• Large-scale systems are more cost effective. The unit installation costs ($/W) are lower and therefore required FIT is lower and the required gap funding between the FIT and the avoided cost benefit is substantially less.
• The developers of commercial scale PV systems have better access to up front capital and low interest finance. The likelihood of uptake of the incentive is therefore greater.
• Reducing the overall number of PV systems reduces pressure on the nascent PV industry to meet the demand of the proposed PV program and allow it more time to develop
• Reducing the overall number of PV systems reduces the administration burden. Managing 100 PV systems in the 100 to 1000kW range is substantially simpler than managing several thousand systems of 10kW or less.
76. Over time, the program could be adjusted to gradually include systems less than 100kW so that by incremental steps the residential market gains access to the program. In the context of the ever-reducing cost of PV systems, this gradual inclusion of smaller systems over time could be done without any significant extra financial burden on the program. A revised FIT schedule targeting commercial PV deployment to the exclusion of residential would be as follows: 77. The FIT rates would be revised annually and adjusted based on the market response to the existing FIT, and the perceived changes to the costs and financing structures that underpin

26
FIT value. No additional degression rate is applied - if the tariff is maintained in nominal terms, then the tariff at constant terms would decrease and have a similar degressive effect.
Table 4.2: Commercial Scale Only FIT
System Capacity (kWp) FIT (USD/kWh) FIT (IDR/kWh) 100-200 0.25 3,080 200-400 0.24 2,950 400-600 0.23 2,830 600-800 0.22 2,710
800-1000 0.21 2,580 > 1000 0.20 2,460
78. Inclusion of an additional adder tariff on top of the main FIT for local content is also recommended. In other local PV schemes, this adder tariff was set to 0.05 USD/kWh (620 IDR/kWh). The final definition of exactly what constitutes local content is open to debate but in terms of consistency it would be advisable to follow the prescription laid out in the MEMR Regulation No 17 Year 2013, where access to the adder tariff required that the locally manufactured content of the PV system hardware was at least 40% of the total hardware cost. FIT Quota 79. For each year for the next five years an annual quota in MW should be set that provides a cap for the total capacity of new PV systems that will be eligible for a FIT for that year. The quota will provide an effective limitation on the total PV capacity to be installed each year. Each annual quota shall also be further distributed across the range of eligible PV system capacities. 80. At the completion of each year an additional annual quota will be added to the schedule such that the 5-year quota outlook is maintained. This will provide clear long-term assurance for the PV industry, potential investor, and to the Government of Indonesia on the maximum cost associated with the Rooftop PV program. Where an initial limitation of 100 kW is set on the PV system size, this capacity limit can be revised annually also and over time the addition of capacity quota’s and associated FIT for smaller capacity systems can be incrementally added. 81. Both the total quantum of the annual quota and its breakdown will have direct impacts on the total government budget that shall be required to support the Rooftop PV program. The larger the total annual quota and greater the allocated proportion of this capacity toward smaller scale systems the higher the cost of the program. 82. The annual FIT quotas should be set such that they do not greatly exceed the capacity of local PV industry to accommodate them. As such, they should start at the perceived capacity level of the PV industry and then be increased every year at a rate that would match the sustainable growth of the industry. The following tables provide an example of a 5-year FIT quota with incremental growth for a program that includes the full range of PV system capacities and a second table that shows the same annualized quotas but constrains access to systems larger than 100 kW only.

27
Table 4.3: Baseline FIT Quotas for Rooftop PV Program
Year
Total Eligible Capacity
(MW)
Breakdown of eligible capacity across FIT categories (MW)
0-10 1--50 50-200 200-1000 >1000
2016 50 5 5 12.5 12.5 15 2017 100 10 10 25 25 30 2018 150 15 15 37.5 37.5 45 2019 200 20 20 50 50 60 2020 250 25 25 62.5 62.5 75
Table 4.4: FIT Quotas for Commercial Scale Only Rooftop PV Program
Year
Total Eligible Capacity
(MW)
Breakdown of Eligible Capacity Across FIT Categories (MW)
100-200 200-400 400-600 600-800 800-1000 > 1000
2016 50 7.5 7.5 7.5 7.5 7.5 12.5 2017 100 15 15 15 15 15 25 2018 150 22.5 22.5 22.5 22.5 22.5 37.5 2019 200 30 30 30 30 30 50 2020 250 37.5 37.5 37.5 37.5 37.5 62.5
Metering Configuration
83. For the Indonesian Rooftop PV program, it is strongly recommended that a Gross Metering configuration be utilized in preference to a Net Metered approach. As described in detail in Annex I, PLN’s existing net metering scheme will not enable a significant number of Rooftop PV systems. Gross Metering with a FIT is by far the simplest and most transparent incentive mechanism available and is well suited to the Indonesia situation of low consumption tariffs and the electricity network being owned and run by a single government utility (PLN). 84. In terms of implementation it is important that access to the FIT be available for the both self-owned and third-party-owned systems. PPA agreements or their equivalent would be established with system owners that would provide access to the FIT for a period of 20 years. For self-owned systems some considerations should be given to loosen the PLN consumer billing restrictions that, as noted previously, provide a capacity limitation on self-owned PV systems. 85. For third party owners there are a variety of ways that such operators might engage with rooftop owners, PLN, and other stakeholders to create a workable deployment model for PV under the proposed FIT. It is likely that the primary investors would be set up as IPP that would lease roof space for PV systems in multi locations and sell the collective PV generation from these sites to PLN under a single PPA. However, other models would also be possible and some considerations shall need to be given in setting up the regulatory framework for the Rooftop program, such that innovative third party models can be deployed but that these same conditions cannot be unfairly exploited to the disadvantage of any of the key project stakeholders.

28
Stakeholder comment #4: Metering configurations
Comment: PLN has an existing net metering policy, which is their preferred configuration for any Rooftop PV Program. However, this report argues for gross metering. Why? Reply: In terms of an incentive for the uptake of PV, a Net Metering configuration generally relies on the offsetting of electricity import through self-consumption of the PV generation. Where the cost of importing electricity is high (>$0.20/kWh), this is an effective incentive. In Indonesia, the tariff paid by electricity consumers is between $0.06 and $0.13/kWh, so even with a generous FIT for the portion of generation that is exported, this is clearly too low to act alone as an incentive for PV uptake. Additional incentives, such as capital subsidies, may assist, but they require strong institutional and administrative arrangements to ensure that subsidies are not misused or misdirected. In contrast, a suitable FIT based on Gross Metering PV system output is by far the simplest, most effective, and most transparent incentive mechanism available for a rooftop PV program in Indonesia, and is thus strongly recommended. In further discussions with PLN, they now largely agree that Gross Metering is indeed the most effective option for the current Indonesian context and that with the correct guidelines, a Gross Metering approach can and should be deployed.
Other supporting policies
86. A Gross metered FIT is, when suitably sized, is a sufficient incentive mechanism on its own to promote the uptake of PV in the grid connected urban space. Other incentive mechanisms such as capital subsidy, loan subsidy and guarantee, tradable renewable energy certificates, and tax incentives, are also possible. These measures can be effective but add complexity, require additional administration, and provide further distortions to the market and should be avoided where effective alternatives are available. A number of additional supporting policies that should be considered is the implementation of green building codes, the removal of remaining import duties on PV hardware and the establishment of lines of credit for rooftop PV systems by key financial institutions. These options are described below.
Green building codes
87. The codes require that all new buildings must comply with minimum mandatory energy consumption standard. Compliance with the standard may be achieved through a range of measures including passive on site electricity generation by PV or other renewable or low carbon technologies. This activity would not fall under the Rooftop PV program but if it is adopted by Government of Indonesia, it would provide additional incentive for PV rollout.
Removal of Import Duties on PV Hardware
88. Duties of up to 20% are still applied on some PV components used by PV system installer, and PV modules sub components used by PV module assemblers. The removal of import duties on PV equipment will reduce the overall cost of PV systems and encourage the rollout of the PV technology in general. For PV module manufacturers this will reduce the cost of local assembled product and make them more competitive with imported PV modules, which are already at zero import duty. Like the adder tariff mentioned earlier, the impact of such an approach should be considered in the broader frame of the Government of Indonesia’s industry policies.

29
Project Financing Support
89. PV systems require very little in the way of on-going operation and maintenance and once installed the costs associated with ensuring these systems continue to run for over 20 years can be very low. In direct contrast to this, the upfront capital cost for PV systems is very high and this front loading of cost can be a major hurdle for investors and developers and negatively impact on the uptake of PV. The availability of affordable financing and established lines of credit is therefore an important element in ensuring the success of a Rooftop PV Program. 90. BNI and some of the other major Indonesian banks have “green lending” policies and are interested in setting up loan packages on reasonable terms for prospective investors in PV systems. A well-structured, long term and fiscally stable Rooftop PV Program that provides reasonable certainty to investors and lenders alike will reduce perceived risk and keep lending rates low. Engagement with key lending institutions to establish lines of credit and standardized loan packages for PV systems is an important aspect of the overall program development.
Institutional Arrangements
91. The three major government agencies identified as best suited for managing the carriage of a Rooftop PV Program MEMR, PLN and MOF. A general outline of the recommended roles that each agency would potentially occupy in the program are as follows
• MEMR: Policy development, program design, tariff setting and overall program direction
• PLN: Day to day operations including approvals, PV system and network assessments, construction standards, power purchase and connection agreements, payments of FIT (using funding supplied by MOF)
• MOF: Provision of program funding to cover both the operational costs and the funding required for PLN to make contracted FIT payments.
92. For the proposed program to succeed, the agreed roles and responsibilities of each agency would need to be clearly defined and on-going co-operation and coordination between each agency needs to be established.
Stakeholder comment #5: IPP licences
Comment: Currently all IPPs who sell electricity to PLN require IPP licences, and households and individuals are not allowed to have the license to sell electricity. Getting these licenses can be a complex and slow process which may deter investment in small to medium scale PV systems. Reply: The requirement for licences for all IPPs regardless of the scale of generation is a significant barrier to the uptake of medium scale PV systems and a complete barrier for small scale (residential) PV systems. This issue shall need to be addressed as part of the overall policy development and it would be recommended that the standard IPP licensing be waived for all PV systems up to and including 1 MW capacity. Alternatively, if the licence requirements cannot be waived then a more basic licence be developed and its application be folded in amongst the PPA and connection agreement arrangements that would be standard for all new PV systems.

30
4.2 WIND 93. Figure 4.1 compares the proposed tariff (tariff ceilings) with production cost estimates of the developers.
Figure 4.1: Comparison of proposed wind FIT with proposed production costs of the developers
94. We may conclude that the wind FIT for small projects, and the tariff ceiling for larger projects, will indeed enable wind projects. This is particularly the case on the eastern Islands, where the value of wind is high because it displaces expensive diesel generation. In other words, some wind projects will be economic. Thus, the following tariff scheme and implementation arrangements are recommended for wind projects:
Projects not greater than 10MW
95. Small projects not above 10MW shall be remunerated by a fixed feed-in tariff based on benefits, and the proposed location, as shown in Table 4.5.
Table 4.5: Wind energy FIT for small projects and ceilings for competitive bid projects
Category I Category II Category III Region Java-Bali-Sumatra
grids Sulawesi Applicable to eastern
Islands FIT, USc/kWh 16.4 15.7 28.0
96. For wind, the tariff for small projects not greater than 10 MW shall be denominated in Rupiah/Rp, those for larger projects in USc/kWh. The bulk of the investment cost for wind will be in foreign exchange, and (as in the case of geothermal), a US$ denominated tariff is more appropriate. This tariff will be available only to such projects for which agreement has been reached with PLN to connect to the local grid in question (see below). This proposal follows established precedents, both for the issuance of a fixed tariff and for an appropriate size threshold (i.e. follows the scheme for small hydro and biomass)
0 10 20 30
11.4
12.8
14.7
16.0
17.4
17.6
19.4
22.0
25.0
15.7
16.4
28.0
13.5
17.3
USc/kWh
SMI
UPC, "non diesel replacement"
Our study prod.cost, Sulawesi
UPC "diesel replacement"
FIT: Sulawesi
PT EAI/AGC, S. Sulawesi
FIT: Central Java
Our study prod.cost, Central Java
WhyPGen, fixed
Pertamina/Viron (Sukabumi)
WhyPGen, Tiered
PT Sumberdaya Sewatama (East S
PT EAI/AGC, West Timor
FIT: small islands [diesel replacem

31
Stakeholder comment #6: The rationale for a feed-in tariff?
Comment: What is the need for FIT? Why not let developers negotiate tariff with PLN on project-by-project basis? Reply FIT provides certainty and transparency to developers. Tariff uncertainty is the largest risk during the development phase of project. With FIT, this risk is removed. Experience worldwide suggests that countries with “known” wind energy tariff that provides a reasonable rate of return and transparent licensing procedures is a recipe for successful policy. One-on-one and project-by-project negotiations are subject to subjective judgements by administrators and elected governments, and hence open to renegotiations when government changes.
Box 3: Special considerations for small projects
Given the high rate of failure of small wind projects (with turbines of size less than 100kW), the regulation should require IPPs to set aside a fund for unscheduled maintenance to cover major repair work (replacement of bearing, gearbox, and others). The reason is, in absence of a set-aside maintenance fund, often IPPs make a decision to abandon a project because the additional investment required for repair does not meet the required rate of return. For large projects, lenders or equity partners will themselves requires a fund (“major maintenance escrow account”) – contributions to which take precedence over dividend payouts. Another requirement that may ameliorate high rate of failure is awarding FIT only to projects with certified turbines. In the small turbine market, there are lot of concept and experimental turbines, whose performance has not been rigorously tested and verified. Turbine certification from reputed international entities like the Small Wind Certification Council (http://smallwindcertification.org/) should be required as a precondition for FIT.
Projects greater than 10MW
97. New wind projects above 10 MW shall be awarded by competitive tender, subject to ceiling tariffs based on benefits, as shown in Table 4.5 (which shall be identical to the benefits based FIT for small projects).
Projects currently under development
98. Exemption from competitive tendering for projects larger than 10 MW shall be granted to projects currently under development, or for the first 250 MW , whichever is greater. To this end, MEMR shall establish a registry of wind projects currently under development; such projects shall be exempted from competitive tendering. These projects may avail of the relevant tariff in Table 4.5, under the conditions specified below. 99. Such wind projects must be registered on or before the effective date of the wind feed-in tariff regulation; thereafter all other proposed projects above 10MW shall be competitively tendered (unless the total of registered projects is less than 250MW). To be eligible for such registration, a wind project must also meet the following requirements:
• Be in possession of the necessary permits from local governments • Demonstrate to the satisfaction of MEMR that a wind-monitoring program has
commenced at least 6 months prior to the registration date (such demonstration to be confirmed).
• Must commit to commissioning date of no later than 3 years after registration date by depositing a performance bond to ESDM. The bond amount will be 2% of installed cost.

32
The bond is forfeited if the project is not commissioned in 3 years. No extensions are allowed.
100. Any such registered project that has not achieved a PPA with PLN by 6 months after the effective date of regulation, shall not qualify for these transition arrangements.
Box 4: Flat versus tiered tariffs
If a tiered tariff is desired (as suggested by some wind developers), then it should be designed to match with the typical duration of loan. Assuming the typical loan duration is 8 years for wind projects, a two tiered tariff with higher tariff from year 1 to 8 and lower tariff from year 9 to 20 is recommended. The tiered tariff levels are set to ensure that the levelized tariff is the same as the flat tariff (or tariff ceiling, as the case may be). For example, with 10% discount rate, a flat tariff for 20 years is equivalent to a 10% increase in tariff in years 1 to 8 and 16.9% decrease in tariff in years 9 to 20. A tiered tariff should be accompanied with a requirement that the wind farm owner setup an escrow account to ensure that the wind farm continues to produce at the same level in years 9 to 20 as in years 1 to 8 (subject only to normal variations around average annual wind speeds, and internationally accepted normal decrease in performance).
Stakeholder comment #7: Implementation milestones
Comment (wind developer): We would recommend a deadline of greater than 2 years from registration to Financial Close/start of construction (potentially a shorter time scale for projects below 10MW). Because of a lack of experience of government authorities with wind farm permitting and licensing, delays outside the fault of the developers are likely to happen. There should also be deadlines for PLN and ESDM for signing the PPA and providing the operating license (IUKU) respectively. We feel it is important that the developer risks are not unnecessarily high, as significant risk is taken through the performance bond ($40,000 per MW/2%of CAPEX) and development expenses. Reply: MEMR/EBTKE will choose number of years based on consistency with other IPP regulations.
Competition
101. As a general principle, competition is desirable provided the transactions costs are small, and hence our recommendation is that projects less than 10 MW in size should be exempt (a conclusion that also follows from the general international experience). 102. As noted, the likely quantity of realizable utility-scale (project of size > 10 MW) wind potential or financially feasible potential is in the range of 300 to 500 MW. Of this potential, 250 MW of potential (200 MW in S. Sulawesi and 50 MW in Java) has been under development for 2 to 5 years by 2 or 3 private developers. Any attempt to impose competition on these projects is unlikely to be successful – as is clearly demonstrated by the recent experiences in Brazil and past experiences in UK: new entrants in such competitive tenders may well offer a low price, but are unable to deliver. This has also been observed in the case of Indonesian geothermal projects, where many tenders have been won by self-evidently unrealistic bids. 103. In any event, if the competitive bid requires at least one year of wind measurement and other criteria (grid integration study, etc.), then there will be no real competition -- both bidders will be at the ceiling price. In short, we recommend that bidding should only be instituted after the wind industry has gained some experience with installation of a few projects, so that most of the unknowns (regulatory, licensing, grid, logistics) have been sorted out.

33
Box 5: Competition in the Wind FIT program
Eligibility for the FIT
104. Whether or not access to the FIT is based on competition, there are eligibility requirements that should be applied to all wind projects. Wind energy is a variable source of electricity, therefore the amount of penetration in the grid must be managed and planned. In this section, penetration will be expressed in terms of percentage of annual peak load or off-peak load, as stated in the current RUPTL for the year of deployment of the proposed wind project. 105. Before a wind project is awarded the Feed-in Tariff, it must meet the following conditions:
1. At least one year of wind measurement that meets these conditions: a. Measurement at three heights b. One of the measurements must be at a height of at least 2/3 of the proposed hub
height of wind turbine, or lower height measurement that has been validated with SODAR or LIDAR.
2. PLN has approved the interconnection of wind project to the grid. The guidelines for approval of interconnection are described below.
The following options illustrate methods of implementing competition after the initial 250MW wind program:
• Option 1 for wind farms of size >10MW: PLN or EBTKE should manage an annual tendering starting from 2017
o Annual tendering (of say 100MW) will provide visibility so developers can plan project development (wind measurement)
o In order to qualify, all bidders must have at least one year of high quality wind measurement data and a pre-feasibility report
o All bidder must have approval for interconnection from PLN, in which PLN should follow the guidelines described in paragraphs 107 and 108
o All bids must be below the FIT ceiling o New areas (besides Java/Bali, Sulawesi and Eastern islands) of wind development
will require benefits-based analysis to determine FIT o Recommendation: PLN or EBTKE should conduct a wind resource study for the
country in order to forecast the size of the annual wind tenders and prepare for integration of wind to the grid.
• Option 2: PLN or EBTKE conduct prospecting to identify areas of interest, collect wind data and invite bids for wind farm
o Tendering for wind projects occurs in specified areas o In the specified areas, EBTKE shares measurement data with developers o In addition EBTKE may obtain EIA and land agreements, and perform
interconnection studies in order to minimize project uncertainties o Developers use the data to prepare a bid for tariff o Winning bidder reimburses PLN for the cost of development (measurement, EIA,
etc.)
Option 1 is recommended because the private sector will drive investment in areas of interest. In Indonesia, there are no sizeable contiguous areas that are rich in wind resources where option 2 would be effective

34
106. A wind project should be “conditionally” eligible if the sum of installed capacity of existing variable generation (wind and solar) and the installed capacity of the proposed wind project is less than 20% of the peak load.
Stakeholder comment #8: The need for competition
Comment (wind developer #1) We have our doubts about the benefit of tenders for projects larger than 10 MW in Indonesia. Due to its island nature, the wind potential is very fragmented and limited by grid sizes. • For all islands except Java – Sumatera – Bali, the limited number of good wind sites will make real
competition unlikely and it is a matter of which company secures a site first. If a tender would be organized, the company with the best site will win as any differences cannot be overcome with smart design or a cheaper source of turbines. Moreover, projects over 10 MW are unlikely to happen outside the locations for which ADB recommends exemption.
• For Java, while the grid is large and could accommodate many MW of wind, in our opinion, good sites are scarce and it remains to be seen if any project can be realized at the proposed price of USD 0.167 per kWh. For example, a project with a Net Capacity Factor of 30% may just be feasible at that price. It is therefore unlikely that a tender would result in PPA prices significantly below the ceiling price of USD 0.167 per kWh and the transaction costs are not gained back.
• A tender makes most sense in situations where 2 or more sites of similar size and wind resource exist which can justify PPA prices significantly below the ceiling price.
Comment (wind developer #2) • The process of bidding for other renewable energy projects in Indonesia has not resulted in large
numbers of MW being installed and, in general, the installations have not met targets or even come close mainly due to imposition of processes that are unworkable.
• FIT rates recommended are too high for all wind and PV covered under this proposal and PLN/MOF will be reluctant to pay more than on-grid generation rates. We recommend the following fixed feed-in tariff rates, to be available for all without competition
• Any significant sized grid system in Indonesia: $125/MWhr • For complete diesel replacement projects: $180/MWhr • For Small Coal replacement projects: $150/MWhr • Diesel/small coal are being displaced: $165/MWhr
Reply: We agree that there have been problems in the tendering for geothermal projects. Our recommendations for the geothermal sector are being adopted by MEMR in a new regulation that will soon be issued. In other sections of this report we make similar recommendations about how competition for large wind projects should be handled. The different views of wind developers about the required tariff - one has stated that the Java tariff is too low, the other that the Java tariff is too high, (stating that 12.5USc/kWh should be sufficient) are an excellent illustration of why competition is needed: only a competitive tender will reveal the true cost at which project can be delivered. 107. Even if conditionally eligible, PLN may choose to perform a system impact study for the proposed wind project that meets the above requirement for conditional eligibility. The results of the study and approval/denial should be published within 8 calendar weeks of the FIT application. Projects that are not conditionally eligible may still be eligible for the FIT subject to PLN approval based on system impact study (power flow, short-circuit and system stability analyses), again with approval/denial published within 8 calendar weeks of the FIT application. 108. The recommendations in the above paragraphs will avoid delays for projects that are less than 20% of peak load. The implementation of the recommendations means that PLN would grant conditional eligibility to a project which satisfies the condition, unless PLN determines

35
either through a prior analysis or some other means that the proposed project requires a full system impact study (which at around $100,000 is expensive and requires experienced consultants)
The PPA:
109. A Standardized PPA should include a take-or-play clause, under which PLN is obliged to pay for any and all curtailments. If PLN has determined through a grid integration study that there is likely to be curtailment due to known issues with the grid, then PLN may be allowed up to 5% curtailment of wind energy with no payment.23 Any curtailment in excess of the specified amount would be subject to payment for the energy deemed to be produced during the curtailment period. 110. For small wind projects (<= 10MW), deemed energy (estimated energy production during curtailment) may be computed based on average production in the past 7 days during the curtailed hours. 111. For large wind projects (>10MW), deemed energy may be computed based on a methodology that combines onsite wind measurement with aggregate production curve of wind farm.
Implementation arrangements
112. A one-stop-shop philosophy is recommended for implementing the administrative processes. Box 6 and Figure 4.2 summarise the approach. Detailed specifications are outside the scope of this study.
Box 6: Streamlining the licensing process: One stop shop
23 The suggested 5% threshold is widely used in PPAs in North America.
A one-stop-shop process can simplify the licensing and permitting process while removing redundancies. It saves time and money for both developers and the government. The agencies that should participate in this process are:
• BKPM • ESDM (EBTKE and DG Electricity) • PLN • Ministry of Home Affairs (Regional/local Government) • Ministry of Environment
The scope of the process should include:
• The process starts from Wind Measurement and ends after commissioning of wind project • Developer view of process:
• Developer interacts with single entity during the entire process • BKPM point of view of process:
• Manages the detailed tasks that are performed by the participating agencies • It issues licenses, permits, PPA, and final approval to build a wind power generation
facility Desideratum of the one-stop-shop process:
• Clearly specified requirements and timelines • Primarily an electronic web-based process:
• All required forms are available as webpage that can be submitted or are available for download
• Ability to upload of documents • Email notification of status • All application fee payments are processed online • Behind the scenes a workflow process is managed with as much automation of
mundane tasks as possible and automated reporting of number of applications in various stages and delays.
An illustration of the one-stop-shop is given in Figure 4.2.

36
Figure 4.2. Illustration of the one-stop-shop
Note: Developer activities and interactions are with a single entity represented by the wide horizontal bar and are represented above the horizontal bar. All the activities and interactions of government, utility and other agencies are shown below the horizontal bar.

37
-40
-30
-20
-10
0
10
2.34.4
0.0
-32.7
4.3
-21.7
$US
mil
lion
PV PLN
MoFJava HH
PLN consum.World
net econ benefit
5. IMPACT ON MOF AND CONSUMERS ______________________________________________________________________________________
5.1 IMPACT OF THE ROOFTOP PV FIT 113. The impact of the proposed FIT on the stakeholders is shown in Table 5.1. The results shown here assume that 250 MW of rooftop solar is installed by 2020. The columns in this table are the stakeholders, the row represent the components of benefits and the producer transactions. The bottom row [15] is simply the sum of the entries in each column and represents the net impact on each stakeholder. Row[14] passes through the incremental financial costs to PLN to the consumer, so that the net impact of the FIT on PLN is zero.
Table 5.1: Rooftop PV: Impact on Stakeholders, $USm in 2024
PV PLN MoF local HH
PLN consum
.
World net econ
benefit
FIT USc /kWh
[1] [2] [3] [4] [5] [6] [7] [8] [1] Benefits [2] Avoided fixed cost 0.0 [3] Avoided variable cost 41.2 41.2 13.45 [4] GHG emission premium 4.3 4.3 1.40 [5] local environmental premium 0.0 0.0 0.00 [6] local economic development 0.0 0.0 0.00 [7] energy security premium 0.5 0.5 0.17 [8] Integration costs 0.0 0.0 0.00 [9] Avoided transmission losses 2.8 2.8 0.90
[10] Producer transactions 0.0 [11] FIT revenue 76.7 -76.7 0.0 [12] Production cost -70.5 -70.5 [13] Taxes and duties -3.8 3.8 0.0 [14] Incremental cost recovery 32.7 -32.7 0.0 [15] Net impact 2.3 0.0 4.4 0.0 -32.7 4.3 -21.7 15.9

38
114. For example, in column [2], PLN benefits from $41.2 in avoided fuel costs (row[3]), $2.8million in avoided T&D losses – but the cost of the FIT (at the assumed 25 USc/kWh is $76.7 million – for a net loss of $32.7 (row[9]) – which here is shown as being passed onto consumers (as a surcharge on the tariff). So despite the GHG benefits - assigned to the global community – the net result is a loss of $21.7million. To the extent that these costs are not passed to consumers, but absorbed by MoF under the established subsidy mechanism, then the additional subsidy requirement on MoF is $32.7million. 115. The production costs, and taxes and duties (paid by the developer to MoF) are indicative only, but have been estimated in such a way to show some net cash flow to the developer. In the absence of net cash flows to developers, the PV projects could not be undertaken. 116. Quite clearly, then, a PV rooftop program on Java, where it displaces gas generation, is not economically viable. If passed to the consumer, the impact on the consumer tariff is calculated as shown in Table 5.2, for which we make the following assumptions: • 2024 total consumer sales, 464 TWh, as per the latest RUPTL • The incremental costs passed to all consumers as a tariff surcharge. • 2015 cost reflective tariff of Rp 1,352/kWh escalated by the rate of domestic inflation of 4.5%
per year, so the tariff for 2024 will be Rp. 2009/kWh. • Exchange rate of 12,500 Rp:US$
Table 5.2: Impact of the proposed rooftop PV program on consumers: 250MW by 2024
US$ Rp/kWh [1] sales, TWh 464 [2] Average retail tariff $/kWh 16.07 2,009 [3] consumer bill million$ 74,582 [4] incremental cost million$ 32.7 [5] adjusted consumer bill million$ 74,614 [6] adjusted tariff USc/kWh 16.08 [7] tariff increase USc/kWh 0.007 0.9 [8] [%] 0.04% [9] Cost to consumer of an
additional KWh of RE USc/kWh 10.7
117. The tariff increase to cover the incremental costs may be seen as quite small (1.3 Rp/kWh): the percentage increase would be slightly greater if (as in Malaysia) the incremental costs are passed only to larger consumers. However, the relevant question is how this compares to other renewable energy options. To make a Jakarta Rooftop program economic would require a societal valuation of avoided carbon of 143$/ton, which is significantly above the generally accepted social cost of carbon of $30/ton CO2, as also used in the geothermal tariff, and significantly above the corresponding cost for wind power (see below). From the perspective of the consumer, who sees the total financial incremental cost to PLN passed onto the consumer bill, s/he is in effect paying $179/ton CO2 .
Table 5.3: Avoided cost of carbon
society consumer emission factor Kg/kWh 0.594 0.594 avoided generation GWh 306.6 306.6 tons GHG avoided tons 182,120 182,120 incremental cost $USm 26.0 32.7 avoided cost of carbon $/ton 143 179
118. It must be stressed that this applies just to rooftop PV in Jakarta – or other cities connected to a grid where the PV would displace gas. But on eastern islands, or in off-grid

39
0
5
10
15
20
2.3
4.45.7
4.3
17.1
$USmillion
PV PLN
MoFlocal HH
PLN consum.World
net econ benefit
situations, where oil is displaced, the economics change dramatically. A 25USc/kWh production cost based FIT for PV, where the cost of oil-based generation is 27USc/kWh and more, results in cost savings to PLN: as shown in Table 5.4. For such application of PV, there is a net economic benefit of $17.1m per year (in 2024).
Table 5.4: Impact of PV where it displaces oil
PV PLN MoF local HH
PLN cons.
World net econ benefit
FIT USc
/kWh [1] [2] [3] [4] [5] [6] [7] [8]
[1] Benefits [2] Avoided fixed cost 0.0 [3] Avoided variable cost 82.4 82.4 26.86 [4] GHG emission premium 4.3 4.3 1.40 [5] local environmental
premium 0.4 0.4 0.12
[6] local economic development 0.1 0.1 0.03 [7] energy security premium 0.5 0.5 0.17 [8] Integration costs 0.0 0.0 0.00 [9] Avoided transmission losses 0.0 0.0 0.00
[10] Producer transactions 0.0 [11] FIT revenue 76.7 -76.7 0.0 [12] Production cost -70.5 -70.5 [13] Taxes and duties -3.8 3.8 0.0 [14] Incremental cost recovery -5.7 5.7 0.0 [15] Net impact 2.3 0.0 4.4 0.5 5.7 4.3 17.1 28.6
119. Indeed, this is the classic “win-win” strategy – as is clear from the diagram, all stakeholders experience a net benefit. Here the assumption is that the savings to PLN are passed to consumers in the form of lower tariffs (which would indeed be the consequence of a cost-reflective tariff). In effect, this is an option under which carbon emissions are achieved at no cost to the Indonesian consumer.

40
-20
-10
0
10
20
2.95.8
2.3
-14.4
11.1
7.7
$USmillion
wind IPPPLN
MoFlocal HH
PLN consum.World
5.2 IMPACT OF THE WIND FIT
Sulawesi
120. Table 5.5 shows the impact of 200MW of wind projects on Sulawesi by 2024. This shows a net economic benefit of $7.7million, when taking avoided GHG benefits into account.
Table 5.5: Impact of wind on Sulawesi, 200MW by 2024
Wind IPP
PLN MoF local HH
PLN consum
.
World net econ
benefit
FIT USc /kWh
[1] [2] [3] [4] [5] [6] [7] [8] [1] Benefits [2] Avoided fixed cost 0.0 0.0 [3] Avoided variable cost 85.2 85.2 13.9 [4] GHG emission premium 11.1 11.1 1.8 [5] local environmental premium 0.2 0.2 0.0 [6] local economic development 2.1 2.1 0.4 [7] energy security premium 1.0 1.0 0.2 [8] Integration costs -3.6 -3.6 -0.6 [9] Avoided transmission losses 0.0 0.0 0.0
[10] Producer transactions 0.0 [11] FIT revenue 96.0 -96.0 0.0 [12] Production cost -88.4 -88.4 [13] Taxes and duties -4.8 4.8 0.0 [14] Incremental cost recovery 14.4 -14.4 0.0 [15] Net impact 2.9 0.0 5.8 2.3 -14.4 11.1 7.7 15.7
121. However, as shown in Table 5.6, if PLN’s incremental financial costs of $14.4m are passed to the consumer, there will be some small impact on the consumer tariff (the assumptions for this calculation are the same as those presented above for Rooftop PV). The impact on the 2024 consumer tariff is 0.4 Rp/kWh, significantly less than for rooftop PV. Similarly, the cost to the consumer for an additional kWh of renewable energy is 2.35 USc/kWh, just 15% of that for Rooftop PV.

41
Table 5.6: Impact on the consumer, Sulawesi wind
US$ Rp/kWh [1] sales, TWh 464 [2] average retail tariff $/kWh 16.07 2,009 [3] consumer bill million$ 74,582 [4] incremental cost million$ 14.4 [5] adjusted consumer bill million$ 74,596 [6] adjusted tariff USc/kWh 16.08 [7] tariff increase USc/kWh 0.003 0.4 [8] [%] 0.02% [9] cost to consumer of
an additional kWh of RE USc/kWh 2.35
122. The cost of carbon to society is $13.7/ton CO2, again much lower than for Rooftop PV. Since the benefits in the tariff calculations have been estimated at $30/ton, this indicates that wind would be economic even at this lower value of $13.7/ton CO2.
Table 5.7: Cost of avoided carbon, Sulawesi wind
society consumer emission factor Kg/kWh 0.404 0.404 avoided generation GWh 613.2 613.2 tons GHG avoided tons 247,733 247,733 incremental cost $USm 3.4 14.4 societal avoided cost $/ton 13.7 58.2
Java
123. Table 5.8 shows the corresponding impacts of 100 MW of wind on Java. The total incremental financial costs to PLN are $6.7million (passed onto consumer under cost-reflective pricing), and the net economic benefit is $3million.
Table 5.8: 2024 Impact of wind on Java
Wind IPP
PLN MoF local HH
PLN consum
.
World net econ
benefit
FIT USc /kWh
[1] [2] [3] [4] [5] [6] [7] [8] [1] Benefits [2] Avoided fixed cost 0.0 0.0 [3] Avoided variable cost 30.6 30.6 13.4 [4] GHG emission premium 4.7 4.7 2.1 [5] local environmental premium 0.0 0.0 0.0 [6] local economic development 1.6 1.6 0.7 [7] energy security premium 0.4 0.4 0.2 [8] Integration costs 0.0 0.0 0.0 [9] Avoided transmission losses 0.0 0.0 0.0
[10] Producer transactions 0.0 [11] FIT revenue 37.3 -37.3 0.0 [12] Production cost -34.4 -34.4 [13] Taxes and duties -1.9 1.9 0.0 [14] Incremental cost recovery 6.7 -6.7 0.0 [15] Net impact 1.1 0.0 2.3 1.6 -6.7 4.7 3.0 16.4

42
-8
-6
-4
-2
0
2
4
6
1.12.3
1.6
-6.7
4.7
3.0
$USmillion
wind IPPPLN
MoFlocal HH
PLN consum.World
124. The impact on the consumer is shown in Table 5.9: the 2024 retail tariff would increase by 0.2 Rp/kWh.
Table 5.9: 2024 Impact on the consumer, 100MW wind on Java
US$ Rp/kWh [1] sales, TWh 464 [2] average retail tariff $/kWh 16.07 2,009 [3] consumer bill million$ 74,582 [4] incremental cost million$ 6.7 [5] adjusted consumer bill million$ 74,588 [6] adjusted tariff USc/kWh 16.08 [7] tariff increase USc/kWh 0.001 0.2 [8] [%] 0.01% [9] cost to consumer of an
additional kWh of RE US$/kWh 1.09
125. The avoided cost of carbon to society is $12.9/ton, similar to that on Sulawesi (Table 5.10).
Table 5.10: Cost of avoided carbon, Wind on Java
society consumer emission factor Kg/kWh 0.594 0.594 avoided generation GWh 227.76 227.76 tons GHG avoided tons 135,289 135,289 incremental cost $USm 1.7 6.7 societal avoided cost $/ton 12.9 49.6
Wind on Eastern Islands
126. Table 5.11 shows the impact of 20MW of small wind projects on eastern islands. The net economic impact is $1m/year, and incremental financial costs passed from PLN to consumers of $1.4 million/year.

43
-2
-1
0
1
2
0.40.7
0.1
-1.4
1.21.0
$USmillion
wind IPPPLN
MoFlocal HH
PLN consum.World
net econ benefit
Table 5.11: Impact of 20MW wind projects on Eastern Islands
Wind
IPP PLN MoF local
HH PLN
consum.
World net econ
benefit
FIT USc /kWh
[1] [2] [3] [4] [5] [6] [7] [8] [1] Benefits [2] Avoided fixed cost 0.0 0.0 [3] Avoided variable cost 11.8 11.8 26.9 [4] GHG emission premium 1.2 1.2 2.7 [5] local environmental premium 0.0 0.0 0.0 [6] local economic development 0.1 0.1 0.3 [7] energy security premium 0.1 0.1 0.2 [8] Integration costs -0.9 -0.9 -2.1 [9] Avoided transmission losses 0.0 0.0 0.0
[10] Producer transactions 0.0 [11] FIT revenue 12.3 -12.3 0.0 [12] Production cost -11.3 -11.3 [13] Taxes and duties -0.6 0.6 0.0 [14] Incremental cost recovery 1.4 -1.4 0.0 [15] Net impact 0.4 0.0 0.7 0.1 -1.4 1.2 1.0 28.0
127. Table 5.12 shows the consumer impacts of Eastern Island wind projects. Notwithstanding the apparent high cost of the FIT, when the very small incremental financial costs are distributed across all electricity consumers, the impact at 0.05Rp/kWh barely registers.
Table 5.12: Consumer impact, eastern Islands wind projects
US$ IRp/kWh
[1] sales, TWh 464 [2] average retail tariff $/kWh 16.07 2,009 [3] consumer bill million$ 74,582 [4] incremental cost million$ 1.4 [5] adjusted consumer bill million$ 74,583 [6] adjusted tariff USc/kWh 16.07 [7] tariff increase USc/kWh 0.000 0.04 [8] [%] 0.00% [9] cost to consumer of an
additional kWh of RE US$/kWh 0.23

44
128. Table 5.13 shows the calculation of the avoided cost of carbon, a very low societal cost of $6.4/ton CO2.
Table 5.13: Avoided cost of carbon, Eastern Islands wind
society consumer emission factor Kg/kWh 0.785 0.785 avoided generation GWh 43.8 43.8 tons GHG avoided tons 34,383 34,383 incremental cost $USm 0.2 1.4 societal avoided cost $/ton 6.4 40.8
5.3 SUMMARY 129. Table 5.14 presents a summary of the stakeholder impact assessments. The total economic benefit of a wind program of 200MW on Sulawesi, 100MW on Java, and 20MW of small projects on eastern Islands is $11.7 million/year. However the net economic loss of the Jakarta Rooftop program is $21.7million/year. The avoided costs of carbon for the wind programs are in the range of $6.4 to $13.7ton CO2. The total impact of the wind projects is a 2024 tariff increase of 0.65 Rp/kWh.
Table 5.14: Comparison of Rooftop PV and wind FITs
Jakarta Rooftop PV
Eastern Island PV
Sulawesi Wind
Java Wind
Eastern Island wind
Installed capacity MW 250 250 200 100 20 Load factor [ ] 0.14 0.14 0.36 0.26 0.25 Renewable energy delivered GWh 307 307 613 228 52 Incremental financial cost USm 32.7 -5.7 14.4 6.7 1.4 Net economic benefit, 2024 $USm -21.7 17.1 7.7 3.0 1.0 2024 consumer tariff impact Increase Decrease Increase Increase (Increase) Rp/kWh +1.3 -0.2 +0.4 +0.2 +0.05 USc/kWh +0.011 -0.001 +0.003 +0.001 0.000 [%] +0.04 -0.01 +0.02 +0.01% 0.00% Cost to consumer of an additional kWh of RE
USc/kWh 10.7 2.35 1.1 0.27
Cost of avoided carbon (as seen by the consumer)
$/ton 179 None, win-win
58.2 49.6 40.8
Societal cost of carbon $/ton 143 13.7 12.9 6.4

45
ANNEX I: ROOFTOP PV
I.1 THE SOLAR RESOURCE 130. Indonesia enjoys a substantial solar resource across the majority of locations. Its equatorial location ensures that the resource is fairly consistent all year round with the most variable influence being the dry season that runs from June through to October and in all locations in Indonesia sees a peak irradiance over that period. The irradiance in Sumatra, Jakarta, and Western Java is generally lower than for the east of the country and, as a general rule, the further you move eastward in the archipelago, the better the resource becomes. The following tables and figures provide an overview and graphic illustration of irradiance in six urban sites in Indonesia.
Table I.1: Summary of Solar Resource in Indonesia (kWh/m2/day)
Month Jan Feb Mar Apr May Jun Jul Aug Sep Oct Nov Dec Ave South Sumatra 4.3 4.3 4.7 4.7 4.4 4.2 4.4 5.2 5.8 5.4 4.6 4.2 4.7 Jakarta 4.3 4.2 4.7 4.5 4.6 4.5 4.9 5.3 5.7 5.4 4.9 4.2 4.8 Yogyakarta 5.0 4.8 4.9 4.7 4.8 4.9 4.9 5.4 5.6 5.5 4.9 4.5 5.0 Surabaya 5.1 5.0 5.0 4.8 4.8 5.1 5.5 6.2 6.7 6.6 5.5 4.7 5.4 South Sulawesi 4.1 4.5 4.9 4.9 5.0 4.8 5.2 6.1 6.4 6.2 5.6 4.1 5.2 Sumba 5.3 5.5 5.7 5.8 5.0 4.9 5.2 6.0 6.8 7.1 7.1 5.8 5.9
Source: © 2014 GeoModel Solar
Figure I.1: Monthly Global Irradiance at 6 Urban sites (kWh/m2/day
131. Notably the solar irradiance in many locations also has a very high diffuse component, and in locations such as Jakarta, diffuse irradiance is more dominant than direct beam irradiance. As a consequence, the total variability of the irradiance will be on average substantially lower than might otherwise be the case. The direct implication of this is that the variability of PV system output in this and other locations will be less, and the potential for adverse impacts on grid stability further reduced.

46
Figure I.2: Average Irradiance with Diffuse vs Direct Breakdown
I.2 THE INDONESIAN ROOFTOP PV PROGRAM 132. It is evident that PV deployment in Indonesia has been largely focused on off-grid and small networks in the remote locations in the country, where diesel based electricity generation dominates. This is driven by a range of factors, but the two key drivers for this policy focus have been:
(i) Avoided Fuel Cost: The cost of diesel generation particularly in remote areas is very high (> 0.35 USD/kWh) and the financial benefit of deploying PV to offset or replace diesel consumption costs is, in most cases, very clear; and
(ii) Rural Electrification: An estimated of 25% of Indonesian citizens do not have access to reliable electricity supply. In these remote areas without existing infrastructure, PV is generally seen as a cost effective means of electrification.
133. In contrast to these remote areas of Indonesia, the main population and load centres in Indonesia, Java, Bali and South Sumatra and South Sulawesi have seen very little deployment of PV systems. The reasons for this are:
• The relatively low cost of electricity generation in these areas, • Subsidized electricity consumption tariffs for end users, • High up front cost of PV systems, • Lack of incentives and policy mechanisms to encourage PV uptake, • Limited access to land for commercial scale PV plants, • Effective regulatory frameworks and installation standards not clearly established. • The numbers of population and the centralized locations of the population in the
locations have made building large power plant more cost-effective. • There are ‘cheaper’ options for energy sources in the area, such as coal, gas, oil, and
hydro. 134. The fundamental purpose of this report is to provide guidance on an appropriate incentive and policy framework for the deployment of Rooftop PV systems in these major load centres of Indonesia.

47
Definition: Rooftop PV
135. The application of the term “Rooftop PV” is open to many interpretations and for the purposes of this paper the following definition is being applied:
A grid connected distributed photovoltaic power system on a residential, commercial or industrial premise.
136. The defining Characteristics of rooftop PV include: • Grid connected such that it requires an active connection to a major distribution network
for PV generation to occur, • The PV system is connected at the premise to the PLN network via an approved meter,
and • The connection is configured as either Net or Gross metered.
137. Because of limited available land the PV system is likely to be roof mounted but ground mounted systems are also permissible. 138. The capacity of individual PV systems can range from small household systems of a few kW’s up to large multi MW scale installations over multiple roof spaces or ground areas.
I.3 POTENTIAL FOR ROOFTOP PV 139. Indonesia’s total electricity generating capacity is currently estimated to be 44GW, of which approximately 80% is deployed on the Java-Bali grid. The projected expansion in electricity generation across the whole of Indonesia is at least double of this existing capacity within 10 years. Additional capacity will be added through the deployment of a range of renewable and non-renewable generation technologies. 140. Rooftop PV has the potential to add significant additional generation on to the Java Bali network. In the greater Jakarta area alone, which is approximately 740km2, the utilization of 1% of this total area for rooftop PV generation would add 1GW of PV generation and 3 to 4 GWh of electricity injected per day into the local network. If these basic results are extrapolated beyond the Jakarta area, the potential for Rooftop PV to add more capacity to Java Bali network is significant. 141. For the purposes of the Rooftop PV program, an initial focus on deployment in Jakarta is viewed as a logical first step. The rationale for this initial Jakarta focus is as follows:
• It is the primary centre in Indonesia for urban population, commercial activity and industry and therefore has broad access to a range of potential system owners or up-takers
• The availability of roof space, residential, government, commercial and industrial is high • It is has large well-established electricity network • All of the key project stakeholders including Government, Financiers and PV industry
are located in Jakarta • The solar resource in Jakarta is generally lower than other areas to the east of Jakarta and
the results of modelling carried out below for Jakarta region would be reasonably conservative when applied to most other areas in Java Bali

48
I.4 TECHNICAL CONSIDERATIONS FOR ROOFTOP PV 142. The benefits and issues associated with grid connected PV system generation and integration, through many years of international experience, are currently well known and documented. The following tables provide a basic summary of the generation characteristics and network impacts that need to be considered.
Table I.2: Generation Characteristics of Rooftop PV Systems
Characteristics Impact on Grid
Variability & Intermittency
• PV generation follows predictable daily and seasonal patterns, but is variable on short time scales
• Individual PV systems potentially have high variability but on a network level, this variability is largely negated where multiple systems with significant geographical dispersions are deployed.
Proximity to load • Generation occurs at load point. • Self consumption of PV generation effectively occurs prior
to export to network
Grid following
• Requires presence of grid for generation. Automated disconnection to avoid islanding.
• Net generation impacted by grid availability where storage systems not included
Grid support & protection
• Export curtailment or reactive power support easily achievable, but at cost to net generation
Table I.3: Network Impacts of Rooftop PV Systems
Impacts Impact on Grid
Network Wide
• For distributed PV systems at net penetrations of < 25% there is limited impact on network stability and no deep network costs.
• At high PV penetration levels, >25%, integration issues can develop and may additional network or end user costs to manage
• Reduction in network losses because of local generation
Localized Network Impacts
• Power quality. In particular Voltage rise or Frequency issues : Usually limited to local feeder or substation level where high concentrations of distributed PV exist in conjunction with low local loads and undersized service connections.
• Modern grid connected inverters provide high quality sine wave output with limited harmonic distortion
Generation Displacement
• Will generally displace peak daytime generation. • Limited capacity benefit • Where energy storage is included may have added benefits
of peak load management
143. The issues listed in the tables above are easily manageable and! in most cases, unlikely to be present a problem until high levels of PV penetration have occurred. All can be managed within the correct regulatory framework without undue impact on either the network or the PV generator.

49
I.5 PV TECHNOLOGY 144. PV is now an internationally recognized generation technology that has become mainstream in many countries. It continues to undergo rapid development both as a technology and in its application. The following is a brief overview of the status of PV internationally and in Indonesia.
International Cost Trends
145. Over the last 30-40 years the price of PV modules has followed an exponential downward tend with average cost for PV modules now sitting below $1.00 USD/Wp and, in many regions of the world, this cost is substantially less (Figure I.3). In recent years, the trend has levelled out to some degree but the projected price for PV modules is expected to continue to fall as module production costs fall and PV module efficiencies increase.
Figure I.3: PV Module price curve
Source: IEA technology Roadmap PV 2014 146. The cost of PV system installation have also been falling over this same period. This was primarily because of the falling costs of PV. In recent years, the Balance Of Systems (BOS) costs have therefore become an increasingly large porportion of the overall installation costs. This has driven a subsequent fall in the cost of inverters, frames, switchboards cabling, and other BOS components (Figure I.4) 147. As noted, the falling costs for both PV system components and for PV system installation in general are expected to continue over the foreseeable future and the impact of this shall need to be considered in the development of an effective Rooftop PV program.

50
Figure I.4 PV system Costs
Source: IEA Technology Roadmap PV 2014
The Indonesian PV Industry
148. The PV Module manufacturing in Indonesia consists of less than 10 relatively small local companies that assemble PV modules utilizing predominately imported components from countries such as China and Taiwan. Unlike Malaysia and the Philippines, none of the large international manufacturers have set up PV production facilities in Indonesia. Several of these large global companies have flagged interest in such ventures but no direct commitments have been made and they have generally linked such future activity to suitable local incentives and expanded deployment of PV in Indonesia. 149. Indonesian PV module manufacturers also form the main contingent of PV system installation contractors, and such installation works have been to date a strong driver for their PV manufacturing activity. The known quality of PV systems installations has also been highly variable, and any rapid expansion of the PV industry in Indonesia through a Rooftop PV program would need to consider the inherent capacity constraints of what is a local industry in its relative infancy. 150. The Indonesian PV market has relied primarily on imported PV modules or the locally assembled PV modules made from imported module components. Similarly the BOS hardware is also largely imported and thus PV system component costs are largely dependent on international factors. 151. Based on figures provided by the Indonesian PV industry, MEMR, and other sources Table I.4 and I.5 provide a summary for PV Module costs in Indonesia in 2014.
Table I.4: PV Module costs: Imported vs. Local
Source Cost (USD/Wp) Imported PV modules ~ 0.70 Indonesian Assembled PV modules ~ 1.00

51
Table I.5: PV Module Assembly
PV module component Source % of Component
Cost Import Duty
(%) PV cells China, Taiwan, Malaysia 50 0 Aluminium Frame Indonesia , China, Taiwan 13 20 EVA China, Korea, Taiwan 4 10 Back Sheet China, Korea 6 15 Glass China 6 5 Junction box China, Korea, Taiwan 6 12.5 Silver Solder Ribbon China, Korea, Taiwan 8 12.5 Sealant China, Taiwan 2 12.5 Accessories Indonesia 5 0
Total 100 NA
I.6 OVERVIEW OF INTERNATIONAL EXPERIENCE WITH ROOFTOP PV
INCENTIVE PROGRAMS
Incentives
152. Incentive programs have been and are being used to support the rollout of PV systems across both developed and developing nations. The following list represents the most common incentives that are being deployed: • Feed-in Tariffs • Capital subsidy, grant or rebate • Loan Subsidies And Loan Guarantees • Utility quota obligation • Tradable renewable energy certificates • Tax incentives • Green building codes
153. The following sections explore in detail the nature and impact of these incentives and how they are being deployed in other countries such as Malaysia, Thailand, Philippines, India. Particular attention is given to international experience with the design of Feed-in Tariff programs.
Capital Subsidy, Grant Or Rebate
154. PV systems have a high up front capital cost and very low operation and maintenance costs. This high up front capital cost is, however, a major barrier to the uptake of PV systems. Capital subsidies in the form of grants or rebates can be a simple and reliable incentive for PV system up-take, particularly for the smaller capacity residential market. Capital subsidies were a very common incentive in early PV program but as the industry has matured and the costs of PV has fallen it is now a less common practice. The delivery of capital subsidies also requires strong institutional arrangements to ensure that subsidies are not misused or misdirected. India does currently use capital subsidy for the installation of small-scale PV systems. These subsidies are a mixture of Central and State government incentive and constitute up to 30%-40% of the capital cost.

52
Loan subsidies and Loan Guarantees
155. Interest rate and loan subsidies are a successful means of increasing the willingness of banks and other lending institutions to loan to renewable energy projects. This is particularly important in countries in which banks are less familiar with renewable energy projects and so apply a high-risk profile to the renewable energy investment loans. Government guarantees can reduce this risk profile and interest rate subsidies reduce the burden of a higher interest loan to the borrower. 156. In Thailand, a “Revolving Fund” was established in 2003 as a low-interest loan scheme for energy conservation and renewable energy projects. The fund provides loans to banks at a 0% interest rate. The banks lend this money to renewable energy projects according to their bank financial history, with a maximum interest rate of 4% for a maximum loan period of seven years. The budget for the fund has substantially reduced in recent years as banks have gained experience in investing in renewable energy projects and are able to finance investments from within their own capital. The need for the fund has therefore reduced as investments have increased. 157. Malaysia’s Green Technology Financing Scheme is a low interest loan program established in 2010 with a budget of $431 million. Loans are granted by banks, with a government’s guarantee of 60% on the financing amount and with the government bearing 2% of the total interest charged over the life of the loan. The scheme is available to a range of projects including but not limited to renewable energy deployment. To date, around 360 projects have been approved in total, 68 of which are solar PV related, including system installations and the establishment of manufacturing plants.
Utility quota obligation and Renewable Energy Trading Certificates
158. A utility quota obligation for renewable energy generation is generally a mandated percentage of total generation that electricity utilities are required to generate or purchase from renewable energy sources. In India, the Central government mandated Renewable Portfolio Obligations (RPO) target for each State to meet. Utilities may meet their targets through trading Renewable Energy Certificates (RECs). States select their policies to meet their RPOs. The Philippines has a Renewable Portfolio Standard in their Renewable Energy Act of 2008; however, it is yet to be promulgated. 159. As an incentive mechanism it is relatively complex and requires strong institutional arrangements to manage it. It has been deployed very successfully in several other countries and jurisdictions, including in Australia, where the scheme separates the REC into small and large scale components. With the wide scale withdrawal in recent years of FIT’s the sale of these tradable generation certificates has become the primary driver for renewable energy development.
Tax incentives
160. The Philippines, Thailand and Malaysia all have generous tax incentive programs to encourage investment in renewable energy and energy efficiency technologies. India has a proposed tax incentive scheme for households installing PV on their rooftops. 161. Tax incentive options that have been deployed for renewable energy and energy efficiency technologies include:
- Exemption of or reductions to the import duties for energy efficiency and renewable related hardware and equipment

53
- Reduction of the corporate income tax for companies that improve their energy efficiency or develop renewable energy projects
- Reduction in Value Added Tax for renewable energy projects - Tax rebates for purchase of all renewable energy and energy efficiency technologies.
162. The net cost benefit to the broader economy of these tax incentives can be difficult to quantify. But there is little doubt that in the countries where tax incentive have been deployed, significant PV industries has been established and or the roll out of PV technology has been enhanced.
Green building codes
163. This involves the deployment of national building codes that require new buildings to comply with minimum energy consumption requirements. It is generally based on a designated rating scheme where the building must meet a certain minimum net energy standard but may achieve this through a wide range of measures, including the deployment of PV or other renewable energy technologies. It is relatively common in developed nations, but less so in other countries. Such codes must be mandatory to have an impact and are sometimes also applied to existing buildings that are being upgraded. As a rooftop PV incentive, it can be moderately effective when applied.
1.7 FEED-IN TARIFFS 164. A Feed-in Tariff (FIT) is a rate paid per unit of metered electricity injected into the grid from a designated generation source. It may be a fixed or variable value but is generally defined for a designated period. The main considerations for developing a FIT include: • Deadline or cap on applications • Net Metering vs Gross Metering • Tariff payment structure • Funding for program • Consumer side implementation model potential
Deadline or Cap/quota on total generation
165. International experience has shown that open and uncontrolled access to an incentive, such as a FIT, can lead to rapid over subscription of PV programs and subsequently a range of negative impacts for program managers and users alike. Control of program subscription has generally been managed through either setting a time deadline for the submission of program applications, or by setting a maximum cap or quota to the total PV capacity that is available for the FIT. 166. International experience has demonstrated that where a generous FIT is applied and a deadline approach used for applications, this will result in an oversubscription to the program, and the agencies capacity to manage the program financially and logistically will be severely challenged. This was the case in the first round of Thailand’s “Adder Tariff” policy in 2006-2008, and the Feed-in Tariff for rooftop solar in NSW Australia in 2008-2010. There are also many other similar international examples. The lessons learned from this experience suggests that a clearly defined on total eligible capacity is a more effective way of ensuring a controlled rollout of FIT based PV program.

54
167. For example, Thailand has applied this lesson learnt in its early programs to its more recent programs. The solar FIT (announced in 2013) has a fixed cap of 1GW installed solar with a quota for 200 MW for rooftop and 800 MW for community ground mounted. Similarly Malaysia’s FIT policy has a staged quotas released every six months. Caps for 2013 and 2014 are displayed in Table I.6. The six-monthly release of quotas allows the target and rates for the FIT to be periodically reviewed and adjusted as necessary.
Table I.6: Six-monthly caps for Malaysia’s Solar PV FIT,2013-2014
Allocated MW Capacity 2013 2014 H1 H2 H1 H2
Housing Developer 0.00 0.00 0.00 0.00 Individual 4.70 0.47 0.00 0.00 Non-individual (<500kW) 1.98 1.30 0.72 0.00 Non-individual (>500kW) 32.26 26.24 30.53 0.00
However, access issues do exist with quota based systems. When quotas are applied, measures must be taken to either ensure equity of access to the limited quota or clearly identify preferred up takers and provide rationales for restricting access to these parties.
Tariff rate and structure
168. Feed in Tariff rates may be differentiated for different technology types, locations, and ownership structures. Often higher tariff rates will be available for smaller systems to reflect the higher cost per kW installed. Tariff rates may also include premium rates or bonuses to encourage investment in a certain technology or area. 169. Once again the international approach is quite diverse. The FIT rate structures in Thailand are displayed in Table I.6
Table I.7: Thailand Rooftop installation FIT rates for cap of up to 200MW total
Power plant category Size FIT rate (THB/kWh)
FIT rate (USD/kWh)
Years of payment
Residential <10kW THB 6.96/kWh 0.21 USD/kWh 25 Small business buildings 10kW-250kW THB 6.55/kWh 0.20 USD/kWh 25 Medium to large scale business buildings/factories 250kW-1,000kW THB 6.19/kWh 0.19 USD/kWh 25
Table I.8: Community Ground-mount FIT rates for cap of up to 800 MW total
Years FIT rate
(THB/kWh) FIT rate
(USD/kWh) Years of payment
L BHT9.75/kWh 0.30 USD/kWh 25 4-10 BHT6.5/kWh 0.20 USD/kWh 25 11-25 BHT4.5/kWh 0.14 USD/kWh 25
170. Previous programs in Thailand included a premium rate for the southernmost region of the country to account for the additional risk of developing in the region. This has been praised as a successful means of encouraging investment where risk is higher. 171. Malaysia’s FIT also has categories for different system sizes and grants bonus FIT rates to Building Integrated PV (BIPV) installations and/or systems that use locally manufactured or assembled PV modules and/or inverters. Malaysia’s FIT rates and bonuses are shown in Box 1 (Main text, above)

55
172. Each state in India has a different electricity tariff policy. The states of Andhra Pradesh, Karnataka and West Bengal are examples of states with FIT policies. Table I.9 shows FIT rates for Karnataka.
Table I.9: FIT rates in Karnataka state in India
Power plant category Rs./kWh USD/kWh PV power plant 8.40 0.13 Rooftop and small solar PV 9.56 0.15 Rooftop and small solar PV (installed with 30% government subsidy)
7.20 0.11
Degression rate
173. Some countries have applied an annual degression rate to their FIT. These degression rates are generally set to account for the falling cost of PV system costs over time and a usually subject to regular reviews to check that the rate matches the industry reality. For example, the Malaysian FIT decreases by 8% per year, and the Philippines FIT decreases by 0.6% per year. The Thailand FIT for community ground mount installations decreases as per rates outlined in the Table I.8.
Funding of the FIT
174. FITs and other incentives are in some cases funded directly from the larger pool of government revenue. However, in many nations FITs are funded through more publicly transparent mechanisms, such as additional costs to customer electricity bills. Thailand’s FIT is funded through a quarterly adjusted automatic fuel price volatility adjustment tariff known as the “Ft charge”. For example, in 2012, the Ft charge added on average 5% to the average power bill, ranging from 4.89% to the average residential customer and 5.48% to the average Large General Services customer. 175. Malaysia’s FIT is funded through the Renewable Energy Fund, which was established in 2011, through a 1% surcharge, increased to 1.6% in February 2014, on electricity bills. Customers consuming less than 300 kWh of electricity are exempt from contributing to the fund. 176. In Indonesia, the costs associated with funding of a FIT for a PV Rooftop program would exceed the avoided cost benefit that this additional generation would provide. It would be highly unlikely that the gap funding would be met by the implementing agency (who is most likely to be PLN) and thus this funding would need to be provided by the Ministry of Finance. The levying of an additional surcharge on consumer tariffs to cover the program costs may be considered as a means to underwrite these costs.
I.8 NET METERING VS GROSS METERING 177. The selection of the metering configuration is a critical element in the design of a Rooftop PV program. There are two basic metering configurations that are deployed in grid connected PV systems: gross metering and net metering. These two configurations are explained below.
Gross Metering
178. Gross metering is (?) a metering arrangement wherein measurement of the total export and total import of electricity is done separately. All electricity produced by the PV system is

56
effectively exported to the grid and can be treated independently of the electricity consumed by the user.
Figure I.5: Gross Metering Configuration
Net Metering
179. Net metering is a metering arrangement where electricity generated by the PV system is first consumed on the premises and only PV generation in excess of this local consumption is exported to the network. The “Net” metered value is the sum of PV electricity generation less the total electricity consumption. Where PV generation exceeds consumption, there is net export to the network and where the consumption exceeds PV generation there is a net import of electricity.
Figure I.6: Net Metering Configuration
180. There is a strong relationship between the metering configuration and the outcome of a FIT program. The following graphs provide an illustration of the difference between Gross and Net metering on electricity export and import for two otherwise identical grid connected PV systems.

57
Figure I.7: Import v. export under gross and net metering
181. In Gross metered systems, all generation is exported to the network and therefore, the total metered export is much higher than in Net metered systems. A Feed in Tariff (FIT) based incentive in Gross metered systems will, therefore, have significantly more impact than in Net metered systems. If the FIT is sufficiently sized, it will likely be the key driver for PV system uptake. 182. In Net metered systems, the bulk of the PV generation is consumed on site and the net export of electricity to the network will be relatively low. In Net metered systems, the key economic driver for the uptake of PV by consumers is the reduction in electricity import costs. Where the electricity consumption (import) tariff for consumers is high, this “self consumption” approach is effective. However, in countries where the import tariff is low, such as Indonesia, the financial incentive for consumers to offset their consumption with localized PV generation is inadequate and therefore other significant incentive measures would need to be deployed as an alternative to or in support of a FIT. 183. In the international experience, many of the FIT programs with a high uptake have had a Gross metering arrangement. Thailand and Malaysia are both examples of this. However, the impact of a FIT as an incentive on either Net or Gross metering depends on the relationship of the FIT with electricity import tariff. Where the FIT is significantly higher than the import tariff, then either Gross metering is deployed, or Net metering but with strong support from other incentives, is utilized. Where the FIT and the imported tariff are both at the same high level, then Net metering has been used. Table I.10 compares the electricity consumption tariffs and metering configurations in different countries.

58
Table I.10: Electricity tariff rates and FIT rates and configurations in different countries
Country Metering
Configuration Electricity
Consumption Tariff FIT rate
Thailand Gross 0.06 - 0.13 USD/kWh ~0.20 USD/kWh
Malaysia Gross 0.08 - 0.16 USD/kWh ~0.28 USD/kWh (degressing 8% per year)
Philippines Net Average 0.20 USD/kWh ~0.22 USD/kWh
India –Andhra Pradesh
Net 0.03 - 0.11 USD/kWh USD 0.10/kWh
India - Karnataka Net 0.09 - 0.13 USD/kWh
~0.14 USD/kWh
I.9 OWNERSHIP MODELS 184. Internationally, there are two broad business models that have been pursued in Rooftop PV systems from the end-user side. These are “Self Owned” and “Third Party Owned”. Within these two categories, the specific structure and financial mechanisms are varied greatly, depending on the individual country circumstance. However, both options are strongly influenced by the metering configurations that underpin them.
Figure I.8: Summary of Consumer Side Implementation Models
Self Ownership: Net Metered
185. The PV system is owned and operated by the owner of the premise on which it is installed and where imported electricity is consumed. PV generation is first consumed at the premise and only excess electricity is exported to the network
Key Points: • The main financial driver for this “Self Consumption” model is the offsetting of the cost of
electricity import • Because the export of PV generation is low, a FIT has low impact

59
• Where the import tariff is low then additional incentives, such as a capital subsidy and tax rebates, are required to encourage PV uptake
• Capital cost and on-going operation and maintenance cost for the system are paid by the owner
• The system owner has lower incentive to reduce their energy consumption • It is commonly and successfully deployed in many countries where the cost of electricity
is high. Additional support in the form of capital subsidies or other incentives is wide spread, particularly in nations where the cost of electricity is low
Self Ownership: Gross Metered
186. The PV system is owned and operated by the owner of the premise on which it is installed and where imported electricity is consumed. All PV generation is exported to the grid and metered independently of the electricity consumed at the premise.
Key Points: • The main financial driver for this model is the sale of exported PV generation • FIT is the key driver • The import tariff only has relevance if it provides a financial limitation on the net value
of exported PV generation. As previously described, this is currently the case in Indonesia
• Where the FIT tariff is low, then additional incentives, such as a capital subsidy and tax rebates, are required to encourage PV uptake
• Capital cost and on-going operation and maintenance cost for the system are paid by the owner
• Because the import of electricity is not tied to export the end user has more incentive to reduce their energy consumption
International Experience: It is commonly and successfully deployed in many countries where the consumer tariff is high. Additional support in the form of capital subsidies or other incentives is widespread, particularly in nations where the cost of electricity is low.
Third Party Ownership: Net Metered
187. The PV system is owned and operated by an external third party developer or intermediary, who leases out PV systems to rooftop owner, who in turn pay them a periodic lease rental. PV generation is first consumed at the premise and only excess electricity is exported to the network: The lease payments are not tied directly to the PV system's actual output, but calculated such that they are competitive with the rooftop owners existing electric bill.
Benefits to rooftop owner: • Avoidance of large upfront capital cost and associated risk for system operation and
maintenance • Net-metering reduces metered electricity import and this saving is shared with the
developer by way of a rental lease
Benefits to developer: • The leasing company generates revenues through the lease contract with rooftop owner

60
• Access to any program incentives including capital subsidies, tax rebates, depreciation allowances etc.
Additional Points • The main financial driver that underpins this model is the cost of electricity import • Where the import tariff is low then additional incentives, such as a capital subsidy and
tax rebates, are required to encourage PV uptake • Because the export of PV generation is low, a FIT has low impact • Developer can realize economies of scale that is not achievable by individual system
owners, such as lower financing, operational, and PV system costs International Experience: 188. It has been successfully deployed in several countries (primarily the USA), where the cost of imported electricity is high and regulatory frameworks have allowed this financial innovation. In India, this model approach is being considered, but due to the low cost of electricity, the incentive for the third party developers is strongly driven by capital subsidies or other incentives instead.
Third Party Ownership: Gross Metered
189. The PV system is owned and operated by an external third party developer or intermediary, who generally leases the rooftop space from the owner of the premise and then sells all the generated electricity either directly to the rooftop owner or to the connecting utility. All PV generation is exported to the grid and metered independently of the electricity consumed at the premise.
Benefits to rooftop owner: • Income from the lease of rooftop space • Potential to purchase electricity for local consumption at a rate lower than offered by the
utility and fix this cost with long term agreements • Avoidance of large upfront capital cost and associated risk for system operation and
maintenance
Benefits to developer: • The leasing company generates revenues through the sale of electricity via a PPA to
either the rooftop owner, or the local electricity utility • Access to any program incentives, including capital subsidies, tax rebates, depreciation
allowances etc.
Additional Points • If generated electricity is sold to the utility, then the main financial driver is the FIT • If generated electricity is sold to the rooftop owner, then the main financial driver is the
import tariff • In either approach, if the FIT or import tariff are low, then additional incentives, such as a
capital subsidy and tax rebates, are required to encourage PV uptake • Developer can accomplish economies of scale that is not achievable by individual system
owners, such as lower financing, operational, and PV system costs • The provision of electricity sales may be constrained because of local regulatory
frameworks • This model naturally allies itself to the deployment of larger scale PV systems
(>100kWp). The inclusion of individual smaller scale PV systems is impeded by proportionally higher per unit costs for hardware and administration. However,

61
inclusion may be achieved by allowing IPPs of a suitable size to collectively sell the metered PV generation for multiple systems under a single PPA.
International Experience: • This model has been deployed for any number of PV generation projects, with an
approved IPP selling generated electricity to an approved buyer, either the utility or the a local client. This approach has been successfully deployed in both Thailand and Malaysia for both ground and roof-mounted PV systems. In Indonesia itself, there are many examples of this broad approach, including for ground mounted PV systems where the Solar PV PP Tariff of 0.25 USD (ceiling) has made several 1MW systems installed in remoter location in Indonesia.
I.10 METERING OPTIONS FOR INDONESIA 190. PT Perusahaan Listrik (PLN) is the government utility that owns, operates, manages and regulates nearly all of the generation, transmission, distribution and retail of electricity in Indonesia. It is, therefore, one of the key stakeholders in the development and deployment of a Rooftop PV program. 191. In terms of Gross and Net metering of PV generation, there are two key areas that PLN’s existing policies have a significant impact on the available options for deployment of Rooftop PV in Indonesia and potentially provide direct constraints on either individual PV systems capacity or the effectiveness of program incentives.
PV Integration and Metering Policy
192. In the second half of 2014 PT Perusahaan Listrik (PLN) released their PV integration policy (No:0009.E/DIR/2014 Operational Terms of Photovoltaic Integration of Customers into the Electric Power System Area of PT. PLN). This policy describes the proposed rules and requirements for the grid connection of PV systems and included details on metering requirements. It also provided a typical PV system connection layout, which was a Net metered configuration, and thus this document has been commonly referred to as the “PLN Net Metering” policy. 193. However, the metering requirements set out in the document and as described by PLN themselves specify that all PV systems must utilize PLN supplied meters that separately measure the following parameters:
1. Total energy export 2. Total energy import 3. Sum of export and import
194. Each of these three values is recorded on a separate register within the meter. A PV system with this PLN specified meter can, therefore, be configured as either a Gross or Net metered system. 195. This is important because, as previously noted, the metering configuration is a major determinant of the incentive structure deployed in a Rooftop PV program. If Gross metering can be applied, then a FIT approach can be more easily deployed. If a Net metering approach is used, then a FIT on its own will be an insufficient driver, thus further supportive incentives shall be required.

62
Figure I.9: PLN Meter Configuration
PLN Consumer Billing Restrictions
196. An additional and important constraint on the application of a FIT for Gross or Net metered Rooftop PV systems is that there exists a direct limitation on PLN’s capacity to provide any financial return to connected consumers. Under current arrangements, any revenue generated by a consumer through a FIT cannot be paid to the consumer directly. Instead the value of PV generated electricity can only be offset against the cost the consumer pays for imported electricity. If the value of exported electricity exceeds the cost of imported electricity then this “credit” may be carried over to the next billing period as an offset to that bill. If the value of exported electricity was consistently in excess of imported electricity, then over an annual billing cycle, the value of this energy credit would grow. However, PLN would be unable to ever pay the consumer for this energy credit and at the periodic reconciliation of consumers electricity account, this energy credit would be lost. 197. The direct implication of this restriction is that it would limit the capacity (kW) of individual Rooftop PV systems installed under these constraints such that for the given reconciliation period, the value of the exported PV generation should not exceed the value of the imported electricity. Where a FIT is applied, the impact of this limitation on Gross and Net metered systems is different. As follows: 198. For Gross metered PV systems, where all PV generation is exported, the relationship is fairly simple as shown below (A). The total income generated through the export of the total generation should not exceed the total cost of electricity consumption (B).
A. EX =PVGen
B. PVGen x FIT = LT x TC
C. PVGen = LT /RTF
PVGen = PV Generation (kWh) EX = Exported Electricity (kWh) LT = Total Load (kWh) FIT = Feed in Tariff (Rp/kWh) TC = Consumption Tariff (Rp/kWh) RTF = Tariff Ratio FIT:TC
199. The final formulae (C) shows that the key relationship in determining the maximum PV generation is the ratio of the FIT to the consumption tariff. As a simple illustrative example, where a FIT is set at twice the value of the consumption tariff, the PV system would need to be designed such that its net generation over the reconciliation period did not exceed half the total
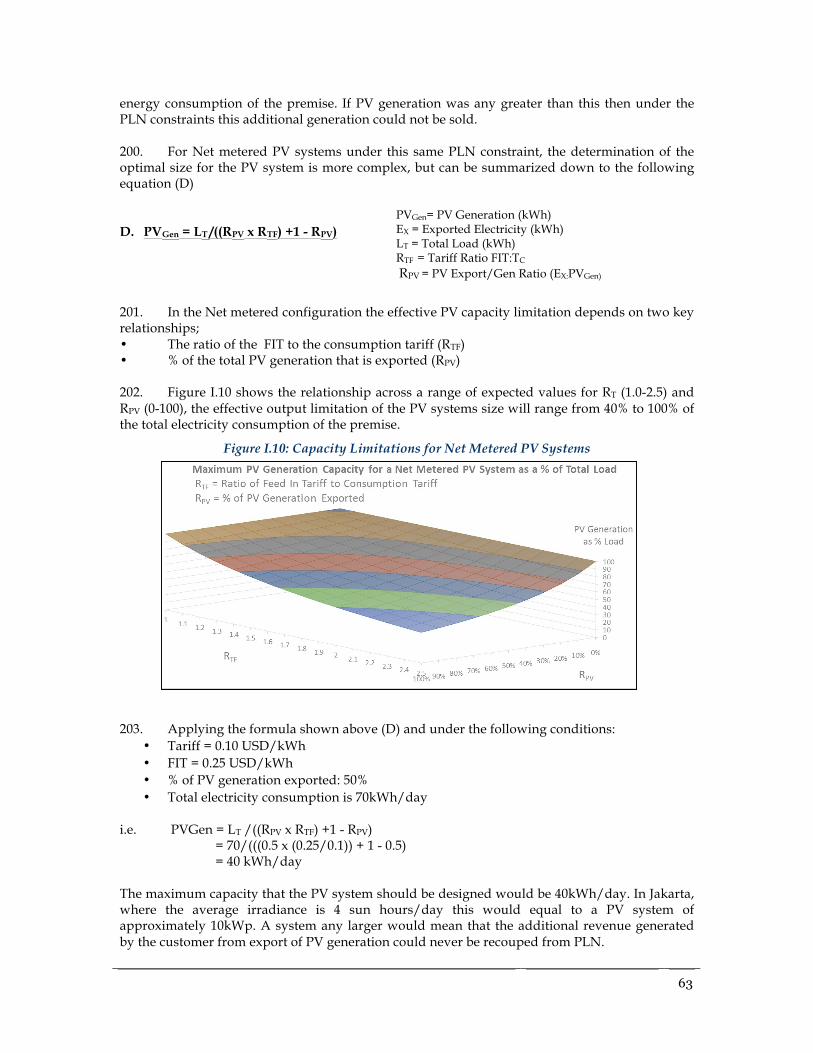
63
energy consumption of the premise. If PV generation was any greater than this then under the PLN constraints this additional generation could not be sold. 200. For Net metered PV systems under this same PLN constraint, the determination of the optimal size for the PV system is more complex, but can be summarized down to the following equation (D) D. PVGen = LT /((RPV x RTF) +1 - RPV)
PVGen= PV Generation (kWh) EX = Exported Electricity (kWh) LT = Total Load (kWh) RTF = Tariff Ratio FIT:TC
RPV = PV Export/Gen Ratio (EX:PVGen)
201. In the Net metered configuration the effective PV capacity limitation depends on two key relationships; • The ratio of the FIT to the consumption tariff (RTF) • % of the total PV generation that is exported (RPV) 202. Figure I.10 shows the relationship across a range of expected values for RT (1.0-2.5) and RPV (0-100), the effective output limitation of the PV systems size will range from 40% to 100% of the total electricity consumption of the premise.
Figure I.10: Capacity Limitations for Net Metered PV Systems
203. Applying the formula shown above (D) and under the following conditions:
• Tariff = 0.10 USD/kWh • FIT = 0.25 USD/kWh • % of PV generation exported: 50% • Total electricity consumption is 70kWh/day
i.e. PVGen = LT /((RPV x RTF) +1 - RPV) = 70/(((0.5 x (0.25/0.1)) + 1 - 0.5)
= 40 kWh/day
The maximum capacity that the PV system should be designed would be 40kWh/day. In Jakarta, where the average irradiance is 4 sun hours/day this would equal to a PV system of approximately 10kWp. A system any larger would mean that the additional revenue generated by the customer from export of PV generation could never be recouped from PLN.

64
204. For the deployment of a FIT program, further consideration should be made to determine if such limitations are desirable and what alternative measures or implementation models can be followed to avoid these constraints.
I.11 THE IMPACT OF ROOFTOP PV Solar Generation and Network Load
205. Jakarta is located the Western part of Java, designated as Area 1 of the larger Java Network. The network load for this region is the highest in all of Indonesia and on average sits between 7 and 10 GW of demand across the day. The profile of this network wide load shows that it is generally flat across most of the day, but does share a peak with PV generation in the middle of the day. This day time load peak is a result of Jakarta being Indonesia’s major commercial and industrial centre, and energy demand due to productive purposes is highest in normal day time working hours. This synchronicity between network demand and PV generation suggests that Rooftop PV that is targeted at commercial and industrial users would potentially be more successful that Rooftop PV targeted at residential users, who tend to have their peak demand in the evening after returning from work. The importance of this last point, however, depends on whether a Net metering configuration is adopted. For Gross metered systems, the relationship is much less critical. 206. The following graphs demonstrate the correlation of peak load with peak PV generation and the potential for PV to “shave” peak PV load. Figure I.11 demonstrates this correlation. Note different axes for load and PV generation. Figure I.12 displays the actual average off-set of 1GW of PV on the whole Jakarta Network.
Figure I.11: Comparison of Jakarta Network Profile with PV Generation Profile

65
Figure I.12: Average off-set of 1GW PV on Jakarta Network daily load profile
System integration costs
207. Grid connected PV systems can under certain circumstances have adverse impacts on both a local and a network wide level. However, these impacts are not common and are evident only at a very high level of penetration into the network of PV (i.e. excess of 25% of capacity). The proposed scale of PV rollout of the rooftop PV program is in 100’s of MW’s and when this is scaled against the size of the overall network (~30-40 GW), it is clear that PV penetration will remain very low for the foreseeable future. Some attention will still be required by PLN in ensuring that PV penetration on a localized level is understood and managed, but in terms of the proposed program, the need for significant integration costs is not evident.
Avoided thermal generation
208. PV generation that is injected into the Java transmission network will displace generation from another source. Where this generation is a non-renewable fuel, such as coal or gas, the value of that fuel is an avoided cost benefit for PV generation. The exact type of the generation that is displaced and, therefore, the value of this displacement will vary depending on merit order of generation and the magnitude of the PV generation. The details are provided in the main text, above
I.12 FINANCIAL MODELLING 209. For a Rooftop PV program to be successful, the incentive structure must be sufficient to encourage participation in the program. This is particularly true because the relatively high capital cost of PV can be seen as a hurdle for many potential investors. As noted previously, the effectiveness of the incentive structures for PV are highly dependent on the metering configuration, the deployment of a FIT, the cost of imported electricity and the range of other capital , tax or loan subsidies, or other incentives that are utilized. 210. Modelling every possibility across a range of incentive structures system capacities and metering configurations is beyond the scope of this assessment but the following modelling will examine the two core approaches, Gross and Net metering, to determine what baseline FIT and quantum of additional capital subsidy that would be required to encourage investment in Rooftop PV.

66
Costs
211. The unit cost of PV installation is high dependent on the scale of the installation. Based on figures provided by the Indonesian PV industry, MEMR and other sources, Table I.11 and Figure I.13 provide a summary of the estimated capital costs and associated breakdown for PV system in Indonesia in 2014. The values presented here are slightly higher but otherwise largely in line with international experience.
Table I.11: PV System Installation Costs: on grid
PV System Size Installed Cost (USD/Wp) 0-5kW 2.75
5-20kW 2.5 20-100kW 2.25
100-1000kW 2 > 1MW 1.75
Figure I.13: PV System Installation cost break down

67
212. The baseline assumptions used in the modelling are shown in Table I.12.
Table I.12: Assumptions for the financial analysis
General Assumptions Electricity price indexation 5 % Inflation 5 % Project Life 20 years Financing Assumptions Debt 70 % Interest rate 12 % Duration of debt 7 years Equity 30 % Expected rate of return 15 % Capital Cost Total PV System Capacity Variable kWp 5kW 2.75 USD/kWp 20kW 2.5 USD/kWp 100kW 2.25 USD/kWp 500kW 2 USD/kWp 1MW 1.75 USD/kWp End of life value 0 % Ongoing Costs (annual) Operation and Maintenance (% of capital cost) 2 % Cost of insurance (% of capital cost) 1 % Technical Assumptions Annual Average Horizontal Radiation (P50) 1735 kWh/m2/day PV System Performance Ratio 80 % Output degradation per annum 0.5 % Tariff Assumptions Electricity Consumption Tariff (1.352Rp/kWh) 0.11 USD/kWh Feed in Tariff (FIT) Variable USD/kWh % of PV Generation Exported Variable %
Scenario 1: Gross Metered
213. The aim of this modelling is to determine what FIT would be required for Gross metered PV systems to achieve an effective rate of return for the system owner. In this scenario, all PV generation is sold by the system owner at the FIT rate. No other subsidy or incentive is applied. The results across an indicative range of PV capacities are as follows.
Table I.13: FIT requirements, Gross metered
System Capacity (kWp)
$/Wp Capital Cost FIT (USD/kWh)
Required to achieve 15% IRR 5 2.75 $13,750.00 0.305
20 2.5 $50,000.00 0.278 100 2.25 $225,000.00 0.25 500 2 $1,000,000.00 0.222
1000 1.75 $1,750,000.00 0.195
Scenario 2: Net Metered
214. As previously described, incentivizing uptake of Net metered systems can be more difficult and complex then the Gross metered alternative. The basic value proposition with Net

68
metered systems is that the PV generation offsets the owner’s electricity consumption costs. This “Self Consumption” approach works well in countries where the cost of electricity is high, but struggles in locations such as Indonesia, where the electricity consumption tariff is low. In this situation additional supportive subsidies are required to encourage PV uptake. 215. The following modelling uses the “Required FIT” results from the Gross metered modelling above and the fixed electricity consumption tariff to determine the percentage (%) of the total PV system capital cost would need to be subsidized to achieve an effective rate of return. Notably, because the consumption tariff is substantially lower than the FIT, the proportion of PV generation that is exported, is critical to the analysis. Therefore, an assessment has been carried out over a range of values, from 0% export to 100% export, which is equivalent to a Gross metered system.
Table I.14: Percentage of capital cost required to be subsidized to achieve 15% Return
System Capacity (kWp)
Gross FIT (USD/kWh)
% of PV Generation Exported
0% 20% 40% 60% 80% 100%
L 0.305 69% 55% 41% 28% 15% 0% 20 0.278 65% 52% 39% 26% 13% 0% 100 0.25 60% 48% 36% 24% 12% 0% 500 0.222 54% 44% 33% 22% 11% 0% 1000 0.195 47% 37% 28% 19% 9% 0%
216. The analysis demonstrates that even for larger PV capacities, Net metered systems that rely largely upon offsetting consumption are unlikely to attract investment, or will only do so with significant additional incentives, in the form of capital subsidies or their equivalent. If an average of 50% of PV generated will be exported and 50% consumed, then the equivalent subsidy required would be 30% of the capital cost. Under the PLN metering and billing constraints, it is expected that “Self Consumption” of PV generation will be substantially higher and PV export of generation lower than this 50% value. If this condition applied, then capital subsidies in excess of this 30% value seems likely in most circumstances.

69
ANNEX II: WIND POWER
II.1 THE RESOURCE AND PROJECT PIPELINE 217. Indonesia is endowed with good wind resources in selected regions of the country. According to LAPAN, the total wind power potential for Indonesia is 9GW. In view of the writers, the realizable wind power potential is about 800MW; most of the rest of the realizable potential is in eastern islands, where the demand for electricity is small. Here realizable means wind projects that are likely to be financially feasible or marginally feasible, and can be integrated into existing network. In some areas, total load in the network constrains the amount of wind power, in other areas, wind resource is the constraint. The geographical distribution of this realizable potential for utility-scale wind installations and small-scale wind projects, while taking into account demand, is presented in Figure II-1. The 2022 target for wind power in the 2013 RUPTL is 280MW.
Figure II.1: Realizable wind potential in Indonesia, as of 2015
Stakeholder comment #9: Wind resource potential
218. In the smaller eastern islands of Indonesia (less than 20MW of peak load [need to check if this is the right threshold]), the collective realizable wind power potential is expected to be
Comment (wind developer): We broadly agree with the current potential of 800 MW (we estimate 1 GW), but by making reasonable assumptions on the growth of grids and technological development of wind turbines, we estimate a potential of up to 10 GW in the next 50 years. It would be good to emphasize growth in potential as an added incentive to start developing the wind industry in Indonesia today. Reply: Wind energy potential and FIT should be revised continuously; we recommend at least once every five years. In addition, we recommend that the MEMR announce a long-term strategy for exploiting the wind energy potential so that both government research institutions and private sector can invest in additional wind resource mapping.

70
10MW by 2025. The primary reasons for the low realizable wind power potential in the Eastern Islands are the low demand in these islands, and the lower efficiency, higher capital cost and higher O&M cost of smaller wind turbines, which would make solar plants more cost effective. 219. As opposed to conventional generation, wind energy has considerable variability in all timescales—minutes, hours, days, months and years. The average monthly and daily variations of wind speed are shown in Figure II-2.
Figure II-2: Hourly and seasonal wind speed variations
Hourly variation: Seasonal variation: Wind speed on S. Sulawesi, Feb 13, 2012 80m hub height, prevailing wind direction ESE 220. Utility-scale wind energy development in Indonesia started in earnest a few years ago; to date there has no utility-scale wind plants. The current status of wind projects is present in Table II-1.
Table II.1: The project pipeline: utility scale projects
Project location. Developer Size (MW) Notes Samas, Central Java. UPC Renewables 50 Expected completion 2015/2016 Jeneponto I, South Sulawesi. AGC 62.5 Expected completion 2016 Jeneponto II, South Sulawesi. AGC 65 Expected completion 2018 Sidrap, South Sulawesi. UPC 70 Expected completion 2016/2017 Sukabumi, Java. Viron 20 Unknown West Timor, NTT. AGC 20 Unknown Total 287.5

71
II.2 INTERNATIONAL EXPERIENCE WITH WIND Table II.2: Tariffs and Implementation models in selected countries
Country Tariff (US cents/kWh)
Notes
Philippines 19 Good wind resource in Northern Luzon, the most populated island. Tariff was approved in 2013. Tariff award is on first-come-first-serve basis with a pre-condition that only projects that have completed 80% construction are eligible. There is a ceiling of 200 MW for the current tariff. 200+MW of utility-scale wind farm installations are in progress, most with balance-sheet financing.
Sri Lanka 17.5 Good wind resource in southern tip and northern part of island. First feed-in tariff was approved in 2008, since then, it has been revised. Projects of size 10 MW or less are eligible for the tariff. 90MW of wind capacity has been installed, primarily by domestic developers. Grid constraints have hampered future development. Competitive auction-based scheme is currently under development for 200+MW of development in Mannar area. ADB is financing a) transmission line from Mannar to Vavunya, b) wind measurement, and c) environmental studies; while the government will lease land for wind development.
Vietnam 7.8 The wind resource of Vietnam is modest, with the best resources in the south central provinces. The FIT was introduced in 2011, and was set n the basis of the avoided costs of coal. Given the modest resource, much higher tariffs would be required to enable new wind projects.
II.3 RELEVANT LESSONS OF THE INTERNATIONAL EXPERIENCE 221. The Feed-in tariff (FIT) mechanism has been the most popular support policy around the world for wind development. At a high level, there are two methods of determining FIT—production cost based and benefit based. Although most FIT schemes were based on production cost, there is a strong consideration to avoided cost. In some countries (like Thailand), the incentive scheme is implemented as an adder. Three main types of tariff related wind energy policy are found in the international experience, as summarised in Table II-3.
Table II.3: Wind support mechanisms
incentive Countries Notes FIT China, India, Philippines,
Thailand, Sri Lanka, Mongolia, and most EU countries
FIT has been the most popular tariff related policy. It has provided certainty to wind developers and resulted in large scale deployment of wind power in China, India and EU countries.
Reverse Auction
Brazil, South Africa Both countries started out with FIT, and then evolved to reverse auction after local developers had gained experience and wind resource in the country was better understood. Both countries have a large wind power potential, and the targets are several GW.
Negotiated USA Wind developers negotiate tariff with utilities. Up to 2013, the federal government provided 2.3c/kWh production tax credit for 10 years. Currently, there are no subsidies, other than state-specific renewable portfolio standards.

72
II.4 THE BENEFITS OF WIND POWER 222. The main benefit of wind power is the value of the avoided thermal energy. This has been determined using the ProSym model (also used by PLN for dispatch modelling purposes) for the South Sulawesi and Central Java grids to which several of the larger wind projects are proposed to be connected. The methodology and main results are described in the main text.
Sumba
223. Eastern Sumba has peak load of 4.5MW and off-peak load of about 2.5MW. Currently, the eastern and western parts of Sumba are not interconnected. Better wind resources exist in the eastern half of Sumba. 85% of the electricity in Sumba is from diesel generators, while the remaining 15% is from hydro. A 500kW wind project will therefore displace electricity generated by diesel. Table II-4 summarizes the marginal cost of electricity from diesel generation in Sumba. Wind integration on Sumba has been studied in some detail as part of the GoI Sumba Iconic Island initiative, supported by ADB.24
Table II.4: Cost of diesel generation on Sumba
Item Weighted Average
Marginal generators
Units
Diesel generation fuel consumption on Sumba Timur
0.276 0.325 Liters/kWh
Exchange rate (Nov 2014) 12,500 12,500 Rp Delivered cost of diesel in Sumba 0.9700 0.9700 USD/Liter Cost of electricity 0.2677 0.3153 USD/kWh
224. Forecasting oil prices at a time of great international market volatility is always subject to high uncertainty: at the time of writing (January 2015), Brent oil is trading at $50/bbl, down 50% from prices of mid June 2014. Whatever may be the short term forecasts (some of which anticipate a further fall below $50/bbl), the 31 USc/kWh generation cost shown in Table 11.8 will overestimate costs in the short term. As shown in Table 3.6 (and discussed in the main text), we anticipate 2016 diesel generation cost of 18 USc/kWh, returning to 2014 prices by 2020.
Avoided Capital Costs
225. The avoided cost of capital due to wind power is minimal and difficult to quantify, therefore the purposes of this analysis it will be conservatively estimated to be zero.
Methodology for deriving tariffs from ProSym modelling results
226. The ProSym modelling of displaced energy generates results at constant 2015 price levels. These have to be converted into a levelised tariff for application to the presumed first year of implementation (2016). This is illustrated by the entries in Table II.5. The procedure is as follows:
24 ADB TA 8287-INO: Scaling Up Renewable Energy Access in Eastern Indonesia. The costs of the wind
project is presented in Castlerock Consulting, Least Cost Electrification Plan for the Iconic Island, 9 Nov 2014.

73
1. Escalate the calculated values form the PROSYM model for 2016, 2020 and 2024 using the assumed rate of $ inflation (2%). These are entered into the blue shaded columns of the table.
2. The values for the intermediate years are obtained by interpolated growth rates between the calculated years.
3. For the years beyond 2024, the values are escalated at the 2% inflation rate 4. The levelised equivalent calculated, using the discount rate of 10%.
Table II.5: Calculation of levelised tariff (Sulawesi Wind Tariff)
levelised 2016 2017 2018 2019 2020 2021 2022 2023 2024 2025 Avoided fixed cost avoided variable cost 13.89 15.50 14.28 13.15 12.11 11.15 11.77 12.43 13.13 13.86 14.14 GHG emission premium 1.81 2.24 2.04 1.85 1.68 1.52 1.55 1.59 1.62 1.65 1.68 local environ. premium 0.02 0.10 0.08 0.05 0.03 0.00 local economic develop. 0.35 0.31 0.31 0.32 0.32 0.33 0.34 0.34 0.35 0.36 0.37 energy security premium 0.17 0.69 0.52 0.35 0.17 0.00 Integration costs -0.58 -0.51 -0.52 -0.53 -0.54 -0.55 -0.56 -0.57 -0.59 -0.60 -0.61 avoided T&D losses 0.00 0.00 0.00 0.00 0.00 0.00 0.00 0.00 0.00 0.00 0.00 total benefit/ceiling 15.66 18.34 16.70 15.18 13.77 12.45 13.10 13.79 14.51 15.27 15.58
Note: in the interest of legibility we have hidden some of the intermediate years: the actual calculation is for each of the 20 years of the assumed PPA
II.5 PROJECT COSTS 227. Notwithstanding our recommendation that the FIT be based on benefits, MEMR should nevertheless make estimates of production costs to verify whether projects will or will not be viable at the recommended tariff. To this end, we have examined production costs for a set of candidate projects based on a standard financial model under typical financial assumptions.
Assumptions
Table II.6 lists the capital and O&M costs for utility scale projects, and Table II.7 those for small scale project typical of the Eastern Islands.
Table II.6: Cost assumptions for utility scale projects
Cost Elements Cost in $US Notes Cost of Utility Scale turbine (per kW) $1,450 Turbine capacity greater than 1.5MW and
plant size of 20MW or higher Balance of Plant (BoP) costs (per kW) $750 Same as above Total Capital Cost (per kW) $2,200 Total O&M Cost (per kWh) $0.021 Annual increase in O&M cost 5% Local component of cost 20 to 25% Turbine and component will have zero
local cost. In the BOP costs, the civil works, erection and logistics cost are expected to be local to Indonesia. Half of this cost is likely to be local to island.

74
Table II.7: Cost assumptions for small scale wind projects
Small-scale Wind Projects Total Capital Cost (per kW) $2,303, $2,098 Quotes for refurbished turbines from
two companies Vestas, Enercon Total O&M Cost (per kWh) $0.11, $0.02 Quotes from two companies Vestas,
Enercon Annual increase in O&M cost 0%, 5% Vestas, Enercon Local component of cost 20 to 25% Turbine and component will have zero
local cost. In the BOP costs, the civil works, erection and logistics cost are expected to be local to Indonesia. 10% to 20% of this cost is likely to be local to island.
Table II.8: Financial assumptions
Financial Assumptions Large projects (S. Sul, C. Java)
Small Projects (Sumba)
Debt 70% 70% Interest rate 8.5% 12% Duration of debt 15 yrs 6 yrs Equity 30% 30% Expected rate of return 12.5% 18% Weighted Average Cost of Capital 9.9% 14.33% Minimum Debt Service Coverage ratio 1.25 1.25 Income tax 25% 25% Depreciation Linear, 15 years Linear, 10 years Life of project 20 yrs 10 yrs
Table II.9: Capacity factor assumptions:
C. Java S. Sul Sumba Net plant capacity factor 26% 36% 25%
Financial Modelling
228. The financial model calculates the required tariff to meet both debt service coverage ratio (DSCR) and equity return requirements, based on a 20-year PPA with a non-escalating tariff. The production costs under these financial constraints, levelised over the PPA life, are shown in Table II-10.
Table II.10: Results of production-cost based tariff that satisfy the financial conditions.
USD/kWh C. Java S. Sul Sumba Production Cost Based Feed-in Tariff 0.1730 0.1349 0.2908
229. These are comparable to the tariff proposals of the developers, as presented at the first meeting of the Stakeholder Consultation group in September 2014 (Table II-11). Several of these proposals involve tiered tariffs, with a higher remuneration in the early years (matching the higher cash flow requirements of the debt service repayment years).

75
Table II.11: Tariff proposals of the developers
Institution Capacity
(MW) Location Status Offered FIT
PLN - - - Not higher than FIT in other countries (China, Brazil, etc.)
UPC Renewable
50 - -
For non-diesel replacement 13.5 cent USD/kWh (years 1-15) 6.75 cent USD/kWh (years 16-30) For diesel replacement 15.5 cent USD/kWh (years 1-15) 7.75 cent USD/kWh (years 16-30)
SMI 10 - - 9.3-11.36 cent USD/kWh (8 years)
PT. Pertamina PT. Viron Energy
50 Sukabumi, West Java
In the process
of licensing
Years 1-8: 18-21 cent USD/kWh Years 9-20: 17 cent USD/kWh
WhyPgen 10 - -
Simulation with fixed tariff: 17.41 cent USD/kWh Simulation with downward staging: 23.34 cent USD/kWh (years 1-8) 13.04 cent USD/kWh (years 9-20)
PT. Sumberdaya Sewatama
0.5 Hambaprai
ng, East Sumba
In the process of EPC tender
RP 2750/kWh (10 years) *using refurbished turbine
PT. EAI PT. AGC
62.5 & 68
Jeneponto 1 & 2, South
Sulawesi
In the process of EPC tender
16-18 cent USD/kWh (20 years) for main grid (Java-Bali, Sumatra, South Sulawesi) 25-28 cent USD/kWh (20 years) for smaller grid
Source: MEMR-EBTKE, Minutes of the Focus group meeting, September 4-6,2014 230. When these tariffs are levelised over 20 years, they may be compared with our financial modelling results noted in Table II-10, as displayed in Figure II-3 and Table II-12.
Table II.12: Levelised tariffs as proposed by developers
USc/kWh Proposed by developers UPC, "non diesel replacement" 12.8 SMI 11.4 Pertamina/Viron (Sukabumi) 17.6 WhyPGen, fixed 17.4 WhyPGen, Tiered 19.4 UPC "diesel replacement" 14.7 PT Sumberdaya Sewatama, East Sumba 22.0 PT EAI/AGC, S. Sulawesi 16.0 PT EAI/AGC, West Timor 25.0 Our estimates (Table II- 13 ) Our estimate, Sumba 29.0 Our estimate, Central Java 17.3 Our estimate, S. Sulawesi 13.5

76
Figure II.3: Production cost based tariffs
Wind integration costs
231. Wind integration costs are a function of the capacity penetration and the size of system: Figure II-4 summarises wind integration costs in the US. In the case of wind projects in Java, where even several hundred MW of wind would represent just a few percent of the grid capacity, wind integration costs will be negligible. But on smaller islands, wind integration costs may be higher, since it may involve extensive modifications to control and dispatching systems.
Figure II.4: Results of studies of wind integration costs versus wind capacity penetration in various regions of the US25
25 http://www.rmi.org/RFGraph-Total_wind_integration_costs_capacity_penetrations
0 10 20 30 40
USc/kWh
SMI
UPC, "non diesel replacement"
Our estimate, S. Sulawesie
UPC "diesel replacement"
PT EAI/AGC, S. Sulawesi
Our estimate, Central Java
WhyPGen, fixed
Pertamina/Viron (Sukabumi)
WhyPGen, Tiered
PT Sumberdaya Sewatama (East S
PT EAI/AGC, West Timor
Our estimate, Sumba

77
Table II.13: Cost assumptions for grid integration costs
Grid integration Cost USD/MWh
Notes
Large Grids (Sulawesi)
$5 See Figure II-3. Average value was chosen.
Small Grids $10 See Figure II.3. High value is chosen because a hybrid controller and storage-based primary frequency response would be required.
232. The wind integration costs in Figure II-4 and Table II-13 are costs associated with increased reserves in all three timeframes—regulation, load following and unit commitment—that are needed to balance the net load variability due to wind generation. 233. Wind integration for the Sulawesi grid has been studied by Innovative Wind Energy Inc. as part of the Indonesia Clean Energy Development project’s technical assistance to PLN (funded by USAID). The report studied 9 scenarios (all combinations of low, medium and high wind, and low, medium and high load) with wind capacity addition timeframe of 70MW by 2015, 132.5MW by 2017, and 197.5MW by 2019. Power flow, short-circuit and stability analysis were performed. The analysis found no significant grid integration issues.26 Modern wind turbines manage intermittency and uncertainty of wind resource with sophisticated plant-level and turbine-level controls that enable stable and well-behaved performance of grids with high levels of wind power penetration: The grid code for interconnection of wind energy developed in this study contains requirements for wind turbines to possess such modern grid-friendliness features.27
Stakeholder comment #10: Storage at Wind farms
II.6 IMPLEMENTATION MODELS 234. In order to ensure smooth implementation of the FIT mechanism, strict conditions must be imposed on projects seeking eligibility for FIT. The conditions must ensure that a) project that are awarded the FIT are indeed built in the proposed timeframe and b) there is no hoarding and/or trading of projects that have been awarded the FIT. - All projects will be considered on a first-come-first-serve basis
26 Sources: (1) “Wind Integration Analysis of the Sulawesi System: Steady State Analysis,” Prepared
for USAID Indonesia Clean Energy Development project, prepared by Innovative Wind Energy, Inc., June 2014; (2) “Wind Integration Analysis of the Sulawesi System: Dynamic Stability,” Prepared for USAID Indonesia Clean Energy Development project, prepared by Innovative Wind Energy, Inc., June 2014. The two reports were submitted to PLN, but are not publicly available.
27 For details, see, e.g., N. Miller, GE wind plant advanced controls, presented at the First International Workshop on Grid Simulator Testing of Wind Turbine Drivetrains, June 2013; (www.nrel.gov/ electricity/transmission/pdfs/turbine_sim_12_advanced_wind_plant_controls.pdf.)
QUESTION: Should wind farms be required to have energy storage to eliminate variability? Reply: Based on world-wide experience, energy storage is not required for penetration levels of below 20%. Even above 20%, storage is one of the most expensive options. The second-to-minute variation of wind energy can be managed by primary frequency controls of other generators similar to managing load variations. Hour-to-hour variation can be managed by better forecasting and increasing the frequency of dispatching.

78
- The award of FIT is accompanied by signing of a standard PPA. The standard PPA specifies a period of two years for the full operation of the wind project, from the date of signing.
- All projects are required to deposit a performance bond in the amount of X USD at the time of signing of the standard PPA. o For projects of total size less than 1MW, X = greater of $10,000 or $20 per kW o For projects of total size between 1MW and 10MW, X = $20 per kW o For projects of total size higher than 10MW, X = $20 per kW
- Condition for forfeiture of the performance bond: o 50% of the turbines (tower, nacelle, generator, blades, transformer) are not erected by the
full operation date - One extension of full operation date is permitted for a maximum period of 90 days, at the
discretion of MEMR. - The FIT award is cancelled if the ownership of a project changes by more than 50% before
commissioning. - The performance bond is returned after successful commissioning and operation of all the
turbines prior to the full operation date or its single extension of 90 days
Stakeholder comment #11: Change in ownership of projects
Comment (wind developer): “The FIT award is (proposed to be) cancelled if the ownership of a project changes by more than 50%.” While we understand that this is meant to avoid PPA trading (and we agree with that), there are all kinds of valid reasons to change ownership of the project company which benefit the competitiveness of wind. Most importantly, investors with the lowest return requirement are commonly not involved in project development, but tend to come in at Financial Close or a short time after commissioning. The developer has a clear added value in identifying and developing a high quality project. The important thing is to prevent people from applying for PPAs and selling them, but with the conditions for registration/application (wind measurement, grid study, etc.) this will already be avoided. Reply: Change of ownership after commissioning is permissible. MoF may choose a different criterion.
Other licensing requirements
235. The other steps in the current process are described below. Note additional permits and licensing requirements may be required depending of project conditions. These permits, approvals, licensing and interconnection processes should be rationalized and implemented as one-stop-shop, as described in the main text.
Table II.14: MEMR permits and licenses.
Document Indonesian Name Issuing Office Application Time Direct Appointment Approval
Persetujuan penunjukan langsung
Director General of Electricity TBD
Temporary business license for electricity for public use
Ijin usaha ketenagalistrikan untuk umum (IUKU) Sementara
Director General of Electricity
30 days, valid for 2 years
Approval of the purchase price of electricity
Persetujuan harga beli tenaga listrik
Director General of Electricity 10 days
Permanent business license for electricity for public use
Ijin usaha ketenagalistrikan untuk umum (IUKU) Tetap
Director General of Electricity
30 days, valid for 30 years

79
Table II.15: Regency and Province level permits
Document Indonesian Name Issuing Office Processing Time Principle license/permit
Ijin Prinsip Bupati’s office
Environmental Impact Assessment (and subsequent environmental permit)
Analisa Mengenai Dampak Lingkungan (AMDAL) and Izin Lingkungan
Badan Lingkungan Hidup (to be approved by AMDAL evaluation commission)
75 working days for recommendation by AMDAL evaluation commission + 10 working days for approval
Permit for designated land use
Ijin peruntukan penggunaan tanah (IPPT)
Kantor Pelayanan Perizinan Terpadu
12 working days
Building construction permit
Ijin mendirikan bangunan (IMB)
Kantor Pelayanan Perizinan Terpadu
12 working days
Interference permit Surat ijin gangguan (SIGA)
Kantor Pelayanan Perizinan Terpadu
10 working days
Location permit Ijin lokasi Kantor Pertanahan
Table II.16: Other licenses and agreements required for a wind project.
Document Indonesian Name Issuing Office Principle license for domestic investment
Ijin prinsip penanaman modal dalam negeri
BKPMD (Regional Investment Coordination Board)
Appointment of the Developer
Penetapan pengembang PT PLN (Persero)
Power Purchase Agreement (not a license)
Perjanjian harga jual beli listrik
PT PLN (Persero)

80
Figure II.5: Environmental Procedures