targeting transit - new jersey future · targeting transit: september 2012 ... 10 transit ridership...
TRANSCRIPT
September 2012
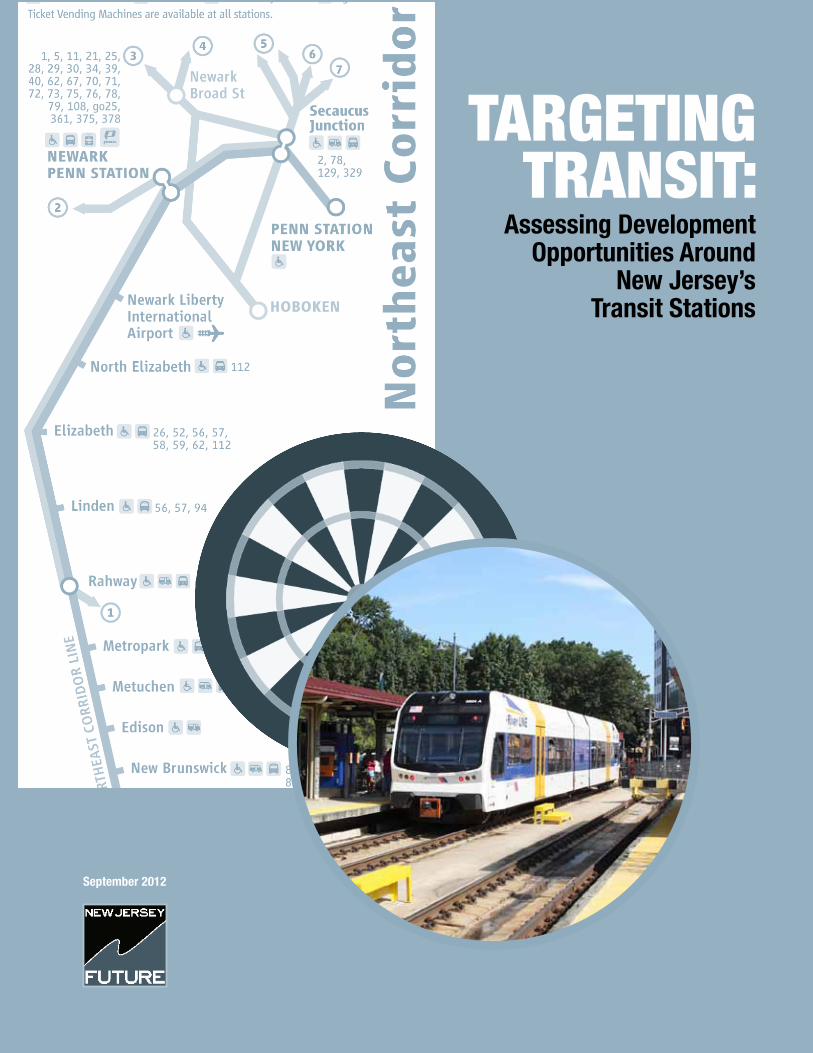
Assessing Development Opportunities Around
New Jersey’s Transit Stations
TargeTingTransiT:

September 2012
Table of Contents
1 ExecutiveSummary
2 Introduction:TheImportanceofTransitRidershipandTransit-OrientedDevelopment
5 Part1:BasicFactsAboutNewJersey’sPublicTransportationSystem
11 PartII:CharacteristicsofIndividualStations
14 PartIII:Characteristicsof“StationAreas”
19 PartIV:DifferentStations,DifferentFunctions
22 PartV:FromDatatoInformation
33 PartVI:PotentialUsersoftheInventory
35 PartVII:Recommendations
Maps
5 Map1:TransitCommutingRatesbyCounty
7 Map2:TheRailTransitSysteminNewJersey
8 Map3:NorthernNewJerseyDetailofNewJerseyTransitRailSystem
8 Map4:DetailofPhiladelphia-AreaRailTransit
9 Map5:NewJerseyandNewYorkFerryTerminals
Tables
6 Table1:StateswithTransitCommuteModeSharesExceedingtheNationalAverage
23 Table2:StationsServedbyMultipleRailLines
24 Table3:StationsServedbyMoreThanOneModeofTransportation
25 Table4:TransitMunicipalitiesWiththeLargestRatiosofJobstoEmployedResidents
25 Table5:TransitMunicipalitieswiththeGreatestNumberofJobs
26 Table6:StationAreasFeaturingtheHighestPopulationDensities
27 Table7:StationsinNeighborhoodsWithLowestPercentagesofSingle-FamilyDetachedHousing
28 Table8a:StationsinNeighborhoodsWhereatLeastOne-ThirdofHouseholdsDoNotOwnaVehicle
29 Table8b:AdditionalStationsinNeighborhoodsWhereatLeastTwo-ThirdsofHouseholdsOwn
atMostOneVehicle
30 Table9:StationsinNeighborhoodsHavingMedianHouseholdIncomeLessThan60Percent
ofStatewideMedia
31 Table10:StationsinNeighborhoodsHavingMedianHomeValueLessThan60Percentof
StatewideMedian
31 Table11:StationsinNeighborhoodsHavingMedianHomeValueGreaterThan200Percentof
StatewideMedian
32 Table12:StationswithDisproportionatelyLargeSuppliesofParking
32 Table13:StationswithLargeSuppliesofUnderutilizedSurfaceParking
Appendix:
39 ListofTransitStationsinNewJerseybyHostCountyandMunicipality
Table of Contents
2 Acknowledgements
3 Executive Summary
5 Introduction
5 Documenting Job Decentralization
7 Centralized vs. Decentralized Models of Employment Distribution
9 Concentrated Employment and Commuting: Sharing the Ride
10 Transit Ridership to the Big City
11 New Jersey Jobs Migrating Away from Transit
12 More Solo Drivers
14 Commute Times Increasing
15 Job Loss in Older Job Centers
18 Reconnecting Jobs with Transit
20 The Need for Transit Hubs within New Jersey
22 Recommendations
29 Endnotes
Figures
5 Relative Job Center
7 Job Decentralization: Employment Spreading Among More Municipalities
8 Centralized and Decentralized Employment Models
10 Job Distribution Models: Monocentric, Polycentric, and Dispersed
11 Percent of Employed Residents Commuting to Manhattan or Philadelphia
12 Municipalities Joining or Dropping Off the List of Absolute Job Centers
Making Up Half the State’s Total Private-Sector Employment, 1980-2000
13 Changing Commuting Characteristics Among Absolute Job-Center Municipalities
Comprising Half of Total Statewide Private-Sector Employment
14 Non-Single-OccupancyVehicle Commuting, New Jersey and United States, 1980-2000
15 Top 10 States by Average Travel Time to Work,Transit vs. Non-Transit
16 Biggest Job-Gaining and Job-Losing Municipalities, 1980-2003, Relative to the Rail Transit Network
17 Commuting Characteristics in Large Job-Losing and Job-Gaining Municipalities
(1980-2003),Tabulated by Municipality of Employment
18 Socioeconomic Characteristics of Declining Job Centers vs. New Jersey Total
21 Population Density vs. Per-CapitaVehicle-Miles Traveled for New Jersey Counties
23 Municipalities/Rail Transit Stations Recommended for Consideration as Transit-Oriented Employment Hubs
Tables
30 Absolute Job-Center Municipalities Comprising 50 Percent of Statewide
Private-Sector Employment, 1980 and 2003
32 Top 20 Job-Gaining and Job-Losing Municipalities, 1980-2003
GETTING TO WORK: RECONNECTING JOBS WITH TRANSIT 1
GETTING TO WORK:RECONNEC T I N G J OBS W I T H T RANS I TNovember 2008
Assessing Development Opportunities Around New Jersey’s Transit Stations

New Jersey is iN possession of a valuable resource: one of the most extensive public transportation systems in the country, an artifact of a transportation past that pre-dates the Interstate Highway System and the om-nipresence of the automobile. The legacy bequeathed by this resource is a rate of transit commuting that is second highest among the 50 states. Transit ridership creates many societal, economic, and personal benefits: for example, reducing congestion on the state’s roads; alleviating the emission of pollutants and greenhouse gases; reducing the need for vehicle ownership; and freeing up commuters’ time for other uses (reading, sleeping, etc.) rather than having to pay attention to the road. In general, transit creates efficiencies and reduces the per-capita impact of the transportation sys-tem by allowing multiple travelers to share the ride.
If increasing transit ridership is a desirable goal, then an intermediate goal must be to improve access to transit. The more activity centers (homes, stores, workplaces) are clustered near the transit system, the more people will be able to use transit for some of their daily ac-tivities. Transit-oriented development (TOD) is a term used to describe a development pattern that concen-trates activity centers near transit stations and fosters the kinds of pedestrian connectivity and amenities that help translate that physical proximity into actual foot traffic and transit use.
The transportation community, policy leaders with-in New Jersey state government, local officials, and
private real estate developers have all embraced TOD to varying degrees. But not all TOD is necessarily equal; some transit station areas may be particularly well suited to one type of development (office, retail, residential, parking) but not to others. The unique characteristics of each individual station area can in-form decisions about what kind of development should be encouraged at what locations.
Thus far, the determination of which stations are ap-propriate for which type of development has largely been an ad-hoc, opportunity-driven process rather than a systematic one. A comprehensive and objec-tive assessment of conditions around all of New Jersey’s transit stations would help identify those stations that pose the greatest opportunities for TOD in general, and for which variety of TOD. This in turn will help to direct limited public and private investments more efficiently and strategically.
The purpose of this report is to present and describe an analytic tool for prioritizing TOD investments that has been developed by New Jersey Future: an inventory of the state’s transit stations, populated with key data items pertaining to each station and the area surround-ing it. The report will also provide examples of the kinds of questions that can be answered with results generated from the inventory. From such a tool for quantitatively assessing and ranking transit stations and their host neighborhoods, a systematic, targeted TOD promotion strategy might evolve.
Executive Summary
Assessing Development Opportunities Around New Jersey’s Transit Stations
TargeTingTransiT:

New Jersey is iN possessioN of a valuable resource: one of the most extensive public transportation systems in the country, an artifact of a transportation past that predates the Interstate Highway System and the om-nipresence of the automobile. The legacy bequeathed by that resource is a rate of transit commuting that, at 11.2 percent,1 is second highest among the 50 states,2 taking hundreds of thousands of private vehicles off the road every day. (Although this report will fo-cus primarily on rail transit, because of the more per-manent nature of its physical facilities, it should be noted that bus commuting exceeds rail commuting in New Jersey – the 11.2 percent transit commuting rate breaks down as 6.6 percent bus, 4.4 percent rail, and 0.2 percent ferry.)
Not all TOD is necessarily equal. The unique characteristics of each individual station area may inform decisions about what kind of devel-opment should be encouraged at what locations.
Transit ridership creates many societal, economic, and personal benefits. It reduces congestion on the state’s roads by giving some people an alternative to driving. It alleviates the emission of pollutants and greenhouse gases that would have otherwise been generated by transit riders if they had driven cars instead. It reduces the amount of money that riders must spend on gaso-line and other costs of operating private vehicles, and may even allow them to reduce the number of vehicles they need to own. It frees up time by allowing riders to work, read, sleep, or otherwise relax on a train or bus instead of having to pay attention to the road. It gives employers located near transit hubs greater access
1 2010 one-year American Community Survey2 The state of New York has the highest rate of transit commuting in the country, at 27.8 percent. Its top ranking is attributable to the outsized effect of its biggest city, New York City, and particularly Manhattan. The high job density in Manhattan – a major source of employment for New Jerseyans, especially in the northern half of the state – is primarily re-sponsible for New Jersey’s high national ranking in transit commuting.
to a more dispersed workforce. In general, it creates efficiencies and reduces the per-capita impact of the transportation system by allowing multiple travelers to share the ride.
If increasing transit ridership is a desirable goal, for any or all of the above reasons, then an intermediate goal must be to improve access to transit, namely by in-creasing the number of people who can get to a transit station – whether on foot, by car, or some other means – from their point of origin within an elapsed time that does not exceed their tolerance threshold. A ma-jor factor that affects how many people have realistic access to transit is the pattern of the built environment surrounding transit stations. The more activity cen-ters (homes, stores, workplaces) are clustered near a transit station, with proximity generally being framed in terms of walking distance, the more people will be able to use transit for some of their daily activities.
Transit-oriented development,3 or TOD, is a term used to describe a development paradigm that seeks to concentrate activity centers near transit stations and foster the kinds of pedestrian connectivity and ame-nities that help translate that physical proximity into actual foot traffic and transit use. The transportation community and other policy leaders within New Jer-sey state government are well acquainted with the concept of TOD and have implemented it to varying degrees in a number of programs:
• New Jersey Transit (NJ Transit) staff, via the “Transit-Friendly Planning, Land Use & Develop-ment” program (which dates to 1992), regularly work with interested developers and local officials who seek to promote TOD at individual stations. For example, NJ Transit has been a key partner in Somerville’s ongoing effort to redevelop an old landfill property adjacent to its commuter rail sta-tion. Overall, more than 50 New Jersey commu-
3 See, for example, Chapter 1 of NJ Transit’s 1994 guidebook Planning for Transit-Friendly Land Use for a primer on transit-oriented development.
INTroducTIoN:The Importance of Transit ridership and
Transit-oriented development
2 Introduction
Not all TOD is necessarily equal. The unique characteristics of each individual station area may inform decisions about what kind of development should be encouraged at what locations.
nities to date have worked with NJ Transit to ad-vance TOD planning since the program’s inception.
• The New Jersey department of Transpor-
tation (NJdoT) inaugurated its Transit Village program in 1999. It was designed to help local government officials in transit-hosting municipali-ties to spur revitalization in transit station areas by laying the groundwork – making zoning changes, improving streetscapes and pedestrian amenities – that would encourage redevelopment projects to happen in the station area. Currently 24 station areas are designated Transit Villages.
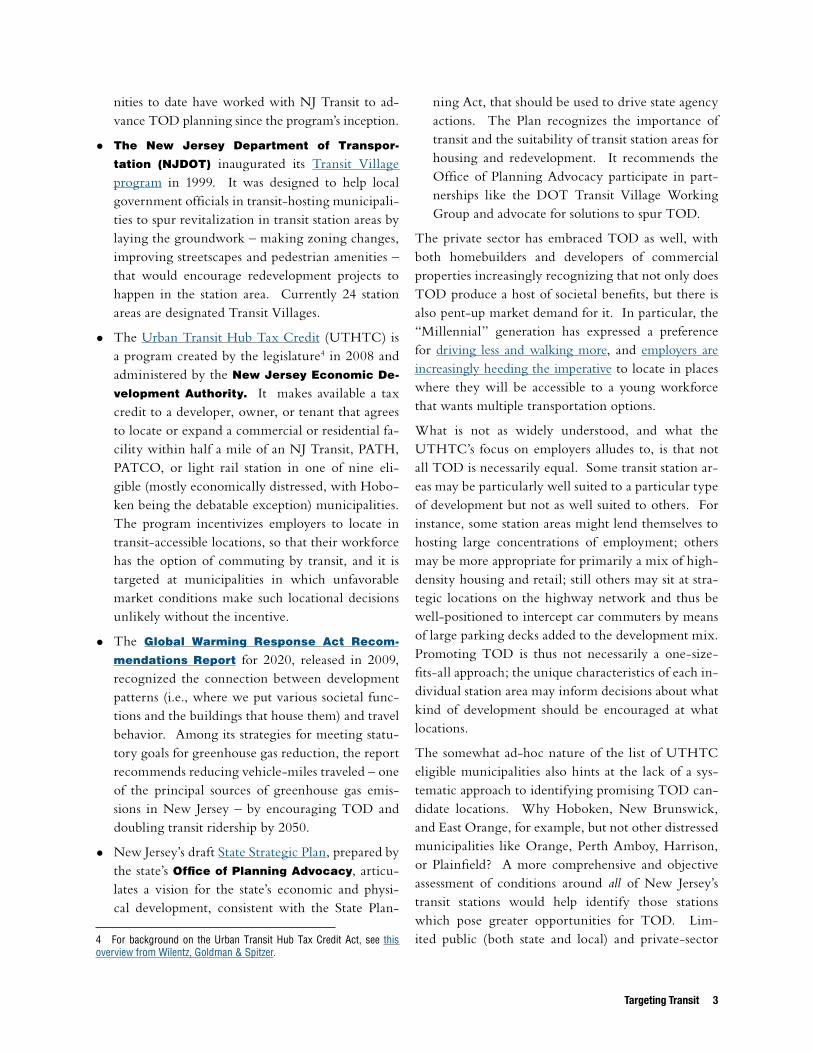
• The Urban Transit Hub Tax Credit (UTHTC) is a program created by the legislature4 in 2008 and administered by the New Jersey Economic de-
velopment Authority. It makes available a tax credit to a developer, owner, or tenant that agrees to locate or expand a commercial or residential fa-cility within half a mile of an NJ Transit, PATH, PATCO, or light rail station in one of nine eli-gible (mostly economically distressed, with Hobo-ken being the debatable exception) municipalities. The program incentivizes employers to locate in transit-accessible locations, so that their workforce has the option of commuting by transit, and it is targeted at municipalities in which unfavorable market conditions make such locational decisions unlikely without the incentive.
• The Global Warming response Act recom-
mendations report for 2020, released in 2009, recognized the connection between development patterns (i.e., where we put various societal func-tions and the buildings that house them) and travel behavior. Among its strategies for meeting statu-tory goals for greenhouse gas reduction, the report recommends reducing vehicle-miles traveled – one of the principal sources of greenhouse gas emis-sions in New Jersey – by encouraging TOD and doubling transit ridership by 2050.
• New Jersey’s draft State Strategic Plan, prepared by the state’s office of Planning Advocacy, articu-lates a vision for the state’s economic and physi-cal development, consistent with the State Plan-
4 For background on the Urban Transit Hub Tax Credit Act, see this overview from Wilentz, Goldman & Spitzer.
ning Act, that should be used to drive state agency actions. The Plan recognizes the importance of transit and the suitability of transit station areas for housing and redevelopment. It recommends the Office of Planning Advocacy participate in part-nerships like the DOT Transit Village Working Group and advocate for solutions to spur TOD.
The private sector has embraced TOD as well, with both homebuilders and developers of commercial properties increasingly recognizing that not only does TOD produce a host of societal benefits, but there is also pent-up market demand for it. In particular, the “Millennial” generation has expressed a preference for driving less and walking more, and employers are increasingly heeding the imperative to locate in places where they will be accessible to a young workforce that wants multiple transportation options.
What is not as widely understood, and what the UTHTC’s focus on employers alludes to, is that not all TOD is necessarily equal. Some transit station ar-eas may be particularly well suited to a particular type of development but not as well suited to others. For instance, some station areas might lend themselves to hosting large concentrations of employment; others may be more appropriate for primarily a mix of high-density housing and retail; still others may sit at stra-tegic locations on the highway network and thus be well-positioned to intercept car commuters by means of large parking decks added to the development mix. Promoting TOD is thus not necessarily a one-size-fits-all approach; the unique characteristics of each in-dividual station area may inform decisions about what kind of development should be encouraged at what locations.
The somewhat ad-hoc nature of the list of UTHTC eligible municipalities also hints at the lack of a sys-tematic approach to identifying promising TOD can-didate locations. Why Hoboken, New Brunswick, and East Orange, for example, but not other distressed municipalities like Orange, Perth Amboy, Harrison, or Plainfield? A more comprehensive and objective assessment of conditions around all of New Jersey’s transit stations would help identify those stations which pose greater opportunities for TOD. Lim-ited public (both state and local) and private-sector
Targeting Transit 3

resources could then be targeted more precisely to those stations where a particular type of development is likely to produce the greatest return on investment, whether measured in terms of ridership, economic re-vitalization, or some other goal advanced by TOD.
The purpose of this report is to present and describe an analytic tool, developed by New Jersey Future, for prioritizing TOD investments: an inventory of the state’s transit stations, populated with key data items pertaining to each station and the area surrounding it (sometimes defined as adjacent Census tracts and sometimes as the entire host municipality). Unless otherwise indicated, this project uses as its definition of the “station area” around each transit station a set of Census tracts delineated by NJ Transit that it con-siders to be within half a mile (roughly a 10-minute walking distance) of that station. NJ Transit’s analysis used 2000 Census tract boundaries. New 2010 Census tracts were recently defined by the Census Bureau, but NJ Transit has not as of this writing undertaken to up-date its station-area delineation using the new tracts.And in any event, the most recent Census Bureau data at the municipal or tract level derive from the 2005-2009 American Community Survey 5-year estimates, which use 2000 Census tract boundaries.
In a few instances, a transit station straddles municipal borders. For purposes of associating municipal-level data with a transit station, each of these stations has been assigned to a unique host municipality in order to simplify data collection. The station’s host munici-pality is defined as the municipality appearing in the street address listed by the transit operator for the sta-tion.
For various reasons, this report will focus on transit stations that involve fixed physical plant – an exclusive right of way and/or a permanent building or platform constructed specifically for the purpose of loading and unloading transit passengers. For example, a bus de-pot (an actual building with waiting area and ticket windows) would qualify as a “station” but a curbside bus stop would not. Land development agents respond to the implied long-term public-sector commitment represented by permanent physical infrastructure, a commitment that is not present in boarding loca-tions marked only with signs or shelters that are easily removed or relocated. Among other things, data are more readily available for these fixed-plant stations, likely because of the same permanence issue.
In addition to describing the variables contained in the inventory, the report will also provide examples of the kinds of questions that can be answered with results generated from the inventory. From such a tool for quantitatively assessing and ranking transit stations and their host neighborhoods, a systematic, targeted TOD promotion strategy might evolve.
Among employed New Jersey residents whose workplaces were located within New Jersey, only 5 percent rode transit to work – no better than the national average.
4 Introduction Targeting Transit 5

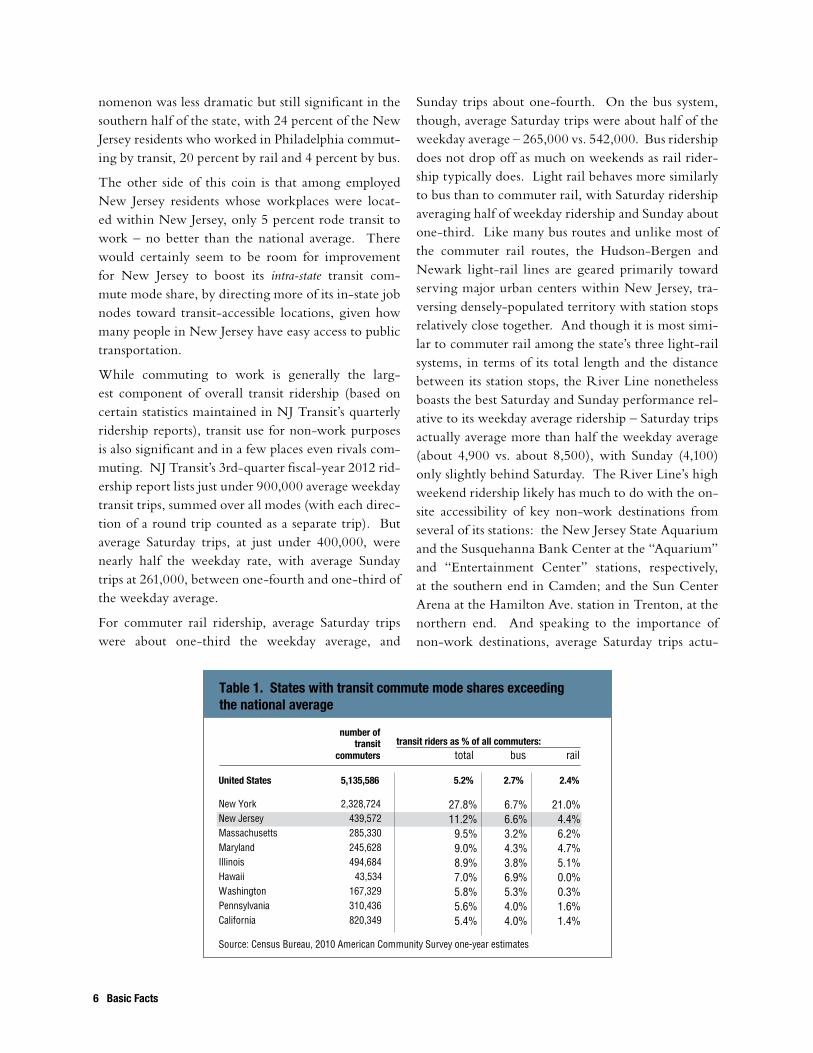
A greAter shAre of employed residents of New Jersey use public transportation to get to work than in any other state besides New York. As of the 2010 American Community Survey, one of every nine New Jersey commuters5 (11.2 percent) used transit, 6.6 per-cent by bus and 4.4 percent by rail (with ferry riders making up the small remainder). (See Table 1 for a list of states with the highest transit commute rates.) In absolute numbers, this is about 440,000 commuters
who are not in their cars every day. Anyone uncon-vinced of the value of transit should contemplate what New Jersey’s highway network would look like at rush hour with an additional 440,000 vehicles on it, on top of the more than 3 million people already commuting by car.
Certain individual counties6 outperform the state rate of transit commuting, specifically those closest to New York City (see Map 1): Hudson County (where 39.0 percent of employed residents commute by tran-sit), Essex (20.5 percent), and Bergen (13.3 percent). (By comparison, New York City’s transit commute mode share is 57.4 percent, while another 10.6 per-cent walked.) These county-level results reflect the transit system’s primary orientation toward the eco-nomic powerhouse of New York City, and especially Manhattan.
All but one of NJ Transit’s commuter rail lines con-verge at Newark, Secaucus, and/or Hoboken for the final trip across the Hudson River to New York. And New York-bound commuters do indeed dis-
5 “Commuters” refers specifically to workers not working at home. Home-based workers are excluded from the denominator of all mode-split percentage calculations in this report.6 County transit commute rates are from the 2005-2009 American Community Survey 5-year estimates.
proportionately use transit: an NJ Transit analy-sis of data from the 2000 Census7 found that one in every 15 employed New Jerseyans worked in Man-hattan, and 70.6 percent of them rode transit to work, 39.1 percent by rail (or ferry; the two were tabulated together)and 31.5 percent by bus. The phe-
7 Mode splits by destination county are not produced in tabular form by the Census Bureau; these figures are from a special analysis performed by NJ Transit. An updated analysis, using more recent American Com-munity Survey data, will likely be performed, but the necessary input data are not yet available.
Among employed New Jersey residents whose workplaces were located within New Jersey, only 5 percent rode transit to work – no better than the national average.
Targeting Transit 5
Part I: Basic Facts About New Jersey’sPublic Transportation System
Source: 2005-2009 American Community Survey 5-year estimates
Atlantic
Bergen
Burlington
Camden
Cape May
Cumberland
Essex
Gloucester
HudsonHunterdon
Mercer
Middlesex
Monmouth
Morris
Ocean
Passaic
Salem
Somerset
Sussex
Union
Warren
Map 1 Transit Commuting Rates by County
nomenon was less dramatic but still significant in the southern half of the state, with 24 percent of the New Jersey residents who worked in Philadelphia commut-ing by transit, 20 percent by rail and 4 percent by bus.
The other side of this coin is that among employed New Jersey residents whose workplaces were locat-ed within New Jersey, only 5 percent rode transit to work – no better than the national average. There would certainly seem to be room for improvement for New Jersey to boost its intra-state transit com-mute mode share, by directing more of its in-state job nodes toward transit-accessible locations, given how many people in New Jersey have easy access to public transportation.
While commuting to work is generally the larg-est component of overall transit ridership (based on certain statistics maintained in NJ Transit’s quarterly ridership reports), transit use for non-work purposes is also significant and in a few places even rivals com-muting. NJ Transit’s 3rd-quarter fiscal-year 2012 rid-ership report lists just under 900,000 average weekday transit trips, summed over all modes (with each direc-tion of a round trip counted as a separate trip). But average Saturday trips, at just under 400,000, were nearly half the weekday rate, with average Sunday trips at 261,000, between one-fourth and one-third of the weekday average.
For commuter rail ridership, average Saturday trips were about one-third the weekday average, and
Sunday trips about one-fourth. On the bus system, though, average Saturday trips were about half of the weekday average – 265,000 vs. 542,000. Bus ridership does not drop off as much on weekends as rail rider-ship typically does. Light rail behaves more similarly to bus than to commuter rail, with Saturday ridership averaging half of weekday ridership and Sunday about one-third. Like many bus routes and unlike most of the commuter rail routes, the Hudson-Bergen and Newark light-rail lines are geared primarily toward serving major urban centers within New Jersey, tra-versing densely-populated territory with station stops relatively close together. And though it is most simi-lar to commuter rail among the state’s three light-rail systems, in terms of its total length and the distance between its station stops, the River Line nonetheless boasts the best Saturday and Sunday performance rel-ative to its weekday average ridership – Saturday trips actually average more than half the weekday average (about 4,900 vs. about 8,500), with Sunday (4,100) only slightly behind Saturday. The River Line’s high weekend ridership likely has much to do with the on-site accessibility of key non-work destinations from several of its stations: the New Jersey State Aquarium and the Susquehanna Bank Center at the “Aquarium” and “Entertainment Center” stations, respectively, at the southern end in Camden; and the Sun Center Arena at the Hamilton Ave. station in Trenton, at the northern end. And speaking to the importance of non-work destinations, average Saturday trips actu-
6 Basic Facts Targeting Transit 7
Table 1. States with transit commute mode shares exceedingthe national average
transit riders as % of all commuters:total bus rail
United States 5,135,586 5.2% 2.7% 2.4%
New York 2,328,724 27.8% 6.7% 21.0%New Jersey 439,572 11.2% 6.6% 4.4%Massachusetts 285,330 9.5% 3.2% 6.2%Maryland 245,628 9.0% 4.3% 4.7%Illinois 494,684 8.9% 3.8% 5.1%Hawaii 43,534 7.0% 6.9% 0.0%Washington 167,329 5.8% 5.3% 0.3%Pennsylvania 310,436 5.6% 4.0% 1.6%California 820,349 5.4% 4.0% 1.4%
Source: Census Bureau, 2010 American Community Survey one-year estimates
number of transit
commuters

Targeting Transit 7
Delaw
are River
Rahway
Denville
High Bridge
MLK B
lvd
Journal Square Grove St
Harrison
World TradeCenter
9th St
14th St
23rd St
33rd St
Milita
ry P
k
Norfo
lk St
Park Ave
Bloo
mfield
AveBr
anch
Broo
k Par
k
Grove
St
Silve
r Lak
e
Bloomfield
Glen Ridge
Bay StWalnut St
Watchung AveUpper Montclair
Watsessing
Little FallsLake Hopatcong
Chatham
Convent Station
Morris Plains
Madison
Mount Tabor
Westfield
Roselle Park
Cranford
Raritan
Bound Brook
Bridgewater
Hamilton
Princeton
Metropark
Princeton Dinky Shuttle
Ridgewood
Union
PENNSYLVANIA
Netcong
Mount Olive
W.Side
Ave
Atlantic Ocean
Junction
Delawar
e Rive
r
Tonn
elle
Ave
BordentownRoebling
Beverly-Edgewater ParkDelanco
RiversideCinnaminson
RivertonPalmyra
Pennsauken-Rt 73
36 St
NJPAC
P4
NEW JERSEY
PENNSY
LVAN
IANEW
JERSEY
New Brunswick
Mountain AveMontclair Heights
Avenel
Mount Arlington
Terminals
®
TrentonTransit Center
EdisonMetuchen
Linden
Elizabeth
N. Elizabeth
Red Bank
Bay Head
Manasquan
Spring Lake
Belmar
Bradley Beach
AllenhurstElberon
Point Pleasant Beach
Morristown
Dover
Towaco
Lincoln Park
Mountain View Wayne
Wayne Rt. 23
LyndhurstDelawannaPassaic
Clifton
Waldwick
Ho-Ho-Kus
Allendale
Mahwah
Tuxedo
Otisville
Sloatsburg
Broa
dway
Garfie
ld
Hawthorne
Ramsey
Harriman
Campbell Hall
Middletown
Glen RockMain Line
Salisbury Mills-Cornwall
Spring Valley
Stadium
STATEN ISLAND
Middletown
Hud
son
Riv
er
NewarkLiberty
Int’l Airport
Garwood
Fanwood
NetherwoodDunellen
North
Bra
nch
White
Hou
se
Leba
non
Anna
ndale
Somerville
Asbury Park
NEW YORK
NEW YORK
Jersey Ave
Suffern
Wash.Park
Hamilton Ave
Burlington South
Cass St
Burlington Towne CtrFlorence
Plainfield
City Hall
Atlantic City
Absecon
Egg Harbor City
Hammonton
Atco
Long Branch
Montclair State University Meadowlands
Hackettstown
Atlantic St
RAIL
Plau
derv
ille
Metro-North Port Jervis Line
RamseyRoute 17
Washi
ngto
n St
SecaucusJunction
Broad StNewark
Daven
port
Ave
Glen RockBoro Hall
With MidTown DIRECT service to New York
With MidTown DIRECT service to New York
reviR era
waleD
Radb
urn
Fair
Lawn
Paterson
Short Hills
Millburn
Maplewood
Mountain Station
Highland Ave
E.Orange
Brick Church
Orange
S.Orange
Summit
Boonton
Mountain Lakes
Harsimus Cove
Port
Impe
rial
Port Authority Services
Light Rail
TransferStation
Station
Future Station
Train
No Smoking permitted at NJ TRANSIT Stations and Platforms. NJSA 40:48-1 and 40:48-2.
Hazlet
Perth
Ambo
y
Warre
n St
/NJIT
Christopher St
Cherry Hill
Aber
deen
-Mat
awan
Entertainment Ctr
Aquarium
Cooper St
-Rutgers
Liberty State Pk
Marin Blvd
Essex St
Jersey AveRichard St34th St
45th St
Danforth Ave22nd St8th St
Little SilverMonmouth Park
Lindenwold
Purchase your tickets before boarding train when a ticket agent and / or a ticket vending machine is available. A $5 surcharge is applied if TVM or ticket office were open at the time of boarding.
Accessible Station
Ferry Connection
Transfer required to New York
CB
AP3P2P1
Exchange Pl
Pennsauken
Transit Center
Garfie
ld A
ve
NEW JERSEY
NEW YORK
Berge
nlin
e
Ave
Woodb
ridge
Sout
h Ambo
y
Port Jervis
Ruth
erfo
rd
(under construction)
New Providence
Murray Hill
LineWith MidTown DIRECTservice to New York
CB 10/11
Wood-Ridge
Essex St
Anderson St
River EdgeOradellEmerson
WestwoodHillsdale
Woodcliff LakePark Ridge
Pearl RiverNanuet
New Bridge Landing
TeterboroHackensack
Hackensack
Montvale
LEGEND
Millington
Gillette
Stirling
Lyons
Berkeley Heights
Gladstone
PeapackFar Hills Bernardsville
Basking Ridge
Amtra
k / SE
PTA S
ervice
to Ph
ilade
lphia
StreetOrange
F r a n k R . L a u t e n b e r g
Fair
Lawn
Meadowlands Rail Line
Williams Ave
Hoboken
2nd St
(seasonal service)
Haddonfield
Westmont
Ferry AveCollingswood
Ashland
Woodcrest
Walter Rand Transp. Center
(PATCO Broadway Station)
Kingsland
Transit Center
Philadelphia30th Street Station
8th St/Market St
12th/13th & Locust St
15th/16th & Locust St
SEPTA Regional RailMarket-Frankford LineTrolley Route 10, 11, 13, 34, 36
SEPTA Regional Rail
NY Penn Station
Long Island Rail RoadNew York City Transit
November 2011NON-DISCRIMINATION POLICY:
NJ TRANSIT is committed to ensuring that no person is excluded from, or denied the benefits of, our services on the basis of race, color or national origin as protected by Title
VI of the Civil Rights Act of 1964, as amended. No person or group of persons shall be discrimi-nated against with regard to the routing, scheduling or quality of transportation service on
the basis of race, color or national origin. Frequency of service, age and quality of vehicles assigned to routes, quality of stations serving different routes, and location of routes may
not be determined on the basis of race, color or national origin. Any person who believes that they have, individually, or as a member of any specific class of persons, been subjected to
discrimination on the basis of race, color or national origin may file a complaint in writing to NJ TRANSIT Customer Service - Title VI Division, One Penn Plaza East, Newark, NJ 07105. A complaint
must be filed within 180 days of the alleged discrimination.
NJ TRANSIT Information(973) 275-5555
NJ TRANSITTelephone Text(800) 772-2287
NJ TRANSITSecurity Hotline
(888) TIPS NJT
(888) 847-7658
LincolnHarbor
9th St/Congress St
Pavonia-Newport
Newark Penn
9th/10th & Locust St
System Map
njtransit.com
or
Text Tips to NJTPD (65873)
Harborside
Map 2 The Rail Transit System in New Jersey
Source: New Jersey Transit, reproduced from their website.

8 Basic Facts Targeting Transit 9
ally exceed average weekday trips on the Atlantic City commuter rail line, whose eastern terminus is just a few blocks from the boardwalk and casinos.
Transportation planners have a tendency to focus dis-proportionately on the work trip, but if a wide enough array of destinations are accessible via public transpor-tation, riders will use transit at all hours of the day (or night, as the 24-hour New York City Subway and PATH systems can attest) for all manner of trip pur-poses. Good TOD should include a diverse mix of activities, to encourage transit use throughout the day, not just in the morning and evening peak periods.
Good TOD should include a diverse mix of activities, to encourage transit use throughout the day, not just in the morning and evening peak periods.
So where are all of New Jersey’s opportunities for TOD? Just how many transit stations are we talk-ing about? Many of New Jersey’s citizens, and even many of its public officials, may not be cognizant of just how extensive the state’s transit system actually is. First of all, the “system” is actually a collection of interconnected systems, run by multiple operators and comprising bus, rail (see Map 2) and ferry operations:
• NJ Transit runs a commuter rail system that it sub-divides into eight individual lines for operational and accounting purposes, although the Main and Bergen lines and the Morristown and Gladstone-branches of the Morris & Essex Lines are geo-graphically separate facilities (and are graphically depicted as such on the NJ Transit system map), arguably bringing the true functional total to 10.
• NJ Transit also operates three light-rail transit (LRT) systems: the Newark Light Rail (formerly known as the Newark City Subway), Hudson-Ber-gen Light Rail (HBLR, serving the Hudson Riv-er waterfront area), and River Line (connecting Camden and Trenton along the Delaware River). (See Map 3 for detail on HBLR and Newark Light Rail.)
• Two branches of the Philadelphia-based SEPTA (Southeastern Pennsylvania Transportation Au-thority) “Regional Rail” commuter-rail system
Good TOD should include a diverse mix of activities, to encourage transit use throughout the day, not just in the morning and evening peak period
Source: Southeastern Pennsylvania Transportation Authority, reproduced from their website.
Map 3 Northern New Jersey detail of NJ Transit rail system map, including PATH, Hudson-Bergen Light Rail, Newark Light Rail, and commuter rail line terminal stations
Map 4 Detail of Philadelphia-Area rail transit, including PATCO and Trenton and West Trenton SEPTA commuter rail stations
extend into New Jersey, terminating at Trenton and West Trenton. (See Map 4.)
• The PATH (Port Authority Trans-Hudson Cor-poration) subway/surface rapid-transit system (see Map 3) connects Newark, Jersey City, and Hobo-ken with Lower and Midtown Manhattan and is run by the Port Authority of New York and New Jersey.
• The PATCO (Port Authority Transit Corporation) subway/elevated rapid-transit system connects a string of Camden County suburbs with the cit-ies of Camden and Philadelphia and is run by the Delaware River Port Authority. (See Map 4.)
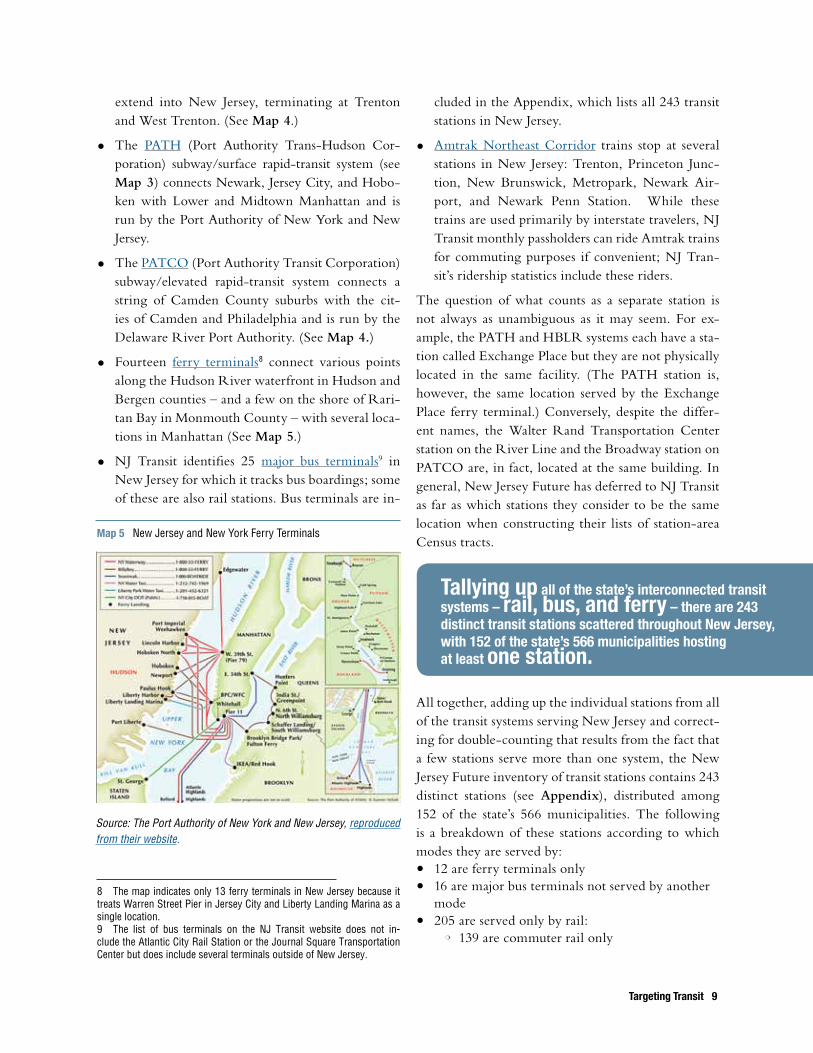
• Fourteen ferry terminals8 connect various points along the Hudson River waterfront in Hudson and Bergen counties – and a few on the shore of Rari-tan Bay in Monmouth County – with several loca-tions in Manhattan (See Map 5.)
• NJ Transit identifies 25 major bus terminals9 in New Jersey for which it tracks bus boardings; some of these are also rail stations. Bus terminals are in-
8 The map indicates only 13 ferry terminals in New Jersey because it treats Warren Street Pier in Jersey City and Liberty Landing Marina as a single location.9 The list of bus terminals on the NJ Transit website does not in-clude the Atlantic City Rail Station or the Journal Square Transportation Center but does include several terminals outside of New Jersey.
cluded in the Appendix, which lists all 243 transit stations in New Jersey.
• Amtrak Northeast Corridor trains stop at several stations in New Jersey: Trenton, Princeton Junc-tion, New Brunswick, Metropark, Newark Air-port, and Newark Penn Station. While these trains are used primarily by interstate travelers, NJ Transit monthly passholders can ride Amtrak trains for commuting purposes if convenient; NJ Tran-sit’s ridership statistics include these riders.
The question of what counts as a separate station is not always as unambiguous as it may seem. For ex-ample, the PATH and HBLR systems each have a sta-tion called Exchange Place but they are not physically located in the same facility. (The PATH station is, however, the same location served by the Exchange Place ferry terminal.) Conversely, despite the differ-ent names, the Walter Rand Transportation Center station on the River Line and the Broadway station on PATCO are, in fact, located at the same building. In general, New Jersey Future has deferred to NJ Transit as far as which stations they consider to be the same location when constructing their lists of station-area Census tracts.
Tallying up over all of the state’s interconnect-ed transit systems – rail, bus, and ferry – there are 243 distinct transit stations scattered throughout New Jersey, with 152 of the state’s 566 municipalities hosting at least one station.
All together, adding up the individual stations from all of the transit systems serving New Jersey and correct-ing for double-counting that results from the fact that a few stations serve more than one system, the New Jersey Future inventory of transit stations contains 243 distinct stations (see Appendix), distributed among 152 of the state’s 566 municipalities. The following is a breakdown of these stations according to which modes they are served by:• 12 are ferry terminals only• 16 are major bus terminals not served by another
mode• 205 are served only by rail:
m 139 are commuter rail only
Tallying up all of the state’s interconnected transit systems – rail, bus, and ferry – there are 243 distinct transit stations scattered throughout New Jersey, with 152 of the state’s 566 municipalities hosting at least one station.
Targeting Transit 9
Source: The Port Authority of New York and New Jersey, reproduced from their website.
Map 5 New Jersey and New York Ferry Terminals
m 9 are rapid transit10 only (7 PATCO and 2 PATH) m 54 are light rail only (21 HBLR, 15 Newark Light Rail, 18 River Line) m 3 are served by multiple rail modes:
Lindenwold (PATCO and commuter rail), Newark-Broad St. (commuter and light rail), and Newport/Pavonia (PATH and light rail). The Pennsauken Transit Center, currently under construction, will fall into this category as well (served by commuter and light rail).
• 10 are multimodal terminals m 1 (Hoboken Terminal) is served by all 3 rail
modes and is also a bus and ferry terminal m 1 (Newark Penn Station) is served by all 3 rail
modes and is also a bus terminal m 1 (Trenton) is served by commuter rail (both
NJ Transit and SEPTA) and light rail and is a bus terminal
m 1 (Walter Rand Transportation Center in Camden) is served by light rail and rapid transit (PATCO) and is a bus terminal
m 4 (Metropark, New Brunswick, Asbury Park, and Atlantic City) are commuter rail stations that also serve as bus terminals
m 1 ( Journal Square) is a rapid transit station that also serves as a bus terminal
m 1 (the Exchange Place PATH station) is a rapid transit station that also serves as a ferry terminal
A total of 215 stations are served by one or more rail
Counting the stations by which modes they are served by, with double counting for stations served by mul-tiple modes, we have:
• a total of 215 stations served by one or more rail modes
• 148 stations served by commuter rail
• 60 served by light rail
• 16 served by rapid transit (PATH or PATCO)
• 25 major bus terminals
• 14 ferry terminals
As mentioned earlier, NJ Transit has delineated a half-mile radius of Census tracts around each of the state’s rail transit stations, roughly corresponding to the dis-
10 Also called subway/elevated or “heavy rail,” usually with power supplied by an electrified third rail.
tance that research has shown most people are willing to walk to a station. It has not, however, carried out a similar analysis for the 28 stations on this list that are served only by bus or ferry (12 ferry-only, 16 bus-only). But even looking only at rail stations, the transit system’s reach is impressive: Out of the state’s 1,944 Census tracts (as defined for the 2000 Census), 657 fall at least partially within half a mile of one or more of the 215 rail stations. Using 2005-2009 ACS popula-tion estimates, the number of people living in the 657 rail tracts – about 2.8 million people – amounts to a
full one-third of the state’s total population (32.8 per-cent). With so many people living within walking dis-tance of it, the rail transit system’s potential to reduce the need for car travel should not be underestimated.
The first step in determining how to boost the share of people with easy access to transit who actually use transit is to take account of how the 243 individual transit stations are presently functioning, in terms of things like frequency of service, how many riders they attract, or how those riders get to the station. Likewise, it is also important to assess the fiscal, demographic, and socioeconomic characteristics of the transit stations’ host neighborhoods (as defined using proximate Cen-sus tracts) and municipalities (for data that are either not produced at the Census tract level or, like variables related to property taxes, are determined by the mu-nicipality). Understanding the factors that influence transit ridership at the individual station level is key to identifying which locations have the greatest potential to attract TOD, and then anticipating what kind of de-velopment is most likely to succeed at which locations.
To this end, New Jersey Future has assembled an in-ventory of the state’s transit stations and has compiled a host of information about the stations themselves and the neighborhoods and municipalities that surround them. The next two sections of the report list these data items – one section for variables associated with the station and one section for variables associated with the surrounding area – and provide a brief explanation of what each variable contributes to an assessment of TOD potential.
10 Basic Facts
A total of 215 stations are served by one or more rail modes.
Roughly one-third of the state’s total population lives within walking distance of a rail transit station.
Centrally located stations served by multiple lines can attract riders from a wider variety of origins thancan stations served by only a single line.
Targeting Transit 11
the trANsit stAtioN inventory variables in this section pertain directly to the individual transit sta-tion and its function as a transportation facility. These features of the transit station are important no matter what type of neighborhood the station is located in. Each variable is followed by an explanation of how its value can be interpreted as a measure of development or ridership potential.
centrality/accessibility. Generally, the greater the number of lines that serve a station, the greater the number of origins from which the station is directly accessible. This is intuitively what we mean when we say a station is “centrally located.” The total number of lines, including summing over all agencies serving the station, is a good objective measure of accessibility.
Greater centrality/accessibility is better. Stations served by more than one line within a single mode – and especially stations served by more than one mode – should score higher as TOD candidates because of their greater degree of accessibility. They can attract riders from a wider variety of origins, or can dissem-inate riders to a wider variety of destinations, than can stations served by only a single line. For bus and ferry terminals, connectivity could be measured by the number of routes emanating from the terminal, although these routes are less permanent than for rail transit because they do not use fixed guideways.
Centrally located stations can attract riders from a wider variety of origins than can stations served by only a single line.
Intermodality. The number of transportation modes that serve a given station is another aspect of accessi-bility. Different modes tend to specialize in servicing trips of differing average lengths – for example, bus and light-rail vehicles stop much more frequently and lend themselves to shorter trip lengths than commut-er-rail trains, because commuter trains take a longer time to accelerate and decelerate. (The distinction between modes is somewhat subjective; as previously mentioned, the River Line uses light-rail vehicles but
operates more like a commuter rail line, in terms of its overall length, distance between station stops, and the types of communities it serves.) In general, hav-ing more modes serving a station increases the op-tions for accessing that station. All other things being equal, stations served by multiple modes (commuter rail, light rail, rapid transit, bus routes, ferry) should thus score higher on TOD potential because of the greater variety of destinations from which they can at-tract riders, not just in terms of the number of compass directions but also in terms of the range of distances.
It should be noted that while a station being served by multiple routes and multiple modes gives that station
Accessibility: Multiple Routes, Multiple Modes… Multiple Operators?
A greater number of routes, lines, or modes serving a transit station generally makes that station accessible from a greater range of origins. But what about multiple operators? It may at first be tempting to think that more systems converging on a location is better. But when considered as a sub-issue of overall accessibility, greater complexity is less desirable, especially if the station serves as a transfer point for many riders, not just a final destination. For a given number of lines or modes serving a single station, it is generally preferable for them to be operated by the same agency, because of the implied consistency of the ticketing and access control apparatus. The complexity of transferring among systems operated by multiple agencies11 can be overcome via integrated ticketing/farecards (NYC Subway farecards are also accepted on PATH, for example), but all other things being equal, a larger number of system operators should probably be considered a negative. Encouraging greater transit ridership by improving accessibility should involve making transfers among lines and modes as seamless as possible.
Some steps have already been taken toward better integra-tion: NJ Transit and New York Waterway (operator of several ferry services between New Jersey and New York) recently announced a joint monthly pass that will be accepted by both carriers, and SEPTA is preparing to introduce new technology that will bypass proprietary farecards altogether by allowing riders to pay using their existing credit or debit card.
11 Or even the same agency – transferring among NJ Transit’s bus, commuter rail, and light rail facilities requires separate fare payments for all riders except those holding monthly passes.
Part II: characteristics of Individual Stations
Roughly one-third of the state’s total population lives within walking distance of a rail transit station.
Centrally located stations served by multiple lines can attract riders from a wider variety of origins thancan stations served by only a single line.
12 Characteristics of Individual Stations
an advantage with regard to accessibility, it is also preferable if those multiple access routes are not oper-ated by multiple entities – see sidebar on page 11.
ridership. Current ridership statistics show which transit stations are already demonstrating an ability to attract large numbers of riders and hence may have the potential to attract more, if their host municipali-ties were to adopt explicit TOD strategies. Ridership statistics can be thought of as a de facto poll of the present-day transit-riding public as to which stations they think offer the closest, most convenient, or least expensive access.
Frequency of service. The inventory includes a tally of the number of stops per day at each station, compiled from timetables listed on the NJ Transit website. The number of stops in the peak period (as defined by the operator) is tabulated separately. A greater number of stops per day creates greater convenience for riders by increasing their range of departure time options. This is especially important in the peak period, when com-muters need to get to work by a certain time. Higher frequency of service is thus assumed to be better. In fact, the higher frequency of service generally provid-ed by light rail and subway-type rapid transit systems, as compared to commuter rail, probably explains why TOD has more often tended to occur naturally around those stations. The higher frequency of service means riders can use transit for all kinds of daily activities, not just the commute to work.
Number of transfers required to reach major
regional destinations. Stations offering a one-seat ride to major regional destinations should score higher because the greater convenience these stations offer to their riders is likely to be a factor in attract-ing additional riders. (The jump in ridership on NJ Transit’s Morris & Essex and Montclair-Boonton lines in the wake of the introduction of “Midtown Direct” service on those lines – direct service to New York Penn Station, as opposed to terminating in Hoboken and requiring a transfer to PATH or ferry to reach Manhattan – attests to the popularity of a one-seat ride.) More generally, the fewer transfers required to reach these major destinations, the more attractive the service becomes. Derived from maps of the state’s transit systems, the inventory includes the number of
transfers required to travel from each station to each of the following major destinations:
• New York Penn Station (including the 33rd St. PATH station)
• Lower Manhattan, as represented by either the World Trade Center PATH station or one of the downtown ferry terminals as the destination, or assuming a transfer to the New York City Subway A, C, and E lines at Penn Station
• Center City Philadelphia, defined as Market East, Suburban Station, or one of the Center City PATCO stops (but not 30th St. Station, which is not in Center City)
• Newark Penn Station
Travel time to major regional destinations. As with the number of transfers, the travel time required to reach major destinations will affect a station’s at-tractiveness to riders. Obviously, a shorter travel time is more desirable. The transit station inventory in-cludes travel times to New York Penn Station calcu-lated by the Regional Plan Association for stations on NJ Transit’s commuter rail lines. Adding travel times to other major destinations, as well as adding travel times to New York Penn for stations on other systems (PATH, HBLR), would be desirable future enhance-ments to the inventory.
Parking. The availability (total number of spaces), configuration (surface lots vs. structures), and utili-zation rate (percent of spaces typically occupied) of parking adjacent to a transit station can all provide insight into numerous aspects of how the station is accessed. Perhaps most obviously, a total absence of parking indicates that all access to the station is by some method other than private automobiles; this will typically be the case mainly in very high-density areas where a large number of residences and businesses are located within walking distance of the station.
Where parking is available, the number of spaces as-sociated with the station relative to the number of av-erage daily riders will give an idea of what share of the ridership typically arrives at the station by private vehicle. A higher ratio indicates greater reliance on automobile access, while a low supply of parking for a given ridership level may mean that the station is
While even park-and-ride locations can benefit from some aspects of TOD, caution should be taken about actually reducing the amount of parking available at these sites, since their strategic locations on the road network allow them to intercept commuters from throughout the surrounding region and divert them onto transit.

Targeting Transit 13
located so as to allow many riders to reach the sys-tem without having to drive and park. Of course, a low ratio could also simply be a function of a short-age of parking associated specifically with the station, a shortage that might be causing parking pressure to overflow into surrounding neighborhoods, where transit agency parking statistics fail to capture it. A parking shortage could also be deterring some poten-tial users from riding transit altogether.
While even park-and-ride locations can benefit from some aspects of TOD, caution should be taken about actually reducing the amount of parking available at these sites, since their strategic locations on the road network allow them to intercept commuters from throughout the surrounding region and divert them onto transit.
The number of spaces at a given station relative to other stations on the same line – or relative to the population of the station area – can hint at the effec-tive catchment area of the station, i.e. the range of distances from which transit riders are accessing this station. Stations with a disproportionately high sup-ply of parking may be serving as regionally impor-tant park-and-rides, with strategic locations on the road network that are able to intercept commuters from surrounding municipalities or counties (or even states!) who might otherwise drive the rest of the way to work. This is especially true if the parking uti-lization rate is high. While even locations that are primarily park-and-rides may benefit from the addi-tion of some components of TOD, caution should be taken about actually reducing the amount of parking available at these sites, as this may inadvertently cause diversion of some transit riders back onto the road network. The replacement of surface parking lots with structured parking may be the optimal approach in these locations, with the freed-up space being used
either for other land uses (housing, retail, etc.) or to increase the supply of parking, depending on estimat-ed latent demand.
A low parking utilization rate, on the other hand, is a sign of excess supply and may point to sites with good redevelopment potential – that is, sites where unused parking could be replaced by TOD land uses that are designed to generate activity around the sta-tion. This is especially true if the station-area parking is all in surface lots rather than decks, as is the case at a large majority of stations, since replacing parking with more intensive uses will not involve demolition of any existing structures or the need to acquire additional property.
The transit station inventory contains information on the total number of parking spaces at each rail station and the breakdown of how many of these spaces are in surface lots vs. decks, as well as an overall average utilization rate (monitored by NJ Transit on an ongo-ing basis). While these statistics alone may not point toward a single conclusion as to the station’s most promising potential TOD configuration, in combi-nation with other data items they can help fill out a profile of how the station is presently functioning and thus raise necessary questions about whether and how these functions need to be maintained or reproduced elsewhere on the system.
Underutilized surface parking lots could be redevel-oped with TOD land uses that are designed to gener-ate activity around the station.
Under-developed surface parking lots could be redeveloped with TOD land uses that are designed to generate activity aroundthe station.
While even park-and-ride locations can benefit from some aspects of TOD, caution should be taken about actually reducing the amount of parking available at these sites, since their strategic locations on the road network allow them to intercept commuters from throughout the surrounding region and divert them onto transit.
14 Characteristics of Station Areas
the vAriAbles iN this section pertain to the area or neighborhood surrounding the station rather than to the station itself. Many of the factors that affect ridership at a transit station are functions of what kind of development surrounds the station, irrespective of where the station is located in the context of the larger transit network. Demographic and economic factors, such as the median household income or vehicle own-ership rate of the residents who live near the station, will influence whether these residents choose to ride transit or not. Likewise, the number of jobs located near the station will affect the station’s attractiveness as a destination. Furthermore, some characteristics of the station area will provide important screening criteria if revitalization of weak-market areas is an ex-plicit goal of a particular TOD program (as is the case with the Urban Transit Hub Tax Credit).
Many of the factors that affect ridership at a transit station are functions of what kind of development surrounds the station.
For data items that are available at the Census tract level, the “station area” is defined as the set of Census tracts that NJ Transit considers to be within a half-mile radius of the station. For any such variable, the transit station inventory is structured to enable the construction of station-area summaries by cumulating the tract-level values over all station-area tracts. In other cases, an important data item is available only at the municipal level, in which case it will be associated with any and all transit stations located in that mu-nicipality. Each variable in this section is flagged as to whether it is a tract-level or municipal-level data item and is followed by an explanation of how its value can be interpreted as a measure of development or rider-ship potential.
Population density. Population and land area are available from the Census Bureau for all Census tracts, so density can be computed at the station level. Sta-tions surrounded by higher-density residential devel-opment – as measured by people per square mile in
the station area – should score higher as candidates for primarily residential TOD. At a very basic tautological level, more people within walking distance of the sta-tion means more potential riders. It may also be true
that residents in higher-density station areas are already accustomed to density and are thus somewhat less like-ly to reflexively resist any new development, though some resistance to change is virtually inevitable.
Alternatively, density can be measured using number of households rather than population. The household-based measure will provide a more accurate picture of actual building density, since the number of house-holds is by definition the same as the number of oc-cupied housing units. The station inventory includes both variables.
Population change. Population loss could serve as an indicator of distress, if a TOD assistance program is intended to be targeted at municipalities or station loca-tions where the market might not otherwise be strong enough to support redevelopment. Conversely, high population growth could indicate heavy and/or grow-ing demand and might argue for greater public-sector involvement in facilitating TOD to harness market forces that are already moving in that direction. The inventory includes a measure of population change over the decade of the 2000s for each station area.
Employment. Employment data is typically available at the municipal level on an ongoing basis from the New Jersey Department of Labor and is included in the inventory. Employment was also formerly avail-able every 10 years at the Census tract level from the decennial Census. With the Census long-form ques-tionnaire having been replaced by the annual Ameri-can Community Survey, employment data at the tract level should become available annually, though the first round of such data had not yet been made avail-able as of this writing.
Part III: characteristics of “Station Areas”
Many of the factors that affect ridership at a transit station are functions of what kind of development surrounds the station.
More people within walking distance of the station means more potential riders.
Targeting Transit 15
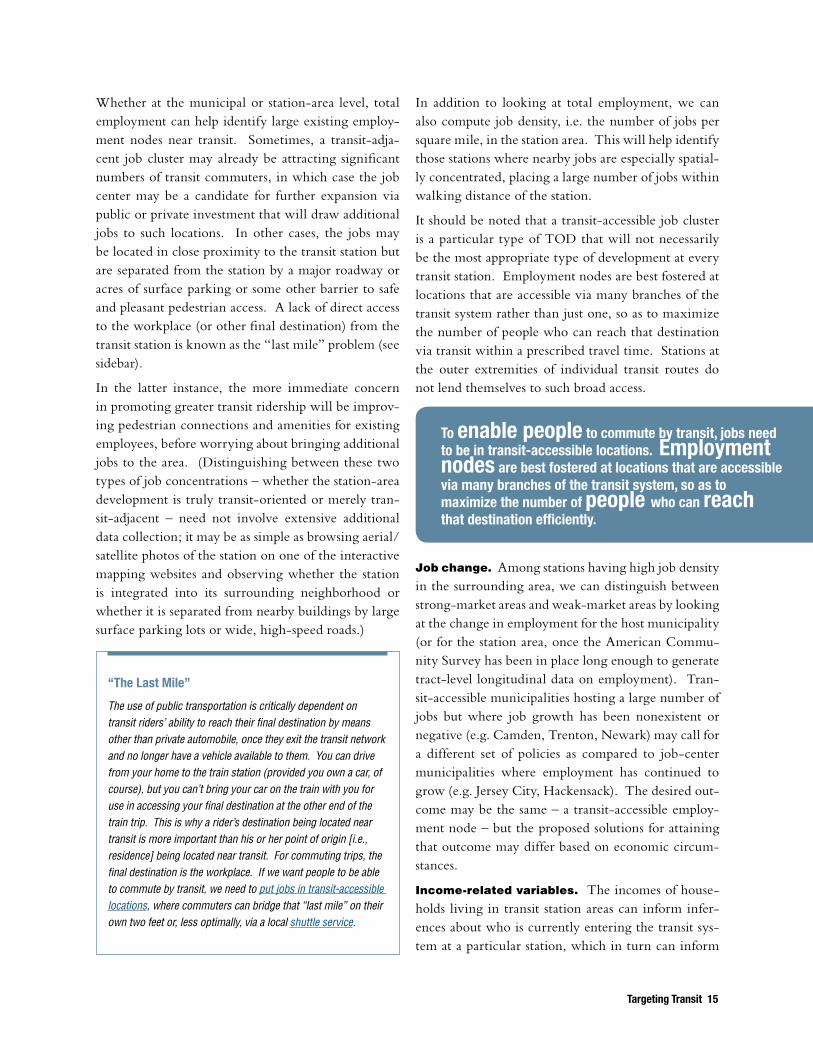
Whether at the municipal or station-area level, total employment can help identify large existing employ-ment nodes near transit. Sometimes, a transit-adja-cent job cluster may already be attracting significant numbers of transit commuters, in which case the job center may be a candidate for further expansion via public or private investment that will draw additional jobs to such locations. In other cases, the jobs may be located in close proximity to the transit station but are separated from the station by a major roadway or acres of surface parking or some other barrier to safe and pleasant pedestrian access. A lack of direct access to the workplace (or other final destination) from the transit station is known as the “last mile” problem (see sidebar).
In the latter instance, the more immediate concern in promoting greater transit ridership will be improv-ing pedestrian connections and amenities for existing employees, before worrying about bringing additional jobs to the area. (Distinguishing between these two types of job concentrations – whether the station-area development is truly transit-oriented or merely tran-sit-adjacent – need not involve extensive additional data collection; it may be as simple as browsing aerial/satellite photos of the station on one of the interactive mapping websites and observing whether the station is integrated into its surrounding neighborhood or whether it is separated from nearby buildings by large surface parking lots or wide, high-speed roads.)
“The Last Mile”
The use of public transportation is critically dependent on transit riders’ ability to reach their final destination by means other than private automobile, once they exit the transit network and no longer have a vehicle available to them. You can drive from your home to the train station (provided you own a car, of course), but you can’t bring your car on the train with you for use in accessing your final destination at the other end of the train trip. This is why a rider’s destination being located near transit is more important than his or her point of origin [i.e., residence] being located near transit. For commuting trips, the final destination is the workplace. If we want people to be able to commute by transit, we need to put jobs in transit-accessible locations, where commuters can bridge that “last mile” on their own two feet or, less optimally, via a local shuttle service.
In addition to looking at total employment, we can also compute job density, i.e. the number of jobs per square mile, in the station area. This will help identify those stations where nearby jobs are especially spatial-ly concentrated, placing a large number of jobs within walking distance of the station.
It should be noted that a transit-accessible job cluster is a particular type of TOD that will not necessarily be the most appropriate type of development at every transit station. Employment nodes are best fostered at locations that are accessible via many branches of the transit system rather than just one, so as to maximize the number of people who can reach that destination via transit within a prescribed travel time. Stations at the outer extremities of individual transit routes do not lend themselves to such broad access.
To enable people to commute by transit, jobs need to be in transit-accessible locations. Employment nodes are best fostered at locations that are acces-sible via many branches of the transit system, so as to maximize the number of people who can reach that destination efficiently.
Job change. Among stations having high job density in the surrounding area, we can distinguish between strong-market areas and weak-market areas by looking at the change in employment for the host municipality (or for the station area, once the American Commu-nity Survey has been in place long enough to generate tract-level longitudinal data on employment). Tran-sit-accessible municipalities hosting a large number of jobs but where job growth has been nonexistent or negative (e.g. Camden, Trenton, Newark) may call for a different set of policies as compared to job-center municipalities where employment has continued to grow (e.g. Jersey City, Hackensack). The desired out-come may be the same – a transit-accessible employ-ment node – but the proposed solutions for attaining that outcome may differ based on economic circum-stances.
Income-related variables. The incomes of house-holds living in transit station areas can inform infer-ences about who is currently entering the transit sys-tem at a particular station, which in turn can inform
More people within walking distance of the station means more potential riders.
To enable people to commute by transit, jobs need to be in transit-accessible locations. Employment nodes are best fostered at locations that are accessible via many branches of the transit system, so as to maximize the number of people who can reach that destination efficiently.

16 Characteristics of Station Areas
strategies for attracting new riders, both at the station in question and at other similar stations. A high me-dian household income in the station area could help identify where “discretionary” riders dominate; that is, where transit riders tend to have higher incomes and are presumably using transit out of choice rather than economic necessity. Characteristics of these sta-tions could be instructive as to what might work else-where, in terms of inducing people to ride transit even though they can afford other options.
A low median income in the station area is useful in identifying transit-dependent populations – those who cannot afford cars and are thus using transit as their only option for longer-distance travel.
On the other end of the scale, a low median income in the station area is useful in identifying potentially transit-dependent populations – those who cannot af-ford cars and are thus using transit as their only option for longer-distance travel. In some instances, a TOD strategy may focus on attracting more discretionary riders, while in other situations the main goal will be making sure transit-dependent households are being adequately served. It is thus important to be able to distinguish between the two.
commuting behavior. The transit station inven-tory contains the percentages (from the 2005-2009 5-year American Community Survey) of commuters in the station area who commute by transit (broken out by rail vs. bus), driving (including carpooling), and walking or biking. Station areas with high rates of transit commuting – and especially those that also have high rates of people walking or biking to work – may represent opportunities to build on already exist-ing TOD clusters. Conversely, station areas with rela-tively low rates of transit commuting but with high values of other variables (e.g., population density) as-sociated with transit may point to stations where some of the ingredients of TOD are already in place but pedestrian connections or frequency of transit service need to be improved.
Vehicle ownership. Stations surrounded by higher concentrations of households with below-average ve-hicle ownership rates (and especially households own-
ing zero vehicles) should perhaps score higher as TOD candidates, for either or both of two reasons. One possibility is that a low vehicle ownership rate is an indicator of a lower-income population that relies on public transportation as its primary means of getting around. Another explanation is that the low vehi-cle ownership rate is evidence of households actively choosing not to own a car, or to own fewer cars than they would otherwise, because good public transpor-tation service is available as an alternative. The latter scenario would suggest that the station area already features a development style that enables at least some daily activities to be accomplished without need of a car, making the station a promising candidate for more of this type of development.
A low vehicle ownership rate near a transit sta-tion may be evidence that the station area already features a development style that enables at least some daily activities to be accomplished without need of a car, making the station a promising candidate for more of this type of development.
Whatever the reason for low vehicle ownership rates, it follows that these places are good candidates for fur-ther TOD, because they are already home to people who are accustomed to getting around with fewer cars than is typically the case in the rest of the state and who would presumably welcome more development that is not automobile-dependent. To identify these places, the transit station inventory contains data at the station level on the percent of households owning zero vehicles and the percent of single-vehicle house-holds, as well as an estimate of the average number of vehicles per household.
Presence of a “downtown.” The inventory con-tains an indicator of whether a station’s host munic-ipality (or, in the case of larger municipalities with multiple transit stations, the station’s host neighbor-hood) also hosts a traditional “downtown,” charac-terized by a mix of commercial and public uses and good street connectivity. The indicator is based on a list being compiled by Downtown New Jersey, which identifies downtowns by the presence of such things as a Main Street program, a Special Improvement Dis-
A low vehicle ownership rate near a transit station may be evidence that the station area already features a development style that enables at least some daily activities to be accomplished without need of a car, making the station a promising candidate for more of this type of development.
A low median income in the station area is useful in identifying potentially transit-dependent popula-tions – those who cannot afford cars and are thus using transit as their only option for longer-distance travel.
Measures of socioeconomic distress – low home values, high rate of vacant housing, etc. can identify transit station neighborhoods where the market is unlikely to generate new development without incentive and which thus may benefit from targeted state programs.

16 Characteristics of Station Areas Targeting Transit 17
trict (SID) or Business Improvement District (BID), or some other organization run by local merchants to “complement rather than replace existing municipal government services as part of a revitalization down-town plan.”12 These authorities typically focus on services (such as street cleaning or maintenance of “street furniture” like benches and trash cans) aimed at improving the pedestrian experience, on the assumption that much of the travel among businesses in the district will be on foot rather than by car.
The presence of such an organization focused on the municipality or neighborhood in which a transit sta-tion is located can be interpreted as a sign that the station is surrounded by a traditional downtown en-vironment and thus may already feature many of the foundational elements of “transit-oriented develop-ment.” Stations whose host municipalities contain one or more designated SIDs/BIDs, Main Street pro-grams, or similar authorities should probably score higher as TOD candidates, since these municipali-ties are already aware that they have a “downtown” and understand the importance of compact, walkable development.
Measures of socioeconomic distress. There are any number of indicators that can be used to describe socioeconomic conditions in a transit station’s host municipality. If a program proposes to use TOD as a redevelopment tool, to be specifically targeted at “weak-market” places in which the market is unlike-ly to generate new development without incentive, these indicator variables would help identify the host municipalities where the needs are greatest.
Measures of socioeconomic distress - low home val-ues, high rate of vacant housing, etc. - can identify transit station neighborhoods where the market is unlikely to generate new development without in-centive and which thus may benefit from targeted state programs.
In addition to measures of income, Census/ACS station-area variables included in the transit station inventory that may be useful in identifying municipal-
12 See Rutgers University Project Community’s Strategic Framework for Commercial Revitalization.
ities or neighborhoods experiencing distress include:
• Median home value for owner-occupied units (self-reported, not from tax records)
• Percent of non-seasonal housing units that are va-cant
• Percent of housing units that are owner-occupied vs. renter-occupied
Other potential measures of socioeconomic health that are available regularly at the municipal level and, though not presently included, could be easily added to the transit station inventory include:
• Per-capita property tax base
• Average residential value (based on assessed values from tax records)
• Rate of children on TANF (Temporary Aid to Needy Families)
• Unemployment rate
Further avenues of inquiry. There are several other characteristics of transit station areas for which data are not systematically available but which are none-theless important to mention as determinants of a station’s TOD potential. These variables are not in-cluded in New Jersey Future’s transit station inventory because of the time and cost prohibitions in collecting the data for every station, but some of them may be worth looking into on an individual basis for a smaller number of stations that score particularly high on oth-er measures of TOD potential.
• Amount of developable land available: Stations with vacant or under-developed land nearby should score higher as TOD candidates, for the straight-forward reason that there is actually land avail-able on which to build new developments. But actually identifying redevelopable land is a labor-intensive process involving either visiting or scru-tinizing aerial photography of each station area. Researchers at Rowan and Rutgers universities (pdf ) have tabulated “barren” land statewide, which serves as a stand-in for “vacant” land in al-ready urbanized areas, but this does not include other properties where more intensive develop-ment may be appropriate, including the fairly ob-vious example of surface parking lots. The Row-an/Rutgers analysis categorizes surface parking as “urbanized,” no different from parcels that have
A low vehicle ownership rate near a transit station may be evidence that the station area already features a development style that enables at least some daily activities to be accomplished without need of a car, making the station a promising candidate for more of this type of development.
Measures of socioeconomic distress – low home values, high rate of vacant housing, etc. can identify transit station neighborhoods where the market is unlikely to generate new development without incentive and which thus may benefit from targeted state programs.
18 Characteristics of Station Areas
buildings on them. In a very limited sense, the amount of surface parking adjacent to the station (as monitored by NJ Transit) is at least a known subset of the larger amount of nearby under-de-veloped land, if we accept the value judgment that surface parking is under-developed by definition. The amount of surface parking can thus con-ceptually be interpreted as a lower bound on the amount of potentially redevelopable land in the station area. But in general, an assessment of re-developable land around a station is probably best undertaken via site visits on a case-by-case basis.
• Environmental constraints: Once any undeveloped land in the station area has been identified, the question remains as to whether it is actually de-velopable. Some or all of it, especially around stations in more rural parts of the state, may be permanently preserved, or it may infringe on wet-lands, floodplains or other environmentally sensi-tive sites unsuitable for development. It is also possible that some adjacent undeveloped lands lie outside sewer service areas. Again, these issues would have to be investigated on a case-by-case basis.
• Brownfield issues: Even if an undeveloped parcel near a transit station is confirmed as being devel-opable, it may still require environmental clean-up, especially in heavily developed urban areas. The costs of such a cleanup might render a TOD project economically unfeasible in the absence of state intervention.
• Amenability to non-motorized access: Another quali-tative feature of a transit station area is how well the design features of the surrounding develop-ment encourage non-motorized access to the sta-tion. Some aspects of this subjective concept can actually be quantified – for example, the presence or absence of sidewalks along each road segment within a half mile of the station, or the number of bike-rack slots available at the station – although such data do not exist in any centralized location for every station and might have to be assembled on an ad-hoc basis for individual stations. Other aspects have more to do with design and aesthetics and would best be assessed by in-person visits.
• Presence of non-employment-related destinations: Considering that not all transit ridership is necessarily job-related, other types of destinations could be identified and added to the station in-ventory, pointing to opportunities for TOD that would generate ridership during non-peak hours. Such destinations include, but are not limited to, sports and entertainment arenas, theaters, spe-cialty shopping districts, hospitals, and colleges and universities. In principle, a greater mix of land-use types centered around transit enables a wider range of trips to be taken on transit and generates ridership throughout the day, not just in peak periods.
The compilation of data about station areas is a means to an end, not an end in itself. The data are meant to inform decisions – by regional and state agen-cies, real estate developers, or local government leaders – about which locations are especially promising for TOD, and among them, what particular type of development is most appropriate around which particular stations. This will in turn help clarify how best to apportion limited resources for promoting TOD.

Targeting Transit 19
As the previous section suggests, the assembly of data items describing a transit station and its surrounding neighborhood is a task that could proceed indefinitely. New Jersey Future’s transit station inventory is certainly designed to facilitate the easy addition of any Census data item that is tabulated at the tract level, or any data item systematically available for all municipalities.
The compilation of data about station areas is a means to an end, not an end in itself. The data are meant to inform decisions – by regional and state agencies, real estate developers, or local govern-ment leaders – about which locations are especially promising for TOD, and among them, what particular type of transit-oriented development is most appro-priate around which particular stations. This will in turn help clarify how best to apportion limited re-sources for promoting TOD.
But the compilation of data about station areas is a means to an end, not an end in itself. The data are meant to inform decisions – by regional and state agencies, real estate developers, or local government leaders – about which locations are especially promis-ing for TOD, and among them, what particular type of development is most appropriate around which par-ticular stations. This will in turn help clarify how best to apportion limited resources for promoting TOD.
One approach to targeting TOD investments is to develop a typology of transit stations. This involves defining several station archetypes or categories, based on a subjective assessment of the range of functions that an individual station serves or might serve in the future. A different set of development strategies can then be outlined for each station type, and the process of deciding on a course of action for an individual station becomes a matter of deciding which of the ar-chetypes the station in question most resembles. By presenting a TOD proponent with a set of pre-defined options, a typology can simplify the otherwise some-what scattershot process of envisioning what kind of development is desired and/or makes economic sense around a particular station. Realistically, though,
a typology should be viewed as a starting point for discussion, as every location will have its own unique set of circumstances that must be taken into consideration.
NJ Transit, in its 1994 handbook Planning for Tran-sit-Friendly Land Use, has in fact constructed such a typology, distinguishing six types of stations: urban center; regional hub; traditional town, village, or hamlet; single-use district or neighborhood; suburban multi-use area; and park-and-ride. It groups the first three of these types as “centers” and the other three as “non-centers.” NJ Transit’s typology is geared mainly toward characterizing the present configura-tion of the land uses surrounding the state’s transit sta-tions, though the types could also be viewed as ideals to work toward – that is, they could be used to classify stations by how they could be functioning, rather than how they are functioning.
The development of a functioning typology is an in-exact science that should probably result from a col-laborative process involving a range of stakeholders
Part IV: different Stations, different Functions
The compilation of data about station areas is a means to an end, not an end in itself. The data are meant to inform decisions – by regional and state agen-cies, real estate developers, or local government leaders – about which locations are especially promising for TOD, and among them, what particular type of development is most appropriate around which particular stations. This will in turn help clarify how best to apportion limited resources for promoting TOD.
North Jersey Sustainable Communities Consortium
The North Jersey Sustainable Communities Consortium comprises a diverse group of public jurisdictions and agencies, citizens, community-based organizations, nonprofit organizations and educational institutions. In November 2011 the Consortium was awarded a $5 million, three-year grant from the federal Department of Hous-ing and Urban Development to create a regional plan for sustainable development for the 13-county North Jersey Transportation Planning Authority region in northern New Jersey. The plan will use sustainability, transit system connectivity, and TOD as its central framework to improve economic and environmental conditions while promoting regional equity and resource efficiency. A key aspect of the grant work will be the development of a “TOD transect” that identifies both existing and potential/desired station types. The Consortium will model different scenarios for future growth in the region, using the TOD transect as one of the factors determining how the model distributes growth geographically.

20 Different Stations, Different Functions
seeking to promote TOD, including but not limited to the transit system operators themselves, real estate developers, municipal leaders, and officials from state government agencies that more generally influence where and how development happens. Such a task is beyond the scope of this report but will be under-taken by the North Jersey Sustainable Communities Consortium (see sidebar on page 19). Nonetheless, certain key questions will help narrow the list of op-tions for what kind of development makes sense at a particular station.
One very basic question, not usually posed explicit-ly, is whether more development is actually desirable around every transit station. In theory, every transit station is a candidate for TOD. But in reality, perhaps we should consider the possibility that some stations are not appropriate for further development. Possible reasons include:
• Environmental constraints. For example, a trio of stations along the Gladstone Branch of the Morris & Essex commuter rail line – Gillette, Stirling, and Millington – are located in Long Hill Town-ship in Morris County, which is entirely contained in the “environmentally sensitive” planning area as defined on the 2001 State Development and Redevelopment Plan Policy Map.13 These three stations are also just outside the boundaries of the Great Swamp National Wildlife Refuge. Is it consistent with other state goals to encourage further development around these stations? Would these stations even be constructed at all if we were building the transit system from the ground up today?
• Limited potential catchment area, in terms of the number of people who can walk to the station or for whom this station is the easiest one to drive to. If a station is not located strategically on the road network, is surrounded by lower-density but fully occupied (and hence not easily redeveloped) local land uses, or is located near other stations
13 The Christie administration is, at the time of this writing, at work on an update of the State Development and Redevelopment Plan, to be called the State Strategic Plan. Among other things, the new Plan is expected to revise the approach and form of the policy map. But the 2001 State Plan map will be in place until the State Strategic Plan Investment Area criteria have been finalized and adopted.
with better access, then this station may not make sense as a receiving area for new development. A sub-optimal location will often manifest itself in low ridership, and indeed NJ Transit has closed some poorly patronized stations in the past, an action that may in some cases represent a better long-term use of limited resources than invest-ing in more development around stations with constrained potential.
As long as the residential transit village model does not preclude a later intensification of use if condi-tions change in the future, it should probably be con-sidered the default pattern for development around transit stations.
Assuming the area around a station is appropriate for TOD, the next important question is whether this particular station will serve a primarily local pur-pose or whether it is positioned to meet some larger, regional need. Many stations might attain their full potential simply by serving as what we might call the generic transit village – primarily residential, with good pedestrian connections, a mix of housing types, higher density closer to the station, and a locally sup-ported retail downtown, but with no major employ-ment centers. (This description roughly corresponds with the “traditional town, village, or hamlet” type in NJ Transit’s typology.) These transit villages could boost transit ridership by offering more people the op-portunity to live and shop near transit, but they would serve primarily as origins, rather than destinations, for work-based transit trips. As long as the residential transit village model does not preclude a later inten-sification of use if conditions change in the future, it should probably be considered the default pattern for development around transit stations.
There are, however, certain locations that are of larger strategic importance relative to statewide transporta-tion goals, where a residential transit village would not necessarily be the most efficient use of the loca-tion. Some transit stations are particularly well-suit-ed to cultivation as employment hubs, as commute destinations rather than origins. After all, residential transit villages can’t deliver on their promise of greater
As long as the residential transit village model does not preclude a later intensification of use if conditions change in the future, it should probably be considered the default pattern for development around transit stations.
New Jersey need not rely solely on New York and Philadelphia to serve as the work destina-tions for its transit commuters; it should endeavor to foster its own home-grown transit employment hubs as well.
Targeting Transit 21
transit ridership if those riders can’t walk to their jobs at the other end of the transit trip. New Jersey need not rely solely on New York and Philadelphia to fill this role, however; it should endeavor to foster its own home-grown transit employment hubs as well.
Another larger regional concern that certain stations may be uniquely positioned to address is capturing commuters from beyond walking-distance range of the transit system and diverting them onto transit and off the road network for at least part of their commute. This is the function of the stations that NJ Tran-sit’s typology calls park-and-rides. (Metropark and Princeton Junction, for example, presently serve this function.) New Jersey’s public transportation system may be extensive, but it does not penetrate all parts of the state. Not everyone has the option of walking or biking to transit, or even of taking a short drive through neighborhood streets. Some commuters may wish to use transit to reach their final destination rath-er than driving the entire distance, but they may need to drive across municipal, county, and even state lines to reach the nearest transit station.
Rather than have these drivers descending on every outlying transit station and overwhelming the local street networks of dozens of towns, they can instead be channeled to a smaller number of stations that are strategically positioned on the highway network to act as regional collectors. Ease of access from the highway will increase the odds of diverting commut-ers onto transit when they are already in their cars, and without steering them onto towns’ local street networks. It will also reduce the need for parking at in-town stations, freeing up station-area land in those towns for better TOD uses.
Even at park-and-rides, some elements of TOD can still be incorporated. Residential and retail compo-nents can be built on surface parking lots, with those spaces replaced by decked parking. In fact, structured parking can actually allow the number of parking spaces to expand while simultaneously converting some of the station-area land to non-parking uses. But it is important that the net result not be a reduc-tion in the total amount of parking spaces, which would risk displacing many willing transit riders back onto the roads. When promoting mixed-use devel-opment around these regional-catchment stations, the mix still needs to include parking.
As long as the residential transit village model does not preclude a later intensification of use if conditions change in the future, it should probably be considered the default pattern for development around transit stations.
New Jersey need not rely solely on New York and Philadelphia to serve as the work destina-tions for its transit commuters; it should endeavor to foster its own home-grown transit employment hubs as well.

22 From Data to Information Targeting Transit 23
the dAtA items iN New Jersey Future’s transit sta-tion inventory were assembled with the goal of helping to answer questions that will inform a set of targeted statewide TOD strategies. Combinations of variables can be synthesized to form a clearer picture of which transit stations have the best potential for which uses. This section provides some preliminary examples of the types of questions that can potentially be answered using the information in the inventory.
Q: How might we identify promising locations for fos-tering transit-accessible employment hubs? As men-tioned earlier, transit-focused job nodes will be most successful at the locations with the best accessibility from points throughout the transit system, because these locations maximize the number of potential employ-ees who can reach the location conveniently via transit (see “Centrality/accessibility” in Part II). The loca-tions with the best accessibility are generally going to be those where multiple transit lines converge, so these centrally located stations should be considered as candidates for hosting concentrations of employment, if they do not already. Table 2 shows the transit sta-tions that are served by more than one rail transit line (including light-rail and rapid transit systems).
An existing concentration of employment near a transit station can be thought of as a signal from the commercial real estate business that the station’s location is considered desirable by the market.
By similar reasoning, accessibility by more than one mode should also be considered a strategic advantage in terms of job location – see “Intermodality” in Part II. Table 3 lists the transit stations that are served by mul-tiple modes, counting the three types of rail service separately.
Given their favored locations, it is probably no coin-cidence that many of these centrally located stations already host disproportionately large numbers of jobs. An existing concentration of employment near a transit station can more generally be thought of as a signal from the commercial real estate industry that the
station’s location is considered desirable by the market, even in cases where most employees are not present-ly actually riding transit to work. Thus any transit-proximate (even if not transit-oriented, from a design point of view) job cluster ought to be considered as a candidate for further development into a transit-focused employment hub (see “Employment” in Part III). Table 4 shows the top quartile of transit-hosting municipalities in terms of their ratios of jobs to em-ployed residents, indicating that they serve as employ-ment destinations – that they gain population during the day. Large concentrations of jobs are important in the absolute sense as well, not just relative to popula-tion – Table 5 lists transit-hosting municipalities that hosted at least 20,000 jobs as of 2009.
Stations that appear on any of these lists warrant further consideration as focal points for concen-trating jobs near transit. Stations that appear on more than one of these lists should be given even higher priority. These include stations located in:
• Atlantic City• Camden (particularly Walter Reed
Transportation Center)• Cherry Hill Twp.• Edison Twp.• Elizabeth• Hackensack• Hoboken• Jersey City (particularly the Newport/Pavonia,
Journal Square, and Exchange Place PATH stations)
• Lindenwold• Millburn Twp.• New Brunswick• Newark (particularly the three commuter rail
stations)• Parsippany-Troy Hills Twp.• Princeton• Secaucus• Summit• Trenton (particularly the Trenton Transit
Center)• Wayne Twp.• Woodbridge Twp. (particularly the Metropark
commuter rail station)
Part V: From data to Information
An existing concentration of employment near a transit station can be thought of as a signal from the commercial real estate industry that the station’s location is considered desirable by the market.

Targeting Transit 23
Of course, some of the municipalities on this list may not necessarily have their existing jobs con-centrated near their transit stations; in these places, “last-mile” solutions (see sidebar on page 15) will continue to be important. In other municipalities, jobs might be physically located near a transit station but are surrounded by automobile-centric land uses;
what is needed here are design solutions – landscaping, pedestrian paths, infill buildings, etc. – that will make the walk from the transit station to the workplace safer and more hospitable.
Q: Where are the best locations to promote higher-density residential development? One way to boost transit rid-
Table 2. Stations served by multiple rail lines
station namehostmunicipality
# of rail routes / lines: line/route names
Hoboken Terminal Hoboken 11 M & E Morristown and Gladstone branches, Montclair-Boonton, Pascack Valley, Main, Bergen, PATH, HBLR, North Jersey Coast,Northeast Corridor,* Raritan Valley*
Secaucus Jct. Secaucus 9 Northeast Corridor, North Jersey Coast, M & E Morristown and Gladstone* branches, Montclair-Boonton, Pascack Valley, Main, Bergen, Raritan Valley*
Newark Penn Station Newark 5 Northeast Corridor, North Jersey Coast, Raritan Valley, PATH, Newark Light RailNewark - Broad St. Newark 4 M & E Morristown and Gladstone branches, Montclair-Boonton, Newark Light RailTrenton Transit Center Trenton 3 Northeast Corridor, SEPTA Trenton, River LineLindenwold Lindenwold 2 Atlantic City, PATCOWalter Rand Transportation Center Camden 2 PATCO, River LineNewport / Pavonia Jersey City 2 PATH, HBLRNewark Airport Newark 2 Northeast Corridor, North Jersey CoastNorth Elizabeth Elizabeth 2 Northeast Corridor, North Jersey CoastElizabeth Elizabeth 2 Northeast Corridor, North Jersey CoastLinden Linden 2 Northeast Corridor, North Jersey CoastRahway Rahway 2 Northeast Corridor, North Jersey CoastEast Orange East Orange 2 M & E Morristown and Gladstone branchesBrick Church East Orange 2 M & E Morristown and Gladstone branchesOrange Orange 2 M & E Morristown and Gladstone branchesHighland Ave Orange 2 M & E Morristown and Gladstone branchesMountain Station South Orange 2 M & E Morristown and Gladstone branchesSouth Orange South Orange 2 M & E Morristown and Gladstone branchesMaplewood Maplewood 2 M & E Morristown and Gladstone branchesMillburn Millburn Twp. 2 M & E Morristown and Gladstone branchesShort Hills Millburn Twp. 2 M & E Morristown and Gladstone branchesSummit Summit 2 M & E Morristown and Gladstone branches
*
For stations on the Main and Bergen lines that are located inbound from their convergence point in Secaucus, the two lines should count as separate collectors. (This applies only to Secaucus Jct. and Hoboken.) On the other hand, stations that are located beyond the outbound re-convergence point at Glen Rock, while technically served by both Main and Bergen trains, should not be counted as being served by multiple lines because, when viewed as destinations, they are only accessible via multiple lines in the outbound direction. This runs counter to the idea of being centrally located.
Denville and stations farther out, while technically served by both the M&E Morristown line and the Montclair-Boonton line, are analogous to the outer stations on the Main/Bergen line in being served as destina-tions by multiple lines only in the outbound direction. They are thus not counted here.
Conversely, the Morristown and Gladstone branches of the Morris & Essex lines should be treated as two separate collectors for the stations that lie inbound of their point of convergence near Summit. This applies to all stations from Summit inward to Secaucus Jct. and Hoboken.
Gladstone Branch trains do not currently stop at Secaucus Junction, but there is no reason they couldn’t; Secaucus Junction is thus counted as being served by the Gladstone branch.
Raritan Valley trains currently terminate in Newark, mainly because diesel locomotives are not permitted in the trans-Hudson tunnel (the Raritan Valley line is not electrified).
But there is no reason, from a physical plant point of view, that Raritan Valley trains could not continue on to Secaucus (and to New York, with the dual-mode locomotives that NJ Transit is currently taking delivery of) -- the track configuration allows it. Secaucus Junction is thus counted as being served by the Raritan Valley line.
Similarly, the tracks are already configured to allow trains coming up the Northeast Corridor to serve Hoboken -- in fact, a small number of North Jersey Coast trains presently terminate in Hoboken. No Northeast Cor-ridor or Raritan Valley trains currently terminate in Hoboken, but there is no physical constraint preventing them from doing so. Hoboken is thus counted as being served by the Northeast Corridor, North Jersey Coast, and Raritan Valley lines.
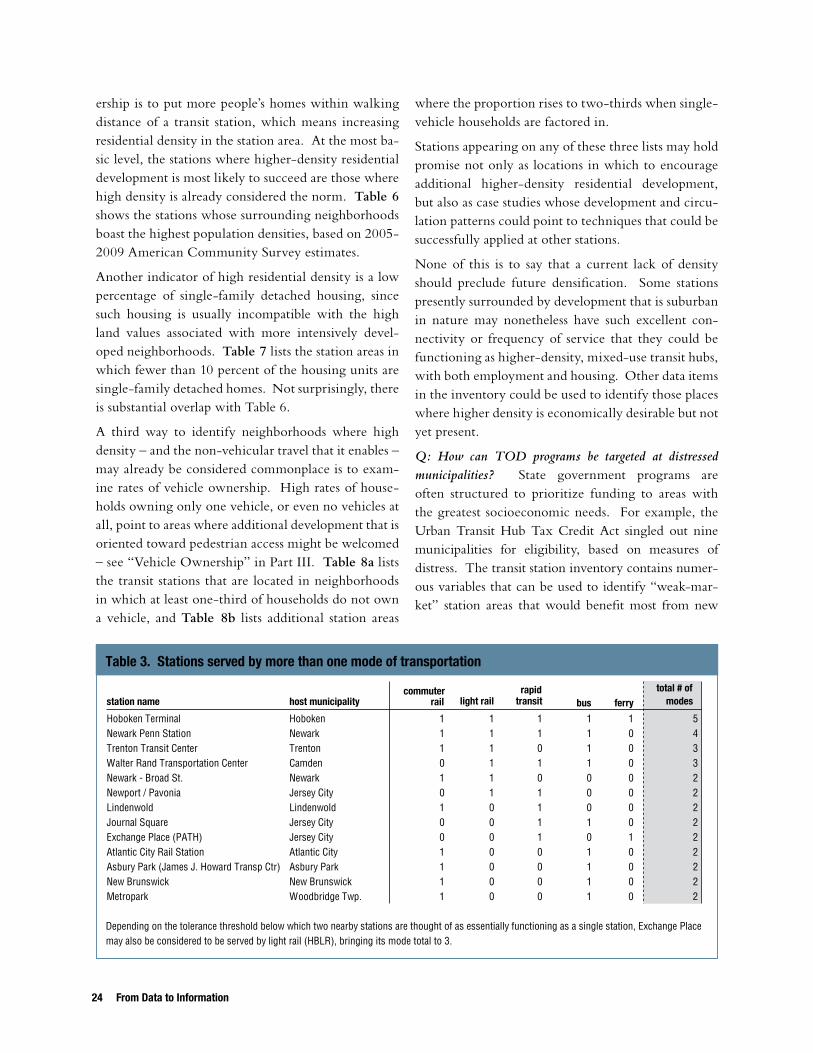
24 From Data to Information Targeting Transit 25
ership is to put more people’s homes within walking distance of a transit station, which means increasing residential density in the station area. At the most ba-sic level, the stations where higher-density residential development is most likely to succeed are those where high density is already considered the norm. Table 6 shows the stations whose surrounding neighborhoods boast the highest population densities, based on 2005-2009 American Community Survey estimates.
Another indicator of high residential density is a low percentage of single-family detached housing, since such housing is usually incompatible with the high land values associated with more intensively devel-oped neighborhoods. Table 7 lists the station areas in which fewer than 10 percent of the housing units are single-family detached homes. Not surprisingly, there is substantial overlap with Table 6.
A third way to identify neighborhoods where high density – and the non-vehicular travel that it enables – may already be considered commonplace is to exam-ine rates of vehicle ownership. High rates of house-holds owning only one vehicle, or even no vehicles at all, point to areas where additional development that is oriented toward pedestrian access might be welcomed – see “Vehicle Ownership” in Part III. Table 8a lists the transit stations that are located in neighborhoods in which at least one-third of households do not own a vehicle, and Table 8b lists additional station areas
where the proportion rises to two-thirds when single-vehicle households are factored in.
Stations appearing on any of these three lists may hold promise not only as locations in which to encourage additional higher-density residential development, but also as case studies whose development and circu-lation patterns could point to techniques that could be successfully applied at other stations.
None of this is to say that a current lack of density should preclude future densification. Some stations presently surrounded by development that is suburban in nature may nonetheless have such excellent con-nectivity or frequency of service that they could be functioning as higher-density, mixed-use transit hubs, with both employment and housing. Other data items in the inventory could be used to identify those places where higher density is economically desirable but not yet present.
Q: How can TOD programs be targeted at distressed municipalities? State government programs are often structured to prioritize funding to areas with the greatest socioeconomic needs. For example, the Urban Transit Hub Tax Credit Act singled out nine municipalities for eligibility, based on measures of distress. The transit station inventory contains numer-ous variables that can be used to identify “weak-mar-ket” station areas that would benefit most from new
Table 3. Stations served by more than one mode of transportation
station name host municipalitycommuter
rail light railrapid transit bus ferry
total # of modes
Hoboken Terminal Hoboken 1 1 1 1 1 5Newark Penn Station Newark 1 1 1 1 0 4Trenton Transit Center Trenton 1 1 0 1 0 3Walter Rand Transportation Center Camden 0 1 1 1 0 3Newark - Broad St. Newark 1 1 0 0 0 2Newport / Pavonia Jersey City 0 1 1 0 0 2Lindenwold Lindenwold 1 0 1 0 0 2Journal Square Jersey City 0 0 1 1 0 2Exchange Place (PATH) Jersey City 0 0 1 0 1 2Atlantic City Rail Station Atlantic City 1 0 0 1 0 2Asbury Park (James J. Howard Transp Ctr) Asbury Park 1 0 0 1 0 2New Brunswick New Brunswick 1 0 0 1 0 2Metropark Woodbridge Twp. 1 0 0 1 0 2
Depending on the tolerance threshold below which two nearby stations are thought of as essentially functioning as a single station, Exchange Placemay also be considered to be served by light rail (HBLR), bringing its mode total to 3.
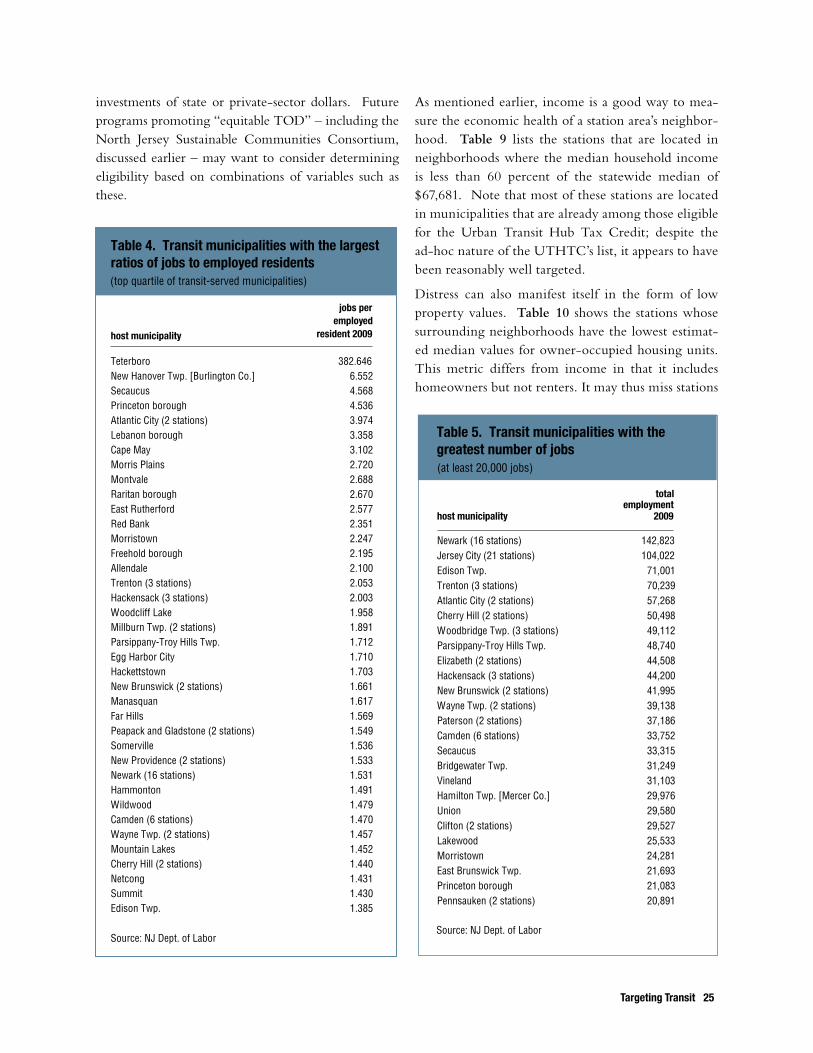
Targeting Transit 25
Table 4. Transit municipalities with the largest ratios of jobs to employed residents(top quartile of transit-served municipalities)
host municipality
jobs per employed
resident 2009
Teterboro 382.646New Hanover Twp. [Burlington Co.] 6.552Secaucus 4.568Princeton borough 4.536Atlantic City (2 stations) 3.974Lebanon borough 3.358Cape May 3.102Morris Plains 2.720Montvale 2.688Raritan borough 2.670East Rutherford 2.577Red Bank 2.351Morristown 2.247Freehold borough 2.195Allendale 2.100Trenton (3 stations) 2.053Hackensack (3 stations) 2.003Woodcliff Lake 1.958Millburn Twp. (2 stations) 1.891Parsippany-Troy Hills Twp. 1.712Egg Harbor City 1.710Hackettstown 1.703New Brunswick (2 stations) 1.661Manasquan 1.617Far Hills 1.569Peapack and Gladstone (2 stations) 1.549Somerville 1.536New Providence (2 stations) 1.533Newark (16 stations) 1.531Hammonton 1.491Wildwood 1.479Camden (6 stations) 1.470Wayne Twp. (2 stations) 1.457Mountain Lakes 1.452Cherry Hill (2 stations) 1.440Netcong 1.431Summit 1.430Edison Twp. 1.385
Source: NJ Dept. of Labor
Table 5. Transit municipalities with thegreatest number of jobs(at least 20,000 jobs)
host municipality
total employment
2009
Newark (16 stations) 142,823Jersey City (21 stations) 104,022Edison Twp. 71,001Trenton (3 stations) 70,239Atlantic City (2 stations) 57,268Cherry Hill (2 stations) 50,498Woodbridge Twp. (3 stations) 49,112Parsippany-Troy Hills Twp. 48,740Elizabeth (2 stations) 44,508Hackensack (3 stations) 44,200New Brunswick (2 stations) 41,995Wayne Twp. (2 stations) 39,138Paterson (2 stations) 37,186Camden (6 stations) 33,752Secaucus 33,315Bridgewater Twp. 31,249Vineland 31,103Hamilton Twp. [Mercer Co.] 29,976Union 29,580Clifton (2 stations) 29,527Lakewood 25,533Morristown 24,281East Brunswick Twp. 21,693Princeton borough 21,083Pennsauken (2 stations) 20,891
Source: NJ Dept. of Labor
investments of state or private-sector dollars. Future programs promoting “equitable TOD” – including the North Jersey Sustainable Communities Consortium, discussed earlier – may want to consider determining eligibility based on combinations of variables such as these.
As mentioned earlier, income is a good way to mea-sure the economic health of a station area’s neighbor-hood. Table 9 lists the stations that are located in neighborhoods where the median household income is less than 60 percent of the statewide median of $67,681. Note that most of these stations are located in municipalities that are already among those eligible for the Urban Transit Hub Tax Credit; despite the ad-hoc nature of the UTHTC’s list, it appears to have been reasonably well targeted.
Distress can also manifest itself in the form of low property values. Table 10 shows the stations whose surrounding neighborhoods have the lowest estimat-ed median values for owner-occupied housing units. This metric differs from income in that it includes homeowners but not renters. It may thus miss stations
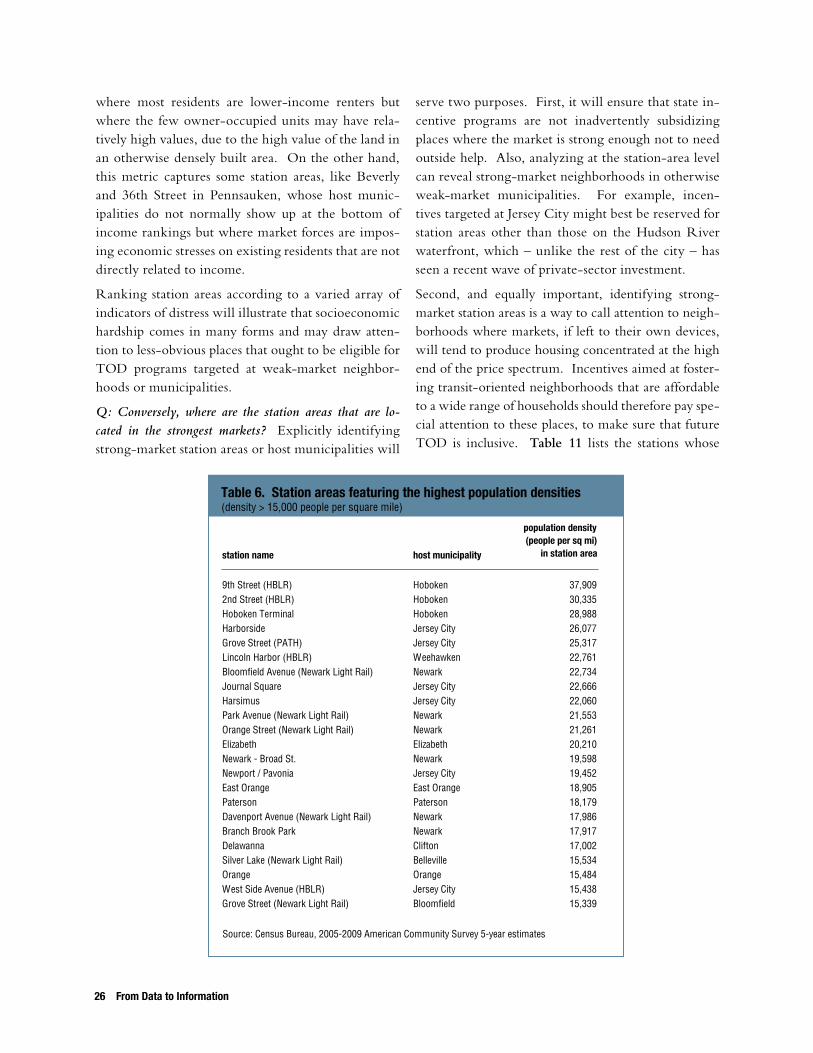
26 From Data to Information Targeting Transit 27
where most residents are lower-income renters but where the few owner-occupied units may have rela-tively high values, due to the high value of the land in an otherwise densely built area. On the other hand, this metric captures some station areas, like Beverly and 36th Street in Pennsauken, whose host munic-ipalities do not normally show up at the bottom of income rankings but where market forces are impos-ing economic stresses on existing residents that are not directly related to income.
Ranking station areas according to a varied array of indicators of distress will illustrate that socioeconomic hardship comes in many forms and may draw atten-tion to less-obvious places that ought to be eligible for TOD programs targeted at weak-market neighbor-hoods or municipalities.
Q: Conversely, where are the station areas that are lo-cated in the strongest markets? Explicitly identifying strong-market station areas or host municipalities will
serve two purposes. First, it will ensure that state in-centive programs are not inadvertently subsidizing places where the market is strong enough not to need outside help. Also, analyzing at the station-area level can reveal strong-market neighborhoods in otherwise weak-market municipalities. For example, incen-tives targeted at Jersey City might best be reserved for station areas other than those on the Hudson River waterfront, which – unlike the rest of the city – has seen a recent wave of private-sector investment.
Second, and equally important, identifying strong-market station areas is a way to call attention to neigh-borhoods where markets, if left to their own devices, will tend to produce housing concentrated at the high end of the price spectrum. Incentives aimed at foster-ing transit-oriented neighborhoods that are affordable to a wide range of households should therefore pay spe-cial attention to these places, to make sure that future TOD is inclusive. Table 11 lists the stations whose
Table 6. Station areas featuring the highest population densities(density > 15,000 people per square mile)
station name host municipality
population density (people per sq mi)
in station area
9th Street (HBLR) Hoboken 37,9092nd Street (HBLR) Hoboken 30,335Hoboken Terminal Hoboken 28,988Harborside Jersey City 26,077Grove Street (PATH) Jersey City 25,317Lincoln Harbor (HBLR) Weehawken 22,761Bloomfield Avenue (Newark Light Rail) Newark 22,734Journal Square Jersey City 22,666Harsimus Jersey City 22,060Park Avenue (Newark Light Rail) Newark 21,553Orange Street (Newark Light Rail) Newark 21,261Elizabeth Elizabeth 20,210Newark - Broad St. Newark 19,598Newport / Pavonia Jersey City 19,452East Orange East Orange 18,905Paterson Paterson 18,179Davenport Avenue (Newark Light Rail) Newark 17,986Branch Brook Park Newark 17,917Delawanna Clifton 17,002Silver Lake (Newark Light Rail) Belleville 15,534Orange Orange 15,484West Side Avenue (HBLR) Jersey City 15,438Grove Street (Newark Light Rail) Bloomfield 15,339
Source: Census Bureau, 2005-2009 American Community Survey 5-year estimates

Targeting Transit 27
Table 7. Stations in neighborhoods with lowest percentages ofsingle-family detached housing (less than 10 percent single-family detached)
station name host municipality
% of housing units that are single-family
detached
Hoboken Terminal Hoboken 0.81%Newport / Pavonia Jersey City 0.86%Harborside Jersey City 0.97%Harsimus Jersey City 0.99%Exchange Place (HBLR) Jersey City 1.29%Exchange Place (PATH) Jersey City 1.29%Grove Street (PATH) Jersey City 1.38%Marin Boulevard (HBLR) Jersey City 1.87%Essex Street (HBLR) Jersey City 1.89%Jersey Avenue (HBLR) Jersey City 2.49%9th Street (HBLR) Hoboken 3.55%Warren Street (Newark Light Rail) Newark 3.92%Washington Street (Newark Light Rail) Newark 3.94%Liberty State Park Jersey City 3.97%Lincoln Harbor (HBLR) Weehawken 4.05%2nd Street (HBLR) Hoboken 4.25%Military Park (Newark Light Rail) Newark 4.74%Paterson Paterson 5.21%Norfolk Street (Newark Light Rail) Newark 5.33%Newark Penn Station Newark 5.60%Newark - Broad St. Newark 5.60%Journal Square Jersey City 5.70%Harrison Harrison 5.97%Newark Airport Newark 6.53%Orange Street (Newark Light Rail) Newark 7.16%City Hall Camden 8.42%Cooper Street (River Line) Camden 8.57%Hamilton Avenue (River Line) Trenton 9.07%Richard Street (HBLR) Jersey City 9.19%Garfield Avenue (HBLR) Jersey City 9.30%Walter Rand Transportation Center Camden 9.73%East Orange East Orange 9.82%
Source: Census Bureau, 2005-2009 American Community Survey 5-year estimates
surrounding neighborhoods have the highest estimat-ed median values for owner-occupied housing units.
Q: Which stations are most effectively functioning as catchment points for regional commuters via park-and-ride access? Park-and-ride facilities enable commuters to ride transit for the main leg of their work trip even if they don’t live near a station. (See “Parking” in Part II) Stations that are currently oriented toward serv-ing this function can be identified by looking at the ratio of the number of station-area parking spaces to
the population of the station area. A large ratio, i.e. a supply of parking far out of proportion to the local population, suggests that the station’s riders are pri-marily arriving by car from a much larger geographic area. Indeed, most of the stations that score high-est on this measure (see Table 12) are well known for their huge parking lots.14 Some, however, are less
14 The recently constructed Wayne Route 23 station, which is a large park-and-ride facility, does not appear on the table because NJ Transit has not yet delineated a Census tract-based station area for it.
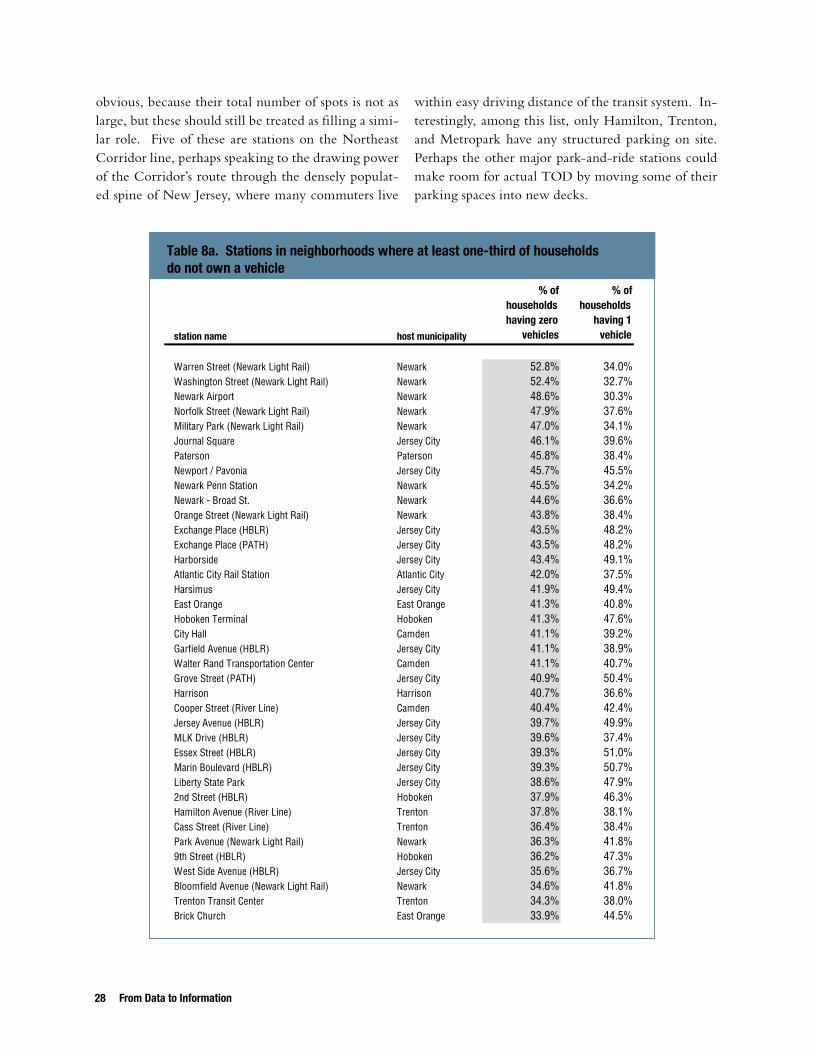
28 From Data to Information Targeting Transit 29
obvious, because their total number of spots is not as large, but these should still be treated as filling a simi-lar role. Five of these are stations on the Northeast Corridor line, perhaps speaking to the drawing power of the Corridor’s route through the densely populat-ed spine of New Jersey, where many commuters live
within easy driving distance of the transit system. In-terestingly, among this list, only Hamilton, Trenton, and Metropark have any structured parking on site. Perhaps the other major park-and-ride stations could make room for actual TOD by moving some of their parking spaces into new decks.
Table 8a. Stations in neighborhoods where at least one-third of households do not own a vehicle
station name host municipality
% of households having zero
vehicles
% of households
having 1 vehicle
Warren Street (Newark Light Rail) Newark 52.8% 34.0%Washington Street (Newark Light Rail) Newark 52.4% 32.7%Newark Airport Newark 48.6% 30.3%Norfolk Street (Newark Light Rail) Newark 47.9% 37.6%Military Park (Newark Light Rail) Newark 47.0% 34.1%Journal Square Jersey City 46.1% 39.6%Paterson Paterson 45.8% 38.4%Newport / Pavonia Jersey City 45.7% 45.5%Newark Penn Station Newark 45.5% 34.2%Newark - Broad St. Newark 44.6% 36.6%Orange Street (Newark Light Rail) Newark 43.8% 38.4%Exchange Place (HBLR) Jersey City 43.5% 48.2%Exchange Place (PATH) Jersey City 43.5% 48.2%Harborside Jersey City 43.4% 49.1%Atlantic City Rail Station Atlantic City 42.0% 37.5%Harsimus Jersey City 41.9% 49.4%East Orange East Orange 41.3% 40.8%Hoboken Terminal Hoboken 41.3% 47.6%City Hall Camden 41.1% 39.2%Garfield Avenue (HBLR) Jersey City 41.1% 38.9%Walter Rand Transportation Center Camden 41.1% 40.7%Grove Street (PATH) Jersey City 40.9% 50.4%Harrison Harrison 40.7% 36.6%Cooper Street (River Line) Camden 40.4% 42.4%Jersey Avenue (HBLR) Jersey City 39.7% 49.9%MLK Drive (HBLR) Jersey City 39.6% 37.4%Essex Street (HBLR) Jersey City 39.3% 51.0%Marin Boulevard (HBLR) Jersey City 39.3% 50.7%Liberty State Park Jersey City 38.6% 47.9%2nd Street (HBLR) Hoboken 37.9% 46.3%Hamilton Avenue (River Line) Trenton 37.8% 38.1%Cass Street (River Line) Trenton 36.4% 38.4%Park Avenue (Newark Light Rail) Newark 36.3% 41.8%9th Street (HBLR) Hoboken 36.2% 47.3%West Side Avenue (HBLR) Jersey City 35.6% 36.7%Bloomfield Avenue (Newark Light Rail) Newark 34.6% 41.8%Trenton Transit Center Trenton 34.3% 38.0%Brick Church East Orange 33.9% 44.5%
Ranking station areas according to a varied array of indicators of distress will illustrate that socio-economic hardship comes in many forms and may draw atten tion to less-obvious places that ought to be eligible for TOD programs targeted at weak-market neighbor hoods or municipalities.
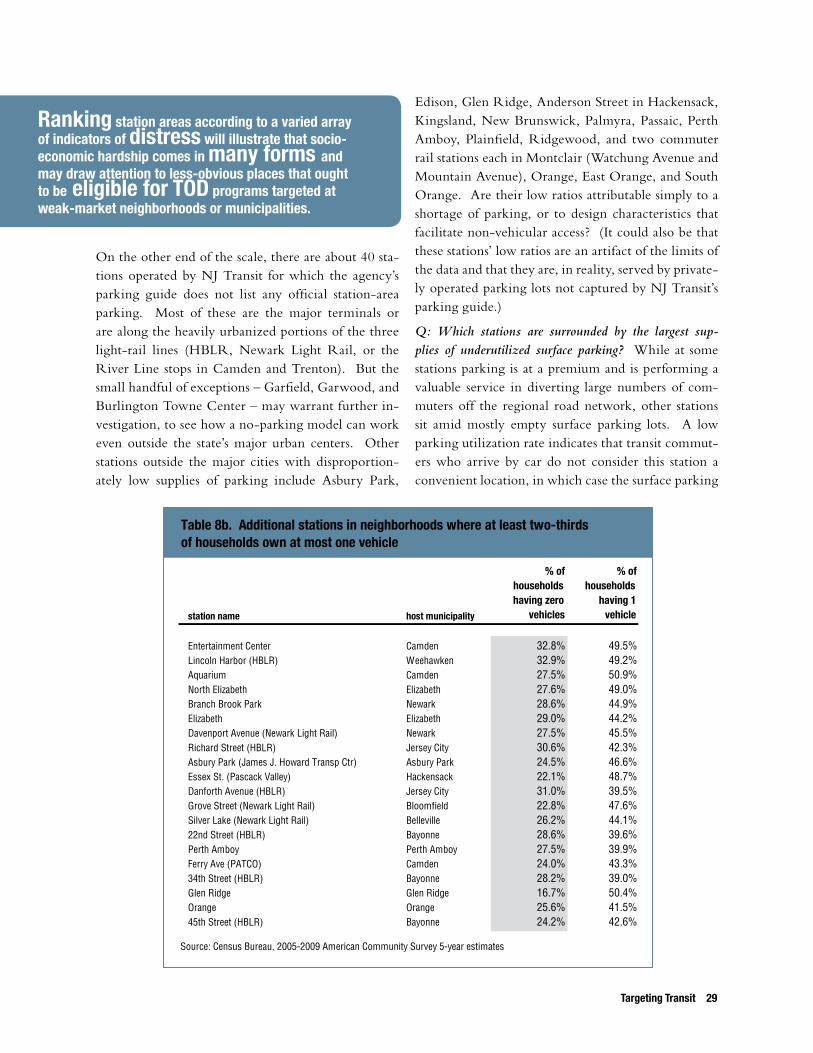
Targeting Transit 29
Table 8b. Additional stations in neighborhoods where at least two-thirdsof households own at most one vehicle
station name host municipality
% of households having zero
vehicles
% of households
having 1 vehicle
Entertainment Center Camden 32.8% 49.5%Lincoln Harbor (HBLR) Weehawken 32.9% 49.2%Aquarium Camden 27.5% 50.9%North Elizabeth Elizabeth 27.6% 49.0%Branch Brook Park Newark 28.6% 44.9%Elizabeth Elizabeth 29.0% 44.2%Davenport Avenue (Newark Light Rail) Newark 27.5% 45.5%Richard Street (HBLR) Jersey City 30.6% 42.3%Asbury Park (James J. Howard Transp Ctr) Asbury Park 24.5% 46.6%Essex St. (Pascack Valley) Hackensack 22.1% 48.7%Danforth Avenue (HBLR) Jersey City 31.0% 39.5%Grove Street (Newark Light Rail) Bloomfield 22.8% 47.6%Silver Lake (Newark Light Rail) Belleville 26.2% 44.1%22nd Street (HBLR) Bayonne 28.6% 39.6%Perth Amboy Perth Amboy 27.5% 39.9%Ferry Ave (PATCO) Camden 24.0% 43.3%34th Street (HBLR) Bayonne 28.2% 39.0%Glen Ridge Glen Ridge 16.7% 50.4%Orange Orange 25.6% 41.5%45th Street (HBLR) Bayonne 24.2% 42.6%
Source: Census Bureau, 2005-2009 American Community Survey 5-year estimates
Ranking station areas according to a varied array of indicators of distress will illustrate that socioeco-nomic hardship comes in many forms .
On the other end of the scale, there are about 40 sta-tions operated by NJ Transit for which the agency’s parking guide does not list any official station-area parking. Most of these are the major terminals or are along the heavily urbanized portions of the three light-rail lines (HBLR, Newark Light Rail, or the River Line stops in Camden and Trenton). But the small handful of exceptions – Garfield, Garwood, and Burlington Towne Center – may warrant further in-vestigation, to see how a no-parking model can work even outside the state’s major urban centers. Other stations outside the major cities with disproportion-ately low supplies of parking include Asbury Park,
Edison, Glen Ridge, Anderson Street in Hackensack, Kingsland, New Brunswick, Palmyra, Passaic, Perth Amboy, Plainfield, Ridgewood, and two commuter rail stations each in Montclair (Watchung Avenue and Mountain Avenue), Orange, East Orange, and South Orange. Are their low ratios attributable simply to a shortage of parking, or to design characteristics that facilitate non-vehicular access? (It could also be that these stations’ low ratios are an artifact of the limits of the data and that they are, in reality, served by private-ly operated parking lots not captured by NJ Transit’s parking guide.)
Q: Which stations are surrounded by the largest sup-plies of underutilized surface parking? While at some stations parking is at a premium and is performing a valuable service in diverting large numbers of com-muters off the regional road network, other stations sit amid mostly empty surface parking lots. A low parking utilization rate indicates that transit commut-ers who arrive by car do not consider this station a convenient location, in which case the surface parking
Ranking station areas according to a varied array of indicators of distress will illustrate that socio-economic hardship comes in many forms and may draw atten tion to less-obvious places that ought to be eligible for TOD programs targeted at weak-market neighbor hoods or municipalities.

30 From Data to Information
lots can be viewed as representing a prime redevelop-ment opportunity. Replacing surface parking with new TOD would have the dual benefit of return-ing essentially barren land into productive use while creating housing, working, or shopping options for potential new transit riders who wish to live or work near transit. If properly designed, the new develop-ments can also create new pedestrian connections to surrounding neighborhoods, possibly inducing some-existing residents who were previously put off by an unattractive, car-oriented station area environment to ride transit. Table 13 lists the station areas where all of the adjacent parking is on surface lots and where less than one-third of the spaces are typically occu-
pied, as monitored by the NJ Transit parking guide. These stations may present the easiest options for real estate developers looking for available land on which to build TOD projects.
In a sense, all surface parking is under-developed, as compared to structured parking, which makes much more efficient use of land for storing vehicles. Using the most recent available parking data for NJ Tran-sit’s stations, the inventory tallies more than 55,000 station-area surface parking spaces statewide. And this figure only hints at the redevelopment potential around transit stations, since surface parking is just one category of under-developed land.
Table 9. Stations in neighborhoods having median household income less than 60 percent of statewide median (statewide median household income = $67,681)
station name host municipality
est. median HH income (weighted
tract avg)
Paterson Paterson 20,671Entertainment Center Camden 22,057Cooper Street (River Line) Camden 22,389Walter Rand Transportation Center Camden 23,957Newark Airport Newark 24,022City Hall Camden 24,895Warren Street (Newark Light Rail) Newark 25,156Aquarium Camden 28,140Norfolk Street (Newark Light Rail) Newark 28,164Washington Street (Newark Light Rail) Newark 29,009Atlantic City Rail Station Atlantic City 30,520Trenton Transit Center Trenton 32,402Orange Street (Newark Light Rail) Newark 32,929Hamilton Avenue (River Line) Trenton 33,227Newark - Broad St. Newark 35,492Cass Street (River Line) Trenton 35,533East Orange East Orange 36,120Park Avenue (Newark Light Rail) Newark 36,277Bloomfield Avenue (Newark Light Rail) Newark 36,844Military Park (Newark Light Rail) Newark 38,301Brick Church East Orange 38,621Elizabeth Elizabeth 39,344Journal Square Jersey City 39,580Newark Penn Station Newark 39,593Asbury Park (James J. Howard Transp Ctr) Asbury Park 39,704Branch Brook Park Newark 40,035
NJ statewide median household income is from the 2010 one-year American Community Survey (ACS);station-area estimates are constructed from tract-level estimates from the 2005-2009 5-year ACS.
A median household income for the whole station neighborhood was estimated by takinga weighted average of the median household incomes for each of the tracts making up the station area.Each tract's median household income was weighted by the number of households in the tract.
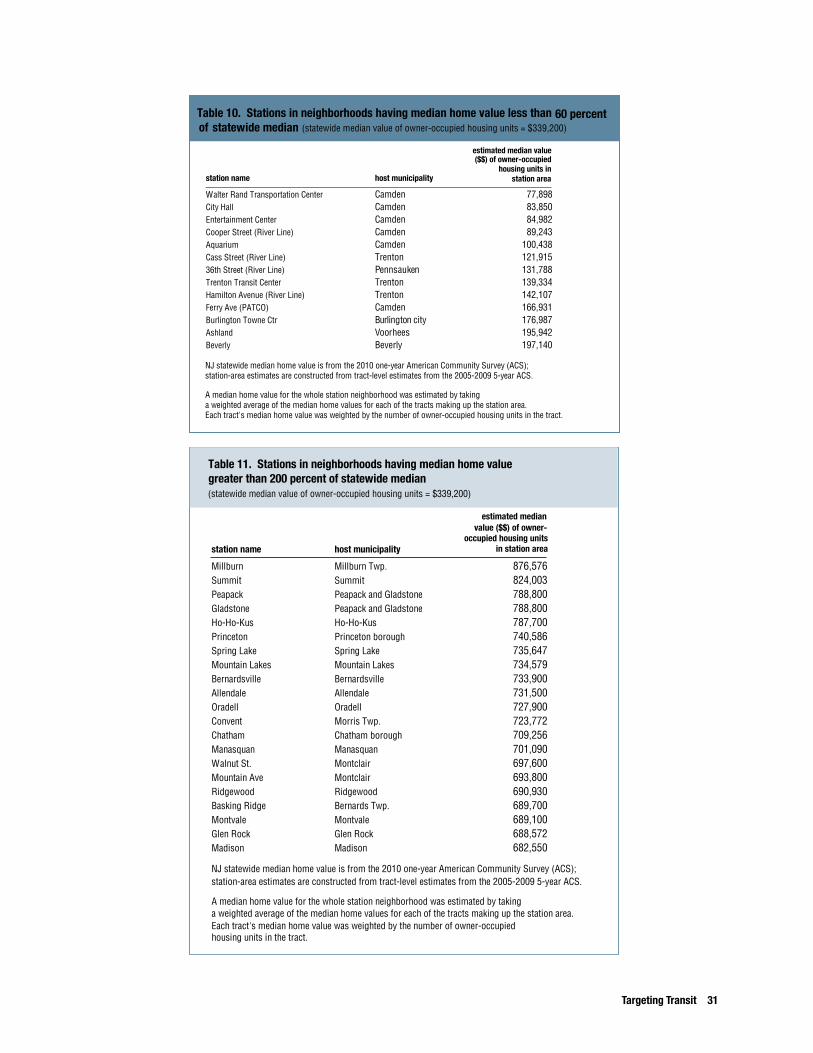
Targeting Transit 31
Table 11. Stations in neighborhoods having median home value greater than 200 percent of statewide median(statewide median value of owner-occupied housing units = $339,200)
station name host municipality
estimated median value ($$) of owner-
occupied housing units in station area
Millburn Millburn Twp. 876,576Summit Summit 824,003Peapack Peapack and Gladstone 788,800Gladstone Peapack and Gladstone 788,800Ho-Ho-Kus Ho-Ho-Kus 787,700Princeton Princeton borough 740,586Spring Lake Spring Lake 735,647Mountain Lakes Mountain Lakes 734,579Bernardsville Bernardsville 733,900Allendale Allendale 731,500Oradell Oradell 727,900Convent Morris Twp. 723,772Chatham Chatham borough 709,256Manasquan Manasquan 701,090Walnut St. Montclair 697,600Mountain Ave Montclair 693,800Ridgewood Ridgewood 690,930Basking Ridge Bernards Twp. 689,700Montvale Montvale 689,100Glen Rock Glen Rock 688,572Madison Madison 682,550
NJ statewide median home value is from the 2010 one-year American Community Survey (ACS);station-area estimates are constructed from tract-level estimates from the 2005-2009 5-year ACS.
A median home value for the whole station neighborhood was estimated by takinga weighted average of the median home values for each of the tracts making up the station area.Each tract's median home value was weighted by the number of owner-occupied housing units in the tract.
Table 10. Stations in neighborhoods having median home value less than 60 percent of statewide median (statewide median value of owner-occupied housing units = $339,200)
station name host municipality
estimated median value ($$) of owner-occupied
housing units in station area
Walter Rand Transportation Center Camden 77,898City Hall Camden 83,850Entertainment Center Camden 84,982Cooper Street (River Line) Camden 89,243Aquarium Camden 100,438Cass Street (River Line) Trenton 121,91536th Street (River Line) Pennsauken 131,788Trenton Transit Center Trenton 139,334Hamilton Avenue (River Line) Trenton 142,107Ferry Ave (PATCO) Camden 166,931Burlington Towne Ctr Burlington city 176,987Ashland Voorhees 195,942Beverly Beverly 197,140
NJ statewide median home value is from the 2010 one-year American Community Survey (ACS);station-area estimates are constructed from tract-level estimates from the 2005-2009 5-year ACS.
A median home value for the whole station neighborhood was estimated by takinga weighted average of the median home values for each of the tracts making up the station area.Each tract's median home value was weighted by the number of owner-occupied housing units in the tract.
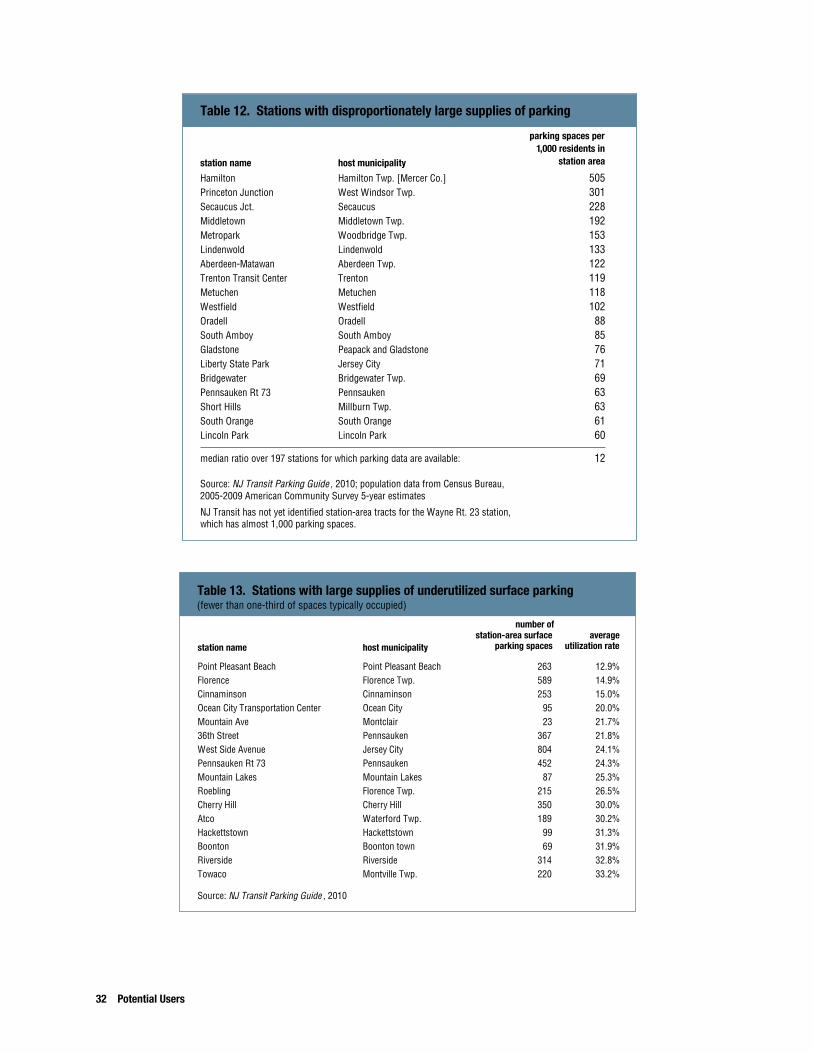
32 Potential Users
average utilization rate
Table 13. Stations with large supplies of underutilized surface parking(fewer than one-third of spaces typically occupied)
station name host municipality
number of station-area surface
parking spaces
Point Pleasant Beach Point Pleasant Beach 263 12.9%Florence Florence Twp. 589 14.9%Cinnaminson Cinnaminson 253 15.0%Ocean City Transportation Center Ocean City 95 20.0%Mountain Ave Montclair 23 21.7%36th Street Pennsauken 367 21.8%West Side Avenue Jersey City 804 24.1%Pennsauken Rt 73 Pennsauken 452 24.3%Mountain Lakes Mountain Lakes 87 25.3%Roebling Florence Twp. 215 26.5%Cherry Hill Cherry Hill 350 30.0%Atco Waterford Twp. 189 30.2%Hackettstown Hackettstown 99 31.3%Boonton Boonton town 69 31.9%Riverside Riverside 314 32.8%Towaco Montville Twp. 220 33.2%
Source: NJ Transit Parking Guide , 2010
Table 12. Stations with disproportionately large supplies of parking
station name host municipality
parking spaces per 1,000 residents in
station area
Hamilton Hamilton Twp. [Mercer Co.] 505Princeton Junction West Windsor Twp. 301Secaucus Jct. Secaucus 228Middletown Middletown Twp. 192Metropark Woodbridge Twp. 153Lindenwold Lindenwold 133Aberdeen-Matawan Aberdeen Twp. 122Trenton Transit Center Trenton 119Metuchen Metuchen 118Westfield Westfield 102Oradell Oradell 88South Amboy South Amboy 85Gladstone Peapack and Gladstone 76Liberty State Park Jersey City 71Bridgewater Bridgewater Twp. 69Pennsauken Rt 73 Pennsauken 63Short Hills Millburn Twp. 63South Orange South Orange 61Lincoln Park Lincoln Park 60
median ratio over 197 stations for which parking data are available: 12
Source: NJ Transit Parking Guide , 2010; population data from Census Bureau,
NJ Transit has not yet identified station-area tracts for the Wayne Rt. 23 station, which has almost 1,000 parking spaces.
2005-2009 American Community Survey 5-year estimates

Targeting Transit 33
the trANsit stAtioN inventory represents a wealth of information about the state’s public transporta-tion system and the neighborhoods that surround its stations, assembled in a single repository. As the examples in the previous section suggest, its ability to answer targeted questions based on strategically selected combinations of variables makes the inven-tory a potentially valuable resource to a variety of users. Three specific categories of users that are often actively engaged in promoting transit-oriented devel-opment – state government agencies, local govern-ment officials, and real estate developers – may find the inventory particularly useful.
State Government
The core of transit-oriented development is public transit, and transit is built and operated by the state or instrumentalities of the state. The state has a great deal of influence over the quality and quantity of transit service and owns real estate adjacent to many transit stations. Additionally, the state determines the regulatory framework and creates the financial incen-tives that either promote or discourage development near transit stations.
The state could invest in transit and transit-oriented development more strategically, by using the transit inventory as follows:
1. Identify transit-rich employment hubs and
reorient employment recruitment programs
accordingly. The state should identify those specific transit stations that best lend themselves to development as transit-focused employment hubs. State sponsored employer recruitment pro-grams could then actively steer employers to these targeted locations that offer transit access to the widest array of potential workers. Programs like the Urban Transit Hub Tax Credit program, the Grow New Jersey program, and the Economic Redevelopment Growth Grant program should all be reviewed to ensure that state employment incentives are focused in station areas with the greatest employment potential. The richest in-centives should be targeted to less affluent com-munities where they can help rebuild markets.
Some residential and retail components are likely to be desirable in any employment hub, although they should probably be considered of secondary priority. State agencies and local officials should be conscious of the need to find the right mix of uses to ensure vibrancy (so as not to create hubs that become ghost towns after 6 p.m.) while fully capitalizing on the particular advantage that central locations offer as employment centers.
2. Identify good candidates for participation in
the Transit Village program. NJDOT could use the information in the transit station inventory to identify municipalities that ought to be recruit-ed into the Transit Village program. Municipali-ties with high population or employment density in their station areas, or with large populations of zero-vehicle households, or whose stations are situated in a traditional downtown environment, may be only a few new pedestrian amenities away from becoming truly transit-oriented, a gap that could be bridged by the incentives offered by the Transit Village program.
3. Highlight promising transit hubs in the
State Strategic Plan to ensure state
agency support for Tod. The Office of Planning Advocacy (OPA), in consultation with NJ Tran-sit and NJDOT, should identify all transit station areas that are good candidates for transit-oriented development, based on ridership potential, char-acteristics of the surrounding area, and a lack of significant environmental constraints.
These “promising transit hubs” should be rec-ognized in the State Strategic Plan as Priority Growth Investment Areas to facilitate alignment of state agency programs, regulations, and capital spending in support of transit-oriented develop-ment. For example, the hubs should receive pref-erential access to: DOT funding to improve access to transit through roadway improvements, bike/pedestrian amenities, and community shuttles; NJ Environmental Infrastructure Trust funding for the water, wastewater, and stormwater improve-ments needed to accommodate additional growth;
Part VI: Potential users of the Inventory
34 Potential Users
and New Jersey Department of Environmental Protection (DEP) assistance with infrastructure permits.
4. consider Tod potential when making capital
investment and operating decisions for the
transit system. NJ Transit could use many of the data items in the transit station inventory, in addition to its own ridership and parking utiliza-tion data, to evaluate its capital investment and operating decisions in terms of their impact on TOD potential. For example, NJ Transit could prioritize transit stations with great TOD po-tential for upgrades to station facilities, transit service, and expansions of the transit system.
Municipal Leaders
Local elected officials and their staffs (including plan-ning and zoning boards) have the ability to shape the areas surrounding transit stations through plan-ning, zoning, and public support for (or rejection of ) development efforts. Chambers of Commerce, “Main Street” organizations, and other business lead-ers can also influence perceptions of neighborhoods around transit stations via marketing efforts and civic improvement projects (see “Presence of a ‘down-town’” in Part III).
These local leaders could use the transit station inventory to learn more about the demographics of the neighborhoods surrounding transit stations in their municipalities. Things like household income, vehicle ownership, and population density can give them insights into what kinds of businesses might
succeed in a TOD and how many people would have easy access to these businesses. Information about station-area parking utilization could alert them to a need for more parking, either at their own station or at another nearby station with better access to the re-gional road network. Or a relatively limited supply of parking but lack of an accompanying traffic problem might together indicate a high degree of non-vehic-ular access to the station, thus pointing to where new pedestrian amenities might prove to be a worthwhile investment.
real Estate developers
Developers are increasingly recognizing transit station areas as untapped resources that offer transportation choices for their residents, choices that many potential residents desire but that have been chronically under-supplied by housing markets for decades. For the right developer, even a transit station in a distressed area can be used as a focal point around which value can be restored to a presently undervalued neighborhood.
Developers could use the transit station inventory to identify station-area neighborhoods where home values (and thus land values) are low, thus presenting inexpensive transit-oriented redevelopment opportu-nities. They could use it to evaluate a station’s mar-ketability by looking at its frequency of transit service and its accessibility to major regional destinations. In addition, many of the demographic variables of interest to municipal leaders will also be of interest to developers, in terms of identifying opportunities to diversify the housing stock.
Targeting Transit 35
this report highlights the extent of New Jersey’s transit network and its rich potential for transit-ori-ented development, as well as the state of New Jersey’s recognition of the importance of transit ridership in a variety of state-level plans and programs. There are a number of ways that state government can expand transit ridership and generally facilitate transit-orient-ed development:
1. Establish an explicit statewide goal for in-
creased transit ridership. The State of New Jersey could establish a strategic goal for increas-ing transit ridership, such as the goal in New Jersey’s Global Warming Response Act Recom-mendations Report for 2020 to double transit ridership by 2050. Establishing a specific target will enable state departments to align investment plans, regulations, and programs toward meeting this goal.
2. Expand and improve the public transit sys-
tem with sustainable funding. Increasing transit ridership will involve both improving ex-isting service for all transit modes and expanding transit infrastructure. The state can fund system-wide improvements by:
a. Dedicating a larger percentage of transporta-tion funds to transit. Transit ridership has increased substantially over the past decade; meanwhile, the percentage of transportation funding that goes to transit has slipped. It is important that investment in our public transit system keeps pace with the system’s popularity.
b. Increasing dedicated funding for transporta-tion investments. New Jersey does not have a stable source of revenue large enough to meet its transportation needs. In order to effectively fund transportation and reduce our reliance on debt, the state must generate and constitutionally dedicate new revenues to the Transportation Trust Fund at a level high enough to meet New Jersey’s 21st-cen-tury needs and ambitions.
c. Creating a dedicated funding source for tran-sit and transportation operations. New Jersey needs to end the practice of paying for New Jersey Transit and Department of Transpor-tation operations with capital funds, instead establishing a separate, dedicated revenue stream for operations
3. Encourage transit ridership through use of
an integrated farecard. New Jersey’s multi-ple public transportation operators – NJ Transit, PATH, PATCO, ferry companies, and perhaps even SEPTA – could work together toward creat-ing an integrated farecard that allows for seamless transfers among systems and also among different modes (commuter rail, light rail, bus, etc.) run by the same operator. The smoother the transfer be-tween different transit lines, the greater the acces-sibility of the transit network overall and the more people can be induced to use it. An “E-ZPass” for transit (see sidebar on page 11), by simplifying fare collection, would save time and hassle for travel-ers and thus effectively expand transit’s catchment radius for a given travel time.
4. Foster transit-oriented development proj-
ects on NJ Transit-owned sites. NJ Transit owns a significant amount of real estate around existing transit stations, including surface parking lots. The state has begun to view these sites as important assets that can be leveraged to stimu-late appropriate station-area real estate develop-ment. The state has the ability to work with the host municipality to plan for redevelopment, and also has the power to partner with private-sector builders to develop the site, once a redevelop-ment strategy is in place. NJ Transit piloted this partnership approach – with favorable results – in the Highlands at Morristown Station transit village development in Morristown; it should continue looking for other similar opportunities to actively participate in creating TOD on sites it owns.
In other parts of the country, station-area real estate projects on agency-owned land are struc-
Part VII: recommendations
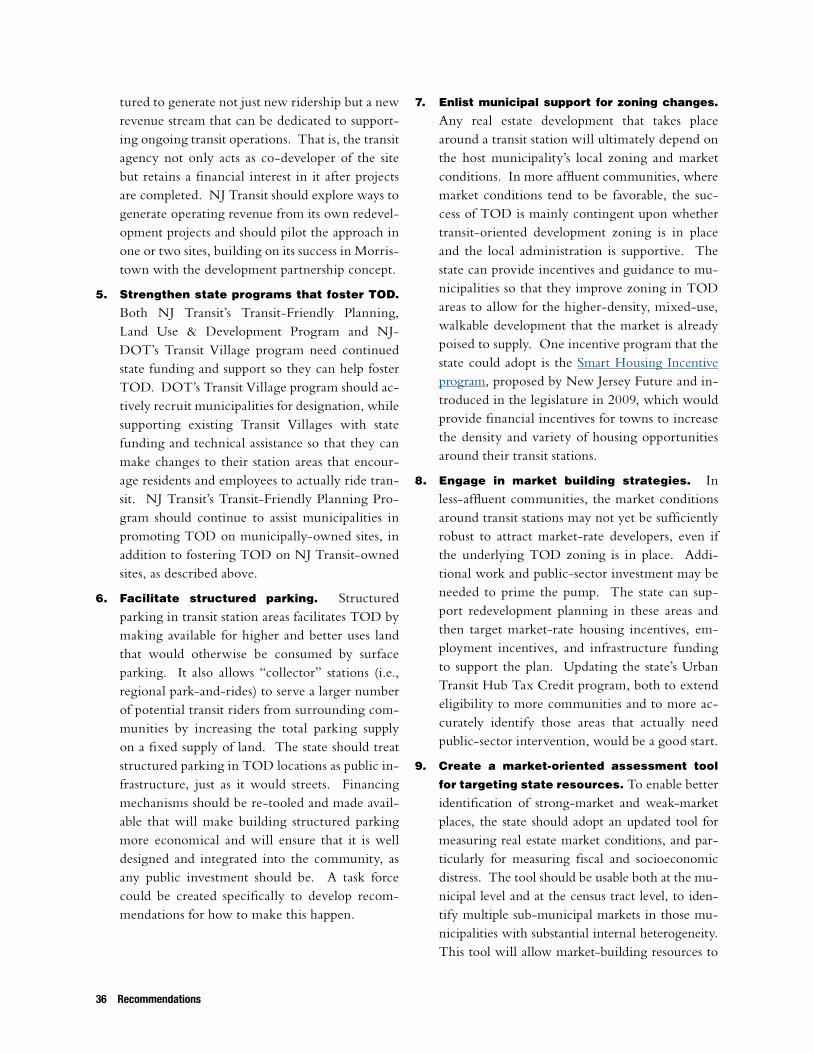
36 Recommendations
tured to generate not just new ridership but a new revenue stream that can be dedicated to support-ing ongoing transit operations. That is, the transit agency not only acts as co-developer of the site but retains a financial interest in it after projects are completed. NJ Transit should explore ways to generate operating revenue from its own redevel-opment projects and should pilot the approach in one or two sites, building on its success in Morris-town with the development partnership concept.
5. Strengthen state programs that foster Tod.
Both NJ Transit’s Transit-Friendly Planning, Land Use & Development Program and NJ-DOT’s Transit Village program need continued state funding and support so they can help foster TOD. DOT’s Transit Village program should ac-tively recruit municipalities for designation, while supporting existing Transit Villages with state funding and technical assistance so that they can make changes to their station areas that encour-age residents and employees to actually ride tran-sit. NJ Transit’s Transit-Friendly Planning Pro-gram should continue to assist municipalities in promoting TOD on municipally-owned sites, in addition to fostering TOD on NJ Transit-owned sites, as described above.
6. Facilitate structured parking. Structured parking in transit station areas facilitates TOD by making available for higher and better uses land that would otherwise be consumed by surface parking. It also allows “collector” stations (i.e., regional park-and-rides) to serve a larger number of potential transit riders from surrounding com-munities by increasing the total parking supply on a fixed supply of land. The state should treat structured parking in TOD locations as public in-frastructure, just as it would streets. Financing mechanisms should be re-tooled and made avail-able that will make building structured parking more economical and will ensure that it is well designed and integrated into the community, as any public investment should be. A task force could be created specifically to develop recom-mendations for how to make this happen.
7. Enlist municipal support for zoning changes. Any real estate development that takes place around a transit station will ultimately depend on the host municipality’s local zoning and market conditions. In more affluent communities, where market conditions tend to be favorable, the suc-cess of TOD is mainly contingent upon whether transit-oriented development zoning is in place and the local administration is supportive. The state can provide incentives and guidance to mu-nicipalities so that they improve zoning in TOD areas to allow for the higher-density, mixed-use, walkable development that the market is already poised to supply. One incentive program that the state could adopt is the Smart Housing Incentive program, proposed by New Jersey Future and in-troduced in the legislature in 2009, which would provide financial incentives for towns to increase the density and variety of housing opportunities around their transit stations.
8. Engage in market building strategies. In less-affluent communities, the market conditions around transit stations may not yet be sufficiently robust to attract market-rate developers, even if the underlying TOD zoning is in place. Addi-tional work and public-sector investment may be needed to prime the pump. The state can sup-port redevelopment planning in these areas and then target market-rate housing incentives, em-ployment incentives, and infrastructure funding to support the plan. Updating the state’s Urban Transit Hub Tax Credit program, both to extend eligibility to more communities and to more ac-curately identify those areas that actually need public-sector intervention, would be a good start.
9. create a market-oriented assessment tool
for targeting state resources. To enable better identification of strong-market and weak-market places, the state should adopt an updated tool for measuring real estate market conditions, and par-ticularly for measuring fiscal and socioeconomic distress. The tool should be usable both at the mu-nicipal level and at the census tract level, to iden-tify multiple sub-municipal markets in those mu-nicipalities with substantial internal heterogeneity. This tool will allow market-building resources to

Targeting Transit 37
be more effectively directed toward those places that both need the funds and can effectively lever-age the funds with private investments. Converse-ly, the tool will support better targeting of state programs and investments designed to increase housing opportunities for low- and moderate-in-come households near jobs and better schools. The NJDOT could provide it to Transit Villages to as-sist them in planning for private investment. This tool would have broad applicability for targeting all manner of state incentive programs, well beyond the promotion of TOD.
10. Foster good design to ensure attractive,
pedestrian-friendly station areas. TOD of-fers an opportunity for communities to create places that are more vibrant, fun, and interesting by capitalizing on existing foot traffic near stations and by taking active steps to encourage more of it. It is important to pay attention to design specifics, such as allowing appropriate densities that support walking; encouraging a rich mix of uses that gen-erate activity throughout the day; and ensuring a comfortable, safe, and visually appealing set-ting with sidewalks, trees, lighting, and attractive buildings. The state can support good municipal design in a cost-effective manner through:
a. Updating NJ Transit’s Planning for Transit-Friendly Land Use, to include design principles and model design guidelines appropriate for TOD areas of varying sizes and scales.
b. Incorporating design principles for walkable TOD and downtown areas into the manda-tory training for planning and zoning officials.
c. Providing a competitive mini-grant program to allow municipalities with high-potential transit hubs to develop design guidelines.
11. Promote a range of housing options near
transit. Residential development in TOD ar-eas should include housing at a variety of prices, including homes affordable to families of more modest incomes. This gives a broader range of households access to alternative (and in many cases less expensive) transportation options for getting to jobs elsewhere in the region (provided those jobs are also transit-accessible) and allows them
to live in a neighborhood where many non-work destinations are accessible on foot. For the com-munity, it means a more diverse labor pool, more patrons for neighborhood businesses, and less traf-fic, as workers in a wider range of professions are able to leave their cars at home. The state can cre-ate incentives for more affluent towns to produce and integrate housing for lower-income house-holds while engaging in market-building activi-ties in less affluent communities, where incentives are needed to foster middle-class and higher-end housing. State programs that support TOD, in-cluding the Urban Transit Hub Tax Credit pro-gram and the Transit Village program, should require municipalities to provide a mix of hous-ing opportunities, including housing for low- and moderate-income families.
12. Make it easier to engage in redevelopment
instead of open-space development. Since most of the transit stations in New Jersey are lo-cated in already-developed areas, station-area de-velopment opportunities are mainly going to be redevelopment opportunities. However, for a va-riety of reasons, it remains easier and cheaper to develop on the state’s remaining open spaces than to redevelop previously used sites. The state Of-fice of Planning Advocacy should make a concert-ed effort to identify obstacles to redevelopment, including difficulties involved in land assembly and financing, and should implement specific in-cremental changes that will help to make redevel-opment the preferred development choice.
13. consider environmental opportunities and
constraints. As train station areas are redevel-oped, part of their vibrancy will depend on how well environmental features and amenities are incorporated. Rather than a license to develop everything, redevelopment should be viewed as an opportunity to improve both the built and the natural environments. This means designing for urban greenery, including parks and tree-lined streets, and highlighting rather than hiding or burying natural features like streams, geologic characteristics, and unique flora. It also means designing buildings that integrate better into the environment from energy, wastewater and storm-
water standpoints. An environmental plan should be part of any redevelopment plan.
The state should also identify any transit stations whose surrounding neighborhoods should not be targeted for future growth because of environ-mental constraints. Perhaps the station was built in what was then or has since become a flood-plain. Perhaps the station’s surrounding area has since been identified as prime farmland, critical wildlife habitat, or an important groundwater recharge area. For various reasons, not every transit station should necessarily be a candidate for further growth.
38 Recommendations Targeting Transit 39
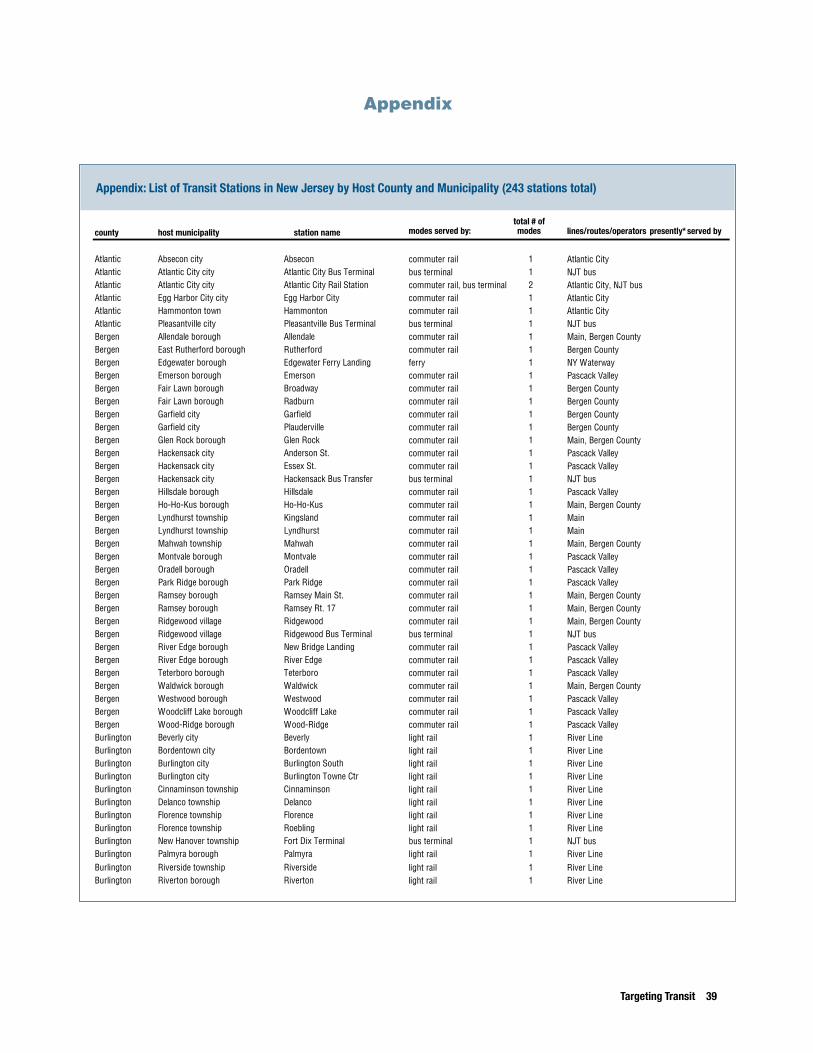
Targeting Transit 39
Appendix: List of Transit Stations in New Jersey by Host County and Municipality (243 stations total)
county host municipality station name modes served by:total # of modes lines/routes/operators presently* served by
Atlantic Absecon city Absecon commuter rail 1 Atlantic CityAtlantic Atlantic City city Atlantic City Bus Terminal bus terminal 1 NJT busAtlantic Atlantic City city Atlantic City Rail Station commuter rail, bus terminal 2 Atlantic City, NJT busAtlantic Egg Harbor City city Egg Harbor City commuter rail 1 Atlantic CityAtlantic Hammonton town Hammonton commuter rail 1 Atlantic CityAtlantic Pleasantville city Pleasantville Bus Terminal bus terminal 1 NJT busBergen Allendale borough Allendale commuter rail 1 Main, Bergen CountyBergen East Rutherford borough Rutherford commuter rail 1 Bergen CountyBergen Edgewater borough Edgewater Ferry Landing ferry 1 NY WaterwayBergen Emerson borough Emerson commuter rail 1 Pascack ValleyBergen Fair Lawn borough Broadway commuter rail 1 Bergen CountyBergen Fair Lawn borough Radburn commuter rail 1 Bergen CountyBergen Garfield city Garfield commuter rail 1 Bergen CountyBergen Garfield city Plauderville commuter rail 1 Bergen CountyBergen Glen Rock borough Glen Rock commuter rail 1 Main, Bergen CountyBergen Hackensack city Anderson St. commuter rail 1 Pascack ValleyBergen Hackensack city Essex St. commuter rail 1 Pascack ValleyBergen Hackensack city Hackensack Bus Transfer bus terminal 1 NJT busBergen Hillsdale borough Hillsdale commuter rail 1 Pascack ValleyBergen Ho-Ho-Kus borough Ho-Ho-Kus commuter rail 1 Main, Bergen CountyBergen Lyndhurst township Kingsland commuter rail 1 MainBergen Lyndhurst township Lyndhurst commuter rail 1 MainBergen Mahwah township Mahwah commuter rail 1 Main, Bergen CountyBergen Montvale borough Montvale commuter rail 1 Pascack ValleyBergen Oradell borough Oradell commuter rail 1 Pascack ValleyBergen Park Ridge borough Park Ridge commuter rail 1 Pascack ValleyBergen Ramsey borough Ramsey Main St. commuter rail 1 Main, Bergen CountyBergen Ramsey borough Ramsey Rt. 17 commuter rail 1 Main, Bergen CountyBergen Ridgewood village Ridgewood commuter rail 1 Main, Bergen CountyBergen Ridgewood village Ridgewood Bus Terminal bus terminal 1 NJT busBergen River Edge borough New Bridge Landing commuter rail 1 Pascack ValleyBergen River Edge borough River Edge commuter rail 1 Pascack ValleyBergen Teterboro borough Teterboro commuter rail 1 Pascack ValleyBergen Waldwick borough Waldwick commuter rail 1 Main, Bergen CountyBergen Westwood borough Westwood commuter rail 1 Pascack ValleyBergen Woodcliff Lake borough Woodcliff Lake commuter rail 1 Pascack ValleyBergen Wood-Ridge borough Wood-Ridge commuter rail 1 Pascack ValleyBurlington Beverly city Beverly light rail 1 River LineBurlington Bordentown city Bordentown light rail 1 River LineBurlington Burlington city Burlington South light rail 1 River LineBurlington Burlington city Burlington Towne Ctr light rail 1 River LineBurlington Cinnaminson township Cinnaminson light rail 1 River LineBurlington Delanco township Delanco light rail 1 River LineBurlington Florence township Florence light rail 1 River LineBurlington Florence township Roebling light rail 1 River LineBurlington New Hanover township Fort Dix Terminal bus terminal 1 NJT busBurlington Palmyra borough Palmyra light rail 1 River LineBurlington Riverside township Riverside light rail 1 River LineBurlington Riverton borough Riverton light rail 1 River Line
Appendix
Appendix: List of Transit Stations in New Jersey by Host County and Municipality (243 stations total)

Appendix: List of Transit Stations in New Jersey by Host County and Municipality
county host municipality station name modes served by:total # of modes lines/routes/operators presently* served by
Camden Camden city Aquarium light rail 1 River LineCamden Camden city City Hall rapid transit 1 PATCOCamden Camden city Cooper Street light rail 1 River LineCamden Camden city Entertainment Center light rail 1 River LineCamden Camden city Ferry Ave. rapid transit 1 PATCO
Camden Camden city Walter Rand Transportation Center light rail, rapid transit, bus terminal
3 River Line, PATCO, NJT bus
Camden Cherry Hill township Cherry Hill commuter rail 1 Atlantic CityCamden Cherry Hill township Woodcrest rapid transit 1 PATCOCamden Collingswood borough Collingswood rapid transit 1 PATCOCamden Haddon township Westmont rapid transit 1 PATCOCamden Haddonfield borough Haddonfield rapid transit 1 PATCOCamden Lindenwold borough Lindenwold commuter rail, rapid transit 2 Atlantic City, PATCOCamden Pennsauken township 36th Street light rail 1 River LineCamden Pennsauken township Pennsauken Rt 73 light rail 1 River LineCamden Voorhees township Ashland rapid transit 1 PATCOCamden Waterford township Atco commuter rail 1 Atlantic CityCape May Cape May city Cape May City Depot bus terminal 1 NJT busCape May Ocean City city Ocean City Transportation Center bus terminal 1 NJT busCape May Wildwood city Wildwood Bus Terminal bus terminal 1 NJT busCumberland Vineland city Vineland Bus Terminal bus terminal 1 NJT busEssex Belleville township Silver Lake light rail 1 Newark Light RailEssex Bloomfield township Bloomfield commuter rail 1 Montclair-BoontonEssex Bloomfield township Grove Street (Newark Light Rail) light rail 1 Newark Light RailEssex Bloomfield township Watsessing Ave commuter rail 1 Montclair-BoontonEssex City of Orange township Highland Ave commuter rail 1 M & E Morristown, M & E GladstoneEssex City of Orange township Orange commuter rail 1 M & E Morristown, M & E GladstoneEssex East Orange city Brick Church commuter rail 1 M & E Morristown, M & E GladstoneEssex East Orange city East Orange commuter rail 1 M & E Morristown, M & E GladstoneEssex Glen Ridge borough Glen Ridge commuter rail 1 Montclair-BoontonEssex Irvington township Irvington Bus Terminal bus terminal 1 NJT busEssex Maplewood township Maplewood commuter rail 1 M & E Morristown, M & E GladstoneEssex Millburn township Millburn commuter rail 1 M & E Morristown, M & E GladstoneEssex Millburn township Short Hills commuter rail 1 M & E Morristown, M & E GladstoneEssex Montclair township Bay St. commuter rail 1 Montclair-BoontonEssex Montclair township Montclair Heights commuter rail 1 Montclair-BoontonEssex Montclair township Mountain Ave commuter rail 1 Montclair-BoontonEssex Montclair township Upper Montclair commuter rail 1 Montclair-BoontonEssex Montclair township Walnut St. commuter rail 1 Montclair-BoontonEssex Montclair township Watchung Ave commuter rail 1 Montclair-BoontonEssex Newark city Atlantic Street light rail 1 Newark Light RailEssex Newark city Bears Stadium light rail 1 Newark Light RailEssex Newark city Bloomfield Avenue light rail 1 Newark Light RailEssex Newark city Branch Brook Park light rail 1 Newark Light RailEssex Newark city Davenport Avenue light rail 1 Newark Light Rail
Essex Newark city Military Park light rail 1 Newark Light Rail
Essex Newark city Newark - Broad St. commuter rail, light rail 2 M & E Morristown, M & E Gladstone, Montclair-Boonton, Newark Light Rail
Essex Newark city Newark Airport commuter rail 1 Northeast Corridor, North Jersey Coast
Essex Newark city Newark Penn Station commuter rail, light rail, rapid transit, bus terminal
4 Northeast Corridor, North Jersey Coast, Raritan Valley, PATH, Newark Light Rail, NJT bus
Essex Newark city Norfolk Street light rail 1 Newark Light RailEssex Newark city Orange Street light rail 1 Newark Light RailEssex Newark city Park Avenue light rail 1 Newark Light RailEssex Newark city Performing Arts Ctr light rail 1 Newark Light RailEssex Newark city Warren Street light rail 1 Newark Light RailEssex Newark city Washington Park light rail 1 Newark Light RailEssex Newark city Washington Street light rail 1 Newark Light RailEssex South Orange Village township Mountain Station commuter rail 1 M & E Morristown, M & E GladstoneEssex South Orange Village township South Orange commuter rail 1 M & E Morristown, M & E Gladstone
40 Appendix Targeting Transit 41
Appendix: List of Transit Stations in New Jersey by Host County and Municipality (243 stations total)

Appendix: List of Transit Stations in New Jersey by Host County and Municipality
county host municipality station name modes served by:total # of modes lines/routes/operators presently* served by
Hudson Bayonne city 22nd Street light rail 1 H-B Light RailHudson Bayonne city 34th Street light rail 1 H-B Light RailHudson Bayonne city 45th Street light rail 1 H-B Light RailHudson Harrison town Harrison rapid transit 1 PATHHudson Hoboken city 2nd Street light rail 1 H-B Light RailHudson Hoboken city 9th Street light rail 1 H-B Light RailHudson Hoboken city Hoboken 14th St ferry 1 NY Waterway (2 routes)
Hudson Hoboken city Hoboken Terminal commuter rail, light rail, rapid transit, bus terminal, ferry
5M & E Morristown, M & E Gladstone, Montclair-Boonton, Pascack Valley, Main, Bergen County, North Jersey Coast, PATH, H-B Light Rail, NJT bus, NY Waterway ferry (2 routes)
Hudson Jersey City city Danforth Avenue light rail 1 H-B Light RailHudson Jersey City city Essex Street light rail 1 H-B Light RailHudson Jersey City city Exchange Place (HBLR) light rail 1 H-B Light RailHudson Jersey City city Exchange Place (PATH) rapid transit, ferry 2 PATH, NY Waterway ferry (3 routes)Hudson Jersey City city Garfield Avenue light rail 1 H-B Light RailHudson Jersey City city Grove Street (PATH) rapid transit 1 PATHHudson Jersey City city Harborside light rail 1 H-B Light RailHudson Jersey City city Harsimus light rail 1 H-B Light RailHudson Jersey City city Jersey Avenue (J.C.) light rail 1 H-B Light RailHudson Jersey City city Journal Square rapid transit, bus terminal 2 PATH, NJT busHudson Jersey City city Liberty Harbor / Marin Blvd. ferry 1 NY WaterwayHudson Jersey City city Liberty Landing Marina ferry 1 Liberty LandingHudson Jersey City city Liberty State Park light rail 1 H-B Light RailHudson Jersey City city Marin Boulevard light rail 1 H-B Light RailHudson Jersey City city MLK Drive light rail 1 H-B Light RailHudson Jersey City city Newport ferry 1 NY WaterwayHudson Jersey City city Newport / Pavonia light rail, rapid transit 2 H-B Light Rail, PATHHudson Jersey City city Port Liberte ferry 1 NY WaterwayHudson Jersey City city Richard Street light rail 1 H-B Light RailHudson Jersey City city Warren St. ferry 1 Liberty LandingHudson Jersey City city West Side Avenue light rail 1 H-B Light RailHudson North Bergen township Tonnelle Avenue light rail 1 H-B Light Rail
Hudson Secaucus town Secaucus Jct. commuter rail 1Northeast Corridor, North Jersey Coast, M & E Morristown, M & E Gladstone, Montclair-Boonton, Pascack Valley, Main, Bergen County
Hudson Union City city Bergenline Avenue light rail 1 H-B Light RailHudson Weehawken township Lincoln Harbor ferry terminal ferry 1 NY WaterwayHudson Weehawken township Lincoln Harbor (HBLR) light rail 1 H-B Light RailHudson Weehawken township Port Imperial (HBLR) light rail 1 H-B Light RailHudson Weehawken township Port Imperial Weehawken ferry 1 NY Waterway (3 routes)
Hunterdon Clinton township Annandale commuter rail 1 Raritan ValleyHunterdon High Bridge borough High Bridge commuter rail 1 Raritan ValleyHunterdon Lebanon borough Lebanon commuter rail 1 Raritan ValleyHunterdon Readington township White House commuter rail 1 Raritan Valley
Targeting Transit 41
Appendix: List of Transit Stations in New Jersey by Host County and Municipality (243 stations total)
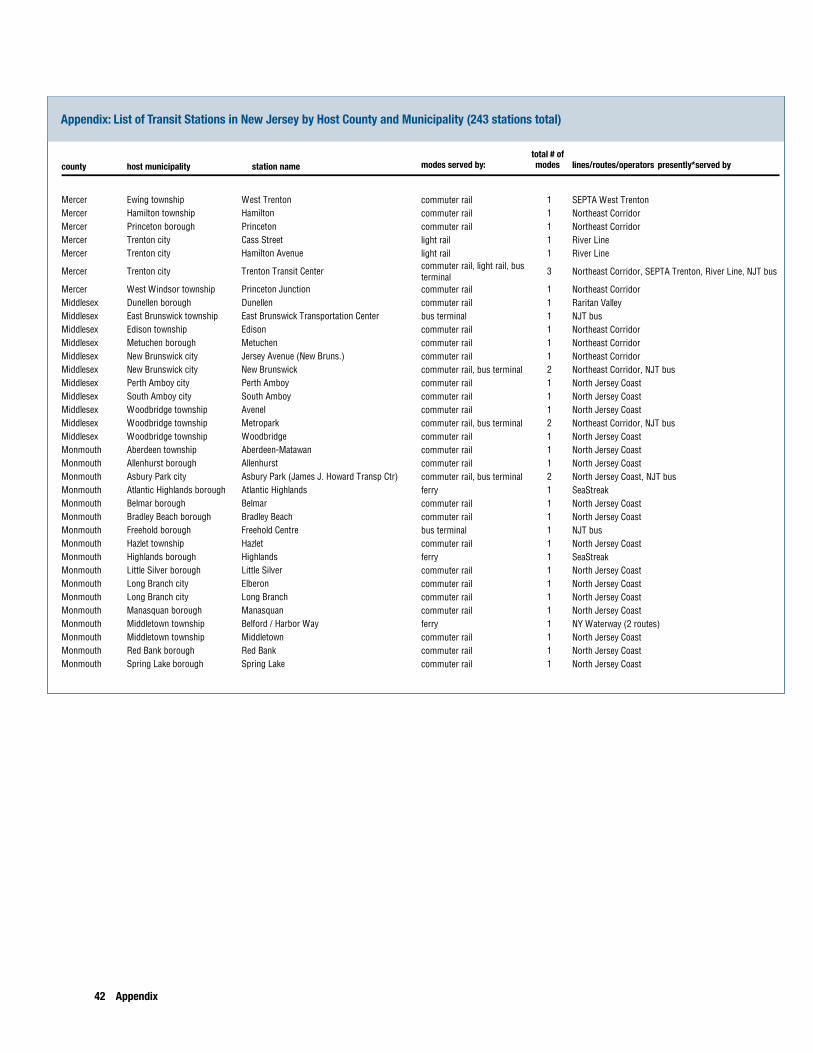
Appendix: List of Transit Stations in New Jersey by Host County and Municipality
county host municipality station name modes served by:total # of modes lines/routes/operators presently* served by
Mercer Ewing township West Trenton commuter rail 1 SEPTA West TrentonMercer Hamilton township Hamilton commuter rail 1 Northeast CorridorMercer Princeton borough Princeton commuter rail 1 Northeast CorridorMercer Trenton city Cass Street light rail 1 River LineMercer Trenton city Hamilton Avenue light rail 1 River Line
Mercer Trenton city Trenton Transit Center commuter rail, light rail, bus terminal
3 Northeast Corridor, SEPTA Trenton, River Line, NJT bus
Mercer West Windsor township Princeton Junction commuter rail 1 Northeast CorridorMiddlesex Dunellen borough Dunellen commuter rail 1 Raritan ValleyMiddlesex East Brunswick township East Brunswick Transportation Center bus terminal 1 NJT busMiddlesex Edison township Edison commuter rail 1 Northeast CorridorMiddlesex Metuchen borough Metuchen commuter rail 1 Northeast CorridorMiddlesex New Brunswick city Jersey Avenue (New Bruns.) commuter rail 1 Northeast CorridorMiddlesex New Brunswick city New Brunswick commuter rail, bus terminal 2 Northeast Corridor, NJT busMiddlesex Perth Amboy city Perth Amboy commuter rail 1 North Jersey CoastMiddlesex South Amboy city South Amboy commuter rail 1 North Jersey CoastMiddlesex Woodbridge township Avenel commuter rail 1 North Jersey CoastMiddlesex Woodbridge township Metropark commuter rail, bus terminal 2 Northeast Corridor, NJT busMiddlesex Woodbridge township Woodbridge commuter rail 1 North Jersey CoastMonmouth Aberdeen township Aberdeen-Matawan commuter rail 1 North Jersey CoastMonmouth Allenhurst borough Allenhurst commuter rail 1 North Jersey CoastMonmouth Asbury Park city Asbury Park (James J. Howard Transp Ctr) commuter rail, bus terminal 2 North Jersey Coast, NJT busMonmouth Atlantic Highlands borough Atlantic Highlands ferry 1 SeaStreakMonmouth Belmar borough Belmar commuter rail 1 North Jersey CoastMonmouth Bradley Beach borough Bradley Beach commuter rail 1 North Jersey CoastMonmouth Freehold borough Freehold Centre bus terminal 1 NJT busMonmouth Hazlet township Hazlet commuter rail 1 North Jersey CoastMonmouth Highlands borough Highlands ferry 1 SeaStreakMonmouth Little Silver borough Little Silver commuter rail 1 North Jersey CoastMonmouth Long Branch city Elberon commuter rail 1 North Jersey CoastMonmouth Long Branch city Long Branch commuter rail 1 North Jersey CoastMonmouth Manasquan borough Manasquan commuter rail 1 North Jersey CoastMonmouth Middletown township Belford / Harbor Way ferry 1 NY Waterway (2 routes)Monmouth Middletown township Middletown commuter rail 1 North Jersey CoastMonmouth Red Bank borough Red Bank commuter rail 1 North Jersey CoastMonmouth Spring Lake borough Spring Lake commuter rail 1 North Jersey Coast
42 Appendix Targeting Transit 43
Appendix: List of Transit Stations in New Jersey by Host County and Municipality (243 stations total)
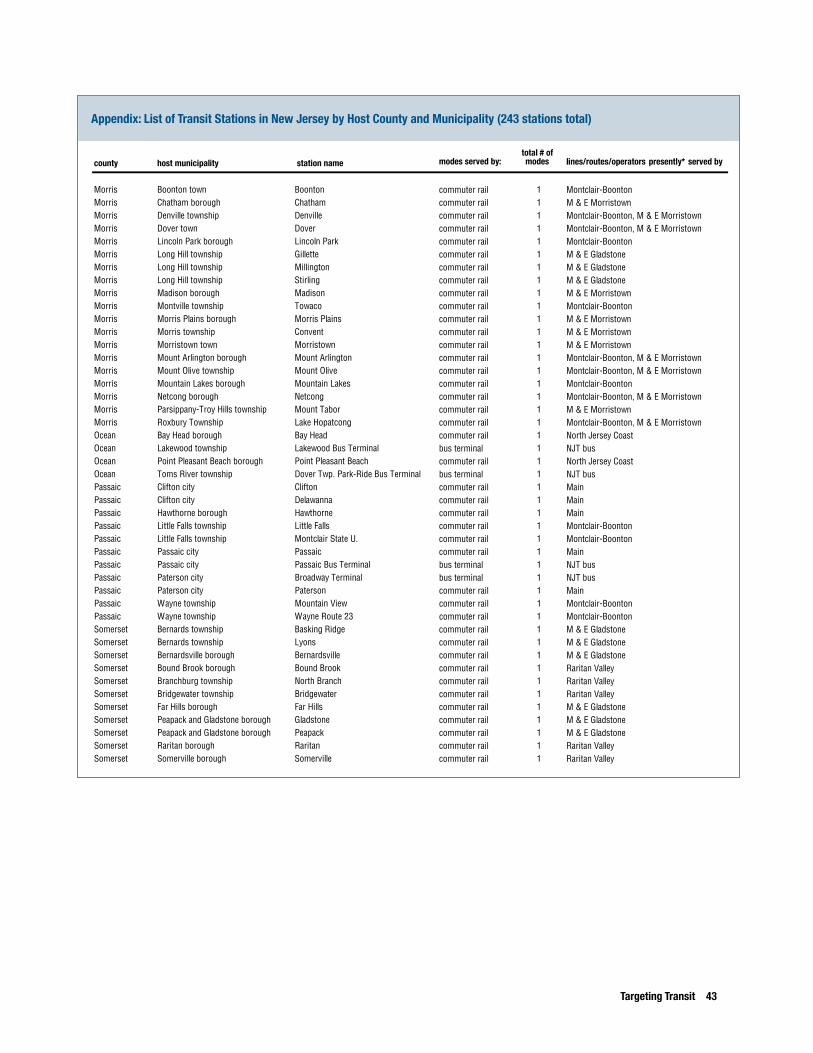
Appendix: List of Transit Stations in New Jersey by Host County and Municipality
county host municipality station name modes served by:total # of modes lines/routes/operators presently* served by
Morris Boonton town Boonton commuter rail 1 Montclair-BoontonMorris Chatham borough Chatham commuter rail 1 M & E MorristownMorris Denville township Denville commuter rail 1 Montclair-Boonton, M & E MorristownMorris Dover town Dover commuter rail 1 Montclair-Boonton, M & E MorristownMorris Lincoln Park borough Lincoln Park commuter rail 1 Montclair-BoontonMorris Long Hill township Gillette commuter rail 1 M & E GladstoneMorris Long Hill township Millington commuter rail 1 M & E GladstoneMorris Long Hill township Stirling commuter rail 1 M & E GladstoneMorris Madison borough Madison commuter rail 1 M & E MorristownMorris Montville township Towaco commuter rail 1 Montclair-BoontonMorris Morris Plains borough Morris Plains commuter rail 1 M & E MorristownMorris Morris township Convent commuter rail 1 M & E MorristownMorris Morristown town Morristown commuter rail 1 M & E MorristownMorris Mount Arlington borough Mount Arlington commuter rail 1 Montclair-Boonton, M & E MorristownMorris Mount Olive township Mount Olive commuter rail 1 Montclair-Boonton, M & E MorristownMorris Mountain Lakes borough Mountain Lakes commuter rail 1 Montclair-BoontonMorris Netcong borough Netcong commuter rail 1 Montclair-Boonton, M & E MorristownMorris Parsippany-Troy Hills township Mount Tabor commuter rail 1 M & E MorristownMorris Roxbury Township Lake Hopatcong commuter rail 1 Montclair-Boonton, M & E MorristownOcean Bay Head borough Bay Head commuter rail 1 North Jersey CoastOcean Lakewood township Lakewood Bus Terminal bus terminal 1 NJT busOcean Point Pleasant Beach borough Point Pleasant Beach commuter rail 1 North Jersey CoastOcean Toms River township Dover Twp. Park-Ride Bus Terminal bus terminal 1 NJT busPassaic Clifton city Clifton commuter rail 1 MainPassaic Clifton city Delawanna commuter rail 1 MainPassaic Hawthorne borough Hawthorne commuter rail 1 MainPassaic Little Falls township Little Falls commuter rail 1 Montclair-BoontonPassaic Little Falls township Montclair State U. commuter rail 1 Montclair-BoontonPassaic Passaic city Passaic commuter rail 1 MainPassaic Passaic city Passaic Bus Terminal bus terminal 1 NJT busPassaic Paterson city Broadway Terminal bus terminal 1 NJT busPassaic Paterson city Paterson commuter rail 1 MainPassaic Wayne township Mountain View commuter rail 1 Montclair-BoontonPassaic Wayne township Wayne Route 23 commuter rail 1 Montclair-BoontonSomerset Bernards township Basking Ridge commuter rail 1 M & E GladstoneSomerset Bernards township Lyons commuter rail 1 M & E GladstoneSomerset Bernardsville borough Bernardsville commuter rail 1 M & E GladstoneSomerset Bound Brook borough Bound Brook commuter rail 1 Raritan ValleySomerset Branchburg township North Branch commuter rail 1 Raritan ValleySomerset Bridgewater township Bridgewater commuter rail 1 Raritan ValleySomerset Far Hills borough Far Hills commuter rail 1 M & E GladstoneSomerset Peapack and Gladstone borough Gladstone commuter rail 1 M & E GladstoneSomerset Peapack and Gladstone borough Peapack commuter rail 1 M & E GladstoneSomerset Raritan borough Raritan commuter rail 1 Raritan ValleySomerset Somerville borough Somerville commuter rail 1 Raritan Valley
Targeting Transit 43
Appendix: List of Transit Stations in New Jersey by Host County and Municipality (243 stations total)

44 Appendix
Appendix: List of Transit Stations in New Jersey by Host County and Municipality
county host municipality station name modes served by: lines/routes/operators presently* served by
Union Elizabeth city Elizabeth commuter rail 1 Northeast Corridor, North Jersey CoastUnion Elizabeth city North Elizabeth commuter rail 1 Northeast Corridor, North Jersey CoastUnion Fanwood borough Fanwood commuter rail 1 Raritan ValleyUnion Garwood borough Garwood commuter rail 1 Raritan ValleyUnion Linden city Linden commuter rail 1 Northeast Corridor, North Jersey CoastUnion New Providence borough Murray Hill commuter rail 1 M & E GladstoneUnion New Providence borough New Providence commuter rail 1 M & E GladstoneUnion Plainfield city Netherwood commuter rail 1 Raritan ValleyUnion Plainfield city Plainfield commuter rail 1 Raritan ValleyUnion Rahway city Rahway commuter rail 1 Northeast Corridor, North Jersey CoastUnion Roselle Park borough Roselle Park commuter rail 1 Raritan ValleyUnion Summit city Summit commuter rail 1 M & E Morristown, M & E GladstoneUnion Union township Union commuter rail 1 Raritan ValleyUnion Westfield town Westfield commuter rail 1 Raritan ValleyWarren Hackettstown town Hackettstown commuter rail 1 Montclair-Boonton, M & E Morristown
*The lines and routes listed for each station are only those that presently serve the station. The list does not include lines that could hypothetically serve the station under present track configurations but currently do not.
For example, Secaucus Junction is not counted as being served by the Raritan Valley line, even though Raritan Valley trains, which presently terminate at Newark Penn, could hypothetically go on to stop at Secaucus Junction.
total # of modes
Union Berkeley Heights township Berkeley Heights commuter rail 1 M & E GladstoneUnion Cranford township Cranford commuter rail 1 Raritan Valley
Appendix: List of Transit Stations in New Jersey by Host County and Municipality (243 stations total)

Acknowledgements
The author would like to thank the following people for their assistance in providing data, reviewing drafts of the report, or otherwise helping to move this project ahead:
Eric Frantz and Chris D’Antonio, New Jersey Future interns Tom Marchwinksi, R.J. Palladino, Vivian Baker, and Chuck Latini at NJ Transit Juliette Michaelson at the Regional Plan Association Jeffrey Perlman and Scott Rowe at the North Jersey Transportation Planning Authority Rich Bickel, Karin Morris, and Jesse Buerk at the Delaware Valley Regional Planning Commission Janna Chernetz and Renata Silberblatt at the Tri-State Transportation Campaign Adam Gordon at the Fair Share Housing Center Diane Sterner at the Housing and Community Development Network of New Jersey
Thanks are also due to everyone who attended a demonstration of the transit station inventory and provided feedback on its functionality.
New Jersey Future would like to acknowledge the generosity of the funders who helped make this research project possible, especially the Ford Foundation, PNC Foundation, PSEG Foundation, Wells Fargo Founda-tion and William Penn Foundation.
About New Jersey Future
New Jersey Future is a nonprofit, nonpartisan organization that brings together concerned citizens and leaders to promote responsible land-use policies. The organization employs original research, analysis and advocacy to build coalitions and drive land-use policies that help revitalize cities and towns, protect natural lands and farms, provide more transportation choices beyond cars, expand access to safe and afford-able neighborhoods and fuel a prosperous economy.
About the Author
Tim Evans is responsible for the original research and data analysis that support New Jersey Future’s policy development. He regularly documents his research results in a variety of products, including full-length research reports and the organi-zation’s twice-monthly Future Facts electronic newsletter. He
also ensures that all of New Jersey Future’s products and media communications are quantitatively accurate and defensible. Tim frequently provides data and advice to colleague organizations, serving as an informal research consultant to the smart growth community at large. His analysis and commentary have been featured by a wide range of state and national media outlets. Tim holds a B.S. in mathematics from Ursinus College, an M.S. in statistics from the University of Virginia, and a master’s in city and regional planning (M.C.R.P.) from the Bloustein School of Planning and Public Policy at Rutgers University. Prior to joining New Jersey Future, Tim worked for six years as a mathematical statistician for the Bureau of the Census in Washington, D.C.