targeted uplc-ms metabolic analysis of human faeces ... · concentration in the metabolomics...
TRANSCRIPT
cancers
Article
Targeted UPLC-MS Metabolic Analysis of HumanFaeces Reveals Novel Low-Invasive CandidateMarkers for Colorectal Cancer
Joaquin Cubiella 1,†,* ID , Marc Clos-Garcia 2,3,† ID , Cristina Alonso 4, Ibon Martinez-Arranz 4,Miriam Perez-Cormenzana 4, Ziortza Barrenetxea 5, Jesus Berganza 5, Isabel Rodríguez-Llopis 5 ID ,Mauro D’Amato 6,7, Luis Bujanda 3,*, Marta Diaz-Ondina 1 and Juan M. Falcón-Pérez 2,7,8,* ID
1 Department of Gastroenterology, Complexo Hospitalario Universitario de Ourense, Instituto deInvestigación Biomédica Ourense-Vigo-Pontevedra, 32005 Ourense, Spain; [email protected]
2 Exosomes Laboratory, CIC bioGUNE, CIBERehd, Bizkaia Technology Park, Derio, 48160 Bizkaia, Spain;[email protected]
3 Department of Gastroenterology, Hospital Donostia/Instituto Biodonostia, Centro de InvestigaciónBiomédica en Red de Enfermedades Hepáticas y Digestivas (CIBERehd), Universidad del PaísVasco (UPV/EHU), 20014 San Sebastián, Spain
4 OWL Metabolomics, Bizkaia Technology Park, Derio, 48160 Bizkaia, Spain;[email protected] (C.A.); [email protected] (I.M.-A.);[email protected] (M.P.-C.)
5 GAIKER-IK4 Technology Centre, Ed. 202, 48170 Zamudio, Spain; [email protected] (Z.B.);[email protected] (J.B.); [email protected] (I.R.-L.)
6 Gastrointestinal Genetics Unit, Biodonostia HRI, 20014 San Sebastián, Spain; [email protected] IKERBASQUE, Basque Foundation for Science, 48011 Bilbao, Spain8 Metabolomics Platform, CIC bioGUNE, CIBERehd, Bizkaia Technology Park, Derio, 48160 Bizkaia, Spain* Correspondence: [email protected] (J.C.);
[email protected] (L.B.); [email protected] (J.M.F.-P.)† Joaquin Cubiella and Marc Clos-Garcia shared first authorship.
Received: 11 July 2018; Accepted: 28 August 2018; Published: 1 September 2018�����������������
Abstract: Low invasive tests with high sensitivity for colorectal cancer and advanced precancerouslesions will increase adherence rates, and improve clinical outcomes. We have performed anultra-performance liquid chromatography/time-of-flight mass spectrometry (UPLC-(TOF) MS)-basedmetabolomics study to identify faecal biomarkers for the detection of patients with advancedneoplasia. A cohort of 80 patients with advanced neoplasia (40 advanced adenomas and 40 colorectalcancers) and 49 healthy subjects were analysed in the study. We evaluated the faecal levels of 105metabolites including glycerolipids, glycerophospholipids, sterol lipids and sphingolipids. We found18 metabolites that were significantly altered in patients with advanced neoplasia compared tocontrols. The combinations of seven metabolites including ChoE(18:1), ChoE(18:2), ChoE(20:4),PE(16:0/18:1), SM(d18:1/23:0), SM(42:3) and TG(54:1), discriminated advanced neoplasia patientsfrom healthy controls. These seven metabolites were employed to construct a predictive model thatprovides an area under the curve (AUC) median value of 0.821. The inclusion of faecal haemoglobinconcentration in the metabolomics signature improved the predictive model to an AUC of 0.885.In silico gene expression analysis of tumour tissue supports our results and puts the differentiallyexpressed metabolites into biological context, showing that glycerolipids and sphingolipidsmetabolism and GPI-anchor biosynthesis pathways may play a role in tumour progression.
Keywords: colorectal cancer; metabolomics; faecal samples; biomarkers
Cancers 2018, 10, 300; doi:10.3390/cancers10090300 www.mdpi.com/journal/cancers
Cancers 2018, 10, 300 2 of 17
1. Introduction
Colorectal cancer (CRC) is the second leading cause of cancer death in developed countries [1].Although knowledge of the genetic- and diet-associated mechanisms involved in CRC establishmentand progression is rapidly increasing [2], still the best prognosis is obtained when malignancy isdetected early. CRC screening, which detects both precancerous polyps and CRC, can reduce bothcolorectal cancer incidence and mortality [3–7]. Through screening, the incidence of colorectal cancercan be reduced by 30% with a mortality reduction of 50% depending on the screening modality and theparticipation rates [7,8]. These data clearly support the strategy to have efficient and sensitive screeningmethods. Screening tests available include detecting haemoglobin or DNA mutations/alterations infeces [4,9], radiologic or endoscopic (flexible sigmoidoscopy, colonoscopy, and computed tomographiccolonography) methods [10]. Each test has its own advantages, has demonstrated to be cost-effective,and has associated limitations and risks [10]. Although colonoscopy is considered the most accuratetest for early detection and prevention of colorectal cancer [11], its applicability is limited due to thesecondary effects associated with it (mild and severe), the low adherence in average and familial-riskpopulations and the limited resources available [12,13].
On the other hand, most of CRC are still diagnosed in symptomatic patients, even when CRCscreening programs are established [14]. In this regard, symptoms and symptom-based predictionmodels have a limited accuracy for CRC detection in this population. CRC diagnostic biomarkers,such as faecal haemoglobin, can improve the diagnostic process either alone or within predictionmodels [15–17]. For all those reasons, the development of non-invasive methods to detect CRCeither in asymptomatic and symptomatic patients is an area of interest for patients, clinicians andhealthcare providers.
Metabolomics is the omics technology dedicated to the measurement of small molecules(<2000 Da) that are present in a biological system. Major advances and new development of analyticalinstruments, together with the implementation of bioinformatics tools for robust data analysisallows simultaneous measurement and analysis of a huge number of metabolites from a biologicalsystem [18–21]. In consequence, metabolomics has become one of the main technologies for biomarkeridentification and for unraveling pathophysiological mechanisms in many diseases, including cancer.The development of ultra-performance liquid chromatography (UPLC) has improved both resolutionand sensitivity of metabolomics analysis. It has also allowed the rapid separation of metabolites whencompared to conventional LC methods [22,23]. Notably, several metabolomics studies have beenperformed aiming to identify new CRC biomarkers, as reviewed by Zhang et al. [24]. For diagnosticspurpose, several studies exist, although the majority of them have been performed on serumsamples [25–33], tissue [34–36] and urine [37]. To our knowledge, only one study was found thatstudied metabolomics differences directly in human feces samples, like our project design, usingNMR-based metabolomics [38]. Metabolomics study of faeces may be more effective in detecting novelcolon cancer makers than other approaches because faeces are in close proximity to the colorectalmucosa and are a product of interactions between dietary components and the microbiota. This latteris affected by and seems to play an important role in the progression of colon cancer [39,40]. Existentliterature has identified several metabolites, some being consistently altered in CRC individuals andothers being increased in some studies and decreased in other ones [24]. These studies have allowedthe identification of several altered metabolic pathways, including carbohydrate and amino acidmetabolisms, and lipid-related metabolic pathways. Significantly, most of the studies found differencesin metabolites of the tricarboxilic acid (TCA) cycle. Also, importantly, alterations on short-chainfatty acids (SCFAs) levels were found for feces-metabolomics study, which clearly indicates a rolefor the CRC-specific microbiota composition [38]. Lipid metabolism is an important pathway ofcellular energy metabolism and its alteration has been related to CRC development and progression.Alterations on metabolic pathways for the eight distinct pathways of lipid metabolism, includingcorresponding genes and lipid-specific cell receptors, have been reviewed by Yan et al. 2016 [41].

Cancers 2018, 10, 300 3 of 17
In this study, we evaluate by UPLC-MS the levels of 105 metabolites in lyophilized faecesfrom a cohort of 129 samples including patients with advanced adenoma or colon carcinoma andhealthy individuals. After applying univariate analysis, we found significant changes between healthyindividuals and advanced neoplasia patients in 18 metabolites including sphingomyelins, ceramides,glycerophospholipis and cholesteryl esters. A combined analysis of ChoE(18:1), ChoE(18:2), ChoE(20:4),PE (16:0/18:1), SM(d18:1/23:0), SM(42:3) and TG(54:1) provides an AUC value of 0.821. This worksupports the usefulness of metabolomics to develop low invasive diagnostic tools for colon cancerpopulation screenings.
2. Results
For the study, we have analysed faecal samples collected from 49 healthy, 40 CRC patients and40 AD patients (see Materials and Methods for more details). On these samples, we have performed ametabolomics profiling using the UPLC-MS approach as described in Materials and Methods. There isno single method to analyse the entire set of metabolites of a biological sample, mainly due to thewide concentration range of the metabolites joined to their extensive chemical diversity. For this study,we have employed an UPLC-MS method (Supplementary Figure S1) capable of detecting consistentlythe 105 identified metabolites listed in Supplementary Table S1, that includes fatty acyls, glycerolipids,glycerophospholipids, sterol lipids and sphingolipids.
2.1. Multivariate Analysis
First, we analysed the metabolomic profiling of the 105 metabolites by unsupervised principalcomponent analysis (PCA). We did not find any clustering of samples according to their classificationas cases (AD and CRC) and controls (C), as seen on the score plot in Figure 1; neither, did if each group(AD, CRC and C) was compared separately each other (Supplementary Figure S2).
Cancers 2018, 10, x FOR PEER REVIEW 3 of 17
individuals. After applying univariate analysis, we found significant changes between healthy
individuals and advanced neoplasia patients in 18 metabolites including sphingomyelins, ceramides,
glycerophospholipis and cholesteryl esters. A combined analysis of ChoE(18:1), ChoE(18:2),
ChoE(20:4), PE (16:0/18:1), SM(d18:1/23:0), SM(42:3) and TG(54:1) provides an AUC value of 0.821.
This work supports the usefulness of metabolomics to develop low invasive diagnostic tools for colon
cancer population screenings.
2. Results
For the study, we have analysed faecal samples collected from 49 healthy, 40 CRC patients and
40 AD patients (see Materials and Methods for more details). On these samples, we have performed
a metabolomics profiling using the UPLC-MS approach as described in Materials and Methods. There
is no single method to analyse the entire set of metabolites of a biological sample, mainly due to the
wide concentration range of the metabolites joined to their extensive chemical diversity. For this
study, we have employed an UPLC-MS method (Supplementary Figure S1) capable of detecting
consistently the 105 identified metabolites listed in Supplementary Table S1, that includes fatty acyls,
glycerolipids, glycerophospholipids, sterol lipids and sphingolipids.
2.1. Multivariate Analysis
First, we analysed the metabolomic profiling of the 105 metabolites by unsupervised principal
component analysis (PCA). We did not find any clustering of samples according to their classification
as cases (AD and CRC) and controls (C), as seen on the score plot in Figure 1; neither, did if each
group (AD, CRC and C) was compared separately each other (Supplementary Figure S2).
Figure 1. PCA scores plot of healthy individuals and patients with advanced neoplasia. (t [1]: R2X =
0.26 and Q2 = 0.22, t [2]: R2X = 0.16 and Q2 = 0.18): CRC and AD patients (n = 80), filled circles; healthy
individuals (n = 49), open circles.
Figure 1. PCA scores plot of healthy individuals and patients with advanced neoplasia. (t[1]: R2X = 0.26and Q2 = 0.22, t[2]: R2X = 0.16 and Q2 = 0.18): CRC and AD patients (n = 80), filled circles; healthyindividuals (n = 49), open circles.

Cancers 2018, 10, 300 4 of 17
Neither the application of orthogonal (partial least squares) projections to latent structures (OPLS)or multivariate analysis was suitable for obtaining a separation between the groups of samples (data notshown). This lack of discrimination between groups through multivariate analysis highlights theexpected high heterogeneity that exists between individuals.
2.2. Univariate Analysis
As it is complementary to the multivariate analysis, we have applied a univariate approach thathas been shown to be an alternative for metabolomics data sets with elevated heterogeneity [26].The comparison of the 105 metabolites between cases (AD plus CRC) versus control (C) samples,showed significant (adjusted p-value < 0.05) difference of the fold change for 18 of them as canbe observed in the Volcano plot (Figure 2A). Differences were mostly seen in sphingolipid family(SM and Cer, but not CMH), but also included ChoE, PC, PE and TG metabolites. The most alteredmetabolite was Cer(42:3), and all metabolites were higher in the case group, except for two of them,Cer(d18:1/16:0) and TG(54:1), which were lower than the control group (Figure 2A). Other highlyaltered metabolites (log2 fold change < 1) were Cer(d18:1/24:1) + Cer(d18:2/24:0), PE(16:0/18:1),PE(16:0/18:2) and TG(54:1) (Figure 2A).
Cancers 2018, 10, x FOR PEER REVIEW 4 of 17
Neither the application of orthogonal (partial least squares) projections to latent structures
(OPLS) or multivariate analysis was suitable for obtaining a separation between the groups of
samples (data not shown). This lack of discrimination between groups through multivariate analysis
highlights the expected high heterogeneity that exists between individuals.
2.2. Univariate Analysis
As it is complementary to the multivariate analysis, we have applied a univariate approach that
has been shown to be an alternative for metabolomics data sets with elevated heterogeneity [26]. The
comparison of the 105 metabolites between cases (AD plus CRC) versus control (C) samples, showed
significant (adjusted p-value < 0.05) difference of the fold change for 18 of them as can be observed in
the Volcano plot (Figure 2A). Differences were mostly seen in sphingolipid family (SM and Cer, but
not CMH), but also included ChoE, PC, PE and TG metabolites. The most altered metabolite was
Cer(42:3), and all metabolites were higher in the case group, except for two of them, Cer(d18:1/16:0)
and TG(54:1), which were lower than the control group (Figure 2A). Other highly altered metabolites
(log2 fold change < 1) were Cer(d18:1/24:1) + Cer(d18:2/24:0), PE(16:0/18:1), PE(16:0/18:2) and TG(54:1)
(Figure 2A).
Figure 2. Volcano plot representation of metabolic changes in stools from control, CRC and AD
sample groups. [log10 (p-value) vs. log2 (fold-change)] for the comparison between healthy
individuals and patients with advanced neoplasia (CRC and AD). The shape and colour of the points
indicates metabolite family, while the size is determined by the absolute value of the log2 Fold Change
(A). Heatmap of metabolites altered in stools from control, CRC and AD sample groups (B).
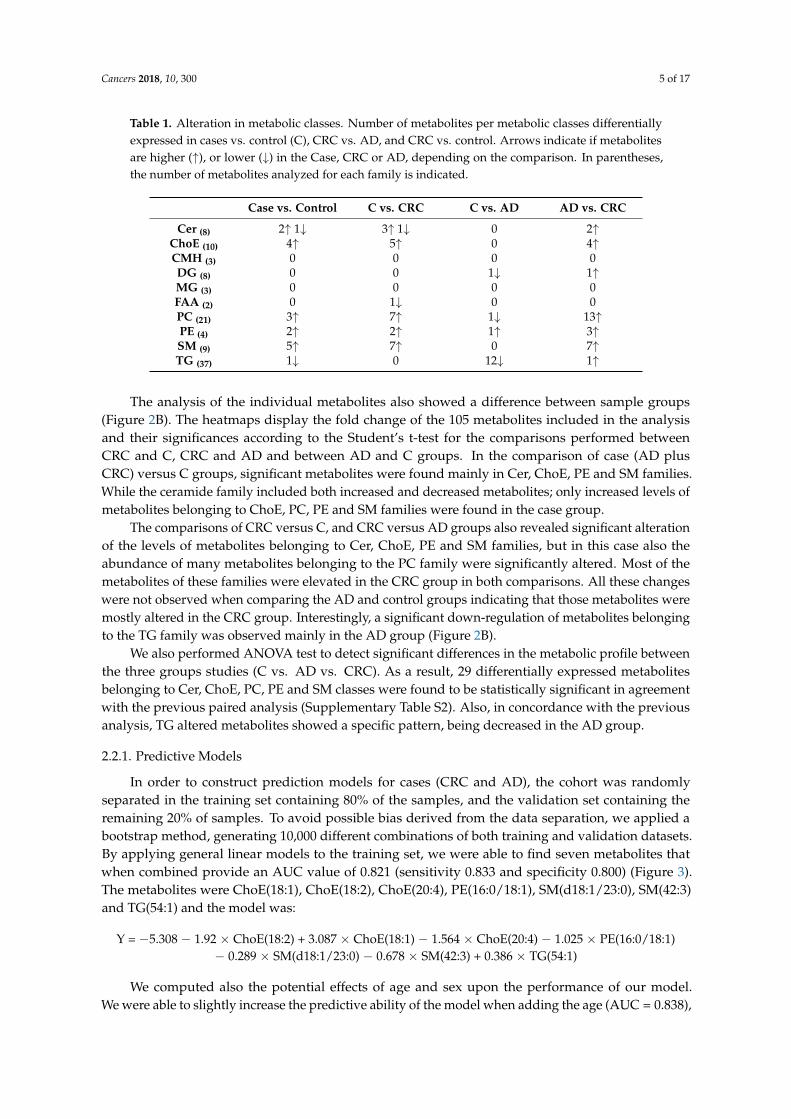
Paired comparisons of sample groups revealed significant differences for some metabolic classes
between CRC and AD, and also between CRC and C individuals (Table 1). Stool samples of patients
with CRC had higher levels than AD or C samples of PC and also ChoE and SM metabolite classes.
TG family showed the maximum differences when AD was compared to C samples, with alterations
in 12 metabolites of the family; it was lower in AD than C. Actually, most of the differences between
AD and C groups were found in this metabolite family, with only one metabolite altered for DG, PC
and PE families. CMH and MG families did not show any difference in any comparison.
Ceramides, ChoE, PC and SM metabolite families were consistently increased in cancer samples.
Only TG metabolites showed a specific trend for AD samples, being decreased with respect to the
control samples, but showing no differences when comparing C versus CRC samples. Only PE family
was consistently increased in both CRC and AD samples when compared to C group.
Figure 2. Volcano plot representation of metabolic changes in stools from control, CRC and AD samplegroups. [log10 (p-value) vs. log2 (fold-change)] for the comparison between healthy individualsand patients with advanced neoplasia (CRC and AD). The shape and colour of the points indicatesmetabolite family, while the size is determined by the absolute value of the log2 Fold Change (A).Heatmap of metabolites altered in stools from control, CRC and AD sample groups (B).
Paired comparisons of sample groups revealed significant differences for some metabolic classesbetween CRC and AD, and also between CRC and C individuals (Table 1). Stool samples of patientswith CRC had higher levels than AD or C samples of PC and also ChoE and SM metabolite classes.TG family showed the maximum differences when AD was compared to C samples, with alterations in12 metabolites of the family; it was lower in AD than C. Actually, most of the differences between ADand C groups were found in this metabolite family, with only one metabolite altered for DG, PC andPE families. CMH and MG families did not show any difference in any comparison.
Ceramides, ChoE, PC and SM metabolite families were consistently increased in cancer samples.Only TG metabolites showed a specific trend for AD samples, being decreased with respect to thecontrol samples, but showing no differences when comparing C versus CRC samples. Only PE familywas consistently increased in both CRC and AD samples when compared to C group.
Cancers 2018, 10, 300 5 of 17
Table 1. Alteration in metabolic classes. Number of metabolites per metabolic classes differentiallyexpressed in cases vs. control (C), CRC vs. AD, and CRC vs. control. Arrows indicate if metabolitesare higher (↑), or lower (↓) in the Case, CRC or AD, depending on the comparison. In parentheses,the number of metabolites analyzed for each family is indicated.
Case vs. Control C vs. CRC C vs. AD AD vs. CRC
Cer (8) 2↑ 1↓ 3↑ 1↓ 0 2↑ChoE (10) 4↑ 5↑ 0 4↑CMH (3) 0 0 0 0DG (8) 0 0 1↓ 1↑MG (3) 0 0 0 0FAA (2) 0 1↓ 0 0PC (21) 3↑ 7↑ 1↓ 13↑PE (4) 2↑ 2↑ 1↑ 3↑SM (9) 5↑ 7↑ 0 7↑TG (37) 1↓ 0 12↓ 1↑
The analysis of the individual metabolites also showed a difference between sample groups(Figure 2B). The heatmaps display the fold change of the 105 metabolites included in the analysisand their significances according to the Student’s t-test for the comparisons performed betweenCRC and C, CRC and AD and between AD and C groups. In the comparison of case (AD plusCRC) versus C groups, significant metabolites were found mainly in Cer, ChoE, PE and SM families.While the ceramide family included both increased and decreased metabolites; only increased levels ofmetabolites belonging to ChoE, PC, PE and SM families were found in the case group.
The comparisons of CRC versus C, and CRC versus AD groups also revealed significant alterationof the levels of metabolites belonging to Cer, ChoE, PE and SM families, but in this case also theabundance of many metabolites belonging to the PC family were significantly altered. Most of themetabolites of these families were elevated in the CRC group in both comparisons. All these changeswere not observed when comparing the AD and control groups indicating that those metabolites weremostly altered in the CRC group. Interestingly, a significant down-regulation of metabolites belongingto the TG family was observed mainly in the AD group (Figure 2B).
We also performed ANOVA test to detect significant differences in the metabolic profile betweenthe three groups studies (C vs. AD vs. CRC). As a result, 29 differentially expressed metabolitesbelonging to Cer, ChoE, PC, PE and SM classes were found to be statistically significant in agreementwith the previous paired analysis (Supplementary Table S2). Also, in concordance with the previousanalysis, TG altered metabolites showed a specific pattern, being decreased in the AD group.
2.2.1. Predictive Models
In order to construct prediction models for cases (CRC and AD), the cohort was randomlyseparated in the training set containing 80% of the samples, and the validation set containing theremaining 20% of samples. To avoid possible bias derived from the data separation, we applied abootstrap method, generating 10,000 different combinations of both training and validation datasets.By applying general linear models to the training set, we were able to find seven metabolites thatwhen combined provide an AUC value of 0.821 (sensitivity 0.833 and specificity 0.800) (Figure 3).The metabolites were ChoE(18:1), ChoE(18:2), ChoE(20:4), PE(16:0/18:1), SM(d18:1/23:0), SM(42:3)and TG(54:1) and the model was:
Y = −5.308 − 1.92 × ChoE(18:2) + 3.087 × ChoE(18:1) − 1.564 × ChoE(20:4) − 1.025 × PE(16:0/18:1)− 0.289 × SM(d18:1/23:0) − 0.678 × SM(42:3) + 0.386 × TG(54:1)
We computed also the potential effects of age and sex upon the performance of our model.We were able to slightly increase the predictive ability of the model when adding the age (AUC = 0.838),

Cancers 2018, 10, 300 6 of 17
sex (AUC = 0.837) and the combination of both (AUC = 0.848) features to the model (Figure 3C).When combining our metabolite model with faecal occult blood (FOB) parameter we were able toincrease the AUC value up to 0.885.
Cancers 2018, 10, x FOR PEER REVIEW 6 of 17
combining our metabolite model with faecal occult blood (FOB) parameter we were able to increase
the AUC value up to 0.885.
Figure 3. ROC curve of the predictive model constructed with the seven specified metabolites,
including the value of the median AUC (A). Distribution of the model’s features (AUC, sensitivity,
specificity and accuracy) obtained from the 10,000 iterations done (B). Distribution of AUC
measurements for the combination of our model with age, sex and the age + sex combination (C).
2.2.2. Correlation of the Metabolites with Clinical Parameters
A number of clinical parameters were available for the 129 samples analysed in this study
including age, gender, FOB test (cut-off 100 ng/mL), carcinoembryonic antigen (CEA) test and
COLONPREDICT index. COLONPREDICT is a CRC prediction model that takes into account
demographic, symptoms, laboratory and anorectal examination results applicable both in primary
and secondary healthcare units [16]. Thus, we evaluated if any of the 105 metabolites analysed in
faecal samples correlated with any of the clinical parameters (Supplementary Table S3). There was
not strong correlation with age, neither with CEA nor COLONPREDICT or gender, and there were
only minor correlations with some clinical data as follows. Several TG metabolites correlated
inversely with age data. Also, some metabolites belonging to the DG family correlate with age data,
in the same direction as the TG metabolites. COLONPREDICT test showed the highest degree of
correlation with metabolites of different families including CMH, PC, ChoE, PE, and SM. Although
only slightly, ChoE(18:2) correlated directly with the FOB parameter (Supplementary Table S3).
We also studied how clinical parameters classified samples between the three groups (C, CRC
and AD) and between two groups (C and Case) (Supplementary Figure S3). Both ANOVA test for
the classification into three groups (Table 2) and Tukey’s HSD test for the classification into two
groups (Table 2) showed that COLONPREDICT was the best index to discriminate between samples,
followed by FOB. We could see that gender had nearly no differences upon the discrimination
between groups, compared to all other clinical parameters. It is important to note that no clinical
parameter was able to significantly differentiate between C and AD sample groups.
Figure 3. ROC curve of the predictive model constructed with the seven specified metabolites, includingthe value of the median AUC (A). Distribution of the model’s features (AUC, sensitivity, specificityand accuracy) obtained from the 10,000 iterations done (B). Distribution of AUC measurements for thecombination of our model with age, sex and the age + sex combination (C).
2.2.2. Correlation of the Metabolites with Clinical Parameters
A number of clinical parameters were available for the 129 samples analysed in this studyincluding age, gender, FOB test (cut-off 100 ng/mL), carcinoembryonic antigen (CEA) test andCOLONPREDICT index. COLONPREDICT is a CRC prediction model that takes into accountdemographic, symptoms, laboratory and anorectal examination results applicable both in primaryand secondary healthcare units [16]. Thus, we evaluated if any of the 105 metabolites analysed infaecal samples correlated with any of the clinical parameters (Supplementary Table S3). There wasnot strong correlation with age, neither with CEA nor COLONPREDICT or gender, and there wereonly minor correlations with some clinical data as follows. Several TG metabolites correlated inverselywith age data. Also, some metabolites belonging to the DG family correlate with age data, in thesame direction as the TG metabolites. COLONPREDICT test showed the highest degree of correlationwith metabolites of different families including CMH, PC, ChoE, PE, and SM. Although only slightly,ChoE(18:2) correlated directly with the FOB parameter (Supplementary Table S3).
We also studied how clinical parameters classified samples between the three groups (C, CRCand AD) and between two groups (C and Case) (Supplementary Figure S3). Both ANOVA test for theclassification into three groups (Table 2) and Tukey’s HSD test for the classification into two groups(Table 2) showed that COLONPREDICT was the best index to discriminate between samples, followedby FOB. We could see that gender had nearly no differences upon the discrimination between groups,compared to all other clinical parameters. It is important to note that no clinical parameter was able tosignificantly differentiate between C and AD sample groups.

Cancers 2018, 10, 300 7 of 17
Table 2. Differences between sample classification of several clinical parameters, either for the groupscomparison (C, AD and CRC) and for the pairwise comparison (Control vs. Case). ANOVA test hasbeen used for the study of differences between the three groups classification (C, AD and CRC) andTukey’s HSD test was used to analyse pairwise classifications (C vs. AD, C vs. CRC and AD vs. CRC).Tukey’s HSD column depicts those pairwise combinations (of the three tested combinations) thatshowed to be significantly different. Avg. stands for average.
C, AD and CRC AvgC AvgAD AvgCRC p-Value Tukey’s HSD
Gender 35.4% men 56.4% men 60% men 0.042 NAAge 62.52 68.64 73.50 0.0003 CRC vs. C
FOB * 0 49 873 1.6 × 10⁻⁹ CRC vs. CCRC vs. AD
CEA 1.90 1.72 14.85 0.00546 CRC vs. CCRC vs. AD
COLONPREDICT 0.048 0.104 0.470 <2 × 10⁻¹⁶ CRC vs. CCRC vs. AD
Control vs. Case AvgCONTROL AvgCASE p-Value
Gender 35.4% men 58.3% men 0.013Age 62.52 71.10 0.00083
FOB * 0 336 7.09 × 10⁻⁸
CEA 1.900 8.367 0.0036COLONPREDICT 0.0477 0.289 1.231 × 10⁻¹⁰
* For FOB index, median values are given instead of mean, due to the non-normal distribution of the measurements.
2.2.3. Gene Expression Analysis of Enzymes Involved in the Metabolism of Altered Metabolites
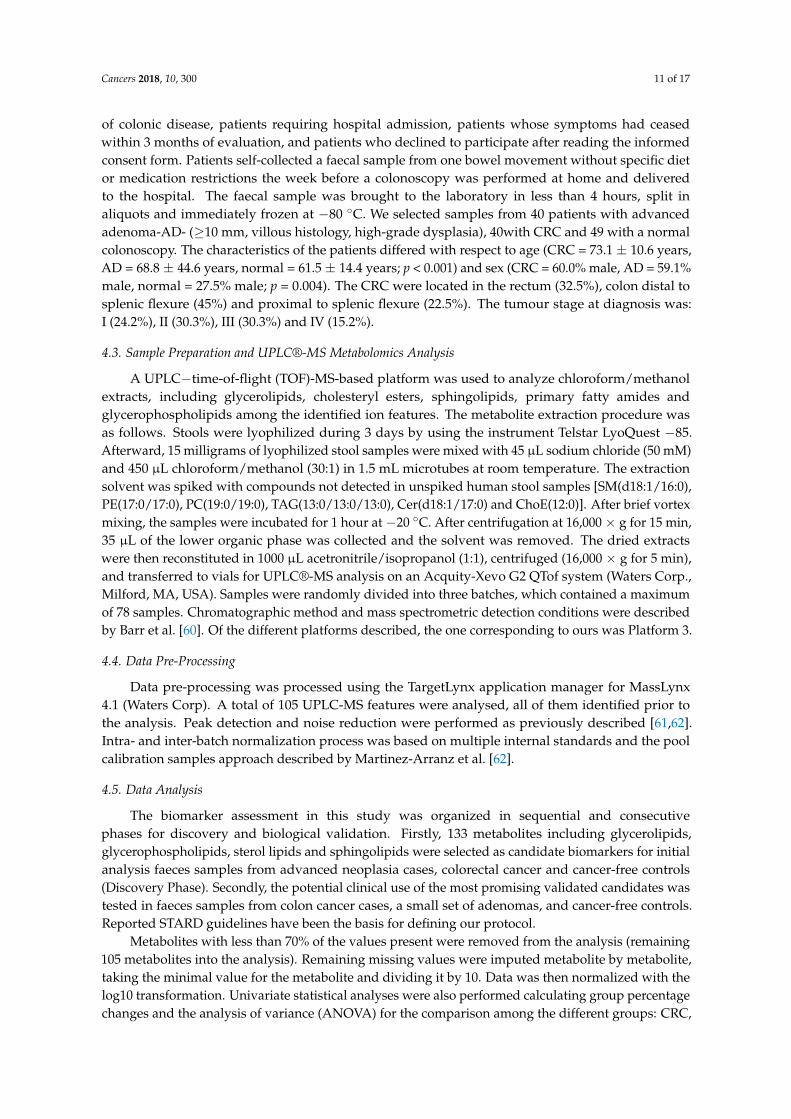
Metabolites that were differentially expressed between case and control samples (Figure 2A),and with a KEGG or HMDB code already defined, were employed to identify possible metabolicpathways altered in colorectal cancer. By using the differentially expressed metabolites, we couldin-silico identify 211 gene-encoding proteins that mainly clustered in three different metabolicpathways (Figure 4A). The identified pathways were glycerophospholipids metabolism, sphingolipidsmetabolism and the glycosylphosphatidylinositol (GPI)-anchor biosynthesis pathway suggestingthat these pathways could be altered in colorectal cancer (Supplementary Figure S4). We analysedthe expression levels of these gene-encoding proteins in the available gene-expression dataset ofbiopsies of colorectal cancer and normal mucosae of the colon [42]. We have observed that 15of them showed a significantly different fold change between control and cancer (case) samples(Figure 4B). We have also observed a downregulation of CERS4, SMPD1 and SMPD3 (Figure 4B),which are responsible for the transformation of sphingosines and sphingomyelins to ceramides.We also observed downregulation of genes that encoded enzymes that catalyse the degradation ofphosphocholine into choline metabolite, mainly from the phospholipase D (PLD) family: PLB1, PLD1,PNPLA7, PLA2G12B, PLA2G4C (Figure 4B). Furthermore, there was a significant downregulation ofthe genes PIGK and PIGZ, which encode enzymes involved in GPI-anchor biosynthesis. In addition,an upregulation of the genes LPCAT1 and LCAT (Figure 4B) that encode enzymes involved in thesynthesis of phosphatidylcholine and cholesteryl esters, respectively, was also observed. Together, allthese alterations on genes involved in lipid metabolism of the tumoral tissue support the lipid changesdetected in the faecal samples.

Cancers 2018, 10, 300 8 of 17Cancers 2018, 10, x FOR PEER REVIEW 8 of 17
Figure 4. Gene networks of enzymes related with metabolism of stool CRC-altered lipids. Three major
pathways could be observed: Sphingolipid and glycerophospholipid metabolisms, and GPI-anchor
biosynthesis (A). Gene expression in silico analysis of CRC tumoral tissue. The expression of gene-
Figure 4. Gene networks of enzymes related with metabolism of stool CRC-altered lipids. Three major

Cancers 2018, 10, 300 9 of 17
pathways could be observed: Sphingolipid and glycerophospholipid metabolisms, and GPI-anchorbiosynthesis (A). Gene expression in silico analysis of CRC tumoral tissue. The expression ofgene-encoding enzymes involved in the metabolism of stool-altered lipids was analysed in publiclyavailable GEO dataset GSE37364 that compared tumoral versus healthy tissue of the same individual.All displayed genes were highly significant (p-value < 0.001) except PLPP1 (p-value = 0.05) and PIGK(p-value = 0.02) (B).
3. Discussion
CRC screening with faecal occult blood (FOB) test has demonstrated efficacy in randomizedtrials. Nonetheless, the low sensitivity for advanced neoplasia of the test suggests the need formore accurate alternative diagnostic tests. In the present study, we have performed an UPLC-basedtargeted metabolomics analysis of stool to detect candidate endogenous metabolites suitable for theassessment of colon cancer using minimally invasive techniques. Metabolomic study of faeces can bemore effective, because faeces are in close proximity to the colorectal mucosa. To date, metabolomicsanalyses of faecal samples have mostly been restricted to experimental studies in animal and smallcross-sectional studies in humans [42–52]. While GC/MS-based metabolic profiling of faecal water hasbeen reported [53–55], there exists only limited studies on the profiling and identification of metaboliteswithin the complete faecal material; notably, lyophilized human faeces where its metabotype wasconfirmed to be more comprehensive than faecal water [47]. Previously, Ponnusamy et al. [56]profiled whole faeces from irritable bowel syndrome using GC/MS and identified several metabolitesas candidate biomarkers for the disease. In the current work, a semi-quantitative analysis of 105metabolites reveals significant differences in the faecal composition of cancer samples in the followinglipids: PC(16:0/16:0), PC(32:1), PC(O-16:0/16:0), PE(16:0/18:1), PE(16:0/18:2), SM(d18:1/16:0),SM(d18:1/23:0), SM(d18:2/24:1) + SM(d18:1/24:0), SM(42:1), Cer(d18:1/16:0), Cer(d18:1/24:1) +Cer(d18:2/24:0), Cer(42:1), SM(42:3), ChoE(16:0), ChoE(18:1), ChoE(18:2), ChoE(20:4), TG(54:1). Theselipid alterations detected in stools were supported by the gene expression profile observed in tumoraltissues showing deregulation of enzymes involved in glycerophospholipids and the glycosphingolipidsmetabolisms (Figure 4B). Some of the genes were of special interest as they serve as union nexuses ofdifferent metabolic pathways. Thus, PLPP1 and PLPP3 genes encoded lipid phosphate phosphatases(LPPs) with broad substrate specificity that dephosphorylate lipid substrates including phosphatidicacid, lysophosphatidic acid, ceramide 1-phosphate, sphingosine 1-phosphate, and diacylglycerolpyrophosphate [57]. One of their enzymatic reactions is the conversion of phosphatidic acid todiacylglycerol which is a central lipid for glycerophospholipids, triacylglycerols and sphingolipidmetabolisms. In consequence, they modulate different signalling pathways and generate buildingblocks for lipid metabolism-regulating physiological and pathological processes including vascularfunction and tumor progression [58]. These also indicate that the altered metabolism of the tumourcould be detected in stools, and consequently be detected in a non-invasive manner.
In our study, the most significant lipids altered in stool were cholesteryl esters, particularlyChoE(18:2) and ChoE(20:4) that were increased in CRC samples. This was in agreement with the factthat acetate—a short chain fatty acid—which is the precursor molecule for endogenous cholesterolproduction, has been reported to be elevated in CRC [59]. In addition, our in silico analysis of the geneexpression profile of tumoral tissue reported by Valcz et al. [42] shows increased tumoral levels of thegene encoding the enzyme phosphatidylcholine-sterol acyltransferase responsible for the cholesterylester synthesis. Together, the data suggest that the levels of cholesteryl esters in stools can be asuitable non-invasive measurement to detect and follow up colorectal cancer. Based on the cholesterylesters ChoE(18:1), ChoE(18:2) and ChoE(20:4), and complemented by PE(16:0/18:1), SM(d18:1/23:0),SM(42:3) and TG(54:1), we have built a robust stool metabolomic signature with an AUC value of0.821 (sensitivity 0.833 and specificity 0.800). In our set of samples, the AUC of the FOB was 0.744,showing that our model of 7-metabolites performed better than the FOB in the detection of CCR.

Cancers 2018, 10, 300 10 of 17
Interestingly, the combination of FOB with our 7-metabolites of our metabolomics model increases thediscriminating ability as judged by the AUC value that passed from 0.821 to 0.885.
It is important to highlight that one of the strengths of our study includes careful processing andpreservation of the faecal specimens, and our quantification of within-subject intraclass correlationcoefficient (ICC), from which we could estimate statistical power with our cutting-edge faecalmetabolomics platform. Our platform has high sensitivity and technical reproducibility, but it haslimited ability to detect some volatile and larger molecules.
Our study’s major limitations are its small size and cross-sectional, hospital-based case–controldesign. It provided no assessment of temporality and could only detect strong associations with CRC.Also, the fact that this is a targeted metabolomics obviously biases the results towards lipid species,which is also an important limitation. As we mentioned in the introduction section, lipid alterationshave been previously associated with CRC development and progression [41]. We considered,therefore, that our panel of metabolites would be sufficient to find potential CRC biomarkers. Also,keeping in mind the diagnostics aim of this study, we decided to use targeted metabolomics becauseit’s cheaper than an untargeted one, making it a more affordable option. Targeted metabolomicsallows an easier interpretation of results and, therefore, an easier translation to clinical practice, whichwe also considered to be an important point for the diagnostics purpose. As no restriction on dietwas provided to the participants in the study, another limitation is the lack of control for potentialdiet-confounding factors. Nevertheless, we believe this potential diet’s effects to be minimal, as allparticipants came from two Spanish regions that share the same dietary patterns. We did not specificallycontrol for age, sex, tumour position and staging for this study, which constitutes another importantlimitation. The decision of not to control for those factors was done taking into account the samplesize, not big enough to generate sufficiently big subgroups to obtain statistically robust data. In orderto minimize those variables effects, we incorporated the 10,000 iterations through random subsettingof the population for the modelization step, thus generating 10,000 different populations, covering ahuge range of different composition trains and test subpopulations that could reduce the potential biastowards some of the mentioned factors. Another strength of our study is the comparison against theFOB test and other clinical parameters. For every one of these comparisons, our model composed bythe 7-metabolites performed better than the clinical parameters alone. Also, the integration of geneexpression data in the study supports the identification of differentially expressed metabolites andputs them into context, providing some insights on how and why the levels are different betweenhealthy controls and cancer patients.
4. Materials and Methods
4.1. Chemicals
HPLC-MS grade solvents were purchase from Sigma Aldrich (St. Louis, MO, USA). Referencemetabolite standard compounds were obtained from Sigma Aldrich, Larodan Fine Chemicals (Malmö,Sweden) and Avanti Polar Lipids (Alabaster, AL, USA).
4.2. Clinical Samples and Study Population
The samples were collected during COLONPREDICT study, a multicentre, cross-sectional, blindedstudy of diagnostic tests aimed to create and validate a CRC prediction index in symptomatic patientsbased on available biomarkers, clinical and demographical data [16]. The study was approved bythe Clinical Research Ethics Committee of Galicia (Code 2011/038). As the samples were collectedfrom the COLONPREDICT study, the population selection characteristics were the same of thatstudy. The cohort consisted of consecutive patients with gastrointestinal symptoms referred forcolonoscopy from primary and secondary health care to Complexo Hospitalario Universitario deOurense, Spain. Exclusion criteria for the COLONPREDICT study were: age under 18, pregnancy,asymptomatic individuals undergoing colonoscopy for CRC screening, patients with previous history
Cancers 2018, 10, 300 11 of 17
of colonic disease, patients requiring hospital admission, patients whose symptoms had ceasedwithin 3 months of evaluation, and patients who declined to participate after reading the informedconsent form. Patients self-collected a faecal sample from one bowel movement without specific dietor medication restrictions the week before a colonoscopy was performed at home and deliveredto the hospital. The faecal sample was brought to the laboratory in less than 4 hours, split inaliquots and immediately frozen at −80 ◦C. We selected samples from 40 patients with advancedadenoma-AD- (≥10 mm, villous histology, high-grade dysplasia), 40with CRC and 49 with a normalcolonoscopy. The characteristics of the patients differed with respect to age (CRC = 73.1 ± 10.6 years,AD = 68.8 ± 44.6 years, normal = 61.5 ± 14.4 years; p < 0.001) and sex (CRC = 60.0% male, AD = 59.1%male, normal = 27.5% male; p = 0.004). The CRC were located in the rectum (32.5%), colon distal tosplenic flexure (45%) and proximal to splenic flexure (22.5%). The tumour stage at diagnosis was:I (24.2%), II (30.3%), III (30.3%) and IV (15.2%).
4.3. Sample Preparation and UPLC®-MS Metabolomics Analysis
A UPLC−time-of-flight (TOF)-MS-based platform was used to analyze chloroform/methanolextracts, including glycerolipids, cholesteryl esters, sphingolipids, primary fatty amides andglycerophospholipids among the identified ion features. The metabolite extraction procedure wasas follows. Stools were lyophilized during 3 days by using the instrument Telstar LyoQuest −85.Afterward, 15 milligrams of lyophilized stool samples were mixed with 45 µL sodium chloride (50 mM)and 450 µL chloroform/methanol (30:1) in 1.5 mL microtubes at room temperature. The extractionsolvent was spiked with compounds not detected in unspiked human stool samples [SM(d18:1/16:0),PE(17:0/17:0), PC(19:0/19:0), TAG(13:0/13:0/13:0), Cer(d18:1/17:0) and ChoE(12:0)]. After brief vortexmixing, the samples were incubated for 1 hour at −20 ◦C. After centrifugation at 16,000 × g for 15 min,35 µL of the lower organic phase was collected and the solvent was removed. The dried extractswere then reconstituted in 1000 µL acetronitrile/isopropanol (1:1), centrifuged (16,000 × g for 5 min),and transferred to vials for UPLC®-MS analysis on an Acquity-Xevo G2 QTof system (Waters Corp.,Milford, MA, USA). Samples were randomly divided into three batches, which contained a maximumof 78 samples. Chromatographic method and mass spectrometric detection conditions were describedby Barr et al. [60]. Of the different platforms described, the one corresponding to ours was Platform 3.
4.4. Data Pre-Processing
Data pre-processing was processed using the TargetLynx application manager for MassLynx4.1 (Waters Corp). A total of 105 UPLC-MS features were analysed, all of them identified prior tothe analysis. Peak detection and noise reduction were performed as previously described [61,62].Intra- and inter-batch normalization process was based on multiple internal standards and the poolcalibration samples approach described by Martinez-Arranz et al. [62].
4.5. Data Analysis
The biomarker assessment in this study was organized in sequential and consecutivephases for discovery and biological validation. Firstly, 133 metabolites including glycerolipids,glycerophospholipids, sterol lipids and sphingolipids were selected as candidate biomarkers for initialanalysis faeces samples from advanced neoplasia cases, colorectal cancer and cancer-free controls(Discovery Phase). Secondly, the potential clinical use of the most promising validated candidates wastested in faeces samples from colon cancer cases, a small set of adenomas, and cancer-free controls.Reported STARD guidelines have been the basis for defining our protocol.
Metabolites with less than 70% of the values present were removed from the analysis (remaining105 metabolites into the analysis). Remaining missing values were imputed metabolite by metabolite,taking the minimal value for the metabolite and dividing it by 10. Data was then normalized with thelog10 transformation. Univariate statistical analyses were also performed calculating group percentagechanges and the analysis of variance (ANOVA) for the comparison among the different groups: CRC,

Cancers 2018, 10, 300 12 of 17
AD and control (C). Student’s t-test p-values were calculated for the comparison between cases (ADand CRC) and C groups, as well as for the comparisons CRC and C, CRC and AD and between AD andC groups. Multivariate analyses were also performed, including both Principal Component Analysis(PCA) and Partial Least Squares Discriminant Analysis one (PLS-DA). ANOVA tests and Tukey’s HSDtests were also calculated for several clinical parameters (FOB, sex, age, CEA and COLONPREDICT test)to determine its effectiveness to classify our samples into categories (CRC, AD and C or Case-Control).All p-values were adjusted with Bonferroni methodology unless otherwise stated.
A logistic regression (LR) was performed to identify a predictive signature capable ofdistinguishing between cases and control groups. LR is a commonly used technique for dataclassification. We first analysed the correlations between metabolites, establishing a cut-off at ρ
0.75. For each pair of correlated metabolites, we removed the one that separated the worst out ofthe two groups. A forward stepwise method was selected as variable selection approach, where theanalysis started with an empty model and variables were added one at a time as long as these additionsare worthy, by measuring the Area Under the Curve (AUC) value. This process finished when no morevariables could be added. All samples were randomly divided into estimation (80% of all subjects;n = 101) and validation (20% of all subjects; n = 26) groups, both cohorts having an equal proportionalrepresentation of individuals belonging to cases and control groups. Ten-thousand iterations of bothsubsetting into estimation and validation groups and model constructing were generated, to avoidpopulation-based biases. Receiver operating characteristic (ROC) curve analysis was used to assess itsdiscriminatory power. Overall diagnostic accuracy for a given two-class comparison was given bythe area under the ROC curve (AUC) with its associated standard error. Sensitivity, specificity andaccuracy values were calculated.
All calculations were performed using statistical software package R v.3.1.1 (R DevelopmentCore Team, 2011; http://cran.r-project.org) with caret, caTools and receiver operating characteristic R(ROCR) packages to produce ROC curves and AUC estimate; MASS package was used to generatethe LR. Additionally, SIMCA-P+ 12.0.1 (Umetrics AB, Umeå, Sweden) was used for PCA and PLS-DAmultivariate data analysis.
Retrieval of genes and enzymes related with differentially expressed metabolites found inthe study was done with custom Python scripts, which takes advantage of the published Pythonpackages Biopython [63] and bioservices [64], which were used to access both HMDB and KEGGdatabases. These custom scripts retrieve information on the metabolite entries on both HMDBand KEGG databases regarding the enzymes involved in the metabolism of cited metabolites, asin which pathways are they present. We identified gene-encoding proteins involved in the metabolismof the seven metabolites of the predictive model, and we uploaded those genes to the STRINGdatabase [65], in order to identify the interaction between them, any potential clusterization andpossible affected metabolic pathways. Genetic expression was obtained from publicly available GEOdatabaset GSE37364 [42]. The datasets were uploaded to R and the expression of selected genes wasplotted into boxplots. Mapping of both metabolites and genes into metabolic pathways was done withpathview package [66] and custom R scripts.
5. Conclusions
This study highlights the power of UPLC-MS-based metabolomics approach in the discovery ofnovel non-invasive markers for colorectal cancer. With this study, we identified alterations in twomain metabolic pathways, the glycerophospholipids and glycosphingolipids metabolisms. We found18 metabolites differentially expressed between case samples (CRC + AD) and healthy controls, beingmainly increased in case ones. We also showed how a discrimination model based only on metabolitespecies was able to differentiate between case (CRC+AD) samples and healthy ones and is better thanthose used nowadays, based in several clinical parameters like FOB, CEA, etc. The model generatedincluded these metabolites: ChoE(18:1), ChoE(18:2), ChoE(20:4), PE (16:0/18:1), SM(d18:1/23:0),SM(42:3) and TG(54:1). Finally, we showed how the integration of different omics technologies

Cancers 2018, 10, 300 13 of 17
might be useful for supporting findings of one of them and to gain insights on how to explain theresults obtained.
Supplementary Materials: The following are available online at http://www.mdpi.com/2072-6694/10/9/300/s1,Supplementary Figure S1, Workflow of the UPLC-MS-based targeted metabolomic profiling. SupplementaryFigure S2, Multivariate analysis of paired group. (A) CRC vs. AD: R2X = 0.29 and Q2 = 0.24 t[2]: R2X = 0.19 andQ2 = 0.22). Black CRC, grey AD. (B) CRC vs. control: R2X = 0.30 and Q2 = 0.25, t[2]: R2X = 0.19 and Q2 = 0.24).Black CRC, white healthy. (C) AD vs. control: R2X = 0.28 and Q2 = 0.24, t[2]: R2X = 0.15 and Q2 = 0.15. Grey AD,white healthy. Supplementary Figure S3, Boxplot representation of the clinical parameters distribution on thedistinct groups of samples (C, AD and CRC). Supplementary Figure S4, Mapping of altered genes and metabolitesinto the three metabolic pathways identified: sphingolipid metabolism (A), glycerophospholipid metabolism (B)and glycosylphosphatidylinositol (GPI)-anchor biosynthesis (C). Genes detected are coloured in a range green-red,depending on the Fold Change and metabolites in a range blue-yellow. Supplementary Table S1, List of the 105metabolites analysed in the study. Supplementary Table S2, Metabolites differentially expressed between control,AD and CRC groups (ANOVA test). Supplementary Table S3, Clinical correlations between metabolites includedin the study and the following parameters: FOB, Sex, Age, COLONPREDICT and CEA. Supplementary Table S4,Number of missing values obtained for each metabolite.
Author Contributions: Conceptualization, J.M.F.-P., J.C., L.B. and M.C.G.; Methodology, M.C.G.; Software, M.C.G.and I.M.-A.; Validation, M.C.G., C.A., I.M.-A. and J.M.F.-P.; Formal Analysis, M.C.G.; Investigation, C.A., I.M.-A.,M.P.-C., Z.B., J.B., I.R.-L., M.D., M.D.-O.; Resources, J.M.F.-P., C.A.; Data Curation, M.C.G.; Writing-OriginalDraft Preparation, M.C.G., J.M.F.-P.; Writing-Review & Editing, J.M.F.-P., M.C.G., J.C., L.B.; Visualization, M.C.G.;Supervision, J.M.F.-P.; Project Administration, J.M.F.-P., L.B., J.C.; Funding Acquisition, J.M.F.-P., L.B., J.C.
Funding: Centro de Investigación Biomédica en Red en el Área temática de Enfermedades Hepáticas y Digestivas(CIBERehd) is funded by the Institute of Health Carlos III. This work has been supported by Instituto deSalud Carlos III (PI12/01604 to JMF-P) and BG2016-INVESTIGACION COLABORATIVA EN MEDICINA DEPRECISION Y BIOMARCADORES (Ref. KK-2016/00026) funded by Basque Government. All of them co-financedby ERDF (FEDER) Funds from the European Commission, “A way of making Europe”.
Conflicts of Interest: The authors declare no conflict of interest. The funders had no role in the design of thestudy; in the collection, analyses, or interpretation of data; in the writing of the manuscript, and in the decision topublish the results.
Abbreviations
AUC Area Under the CurveCEA Carcinoembryonic AntigenCer CeramidesChoE Cholesteryl estersCMH MonohexosylceramidesDAG DiacylglyceridesDAPC DiacylglycerophosphocholinesFAA Fatty acid amides (Primary Fatty Amides)FOB Faecal Occult BloodMAG MonoacylglyceridesMEMAPC 1-ether, 2-acylglycerophosphocholinesPC PhosphatidylcholinesPCA Principal Component AnalysisPE PhosphatidylethanolaminesPI PhosphatidylinositolsPLS-DA Partial Least Square Discriminant AnalysisSM SphingomyelinsTAG TriacylglyceridesUPLC®-MS Ultra performance liquid chromatography-mass spectrometry

Cancers 2018, 10, 300 14 of 17
References
1. Ferlay, J.; Soerjomataram, I.; Dikshit, R.; Eser, S.; Mathers, C.; Rebelo, M.; Parkin, D.M.; Forman, D.; Bray, F.Cancer incidence and mortality worldwide: Sources, methods and major patterns in GLOBOCAN 2012.Int. J. Cancer 2015, 136, E359–E386. [CrossRef] [PubMed]
2. Vogelstein, B.; Papadopoulos, N.; Velculescu, V.E.; Zhou, S.; Diaz, L.A., Jr.; Kinzler, K.W. Cancer GenomeLandscapes. Science 2013, 339, 1546–1558. [CrossRef] [PubMed]
3. Zauber, A.G.; Winawer, S.J.; O’Brien, M.J.; Lansdrop-Vogelaar, I.; van Ballegooijen, M.; Hankey, B.F.; Shi, W.;Bond, J.H.; Schapiro, M.; Panish, J.F.; et al. Colonoscopic Polypectomy and Long-Term Prevention ofColorectal-Cancer Deaths. N. Engl. J. Med. 2012, 366. [CrossRef] [PubMed]
4. Quintero, E.; Castells, A.; Bujanda, L.; Cubiella, J.; Salas, D.; Lanas, Á.; Andreu, M.; Hernández, C.; Jover, R.;Montalvo, I.; et al. Colonoscopy versus Fecal Immunochemical Testing in Colorectal-Cancer Screening.N. Engl. J. Med. 2015, 366, 697–706. [CrossRef] [PubMed]
5. Lindholm, E.; Brevinge, H.; Haglind, E. Survival benefit in a randomized clinical trial of faecal occult bloodscreening for colorectal cancer. Br. J. Surg. 2008, 95, 1029–1036. [CrossRef] [PubMed]
6. Faivre, J.; Dancourt, V.; Lejeune, C.; Tazi, M.A.; Lamour, J.; Gerard, D.; Dassonville, F.; Bonithon-Kopp, C.Reduction in colorectal cancer mortality by fecal occult blood screening in a French controlled study.Gastroenterology 2004, 126, 1674–1680. [CrossRef] [PubMed]
7. Atkin, W.S.; Edwards, R.; Kralj-Hans, I.; Wooldrage, K.; Hart, A.R.; Northover, J.M.; Parkin, D.M.; Wardle, J.;Duffy, S.W.; Cuzick, J. Once-only flexible sigmoidoscopy screening in prevention of colorectal cancer:A multicentre randomised controlled trial. Lancet 2010, 375, 1624–1633. [CrossRef]
8. Segnan, N.; Senore, C.; Andreoni, B.; Arrigoni, A.; Bisanti, L.; Cardelli, A.; Castiglione, G.; Crosta, C.;DiPlacido, R.; Ferrari, A.; et al. Randomized trial of different screening strategies for colorectal cancer:Patient response and detection rates. J. Natl. Cancer Inst. 2005, 97, 347–357. [CrossRef] [PubMed]
9. Imperiale, T.F.; Ransohoff, D.F.; Itzkowitz, S.H.; Levin, T.R.; Lavin, P.; Lidgard, G.P.; Ahlquist, D.A.;Berger, B.M. Multitarget Stool DNA Testing for Colorectal-Cancer Screening. N. Engl. J. Med. 2014, 370,1287–1297. [CrossRef] [PubMed]
10. Levin, B.; Lieberman, D.A.; McFarland, B.; Smith, R.A.; Brooks, D.; Andrews, K.S.; Dash, C.; Giardiello, F.M.;Glick, S.; Levin, T.R.; et al. Screening and Surveillance for the Early Detection of Colorectal Cancer andAdenomatous Polyps, 2008: A Joint Guideline from the American Cancer Society, the US Multi-Society TaskForce on Colorectal Cancer, and the American College of Radiology. CA Cancer J. Clin. 2008, 58, 130–160.[CrossRef] [PubMed]
11. Regula, J.; Rupinski, M.; Kraszewska, E.; Polkowski, M.; Pachlewski, J.; Orlowska, J.; Nowacki, M.P.;Butruk, E. Colonoscopy Screening for Detection of Advanced Neoplasia. N. Engl. J. Med. 2006, 355,1863–1872. [CrossRef] [PubMed]
12. Bujanda, L.; Sarasqueta, C.; Zubiaurre, L.; Cosme, A.; Muñoz, C.; Sánchez, A.; Martín, C.; Tito, L.; Piñol, V.;Castells, A.; et al. Low adherence to colonoscopy in the screening of first-degree relatives of patients withcolorectal cancer. Gut 2007, 56, 1714–1718. [CrossRef] [PubMed]
13. Puente Gutiérrez, J.J.; Marín Moreno, M.A.; Domínguez Jiménez, J.L.; Bernal Blanco, E.; Díaz Iglesias, J.M.Effectiveness of a colonoscopic screening programme in first-degree relatives of patients with colorectalcancer. Color. Dis. 2011, 13, 145–153. [CrossRef] [PubMed]
14. Mansouri, D.; McMillan, D.C.; Crearie, C.; Morrison, D.S.; Crighton, E.M.; Horgan, P.G. Temporal trendsin mode, site and stage of presentation with the introduction of colorectal cancer screening: A decade ofexperience from the West of Scotland. Br. J. Cancer 2015, 113, 556–561. [CrossRef] [PubMed]
15. Cubiella, J.; Digby, J.; Rodríguez-Alonso, L.; Vega, P.; Salve, M.; Díaz-Ondina, M.; Strachan, J.A.; Mowat, C.;McDonald, P.J.; Carey, F.A.; et al. The fecal hemoglobin concentration, age and sex test score: Developmentand external validation of a simple prediction tool for colorectal cancer detection in symptomatic patients.Int. J. Cancer 2017, 140, 2201–2211. [CrossRef] [PubMed]
16. Cubiella, J.; Vega, P.; Salve, M.; Díaz-Ondina, M.; Alves, M.T.; Quintero, E.; Álvarez-Sánchez, V.;Fernández-Bañares, F.; Boadas, J.; Campo, R.; et al. COLONPREDICT study investigators Development andexternal validation of a faecal immunochemical test-based prediction model for colorectal cancer detectionin symptomatic patients. BMC Med. 2016, 14, 128. [CrossRef] [PubMed]
Cancers 2018, 10, 300 15 of 17
17. Westwood, M.; Lang, S.; Armstrong, N.; van Turenhout, S.; Cubiella, J.; Stirk, L.; Ramos, I.C.; Luyendijk, M.;Zaim, R.; Kleijnen, J.; et al. Faecal immunochemical tests (FIT) can help to rule out colorectal cancer inpatients presenting in primary care with lower abdominal symptoms: A systematic review conducted toinform new NICE DG30 diagnostic guidance. BMC Med. 2017, 15, 1–17. [CrossRef] [PubMed]
18. Chen, C.; Gonzalez, F.J.; Idle, J.R. LC-MS-based metabolomics in drug metabolism. Drug Metab. Rev. 2007,39, 581–597. [CrossRef] [PubMed]
19. Clarke, C.J.; Haselden, J.N. Metabolic Profiling as a Tool for Understanding Mechanisms of Toxicity.Toxicol. Pathol. 2008, 36, 140–147. [CrossRef] [PubMed]
20. Fernie, A.R.; Trethewey, R.N.; Krotzky, A.J.; Willmitzer, L. Metabolite profiling: from diganostics to systemsbiology. Nat. Rev. Mol. Cell Biol. 2004, 5, 1–7. [CrossRef] [PubMed]
21. Nicholson, J.K.; Wilson, I.D. Understanding “global” systems biology: Metabonomics and the continuum ofmetabolism. Nat. Rev. Drug Discov. 2003, 2, 668–676. [CrossRef] [PubMed]
22. Nordström, A.; O’Maille, G.; Qin, C.; Siuzdak, G. Non-linear Data Alignment for UPLC-MS and HPLC-MSbased Metabolomics: Application to Endogenous and Exogenous Metabolites in Human Serum. Anal Chem2006, 15, 3289–3295. [CrossRef] [PubMed]
23. Nováková, L.; Solichová, D.; Solich, P. Advantages of ultra performance liquid chromatography overhigh-performance liquid chromatography: Comparison of different analytical approaches during analysis ofdiclofenac gel. J. Sep. Sci. 2006, 29, 2433–2443. [CrossRef] [PubMed]
24. Zhang, F.; Zhang, Y.; Zhao, W.; Deng, K.; Wang, Z.; Yang, C.; Ma, L.; Openkova, M.S.; Hou, Y.; Li, K.Metabolomics for biomarker discovery in the diagnosis, prognosis, survival and recurrence of colorectalcancer: a systematic review. Oncotarget 2017, 8, 35460–35472. [CrossRef] [PubMed]
25. Cross, A.J.; Moore, S.C.; Boca, S.; Huang, W.-Y.; Xiong, X.; Stolzenberg-Solomon, R.; Sinha, R.; Sampson, J.N.A prospective study of serum metabolites and colorectal cancer risk. Cancer 2014, 120, 3049–3057. [CrossRef][PubMed]
26. Ikeda, A.; Nishiumi, S.; Shinohara, M.; Yoshie, T.; Hatano, N.; Okuno, T.; Bamba, T.; Fukusaki, E.;Takenawa, T.; Azuma, T.; et al. Serum metabolomics as a novel diagnostic approach for gastrointestinalcancer. Biomed. Chromatogr. 2012, 26, 548–558. [CrossRef] [PubMed]
27. Leichtle, A.B.; Nuoffer, J.M.; Ceglarek, U.; Kase, J.; Conrad, T.; Witzigmann, H.; Thiery, J.; Fiedler, G.M.Serum amino acid profiles and their alterations in colorectal cancer. Metabolomics 2012, 8, 643–653. [CrossRef][PubMed]
28. Li, F.; Qin, X.; Chen, H.; Qiu, L.; Guo, Y.; Liu, H.; Chen, G.; Song, G.; Wang, X.; Li, F.; et al. Lipid profiling forearly diagnosis and progression of colorectal cancer using direct-infusion electrospray ionization Fouriertransform ion cyclotron resonance mass spectrometry. Rapid Commun. Mass Spectrom. 2013, 27, 24–34.[CrossRef] [PubMed]
29. Nishiumi, S.; Kobayashi, T.; Ikeda, A.; Yoshie, T.; Kibi, M.; Izumi, Y.; Okuno, T.; Hayashi, N.; Kawano, S.;Takenawa, T.; et al. A novel serum metabolomics-based diagnostic approach for colorectal cancer. PLoS ONE2012, 7, 1–10. [CrossRef] [PubMed]
30. Ma, Y.; Zhang, P.; Wang, F.; Liu, W.; Yang, J.; Qin, H. An integrated proteomics and metabolomics approachfor defining oncofetal biomarkers in the colorectal cancer. Ann. Surg. 2012, 255, 720–730. [CrossRef][PubMed]
31. Ritchie, S.A.; Ahiahonu, P.W.K.; Jayasinghe, D.; Heath, D.; Liu, J.; Lu, Y.; Jin, W.; Kavianpour, A.; Yamazaki, Y.;Khan, A.M.; et al. Reduced levels of hydroxylated, polyunsaturated ultra long-chain fatty acids in the serumof colorectal cancer patients: implications for early screening and detection. BMC Med. 2010, 8, 13. [CrossRef][PubMed]
32. Tan, B.; Qiu, Y.; Zou, X.; Chen, T.; Xie, G.; Cheng, Y.; Dong, T.; Zhao, L.; Feng, B.; Hu, X.; et al. MetabonomicsIdenti fi es Serum Metabolite Markers of Colorectal Cancer. J. Proteome Res. 2013, 12, 3000–3009. [CrossRef][PubMed]
33. Zhu, J.; Djukovic, D.; Deng, L.; Gu, H.; Himmati, F.; Chiorean, E.G.; Raftery, D. Colorectal cancer detectionusing targeted serum metabolic profiling. J. Proteome Res. 2014, 13, 4120–4130. [CrossRef] [PubMed]
34. Manna, S.K.; Tanaka, N.; Krausz, K.W.; Haznadar, M.; Xue, X.; Matsubara, T.; Bowman, E.D.; Fearon, E.R.;Harris, C.C.; Shah, Y.M.; et al. Biomarkers of coordinate metabolic reprogramming in colorectal tumors inmice and humans. Gastroenterology 2014, 146, 1313–1324. [CrossRef] [PubMed]
Cancers 2018, 10, 300 16 of 17
35. Mirnezami, R.; Jiménez, B.; Li, J.V.; Kinross, J.M.; Veselkov, K.; Goldin, R.D.; Holmes, E.; Nicholson, J.K.;Darzi, A. Rapid diagnosis and staging of colorectal cancer via high-resolution magic angle spinning nuclearmagnetic resonance (HR-MAS NMR) spectroscopy of intact tissue biopsies. Ann. Surg. 2014, 259, 1138–1149.[CrossRef] [PubMed]
36. Wang, H.; Wang, L.; Zhang, H.; Deng, P.; Chen, J.; Zhou, B.; Hu, J.; Zou, J.; Lu, W.; Xiang, P.; et al.1H NMR-based metabolic profiling of human rectal cancer tissue. Mol. Cancer 2013, 12, 121. [CrossRef][PubMed]
37. Silva, C.L.; Passos, M.; Cmara, J.S. Investigation of urinary volatile organic metabolites as potential cancerbiomarkers by solid-phase microextraction in combination with gas chromatography-mass spectrometry.Br. J. Cancer 2011, 105, 1894–1904. [CrossRef] [PubMed]
38. Lin, Y.; Ma, C.; Liu, C.; Wang, Z.; Yang, J.; Liu, X.; Shen, Z.; Wu, R. NMR-based fecal metabolomicsfingerprinting as predictors of earlier diagnosis in patients with colorectal cancer. Oncotarget 2016, 7,29454–29464. [CrossRef] [PubMed]
39. Irrazábal, T.; Belcheva, A.; Girardin, S.E.; Martin, A.; Philpott, D.J. The multifaceted role of the intestinalmicrobiota in colon cancer. Mol. Cell 2014, 54, 309–320. [CrossRef] [PubMed]
40. Gao, Z.; Guo, B.; Gao, R.; Zhu, Q.; Qin, H. Microbiota disbiosis is associated with colorectal cancer.Front. Microbiol. 2015, 6, 1–9. [CrossRef] [PubMed]
41. Yan, G.; Li, L.; Zhu, B.; Li, Y. Lipidome in colorectal cancer. Oncotarget 2016, 7, 33429–33439. [CrossRef][PubMed]
42. Valcz, G.; Patai, Á.V.; Kalmár, A.; Péterfia, B.; Furi, I.; Wichmann, B.; Muzes, G.; Sipos, F.; Krenács, T.;Mihály, E.; et al. Myofibroblast-derived SFRP1 as potential inhibitor of colorectal carcinoma field effect.PLoS ONE 2014, 9, 18–20. [CrossRef] [PubMed]
43. Chow, J.; Panasevich, M.R.; Alexander, D.; Vester Boler, B.M.; Rossoni Serao, M.C.; Faber, T.A.; Bauer, L.L.;Fahey, G.C. Fecal metabolomics of healthy breast-fed versus formula-fed infants before and during in vitrobatch culture fermentation. J. Proteome Res. 2014, 13, 2534–2542. [CrossRef] [PubMed]
44. Zheng, X.; Xie, G.; Zhao, A.; Zhao, L.; Yao, C.; Chiu, N.H.L.; Zhou, Z.; Bao, Y.; Jia, W.; Nicholson, J.K.; et al.The Footprints of Gut Microbial-Mammalian Co-Metabolism. J. Proteome Res. 2011, 10, 5512–5522. [CrossRef][PubMed]
45. Jump, R.L.P.; Polinkovsky, A.; Hurless, K.; Sitzlar, B.; Eckart, K.; Tomas, M.; Deshpande, A.; Nerandzic, M.M.;Donskey, C.J. Metabolomics analysis identifies intestinal microbiota-derived biomarkers of colonizationresistance in clindamycin-treated mice. PLoS ONE 2014, 9. [CrossRef] [PubMed]
46. Martin, F.J.; Sprenger, N.; Montoliu, I.; Rezzi, S.; Kochhar, S.; Nicholson, J.K. Dietary Modulation of GutFunctional Ecology Studied by Fecal Metabonomics Francois-Pierre. J. Proteome Res. 2010, 9, 5284–5295.[CrossRef] [PubMed]
47. Phua, L.C.; Koh, P.K.; Cheah, P.Y.; Ho, H.K.; Chan, E.C.Y. Global gas chromatography/time-of-flight massspectrometry (GC/TOFMS)-based metabonomic profiling of lyophilized human feces. J. Chromatogr. B Anal.Technol. Biomed. Life Sci. 2013, 937, 103–113. [CrossRef] [PubMed]
48. Saric, J.; Wang, Y.; Li, J.; Coen, M.; Utzinger, J.; Marchesi, J.R.; Keiser, J.; Veselkov, K.; Lindon, J.C.;Nicholson, J.K.; et al. Species variation in the fecal metabolome gives insight into differential gastrointestinalfunction. J. Proteome Res. 2008, 7, 352–360. [CrossRef] [PubMed]
49. Stella, C.; Beckwith-Hall, B.; Cloarec, O.; Holmes, E.; Lindon, J.C.; Powell, J.; Van Der Ouderaa, F.;Bingham, S.; Cross, A.J.; Nicholson, J.K. Susceptibility of human metabolic phenotypes to dietary modulation.J. Proteome Res. 2006, 5, 2780–2788. [CrossRef] [PubMed]
50. Weir, T.L.; Manter, D.K.; Sheflin, A.M.; Barnett, B.A.; Heuberger, A.L.; Ryan, E.P. Stool Microbiome andMetabolome Differences between Colorectal Cancer Patients and Healthy Adults. PLoS ONE 2013, 8.[CrossRef] [PubMed]
51. Xu, W.; Chen, D.; Wang, N.; Zhang, T.; Zhou, R.; Huan, T.; Lu, Y.; Su, X.; Xie, Q.; Li, L.; et al. Development ofHigh-Performance Chemical Isotope Labeling LC-MS for Profiling the Human Fecal Metabolome. Anal. Chem.2017, 89, 6758–6765. [CrossRef] [PubMed]
52. Zhao, Y.; Wu, J.; Li, J.V.; Zhou, N.; Tang, H.; Wang, Y. Gut Microbiota Composition Modifies Fecal MetabolicProfiles in Mice. J. Proteome Res. 2013, 12. [CrossRef] [PubMed]

Cancers 2018, 10, 300 17 of 17
53. Gao, X.; Pujos-Guillot, E.; Martin, J.F.; Galan, P.; Juste, C.; Jia, W.; Sebedio, J.L. Metabolite analysis ofhuman fecal water by gas chromatography/mass spectrometry with ethyl chloroformate derivatization.Anal. Biochem. 2009, 393, 163–175. [CrossRef] [PubMed]
54. Gao, X.; Pujos-Guillot, E.; Sébédio, J.L. Development of a quantitative metabolomic approach to studyclinical human fecal water metabolome based on trimethylsilylation derivatization and GC/MS analysis.Anal. Chem. 2010, 82, 6447–6456. [CrossRef] [PubMed]
55. Poroyko, V.; Morowitz, M.; Bell, T.; Ulanov, A.; Wang, M.; Donovan, S.; Bao, N.; Gu, S.; Hong, L.; Alverdy, J.C.;et al. Diet creates metabolic niches in the “inmature gut” that shape microbial communities. Nutr. Hosp.2011, 26, 1283–1295. [CrossRef] [PubMed]
56. Ponnusamy, K.; Choi, J.N.; Kim, J.; Lee, S.Y.; Lee, C.H. Microbial community and metabolomic comparisonof irritable bowel syndrome faeces. J. Med. Microbiol. 2011, 60, 817–827. [CrossRef] [PubMed]
57. Sciorra, V.A.; Morris, A.J. Roles for lipid phosphate phosphatases in regulation of cellular signaling.Biochim. Biophys. Acta-Mol. Cell Biol. Lipids 2002, 1582, 45–51. [CrossRef]
58. Tang, X.; Benesch, M.G.K.; Brindley, D.N. Lipid phosphate phosphatases and their roles in mammalianphysiology and pathology. J. Lipid Res. 2015, 56, 2048–2060. [CrossRef] [PubMed]
59. Weaver, G.A.; Krause, J.A.; Miller, T.L.; Wolin, M.J. Short chain fatty acid distribution of enema samplesfrom a sigmoidoscopy population:an association of high acetate and low butyrate ratios with adenomatouspolyps and colon cancer. Gut 1988, 29, 1539–1543. [CrossRef] [PubMed]
60. Barr, J.; Caballería, J.; Martínez-Arranz, I.; Domínguez-Díez, A.; Alonso, C.; Muntané, J.; Pérez-Cormenzana, M.;García-Monzón, C.; Mayo, R.; Martín-Duce, A.; et al. Obesity-dependent metabolic signatures associatedwith nonalcoholic fatty liver disease progression. J. Proteome Res. 2012, 11, 2521–2532. [CrossRef] [PubMed]
61. Saccenti, E.; Hoefsloot, H.C.J.; Smilde, A.K.; Westerhuis, J.A.; Hendriks, M.M.W.B. Reflections on univariateand multivariate analysis of metabolomics data. Metabolomics 2014, 10, 361–374. [CrossRef]
62. Martínez-Arranz, I.; Mayo, R.; Pérez-Cormenzana, M.; Mincholé, I.; Salazar, L.; Alonso, C.; Mato, J.M.Enhancing metabolomics research through data mining. J. Proteomics 2015, 127, 275–288. [CrossRef][PubMed]
63. Cock, P.J.A.; Antao, T.; Chang, J.T.; Chapman, B.A.; Cox, C.J.; Dalke, A.; Friedberg, I.; Hamelryck, T.; Kauff, F.;Wilczynski, B.; et al. Biopython: Freely available Python tools for computational molecular biology andbioinformatics. Bioinformatics 2009, 25, 1422–1423. [CrossRef] [PubMed]
64. Cokelaer, T.; Pultz, D.; Harder, L.M.; Serra-Musach, J.; Saez-Rodriguez, J.; Valencia, A. BioServices: A commonPython package to access biological Web Services programmatically. Bioinformatics 2013, 29, 3241–3242.[CrossRef] [PubMed]
65. Szklarczyk, D.; Morris, J.H.; Cook, H.; Kuhn, M.; Wyder, S.; Simonovic, M.; Santos, A.; Doncheva, N.T.;Roth, A.; Bork, P.; et al. The STRING database in 2017: quality-controlled protein-protein associationnetworks, made broadly accessible. Nucleic Acids Res. 2017, 45, D362–D368. [CrossRef] [PubMed]
66. Luo, W.; Brouwer, C. Pathview: An R/Bioconductor package for pathway-based data integration andvisualization. Bioinformatics 2013, 29, 1830–1831. [CrossRef] [PubMed]
© 2018 by the authors. Licensee MDPI, Basel, Switzerland. This article is an open accessarticle distributed under the terms and conditions of the Creative Commons Attribution(CC BY) license (http://creativecommons.org/licenses/by/4.0/).