targeted skin delivery of topically applied drugs by ...376690/s4190263_phd_final... · targeted...
TRANSCRIPT
I
Targeted skin delivery of topically applied drugs by optimised formulation design
Eman Abd
A thesis submitted for the degree of Doctor of Philosophy at
The University of Queensland in 2015
School of Medicine (Southern Clinical Division)

II
Abstract
Early research concentrated on the relationship between a solute’s physicochemical
properties and its skin permeation, mostly from simple solutions. Relatively less is known
about how vehicles, particularly complex ones, might also affect skin permeation by altering
the properties of the skin, although this is an area that has attracted much interest. Key
requirements for topical delivery is understanding the relationships between drug-vehicle,
drug-skin or drug –vehicle –skin interaction. In this project, understanding this relationship
was crucial to designing novel formulations able to deliver drugs with different lipophilicity
topically or systemically. The first aim was to explore the impact of various solution
compositions on skin permeation of some model drugs. I compared in vitro maximum
penetration fluxes (Jmax) and solubilities of the vehicles (Sv) and of the stratum corneum
(SSC) and derived diffusivities (D*) for four drugs (caffeine, minoxidil, lidocaine and
naproxen) having a range of lipophilicities. I used a range of solvent vehicles that were
hypothesised to affect the skin to differing degrees to evaluate vehicle effects on
permeability parameters.
If neither the vehicle nor the solute alters the properties of the skin, maximum (or saturated)
solute flux is independent of both the vehicle composition and the solute’s saturated
solubility in that vehicle. These findings were confirmed in this study for all four drugs used.
The permeation of caffeine, minoxidil, lidocaine and naproxen were found to be selectively
enhanced by vehicles containing specific excipients that were hypothesised to alter the
properties of the skin. The greatest effects were seen on flux and diffusivity by the eucalyptol
(EU) and oleic acid (OA) vehicles on the more hydrophilic compounds, caffeine and
minoxidil. We concluded that enhanced solute fluxes were mainly driven by increased
diffusivity in the stratum corneum.
I also examined the extent of skin permeation enhancement of the hydrophilic drug caffeine
and lipophilic drug naproxen applied in nanoemulsions incorporating skin penetration
enhancers. Infinite doses of fully characterised oil-in-water nanoemulsions containing the
skin penetration enhancers oleic acid or eucalyptol as oil phases and caffeine (3%) or
naproxen (2%) were applied to full-thickness skin and human epidermal membranes in
Franz diffusion cells, along with aqueous control solutions. Caffeine and naproxen fluxes
were determined over 8 h. Solute solubility in the formulations and in the stratum corneum,
as well as the uptake of product components into the stratum corneum were measured.
The nanoemulsions significantly enhanced the skin penetration of caffeine and naproxen
compared to aqueous control solutions. The maximum flux enhancement of caffeine was

III
associated with a synergistic increase in both its solubility in the stratum corneum and skin
diffusivity. Enhanced skin penetration in these systems is largely driven by uptake of
formulation excipients containing the active compounds into the stratum corneum. Fluxes of
caffeine and naproxen absorbed into the receptor from full-thickness skin compared with
epidermis were similar. Therefore, the amount of caffeine permeating the dermis and
hypodermis was not affected by these structures although the stratum corneum only
provided the barrier against penetration. In addition to lipids, the vesicle excipients included
eucalyptol or oleic acid as penetration enhancers, and decyl polyglucoside (DPGluc) as a
non-ionic surfactant. Vesicle particle sizes ranged between 135 and 158 nm and caffeine
encapsulation efficiencies were between 46% and 66%. Caffeine penetration and
permeation was measured using high performance liquid chromatography (HPLC). We
found that niosomes, which are liposomes containing a non-ionic surfactant and
transferosomes (ultraflexible vesicles) showed significantly greater penetration into the skin
and permeation across the stratum corneum. Significant enhancement of caffeine
penetration into hair follicles was found for transferosomes and those liposomes containing
oleic acid.
The third aim was to investigate the effectiveness of our nanoemulsion formulations of
caffeine and minoxidil for transfollicular delivery. Nanoemulsions were applied to full-
thickness excised human abdominal skin in Franz diffusion cells for 24 h. Minoxidil
concentrations in receptor fluid, tape strip extracts, follicular casts and homogenised skin
extracts were analysed. The oleic acid formulation was the best at promoting minoxidil
retention into the superficial skin compartments (stratum corneum and hair follicles). The
eucalyptol formulation was the best for deeper penetration into and through the skin. In the
second part, caffeine in nanoemulsion formulations containing OA or EU and in controls was
topically applied and the amount of caffeine retained in the stratum corneum, hair follicles,
in the skin and in the receptor was analysed. The hair follicles and the area around them
were imaged by a LaVision Multiphoton Microscope. Oleic acid nanoemulsion showed the
highest transfollicular delivery of caffeine. Less caffeine in skin layers and storage in hair
follicles was found after blocking the hair follicles.
In conclusion, this project provided information to understand the mechanisms of chemical
penetration enhancers on the human skin and the results of this PhD will help to improve
the design of new formulations or to develop current formulations containing model drugs.

IV
Declaration by author
This thesis is composed of my original work, and contains no material previously published
or written by another person except where due reference has been made in the text. I have
clearly stated the contribution by others to jointly-authored works that I have included in my
thesis.
I have clearly stated the contribution of others to my thesis as a whole, including statistical
assistance, survey design, data analysis, significant technical procedures, professional
editorial advice, and any other original research work used or reported in my thesis. The
content of my thesis is the result of work I have carried out since the commencement of my
research higher degree candidature and does not include a substantial part of work that has
been submitted to qualify for the award of any other degree or diploma in any university or
other tertiary institution. I have clearly stated which parts of my thesis, if any, have been
submitted to qualify for another award.
I acknowledge that an electronic copy of my thesis must be lodged with the University Library
and, subject to the policy and procedures of The University of Queensland, the thesis be
made available for research and study in accordance with the Copyright Act 1968 unless a
period of embargo has been approved by the Dean of the Graduate School.
I acknowledge that copyright of all material contained in my thesis resides with the copyright
holder(s) of that material. Where appropriate I have obtained copyright permission from the
copyright holder to reproduce material in this thesis.
V
Publications during candidature
Submitted journal articles
1. Eman Abd, Sarika Namjoshi, Yousuf H. Mohammed, Michael S. Roberts, Jeffrey E.
Grice, Synergistic skin penetration enhancer and nanoemulsion formulations promote the
human epidermal permeation of caffeine and naproxen. Journal of Pharmaceutical Science.
(Accepted in September 2015)-
2. Eman Abd, Michael S. Roberts, Jeffrey E. Grice, A comparison of the penetration and
permeation of caffeine into and through human epidermis after application in various vesicle
formulations. Skin Pharmacology and Physiology. (Accepted in September 2015)
3. Eman Abd, Michael S. Roberts, Jeffrey E. Grice, The human epidermal skin permeation
of solutes is determined by vehicle uptake into and effects on the stratum corneum.
American Association Pharmaceutical Scientists (AAPS) (Submitted in October 2015)
Conference abstracts
1- Eman Abd, Gregory Medley, Yousuf Mohammed, Jeffrey E. Grice, Michael S. Roberts,
Development and evaluation of microemulsion formulations for transdermal delivery of
caffeine. ASCEPT Annual conference, Melbourne Dec 7-11, 2013.
2- Eman Abd, Gregory Medley, Yousuf Mohammed, Michael S. Roberts,
Jeffrey E. Grice,
Enhanced delivery of minoxidil into skin compartments using microemulsion formulations.
TRI, 2014.
3- Eman Abd, Gregory Medley, Yousuf Mohammed, Michael S. Roberts,
Jeffrey E. Grice,
Development and evaluation of nanoemulsion formulations for transdermal delivery of
Naproxen, ASMR, Brisbane, 2014.
4- Eman Abd, Gregory Medley, Yousuf Mohammed, Michael S. Roberts,
Jeffrey E. Grice,
Effect of vehicles on in vitro percutaneous penetration rates, PhD symposium, Sydney, 2014.
5- Eman Abd, Gregory Medley, Yousuf Mohammed, Michael S. Roberts,
Jeffrey E. Grice,
Effect of chemical enhancers on the in vitro percutaneous penetration of caffeine, ASCEPT
Annual conference, Melbourne Dec 7-11, 2014.
6- Eman Abd, Michael S. Roberts, Jeffrey E. Grice, Follicular penetration and retention of
the hydrophilic model compound caffeine is promoted by microemulsion formulations
containing penetration enhancers, 6th International Postgraduate Symposium in Biomedical
Sciences, UQ, Brisbane, 2015.

VI
Publications included in this thesis
Eman Abd, Sarika Namjoshi, Yousuf H. Mohammed, Michael S. Roberts, Jeffrey E. Grice,
Synergistic skin penetration enhancer and nanoemulsion formulations promote the human
epidermal permeation of caffeine and naproxen. Journal of Pharmaceutical Science.
(Accepted in September 2015)- Incorporated in Chapter 4.
Contributor Statement of contribution
Abd, E (Candidate) Designed experiment (80%)
Conducted experiment (100%)
Statistically analysed and interpretated all
data (100%)
Wrote the paper (70%)
Namjoshi, Sarika Edited the paper (20%)
Mohammed, Yousuf Edited the paper (10%)
Roberts, MS Supervised the project
Edited the paper (30%)
Wrote the paper (15%)
Grice, JE Supervised the project
Designed experiment (20%)
Edited the paper (40%)
Wrote the paper (15%)

VII
Eman Abd, Michael S. Roberts, Jeffrey E. Grice, A comparison of the penetration and
permeation of caffeine into and through human epidermis after application in various vesicle
formulations. Skin Pharmacology and Physiology. (Accepted in September 2015)
Incorporated as Chapter 6
Contributor Statement of contribution
Abd, E (Candidate) Designed experiment (80%)
Conducted experiment (100%)
Statistically analysed and interpretated all
data (100%)
Wrote the paper (70%)
Roberts, MS Supervised the project
Edited the paper (50%)
Wrote the paper (15%)
Grice, JE Supervised the project
Designed experiment (20%)
Edited the paper (50%)
Wrote the paper (15%)

VIII
Eman Abd, Michael S. Roberts, Jeffrey E. Grice, The human epidermal skin permeation of
solutes is determined by vehicle uptake into and effects on the stratum corneum. American
Association Pharmaceutical Scientists (AAPS) (Submitted in October 2015) Incorporated
as Chapter 3
Contributor Statement of contribution
Abd, E (Candidate) Designed experiment (80%)
Conducted experiment (100%)
Statistically analysed and interpreted the
data (100%)
Wrote the paper (70%)
Roberts, MS Supervised the project
Edited the paper (50%)
Wrote the paper (15%)
Grice, JE Supervised the project
Designed experiment (20%)
Edited the paper (50%)
Wrote the paper (15%)

IX
Contribution by others to the Thesis
The data collection and all data analysis for chapters 3, 4, 5 and 6 were undertaken by the
PhD candidate, Eman Abd. The candidate drafted all chapters and submitted papers that
are included in this thesis under the guidance of the other co-authors.
Chapter 3 was undertaken by the PhD candidate, Eman Abd. This chapter led to the soon
to be submitted journal article, entitled “Exploring the effect of vehicle composition relating
skin penetration maximum flux to skin solubility for different vehicles compositions” All
experimental work, data analysis and drafting of this chapter were undertaken by the PhD
candidate, Eman Abd. As PhD supervisors: Dr Jeffrey Grice and Prof Michael S Roberts
advised with discussion and oversaw all aspects of this chapter.
The preparation and characterisations of nanoemulsions in Chapter 4 led to the submitted
journal article, entitled “Synergistic skin penetration enhancer and nanoemulsion
formulations promote the human epidermal permeation of caffeine and naproxen”. All
experimental work, data analysis and drafting of this chapter were undertaken by the PhD
candidate, Eman Abd. The names and roles of all co-authors are: Dr. Sarika Namjoshi, who
helped with the revision of this chapter. Dr. Yousuf H. Mohammed, who help image the skin
and advised and revised this chapter. As PhD supervisors: Dr Jeffrey Grice and Prof Michael
S. Roberts oversaw all aspects of this chapter.
Chapter 5 was undertaken by the PhD candidate, Eman Abd. All experimental work, data
analysis and drafting of this chapter were undertaken by the PhD candidate, Eman Abd. Dr.
Washington Sanchez Jnr. assisted with the use of LaVision multiphoton microscope. Dr.
Yousuf H. Mohammed helped explain the skin images. Navin Chandrakanth
Chandrasekaran helped in blocking hair follicles technique. As PhD supervisors: Dr Jeffrey
Grice and Prof Michael S. Roberts oversaw all aspects of this chapter.
The preparation and characterisations of vesicles in Chapter 6 led to the submitted journal
article, entitled “A comparison of the penetration and permeation of caffeine into and
through human epidermis after application in various vesicle formulations”. All
experimental work, data analysis and drafting of this chapter were undertaken by the PhD
candidate, Eman Abd. As PhD supervisors: Dr Jeffrey Grice and Prof Michael S. Roberts
advised with discussion and oversaw all aspects of this chapter.

X
Statement of parts of the thesis submitted to qualify for the award of another degree
None

XI
Acknowledgements
I would like to express my gratitude to Iraqi government/Ministry of Higher Education for
their financial support during my study and for giving me the opportunity to study in Australia.
I would like to sincerely thank my principal supervisor, Dr. Jeffrey E. Grice who is an example
of a hugely talented, innovative and dedicated researcher and a kind and determined
person, his academic skills and positive energy have led me through all doubts and
hardships.
My foremost thanks are directed to Professor Michael S. Roberts who, with his expertise
and support, was always available to help me develop my knowledge of research strategies
and provide encouragement leading to completion of this thesis.
I have greatly benefited from Dr. Gregory Medley’s technical assistance and expertise in the
validation of analytical assays.
I am also particularly grateful for the imaging assistance by Dr. Washington Sanchez Jnr.
My sincere thanks also go to my friends in the College of Health and Medical Technology,
Baghdad, Iraq and my colleagues from the Therapeutic Research centre for their personal
support.
Most importantly, I would like to express my huge gratitude to my parents especially my Dad
without whom I would not be where I am now, and my life partner Haithm and my children
who were always supportive and patient and encouraged me through all difficulties and
challenges.

XII
Keywords
Penetration enhancers, stratum corneum, solubility in vehicles, oleic acid, eucalyptol,
transfollicular, microemulsions, vesicle systems, maximum flux, diffusivity.
Australian and New Zealand Standard Research Classifications (ANZSRC)
ANZSRC code: 110304 Dermatology, 20%
ANZSRC code: 111504 Pharmaceutical Science, 80%
Fields of Research (FoR) Classification
FoR code: 1115 Pharmacology and Pharmaceutical Sciences, 100%

XIII
Table of Contents
Chapter Page
Chapter 1 Literature Review
Enhanced skin delivery of topically applied drugs: A review
1
1.1 Abstract 1
1.2 Introduction 1
1.3 Skin structure 2
1.3.1 Epidermis 2
1.3.1.1 Stratum basale 3
1.3.1.2 Stratum spinosum 3
1.3.1.3 Stratum granulosum 4
1.3.1.4 Stratum corneum 4
1.3.2 Dermis 5
1.3.3 Subcutaneous 5
1.3.4 Derivative structures of the skin (Appendages) 6
1.3.4.1 Hair 6
1.3.4.2 Sebaceous glands 6
1.3.4.3 Sweat glands 6
1.4 Barrier function 7
1.5 Routes of drug delivery via human skin 8
1.5.1 Cutaneous delivery 9
1.5.1.1 Advantages of cutaneous delivery 9
1.5.1.2 Limitations of using cutaneous delivery 10
1.5.1.3 Factors responsible for releasing a drug from a cutaneous
system
10
1.5.2 Appendageal Drug Delivery’ 12
1.6 Skin penetration enhancement 14
1.6.1 Chemical enhancers 14
1.6.2 Natural Enhancers 18
1.6.2.2 Terpenes 18
1.6.2.3 Fixed oils/ Fatty acids 18
1.6.3 Adverse effects of chemical and natural enhancers in skin 19
1.6.4 Other methods of enhancing skin penetration 19
1.6.4.1 Water as penetration enhancers (Effect of hydration) 19
1.6.4.2 Supersaturation 20

XIV
1.6.4.3 Physical enhancement 21
1.6.4.4 Vesicular system enhancement 21
1.7 Selection of drug models with optimal physiochemical
properties for skin penetration
22
1.7.1 Molecular weight and shape 22
1.7.2 Lipophilicity 23
1.7.3 Hydrogen Bonding 23
1.8 Assessment of skin penetration 24
1.8.1 Maximum Flux (Jmax) 24
1.8.2 Drug-vehicle-skin interactions 24
1.8.3 Animal skin vs. human skin 25
1.8.4 Skin integrity 25
1.8.5 Solubility parameters 25
1.9 Colloidal delivery system 26
Chapter 2 Aims and Hypotheses 30
Chapter 3 Effect of Penetration Enhancers; Solution Studies 33
3.1 Abstract 33
3.2 Introduction 34
3.2.1 The solubility parameters concept 36
3.3. Materials and methods 38
3.3.1 Chemicals 38
3.3.2 Sample analysis 38
3.3.3 Determination of Solubility in the vehicles (SV) 39
3.3.4 Human skin preparation 39
3.3.5 Determination of Solubility in the stratum corneum (SSC) 39
3.3.6 Solvent uptake in the stratum corneum 40
3.3.7 In vitro permeation study 40
3.3.8 In vitro pretreatment permeation study 40
3.3.9 Prediction of maximum flux 41
3.3.10 Data analysis 41
3.4 Results 44
3.4.1 In vitro permeation of solutes across epidermal membranes 44

XV
3.4.2 Impact of formulation on active solubility in the stratum
corneum, maximum flux and derived diffusivity
48
3.4.3 Mechanism underpinning the differential enhanced uptake of
actives into the epidermis
52
3.4.4 Can the permeation fluxes of actives from various vehicles be
predicted by a solubility parameter approach?
56
3.4.5 Caffeine vehicle solubility 57
3.4.6 Penetration and solubility data 57
3.5 Discussion 63
3.6 Conclusions 67
Chapter 4 Synergistic skin penetration enhancer and nanoemulsion
formulations promote the human epidermal permeation of
caffeine and naproxen
68
4.1 Abstract 68
4.2 Introduction 69
4.3. Materials and Methods 71
4.3.1 Preparation of Emulsions 71
4.3.2 Characterisation of emulsions 72
4.3.3 Human skin preparation 72
4.3.4 Determination of the solubility of actives in the various
formulations (SV)
73
4.3.5 Determination of solubility in the stratum corneum (SSC) and
solvent uptake
73
4.3.6 In vitro skin penetration and distribution study 73
4. 3.7 Multiphoton microscopy (MPM) 74
4.3.8 HPLC analysis of caffeine and naproxen 75
4.3.9 Data analysis 75
4.3.10 Statistics 76
4.4 Results 78
4.4.1 Physical and chemical characterisation of the formulations
used
78
4.4.2 In vitro permeation of caffeine and naproxen across epidermal
membranes
79

XVI
4.4.3 Impact of formulation on active solubility in formulation,
solubility in stratum corneum, maximum flux and derived
diffusivity
79
4.4.4 Mechanism underpinning the differential enhanced uptake of
caffeine and naproxen into the epidermis
82
4.4.5 In vitro permeation of caffeine and naproxen across full-
thickness human skin
84
4.4.6 Multiphoton microscopy of full-thickness human skin after
exposure to nanoemulsion formulations
89
4.5 Discussion 90
4.6 Conclusions 94
Chapter 5
Appendageal delivery
A. Potentials of nanoemulsion formulations into delivering
Minoxidil through skin appendages, stratum corneum and
permeation through human skin
B. Investigation of the effects of nanoemulsion containing
penetration enhancers on follicular penetration of hydrophilic
model compound caffeine
95
5.1 Abstract 95
5.2 Introduction 96
5.3. Materials and Methods 98
5.3.1 Chemicals 98
5.3.2 Nanoemulsion formulation preparation and Characterisation 98
5.3.3 Determination of SV and in the SSC 99
5.3.4 Solvent uptake in the stratum corneum 100
5.3.5 Open hair follicles technique 100
5.3.6 Blocked hair follicles technique 100
5.3.7 In vitro skin penetration study 101
5.3.8 Samples analysis 102
5.3.9 Visualisation of follicles and follicular delivery 103
5.3.10 Data analysis 103
5.3.11 Statistics 104
5.4 Results 105
5.4.1 Cumulative amount of minoxidil in the receptor after 24h 105

XVII
5.4.2 Amount of minoxidil in the stratum corneum and hair follicles 106
5.4.3 Amount of minoxidil retained in the skin layers (viable
epidermis and dermis) after 24h
107
5.4.4 Jmax estimated, solubility in the stratum corneum SSC and
diffusivity (D*) and SV
107
5.4.5 Minoxidil solubility in the vehicles 108
5.4.6 Solubility in the stratum corneum and solvent uptake 108
5.4.7 Cumulative amount of caffeine in the receptor after 24h 109
5.4.8 Amount of caffeine in the stratum corneum and in the hair
follicles
113
5.4.9 Amount of caffeine retained in the skin layers (viable epidermis
and dermis) after 24h
114
5.4.10 Multiphoton microscopy imaging to evaluate follicular blocking
technique and assess the penetration of model fluorescent dye
(Acriflavine)
117
5.5 Discussion 117
5.6 Conclusion 122
Chapter 6 A comparison of the penetration and permeation of caffeine
into and through human epidermis after application of various
vesicle formulations
123
6.1 Abstract 123
6.2 Introduction 123
6.3 Materials and methods 125
6.3.1 Materials 125
6.3.2 Vesicle preparation 125
6.3.3 Vesicle characterisation 125
6.3.4 Caffeine encapsulation efficiency 125
6.3.5 Caffeine skin permeation studies 126
6.3.6 Sample analysis 126
6.3.7 Data analysis and Statistics 127
6.4 Results 127
6.4.1 Vesicle characterisation 127
6.4.2 Permeation of caffeine from vesicles and control 127
6.5 Discussion 128

XVIII
6.6 Conclusion 133
Chapter 7 Conclusion and Future recommendation 134
7.1 Conclusion 134
7.1.1 Effect of Penetration Enhancers; Solution Studies 134
7.1.2 Synergistic skin penetration enhancer and nanoemulsion
formulations promote the human
135
7.1.3 Appendageal delivery 136
7.1.4 A comparison of the penetration and permeation of caffeine
into and through human epidermis after application in various
vesicle formulations
136
7.2 Future Direction 137
List of References 138
Appendix 150

XIX
List of Figures
Chapter 1 Page
Figure 1.1 Structure and Function of the Skin 3
Figure 1.2 Main routes of penetration: 1. through the sweat gland; 2.
directly across the stratum corneum (transcellular); 3. via the
hair follicles; 4. Intercellular
9
Figure 1.3 Diagrammatic representation of the drug transport into and
through the skin from topical applied formulation
11
Figure 1.4 Penetration depths and capacity to penetrate the epithelium
depend on the particle size
13
Figure 1.5 Actions of penetration enhancers within the intercellular lipid
domain
14
Figure 1.6 Relationship between log Jmax and MW for solutes from
aqueous solutions through human epidermal membranes.
(n=87).The regression line (solid line) describes the
relationship: log Jmax=-3.90-0.019MW (p<0.001, r²=8.847).
The dashed lines show 95% confidence limits
23
Chapter 3
Figure 3.1 Hansen sphere in the schematic form 37
Figure3.2 In vitro percutaneous permeation through epidermal human
skin A1- caffeine with penetration enhancer vehicles, A2-
caffeine with controls; B1-minoxidil with penetration enhancer
vehicles, B2- minoxidil with controls; C1- lidocaine with
penetration enhancer vehicles, C2- lidocaine with controls &
D1- naproxen with penetration enhancer vehicles, D2-
naproxen with controls.
45
Figure 3.3 A-D, Jmax versus solubility in the vehicles (Sv). A, Caffeine; B,
Minoxidil; C, Lidocaine; D, Naproxen.
49
Figure 3.4 A-D, Effective diffusivity, D* (= D/h) versus solubility in the
vehicles (Sv). A, Caffeine; B, Minoxidil; C, Lidocaine; D,
Naproxen.
50
Figure 3.5 Jmax versus solubility in the stratum corneum, SSC for A,
Caffeine; B, Minoxidil; C, Lidocaine; D, Naproxen
52

XX
Figure3.6 Solubility in the stratum corneum (SSC) versus predicted
solvent uptake values from range of vehicles for A, Caffeine;
B, Minoxidil; C, Lidocaine; D, Naproxen.
53
Figure 3.7 Solubility in the stratum corneum (SSC) versus predicted solute
uptake values from range of vehicles for A, Caffeine; B,
Minoxidil; C, Lidocaine; D, Naproxen
54
Figure 3.8 Predicted versus experimental solubility in the stratum
corneum (SSC) from a range of vehicles for A, Caffeine; B,
Minoxidil; C, Lidocaine; D, Naproxen; E, the combined dataset
(Mean, n=4).
55
Figure 3.9 Log Jmax (predicted using Hansen solubility parameters by
method of Abbott) vs log Jmax (observed) for caffeine
(triangles), minoxidil (circles), lidocaine (diamonds) and
naproxen (squares) applied to human epidermal membranes
in different vehicles.
56
Figure 3.10 Relationship between experimentally determined caffeine
solubility in each solvent (Sv) and solvent solubility parameter
(δtotal
). (The dashed line is the total solubility parameter area
for caffeine)
57
Figure 3.11 Permeation profiles of caffeine through epidermal human skin after
pre-treating skin for 2h with a range of t vehicles
58
Figure 3.12 Mean plot summarising the effect of Hansen solubility
parameter of vehicle on enhancement of Jmax, partition and
diffusion
60
Figure 3.13 Composite of the effects of vehicle pretreatment on diffusion
and partition of caffeine. (The red line is the identity line)
61
Figure 3.14 Relationship between (A) Jmax and SSC and (B) caffeine
permeability coefficient (KP) and SSC.
62
Chapter 4
Figure 4.1 Ternary phase diagram of the oil, surfactant/co-surfactant
mixture and water at ambient temperature. The dotted line in
the diagram represents the nanoemulsion.
78

XXI
Figure 4.2 In vitro percutaneous permeation through epidermal human
skin A-caffeine; B-naproxen
79
Figure 4.3 Estimated maximum fluxes for caffeine and naproxen for each
of the formulations plotted against the solubility of these
actives in the formulations
80
Figure 4.4 Impact of stratum corneum solubility and apparent diffusivity
D* on the maximum flux Jmax for caffeine and naproxen. 4A.
Jmax versus stratum corneum; 4B Jmax versus D*.
82
Figure 4.5 Stratum corneum solubility predicted from solvent uptake for
caffeine (A) and Naproxen (B). (Lin’s concordance correlation
coefficient of caffeine is 0.58 and naproxen is 0.93)
83
Figure 4.6 Solute solubility in vehicle and formulation uptake into stratum
corneum as a function of their estimated HSP distance (Ra).
A. Vehicle solubility (SV) for caffeine (circles) and naproxen
(triangles) versus the Ra between the nanoemulsion
formulations and controls; B: Formulation uptake into the
stratum corneum (diamonds) versus the Ra between the
nanoemulsion formulations and the skin
84
Figure 4.7 In vitro percutaneous permeation through Full-thickness
human skin A-caffeine; B-naproxen
85
Figure 4.8 A-Caffeine; B-naproxen retained in the stratum corneum and
skin from nanoemulsion formulations and controls after 8h
permeation from full-thickness human skin
87
Figure 4.9 structural and viability study of excised skin following the
topical application of nanoemulsion formulations- explain blue
and yellow fluorescence
89
Chapter 5
Figure 5.1 permeation profiles of minoxidil through excised human skin
from nanoemulsions and control
105
Figure 5.2 Minoxidil retained in stratum corneum, hair follicles and skin
layers
106
Figure 5.3 Minoxidil A - Jmax
values from all formulations versus solubility
in the stratum corneum (SSC
) (R2=0.84); B- J
max values from all
108

XXII
formulations versus Diffusivity (D*) (R2= 0.90); C- Diffusivity
(D*) versus Sf; D- S
SC versus S
V
Figure 5.4 SSC
(predicted) versus SSC
(measured) 109
Figure 5.5 Permeation profiles of caffeine through A- normal excised
human skin; B- Excised human skin (after opening the hair
follicles); C- Excised human skin (after plugging the hair
follicles) from nanoemulsion formulations & controls
112
Figure 5.6 Permeation profiles of caffeine through Excised human skin A-
Contribution to permeation by all the hair follicles B-
Contribution to permeation by the open hair follicles from
nanoemulsion formulations & controls
113
Figure 5.7 Caffeine retained in the Stratum corneum (SC) from ME
formulations & controls after
115
Figure 5.8 Caffeine retained in the hair follicles after topical administration
of nanoemulsion formulations & controls up to 24h
115
Figure 5.9 Caffeine retained in the viable epidermis and dermis from
nanoemulsion formulations & controls after 24h
116
Figure 5.10 Skin images after applying nanoemulsion formulations and
controls
121
Chapter 6
Figure 6.1 Permeation profiles of caffeine through excised human skin
from various vesicle systems and a control
132
Figure 6.2 Caffeine recovery from the skin surface, the stratum corneum,
hair follicles, residual skin and receptor solution after
application of vesicles and control for 24h
133

XXIII
List of Tables
Tables
Chapter 1
Page
Table 1.1 Immune components of the skin 8
Table 1.2 Common chemical penetration enhancers (CPEs);
mechanisms, safety and side effects and their features
16
Table 1.3 Nano delivery systems 27
Chapter 3
Table 3.1 Physicochemical properties of model compounds 38
Table 3.2 Composition of vehicles used. Concentrations (w/v) of
caffeine, minoxidil, lidocaine and naproxen were a3%,
b2%, c2.5%, d2%, respectively, except those marked by
*, where the solutions are saturated. Vehicles
containing ethanol are shaded, with those also
containing penetration enhancers in darker shading.
43
Table 3.3 In vitro percutaneous permeation through epidermal
human skin A1- caffeine with penetration enhancer
vehicles, A2- caffeine with controls; B1-minoxidil with
penetration enhancer vehicles, B2- minoxidil with
controls; C1- lidocaine with penetration enhancer
vehicles, C2- lidocaine with controls & D1- naproxen
with penetration enhancer vehicles, D2- naproxen with
controls
46
Table 3.4 Vehicle solubility parameters and skin parameters 59
Chapter 4
Table 4.1 Compositions (% w/w) of nanoemulsion formulations
(C3 and C4), with penetration enhancers eucalyptol (E1
and E2) and oleic acid (O1 and O2), and control
mixtures (C1 – C2). The concentration of caffeine
(marked as C) dissolved in aqueous controls and
nanoemulsions was 3% w/w, whereas a concentration
of 2% w/w was used for naproxen (marked as N).
72

XXIV
Table 4.2 Physical and chemical characterisation of the various
nanoemulsion formulations and control mixtures
defined in Table 1.
77
Table 4.3 Experimental data for caffeine and naproxen in
different nanoemulsions without and with penetration
enhancers and control vehicles. The formulations are
defined in Table 1 and are nanoemulsion formulations
(C3 and C4), with penetration enhancers eucalyptol (E1
and E2) and oleic acid (O1 and O2), and control
mixtures (C1 – C2).
81
Table 4.4 Caffeine and naproxen permeation parameters from
different vehicles though full-thickness skin C1 is 100%
water, C2 is 60% ethanol/water, C3 is 25%
PEG6000/water, C4 is 25% Volpo-N10
25%ethanol/50%water
E nanoemulsions containing eucalyptol as oil phase, O
nanoemulsions containing Oleic Acid as oil phase
86
Table 4.5 Estimated lag times and steady state flux for caffeine
and naproxen from epidermal membrane and full-
thickness skin.
88
Chapter 5
Table 5.1 Compositions and solubilities of minoxidil in selected
nanoemulsion formulations (%w/w)
99
Table 5.2 Compositions of selected nanoemulsion formulations
and controls (%w/w)
99
Table 5.3 Transdermal permeation parameters and pH of the
minoxidil from formulations and control
106
Table 5.4 The cumulative amounts (µg/cm2), fluxes (µg/cm2/h)
and follicular penetration (µg/one hair follicle) by
follicular closing technique and open hair follicle
technique using Franz diffusion cells at 24h from ME
formulations and controls.
111

XXV
Table 5.5 Amount of caffeine (µg/cm2) in different skin
compartments for controls and nanoemulsion
formulations.
114
Chapter 6
Table 6.1 Liposome formulations showing excipient ratios and
aqueous control composition. All formulations
contained caffeine, 2% w/v.
131
Table 6.2 Vesicle systems characterisation and encapsulation
efficiency.
131
Table 6.3 Permeation parameters following 24 hours application
of caffeine from vesicle formulations and controls to full-
thickness human skin).
132

XXVI
List of Abbreviations
CV Initial concentration
D* Diffusivity
DLS Dynamic light scattering
DPGluc decyl polyglucoside
E Enhancement ratio
EU Eucalyptol
FDC Franz diffusion cell
FTS Full Thickness Skin
HLB Hydrophilic lipophilic balance
HPLC High performance liquid chromatography
Jmax Maximum flux
JSS Steady state flux
KP Permeability coefficient
KSC Partitioning coefficient
Log P Lipophilicity
ME Microemulsion
mg Milligram
min minute
mL Milliliter
MPM Multiphoton microscope
MW Molecular weight
OA Oleic acid

XXVII
O/W Oil in water
PBS Phosphate buffer saline
PEG6000 Polyethylene glycol 6000
PDI Polydispersity Index
Q Cumulative amount
RI Refractive index
SC Stratum corneum
SD Standard deviation
SE Standard error
SEM Standard error of the mean
SF Solubility in formulation
SLS Sodium lauryl sulphate
SSC Solubility in the stratum corneum
SV Solubility in vehicle
T Transferosomes
δtotal Total solubility parameters
W/O Water in oil microemulsion
1
Chapter 1
Literature Review
Enhanced skin delivery of topically applied drugs: A review
1.1 Abstract
There is substantial interest in the skin as a route of drug delivery for local or systemic
effects. However, the stratum corneum forms a formidable barrier to solute penetration,
limiting topical and transdermal bioavailability. Many techniques have been used to enhance
the permeability of drugs and increase the penetration of drugs that are used for topical
delivery. This review describes the skin structure and the various techniques that have been
used to enhance drug delivery across human skin.
1.2 Introduction
The skin is the largest organ of the body; it forms a protective layer over the underlying
tissues such as ligaments, muscles and internal organs, preventing exposure to exogenous
particles and mechanical and radiation-induced injuries. In addition, the skin plays a role in
immunity and metabolism, controls body temperature and comprises sensory nerve endings
for the perception of temperature, touch, pressure and pain. Skin is made up of viable and
non-viable epidermis, dermis and hypodermis (subcutaneous) layers.
Topical application of drugs has been investigated as an alternative to intravenous or
parenteral routes, but transdermal delivery is frequently limited by poor drug penetrability.
This low permeability can be mostly attributed to the outer layer of the skin, the stratum
corneum, which serves as a rate-limiting lipophilic barrier to the uptake of exogenous
chemical and biological substances and to the loss of water. This means that some drugs
need penetration enhancers included in formulations to enable efficient delivery of
therapeutic agents. Penetration enhancers are chemicals that reversibly reduce the barrier
function of the stratum corneum, to facilitate drug delivery to and through the tissue. Ideally,
they should be odourless, colourless, pharmacologically inert and chemically and physically
stable.
After extensive research, the success of this technique remains limited, with many issues
still to be solved. Recently, advanced formulations such as liposomes and nanoemulsions
have also been used to help drugs penetrate the skin. This review describes the skin
structure; routes of penetration, how drug properties affect permeation, permeation
enhancement techniques and advanced formulations.

2
1.3 Skin structure:
The skin is the outer layer and largest organ in the body, accounting for about 16% of body
weight with surface area of approximately 1.8 m² in adults (1). The skin plays an essential
role for the survival of the human body in a relatively hostile environment. The most vital role
is providing a physical barrier to the environment, it maintains homeostasis by limiting the
loss of water, electrolytes and heat and protects against micro-organisms, toxic agents and
ultraviolet radiation (2). It consists of three basic layers: the epidermis, the dermis and the
subcutaneous layer. Hair, nails, sebaceous, sweat and apocrine glands are considered as
skin derivatives or appendages. Even though it is structurally continuous throughout the
body, skin varies in thickness according to the age of the individual and the anatomical site
(3).
1.3.1 Epidermis
The epidermal layer is formed from squamous epithelium. Keratinocytes are the main cells
of the epidermis that can produce the keratin protein. Protein bridges named desmosomes
attach the keratinocytes and are in a constant state of moving from the deeper layers to the
superficial. The separate layers of the epidermis are defined by the degree of keratinisation.
The layers of the epidermis from bottom layers to the surface are the stratum basale (basal
cell layer), the stratum spinosum (spinous or prickle cell layer), the stratum granulosum
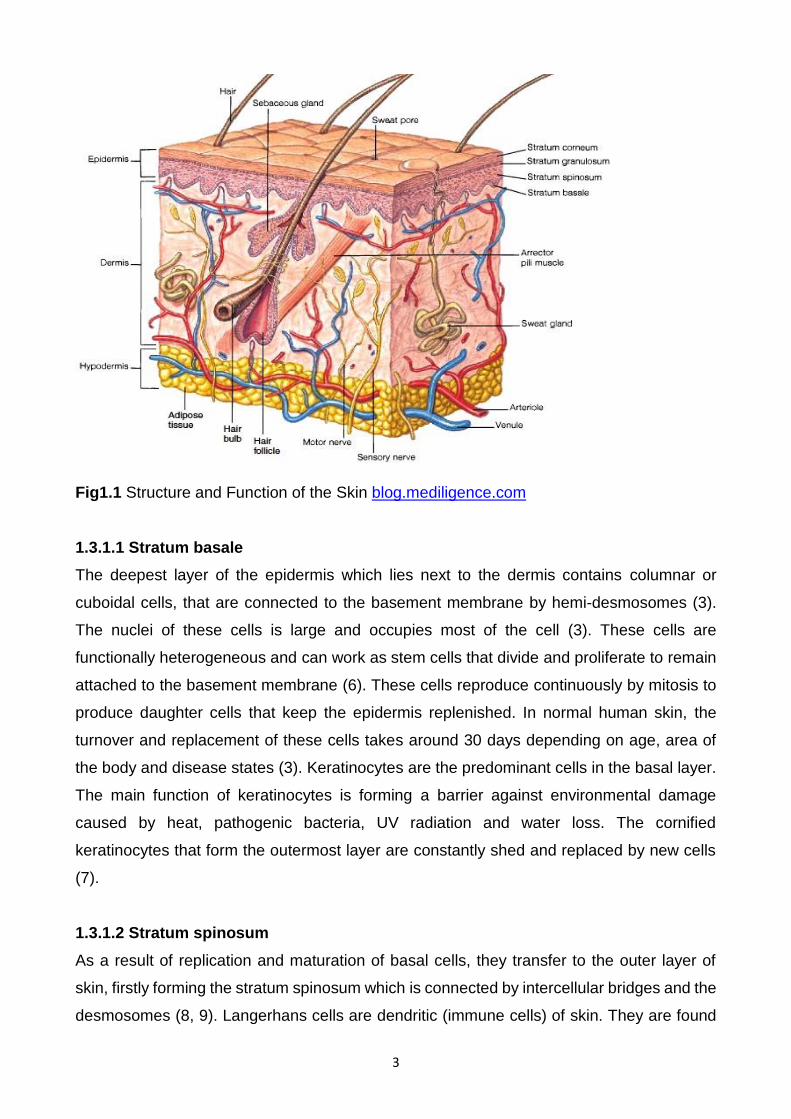
(granular cell layer) and the stratum corneum (horny layer) (4), (see Fig1.1). Both the stratum
spinosum and stratum granulosum are occasionally mentioned as the Malphigian layer (1,
5)
3
Fig1.1 Structure and Function of the Skin blog.mediligence.com
1.3.1.1 Stratum basale
The deepest layer of the epidermis which lies next to the dermis contains columnar or
cuboidal cells, that are connected to the basement membrane by hemi-desmosomes (3).
The nuclei of these cells is large and occupies most of the cell (3). These cells are
functionally heterogeneous and can work as stem cells that divide and proliferate to remain
attached to the basement membrane (6). These cells reproduce continuously by mitosis to
produce daughter cells that keep the epidermis replenished. In normal human skin, the
turnover and replacement of these cells takes around 30 days depending on age, area of
the body and disease states (3). Keratinocytes are the predominant cells in the basal layer.
The main function of keratinocytes is forming a barrier against environmental damage
caused by heat, pathogenic bacteria, UV radiation and water loss. The cornified
keratinocytes that form the outermost layer are constantly shed and replaced by new cells
(7).
1.3.1.2 Stratum spinosum
As a result of replication and maturation of basal cells, they transfer to the outer layer of
skin, firstly forming the stratum spinosum which is connected by intercellular bridges and the
desmosomes (8, 9). Langerhans cells are dendritic (immune cells) of skin. They are found

4
throughout the epidermis but are mostly prominent in the middle of this layer. In case of skin
infection, the Langerhans cells engage in and process microbial antigens to be fully
functional antigen-presenting cells (10-12).
1.3.1.3 Stratum granulosum
During their migration to the surface, the cells progressively collapse and lose their nuclei
and cytoplasm, so that they seem granular at this level(1). A typical feature of this layer is
the presence small lamellar granules known as lamellated bodies or membrane coated
granules (3). These granules are smaller than mitochondria and differ in size according to
variation in species from 0.1-0.5 µm (9) or from 0.3-0.7 µm (8).
1.3.1.4 Stratum corneum
The stratum corneum results from the migration of cells from the basal layer to the skin
surface by the process known as keratinisation. The final result of keratinocyte maturation
is the stratum corneum, which is formed from hexagonal-shaped layers, non-viable cornified
cells named corneocytes. In most skin sites, there are 10-25 layers of stacked corneocytes
which are non-hydrated cells lying parallel to the skin surface (2). Every cell is enclosed by
a protein envelope and filled with water-retaining keratin proteins. The form and location of
the keratin proteins give strength to the stratum corneum. The thickness varies according to
the physical interaction and environment, as for example, these cells are thicker on palms
of the hands and soles of the feet. Moreover, the absorption of solutes through these areas
is slower than other parts of the body(13). Each stratum corneum cell contains keratin
(~70%) and lipid (~20%). The region between cells consists of lipid and desmosomes for
corneocyte cohesion. The stratum corneum acts as a barrier to prevent the loss of internal
body components such as water. The layer of corneocytes can absorb three times its mass
in water if its water content falls below 10% but it no longer remains flexible and cracks. The
epidermal cells take 2-3 weeks to transfer to this layer (13).
Epidermal stem cells are responsible for everyday regeneration of the different layers of
the epidermis. These stem cells are found in the basal layer of the epidermis. The main
functions of epidermal cells are:
- Melanocyte cells are responsible for regeneration of melanocytes, a type of pigment
cell. Melanocytes produce the pigment melanin, and therefore play an important role
in skin and hair follicle pigmentation. It is not yet certain where these stem cells are
found in humans

5
Keratinic cells play an essential role in serving to anchor the epidermis to the Basal
membrane (6, 13).
Langerhans cells have important roles in the skin’s immune system. (6, 13)
Desquamation of skin cells
Desquamation is an important factor in maintaining skin integrity and smoothness of the
stratum corneum. It is the process of cell shedding from the surface of the stratum corneum,
and balances proliferating keratinocytes that form in the stratum basale. These cells migrate
through the epidermis towards the surface in a journey that takes approximately fourteen
days. The keratinocytes are denucleated during the process and corneodesmosomes are
broken down to allow the cells to be shed (3).
1.3.2 Dermis
The dermis differs in thickness, from almost 0.1 -0.5 cm. It is located underneath the
epidermis and is composed of a firm, supportive cell matrix. The dermis contains two layers:
thin papillary layer and thicker reticular layer (1, 13). The papillary dermis lies under and
connects to the epidermis. It comprises thin, free organised collagen fibres. The thicker
collagen bundles are equivalent to the surface of the skin in the deeper reticular layer, and
spread from the base of the papillary layer to the subcutaneous tissue. The dermis consists
of fibroblasts, which create collagen, elastin and structural proteoglycans, both with immune
capable mast cells and macrophages. Collagen fibres form more than 70% of the dermis,
providing strength and hardness and elastin gives elasticity and flexibility whereas
proteoglycans provide viscosity and hydration. The dermal vasculature, lymphatics, nervous
cells and fibres are embedded in the fibrous tissue of the dermis in addition to the sweat
glands, small numbers of striated muscles and hair roots. The dermis has an extensive
vascular network, hair follicles, and sweat glands. Therefore, the major function of the
dermis is providing nutrition and immune response to the skin. It also plays an important role
in regulating the temperature, pressure and pain. Moreover, the papillary layer in the dermis
provides a support system for the epidermis (1, 13).
1.3.3 Subcutaneous
The subcutaneous (hypodermis) layer is the deepest layer of the skin, and is formed from
loose connective tissue and fat (50% of the body fat), which may be more than 3 cm thick
on the abdomen. Its function is absorption of shock and as storage for energy in addition to
its work as a heat insulator as it carries the vascular and neural systems for the skin. The

6
hypodermis layer is linked to the dermis by interconnecting collagen and elastin fibres in a
loose arrangement, allowing flexibility and free movement of the skin over the underling
structure (3). The main cells in this layer are fibroblasts and macrophages. (1, 13).
1.3.4 Derivative structures of the skin (Appendages)
1.3.4.1 Hair
Hair is found in varying thickness over most of the body surface, with a few exceptions
including the soles of the feet, palms of the hands, lips and some other areas. Every hair
follicle is surrounded by germinative cells, which provide keratin and melanocytes and
produce pigment. The free part of the hair above the skin surface is called the hair shaft and
the part within the follicle is called the hair root, with a terminal hollow knob called the hair
bulb (3). The hair shaft contains an outer cuticle, a cortex of keratinocytes and an inner
medulla (1, 3) and is accompanied by arrector pili muscle that contracts the hair shaft in
case of fear, emotion and cold, giving the skin “goose bumps” (1). The hair density is
different in various body sites; on the forehead the hair follicles are small but high in density,
while on the calf area, the density is low but the follicles are larger (14, 15).
1.3.4.2 Sebaceous glands
The sebaceous glands are derived from epidermal cells and accompany hair follicles,
particularly those of the scalp, face, chest and back. These cells are not found in hairless
areas. Sebaceous glands are small in children, growing and becoming active during
adolescence. An oily sebum is produced from these glands by holocrine secretion,
consisting of triglyceride, free fatty acids and waxes. The sebum function is to protect and
lubricate the skin as well as maintain the skin pH at around 5 (13). Other functions of sebum
are maintaining the epidermal permeability barrier, carrying antioxidants to the skin surface,
and also regulating steroidogenesis and androgen (3, 16)
1.3.4.3 Sweat glands
Sweat glands are believed to number more than 2.5 million on the human skin surface. They
are classified into apocrine and eccrine sweat glands depending on their function and shape.
The apocrine gland is bigger and has ducts which empty into the hair follicles. It is found
throughout the skin in most domestic animals but in humans it occurs in restricted areas
only (axillae, areola and nipples, external ear canal, eyelids, inner nostrils, perianal region,
and some parts of the external genitalia). The eccrine gland is the dominant form in humans
and is distributed in most other areas of the body (4). Eccrine glands open directly onto the
skin surface. The eccrine glands excrete watery fluid containing lactic acid, chloride, fatty

7
acids, urea, mucopolysaccharides and glycoproteins and are necessary for fluid and
electrolytes homeostasis. Also, they secrete a dilute salt solution in case of high
environmental temperature and emotional stress. Apocrine glands become active in
adolescence, producing an odourless protein-rich secretion which when acted upon by skin
bacteria emits a characteristic odour (1, 3).
1.4 Barrier function
stratum corneum, the result of epidermal terminal differentiation, is an important mediator of
defensive function of the skin (17) and a biosensor which recognises and responds to
changes in external humidity and pH. Thermoregulation is achieved by keeping a constant
body temperature through alterations in blood flow in the cutaneous vascular system and
sweat evaporation from the surface. UV protection is provided by the melanocytes, in the
basal layer, producing melanin which absorbs UV radiation and protect the cell nuclei from
DNA damage (18) .(1). Melanin particles in the epidermal inner layers form defensive
shields over the keratinocyte nuclei in the outer layers, and are more regularly distributed.
As well as acting as a physical barrier, skin also has an essential immunological role. It
incorporates all the elements of cellular immunity, with the exception of B cells. Immune
components of the skin are given in Table 1.1 (19). The skin is also working as a barrier by
controlling the loss of water, electrolytes and other body components, in addition to inhibiting
the entry of harmful and unwanted molecules from the external environment. This function
may be attributed to the unique structure of the stratum corneum, which consists of multiple
layers of nucleate, proteinaceous corneocytes embedded in an expanded, extracellular
matrix of enriched lipid forming a model similar to “bricks and mortar”(20). The function of
corneocytes is mechanical friction resistance which is attributed to the rigid , highly cross-
linked cornified envelope (21).

8
Table 1.1 Immune components of the skin (19) Defence type Component Immune action
Structure Skin Impenetrable physical barrier to most external
organisms
Blood and Lymphatic vessels Provision of transport network for cellular defence
Cellular Langerhans cells
T lymphocytes
Mast cells
Antigen presentation
Facilitate immune reactions. Self-regulating through
the action of T suppressor cells.
Facilitate inflammatory skin reactions.
Keratinocytes Secrete inflammatory cytokines; have ability to
express surface immune
Systemic molecules Cytokines and Eicosanoids
Cytokines: cell mediation chemicals produced by
components of the cellular defence system
Eicosanoids: non-specific inflammatory
Mediators produced by mast cells,
Macrophages and keratinocytes.
Increase the number of cellular defence facilitators in
an area by binding to T cells.
Adhesion molecules Complement
Cascade
Activation of this initiates a host of destructive
mechanisms, including opsonisation, lies,
chemotaxis and mast cell degranulation.
Immunogenic
antigens
Major Enables immunological recognition of Major
Histocompatibility Complex (MHC)
1.5 Routes of drug delivery via human skin
When designing a topical delivery system, it is important to understand the possible
penetration pathways. Drug molecules, in contact with skin, penetrate by three potential
routes: directly through the stratum corneum (intercellular and transcellular) (Fig 1.2), via
the sweat ducts, and through the hair follicles and sebeaceous glands (the shunt or
appendageal route) (Fig 1.2). The importance of the appendageal route versus transport
through the stratum corneum has been debated by researchers for many years (22, 23) as
its determination is complicated by the absence of suitable experimental models to allow
separation of these three routes. The pilosebaceous pathway penetrating through hair

9
follicles may be portal for penetration of large polar molecules which have difficulty diffusing
through the stratum corneum.
Fig 1.2 Main routes of penetration: 1. through the sweat gland; 2. directly across the stratum corneum
(transcellular); 3. via the hair follicles; 4. Intercellular (modified from (24)).
1.5.1 Cutaneous delivery
Designing drug delivery systems has become a major focus of activity in the pharmaceutical
industry and transdermal administration is one of the important delivery routes currently
under consideration. The stratum corneum is very selective with respect to what it permits
to be transported through the skin; consequently, only penetrants with particular
physicochemical properties in a narrow range can pass through the skin adequately under
passive conditions. This causes the variety of potential drugs that can be administrated
topically to be limited, which highlights the value of incorporating permeation enhancers into
formulations to help in the active delivery of a larger diversity of drugs (25). The aim is to
deliver active substances to targeted sites through the skin at an acceptable rate to produce
the desired pharmacological effect.(26).
1.5.1.1 Advantages of cutaneous delivery
Cutaneous administration has numerous advantages and can be summarised as follows:
1. This route of administration means that the hepatic first pass metabolism and the
gastrointestinal tract metabolism are avoided (27)
2. It offers an alternative pathway for patients who have oral dosing issues, such as in
unconscious patients (28).
3. It is painless and convenient (29).

10
4. Cutaneous delivery can provide direct access to the diseased or target site such as
for fungal skin disease or eczema (30).
5. It has fewer side effects related to systemic toxicity compared to other routes of
administration (28, 31).
6. As the drug would normally be delivered by an external device, medication can be
ceased at any point by the removal of the device. Of course, any substance that has
already partitioned into the skin cannot be easily removed but only this substance
can enter the body once the device is removed from the skin (26).
1.5.1.2 Limitations of using cutaneous delivery
The most obvious limitation for topical drug delivery is that the solute should be able to
penetrate the skin. This means that the physicochemical properties of the drug play an
important role in penetration, for example, the molecular weight should be less than 500 Da
to diffuse through the stratum corneum (32), (33).
The skin is a multilaminate membrane and changes from a lipophilic material (the outer most
stratum cormeum) to a very aqueous internal structure (viable epidermis and dermis).
Therefore, successful permeation of solutes requires molecules, which are soluble in the
lipophilic environment of the stratum corneum and in the hydrophilic environment of the
viable epidermis and dermis. A drug lipophilicity (log P (Octanol/Water) should be between
1-3 in order to permeate through the variable epidermis and underlying layers successfully
(34). These limitations apply only to passive delivery and the point of developing enhanced
delivery systems is to circumvent the limitations.
1.5.1.3 Factors responsible for releasing a drug from a cutaneous system
The events which may occur after administration of formulation to the skin are shown in
Figure 1.3. Studies of cutaneous drug delivery and transdermal absorption have
demonstrated six events which are responsible for drug transfer from the system of
transdermal application to the blood circulation(26):
1. Transport of drug from formulations to the stratum corneum.
2. Partitioning of drug from formulations into the stratum corneum.
3. Drug diffusion within the stratum corneum.
4. Partitioning of drug into the more aqueous epidermal tissues (Viable epidermis: VE).
5. Drug diffusion within the tissues of viable epidermis.
6. Drug absorption into the dermal and blood vessels.

11
Initially, the drug must be released from the vehicle followed by partitioning into the SC.
Molecules will subsequently diffuse (as a result of a concentration gradient) through the SC
before a further partitioning process into the viable epidermis, and further diffusion through
the viable epidermis towards the dermis. Following uptake by the vasculature and lymphatic
vessels in the dermis, the drug enters the systemic circulation to be distributed to tissues
and organs and eventually cleared.(26, 35).
Fig 1.3 Diagrammatic representation of the drug transport into and through the skin from a
topical applied formulation (36).

12
1.5.2 Appendageal Drug Delivery
The important role of hair follicles as penetration routes and reservoirs for topically applied
substances has been validated in several animal models and in humans (37). The
pilosebaceous unit describes the combined structure of the hair follicle, the adjoining
arrector pili muscle and associated sebaceous gland (38), containing more than 20 various
cell populations (39), which regulate different immunological, biochemical and metabolic
activities.
Previously, layers of stratum corneum have been considered to be the main permeation
pathway into and through the stratum corneum, while the skin appendages were supposed
to play a secondary role by representing only 0.1% of the entire skin surface area (40).
Further studies have concentrated on the hair follicle as a possible pathway for both
systemic and localised drug delivery. Initial experiments on this idea were reviewed by Barry
(41), and more contemporary methods involve fluorescence microscopy and confocal laser
scanning microscopy applied to a variety of drugs in a range of vehicles. Therefore, a better
understanding of the structure and function of the hair follicle may lead to more rational
design of drug formulations to target follicular delivery (42). Efforts have been made to
improve techniques that enhanced follicular penetration rates, in order to reach the
maximum concentration of topically administration compounds in and around the hair follicle.
A study by Lademann et al in 2003 suggested that large particles (e.g., 750, 1500nm) may
be used to deposit high concentrations of drugs in the follicular duct, while small particles of
about 40 nm especially in barrier disrupted skin, may be used to release active moieties to
specific cell populations such as stem cells and multiple precursor cells (Fig1.4) (43), (44).
Also for evaluation and quantification of the transfollicular process, a knowledge of variations
of hair follicle parameters in various body sites is important. Different ways have been used
to investigate the hair follicle as a potential follicular reservoir such as cyanoacrylate skin
surface biopsy (15), (45). One aim of follicular targeting is to treat alopecia by growing new
follicles bioengineered from the stem cells of patients (46).

13
A 750nm, 1500nm B 40 nm particles
Fig 1.4 Penetration depths and capacity to penetrate the epithelium depend on the particle
size (43)
Infundibulum
Bulge Stem
cells

14
1.6 Skin penetration enhancement
Substances which enhance drug diffusion through the stratum corneum and viable
epidermis, are known as penetration enhancers, accelerants or promoters (47).
Extensive studies have focused on improving drug delivery through skin, by reducing the
resistance of the stratum corneum to drug penetration (27). However, the main problem is
in trying to improve the flux of drug through human skin. Therefore, it is essential to develop
new methods or formulations that could remove the skin barrier resistance reversibly and
accelerate the penetration of a drug. Numerous advances have included iontophoresis,
sonophoresis, microneedle, chemicals and vesicular systems such as liposomes,
transferosomes, neosomes etc. (48). Figure 1.5 shows the intercellular lipid domain of the
stratum corneum as the main target of action for chemical penetration enhancers (49).
Fig.1.5 Actions of penetration enhancers within the intercellular lipid domain (49)
1.6.1 Chemical enhancers
The use of chemical penetration enhancers over other strategies has many benefits,
including design flexibility with formulation chemistry. Chemical penetration enhancers
should ideally be pharmacologically inert, nontoxic, non-irritant, non-allergic, odourless,
tasteless, colourless, compatible with most drugs and excipients and inexpensive (49).
Moreover, they should work rapidly and act unidirectionally. That is, they should allow
therapeutic agents into the body while preventing the loss of endogenous material from the
body. In addition, the barrier properties should return both rapidly and fully once the

15
enhancers are removed from the skin. Another prerequisite feature is that they should be
cosmetically acceptable. A broad range of vehicles have been tested, such as alcohols and
polyols (ethanol, propylene glycol); surfactants, fatty acids (oleic oil), lactams (azone),
terpenes (limonene), sulfoxides (dimethyl sulfoxide) and esters (50).
Chemical enhancers work by different mechanisms:
A- Interaction with intracellular lipids. The enhancer disrupts the stratum corneum lipid
organisation, making it permeable (51, 52), thereby increasing the drug diffusion coefficient.
The enhancer substances jump into the bilayer, vibrating, translocating and increasing the
free volume available for drug diffusion. Without accelerant, the free volume fraction is
lowest (D lowest) near the bilayer interface. Many enhancers operate in this way such as
azone, terpenes, fatty acid and so on. It was believed that such enhancers would penetrate
into and mix homogenously with the lipid. Nonetheless, oleic acid and terpenes pool within
lipid domains at high loadings, permeable pores form, and polar molecules are allowed
access to the viable epidermis (53).
B- Interaction with intracellular protein and denaturation of keratin (54). Ionic surfactant
(sodium laurate sulphate (SLS)), and decylmethyl sulphoxide (DCMS) interact with keratin
in corneocytes, opening up the dense protein structure and making it more permeable and
consequently increasing diffusivity (51). Some molecules may also modify peptide/protein
material in the bilayer domain.
C- Increasing partitioning and solubility in the stratum corneum. A large number of solvents
entering the stratum corneum, change their solution properties by altering the chemical
environment, and thus increase the partitioning and solubility of a molecule in the stratum
corneum, for example, transcutol, ethanol and propylene glycol (24). In theory, nonsolvent
enhancers that mainly act to raise drug diffusivity by lipid action mechanism, should also
increase the partitioning coefficient of lipid drugs by disordering the lipid interfacial domain;
they increase the free volume and make a large fraction of the bilayer available for solute
partitioning (52).

16
Table 1.2 Common chemical penetration enhancers (CPEs); mechanisms, safety and side effects and their features (modified from (55))
Mechanism of
action
Example of CPE Safety and side effects Features
Interaction with intracellular lipids and produce lipid disruption and fluidisation.
1-Fatty acids (FA),
oleic acid
(unsaturated) and
Lauric acid
(saturated)
-High concentration
can cause skin
redness and mild
irritation.
-Disruption of the densely packed lipid that fill the extracellular spaces of stratum
corneum and form ion pairs.
-Increase drug solubility and partitioning.
-Promote both lipophilic and hydrophilic drugs delivery at high concentration.
-Previous study on hairless mouse and using hydrocortisone as a model has been
found that unsaturated F.As have high enhancement potency when have been used
in free form. Another study on Lauric acid and other saturated F.As, using different
physicochemical properties of model drugs has shown that drug solubilisation in the
vehicle increased partitioning, increased barrier disruption and solvent penetration in
the presence of F.As; the mechanism differ with the adjuvant, the drug and the vehicle.
2-Azone (1-dodecyl-azacycloheptan-2-one)
-May cause mild
irritation and toxicity at
low concentration
-Its Log O/W partitioning coefficient is 6.6. -Non polar, no protein interacting. -Promote penetration at low concentration (1-5%) for lipophilic and hydrophilic drugs. -It affects the fluidity of structured lipids in the intercellular channels of the skin.
3-Terpenes such as Menthol and 1-Carvone
-FDA classified them as
safe, free toxicity and
has low irritancy
potential.
-They are often the components of volatile oil. -They are a synergistic effect with co-solvents such as ethanol and propylene glycol. - Good penetration enhancer for both lipophilic and hydrophilic drugs. -Act by disrupting the ordered lipid structure of the stratum corneum and increase partitioning of the drug from its aqueous vehicle in the stratum corneum.

17
Interaction with
intercellular protein
(keratin), It is
believed that these
chemicals interact
with keratin into
coenocytes to alter
the diffusion
coefficient and
increase the
permeability.
However, other
studies claim that
these compounds
can also work on the
various regions such
as protein or peptide
in the domain of the
lipid to increase
permeability.
1-Decylmethyl
sulphoxide
(DCMS)
- It acts at low concentrations, even below 0.1%.
- It accelerates polar drug more than non- polar.
-DCMS use as a solvent, altering protein conformation and thus opening up aqueous
cannels and also increase lipid fluidity.
- DCMS use combination with 15% DCMS in PG or 4% in water.
2-Surfacants (Sodium
laurate sulphate (SLS))
-Cause some problems
such as swelling and
skin irritation.
-SLS disrupt the entire membrane affecting both lipid and protein structure.
-Previous study has been shown that 0.1-1% SLS solution grossly swell the stratum
corneum, uncoiling and extending alpha-keratin helices and the opening up the
protein-controlled polar pathway.
3-Polymers
(Dendrimers)
-No skin rotation has
been reported (safe).
-These chemicals act by interacting with keratin and lipid in the stratum corneum in
addition to increase the drug partitioning.
Increasing
partitioning and
solubility in the
stratum corneum
-They act by
extracting lipids from
the stratum corneum
and forming aqueous
channels within the
stratum corneum that
increase
permeability.
-Alcohol (ethanol)
High concentration
causes skin
dehydration.
-High concentration of ethanol causes extraction lipids from stratum corneum.
-Low concentration of ethanol alters the organisation of intercellular lipids, thus
increasing skin permeability.

18
1.6.2 Natural Enhancers
While various synthetic chemicals are often employed as penetration enhancers by the
pharmaceutical industry, some of these are associated with irritation and other adverse
effects. Consequently, safe and effective alternative enhancers are sought and there is
much interest in substances of natural origin. These offer potential advantages, such as
renewable mass production from sustainable resources and lower cost, depending on the
extraction process. Some examples of natural penetration enhancers are fatty acids,
essential oils, including terpenes and polysaccharides (56).
1.6.2.2 Terpenes
Terpenes are components of essential oils which are derived biosynthetically from isoprene
units. They are commonly used as penetration enhancers for hydrophilic and lipophilic drugs
in the pharmaceutical industry and are generally regarded as safe for use on human skin.
Different classes, various physiochemical features and various mechanisms of action make
these compounds useful for transdermal delivery of drugs. Terpenes are classified
according to the number of isoprene units (C₅H₈ ) in the molecule (56). It is reported that
hydrocarbon terpenes are less effective enhancers for hydrophilic drugs than ketone or
alcohol containing terpenes and the oxide terpenes have shown the greatest enhancement
activity with hydrophilic drugs (57). Eucalyptol has been found to increase the permeation
of several lipophilic drugs across hairless mouse skin (58). Some monocyclic monoterpenes
such as limonene and menthol enhanced the penetration of indomethacin (59) and
diazepam (60) respectively, across rat skin. Also, spectroscopic evidence has suggested
that terpenes may be retained within spatial domains in the stratum corneum lipids (53).
1.6.2.3 Fixed oils/ Fatty acids
These oils are formed from an aliphatic hydrocarbon chain which may be either saturated
or unsaturated and have a terminal carboxyl group. They are effective skin penetration
enhancers and considered nontoxic and safe for human skin use. Examples include fish oil,
fatty acids from algae and phospholipids (56). The effects of fatty acids as penetration
enhancers depends on their structure, alkyl chain and degree and type of unsaturation (61).
Aungst has extensively studied a range of fatty acids as penetration enhancers, and
suggests that saturated alkyl chain lengths of around C10-C12 attached to the polar head
group produce potent enhancers. Compared to penetration enhancers containing
unsaturated compounds, the bent cis configuration disrupts intercellular lipid packing more

19
than the trans arrangement (62), (63). The most commonly used unsaturated fatty acid is
oleic acid; it has been shown to increase the flux of many drugs such as salicylic acid 28-
fold and 5-flourouacil flux 65-fold through human skin in vitro (64).
1.6.3 Adverse effects of chemical and natural enhancers in skin
Although the goal is to use chemical penetration enhancers that have no adverse effects, it
is unlikely that chemicals that cause disruption to the organisation of the stratum corneum
lipids will have no measurable side effects. Penetration enhancers may cause reversible
damage or alter the physicochemical properties of the skin. One of side effects associated
with penetration enhancers is skin irritancy. In addition, enhancers may work by multiple
mechanisms and combinations of enhancers may induce synergistic responses. This lack
of understanding causes unease, without a known mechanism or understanding the barrier
repairs /restores over time. Another area that creates concern is the extrapolation of the
activity of enhancers to biological effects. The effects of enhancers on biological,
immunological and inflammatory cascades have received little attention.
Herbal preparations are becoming more popular and are frequently used for treatment of
dermatological conditions. Hence, dermatologists need to know about their potential to
cause adverse effects. A review by Ernst in 2000 (65) showed that many Chinese herbal
creams were adulterated with corticosteroids. Nearly all herbal medicines are mixtures of
chemicals and can cause allergic reactions and several can be responsible for
photosensitisation. Several herbal medicines, in particular Ayurvedic medicines, contain
arsenic or mercury that can produce skin lesions. Other common remedies that can cause
dermatological side-effects include St John's Wort, kava, aloe vera, eucalyptus, camphor,
henna and yohimbine. The adverse effects of herbal medicines are an important although
neglected subject in treatment of skin diseases, which deserves a more systematic
investigation.
1.6.4 Other methods of enhancing skin penetration
1.6.4.1 Water as penetration enhancer (Effect of hydration)
Water is the most used and safest way to increase the rate of percutaneous passage of
lipophilic drugs (66). The water content of human stratum corneum is normally about 15-
20% of the tissue by dry weight (54). Elevated stratum corneum hydration will swell the
compact structure of the stratum corneum continuously, absorbing as much as ten times the
dry weight, the water bound within the intercellular keratin, leading to a rapid increase in the

20
permeability and then a slow down to a steady- state diffusion (67). Hydration can be
increased by occlusion with parafilm or oils, waxes as components of ointment, and water
in oil emulsions which prevent transepidermal water loss (51). In occlusion, the water
content in the outer membrane can increase 400% compared to tissue dry weight (57). Solid
state nuclear magnetic resonance (NMR) has been used to show the movement of skin
compounds in the presence of water (68). Hikima and Maibach (69) examined the ratio of
fluxes and lag time for a range of solutes and concluded that hydration enhancements were
independent of lipophilicity and molecular weight. These finding were consistent with the
summary reported by Roberts and Walker, (70) who noted that the effects of hydration on
solute penetration were equivocal, with some reporting increasing of up to ten fold for some
substances, and others showing a very small effect. They commented that the major effect
of hydration may be in solubility in skin lipids, citing the greater enhancement of pure glycol
salicylate relative to methyl or ethyl salicylate by hydration using the human in vivo data of
Wurster and Kramer (71). Bucks and Maibach (72) found that lipophilic steroids showed
greater enhancement by occlusion than more polar ones.
1.6.4.2 Supersaturation
Supersaturation acts directly in the drug to increase skin permeation without alteration of
stratum corneum architecture. The mechanism of enhancement is by increasing the
thermodynamic activity of the drug in the vehicles. For example an increased driving force
for transit out of the formulation and into and across the stratum corneum (73). Once drug
concentration is increased above the saturation, the system become thermodynamically
unstable and the supersaturation formulation will be typically subject to recrystallization of
drug molecules and concomitant loss of the enhancing effect. Even when the stability of
supersaturation formulations is improved by the use of polymers (74, 75), stability remains
the limiting factor for achieving enhanced skin permeation, which can be seen only for as
long as the formulations are supersaturation (75). The dependence in thermodynamic
activity has been shown by Twist and Zatz (76). Silicone membrane was used to determine
the diffusion of saturated parabens in different solvents. As the saturated solubility of
parabens is different in these solvents, the concentration differed over two orders of
magnitude. However, thermodynamic activity was constant due to continuous saturated
conditions during the experiment and the same flux of paraben from all solvents was
obtained (24). There are several ways to achieve supersaturation such as, heating and
cooling (77), evaporation of a volatile components of the vehicle (78) or by mixing of two

21
solvents where the drug is significant more soluble in one solvent than the other (79) (54).
Also, water can act as an solvent in the case of it being imbibed from skin into the vehicles,
and the thermodynamic activity of the solute will increase (80). Many studies have reported
increases in drug flux 5 to 10 times that of supersaturated solutions (75, 81). A study by
Megrab et al (79) suggested that the oestradiol flux of a saturated system was increase 18-
fold through human skin. However, in silastic membrane the increase was only 13-fold. They
revealed that the components of the stratum corneum (fatty acids, cholesterol and ceramide
etc.) may produce an antinucleating effect thus stabilising the supersaturated system.
1.6.4.3 Physical enhancement
Physical penetration enhancement transiently circumvents the normal barrier function of the
skin and can permit the passage of macromolecules (82). There are different physical
methods for enhancement and they share the common aim of creating pathways for
molecules to penetrate. The most common strategy is iontophoresis. Iontophoresis is a
process using low DC current via an electrode in contact with the drug and the skin; a
grounding electrode completes the circuit. It works by two mechanisms, i) the driving
electrode repels ions: ii) the flow of the current may decrease the resistance of the skin so
as to increase its permeability. Another more recent method for delivery of macromolecules
is microneedle-enhanced delivery (83). This technique uses tiny needle-like structures to
produce pathways for macromolecules to penetrate the horny layer without breaking it. This
system can enhance the permeation, up to 100,000 fold, of macromolecules across the skin
(52), also offering painless delivery of drugs (84).
1.6.4.4 Vesicular system enhancement
Vesicular system enhancement uses prodrugs (85), chemical modifications (86), vascular
systems or colloidal particles (87) to increase skin penetration. From these techniques,
liposomes (phospholipid-based artificial vesicles), niosome (non-ionic surfactant vesicles)
and transferosomes which contain phospholipids, cholesterol and edge activators-
surfactant substances, such as sodium cholate, are extensively used to deliver drugs
through human skin. Such systems act by one of the following mechanisms: 1- penetration
of the stratum corneum by free drug or drug release from vesicles and then penetrates the
skin independently. 2- Release lipids from carriers and then interact with stratum corneum
lipids. 3- Improve drug uptake by skin. 4- Control drug input by different enhancement

22
efficiencies (82). These systems will be examined in more detail in section 1.9 which
describes some specific colloidal formulations.
1.7 Selection of drug models with optimal physiochemical properties for skin
penetration
Earlier studies (88, 89) found that solubility, lipid-water partition coefficient, melting point and
molecular weight are significant determinants of the permeability of drugs across the skin.
These studies confirm that the role of molecular weight, lipophilicity and melting point are
more important than the other properties.
1.7.1 Molecular weight and shape
Several prior studies (90, 91) found that molecular size (weight, volume and radius) have an
important role in determining skin permeability. Magnusson et al’s (92) study of a large
literature dataset has shown that molecular weight was the dominant determinant of
maximum flux (Fig 1.5). Also, it has been indicated that small molecular weight drugs
(preferred <500Da) can penetrate the skin more easily (93). A study in transdermal delivery
claims that molecular weight has an inverse relationship with diffusivity (D) of molecules;
this means that molecular weight increases exponentially when diffusivity decreases (94).
However, Mitragotri suggested a logarithm for KP based on molecular radius (95)
D=D⁰.e (-B.MW)
D⁰=diffusivity of molecule at zero molecular volume, B= constant.
Fig 1.6 Relationship between log Jmax and MW for solutes from aqueous solutions that
passed through human epidermal membranes (n=87). The regression line (solid line)

23
describes the relationship: log Jmax=-3.90-0.019 MW (p<0.001, r²=8.847). The dashed lines
show 95% confidence limits (92)
1.7.2 Lipophilicity
Previous studies claimed that drug lipophilicity is the most important determinant of skin
permeation with small compounds, such as alcohols (90), and phenols (96). Scheuplein (97)
found that the membrane-solvent partition coefficient of a drug was a measure of the
interaction and was an essential determinant of permeability. These partitioning coefficients
have been measured by partitioning between olive oil and water (97) and most frequently
by octanol and water (96) as a measure of drug lipophilicity. This is expressed as the log of
octanol-water partitioning coefficients, log KO/W or Log P. Pugh et al suggested that octanol
was the better solvent for drug partitioning into the stratum corneum (98). The interaction
between the drug and the lipid domain would be expected to have an important effect on
drug transport (99).
1.7.3 Hydrogen Bonding
It has been reported in many studies (100), (92) as a determinant of solute skin transport,
that hydrogen bonding related inversely with permeability, expressed in terms of the donor
and acceptor parameters, Hd and Ha (101). Previous work (102) thought that permeability
relied on the group’s number of hydrogen bonding found on the molecule while recent
studies (103) believed that permeability depended on mathematical treatments of each
hydrogen–bonding group and where the large numbered hydrogen bonding group was
found. Some reports considered that good penetration occurred with <5 hydrogen binding
sites. Studies have found that melting point also is a guide to the ability of hydrogen bonding
and often permeability depends on this parameter (92), (104). Lag time is relayed to the type
and number of hydrogen bonding groups, claiming an effect on diffusion due to solute
retardation by binding to polar head groups of the stratum corneum lipid domain. When
hydrogen bonding solutes bind with polar groups into the lipid bilayer, the non-hydrogen
groups diffuse freely across the lipid domain (105).
From the above, it is clear that lipophilicity and molecular size are essential determinants of
skin penetration as well as hydrogen bonding. A study done by Zhang et al (2009) on human
epidermal penetration used phenols with Log P values of 1.8-3.54 and molecular weight and

24
hydrogen bonding the same; they found that the fluxes were decreased for the high lipophilic
solutes which confirms the relationship between Jmax and Log P (106).
1.8 Assessment of skin penetration
1.8.1 Maximum Flux (Jmax)
The majority of research has assessed skin permeation in terms of permeability coefficients
(Kp, unit of distance/time, usually cm/h) from simple solutions, including aqueous solutions
(88, 99). Nonetheless, other studies have used maximum (or more correctly, saturated) flux
(Jmax, units of amount/area/time). Jmax describes the rate of penetration through a membrane
from saturated solutions or pure substances and as such, should theoretically be
independent of the vehicle (67, 107). On the other hand, KP is dependent upon the vehicle
in which the penetrant is dissolved. Therefore, Jmax allows a comparison to be made between
permeation data that may have been obtained under different vehicle conditions (108). Also,
the importance of using Jmax is that it is an invariant in the thermodynamic activity of the
permeation process, while Kp, relies on formulation applied to the skin (106).
1.8.2 Drug-vehicle-skin interactions
Any approach with topical delivery should start with consideration of the stratum corneum
and as mentioned in this review that the transport of molecules throughout the skin is a
complex phenomenon including chemical, physical and biological interactions. Higuchi was
the first one to progress equation about the relationship between thermodynamic activity
and skin absorption from ointments and creams (104). Barry has considered on relating
numerous models with percutaneous absorption from binary vehicles (105) and he has
defined the solute-vehicle–skin interaction depending on the theoretical model described by
Poulsen (2). First theory is, the ideal case when neither SC solubility nor diffusivity is affected
by either the vehicle or the drug. The maximum solubility of the drug in this vehicle, produced
release from that vehicle is not diffusion limited. High effect may be achieved by adding
other drugs with the similar action to the solvent system. Secondly (105), a vehicle or solute
leads to increase in drug solubility in the SC. For example, a study by Kadir et al (106)
suggested that addition of paraffin oil to propionic acid solutions increased the flux of either
theophylline or adenosine by enhancing the flux of propionic acid into the skin and
accelerating the partitioning of the solutes in the modified skin barrier. There are many
agents which can enhance or retard skin penetration. For instance, Azone analogue N-0915
has been identified as a penetration retarder, for which the mode of action is believed to be

25
an increase in the order of the SC lipids (107). Also, when the solubility of solute in the
vehicle increase, the flux should decline due to reduction in skin/vehicle partitioning
coefficient. There are many factors effect drug-vehicle-skin interaction relationship such as,
the applied area, type of the vehicle (induce hydration to the SC or not), solubility of the
solute in the vehicle, concentration of the solute in the vehicle, length time of contact
application and the condition of skin itself (the outer SC intact or not) (108). Understanding
barrier characteristic of the skin, can help understanding the mechanism of vehicles and
drugs on skin for optimized the design of formulations with solutes from the drug-vehicle-
skin interaction point of view.
1.8.3 Animal skin vs. human skin
Human skin is clearly the best choice but is not always readily available. Otherwise, pig skin
can be used because it shares vital permeation features with human skin (109). Rat skin is
2 to 10 times more permeable than human skin (110) which may result in an overestimation
of dermal absorption. Mouse, guinea pig or rabbit skins also have reduced barrier function
compared to human skin (57, 111). The use of cultured or reconstructed skin models is
under development and those systems are not yet recommended for in vitro testing on the
basis of their inadequate barrier function (112).
1.8.4 Skin integrity
Barrier integrity is essential for skin penetration experiments, and should therefore be
measured. This is achieved by either measuring the penetration of a marker molecule, such
as tritiated water, caffeine or sucrose, or by physical methods, such as determination of
Transepidermal water loss (TEWL) or Transcutaneous Electrical Resistance (TER).
1.8.5 Solubility parameters
Solubility parameters are useful to describe features of materials, such as compatibility,
miscibility and adsorption. Solubility parameter values for various excipients allow
forecasting of the magnitude of interactions between the compounds of formulation in
addition to the stability of a product. The term solubility parameter is connected to cohesive
energy density (CED), which indicates the energy of vaporisation per unit volume (113) and
is important to the pharmaceutical material scientist as it determines physicochemical
properties such as solubility and melting point of the solutes and excipients.

26
(1)
Where δ is the solubility parameter, R the gas constant, T the temperature, ΔH the enthalpy
of vaporisation, Vm the molar volume, and ΔE is the free energy of vaporisation. The
solubility parameter defined by Eq. (1) is named Hildebrand solubility parameter or
Hildebrand parameters (114). The supposed Hansen solubility parameter (HSP) is an
extension of the Hildebrand solubility parameter to polar and hydrogen bonding
systems(115). Hansen expected that cohesive energy could be measured as a sum of
contributions from dispersive (Ed), polar (Ep) and hydrogen bonding (Eh) interactions (113,
115-117).
Ecoh= Ed+ Ep+ Eh (2)
And the total solubility parameter (δT) is expressed as
δ²T = δ²d+ δ²p+ δ²h (3)
Where δd, δp, and δh represent the dispersive, polar and hydrogen bonding, respectively.
According to Hansen's interpretation, it can be expected that for the spontaneous mixing
process between liquids, the values of HSP compounds for one liquid should be close to the
other liquid. Various approaches can be used for estimating solubility parameters. The
solubility parameter can be found from energy of evaporation for volatile materials and, by
using Eq. (1), this only gives total solubility parameter not Hansen solubility parameters. For
low- or non-volatile compounds, measuring the solubility parameter straight from the energy
of evaporation, and comparing it to liquids, is impossible. The HSP can be used to describe
relationships among all kinds of organic and inorganic substances. and they have been
applied to many practical and industrial issues (118).
1.9 Colloidal delivery system
New nano-delivery systems such as emulsions, lipogels, rigid or flexible liposomes and so
on are being assessed for their ability to provide improved delivery of therapeutic,
prophylactic and diagnostic agents (119). Active ingredients in these nano-sized systems,
such as phospholipids, fatty acids, surfactants, etc., are combined to accelerate penetration
across the skin leading to more rapid absorption of the drug. While some of the older

27
chemical enhancers caused skin irritation (120), more recent systems using emulsions and
liposomes are more biocompatible (121). In addition to the components of the vehicle, it is
worth remembering that frequently a simple alteration in properties, such as pH, viscosity,
water or surfactant content in an emulsion, the relative amount of oil, droplet size; ionic
nature or the method of preparation may affect skin absorption. Table 1.3 provides some
examples of advanced formulations.
Table 1.3 Nano delivery systems (122).
Technique Principle Deliverables
Nano emulsion or
micro emulsion
System of water, oil and an
amphiphile, which forms a single
optically isotropic solution
Plasmid DNA, Ketoprofen,
amphorphine, oestradiol and
lidocaine
Liposomes Vesicles formed by one or multiple lipid
bilayers made of mixture of
phospholipids
Cosmetics, antibiotics and vaccine
adjuvants
Niosomes Mixture of non-ionic surfactants,
cholesterol and phospholipids
Tretinoin, peptide drugs and
zidovudine
Ethosomes Increase skin penetration by increasing
the elasticity of the lipidic vesicle,
contain up to 20-45% of ethanol
5-ALA(Aminoolevulinic acid),
salbutamol, finasteride and anti-HIV
therapy
Transferosomes Phospholipids with surfactants, that
acts to provide vesicle elasticity and
deformability
Vaccines, 5-fluoruoracil, IL-2
SECosomes or
nanosomes
Mixture of surfactants, ethanol,
cholesterol
siRNA
SLN(solid lipid
nanoparticles)
Produced with one single solid lipid
and surfactant , with perfect crystalline
lattice
CoQ-10, glucocorticoids, minoxidil
and oxybenzone
NLC(nanostructured
lipid carriers)
Produced with liquid and solid lipid and
surfactants, with distorted crystalline
lattice
Targeted tumour delivery,
phospholipaseA2 inhibitors,
benzocaine, lidocaine and psoriasis
treatment
Polymeric
nanoparticles
Consist of micro and nano spheres or
capsules developed to control the
release of the entrapped drug
Chlorhexidine, indomethacin,
melatonin and poorly soluble drugs
Microemulsions are clear, thermodynamically stable, isotropic liquid mixtures of oil, water
and surfactants, often in combination with a co-surfactant, with droplet sizes typically in the
10-100 nm range. They may be a water in oil (W/O) type, with water dispersed in a
continuous oil phase; oil in water (O/W), with the oil phase dispersed in a continuous

28
aqueous phase; or bi-continuous (121),(123). Multi-phase systems such as W/O/W or
O/W/O are also possible. In all kinds of emulsions, the interface is stabilised by a proper
combination of surfactants with or without co-surfactants. The choice of oils and surfactants
for an emulsion system for topical delivery is limited by their potential irritation and toxicity.
A significant difference between macro-emulsions and micro- or nanoemulsions is that
macro-emulsions are unstable thermodynamically and phase separation will eventually
occur. In addition, the macroemulsion droplet size will increase with time. Furthermore, the
larger droplet size in macroemulsions makes them cloudy, unlike the clear liquids formed
with the micro or nano-sized droplets. Whereas, macroemulsions require the input of energy
for preparation, microemulsions do not, because they are created spontaneously when their
components are brought into contact (121). While, nanoemulsions need Low or high energy
methods, in high energy methods, large disruption forces are provided by the use of
mechanical devices such as ultrasonicators, microfurdisers and high pressure
homogenizers which produce small droplet size. In low energy, no external force is provided,
instead it makes use of intrinsic physiological properties of the system for production of
nanoemulsions (124). Finally, macro-emulsions are more viscous than micro- or
nanoemulsions (121). Nanoemulsions combined some of the important requirements of a
liquid delivery system, such as thermodynamic instability, ease of formation, high viscosity
and small droplet size (125). They can be given orally, topically or nasally as an aerosol for
direct administration into the lungs (125). Characterisation of a microemulsion may be done
by assessing viscosity (126, 127) conductivity (127), NMR spectra (128) and dynamic light
scattering (DLS) (129). Benefits of topical nanoemulsions include avoidance of hepatic
metabolism, simple and convenient administration methods and immediate removal if
necessary (125). Nanoemulsions work by different mechanisms. For instance, denaturation
of intercellular proteins causes swelling and increased skin hydration (49), modification of
lipid bilayers reduces resistance to penetration (49) and changing the solvent properties of
the stratum corneum modify solute partitioning (49).
Liposomes are enclosed spherical vehicles that are organised in one or several concentric
phospholipidic bilayer/s with an aqueous core (130). The liposomal membrane is mainly
supported by edge activators, a type of surfactant, which destabilise the lipid bilayer of the
liposomes and increase the elasticity bilayer at the same time (131). Researchers believe
that the mechanism of action of liposomes on skin is by either forming a thin lipid film on the
skin surface or increasing the total lipid content of the skin by forming a liquid crystalline on
the uppermost skin layer (132). There are many types of liposomes such as niosome (non-

29
ionic surfactant) and transferosomes (phospholipid and surfactants) (133). The presence of
surfactant will increase the elasticity of the lipid bilayer (134). El Maghraby et al in 2006
reported that flexible liposomes are more effective in transdermal drug delivery (135). It is
reported that surfactants (edge activators) are able to impart deformability to the nano-
carrier which permits improved transcutaneous delivery of drugs (136). Liposomes are able
to exert various functions after topical administration (135). They are able to improve drug
deposition within the skin at the action site where the aim is to decrease systemic absorption
and thus reduce side effects. They also are able to produce targeted delivery to skin
appendages as well as having potential for transepidermal delivery (135).

30
Chapter 2
2.1 Aims and Hypotheses
My PhD project is entitled “Targeted skin delivery of topically applied drugs by optimised
formulation design”. Each of the three aims is detailed below.
Aim 1
A) To gain mechanistic understanding of the factors that drive skin permeation rates: Effect
of vehicle composition.
Hypothesis
The skin permeation flux of solutes should be identical unless the vehicle has affected the
skin.
B) To determine if enhanced solute permeation is due to combinations of increased solubility
of the compounds in the stratum corneum and increased diffusivity in the skin
In this study, we examined how skin penetration fluxes are affected by vehicles reported to
interact with the skin barrier to various degrees. We compared in vitro penetration fluxes
(Jmax) and solubilities in the vehicles (Sv) and stratum corneum (SSC) for caffeine, minoxidil,
lidocaine and naproxen from various solvent vehicles (with or without penetration
enhancers) to evaluate vehicle effects on permeability parameters. To separate and quantify
this effect, we also examined the relationship between maximum fluxes, solubility of solute
into the stratum corneum with the solubility parameters of the solvents. We also examined
whether the solvent of solutes uptake into the stratum corneum related to the solubility of
the solutes in the stratum corneum. Further study was done with caffeine to determine the
relationship between skin parameters and solubility parameters after pretreatment of skin
with a range of vehicles for 2 h.
Aim 2
To investigate the efficacy of incorporating penetration enhancers into advanced
formulations (e.g. flexible liposomes, microemulsions) for enhanced skin penetration /
permeation of model compounds.

31
Hypothesis
Targeted delivery of topically applied drugs to skin compartments, including hair follicles,
can be achieved by design of an optimised drug delivery system.
The second aim was to investigate the efficacy of incorporating penetration enhancers into
advanced formulations (e.g. flexible liposomes and microemulsions) on the skin permeation
of model compounds. I prepared and characterised nanoemulsion formulations with caffeine
(hydrophilic model) and naproxen (lipophilic model), using oleic acid and eucalyptol as
combined oil phases / penetration enhancers. The nanoemulsions were evaluated
according to their particle size, conductivity, viscosity and refractive index. Permeation
through epidermal membrane and full-thickness excised human skin was measured for
caffeine and naproxen. Evaluations were also undertaken to prove that the maximum flux of
the compounds may be enhanced by either increasing its solubility in stratum corneum lipid
components or by increasing the diffusivity of the solutes in the stratum corneum. The
amount of caffeine and naproxen in receptor fluid, extracts of tape strips (20 times) and skin
was quantified using high performance liquid chromatography (HPLC). The effect of
nanoemulsion formulation on the skin and the delivery route was determined using
Multiphoton microscopy (MPM). I also prepared and characterised liposomes,
transferosomes and neosomes with caffeine using oleic acid, eucalyptol and decyl glucoside
as combined edge activators. The liposomes were evaluated according to their particle size,
zeta potential, and dispersity index and drug efficiency. Permeation through full-thickness
excised human skin, retention in the stratum corneum and in the skin was measured for
caffeine. All samples were analysed using HPLC.
Aim 3
To investigate the effects of penetration enhancers on follicular penetration of model
compounds.
Hypothesis
Hair follicles are pertinent and efficient penetration pathways and reservoirs for topically
applied chemicals/drugs
This study aimed to develop substances which can be topically applied and able to penetrate
into hair follicles. In this aim, we have tested the penetration of model drugs (caffeine and
minoxidil) into hair follicles, using the same nanoemulsion and liposome formulations used

32
in Aim 2. For follicular localisation of drug molecules, we have been measured the amount
of drug that penetrates into the follicle by a technique available in our lab called follicular
casting (a non-invasive method). We examined targeted delivery of solute molecules
specifically to hair follicles, and the difference between normal, open and block hair follicles
in permeation using solution and nanoemulsion formulations. We also imaged the
penetration depth of Acriflavine (a dye) into the hair follicles and the area around the hair
follicles.

33
Chapter 3
Effect of Penetration Enhancers; Solution Studies
A- The impact of chemical penetration enhancers on permeation of solutes
through human epidermal membranes in vitro: Mechanistic investigations
B- The effect of vehicle pretreatment on the flux, retention and diffusion of
topically applied caffeine in vitro: understanding the relationship between
solvent and solute penetration using human skin.
3.1 Abstract
This study aimed to explore the mechanism by which skin permeation fluxes are affected by
a range of vehicles reported to interact with the skin barrier to different degrees. We
compared in vitro penetration fluxes (Jmax) and solubilities in the vehicles (Sv) and stratum
corneum (SSC) for caffeine, minoxidil, lidocaine and naproxen of various solvent vehicles to
evaluate the vehicle effects on permeability parameters. Solutions of four drugs with log P
ranging from -0.07 (caffeine) to 3.18 (naproxen) were dissolved in a range of vehicles and
applied to heat separated human epidermal membranes in Franz diffusion cells. The
vehicles either contained substances known to enhance skin penetration (e.g., ethanol, oleic
acid, eucalyptol, sodium lauryl sulphate) or were known to have no effect on skin. We
measured the solubility of these solutes in the vehicles (Sv) and in the stratum corneum
(SSC). We also examined whether the solubility of the solutes in the stratum corneum was
determined by the uptake of solvent, in which the solutes were dissolved, into the stratum
corneum. For the pretreatment study, the flux of caffeine was measured over 8 h through
heat-separated human epidermis pretreated for 2 h with water, 20, 40, 60% ethanol/water
and 5% oleic acid (OA), 5% eucalyptol (EU) or 1% SLS in 60% ethanol, mineral oil (MO)
and microemulsions with eucalyptol or silicone oil as the oil phase. Enhancement was
greater after pretreatment with vehicles containing penetration enhancers (oleic acid and
eucalyptol in 60% ethanol and in the eucalyptol microemulsion). For vehicles that had no
effect on the skin, the Jmax values were the same, regardless of the Sv. Similarly, there was
a linear relationship between Jmax and SSC for these vehicles, whereas vehicles containing
penetration enhancers caused deviations from linearity. The treatment study indicates that

34
the solubility model has a good correlation between the predicted SSC and measured SSC for
caffeine, minoxidil and lidocaine. It provides a linear shape with R2= 0.8, 0.7, 0.8,
respectively. However, we could not find the same correlation with naproxen. There was
significant enhancement following pretreatment with 40% and 60% ethanol vehicles relative
to controls (water and 20% ethanol, MO and silicone oil). The enhancement rate was related
to Hanson solubility parameters.
We conclude that the solubility of a solute in the skin can be correlated to its solubility in the
vehicle and the amount of vehicle absorbed by the stratum corneum. This study observed
that changes in both diffusivity and solubility of solute (caffeine) in the stratum corneum can
be affected by vehicle absorption in the skin.
3.2 Introduction
Topical administration products account for an increasingly significant percentage of solute
delivery candidate compounds under clinical evaluation (106). To be useful, topical products
must provide efficient delivery of actives to either the systemic circulation or to the skin, but
for most substances, the uppermost layer of the skin, the stratum corneum presents a
substantial barrier to their penetration. However, the barrier may often be overcome to meet
therapeutic or cosmetic goals by judiciously designed delivery systems (137), taking into
account the active’s potency, its physicochemical properties and the properties of the vehicle
and its interaction with the skin.
In this study we investigated some of the factors that influence the penetration and
permeation of topically applied substances through skin and sought to relate the observed
permeation fluxes to the physicochemical properties of the actives and the vehicles, as well
as the various active-vehicle, active-skin and vehicle-skin interactions that occurred.
Techniques previously applied to relate drug flux to solute-skin, solute-vehicle, and vehicle-
skin interactions include maximum flux studies, (64, 96), and relating the membrane fluxes
to solute uptake in the stratum corneum (138). The maximum or saturation flux (Jmax) is
defined as that occurring when a solute is applied to the skin in a saturated solution. The
important of Jmax is that for a given solute, it is an invariant in the thermodynamic description
of the permeation process (106). By definition, if neither the vehicle nor the solute affect the
membrane, the same maximum flux will be observed for the solute from a range of vehicles
regardless of its concentration in them (138). For example, Twist and Zatz (139) found that
methyl paraben had the same flux from a range of saturated solutions in different vehicles

35
applied to inert polydimethylsiloxane membranes that were not affected by the vehicles
(139). Physicochemical properties including molecular size, melting point, lipophilicity,
solubility and hydrogen bonding acceptor ability have been considered to be important in
determining permeation flux (89, 140).
Maximum flux is determined by the solubility of the drug in the stratum corneum (SSC)
according to the equation:
Jmax = D*.SSC = D*.KSCSV
Where D* is the diffusivity, SSC is the solubility in the stratum corneum, KSC is the epidermal
permeability coefficient and Sv is the solubility in the vehicles (138). Inspection of Equation
indicates that the maximum flux of a solute through the stratum corneum can be enhanced
by three mechanisms; (a) increasing the diffusivity of the solute in the stratum corneum; (b)
affecting the partitioning between the stratum corneum lipids and other stratum corneum
components; (c) increasing its solubility in the stratum corneum lipids (141). Accordingly,
skin absorption depends upon the physiochemical properties of the solutes (69), so that
lipophilic compounds penetrate more easily than hydrophilic compounds and lower MW
more easily than high MW (69). As well, the vehicle is a key factor in determining the efficacy
of transdermal drug delivery systems. Two main mechanisms are thought to govern the
effect of vehicles on the skin permeability of solutes; firstly, the force driving the drug into
the skin is due to thermodynamic activity of the solute in the vehicle (142) and secondly, the
skin barrier properties may be modified by interaction with the skin’s lipid and keratin
components (142).
Several technological advances have been made in the recent decades to overcome the
stratum corneum barrier and thereby deliver therapeutic substances accurately to their skin
target sites in sufficient quantities (82). One approach is to use chemical penetration
enhancers (27). These can act by various mechanisms, such as promoting supersaturation
in the vehicle, leading to an enhanced partitioning into stratum corneum (75), interaction
with intercellular lipids causing organisation disruption and thereby raising their fluidity,
extraction of stratum corneum lipids (143) or interaction with intercellular protein and
denaturation of keratin (64, 82). While it is well recognised that appropriately chosen
vehicles can enhance skin penetration (144), there appear to be limited studies examining
the effect of vehicles on the maximum flux of solutes across the skin.

36
In this study, we sought to explore the impact of various solution compositions on the skin
permeation of some model drugs. We compared in vitro maximum penetration fluxes (Jmax)
and solubilities in the vehicles (Sv) and in the stratum corneum (SSC) of four drugs (caffeine,
minoxidil, lidocaine and naproxen) having a range of lipophilicities (log P -0.07, 1.24, 2.44,
and 3.18, respectively). We used a range of solvent vehicles that were hypothesised to affect
the skin to differing degrees to evaluate vehicle effects on permeability parameters.
3.2.1 The solubility parameters concept
An understanding the interaction of between topically applied formulations and the skin
barrier is crucial for tailoring effective skin delivery. The equilibrium between solute solubility
in the vehicles, and in the skin and the complex interaction that may occur between different
components of the system will determine the targeting of topical solutes to the stratum
corneum, epidermis and deeper tissues (98, 104). Solubility parameters have been used as
tools to predict the adhesive and cohesive properties of materials and in particular have
been used to model and predict the permeation of topically applied substances (145). The
solubility parameter concept was developed by Hildebrand (146, 147), who assumed that
the solubility of the compounds rely on the cohesive energy, the square root of cohesive
pressure is Hildebrand’s solubility parameter, δ:
δ = √C = √∆Hv − RT ÷ Vm (1)
Where ∆𝐻𝑣 Is the heat of vaporisation, R is the gas constant, T is absolute temperature,
and Vm is the molar volume of the solvent. Frequently, the RT term is ignored because it
accounts for only 5-10% of the evaporation heat (145). If the solubility parameter of the
vehicle and the drug are similar, it is likely that the drug is soluble in the vehicle. This model
is an experimental development of the rule of “like dissolve like” (145). Hansen proposed a
model to extend Hildebrand’s model to polar and hydrogen binding systems and defined the
solubility parameter as:
δt2 = δd
2 + δp2 + δh
2 (2)
Where δt is the total or three dimensional solubility parameter, δd the dispersive, δp the polar
term and δh the hydrogen binding (115, 116, 148). The Hansen model describes solvents
as points in three dimensional space and the solute as a sphere of solubility (Fig 1). If the
solvent point is within the solute volume space, the solute is dissolved by the solvent and if
the solvent points are located outside the space volume, the solvent does not dissolve the

37
solute (148). Furthermore, Hansen (116) developed the solubility parameter equation to
express the distance (Ra), between two materials:
(Ra) 2 = 4 (δD2 - δD2)2 + (δP2 – δP2)2 + (δH2 – δH2)2 (3)
Equation 3 was improved from plots of experimental values where the constant “4” more
accurately represented the solubility data by encompassing the “good” solvents (148).
Various approaches to quantify solvent-solute and solvent-skin interaction using the
solubility parameter have been suggested (δ). The first attempt to characterise human skin
with the HSP was made visually using psoriasis scales of swelling when immersed for
prolonged time in different solvents (114). An extensive study has been done on permeation
through viable human skin that allowed placement of the solvents into groups according to
actual permeation rates (115). In the second part of this study (B: pretreatment) we explored
the use of HSPs in the particular solute-vehicle, solute-skin and vehicle skin interaction. We
used a hydrophilic model solute (caffeine) and a range of vehicles with differing HSPs. Heat
separated epidermal membrane was pretreated for 2 h with the chosen vehicle and an
aqueous solution of caffeine was applied for 8 h. Flux and drug retained in the epidermis
after the experiment was measured to determine the effect of the vehicle on the skin
parameters.
Figure 3.1 Hansen sphere in schematic form (145) (Copyright ©2011; Steven Abbott,
Charles Hansen and Hiroshi Yamamoto)

38
3.3 Materials and methods
3.3.1 Chemicals
Caffeine, naproxen, minoxidil, lidocaine, ethanol, OA, EU, polyethylene glycol 400
(PEG400) and polyethylene glycol 6000 (PEG6000) were purchased from Sigma-Aldrich
Pty. Ltd. (Sydney, Australia). MO was purchased from Galtex (Australia, Ltd), Glycerol from
Ajax (a division of Naplex industries, Australia Pty. Ltd), Polyoxyl-20 Oleyl ether (Volpo-N20)
was purchased from CRODA (Croda Europe Ltd, United Kingdom) and Polyoxyl 10 Oleyl
ether (Volpo-N10, also known as Brij96v) from UNIQEMA (Wilton, United Kingdom). All
chromatography reagents were analytical reagent grade.
The physicochemical properties of the model compounds are shown in Table 3.1.
Table 3.1. Physicochemical properties of model compounds [Molecular weight (MW g/mol);
Lipophilicity (Log P); Melting point (MP °C); Molar volume (MV), Solubility in aqueous
solution (Saq mg/L); Dissociation constant (pKa)]
Compound MWa Log Pa MPa MVb Saq pKaa
Caffeine 194.19 -0.07 238 151.8 21600 14
Minoxidil 209.25 1.24 248 214.6 2200 4.61
Lidocaine 234.34 2.44 68.5 89.7 4100 7.9
Naproxen 230.26 3.18 153 142.6 15.9 4.2
aChemIDplus advanced-chemical information with searchable synonyms, structure,
formulas http://chem.sis.nlm.nih.gov/chemidplus/
bHSPiP program (Steven Abbott of Steven Abbott TCNF Ltd; ©2011 Steven Abbott and
Johann Wiechers)
3.3.2 Sample analysis
All samples were analysed using a High Performance Liquid Chromatography (HPLC)
system consisting of Shimadzu SIL-20 a HT, CBM-20A system controller, a SPD-20A
detector, LC-20AD a pump and an auto injector. Samples were separated isocratically on a
Phenomenex Luna 5µm, C18 (150 x 4.6 mm) column using aqueous buffers containing

39
acetonitrile. Caffeine, minoxidil, lidocaine and naproxen were detected at 273, 281, 210 and
230 nm respectively.
3.3 3 Determination of Solubility in the vehicles (SV)
SV was determined in saturated solutions of the compounds in each vehicle (see Table 3 A-
D). An excess amount of the compound was added to 5 ml of the vehicle and the samples
were incubated in a water bath at 32°C for 24 h, with continuous magnetic stirring. The
samples were then centrifuged at 4000 rpm for 15 min and the supernatants were analysed
by validated HPLC methods, after appropriate dilution where necessary.
3.3.4 Human skin preparation
Human epidermal membranes were prepared from abdominal full-thickness skin using heat
separation (149 ). The skin was provided by a female donor (aged 57) following an elective
surgical procedure, with ethical approval granted by the University of Queensland Human
Research Ethics Committee (Approval No. 2008001342). The epidermal membranes were
stored at -20°C until use.
3.3.5 Determination of Solubility in the stratum corneum (SSC)
The stratum corneum was prepared from epidermal sheets by trypsin digestion (149). The
full-thickness skin was immersed in water at 60°C for 1 min, allowing the epidermis to be
teased off the dermis. The epidermis was floated overnight on a solution of 0.01% trypsin in
phosphate buffer saline at 37°C. The viable epidermis was scraped off using cotton buds
and the remaining stratum corneum membrane was rinsed several times with distilled water.
The isolated stratum corneum sheets were placed flat on aluminium foil and stored at -20°c
until use.
Discs of stratum corneum (4 replicates for each sample) were weighed before using. They
were then equilibrated in a saturated solution 1mL of each solute at 32°C for 24 h, according
to established methods (150). At the end of incubation period, the stratum corneum was
removed and blotted dry. It was extracted with 1 mL 70% ethanol/water for another 24 h, at
the same temperature used for equilibrium (32°C). The SSC was determined from the amount
of recovered model compound in the extraction fluid, measured by HPLC.
40
3.3.6 Solvent uptake in the stratum corneum
The total solvent uptake into the stratum corneum was determined from the weight
difference of a piece of the dry stratum corneum (about 0.6mg) soaked in individual solvents
(1 mL) for 24 h at 35°C. The stratum corneum pieces were wiped three times with Kimwipe
tissues before being weighed again.
3.3 7 In vitro permeation study
The epidermis has cut into discs and mounted stratum corneum side uppermost in horizontal
glass Franz type static diffusion cells, with 4 replicates for each vehicle. The cells had an
exposed surface area of 1.33 cm² and a receptor volume of approximately 3.4mL. To assess
the integrity of the epidermis, the donor and receptor chambers were filled with PBS
(phosphate buffered saline pH 7.4) and the cells equilibrated for 30 min before measuring
transepidermal electrical resistance with a standard multimeter. Skin samples with
resistance less than 20 kΩ were considered damaged and were discarded (151). Donor and
receptor chambers were then emptied and the receptor refilled with PBS. The diffusion cells
were placed in a Perspex holder in a water bath, to maintain the receptor phase temperature
at 35°C, and the receptors were constantly stirred with magnetic fleas (152).
The formulations (see Table 3.2) were applied to the skin at an infinite dose of 1 mL and the
donor chamber was covered with a glass cover slip to minimise evaporation from the donor
phase. Samples of receptor phase (200 µL) were removed at regular time points over the
next 8 h and replaced with same amount of fresh PBS. All samples were analysed using
HPLC.
3.3.8 In vitro pretreatment permeation study
The epidermis was cut into discs and mounted in horizontal glass Franz type static diffusion
cells, with 4 replicates for each vehicle. Receptor compartment was filled with phosphate-
buffered saline (pH7.4), maintained at 35°C in water bath. The donor doses (1 mL) of the
vehicles were added to the skin and left for 2 h., covered with glass cover slip to minimise
evaporation. Before application of caffeine, the excess vehicles were removed and the skin
surface washed three times with water before applying 1 mL of water containing 3% caffeine.
Samples of receptor phase (200 µL) were removed at regular time points over the next 8 h

41
and replaced with same amount of fresh PBS. All samples were analysed using a HPLC
system.
3.3.9 Prediction of maximum flux
The method used the software package HSPiP generously supplied by Stephen Abbott
(153) based on melting point and molar volume of the solute. The experimental temperature
and the HSPs of the solute and the stratum corneum was used to predict Jmax. The HSP
distance (Ra) can be related to the mutual solubility of two substances and is given by:
Ra = [4(δD1 – δD2)2 + (δP1 – δP2)2 + (δH1 – δH2)2]1/2 (4)
Where δD, δP and δH are the dispersion, polar and hydrogen-bonding HSPs of the interacting
substances.
This method relies solely on the properties of the solute and the interaction between it and
the skin. No account is taken for the effect of the vehicle on the skin.
3.3.10 Data analysis
The cumulative amount penetrating per skin surface area (Q, µg/cm²) was plotted against
time (h). The steady state flux JSS (µg/cm²/h) was derived from the slope of the linear portion
of the cumulative amount (Q) versus time (t) plot.
Jmax, applicable to saturated solutions, is derived from the experimental steady state flux by
correcting for the actual solubility in the vehicle (106). (Equation 5)
Jmax= JSS. Sv / CV (5)
Where Sv is the solubility in the vehicle and CV is the experimental vehicle concentration
used.
The diffusivity of solutes in the skin divided by path length (D*) was calculated from equation
6:
D*=Jmax / SSC (6)
The Partitioning of solute in the stratum corneum (KSC) was calculated from equation 7:
KSC= SC density * SSC/CV (7)

42
The permeability coefficient (KP) of caffeine was calculated from equation 8
KP = JSS / CV (8)
Total solubility parameters (3D) for each of the solvents were estimated by formulating
efficacy software (JW solution B.V., The Netherlands). The solubility parameter for human
skin was taken from the Hanson Handbook (148).
Data were analysed by one-way analysis of variance (ANOVA) with post-hoc comparisons
(Tukey in Graph pad); P<0.05 was considered to be significant.

43
Table 3.2. Composition of vehicles used.
Caffeinea Minoxidilb Lidocainec Naproxend
mineral oil
100% water 100% water *
25% PEG 6000 /water 35% PEG6000/water 25% PEG6000/water 40% PEG6000/water
35% PEG 6000/water 50% PEG6000/water 50% PEG6000/water 50% PEG6000/water
50% PEG 6000/water 75% PEG6000/water 75% PEG6000/water 75% PEG6000/water
90% PEG 6000/water
20% glycerol/water * 20% glycerol/water *
3% V20/water * 3% V20/water * 5% V20/water *
25% PEG400/water * 30% PEG400/water * 5% V20/30% PEG400/water*
20% ethanol/water
40% ethanol/water
60% ethanol/water 60% ethanol/water 60% ethanol/ water 60% ethanol/water
60% ethanol/water/5% V20 60% ethanol/water/5% V20
25% ethanol/water/25% V10/
60% ethanol/water/ 5% EU 60% ethanol/water/5% EU 60% ethanol/water/5% EU 60% ethanol/water/5% EU
60% ethanol/water/3% OA 60% ethanol/water/3% OA 60% ethanol/ water /3% OA 60% ethanol/ water /3% OA
60% ethanol/water/1%SLS 60% ethanol/water/1%SLS 60% ethanol/water/1%SLS 60% ethanol/water/1%SLS
Concentrations (w/v) of caffeine, minoxidil, lidocaine and naproxen were a3%, b2%, c2.5%, d2%, respectively, except those marked by *,
where the solutions are saturated. Vehicles containing ethanol are shaded, with those also containing penetration enhancers in a darker
shading.

3.4 Results
3.4.1 In vitro permeation of solutes across epidermal membranes
Figure 3.2 shows drug permeation through human epidermal membranes generally
reaching a steady state by 2-4 h. The estimated steady state and maximum fluxes (Jmax,
determined from Equation 5) for all solutes are summarised in Table 3.3 (A-D). Vehicles
containing EU, OA and SLS, all generally regarded as skin penetration enhancers, affected
permeation fluxes to varying extents. EU and OE significantly increased the flux of caffeine,
minoxidil and naproxen compared to all vehicles lacking penetration enhancers. There were
no significant differences in the presence of SLS (P>0.05, n=4). On the other hand, the
highest Jmax for lidocaine came from EU and SLS.

45
0
20
40
60
80
0 2 4 6 8
cum
ula
tive
am
ou
nt
(µg/
ml)
Time(h)
water
20%ethanol
25%PEG400
volpo
25%PEG6000
35%PEG6000
50%PEG6000
90%PEG6000
A1 A2
0
500
1000
1500
2000
2500
3000
3500
0 1 2 3 4 5 6 7 8
cum
ula
tive
am
ou
nt
(µg/
cm²)
Time (h)
SLS60% ethanolEUOA5%volpo +60%ethanol20% glycerol40% ethanol
0
100
200
300
400
500
600
700
800
0 2 4 6 8
cum
ula
tive
am
ou
nt
(µ
g/cm
²)
Time (h)
60%ethanol
OA
EU
SLS
0
2
4
6
0 2 4 6 8
cum
ula
tive
am
ou
nt(
ug/
ml)
Time (h)
volpo
Glycerol
35% PEG6000
50% PEG6000
75% PEG6000
B1 B2
0
200
400
600
800
1000
1200
1400
1600
1800
0 2 4 6 8
cum
ula
tive
am
ou
nt
(µg/
cm²)
Time (h)
60%ethanol
OA
EU
SLS
0
100
200
300
0 2 4 6 8
cum
ula
tive
am
ou
nt
(µg/
cm²)
Time (h)
water
25%PEG6000
50% PEG6000
75%PEG6000
30%PEG400
MO
C1 C2
0
1000
2000
3000
0 2 4 6 8
cum
ula
tive
am
ou
nt
(µg/
cm²)
Time(h)
OA
60%ethanol
EU
SLS
5%volpo+60%ethanol
0
20
40
60
80
100
120
0 2 4 6 8
cum
ula
tive
am
ou
nt
(µg/
cm²)
Time(h)
volpo5%volpo+30%PEG40025%Brij 9640%PEG600050%PEG600075%PEG6000
D1 D2

46
Figure 3.2 In vitro percutaneous permeation through epidermal human skin: A1- caffeine
with penetration enhancer vehicles, A2- caffeine with controls; B1-minoxidil with penetration
enhancer vehicles, B2- minoxidil with controls; C1- lidocaine with penetration enhancer
vehicles, C2- lidocaine with controls; and D1- naproxen with penetration enhancer vehicles,
D2- naproxen with controls (Mean± SEM, n=4).
Symbols: Black, inert controls; Red, oleic acid (OA); Green, eucalyptol (EU); Blue, sodium
lauryl sulphate (SLS); Yellow, ethanol vehicles; Orange, glycerol; Grey, 5% volpo in 30%
PEG400/water.
Table 3.3.
A: Caffeine
Vehicle
% Active Sv
(mg/cm3)
JSS
(µg/cm²/h)
Jmax
(µg/cm²/h)
SSC
(mg/cm3)
D* (x104
cm/h)
H2O 100% 3 31.3±1 2.1±.16 2.2±06 21.6±2.6 1.0
H2O / 25% PEG6000 3 98.5±8.2 2±2.0 6.5±3.7 98.2±0.3 0.7
H2O / 35% PEG6000 3 85.2±5.2 3.5±1.8 6.7±3.7 68.2±0.3 0.2
H2O / 50% PEG6000 3 57.4±9.5 1.1±.16 2.1±0.9 49.5±0.3 0.3
H2O / 90% PEG6000 3 17.9±0.4 2.1±1.6 1.2±0.7 60.2±0.3 0.2
H2O / 20% glycerol Sat’d 48.1±4.5 10.5±4.0 35.0±11.6 22.9±16.2 15.3
H2O / 3% V10 Sat’d 69.4±7.8 1.6±1.4 5.3±5.0 51.9±25.7 1.0
H2O / 25% PEG400 Sat’d 72.8±6.7 4.7±3.0 15.5±13.0 17.5±8.3 8.8
ethanol 20% / H2O 3 48.0±1.0 2.4±0.5 3.8±1.4 39.5±9.0 1.0
ethanol 40% / H2O 3 71.9±1.7 11.8±3.0 28.3±8.0 54.5±24.5 5.2
60% ethanol/H2O/5% V10 3 54.6±0.6 33.9±3.5 61.8±6.5 105.5±9.9 5.9
60% ethanol/ H2O 3 81.5±1.1 9.4±.48 25.6±2.5 151.9±34.4 1.7
60% ethanol/ H2O /1%SLS 3 74.8±1 18.1±8.8 45.2±6.0 100.9±23.5 4.5
60% ethanol/ H2O / 5% EU 3 98.3±7.3 310.0±10.4 1015.8±28.9* 254.5±66.0 39.9
60% ethanol/ H2O /3% OA 3 56.0±2.5 368.2±17.0 692.6±24.0* 155.9±44.7 44.4
(Mean ± 95% confidence intervals, n=4)

47
B: Minoxidil
Vehicles
%
Active
Sv
(mg/cm3)
JSS
(µg/cm²/h)
Jmax
(µg/cm²/h)
SSC
(mg/cm3)
D* (x104
cm/h)
35% PEG6000/water 2 15.5±2.3 0.4±0.1 0.3±0.1 13.2±0.4 0.2
50% PEG6000/water 2 39.0±0.9 0.3±0.1 0.3±0.1 12.3±4.2 0.5
75% PEG6000/water 2 73.0±1.2 0.3±0.0 0.3±0.1 15.5±0.4 0.2
20%glycerol/water Sat’d 5.9±0.1 0.1±0.1 0.1±0.1 4.6±1.0 0.3
3%Volpo+water Sat’d 21.6±1.2 0.1±0.1 0.1±0.1 5.3±0.6 0.2
60% ethanol/water 2 34.7±2.7 2.2±1.4 3.7±1.5 44.0±5.3 0.5
60% ethanol/water/1%SLS 2 51.4±0.7 7.8±4.7 20.0±12.2 62.6±10.4 3.2
60% ethanol/water/5% EU 2 56.0±0.6 4.3±2.2 101.6±6.2* 68.7±4.7 14.8
60% ethanol/water/3% OA 2 71.4±8.7 9.3±26.4 332.96±54.2* 133.8±8.6 24.9
(Mean ± 95% confidence intervals, n=4)
C: Lidocaine
Vehicles
%
Active
Sv
(mg/cm3)
JSS
(µg/cm²/h)
Jmax
(µg/cm²/h)
SSC
(mg/cm3)
D* (x104
cm/h)
mineral oil 2.5 44.9±2.3 7.6±0.4 7.6±0.4 29.9±4.7 2.5
100% water sat’d 7.2±0.7 21.5±12.0 6.1±2.9 11.6±2.7 5.3
25% PEG6000/water 2.5 23.3±0.2 33.0±9.3 15.4±11.1 69.3±3.8 2.2
50% PEG6000/water 2.5 47.7±3.0 14.9±3.2 14.2±12.7 49.2±2.7 2.9
75% PEG6000/water 2.5 94.9±4.2 26.3±14.0 11.4±18.7 48.7±2.8 2.3
30% PEG400/water sat’d 67.1±10.7 5.6±2.7 8.2±2.8 19.0±0.4 4.3
60% ethanol/ water 2.5 47.9±0.4 38.4±8.5 73.5±16.3 97.1±12.4 7.6
60% ethanol/water/1%SLS 2.5 97.4±21.0 71.9±11.4 280.3±39.4 114.1±22.5 21.7
60% ethanol/ water /5% EU 2.5 64.0±6.8 185.8±17.2 475.7±41.3 133.7±27.6 33.4
60% ethanol/ water /3% OA 2.5 62.8±13.0 72.2±28.7 181.4±64.2 107.4±11.6 15.0
(Mean ± 95% confidence intervals, n=4)

48
D: Naproxen
Vehicles
%
Active
Sv
(mg/cm3)
JSS
(µg/cm²/h)
Jmax
(µg/cm²/h)
SSC
(mg/cm3)
D* (x104
cm/h)
40% PEG6000/ H2O 2 45.5±11.7 3.4±1.4 3.5±0.8 9.6±3.5 3.7
50% PEG6000/ H2O 2 66.8±5.6 2.0±0.1. 5.6±0.7 12.0±4.0 4.6
75% PEG6000/ H2O 2 84.2±11.4 2.0±0.1. 5.1±2.8 16.6±7.0 3.1
5% volpo/ H2O Sat’d 15.1±11.9 2.3±1.3 2.3±2.0 3.5±0.2 6.2
5%volpo/30%PEG400/H2O Sat’d 76.6±8.0 13.4±7.0 13.7±6.6 26.0±0.9 5.2
Ethanol/V10/H2O (1/1/2) 2 25.9±6.9 4.1±0.9 5.3±1.4 9.5±1.6 5.6
60% ethanol/ H2O /5% V10 2 51.9±0.7 14.5±1.2 37.7±3.2 37.8±2.4 9.9
60% ethanol/ H2O 2 50.9±1.1 9.2±1.5 23.4±3.9 18.3±5.0 12.8
60% ethanol/ H2O / 1%SLS 2 55.3±16.0 14.8±2.4 41.0±6.6 23.9±90 17.1
60% ethanol/ H2O / 5% EU 2 20.7±14.6 72.5±7.0 74.9±12.3 38.7±1.2 11.7
60% ethanol/ H2O /3% OA 2 23.9±12.0 373.3±20.5 446.3±37.9 55.6±1.8 80.2
(Mean ± 95% confidence intervals, n=4)
3.4.2 Impact of formulation on active solubility in the stratum corneum, maximum flux
and derived diffusivity
To investigate some of the determinants of increased flux in these vehicles, we examined
the relationships between some of the parameters in Table 3.3 (A-D). As shown in Figure
3.3 (A-D), although there were considerable differences in vehicle solubility (Sv), Jmax was
independent of Sv, for all control vehicles. Particularly those containing ethanol and may
alter the properties of the skin barrier those Figure 3.3E shows Jmax enhancement for
vehicles containing ethanol, EU, OA and SLS, expressed as a ratio:
Jmax / Jmax (50% PEG6000 control).
The greatest enhancement was seen with EU and OA, predominantly with the more
hydrophilic solutes, caffeine and minoxidil.

49
Figure 3.3. A-D, Jmax versus solubility in the vehicles (Sv). A, Caffeine; B, Minoxidil; C,
Lidocaine; D, Naproxen.
The dashed lines represent the mean of the control values. E: Jmax enhancement ratio
compared to control (50%PEG6000/water) for selected vehicles. (Mean ± 95% confidence
intervals, n=4)
Symbols: Black, inert controls; Red, oleic acid (OA); Green, eucalyptol (EU); Blue, sodium
lauryl sulphate (SLS); Yellow, ethanol vehicles; Orange, glycerol; Grey, 5% volpo in 30%
PEG400/water.
0.1
1
10
100
1000
10000
0 20 40 60 80 100 120
J ma
xes
tim
ated
(µ
g/cm
²/h
)
Sv (mg/mL)
0.01
0.1
1
10
100
1000
0 20 40 60 80
J ma
xes
tim
ated
(µ
g/cm
²/h
)
Sv (mg/mL)
1
10
100
1000
0 20 40 60 80 100J ma
xes
tim
ated
(µ
g/cm
²/h
)
Sv (mg/mL)
0.1
1
10
100
1000
0 50 100
J ma
xes
tim
ated
(µ
g/cm
²/h
)
Sv (mg/mL)
A B
C D
E
0
200
400
600
800
1000
1200
J max
Enh
ance
me
nt
EU
OA
SLS
60% EtOH
Caffeine Minoxidil Lidocaine Naproxen
E

50
As expected for vehicles that do not alter the properties of the skin, there was little variation
in diffusivity (D*) amongst the control solutions for all four solutes (see Fig. 3.4A-D). Figure
3.4E shows D* enhancement for vehicles containing ethanol, EU, OA and SLS, expressed
as a ratio: D* / D* (50% PEG6000 control). The greatest enhancement in diffusivity was
again seen with caffeine and minoxidil, applied in the EU and OA vehicles. Smaller effects
were seen with SLS on caffeine diffusivity and with OA on naproxen.
Figure 3.4. A-D, Effective diffusivity, D* (= D/h) versus solubility in the vehicles (Sv). A,
Caffeine; B, Minoxidil; C, Lidocaine; D, Naproxen.
The dashed lines represent the mean of the control values. E: D* enhancement ratio
compared to control (50%PEG6000/water) for selected vehicles. (Mean± SEM, n=4)
Symbols: Black, inert controls; Red, oleic acid (OA); Green, eucalyptol (EU); Blue, sodium
lauryl sulphate (SLS); Yellow, ethanol vehicles; Orange, glycerol; Grey, 5% volpo in 30%
PEG400/water.
0.000001
0.00001
0.0001
0.001
0.01
0 20 40 60 80 100 120
D*
(cm
/h)
Sv (mg/cm3)
0.000001
0.00001
0.0001
0.001
0.01
0 20 40 60 80
D*
(cm
/h)
Sv (mg/cm3)
0.0001
0.001
0.01
0.1
0 20 40 60 80 100
D*
(cm
/h)
Sv (mg/cm3)
0
50
100
150
D*
Enh
ance
me
nt EU
OASLS60% EtOH
Caffeine Minoxidil Lidocaine Naproxen
0.00001
0.0001
0.001
0.01
0 20 40 60 80 100
D*
(cm
/h)
Sv (mg/cm3)E
A
D C
B

51
We next explored the relationships between maximum flux and solubility in the stratum
corneum. Rearranging Equation 6, we obtain Jmax = SSC. D*, indicating that if D* is constant,
there should be a linear relationship between Jmax and SSC (with a slope of D*, or D/h). We
have already seen that for our control vehicles, there was a minimal variation in D*. Figure
3.5 illustrates the observed linear relationships between Jmax and SSC for each solute and
the control vehicle, with R2 values ranging from 0.67 to 0.88. Vehicles containing ethanol
and penetration enhancers show elevated Jmax values that do not fit the relationships seen
with the control vehicles, reflecting the effects on diffusivity seen in Figure 3.5.

52
Figure 3.5 Jmax versus solubility in the stratum corneum, SSC for A, Caffeine; B, Minoxidil;
C, Lidocaine; D, Naproxen (Mean ± SEM, n=4).
Symbols: Black, inert controls; Red, oleic acid (OA); Green, eucalyptol (EU); Blue, sodium
lauryl sulphate (SLS); Yellow, ethanol vehicles; Orange, glycerol; Grey, 5% volpo in 30%
PEG400/water.
3.4.3 Mechanism underpinning the differential enhanced uptake of actives into the
epidermis
We investigated the hypothesis that stratum corneum solubility was related to the amount
of vehicle taken up by the membrane, carrying with it an amount of solute determined by its
solubility in the vehicle. Vehicle uptake into the stratum corneum was determined by
measuring the weight of pieces of stratum corneum before and after incubation in the various
vehicles. Solute uptake was then estimated from this and the measured solubility of the
R² = 0.6691
0
25
50
75
0 60 120 180 240 300
Ssc (mg/cm3)
600
800
1000
1200
J ma
x est
imat
ed (
µg/
cm2 /h
)
R² = 0.7195
0
20
40
0 20 40 60 80 100 120 140
Ssc (mg/cm3)
50
150
250
350
450
550
J ma
x es
tim
ated
(µ
g/cm
2/h
)
R² = 0.8595
0
25
50
0 20 40 60
Ssc (mg/cm3)
50100150200250300350400450500
J max
est
imat
ed (
µg/
cm2/
h)
A
C D
J max
est
imat
ed (
µg/
cm2
/h)
B
R² = 0.8845
0123456
0 50 100
SSC (mg/cm3)
10
110
210
310
410

53
solutes in each vehicle (Sv). The relationships between solute solubility in the stratum
corneum from each vehicle (SSC) and the vehicle uptake or solute uptake are shown in
Figures 3.6 and 3.7, respectively. There was a good correlation for both parameters with all
compounds, with the exception of naproxen uptake, where the values for the EU and OA
vehicles were seen as outliers.
Figure 3.6 Solubility in the stratum corneum (SSC) versus predicted solvent uptake values
from a range of vehicles (Mean, n=4) for A, Caffeine; B, Minoxidil; C, Lidocaine; D,
Naproxen.
Symbols: Black, inert controls; Red, oleic acid (OA); Green, eucalyptol (EU); Blue, sodium
lauryl sulphate (SLS); Yellow, ethanol vehicle; Orange, glycerol; Grey, 5% volpo in 30%
PEG400/water.
D C
y = 55.739xR² = 0.7789
0
50
100
150
200
250
300
0 1 2 3 4
S SC
(mg/
mL)
solvent uptake (mg)
y = 26.382xR² = 0.5609
0
20
40
60
80
100
120
140
0 1 2 3 4S S
C(m
g/m
L)
solvent uptake (mg)
y = 42.459xR² = 0.7741
0
50
100
150
0 1 2 3 4
S SC
(mg/
mL)
solvent uptake (mg)
y = 13.67xR² = 0.5578
0
10
20
30
40
50
60
0 1 2 3 4
S SC
(mg/
mL)
solvent uptake (mg/mL
A B

54
Figure 3.7. Solubility in the stratum corneum (SSC) versus predicted solute uptake values
from range of vehicles for A, Caffeine; B, Minoxidil; C, Lidocaine; D, Naproxen (Mean, n=4).
Symbols: Black, inert controls; Red, oleic acid (OA); Green, eucalyptol (EU); Blue, sodium
lauryl sulphate (SLS); Yellow, ethanol vehicle; Orange, glycerol; Grey, 5% volpo in 30%
PEG400/water.
To predict stratum corneum solubility of the solutes, an optimal regression was found when
it was assumed that all the dissolved solute in the vehicle was taken up into the stratum
corneum as defined by:
SSC (predicted) = SSC (skin, control) + Sv * Vup/VSC (9)
Where Vup is the volume of vehicle taken up, VSC is the measured volume of the stratum
corneum used, and
SSC (skin, control) = SSC (control, observed) - Sv (control) * Vup (control) /VSC (10)
Predicted versus experimental SSC plots are shown in Figure 3.8. Good correlations were
seen for caffeine, minoxodil and lidocaine, with R2 values of 0.81, 0.80 and 0.84 respectively,
and 0.69 for the combined dataset of all actives. The correlation for naproxen was poor (R2
= 0.02). Equation 9 under predicted SSC in each case, as shown by most of the points falling
below the line of identity. The underproduction is also indicated by values of Lin’s
C D
A B
y = 692.1xR² = 0.8991
0
50
100
150
200
250
300
0 0.1 0.2 0.3 0.4
S SC
(mg
/mL)
Solute uptake (mg/mL)
y = 607.81xR² = 0.7377
0
50
100
150
0 0.1 0.2 0.3
S SC
(mg
/mL)
Solute uptake (mg/mL)
y = 254.69xR² = 0.0333
0
10
20
30
40
50
60
0 0.05 0.1 0.15 0.2
S SC
(mg
/mL)
Solute uptake (mg/mL)
y = 482.78xR² = 0.8497
0
50
100
150
0 0.1 0.2 0.3
S SC
(mg
/mL)
Solute uptake (mg/mL)
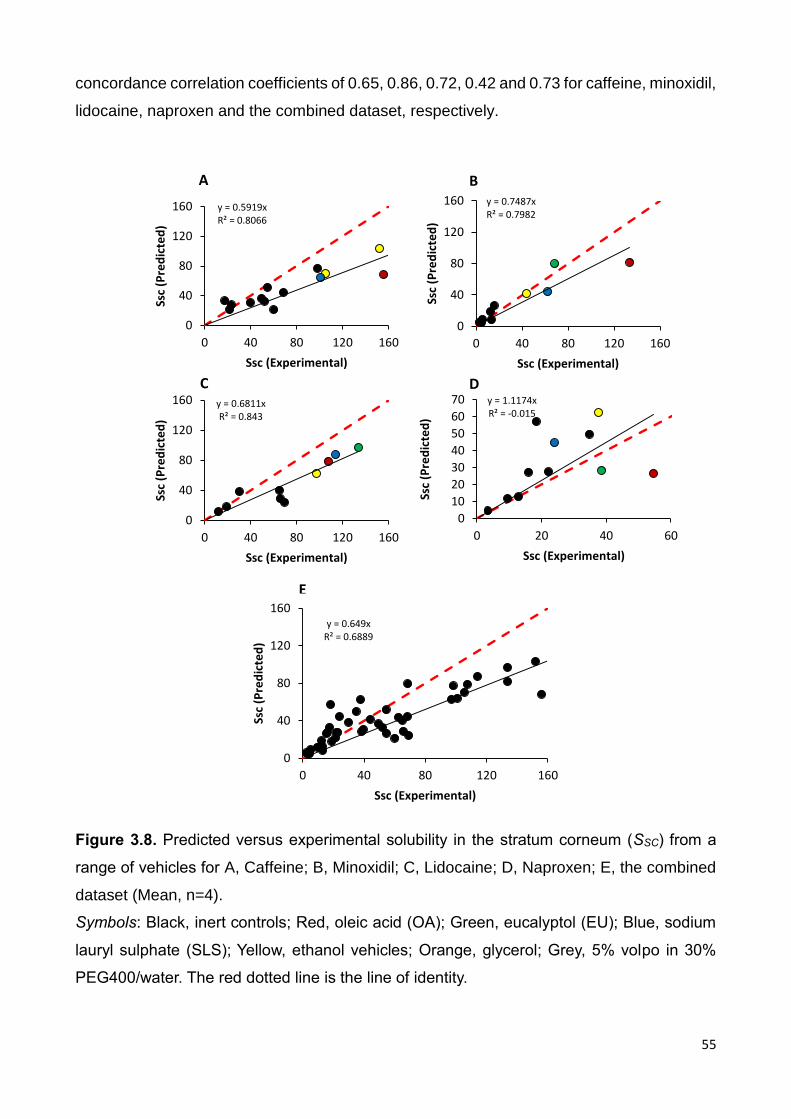
55
concordance correlation coefficients of 0.65, 0.86, 0.72, 0.42 and 0.73 for caffeine, minoxidil,
lidocaine, naproxen and the combined dataset, respectively.
Figure 3.8. Predicted versus experimental solubility in the stratum corneum (SSC) from a
range of vehicles for A, Caffeine; B, Minoxidil; C, Lidocaine; D, Naproxen; E, the combined
dataset (Mean, n=4).
Symbols: Black, inert controls; Red, oleic acid (OA); Green, eucalyptol (EU); Blue, sodium
lauryl sulphate (SLS); Yellow, ethanol vehicles; Orange, glycerol; Grey, 5% volpo in 30%
PEG400/water. The red dotted line is the line of identity.
E
y = 0.5919xR² = 0.8066
0
40
80
120
160
0 40 80 120 160
Ssc
(Pre
dic
ted
)
Ssc (Experimental)
y = 0.7487xR² = 0.7982
0
40
80
120
160
0 40 80 120 160
Ssc
(Pre
dic
ted
)
Ssc (Experimental)
A B
y = 0.6811xR² = 0.843
0
40
80
120
160
0 40 80 120 160
Ssc
(Pre
dic
ted
)
Ssc (Experimental)
C y = 1.1174xR² = -0.015
0
10
20
30
40
50
60
70
0 20 40 60
Ssc
(Pre
dic
ted
)
Ssc (Experimental)
D
y = 0.649xR² = 0.6889
0
40
80
120
160
0 40 80 120 160
Ssc
(Pre
dic
ted
)
Ssc (Experimental)

56
3.4.4 Can the permeation fluxes of actives from various vehicles be predicted by a
solubility parameter approach?
We used a method based on physicochemical properties of the solutes and the HSP
interaction between the solute and the skin to predict Jmax. This method takes no account of
the properties of the vehicle or its effect on the skin. For the inert control vehicle (50% PEG-
6000/water) there was a good correlation (R2=0.9439) between predicted and observed log
Jmax for the four solutes (Fig. 3.9, white symbols). The regression line approximated the line
of identity, with a Lin’s concordance correlation coefficient of 0.9007. Minoxidil applied in the
control vehicle 50% PEG-6000/water (white circle) appears to be an outlier, with a smaller
observed flux than predicted.
Figure 3.9 also shows a comparison between the control vehicle and the vehicles containing
60% ethanol and the penetration enhancers EU, OA and SLS. The increased fluxes
observed with these enhancing vehicles were not matched by the predicted values,
supporting the view that the vehicles have modified the epidermal barrier.
Figure 3.9. Log Jmax (predicted using Hansen solubility parameters by method of Abbott) vs
log Jmax (observed) for caffeine (triangles), minoxidil (circles), lidocaine (diamonds) and
naproxen (squares) applied to human epidermal membranes in different vehicles.
Vehicles are 50% PEG6000/water (control, white symbols), 60% ethanol/water (yellow),
60% ethanol/water/1% SLS (blue), 60% ethanol/water/3% OA (red), 60% ethanol/water/5%
Eucalyptol (green).

57
3.4.5 Caffeine vehicle solubility
The solubility of caffeine in a range of solvents (Sv) (16.6-47.8) is shown in Table 3.4. Figure
3.10 shows that with the particular solvents chosen for this study, a better relationship
between solubility and δv was seen when the Sv increased as the solubility parameter for the
vehicle approached that of caffeine. (δtotal=25). This study agrees with a study done by Cross
in 2001 on silicone membrane with hydrocortisone (104) when they claimed that the best
relationship between solubility and δtotal may not be linear.
Figure 3.10. Relationship between experimentally determined caffeine solubility in each
solvent (Sv) and solvent solubility parameter (δ
V). (The dashed line is the total solubility
parameter area for caffeine.)
3.4 6 Penetration and solubility data
In vitro permeability of caffeine through excised human skin was examined after
pretreatment with different vehicles for 2 h. Fig 3.11 shows that drug permeation generally
reaches a steady state in 1-2 h, allowing a steady state flux to be established.
1 5 2 0 2 5 3 0 3 5 4 0 4 5 5 0 5 5 6 0
0
2 0
4 0
6 0
8 0
1 0 0
1 2 0
v
Sv
(m
g/c
m3
)

58
Figure 3.11 Permeation profiles of caffeine through epidermal human skin after pre-
treating skin for 2 h with a range of vehicles (Mean ± sd, n=3).
OA (oleic acid in 60%ethanol/water); EU (eucalyptol in 60%ethanol/water); SLS (sodium
lauryl sulphate in 60%ethanol/water); MO (mineral oil); SO (silicone oil), MEU
(Eucalyptol/Volpo-N10/water/ethanol).
The estimated permeation parameters for all solutes are summarised in Table 3.4. OA and
EU formulations and SLS significantly increased the flux of caffeine through the epidermal
human skin compared to the other vehicles. In fact, these reported the highest Jmax for
caffeine. There were no significant differences in the presence of 60% ethanol (P<0.05,
mean ± SD, n=4). Generally, the effect of the Eucalyptol/Volpo-N10/water/ethanol (MEU)
vehicle on the diffusivity (D*, determined from Equation 6), of caffeine seems to be larger
than those on D* with other vehicles (Table 3.4). The effect of the penetration enhancer
vehicles (EU, OA, SLS and 60% ethanol/water) on the partitioning (KSC determined from
Equation 8), of caffeine seems to be larger than those on KSC for other vehicles (Table 3.4)
The effect of pretreatment vehicles on caffeine flux is summarised in the Table 3.4.
0
50
100
150
200
250
300
350
400
0 1 2 3 4 5 6 7 8
cum
ula
tive
am
ou
nt
(µg/
cm²)
Time(h)
OA EU
SLS Water
20% ethanol 40% ethanol
60% ethanol SO
MO MEU
50%PEG6000 75%PEG6000

59
Table 3.4 Vehicle solubility parameters and skin parameters
Formula code
Vehicles δV SV
(mg/mL)
Jmax
(µg/cm²/h)
SSC
(mg/cm3)
D* (cm/h)
KSC
Water 100% water 47.8 31.3 1.2 21.6 0.6 0.7
50%PEG6000 50% PEG6000/water 33.5 57.4 2.0 49.5 0.4 1.6
75%PEG6000 75%PEG6000/water 27.4 41.0 1.3 54.4 0.2 1.8
20% ethanol 20%ethanol/water 43.4 48.0 1.8 39.5 0.5 1.3
40% ethanol 40%ethanol/water 39.0 71.9 10.7 54.5 1.9 1.8
60% ethanol 60%ethanol/water 34.7 81.5 18.3 151.0 1.2 5.0
OA 60%ethanol/water + 5%OA 34.0 56.0 40.3 156. 2.6 5.2
EU 60%ethanol/water + 5% EU 33.5 98.3 38.9 254.6 1.5 8.5
SLS 60%ethanol/water + 1% SLS
34.6 74.8 20.1
100.9 2.0 3.4
MO Mineral oil 16.6 0.4 0.002 0.4 - -
SO 50% Silicone/volpo/water/ethanol
21.0 33.7 2.1 47.7 0.4 1.6
MEU Eucalyptol/Volpo-N10/water/ethanol
27.4 110.0 37.2 35.5 10.2 1.2
Enhancement ratio of the flux was greatest after pretreatment with the penetration enhancer
vehicles. However, the flux was not enhanced to the same extent (Fig 3.12). Also, the
enhancement partitioning ratio of caffeine into the stratum corneum is generally higher for
OA and EU solutions (Fig 3.12).

60
Figure 3.12 Mean plot summarising the effect of Hansen solubility parameter of vehicle on
enhancement of Jmax, partition and diffusion.
MEU (eucalyptol, Volpo-N10, ethanol and water).
0
10
20
30
40
15 25 35 45 55
Enh
ance
me
nt
Rat
io (
J ma
x)
Vehicle solubility parameters
0
2
4
6
8
10
12
14
15 25 35 45 55
Enh
ance
me
nt
Rat
io (
KSC
)
Vehicle solubility parameters
02468
101214161820
15 25 35 45 55
Enh
ance
me
nt
Rat
io (
D*)
Vehicle solubility parameters
MEU

61
Figure 3.13 Composite of the effects of vehicle pretreatment on diffusion and partition of
caffeine. (The red line is the identity line).
MEU (eucalyptol, Volpo-N10, ethanol and water).
Figure 3.13 is the composite plot for caffeine with all vehicles. The line of identity suggests
that the enhancement mechanism is an increase into the partition of the epidermis.
The Jmax and SSC of caffeine from each vehicle in the δV range (16-48) are shown in Figure
3.14. A linear relationship, found between Jmax and SSC R2=0.80, can be seen when all points
are considered. Also a linear relationship was found between the caffeine permeability
coefficient (KP) and SSC R2=0.80 (Fig 3.14B).
0
2
4
6
8
10
12
14
16
18
0 2 4 6 8 10 12 14 16 18
Dif
fusi
on
en
han
cem
en
t
Partition enhancement
MEU

62
A
B
Figure 3.14 Relationship between (A) Jmax and SSC and (B) caffeine permeability
coefficient (KP) and SSC.
MEU (eucalyptol, Volpo-N10, ethanol and water).
y = 0.1626xR² = 0.8035
0
5
10
15
20
25
30
35
40
45
0 50 100 150 200 250 300
Jmax
(µ
g/cm
²/h
)
Ssc (µg/cm3)
MEU
y = 5E-06xR² = 0.8035
0
0.0002
0.0004
0.0006
0.0008
0.001
0.0012
0.0014
0 50 100 150 200 250 300
Kp
SSC (mg/cm3)
MEU

63
3.5 Discussion
This work has revealed marked differences in the epidermal permeation of solutes using
different solution vehicles, some of which contained excipients that were hypothesised to
alter the properties of skin. This was demonstrated by differences in solute uptake into the
stratum corneum, permeation maximum flux and derived diffusivity. Interpretation of our
results adds to our mechanistic understanding on how vehicles effect the penetration of
different solutes. Our findings of selective permeation enhancement can be understood in
terms of three mechanisms: i) alterations in the solubility of the drug in the applied vehicle,
ii) uptake of the vehicle carrying the active compounds into the stratum corneum, and iii)
changes in the properties of the stratum corneum membrane, such as fluidisation of the lipid
bilayers.
In this work, we estimated the solute maximum (or saturated) fluxes (Jmax) as a measure of
skin permeation rates. It has long been recognised that maximum flux is independent of the
vehicle and dependent solely on the thermodynamic activity of the solute in the vehicle,
provided the vehicle or solute does not alter the properties of the membrane (154). This
concept was initially highlighted in the work of Twist and Zatz (155), who showed the same
flux for methyl paraben across synthetic membranes, regardless of its solubility in a range
of different vehicles. More recently, we published similar findings on the epidermal
permeation of a group of phenols with similar molecular weights but different log P values
(106-108). Our results for the control solutions here are consistent with these findings in that
similar low values for Jmax were found for each control solutions not affecting skin
permeability across a range of vehicle solubilities. In contrast, the Jmax values seen with the
enhancer solutions and to some extent, ethanol/water, are much higher than the controls,
indicating that these vehicles have altered the properties of the stratum corneum.
An interesting result from this work was the predominant effect on Jmax and D* seen with the
more hydrophilic solutes, caffeine and minoxidil, compared to lidocaine and naproxen. This
suggests that flux increases in these compounds are driven by increased diffusivity. It is well
recognised that diffusivity is independent of solute lipophilicity when the vehicle does not
alter the properties of the stratum corneum (107, 141). However, this may not be the case
when the vehicle does affect the stratum corneum. For example, we (107) recently showed
enhanced diffusivity for the more hydrophilic phenols applied to epidermal membranes in
isopropyl myristate (IPM), a vehicle that has a high affinity for the skin and can disrupt
stratum corneum lipid arrangements (156). The diffusivity-driven increases in caffeine
permeation seen here, particularly with the EU vehicle, were consistent with previous work

64
showing increased diffusivity of the polar compound 5-FU with EU enhancers, which was
explained in terms of disruption of stratum corneum lipids (157). Skin permeation of the
lipophilic compound tamoxifen has also been shown to be enhanced by terpenes, due to
enhanced partitioning into the stratum corneum (158). Williams and Barry (159) suggested
that generally, partitioning plays a greater role in enhancement of more lipophilic
substances.
The relationship between stratum corneum solubility and solute maximum flux and the
recognition that the stratum corneum solubility depends upon both solvent and solute uptake
into the stratum corneum were key findings in this work. Firstly, our results, showing good
linear relationships between Jmax and solubility in the stratum corneum for the control
vehicles but not for the vehicles that affected the skin, are consistent with our previous
findings (106-108). This supports the concept that dual mechanisms for permeation
enhancement, stratum corneum solubility and diffusion, may be acting in varying degrees in
these systems. The observed correlations between stratum corneum solubility and solute or
solvent uptake prompted us to hypothesise that the solvent acts as a carrier to draw solute
into the stratum corneum. Interestingly, the points for the penetration enhancer vehicles
generally follow the same linear regression lines as those for the controls in Figures 3.6 and
3.7, whereas they do not in Figure 3.5. This suggests that enhanced fluxes for these
compounds may be mainly driven by diffusivity rather than stratum corneum solubility.
Polyethylene glycols (PEGs) are used in a great variety of cosmetic applications because of
their solubility and viscosity properties and because of their low toxicity (160). Based on
available data, the PEGs with a wide molecular weight range (200 to 10000) are safe for
use in cosmetic products (160). It was clear from our results that PEG6000 vehicles were
inert and did not penetrate skin, as would be expected for a compound of such a high
molecular weight. The vehicles containing EU, OA and SLS also contained 60% ethanol,
while some of the other vehicles had 20%, 40% and 60% ethanol/water. Generally, the
responses with ethanol/water solutions alone were less than those with the enhancers. The
influence of ethanol in aqueous solutions in the transport of hydrophilic and lipophilic drugs
has been investigated and it has been suggested that ethanol has no or little effect in
penetration at low levels. However, at higher concentrations, it can cause extraction of lipids
(57, 161-163), which is consistent with our results. Pershing et al. found that ethanol
enhances the flux of oestradiol across human skin without affecting diffusion, while
increasing the solubility of drug in the membrane (164). This work also found that 60%
ethanol/water with caffeine, minoxidil and lidocaine had little effect on diffusivity but

65
increased the solubility of these solutes in the stratum corneum. Ethanol is a volatile solvent
and evaporation can lead to increased drug concentration and a greater driving force for
permeation (45, 57, 165), although this is unlikely to have occurred in our infinite dose
experiments here.
We attempted to use solubility parameters to predict solute maximum fluxes and from this
to distinguish between vehicles that do or do not affect the skin. The prediction depends
entirely on the properties of the solute (molar volume, melting point), the HSPs of the solute
and the skin and the experimental temperature. It therefore applies only to inert vehicles that
have no effect on the skin. Deviations of observed fluxes from the predicted values could be
attributed, in part, to skin effects. The plot of predicted versus observed Jmax values for a
typical inert vehicle that was used for all solutes (50% PEG-6000/water) showed excellent
correlation and concordance. It was noted that Jmax for minoxidil was over-predicted by the
solubility parameter method. The pKa of minoxidil is 4.61 and we believe that at the pH at
which the experiment was performed, the compound was substantially ionised, leading to a
lower than expected experimental flux. A better fit to the predicted correlation line would be
obtained if the minoxidil point was adjusted to account for the degree of ionisation. As
expected, given that the HSP prediction of Jmax takes no account of vehicle effects on the
skin, there were significant deviations from predicted values seen for the four vehicles shown
in Figure 3.9. The 60% ethanol/water and the ethanol/water/SLS vehicles showed the least
deviation, as seen above. We also applied a published regression based on a large literature
database (89) to predict Jmax (data not shown). This used solute properties (log P, molecular
weight and melting point) and once again, took no account of vehicle-skin interactions. The
resulting correlation between predicted and observed Jmax values was almost identical to
that obtained with the HSP prediction, but with a poorer correlation coefficient (0.7344).
Recently, Riviere reported a quantitative structure permeability model to predict in vitro
permeation of some ectoparaciticides through porcine and canine skin that accounted for
both the physicochemical properties of the penetrant and the formulation components (166).
For the pretreatment study, the principal gaols were to find the relationship between total
solubility parameters, solute, solvents and skin. The important finding in this work is the
parabolic relationship between enhancement ratio for Jmax, KSC, SV and δV for the vehicles
which interacted with skin and straight line in vehicles which did not interact with skin (inert)
such as water and PEG6000 vehicles. The treatment result with the caffeine showed a linear
relationship between Jmax, and SSC; the same finding has been shown with pretreatment

66
results. The effect of vehicles on flux is summarised in mean effect plot (Fig 3.12 and Table
3.4). Enhancement is generally higher for OA, EU and eucalyptol vehicle MEU. It is noted
that Hansen 2007 (148) considered the stratum corneum to have 30 (total solubility δV)
implying that vehicles with a value close to this should mix easily with the skin and have
maximal enhancement properties. This is seen in the present study, which shows that any
vehicle in the range close to 30 will penetrate the barrier effectively. This hypothesis is in
accordance with the similarity in enhancement values for most vehicles. After recognising
that Jmax was increased by vehicle pretreatment, we proceeded to separate it into its partition
and diffusion components. Vehicles can strongly effect permeation through the stratum
corneum barrier by altering the partitioning coefficient between the vehicles and the
membrane (KSC) and or solute diffusion (D*) within the membrane (167). The KSC is a kinetic
effect that could be related to structural effects such as alterations to the stratum corneum
cells structure. As mentioned earlier, if the vehicle has no effect on the skin, the Jmax of a
given solute appears to be independent of vehicles for saturated solutions. This has been
noted experimentally (168), (107) for many vehicles. However, the ones known as
penetration enhancers are either entering the skin to change partitioning and diffusion or
removing the skin components. The partitioning coefficient KSC was determined
experimentally as described, so the apparent diffusivity D* could be found indirectly from
JSS/KSC. The main effects plots for KSC and D* are shown in Figure 3.12. Generally the effects
of a vehicle on KSC seem to be similar to those on D*, but trend with respect to δv can be
seen. Water, MO, PEG6000 vehicles, silicone oil and 20% ethanol/water as expected have
no effect on any of the three factors Jmax, KSC and D*.
Figure 3.13 is a line of identity, so it is apparent that the effect of vehicles on partitioning is
more than on diffusion, suggesting that the enhancement mechanism includes a high
increase in the thermodynamic (partition). These results agree with Rosado et al’s (167)
finding that the enhancement mechanism includes a greater increase in the thermodynamic
(partition) than in the kinetic (diffusion). The maximum flux of compounds was increased by
increasing the solubility of these compounds in the stratum corneum lipids (Table 3.4). A
linear relationship found between Jmax and SSC, r2=0.80, could be seen when all points were
considered (Fig 3.14A). A linear relationship was found between caffeine permeability
coefficient (KP) and SSC r2=0.80 (Fig 3.14B). In future, expansion of the HSP or other
approaches to account for vehicle-skin interactions would be valuable to provide more
realistic predictions that can be generally applied.
67
3.6 Conclusions
This study has shown that the permeation of caffeine, minoxidil, lidocaine and naproxen
were selectively enhanced by vehicles containing specific excipients that were hypothesised
to alter the properties of skin (OA, EU, SLS and ethanol). The greatest effects were seen on
flux and diffusivity by the EU and OA vehicles on the more hydrophilic compounds, caffeine
and minoxidil. Enhancements in stratum corneum solubility were predicted by
experimentally determined uptake of solvent and solute. We conclude that enhanced solute
fluxes are mainly driven by increased diffusivity in the stratum corneum, likely to be due to
greater lipid fluidisation caused by the enhancers. In the pretreatment study, there was
enhancement of caffeine flux following penetration enhancer vehicles pretreatment of heat
separated epidermis. Enhancement could be related to HSPs of the vehicle. Calibration of
the solute flux and its solubility in the stratum corneum data is a simple novel plotting
procedure that separated and quantified the effects of the vehicle on solute partition and
diffusion. The treatment and pretreatment results indicate that mainly, enhancement is
related to an increase in partition into skin with an increase in diffusivity. The diffusivity was
obtained for all compounds and was unaffected by the inert control vehicles (controls)
supporting the notion that Jmax is determined by stratum corneum solubilities and not
diffusivity.
68
Chapter 4
Synergistic skin penetration enhancer and nanoemulsion formulations promote the
human epidermal permeation of caffeine and naproxen
4.1 Abstract
Targeted delivery of topically applied drugs to various skin compartments, including hair
follicles, can be achieved by designing an optimised drug delivery system. One of the many
ways of enhancing delivery through the skin is by formulation optimisation. They are
considered as novel alternatives to conventional transdermal delivery systems and the main
reasons include simplicity of the formulation process, stability of the system and a high
potential in pharmaceutical applications. Nanoemulsions, a formulation, act as efficient
vehicles for topical drug delivery mainly due to their potential of providing enhanced solubility
and improved bioavailability. The aim of this study is to assess delivery of caffeine, a model
hydrophilic compound and Naproxen, a model lipophilic compound across human epidermal
and full-thickness skin, utilising nanoemulsion formulations containing oleic acid (OA) and
eucalyptol (EU) as oil phases. Evaluations were also undertaken to prove that the maximum
flux of the compounds may be enhanced by either increasing their solubility in the stratum
corneum lipid component or by increasing the diffusivity of the solutes in the stratum
corneum. Two oil-in-water (O/W) nanoemulsion formulations containing caffeine and
naproxen (3% and 2% w/w, respectively) with OA or EU as oil phases were prepared. The
proportion of the surfactant, co-surfactant and aqueous phase was selected through the
construction of a pseudo-ternary phase diagram. The formed systems were characterised
using particle size, measurement of electrical conductivity, viscosity and refractive index.
Nanoemulsions and controls consisting of 3% w/w caffeine in water (C1), 60% ethanol/water
(C2), or 50% PEG6000/water (C3); 2% naproxen in 60% ethanol/water (C2) or 25% ethanol,
25% volpo-N10 and 50% water (C4) were applied to epidermal and excised full-thickness
human abdominal skin in Franz diffusion cells (n=4) for 8 h. The stratum corneum distribution
of the chosen model drugs was studied using the tape-stripping technique. The amount of
caffeine and naproxen in receptor fluid, extracts of tape strips (20 times) and skin was
quantified using HPLC. The effect of the nanoemulsion formulation on the skin and the
delivery route was determined using Multiphoton microscopy (MPM). The results depicted
that both O/W nanoemulsions significantly enhanced the delivery of caffeine that permeated
across as well as was retained in the skin as compared to the controls. The rate of
penetration of naproxen through the skin (epidermis and full-thickness skin) (flux) as well as

69
the amount retained in the skin were significantly greater than for all the controls (p<0.005)
for both O/W nanoemulsions, whereas no significant differences in flux and skin retention
between the EU and OA nanoemulsions was observed. For Naproxen, it was found that the
maximum flux was related to the stratum corneum solubility of the nanoemulsion formulation
and the amount of vehicle absorbed into the stratum corneum, as well as the amount of
naproxen dissolved in that absorbed vehicle. Caffeine maximum flux enhancement was
found to be associated with increased skin diffusivity. These relationships were reflected in
the uptake of active compound into the stratum corneum, carried with the vehicle being
taken up. Also, estimated diffusivity appeared to be vehicle independent. Images of
nanoemulsion treated skin showed altered stratum corneum barrier structure. In the case of
caffeine, the transdermal flux from EU formulations was higher than OA nanoemulsions but
the amount retained in the stratum corneum and skin were not significantly different for these
formulations. In conclusion, both the nanoemulsion systems in this study significantly
enhanced penetration of caffeine and naproxen. The possible cause of enhancement may
be due to alterations in the stratum corneum barrier structure due to the presence of EU and
OA as penetration enhancers in the formulation. Further work is needed, directed at applying
theoretical principles based on HSPs to design formulations for improved targeting of
specific skin layers.
4.2 Introduction
Percutaneous absorption offers an attractive non-invasive route of administration for local
topical or systemic effects of substances but is limited by the skin's inherent barrier to
penetration of any exogenous material. It is well established that the uppermost layer of the
skin, the stratum corneum, is the main barrier to such penetration but can be overcome to
meet therapeutic and cosmetic goals by prudent considerations of the active’s potency,
physicochemical properties, formulation and delivery systems (169). Formulation
approaches include optimisation, use of pro-drugs and incorporation of chemical or
biological modifiers to transiently reduce stratum corneum barrier function. The range of
delivery systems in current use include: topical products, transdermal patches, physical
methods such as microneedles and heat as well as other technologies, including
iontophoresis, sonophoresis, radiofrequency and laser ablation(169).
Microemulsions, defined as single phase and thermodynamically stable isotropic systems
composed of water, oil and amphiphilic molecules (170), are attractive systems for
enhancing drug delivery to the skin because of their ease of formulation, thermodynamic

70
stability and solubilisation(171). They are capable of incorporating and enhancing the skin
delivery of both hydrophilic and lipophilic drugs (172, 173) and are considered to be more
stable than conventional emulsions because of their small droplet sizes preventing phase
separation. Moreover, small droplet size provides better adherence to membranes, leading
to more efficient transport of drug molecules in a controlled fashion (174, 175).
Micro- and nanoemulsions may be categorised into three main types: water in oil (W/O),
bicontinuous and O/W though a mixture of oil, water and surfactants will be able to generate
a variety of structures and phases (173, 176, 177). When similar amounts of oil and water
are used, the structures formed are not well characterised and are assumed to be
continuous (178). While micro- and nanoemulsion formation depends on the capacity of the
surfactant system to decrease the surface tension, in practice almost all surfactants require
the presence of additional co-surfactants. Excipients such as short- or long-chain alcohols
or polyglycerol derivatives have been used to achieve low surface tension. Addition of a co-
surfactant reduces the interfacial tension as well as the critical micelle concentration. The
correct selection of components is the main factor to be considered when formulating
microemulsions for topical or transdermal delivery (179). Micro- and nanoemulsions may
enhance topical and transdermal delivery mainly by increasing the solubilisation capacity for
hydrophilic and lipophilic compounds, maintaining constant supply of the drug from the
internal to the external phase and thus keeping the external phase saturated and promoting
skin absorption. The formulation ingredients such as the oil, surfactants, co-surfactants and
penetration enhancers may increase drug diffusion by enhancing partitioning through the
skin. Also, the low interfacial tension required for micro- and nanoemulsion formations may
be responsible for the excellent wetting properties, which ensures surface contact between
the membrane and the vehicle (180). In addition to their favourable permeation
enhancement properties, micro- and nanoemulsions may also reduce skin irritancy of certain
excipients. For example, an aqueous solution containing 20% propylene glycol was shown
to cause irritation, but the same concentration of propylene glycol used as a co-surfactant
in microemulsion formulations did not (181).
The components of the oil phase in a microemulsion may include penetration enhancers
such as lecithin, hydrophilic terpenes such as EU or unsaturated fatty acids such as OA to
enhance the permeation of the active through the skin without causing local irritation (182,
183). Studies suggest that these penetration enhancers may cause disruption of the stratum
corneum lipid organisation thus increasing the fluidity and decreasing diffusion resistance to
solutes (182, 184). In this study OA and EU were selected as the penetration enhancers.
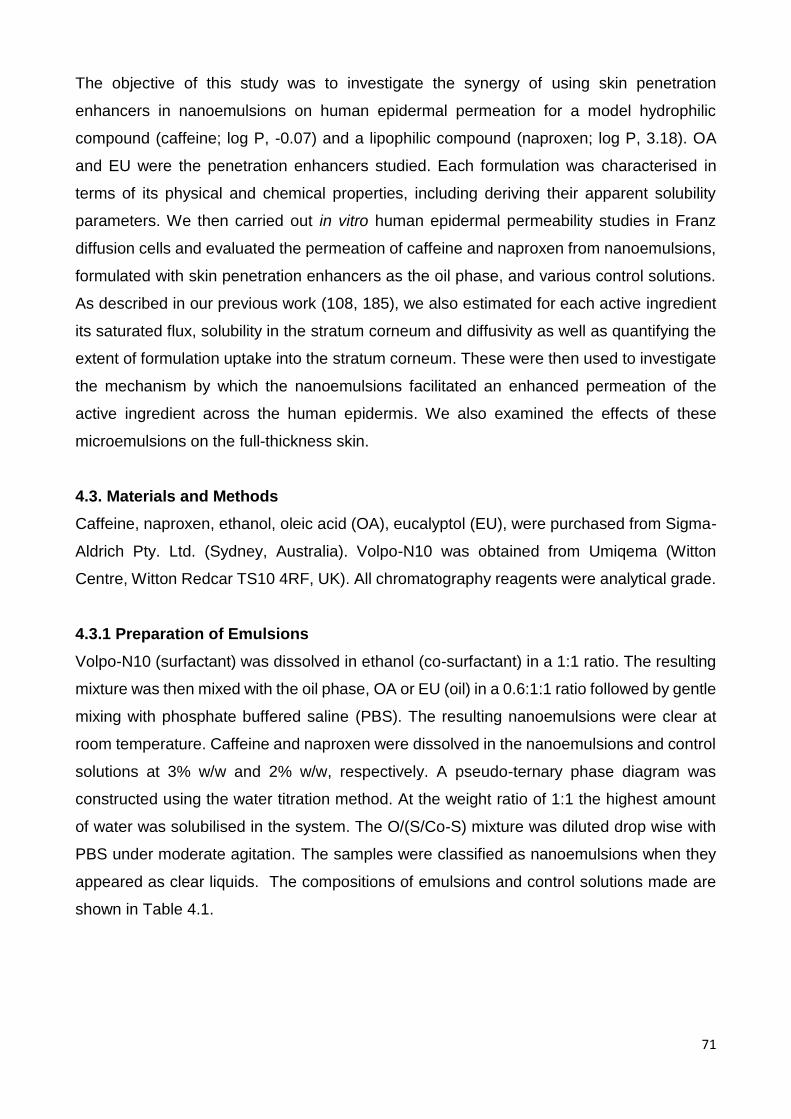
71
The objective of this study was to investigate the synergy of using skin penetration
enhancers in nanoemulsions on human epidermal permeation for a model hydrophilic
compound (caffeine; log P, -0.07) and a lipophilic compound (naproxen; log P, 3.18). OA
and EU were the penetration enhancers studied. Each formulation was characterised in
terms of its physical and chemical properties, including deriving their apparent solubility
parameters. We then carried out in vitro human epidermal permeability studies in Franz
diffusion cells and evaluated the permeation of caffeine and naproxen from nanoemulsions,
formulated with skin penetration enhancers as the oil phase, and various control solutions.
As described in our previous work (108, 185), we also estimated for each active ingredient
its saturated flux, solubility in the stratum corneum and diffusivity as well as quantifying the
extent of formulation uptake into the stratum corneum. These were then used to investigate
the mechanism by which the nanoemulsions facilitated an enhanced permeation of the
active ingredient across the human epidermis. We also examined the effects of these
microemulsions on the full-thickness skin.
4.3. Materials and Methods
Caffeine, naproxen, ethanol, oleic acid (OA), eucalyptol (EU), were purchased from Sigma-
Aldrich Pty. Ltd. (Sydney, Australia). Volpo-N10 was obtained from Umiqema (Witton
Centre, Witton Redcar TS10 4RF, UK). All chromatography reagents were analytical grade.
4.3.1 Preparation of Emulsions
Volpo-N10 (surfactant) was dissolved in ethanol (co-surfactant) in a 1:1 ratio. The resulting
mixture was then mixed with the oil phase, OA or EU (oil) in a 0.6:1:1 ratio followed by gentle
mixing with phosphate buffered saline (PBS). The resulting nanoemulsions were clear at
room temperature. Caffeine and naproxen were dissolved in the nanoemulsions and control
solutions at 3% w/w and 2% w/w, respectively. A pseudo-ternary phase diagram was
constructed using the water titration method. At the weight ratio of 1:1 the highest amount
of water was solubilised in the system. The O/(S/Co-S) mixture was diluted drop wise with
PBS under moderate agitation. The samples were classified as nanoemulsions when they
appeared as clear liquids. The compositions of emulsions and control solutions made are
shown in Table 4.1.

72
Table 4.1 Compositions (% w/w) of nanoemulsions formulations (C3 and C4), with
penetration enhancers eucalyptol (E1 and E2) and oleic acid (O1 and O2), and control
mixtures (C1 – C2). The concentration of caffeine (marked as C) dissolved in aqueous
controls and nanoemulsions was 3% w/w, whereas a concentration of 2% w/w was used for
naproxen (marked as N).
Water Ethanol PEG-6000 Volpo-N10 Eucalyptol Oleic Acid
C1C 100 - - - - -
C2C,N 40 60 - - - -
C3C 75 - 25 - - -
C4N 50 25 - 25 - -
E1C,N 30.97 26.55 - 26.55 15.93 -
E2C,N 36.59 24.39 - 24.39 14.63 -
O1C,N 30.97 26.55 - 26.55 - 15.93
O2 C,N 36.59 24.39 - 24.39 - 14.63
4.3.2 Characterisation of emulsions
The droplet size distributions, refractive indices and electrical conductivities of the emulsions
were determined at ambient temperature using dynamic light scattering (Zetasizer Nano ZS,
Malvern Instruments, Ltd, Malvern, UK), on a RFM34 refractometer (Bellingham & Stanley,
UK) and a Digitor multimeter (DSE, Australia), respectively. Electrical conductivity
measurement enables identification of the continuous phase of the emulsion, with O/W
emulsions being conductive, while W/O emulsions are not. The viscosity of the emulsion
formulations was measured using a U-tube viscometer at 25°C. All determinations were
done with three replicates.
4.3.3 Human skin preparation
Skin samples were obtained with informed consent from female patients undergoing elective
abdominoplasty, and approval from The University of Queensland Human Research Ethics
Committee (HREC Approval no. 2008001342). The procedures were conducted in
compliance with guidelines of the National Health and Medical Research Council of
Australia. Full-thickness skin was prepared by removal of subcutaneous fat by blunt

73
dissection. Heat separation was used to separate epidermal membranes from full-thickness
skin, by immersing it in water at 60°C for 1 min, to allow the epidermis to be teased away
from the dermis (186). Stratum corneum was prepared from the epidermal membranes by
trypsin digestion (187). The epidermis was floated overnight on a solution of 0.01% trypsin
in PBS at 37°C. The digested viable epidermis was gently scraped off with cotton buds and
the remaining stratum corneum membrane was rinsed several times with distilled water. The
isolated stratum corneum membranes were dried with absorbent paper and placed flat
between parafilm sheets covered with aluminium foil. All skin membranes were stored frozen
at -20°C until use.
4.3.4 Determination of the solubility of actives in the various formulations (SV)
The solubility of caffeine and naproxen in each formulation (SV) was determined by adding
caffeine or naproxen to 5 mL of each nanoemulsion or control solution until an excess
amount remained. The samples were then incubated in a water bath at 32°C for 24 h with
continuous agitation and centrifuged at 4700 rpm for 10 minutes. The supernatant was
withdrawn and diluted to accurately quantify the amount of each compound by HPLC.
4.3.5 Determination of solubility in the stratum corneum (SSC) and solvent uptake
To determine the stratum corneum solubilities of caffeine and naproxen from the various
vehicles, pre-weighed discs of stratum corneum (4 replicates for each compound) were
incubated in 1 mL saturated solutions of each compound in the various vehicles at 32°C for
24 h (187). At the end of the incubation period, the stratum corneum discs were removed
and blotted dry and further incubated with 1 mL of 70% ethanol/water for 24 h at 32°C to
enable complete extraction of the solutes. SSC was determined from the amount recovered
in the extraction fluid measured by HPLC divided by the thickness and area of the stratum
corneum (185). The total solvent uptake into the stratum corneum was determined from the
weight differences of the dry pieces of the stratum corneum (about 0.7mg) soaked in each
formulation (1mL) for 24 h at 32°C. The stratum corneum pieces were wiped three times
with Kimwipe tissues before being weighed again.
4.3.6 In vitro skin penetration and distribution study
In vitro skin permeation studies were performed with epidermal skin in Franz diffusion cells
with an effective diffusion area of 1.33cm² and an approximate receptor chamber capacity
of 3.4 mL. The skin was cut into discs and mounted between the donor and receptor

74
compartment of the Franz cell with the stratum corneum side facing the donor chamber. The
receptor compartment containing PBS (pH 7.4) was immersed in a water bath at 35±0.5°C.
The donor solution consisted of 1mL of the nanoemulsions or control formulations,
containing either 3% w/w caffeine or 2% w/w naproxen. The donor compartment was
covered with parafilm to prevent evaporation. At pre-determined time points, 200 µL of the
receptor phase was withdrawn and replaced with an equal volume of fresh PBS.
In vitro skin absorption studies were performed with full-thickness human abdominal skin in
Franz diffusion cells as described previously. The skin was cut into discs and mounted in
between the donor and receptor compartment of the Franz cell with the stratum corneum
side facing the donor chamber. The receptor compartment containing PBS (pH 7.4) was
immersed in a water bath at 35±0.5°C. The donor solution consisted of 1mL of nanoemulsion
formulations (with 3% and 2% w/w of caffeine and naproxen, respectively) or control
formulations. The donor compartment was covered with parafilm to prevent evaporation. At
pre-determined time points, 200 µL of the receptor phase was withdrawn and replaced with
an equal volume of fresh PBS over the duration of the study. The caffeine and naproxen
content in the samples was determined using HPLC. On completion of the diffusion studies,
the donor remaining at the end was withdrawn and the skin in each cell was wiped with a
cotton bud to remove any formulation. This was followed by tape stripping (20 tape strips)
to separate the stratum corneum from the epidermis by application of adhesive tape (D-
Squame tapes, CuDerm Corp., TX) to the exposed skin surface for about 5 seconds. Tapes
were placed in separate scintillation vials, soaked overnight with 2 mL methanol with
constant shaking. The amount of absorbed material in the stratum corneum was determined
by HPLC. The amounts in the first tape were not included, as this represents surface
material. Subsequent to tape stripping, the remaining skin was sliced into small sections;
homogenised and soaked overnight with 2 mL methanol under constant shaking. The
caffeine and naproxen content in these samples was then determined by HPLC.
4.3.7 Multiphoton microscopy (MPM)
Multiphoton microscopy (MPM) was used to assess the effect of these formulations in the
stratum corneum. A DermaInspect system (JenLab GmbH, Jena, Germany), coupled to an
ultra-short-pulsed, mode-locked, 80-MHz Titanium Sapphire laser (Mai Tai, Spectra
Physics, Mountain View, California, USA) was used to image the skin. Full-thickness
abdominal skin was mounted in Franz diffusion cells and an infinite dose of formulation 2 of
EU and OA was applied. Samples of untreated skin were used as controls. After 8 h, the

75
Franz diffusion cells were dismantled and the skin was rinsed gently with water and blotted
dry with a tissue. It was then placed on a microscope slide and protected with a cover slip
(108). Images were captured by two photon excitation at 740 nm. The skin was imaged at
four depths, from the superficial surface, corresponding to the stratum corneum (~5-10 µm),
stratum granulosum (SG; ~15-20 µm), stratum spinosum (SS; 25-30 µm) and stratum basale
(SB; 35-40 µm). Keratinocyte morphology was used to confirm each of these layers.
4.3.8 HPLC analysis of caffeine and naproxen
Caffeine and naproxen in solution and extracts from various matrices were analysed by a
sensitive and rapid HPLC. The HPLC system consisted of a Shimadzu SIL-20 a HT, CBM-
20A system controller, a SPD-20A detector, LC-20AD a pump and an auto injector. Isocratic
separation of both caffeine and naproxen was achieved on a Phenomenex Luna 5µm, C18
(150 x 4.6 mm) column. For caffeine analysis, elution was performed at ambient temperature
with a mobile phase of 95% water, 2% acetonitrile, 2% tetrahydrofuran and 0.5% acetic acid
at a flow rate of 1mL/min. Detection wavelength was 273nm. For naproxen the mobile phase
consisted of 35% water, 45% acetonitrile, 20% methanol and 0.3% acetic acid at a flow rate
of 0.7 mL/min. The detection wavelength was 230 nm.
4.3.9 Data analysis
The cumulative amount (Q, µg/cm²) of caffeine and naproxen penetrating through an area
of 1.3 cm2 was plotted against time (t). The steady state flux JSS (µg /cm²/h) was determined
from the slope of the linear portion of the cumulative amount (Q) versus time t plot.
The maximum flux (Jmax) that would be applicable to saturated solutions can be estimated
from the experimental steady state flux corrected for the known solubility in the formulation
by Equation 2 (185)
Jmax= JSS. Sv / CV (1)
Where SV is the solubility of the formulation and CV is the experimental concentration used.
The diffusivity of solute in the skin divided by path length (D*) was calculated from the
maximum flux and the solubility of the active compound in the stratum corneum according
to Equation 2 (185).
D* = Jmax / SSC (2)
Where SSC is the experimentally determined solubility of the solute in the stratum corneum.

76
HSPs (D, P, H) for formulation excipients, solvents and active compounds were obtained
from the software package HSPiP (JW solutions B.V, the Netherlands). The total solubility
parameters were also obtained from HSPiP, according to the formula:
total2 = D
2 + P2 + H
2 (3)
Values of the solubility parameters for human skin (D=17, P =8 and H=8) were taken from
Hansen Solubility Parameters: A User’s Handbook (148) and used with the reported
solubility parameters for caffeine (D=19.5, P =10.1 and H=13.0) and naproxen (D=18.9,
P =4.3 and H=9.9) to estimate the HSP distance (Ra), a measure of the similarity between
two materials:
Ra = [4(D1 - D2)2 + (P1 -+ P2)2 + (H1 - H2)2]1/2 (4)
4.3.10 Statistics
All experiments were analysed by one-way analysis of variance (ANOVA) with post-hoc
comparisons (Tukey) using GraphPad Prism 6 (GraphPad Software Inc. La Jolla, CA92037,
USA); p<0.05 was considered to be significant.
Comparisons were made between the nanoemulsion formulations, with and without
enhancers, and controls as well as between the different nanoemulsion formulations for the
cumulative amount permeated at different time points and the amount of caffeine and
naproxen recovered following skin extraction. A result was considered significant when p <
0.05.

Table 4.2 Physical and chemical characterisation of the various of nanoemulsion formulations and control mixtures defined in Table 1.
Physical and Chemical
Properties
Formulations
Control mixtures Nanoemulsion
formulations
Nanoemulsion
formulations with
eucalyptol
Nanoemulsion
formulations with oleic
acid
C1C C2C,N C3C C4N E1C,N E2C,N O1C,N O2 C,N
Appearance Clear Clear Clear Clear Clear Clear Clear Clear
Viscosity (cp) 0.96 2.65 22.20 25.40 13.7±4.5 15.1±4.0 23.0±4.7 28.3±4.5
Conductivity (µS) 0.21 1.15 0.12 1.05 87.5±2.2 91.3±3.9 80.8±8.2 84.5±10.1
Refractive Index 1.33 1.36 1.32 1.34 1.38 1.37 1.38 1.37
Emulsion droplet size
(nm)
- - - - 29.6±3.1 19.5±1.3 8.0±0.5 12.4±0.1
Hansen Solubility
Parameters (MPa)1/2
D 15.5 15.4 16.7 15 15.3 15.3 15.3 15.3
P 16 11.9 13.6 11.9 9.4 9.3 9.4 10
H 42.3 28.7 25.7 28.4 20.7 22.5 21.2 22.9
Total 47.8 34.7 33.5 34.3 27.4 28.8 27.8 29.3
(HSP dist)a 43.2 26.3 29.1 20.7 15.8 17.3 14.8 16.8
Molar volume (MV) 18 30.8 35.9 30.9 43.3 38.9 44.2 39.5
aHSP distances (Ra) of mixtures calculated from Equation 4 below, using software package HSPiP.
4.4 Results
4.4.1 Physical and chemical characterisation of the formulations used
Table 4.2 summarises the physical and chemical properties of the various formulations used
in this study. In general, all formulations were clear and had a low viscosity. As one example,
shown in Figure 4.1, the nanoemulsions area in the pseudo-ternary phase diagram with a
1:1 w/w ratio of Volpo-N10 to ethanol is in a region with a surfactant concentration between
80% and 40%. In this region, a high amount of water can be solubilised without causing
phase separation and is characterised by transparency and higher viscosity. In contrast, in
other regions of the phase diagram, a turbid emulsion is seen. Figure 4.1 also shows that
the proportion of the ternary diagram existing as the nanoemulsion increases as the amount
of water increases and the concentration of surfactant / co-surfactant mixture decreases.
Figure 4.1. Ternary phase diagram of the oil, surfactant/co-surfactant mixture and water at
ambient temperature. The dotted line in the diagram represents the nanoemulsion.
Table 4.2 also shows the viscosity, conductivity, refractive index and, where appropriate,
nanoemulsion droplet size. However, it is apparent that, consistent with OA’s surface active
properties, the droplets from the nanoemulsions containing OA are smaller than those of
EU. Further, all nanoemulsions had mean droplet sizes < 100 nm, indicating that they
should be regarded as being nanoemulsions, and high conductivities, consistent with them
being oil in water (O/W) nanoemulsions. Also, included in Table 4.2 are the estimated
solubility parameters and “average” molar volume for each of the formulations studied. It
0 10 20 30 40 50 60 70 80 90 100
0
20
40
60
80
1000
10
20
30
40
50
60
70
80
90
100
% S
/CoS
(y)
% A
queous
(z)
Oil % (x)
Ternary Phase diagram Formulation 1

79
evident that the various solubility parameters are in the general order:
water>nanoemulsions>nanoemulsions containing penetration enhancers.
4.4.2 In vitro permeation of caffeine and naproxen across epidermal membranes
Figure 4.2A shows the cumulative amount (g/cm2) of caffeine that penetrated across
epidermal membranes versus time for nanoemulsions and controls for this study.
Penetration from nanoemulsions containing skin penetration enhancers was greater than
from control vehicles. The corresponding cumulative amount versus time profiles for
naproxen are shown in Figure 4.2B, where similar but greater penetration occurs from
nanoemulsions compared to controls. For both caffeine and naproxen, the ethanol/water
solution promoted a greater epidermal penetration than the other control solutions.
Figure 4.2. In vitro percutaneous permeation through epidermal human skin A-caffeine; B-
naproxen (E1, green solid lines; E2, green dashed lines; O1, red solid lines; O2, red dashed
lines; C1 (water), crosses; C2 (60% EtOH/water), yellow squares; C3 (50%
PEG6000/water), diamonds and C4 (Volpo-N10/EtOH/water), circles.
4.4.3 Impact of formulation on active solubility in formulation, solubility in stratum
corneum, maximum flux and derived diffusivity
Table 4.3 shows the estimated active solubility in formulation, solubility in stratum corneum,
maximum flux calculated from steady state flux using Equation 1 and diffusivity per path
length D* derived from the maximum flux and stratum corneum solubility using equation 2.
It is apparent that both caffeine and naproxen have a much higher solubility in nanoemulsion
formulations containing enhancers than in controls. Indeed, the solubility of caffeine in water
was much less than the corresponding values with the other controls and with the emulsions;
0
200
400
600
800
0 2 4 6 8
Cu
mu
lati
ve a
mo
un
t (
µg/
cm2)
Time (h)
0
40
80
120
160
0 2 4 6 8
Cu
mu
lati
ve a
mo
un
t (µ
g/cm
2 )
Time (h)
A B

80
naproxen had a higher solubility in the nanoemulsions than in the controls. Pronounced
enhancements in caffeine and naproxen maximum fluxes were evident for the aqueous
ethanolic solution and the various emulsion formulations containing enhancers, the
enhancement being between one and two orders of magnitude greater than the controls
(Figure 4.3). It is apparent that the solubility of caffeine in the stratum corneum after
application of various emulsion formulations containing enhancers is modest, whereas the
derived D* for these formulations increases by one or two orders of magnitude. It is thus
apparent that the marked formulation enhancement in caffeine penetration arises from the
enhancers reducing the diffusion resistance for caffeine permeation. In contrast, the
solubility of naproxen in the stratum corneum after application of various emulsion
formulations containing enhancers is about one order of magnitude greater than the
controls, whereas the derived D* is not greatly different from the slight enhanced D* seen
for an aqueous ethanolic formulation.
Figure 4.3. Estimated maximum fluxes for caffeine and naproxen for each of the
formulations plotted against the solubility of these actives in the formulations. Circles,
caffeine; Triangles, naproxen. Black symbols - controls (solutions in water and 25%
PEG6000/water for caffeine, 25% PEG6000/water and Volpo-N10/EtOH/water for
naproxen); Yellow symbols - 60% EtOH/water; Red symbols - nanoemulsions containing
oleic acid; Green symbols - nanoemulsions containing eucalyptol
0
100
200
300
0 20 40 60 80 100 120
J max
(µg/
cm2 /
h)
SV (mg/mL)
0
50
100
150
0 50 100 150 200
J max
(µg/
cm2/h
)
SV (mg/mL)
A B

Table 4.3 Experimental data for caffeine and naproxen in different nanoemulsions without and with penetration enhancers and control
vehicles. (Mean ± SD).
Active
Caffeine Naproxen
Formulation SV
(mg/mL)
Jmax
(g/cm2/h)
SSC (µg/mL) D*
(cm/h *1E4)
SV
(mg/mL)
Jmax
(g/cm2/h)
SSC (µg/mL) D*
(x104 cm/h)
C1 31.3±1.2 2.2±0.8 21.6±2.2 1.0±0.4 - - - -
C2 81.5±13.4 25.6±3.1 151.0±37.7 1.7±0.2 50.9±1.4 23.4±4.8 18.3±6.1 12.8±2.6
C3 57.4±10.1 2.5±0.7 49.4±14.2 0.5±0.1 66.8±1.9 6.2±0.3 16.0±1.8 3.9±0.2
C4 - - - - 25.9±1.5 7.3±2.7 9.5±1.7 7.7±2.9
EU1 112.3±8.5 263.6±1.2 38.2±15.3 69.1±0.3 174.9±8.3 122.4±27.1 101.8±22.4 12.0±2.7
EU2 110.8±9.5 267.7±24.0 36.5±4.1 73.3±6.6 148.1±5.1 86.6±8.9 114.0±35.1 7.6±0.8
OA1 101.8±2.2 118.8±57.3 52.4±3.9 22.7±11.0 198.5±0.4 101.2±41.7 113.8±66.7 8.9±3.7
OA2 90.2±8.1 136.4±95.2 64.4±20.6 21.2±14.8 170.6±3.3 74.0±2.3 95.9±58.2 7.7±0.2
The formulations are defined in Table 1 and are nanoemulsion formulations (C3 and C4), with penetration enhancers eucalyptol (EU1 and
EU2) and oleic acid (OA1 and OA2), and control mixtures (C1 – C2).

82
The different mechanisms of enhancement for the nanoemulsions with enhancers for
caffeine and naproxen are more clearly shown in Figure 4.4. In Figure 4.4A it is evident that
the Jmax for naproxen is correlated with its solubility in the stratum corneum Ssc whereas, as
shown in Figure 4.4B, caffeine is better related to its altered diffusivity D* associated with
the various formulations.
Figure 4.4 Impact of stratum corneum solubility and apparent diffusivity D* on the maximum
flux Jmax for caffeine and naproxen. A. Jmax versus stratum corneum; B. Jmax versus D*.
Circles, caffeine; Triangles, naproxen. Black symbols - controls (solutions in water and 25%
PEG6000/water for caffeine, 25% PEG6000/water and Volpo-N10/EtOH/water for
naproxen); Yellow symbols - 60% EtOH/water; Red symbols - nanoemulsions containing
oleic acid; Green symbols - nanoemulsions containing eucalyptol. The trend line for
naproxen is shown. It is evident from Figure A that Jmax is more dependent on stratum
corneum solubility for naproxen, whereas in Figure B Jmax is better related to D* for caffeine.
4.4.4 Mechanism underpinning the differential enhanced uptake of caffeine and
naproxen into the epidermis
Figure 4.5 shows that the enhanced solubility in the stratum corneum from the various
formulations could be related to the uptake of both caffeine and vehicle into the stratum
corneum. An optimal regression was found when it was assumed that all the dissolved solute
in the vehicle was taken up into the stratum corneum as defined by:
SSC (predicted) = SSC (skin, control) + SV (vehicle) * Vup / VSC
Where Vup is solvent uptake and VSC is the volume of the stratum corneum. SSC (skin,
control) represents the solute in the stratum corneum, derived from the experimental data
for a control solution:
R² = 0.8909
0
50
100
150
200
250
300
0 40 80 120 160
J max
(µg/
cm2 /
h)
SSC (mg/mL)
R² = 0.9426
0
50
100
150
200
250
300
0 20 40 60 80
J max
(µg/
cm2 /
h)
D* (cm/h x 1E4)
A B

83
SSC (skin, control) = SSC (exp, control) - Sf (exp, control) * Vup (control) / VSC
An excellent SSC (predicted) versus SSC (experimental) is evident for naproxen (R2=0.84) but
not for caffeine (R2=0.48).
Figure 4.5. Stratum corneum solubility predicted from solvent uptake for caffeine (A) and
naproxen (B). (Lin’s concordance correlation coefficient for caffeine is 0.58 and for naproxen
is 0.93.) Black symbols, control solutions in water and 25% PEG6000/water for caffeine,
25% PEG6000/water and Volpo-N10/EtOH/water for naproxen); Yellow symbols, 60%
EtOH/water; Red symbols - nanoemulsions containing oleic acid; Green symbols -
nanoemulsions containing eucalyptol.
Can the solubility of the actives in various formulations and the uptake of
formulations into stratum corneum be predicted by the solubility parameter
approach?
Figure 4.6 shows the relationships between the solubility of solutes in formulations, uptake
of formulations into stratum corneum and stratum corneum solubility as a function of the
HSP distance (Ra). Figure 4.6A shows that the experimental solubilities of caffeine and
naproxen in the various vehicles were highest when Ra was lowest and when the solutes
and nanoemulsions were most similar in their various solubility parameters. Figure 4.6B
shows that solvent uptake into the stratum corneum is also greatest for these formulations
when Ra is lowest, i.e. formulations which are most similar to the stratum corneum in their
various solubility parameters.
A B
R² = -0.483
0
40
80
120
160
0 40 80 120 160
Pre
dic
ted
SSC
(mg/
mL)
Observed Ssc (mg/mL)
R² = 0.8488
0
20
40
60
80
100
120
0 40 80 120P
red
icte
d S
SC(m
g/m
L)Observed Ssc (mg/mL)

84
Figure 4.6. Solute solubility in vehicle and formulation uptake into stratum corneum as a
function of their estimated HSP distance (Ra). A & B. Vehicle solubility (SV) for caffeine
(circles) and naproxen (triangles) respectively versus the Ra between the nanoemulsion
formulations and controls; C & D: Formulation uptake into the stratum corneum for caffeine
(circles) and naproxen (triangles) respectively versus the Ra between the nanoemulsion
formulations and the skin. Black symbols - controls (solutions in water and 25%
PEG6000/water for caffeine, 25% PEG6000/water and Volpo-N10/EtOH/water for
naproxen); Yellow symbols - 60% EtOH/water; Green symbols - nanoemulsions containing
eucalyptol; Red symbols - nanoemulsions containing oleic acid.
4.4.5 In vitro permeation of caffeine and naproxen across full-thickness human skin
The cumulative amount of caffeine and naproxen penetrated through full-thickness human
skin (µg/cm²) was plotted as a function of time (h) and the slope yielded the pseudo steady-
state flux JSS (µg/cm2/h). The permeability coefficient KP (cm/h) was calculated from
equation 1. After 8 h exposure, the amount of caffeine delivered into the receptor from the
microemulsion formulations was significantly higher than controls (P<0.05), Fig 4.7.
A
0
40
80
120
10 20 30 40
S V(m
g/m
L)
Ra (V/A)
0
40
80
120
160
200
10 15 20 25
S V(m
g/m
L)
Ra (V/A)
0
40
80
120
160
10 20 30 40
S SC
(mg/
mL)
Ra (V/S)
0
40
80
120
10 15 20 25
S SC
(mg/
mL)
Ra (V/S)
B
C D

85
A B
Figure 4.7. In vitro percutaneous permeation through full-thickness human skin; A-caffeine;
B-naproxen (E1 (Eucalyptol 1 - green solid lines); E2 (Eucalyptol 2 - green dashed lines;
O1 Oleic acid 1 - red solid lines; O2 (Oleic acid - red dashed lines; C1 (water -, crosses; C2
(60% EtOH/water - yellow squares; C3 (50% PEG6000/water - diamonds and C4 (Volpo-
N10/EtOH/water - circles.
The calculated flux and permeability coefficient from O/W microemulsions for both systems
(OA and EU) was 10-fold higher (36.8 and 56 µg/cm2/h, respectively) than controls (C1, C2
and C3) (1.7, 4.6 and 1.2 µg/cm2/h, respectively) in the case of caffeine; and 2- to 3- fold
(11.9 and 11.3 µg/cm2/h OA and EU, respectively) higher than controls (C2, C4) (4.7 and
5.5 µg/cm2/h, respectively) for naproxen.
0
50
100
150
200
250
300
0 2 4 6 8
Cu
mu
lati
ve a
mo
un
t (µ
g/cm
2)
Time (h)
0
10
20
30
40
50
60
70
80
0 2 4 6 8
Cu
mu
lati
ve a
mo
un
t (µ
g/cm
2)
Time (h)

86
Table 4.4. Caffeine and naproxen permeation parameters for different vehicles though full-
thickness skin (Mean ± SD, n=4)
KP (cm/h *1E4) Jmax (g/cm2/h) D*
(x104 cm/h)
Formulation Caffeine Naproxen Caffeine Naproxen Caffeine Naproxen
C1 0.5±0.1 - 1.5±0.3 - 0.7±0.7 -
C2 1.2±0.3 1.4±0.3 10.0±3.0 7.3±2.8 0.7±0.2 4.0±1.5
C3 0.3±0.1 - 1.8±0.7 - 0.4±0.1 -
C4 - 1.6±0.1 4.2±1.5 4.5±1.6
E1 11.4±2.8 5.2±0.5 127.9±31.4 90.8±8.9 33.5±8.2 8.9±0.8
E2 12.0±2.1 4.8±1.0 132.5±26.5 71.1±8.8 36.3±7.2 6.2±1.4
O1 6.9±4.3 2.4±0.4 69.8±21.8 47.0±8.3 13.3±4.0 4.1±0.7
O2 9.6±1.6 3.3±1.0 86.9±15.0 55.7±18.2 13.5±2.0 5.8±2.2
C1 is 100% water, C2 is 60% ethanol/water, C3 is 25% PEG6000/water, and C4 is 25%
Volpo-N10 25% ethanol/50% water
EU nanoemulsions containing eucalyptol as oil phase, OA nanoemulsions containing Oleic
Acid as oil phase
Figure 4.8 shows that more caffeine was promoted from nanoemulsion formulations into
skin and stratum corneum than from the controls and that the amount permeating from these
formulations was greater for caffeine than for naproxen. However, the same pattern not seen
for lipophilic drug naproxen. Also, a significant difference (P<0.05) was found in the amount
of caffeine retained in the stratum corneum when compared between nanoemulsions and
controls (C1 & C3). No differences were found between nanoemulsion formulations for
caffeine and naproxen. Unexpectedly, high naproxen levels were retained in the stratum
corneum from control C2 (60% ethanol/water) solution. We are not sure why this occurred
but it could be due to enhanced partitioning of actives into the stratum corneum caused by
ethanol.

87
A-
B-
Fig 4.8 A-Caffeine; B-naproxen retained in the stratum corneum (SC) and skin from
nanoemulsion formulations and controls after 8 h permeation in full-thickness human skin
(Mean ± SEM, n=4)
Table 4.5 shows the lag time for full-thickness skin is higher than for epidermal membrane
for both caffeine and naproxen and from all nanoemulsion formulations and controls. It also
shows that the caffeine flux of nanoemulsion formulations from epidermal membranes was
significantly higher than the flux from full-thickness skin (P<0.05).The naproxen epidermal
flux was slightly higher than full-thickness skin but was not significant.
F o rm u la tio n s
Ca
ffe
ine
am
ou
nt
(ug
/cm
2)
C1
C2
C3
E1
E2
O1
O2
0
2 0 0
4 0 0
6 0 0
8 0 0
R e te n tio n in th e S C
R e te n tio n in th e s k in
Caf
fein
e am
ou
nt
(µg/
cm2)
F o rm u la tio n s
Na
pro
xe
n a
mo
un
t (
g/c
m2
)
C2
C4
E1
E2
O1
O2
0
5 0
1 0 0
1 5 0
2 0 0
R e te n tio n in th e S C
R e te n tio n in th e s k in
Nap
roxe
n a
mo
un
t (µ
g/cm
2 )

88
Table 4.5 Estimated lag times and steady state flux for caffeine and naproxen in epidermal
membrane and full-thickness skin.
Formulation Lag time (h) JSS (g/cm2/h)
Caffeine FTS Epi FTS Epi
C1 4 2.5 1.4±0.3 2.1±0.6
C2 3 2 3.7±1.1 9.4±0.9
C3 4 3 0.9±0.1 1.3±0.4
E1 2.5 1 34.2±8.6 70.4±0.3
E2 2.5 1 35.9±6.3 72.5±6.2
O1 2.5 1 20.6±2.0 35.0±19.6
O2 2.5 1 28.9±5.8 454±10.5
Naproxen
C2 3 1.5 2.9±0.8 9.2±1.5
C3 - 2 - 1.9±0.1
C4 4 2 3.3±1.2 5.7±1.7
E1 3 0.5 10.4±1.0 14.0±3.6
E2 3 0.5 9.6±2.3 11.7±1.1
O1 3 0.5 4.7±0.8 10.2±4.8
O2 3 0.5 6.5±2.0 8.7±0.3

89
4.4.6 Multiphoton microscopy of full-thickness human skin after exposure to
nanoemulsion formulations
MPM images of human full-thickness skin exposed to the formulations and corresponding
control samples (untreated) are shown in Figure 4.9. The pseudo-coloured images (40X)
have been recreated from normalised average endogenous autofluorescence lifetime of
NADPH and FAD. The images are coloured from shorter lifetime (blue) to longer lifetimes
(red). An area (2cm2) of skin pre-treated with the formulations for 8 h was imaged using the
Derma Inspect multiphoton tomography system. We observed a change in stratum corneum
morphology compared to the control skin. The hollowing of the cellular regions (Figure 4.9-
white arrow) can be attributed to the action of nanoemulsion on the stratum corneum lipids.
In addition, an increase in the thickness of the viable epidermis was observed. The visible
layers could be observed for a greater depth. In the case of the oleic acid formulation the
total depth of the epidermis was 100 µm; this is nearly twice the generally observed
thickness of epidermis. However, when metabolic analysis of the NADPH and FAD lifetimes
was conducted on the viable layers, no change was observed. The treated skin and the
control skin were both found to have a comparable average lifetime (tm). (188, 189)
Fig 4.9 Structural and viability study of excised skin following the topical application of
nanoemulsion formulations-. SC = stratum corneum; SG = stratum granulosum; OA =
nanoemulsions with oleic acid; EU = nanoemulsions with eucalyptol
SC
SG
Untreated OA EU
τm (0-2000 ps)

90
4.5 Discussion
This work has demonstrated that the skin permeation of caffeine and naproxen is markedly
enhanced using nanoemulsion formulations containing the penetration enhancers, OA and
EU, in comparison to the controls. These results are consistent with those previously
reported for skin permeation of hydrophilic and lipophilic drugs using microemulsion
formulations (190). A key question we also addressed was how the nanoemulsions with the
penetration enhancers promoted skin penetration. It is evident that the nanoemulsions made
in this study worked by three mechanisms, which may or may not be working in concert to
give a synergistic effect: i) an enhanced solubility of the drug in the applied vehicle, ii) uptake
of the vehicle carrying the drug into the stratum corneum, and iii) alteration of the properties
of the stratum corneum membrane, for example by fluidisation of the stratum corneum lipids.
The combinations of surfactants and oils used in our emulsions enabled the vehicle solubility
of both caffeine and naproxen to be increased more than any single solvent solution or
solvent mixture used in this study as controls (Table 4.3). The 3- to 4-fold increase in
solubility of the water soluble compound caffeine in the nanoemulsions compared to the
aqueous solution is most likely reflecting the process of micellar solubilisation (191). The
nanoemulsion induced enhanced solubility was even more evident with the lipophilic
naproxen, with a 6- to 8-fold solubility enhancement seen when compared to the complex
co-solvent mixture containing Volpo-N10 and ethanol (25.9 mg/mL). The findings are
consistent with the general view that solubilisation is even more pronounced for lipophilic
compounds (192). The nanoemulsions were also associated with excellent stratum corneum
solubility, particularly in the case of the more lipophilic naproxen (Table 4.3). Further, both
EU and OA are known to disrupt the stratum corneum by multiple mechanisms, including
dissolution of stratum corneum lipids (193).
To clarify that there had been a nanoemulsion induced permeation enhancement for caffeine
and naproxen, we estimated the solute maximum (or saturated) fluxes (Jmax). The use of
maximum flux enables the potential enhancement caused by the nanoemulsions to be
defined as it is now well recognised that maximum flux is independent of the vehicle and
dependent solely on the thermodynamic activity of the solute in the vehicle, provided the
vehicle or solute does not alter the properties of the membrane (106, 154). This concept
was initially highlighted by the work of Twist and Zatz (155), who showed the same flux for
methyl paraben across synthetic membranes, regardless of its solubility in a range of
different vehicles. Our results for the control solutions are consistent with these findings in
that a similar low value for Jmax for both caffeine and naproxen was found for each control

91
solution not affecting skin permeability across a range of vehicle solubilities. In contrast, the
Jmax values seen with nanoemulsions and to some extent, ethanol/water, are much higher
than the controls (Figure 4.3), consistent with their enhancement of skin permeability and
suggesting that these vehicles have altered the properties of the stratum corneum. The
penetration enhancer, EU, had a much greater effect on Jmax than OA for the hydrophilic
drug caffeine; a differentiation not seen with the lipophilic naproxen.
In order to understand the mechanisms by which the solutions and nanoemulsions had
acted as permeation enhancers, we also estimated the underlying Jmax determinants of
stratum corneum solubility and stratum corneum diffusivity. Ethanol, used as a co-surfactant
in these nanoemulsions, has been shown to extract stratum corneum lipids and perturb
barrier function by improving the permeation of more hydrophilic drugs such as caffeine
through skin by partitioning between the vehicle and stratum corneum. Peltola et al also
reported enhanced transdermal delivery of the lipophilic steroid oestradiol from
microemulsions containing ethanol as a co-surfactant (194), with which our findings are
consistent. Interestingly, ethanol has been reported to act synergistically with terpenes to
enhance penetration of both hydrophilic and lipophilic drugs (195, 196). The increased
ethanol content in the 60% ethanol/water mixture however, was likely to have a greater
effect on the skin, particularly on the extraction of skin lipids. This would have a larger impact
on the partitioning of the hydrophilic caffeine, compared to the lipophilic naproxen,
accounting for the much greater enhancement of SSC seen with caffeine.
Table 4.3 showed that the stratum corneum solubility of naproxen was enhanced by the
nanoemulsions much more than that for caffeine (range, 96-114 mg/mL compared to 36-64
mg/mL) and that this increased stratum corneum solubility was, in turn, associated with an
enhanced flux (Figure 4.4). In contrast, there was no such clear relationship seen with
caffeine (Figure 4.4). On the other hand, the apparent linear relationship between effective
diffusivity in the epidermal membrane and Jmax for caffeine (Figure 4.4) suggests that the
nanoemulsion formulations may have modified the stratum corneum lipids (157). In contrast,
the Jmax for naproxen appears to not have been increased by alterations in the stratum
corneum diffusivity. In general, diffusivity will be independent of solute lipophilicity for those
vehicles that do not affect the stratum corneum (107, 197). However, when the vehicle does
affect the stratum corneum, there may be varying impacts for different types of solutes. We
have found, for instance, an increased diffusivity for the more hydrophilic phenol compounds
such as isopropyl myristate (IPM) relative to more lipophilic phenols. IPM has a high affinity
for skin and can disrupt the lipid bilayer regions of the stratum corneum intercellular matrix.

92
Its stratum corneum diffusivity enhancement was most pronounced for moderately
hydrophilic compounds like methyl paraben (log P 1.95) and 4-propoxyphenol (log P 2.34)
and so may be anticipated to also affect caffeine (log P -0.07), consistent with the
nanoemulsion enhancement of its diffusivity seen in this work. Interestingly, we also
observed a reduced diffusivity for the more lipophilic phenols (above log P of about 3.0) from
IPM (107), consistent with our findings with naproxen. Our findings of diffusivity-mediated
caffeine flux increases, that were particularly evident in the nanoemulsions containing EU,
are consistent with previous work showing increased diffusivity of the polar compound 5-FU
with terpene enhancers, including EU (157). In that work, the terpenes were not considered
to act by increasing stratum corneum solubility but by disruption of the stratum corneum
lipids to enhance diffusivity. On the other hand, in other work, OA had only a moderate
diffusion-enhancing effect compared to the terpene d-limonene for solutes with a range of
lipophilicities (198), analogous to our findings. Terpenes have also been shown to enhance
the permeation of a lipophilic compound, tamoxifen, by enhancing its partitioning into the
stratum corneum (199). Williams and Barry (159) observed that in general, partitioning may
play a greater role in enhancement of more lipophilic substances. Another contribution to
enhanced flux seen with the nanoemulsions could come from an increase in surface area
coverage, due to distribution of the drug in the nanoemulsion droplets to aid in the transfer
of the active compounds from the formulation to the stratum corneum (184, 194).
A key finding in this work is that the nanoemulsion enhanced stratum corneum solubility is
due to the uptake of solute dissolved in the formulation and this, in turn, depends on the
solubilities of the solutes in the formulations and formulation uptake into the stratum
corneum. We did explore for any the relationships between the solubilities of the active
compounds in the various formulations and in the stratum corneum after application of the
formulations with the HSP distance for the nanoemulsions and actives (Figure 4.6). Our
conclusion is that the data are consistent with the adage of “like dissolves like” in that the
highest solubility in the formulations and the uptake of formulations into the stratum corneum
corresponded to the lowest HSP distance. The findings appear to be consistent with the
general principles enunciated by Abbott et al (153). Further studies using an expanded
range of vehicles and actives may allow predictive algorithms to be generated.
The caffeine and naproxen permeation of full-thickness skin and epidermis layers was
measured. Epidermal membrane had, as expected, higher permeability of caffeine and
naproxen as flux than the full-thickness skin. However, fluxes of caffeine and naproxen
absorbed into the receptor from full-thickness skin compared with epidermis were similar. A
study by Cross et al found that the ratio of fluxes of salicylate into the receptor from their

93
formulations remained constant in full-thickness skin and epidermis and they suggested that
the dermis constitutes a similar barrier to the diffusion of active ingredients from their
formulations (200). Therefore, the presence of dermis and hypodermis did not affect the
permeation amount of caffeine and the stratum corneum was just limiting the rate of barrier
against penetration. These results are similar to other results obtained from a study done in
2008 on caffeine (201).
The amount of caffeine and naproxen retained in the stratum corneum was measured by
tape stripping to correlate solubility of solute in the formulations to that in the stratum
corneum. We found that the solubility of nanoemulsion formulations containing caffeine and
naproxen in the stratum corneum followed the same trend as that obtained from tape
stripping (amount of caffeine and naproxen retained in the stratum corneum). It was seen
(Table 4.4) that the highest permeability of naproxen was obtained from OA and EU
nanoemulsion formulations, which may be due to high solubility of naproxen in the stratum
corneum from these formulations compared with controls. Naoui et al found significant
differences in the amount of caffeine stored in the stratum corneum (202). It was previously
claimed that diffusional resistance in the dermal matrix could significantly decrease the
permeability of lipophilic solutes (203). As shown in Table 4.5, this effect is evident for both
caffeine and naproxen in this study with the greatest reduction in flux and diffusion seen for
caffeine.
Our microscopic evaluation of the skin concurs with the lipid dissolution hypothesis. As
described in the results, the dissolution of stratum corneum lipids was evident after 8 h of
treatment with the emulsions. Walker and Hadgraft found that the use of oleic acid as a
penetration enhancer disrupted the intercellular lipid arrangement of the stratum corneum
(188). A study using a EU nanoemulsion with curcumin (log P 3.2) as a model penetrant
showed similar changes to those observed in our work (189). Their histological images
comparing a PBS control and the terpene nanoemulsion showed keratin fragmentation and
disruption of the lipid bilayers after 24 h microemulsion treatment of full-thickness pig ear
skin.

94
4.6 Conclusions
In conclusion, the nanoemulsion systems in this study significantly enhanced the human
epidermal permeation of caffeine and naproxen. Both a nanoemulsion increase in stratum
corneum solubility and in diffusivity could be shown as the key mechanisms for this increase
with the enhanced solubility arising from solute being carried into the stratum corneum with
the formulation. Analysis of these data using solubility parameters suggests that “like
dissolves like” is the key adage determining solute solubility in the formulations, uptake of
the formulations into the stratum corneum and then the stratum corneum solubility. Our
results comparing the responses in epidermal membrane full-thickness skin highlight the
additional behavior provided by the dermis in the permeation of both hydrophilic and
lipophilic solutes.

95
Chapter 5
Appendageal delivery
A. Potential of nanoemulsion formulations for delivery of Minoxidil through skin
appendages, stratum corneum and permeation through human skin.
B. Investigation of the effects of nanoemulsions containing penetration enhancers on
follicular penetration of the hydrophilic model compound caffeine.
5.1 Abstract
Hair follicles are pertinent and efficient penetration pathways and reservoirs for topically
applied chemicals/drugs. Penetration enhancers can also be incorporated as the oil phase
of microemulsions to further enhance drug delivery. Penetration enhancers are used to
reduce the skin barrier by physically and chemically altering its properties. Enhanced
minoxidil delivery, targeted to receptors localised within hair follicles, aims to promote hair
growth. We aimed to compare the permeation of minoxidil into and through excised human
skin using different nanoemulsion formulations, compared to a simple solution control. A
further aim was to prove that maximum flux of solutes can be enhanced by increasing its
solubility in stratum corneum lipid components and increasing the diffusivity of the solute in
the stratum corneum. Oil in water (O/W) nanoemulsions containing 2% minoxidil and either
oleic acid (OA) or eucalyptol (EU) as oil phase were prepared and characterised.
Nanoemulsions and control (C - 2% minoxidil in 60% ethanol/water) were applied to full-
thickness excised human abdominal skin in Franz diffusion cells (n=4) for 24 h. Minoxidil
concentrations in receptor fluid (through the skin), tape strip extracts (stratum corneum
retention), follicular casts (hair follicle retention) and homogenised skin extracts (deeper skin
retention) were analysed by high performance liquid chromatography (HPLC). Minoxidil
penetration through and into skin was greater for all nanoemulsions compared to the control.
The OA formulation was the best at promoting minoxidil retention into the superficial skin
compartments (stratum corneum and hair follicles). The EU formulation was best for deeper
penetration into and through the skin. We also found that maximum flux was related to
formulations and was dependent on stratum corneum solubilities for minoxidil. These
solubilities, in turn, depended on the amount of vehicle absorbed into the stratum corneum
and the amount of minoxidil dissolved in that absorbed formulation.

96
The second aim of this study was to investigate the effectiveness of our nanoemulsion
formulations for follicular delivery of caffeine. In excised human full-thickness skin, hair
follicles were opened by tape stripping, blocked with a microdrop of super glue and
acriflavine (for visualisation), or left untreated. Caffeine in nanoemulsion formulations
containing OA or EU and in controls was topically applied. Caffeine retention in the stratum
corneum, hair follicles and the skin, as well as penetration through the skin after 24 h was
determined. Separately, acriflavine was applied to the skin and imaged in the follicles and
surrounding area by multiphoton microscopy
Nanoemulsions caused significant increases in caffeine permeation through untreated skin,
compared to controls (16- and 25-fold for OA and EU, respectively), with the follicular route
contributing 18% of caffeine permeation for the OA nanoemulsion and 24% for EU. When
follicles were opened, the respective contributions rose to 32% and 43%. The
nanoemulsions also promoted caffeine retention in the follicles, with 11- and 15-fold
increases with OA and EU, respectively. Imaging showed cellular uptake of acriflavine
around the opened follicle, but not in the untreated follicle with OA, suggested that OA was
unable to penetrate the sebum barrier around the follicle. This study demonstrated effective
delivery of a hydrophilic model drug into and through hair follicles and showed that the
follicles and surrounding regions may be targeted by optimised formulations for specific
treatment.
O/W nanoemulsions containing OA or EU enhanced transdermal delivery of minoxidil. OA
appeared to promote stratum corneum and follicular delivery more than EU. This study has
also suggested that OA and EU nanoemulsions containing caffeine as a hydrophilic model
drug appeared to be convenient to be used in the transfollicular penetration. Improved
follicular targeting has implications for acne treatment and vaccine delivery to adjacent
antigen-presenting cells.
5.2 Introduction
The knowledge of the permeation process is essential for improving and optimising skin
transport solutes and cosmetics. Even though the stratum corneum is commonly known as
the most important barrier to transdermal absorption, it is also regarded as the main route
for penetration. Recently, researchers have suggested, in addition to percutaneous
absorption, hair follicles and sebaceous glands may contribute significantly to topical or
transdermal delivery (204). Previously, the actual importance of the transfollicular route had
been overlooked based on the fact that the hair follicle orifices occupy only approximately
97
0.1% of the total skin surface area (205). Nonetheless, hair follicles are a pocket within the
epidermis extending deep into the dermis, providing a much greater area for absorption
below the surface of skin. Follicular density has major effects on penetration. Shelley and
Melton observed the appearance of tiny multiperifollicular wheals on hairy human skin after
topical administration of epinephrine and histamine phosphate in propylene glycol. There
was no response in areas with less hair density, thus, suggesting follicular contribution (206).
Also, studies by a number of researchers have shown higher absorption rates in skin areas
with higher follicle density (207), (208). Previous studies of the transfollicular route were
mostly qualitative and histological studies depended on stain and dye localisation within the
hair follicle. For instance, Mackee et al (209) were amongst the first to study the role of the
hair follicles in topical drug delivery. There have been substantial studies on the effect of
vehicles and drugs on the transfollicular route but it seems the physicochemical features of
the solute itself may influence the final transport of the solutes within the skin. Many
theoretical considerations of the follicular route have been suggested. Theoretical
consideration of the transfollicular or shunt pathway was first considered by Scheuplein
(210). Shunt-mediated diffusion of charged dye was observed. Transient diffusion depended
upon conditions, considered to be either transdermal or transfollicular (210). These
examples of transient percutaneous absorption apply only to solution dosage forms, and
can not necessarily be extended to other topical vehicles (204). Particle size may greatly
influence targeted delivery into hair follicles (205), (211) and different particle sizes may be
used to aim at various depths in the follicular duct. It has been suggested that 750 nm and
1500 nm polystyrene particles can penetrate to the end of a hair follicle (44). However, it
has been also reported that 750 and 1500 nm particles were not able to enter the cells after
topical administration, although 40 nm particles did enter (212). Lademann et al (15)
identified body-region-dependent hair follicle features varying in follicular size and follicular
distribution. Furthermore, it has been reported that solutes enter from active hair follicles
only and that inactive or closed hair follicles produce sebum and prevent the growth of hair.
Consequently, open orifices are obtained by mechanical peeling before applying the
substances (213). The variation in the stratum corneum thickness in different body areas
has been the most important reason for the varying rates of absorption.
Nanoemulsions are a modern approach to carrying drugs acting as new delivery system due
to their high solubilisation and the possibility of managing delivery rates of drugs. Mostly,
these advanced formulations have been used topically. It is believed that drug permeation
rates from nanoemulsions are significantly higher than from other formulations such as
conventional emulsions and vehicles because the nanoemulsions combine several

98
enhancing components (202). Nanoemulsions are a dispersed system of oil, water,
surfactant and co-surfactant. The mixture of oil, water and surfactant could form a wide
range of phases or structures, which can be discerned microscopically. The
physicochemical properties of nanoemulsions influence the delivery of a drug to the skin
and many hypotheses have been put forward. One of these theories claimed that contact of
the drug with the skin could be improved by low interfacial tension between oil and water
(176). The bioavailability of the drug increases due to the low interfacial tension and the
fluctuating oil-water interface, which enhances material movement between lipophilic and
hydrophilic domains of the nanoemulsion and the stratum corneum (202).
The aim of this study was to determine the influence of an oil-in-water droplets nanoemulsion
on the permeation of minoxidil as a moderate lipophilic drug (log P 1.24) in hair follicles,
stratum corneum, other skin layers and in receptor samples after 24 h. Minoxidil was the
drug to be loaded into the nanoemulsions that contained EU and OA (oil), Volpo-N10 (non-
ionic surfactant) and ethanol (co-surfactant). The second aim of the present study was to
investigate the transfollicular delivery enhancement of caffeine using the same
nanoemulsion formulations. Differential tape stripping was performed followed by
cyanoacrylate skin surface biopsies to determine the amount of caffeine in the hair follicles.
Follicular closing and opening technique in human skin was also performed to determine
the penetration of caffeine through hair follicles. Skin was also imaged using a LaVision
multiphoton microscope to see permeation into hair follicles and the area around the hair
follicles.
5.3. Materials and Methods
5.3.1 Chemicals
Caffeine, minoxidil, ethanol, OA and EU, were purchased from Sigma-Aldrich Pty. Ltd.
(Sydney, Australia). Volpo-N10 was obtained from Umiqema (Witton Centre, Witton Redcar
TS10 4RF, UK). All chromatography reagents were analytical grade.
5.3.2 Nanoemulsion formulation preparation and Characterisation
Volpo-N10 (surfactant) was dissolved in ethanol (co-surfactant) in a 1:1 ratio. The resulting
mixture was then mixed with the oil phase, OA or EU (oil) in a 0.6:1:1 ratio followed by gentle
mixing with phosphate buffered saline (PBS). The resulting nanoemulsion was clear at room
temperature. Minoxidil and caffeine were dissolved in selected nanoemulsions at 2% and

99
3% w/w, respectively. The characterisation methods are described in Chapter 5. The
compositions of emulsions and control solutions are shown in Table 5.1 and 5.2.
Table 5.1 Compositions and solubilities of minoxidil in selected nanoemulsion formulations
and control (%w/w)
Formulation Compositions
C 2% minoxidil in 60% ethanol
M1E 2% minoxidil + 15.93% EU+53.10% Volpo-N10/ethanol+30.97% water
M2E 2% minoxidil + 14.63% EU+ 48.78% Volpo-N10/ethanol+ 36.59% water
M3O 2% minoxidil + 15.93% OA+53.10% Volpo-N10/ethanol+30.97% water
M4O 2% minoxidil + 14.63% OA+ 48.78% Volpo-N10/ethanol+ 36.59% water
Table 5.2 Compositions of selected nanoemulsion formulations and controls (%w/w)
Formulation Compositions
C1 3% caffeine in water
C2 3% caffeine in 25% PEG6000/water
MO 3% caffeine + 14.63% OA+ 48.78% Volpo-N10/ethanol+ 36.59% water
ME 3% caffeine + 14.63% EU+ 48.78% Volpo-N10/ethanol+ 36.59% water
5.3.3 Determination of SV and the solubility in the stratum corneum SSC
Solubility in the formulation (SV) was determined by adding minoxidil to 5 mL of each
nanoemulsion or control solution until an excess amount remained. The samples were then
incubated in a water bath at 32°C for 24 h with continuous agitation and centrifuged at 4700
rpm for 10 minutes. The supernatant was withdrawn and diluted to accurately quantify the
amount of each compound by HPLC.
The stratum corneum was prepared from epidermal sheets by trypsin digestion (149), then
stored frozen at -20°C until use. Circles of stratum corneum (4 replicates for each
formulation) were weighed before use. They were then equilibrated in a saturated solution
1mL of each formulation at 32°C for 24 h, according to established methods (150). At the

100
end of the incubation period, the stratum corneum was removed and blotted dry. Then it was
extracted using 1 mL 70% ethanol/water for another 24 h, at the same temperature used for
equilibrium (32°C). The solubility in the stratum corneum (SSC) was determined from the
amount of recovered model compound in the extraction fluid, measured by HPLC, divided
by the area (1.33cm) and the thickness (0.02cm) of the stratum corneum.
5.3.4 Solvent uptake in the stratum corneum
The total solvent uptake into the stratum corneum was determined from the weight
difference of piece of the dry stratum corneum (about 0.7mg) soaked in individual
formulations (1mL) for 24 h at 32°C. The stratum corneum pieces wiped three times with
Kimwipe tissues before weighing again.
5.3.5 Open hair follicles technique
A cyanoacrylate skin surface biopsy was used to open the hair follicles; a drop of ethyl
cyanoacrylate, (Loctite Super glue) was placed on the skin and covered with a glass slide
under slight pressure as described by Lademann 2000 (214). After 5 min, the cyanoacrylate
polymerised and the slide was removed with one quick movement to open the hair follicles.
5.3.6 Blocked hair follicle technique
Our group has developed a method to plug the hair follicles on excised skin to evaluate their
contribution in permeability across the skin. Accordingly, all hair follicles in a marked region
were carefully identified under the ZEISS microscope (Stemi 2000-C). The plugging
procedure involved applying 0.1μL acriflavine solution (dissolved in milliQ water) to form a
globule around the follicle and subsequently 0.1μL of ethyl cyanoacrylate, (Loctite Super
glue) (Henkel, Ohio, USA) was added on top of it. The polar monomers of cyanoacrylate
polymerise when they come in contact with the water molecules in the presence of
acriflavine dye. This dye-sensitised polymerisation forms long and strong chains, thus
plugging the skin and hair follicle.

101
5.3.7 In vitro skin penetration study
In the first part, 2% minoxidil was totally solubilised in formulations that have high
concentrations of water (e.g., O/W) Therefore, two concentrations of nanoemulsion
formulations were chosen for OA and EU and control in minoxidil (Table 5.1). In vitro skin
absorption studies were performed on a Franz diffusion cell with an effective diffusion area
of 1.33 cm² and 3.4 mL receptor chamber capacity using full-thickness human abdominal
skin. The skin was cut into circlular pieces and mounted in a Franz diffusion cell between
donor and receptor compartment, the stratum corneum side was facing the donor chamber
and the dermal side was facing the receptor chamber. The receptor contained PBS buffer
(pH 7.4) at 35°C. 1 mL of nanoemulsion formulation or control formulation was added to the
donor. The donor was wrapped with parafilm after addition of the nanoemulsions to prevent
water evaporation. After 30min, 60min, 90min, 2h, 3h, 4h, 6h, 8h and 24h, 200 µL of the
receptor was withdrawn and replaced with the same amount of fresh PBS buffer. The
samples were analysed by HPLC. After Franz diffusion studies were completed, skin in each
cell was wiped with cotton buds to remove any remaining formulation and then subjected to
tape stripping (20 times) which involved by application of adhesive tape (D-Squame tapes,
CuDerm Corp., TX) to the exposed skin surface for about 5 second, and then the tape was
carefully removed. The tapes were placed into separate vials and soaked overnight with 2
mL methanol before analysis by HPLC. The amount of absorbed material in the tapes was
determined, representing material deposited within the stratum corneum.
Follicular casting followed tape stripping; one drop of superglue was placed on a microscope
slide. Then, the slide was pressed onto the surface of the stripped skin with light pressure
for 15 min. After that, the slide was peeled carefully from the skin. The superglue was
dissolved by rubbing with acetone–soaked cotton buds (four times), the cotton buds were
soaked overnight in 2 mL methanol and then were analysed by HPLC.
After follicular casting, the skin was chopped into small pieces, homogenised and soaked
overnight in 2 mL methanol under constant shaking and at room temperature before being
analysed by HPLC.
Part 2 of study, the full-thickness skin (FTS) was cut into discs and divided into three groups
(open hair follicles, plugged hair follicles and normal skin), then mounted in horizontal glass
Franz type static diffusion cells, stratum corneum side uppermost, with 3 replicates for each
formulation. The Franz diffusion cells had an exposed surface area of 1.33 cm² and a
receptor volume of approximately 3.4 mL. The formulations (see Table 5.2) were applied to

102
the skin at an infinite dose of 1mL and the donor chamber was covered with a glass cover
slip to minimise evaporation from the donor phase. Samples of receptor phase (200 µL)
were removed at regular time points over the next 24 h and replaced with the same amount
of fresh PBS. All samples were analysed using HPLC.
After Franz diffusion studies were completed, the skin in each cell was wiped with cotton
buds to remove any remaining formulation and then subjected to tape stripping (20 times)
which involved application of adhesive tape (D-Squame tapes, CuDerm Corp., TX), to the
exposed skin surface for about 5 second, and then carefully removed. The tapes were
placed into separate vials and soaked overnight with 2 mL methanol before being analysed
by HPLC. Results for the first tape are discarded, as this represents surface deposited
material only.
Follicular casting followed tape stripping. One drop of superglue was placed on a
microscope slide. Then, the slide was pressed onto the surface of the stripped skin with light
pressure for 15 min. After that, the slide was peeled carefully from the skin. The superglue
was then dissolved by rubbing with acetone–soaked cotton buds (four times). The cotton
buds were soaked overnight in 2 mL methanol and then analysed by HPLC.
After follicular casting, skin was chopped into small pieces, homogenised and soaked
overnight with 2 mL methanol under constant shaking before being analysed by HPLC.
5.3.8 Sample analysis
Minoxidil and caffeine in the receptor fluid, stratum corneum, hair follicles and skin layers
were analysed and validated by sensitive and rapid HPLC. The HPLC system consisted of
a Shimadzu SIL-20 a HT, CBM-20A system controller, a SPD-20A detector, LC-20AD a
pump and an auto injector. Isocratic separation was performed on a Phenomenex Luna C18
5μ (150×4.6 mm) column. The mobile phase of minoxidil (60% of 0.01M sodium dihydrogen
phosphate [Na2H2PO4] buffer, 40% acetonitrile v/v containing 2.5 mM sodium dodecyl
sulphate [SDS] (adjusted to pH 3) was pumped across the system at 1mL/min flow rate.
Minoxidil and its internal standard (propyl paraben) were detected at 281 nm. The caffeine
in the skin and receiver compartments were assayed by HPLC using the same conditions
as described in Chapters 3 and 4.

103
5.3.9 Visualisation of follicles and follicular delivery
The LaVision Microscope (LaVision BioTec GmbH, Germany) was used to assess the effect
of these formulations in hair follicles and the area around hair follicles. The Multiphoton
system coupled to an ultra-short-pulsed Titanium Sapphire laser (Mai Tai, Spectra Physics,
Mountain View, California, USA) was used to image the skin. Full-thickness abdominal skin
(3 replicates) were mounted in Franz diffusion cells and a finite dose of acriflavine in the
formulations containing EU, OA and control (water) was applied. Samples of untreated skin
were used as controls. After 24 h, the cells were dismantled and the skin was rinsed gently
with water and blotted dry with a tissue. It was then placed directly on a microscope slide.
Images were captured by two photon excitation at 740 nm. A 100 µm Z- stack was captured
with a 5 µm step size totalling 20 images. The skin was imaged through to capture different
depths, from the superficial surface, corresponding to the stratum corneum (SC; ~5-10 µm),
stratum granulosum (SG; ~15-20 µm), stratum spinosum (SS; 25-30 µm) and stratum basale
(SB; 35-40 µm). Keratinocyte morphology was used to confirm each of these layers. Image
analysis was done using Image J (Wayne Rasband, National Institutes of Health, USA).
5.3.10 Data analysis
The cumulative amount (Q, µg/cm²) of minoxidil and caffeine penetrating through an area of
1.3 cm2 was plotted against time (h). The steady state flux, JSS (µg/cm²/h), was determined
from the slope of the linear portion of the cumulative amount (Q) versus time plot.
The maximum flux (Jmax) that would be applicable to saturated solutions can be estimated
from the experimental steady state flux corrected for the known solubility in the formulation
by Equation 1 (185)
Jmax= JSS. SV / CV Equation (1)
Where SV is the solubility in the formulation and CV is the experimental concentration used.
The permeability coefficient KP (cmhˉ¹) was calculated by Equation 2 below which is derived
from Fick’s 1st law of diffusion (215).
KP = JSS / CV Equation (2)
Where CV is the initial concentration of the model compound in the donor.
The apparent diffusivity of solute in the skin divided by path length (D*) was calculated from
the maximum flux and the solubility of the active compound in the stratum corneum
according to Equation 3 (185).
104
D* = Jmax / SSC Equation (3)
Where SSC is the experimentally determined solubility of the solute in the stratum corneum.
Hansen solubility parameters (HSPs) (D, P, H) for formulation excipients, solvents and
active compounds were obtained from the software package HSPiP (JW solutions B.V., The
Netherlands). The total solubility parameters were also obtained from HSPiP, according to
the formula:
total2 = D
2 + P2 + H
2 Equation (4)
The cumulative amount, fluxes and transfollicular penetration per one hair follicle in the
receiving solutions were calculated by the following equations which have been mentioned
below:
Cumulative amounts (µg/cm2) = 𝑭𝑨 𝒐𝒑𝒆𝒏−𝑭𝑨 𝒃𝒍𝒐𝒄𝒌
𝟏.𝟑𝟑
Transfollicular penetration per one HF (µg/one HF) = (𝑭𝑨 𝒐𝒑𝒆𝒏−𝑭𝑨 𝒃𝒍𝒐𝒄𝒌)
𝒏𝒖𝒎𝒃𝒆𝒓 𝒐𝒇 𝑯𝑭
Where FA open was the caffeine amount in the open system, FA block was the caffeine
amount in the block system and HF was the hair follicle.
5.3.11 Statistics
All experiments were analysed by one-way analysis of variance (ANOVA) with post-hoc
comparisons (Tukey) using GraphPad Prism 6 (GraphPad Software Inc. La Jolla, CA92037,
USA); P<0.05 was considered to be significant.
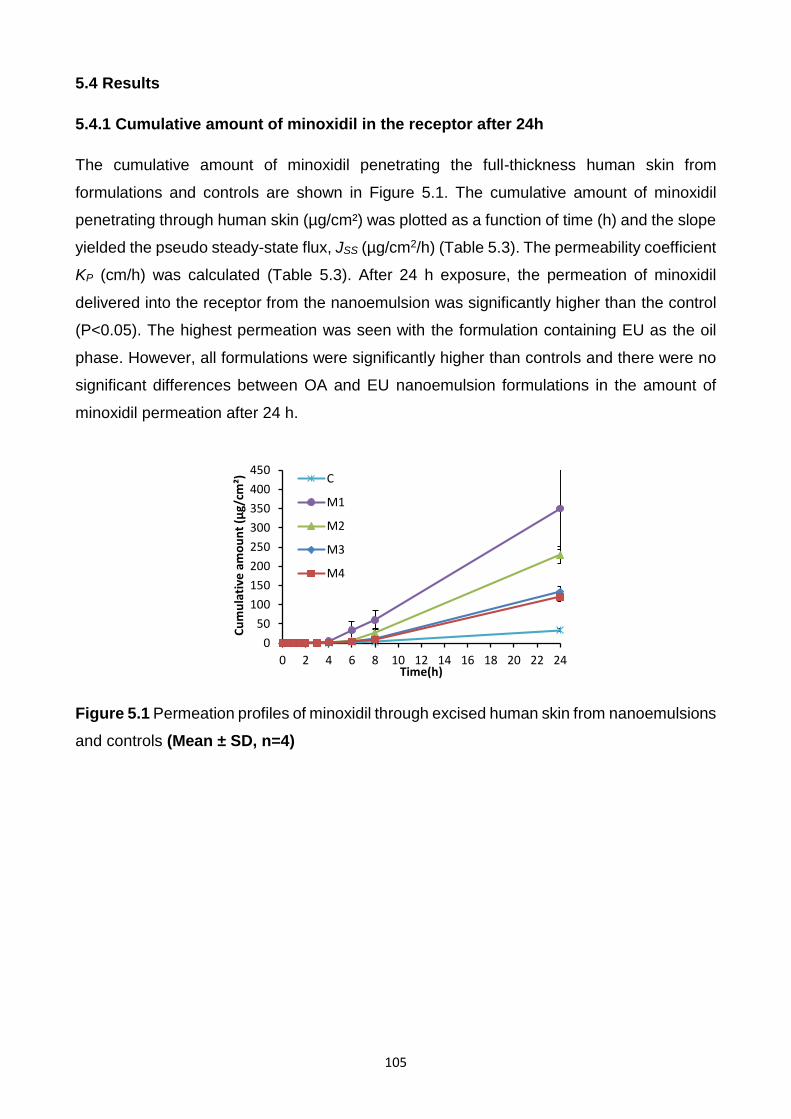
105
5.4 Results
5.4.1 Cumulative amount of minoxidil in the receptor after 24h
The cumulative amount of minoxidil penetrating the full-thickness human skin from
formulations and controls are shown in Figure 5.1. The cumulative amount of minoxidil
penetrating through human skin (µg/cm²) was plotted as a function of time (h) and the slope
yielded the pseudo steady-state flux, JSS (µg/cm2/h) (Table 5.3). The permeability coefficient
KP (cm/h) was calculated (Table 5.3). After 24 h exposure, the permeation of minoxidil
delivered into the receptor from the nanoemulsion was significantly higher than the control
(P<0.05). The highest permeation was seen with the formulation containing EU as the oil
phase. However, all formulations were significantly higher than controls and there were no
significant differences between OA and EU nanoemulsion formulations in the amount of
minoxidil permeation after 24 h.
Figure 5.1 Permeation profiles of minoxidil through excised human skin from nanoemulsions
and controls (Mean ± SD, n=4)
0
50
100
150
200
250
300
350
400
450
0 2 4 6 8 10 12 14 16 18 20 22 24
Cu
mu
lati
ve a
mo
un
t (µ
g/cm
²)
Time(h)
C
M1
M2
M3
M4

106
Table 5.3 Transdermal permeation parameters and pH of the minoxidil from formulations
and control (Mean ± SD, n=4)
Formulation JSS
(µg/cm2/h)
Kp X1E4
(cm²/h)
Jmax
(µg/cm²/h)
D*
(x104 cm/h)
SV
(mg/mL) SSC
(mg/mL) pH
C 1.9±0.1 0.9±0.0 3.3±0.2 0.8±0.0 34.7±2.7 44.3±4.6 7.2
M1E 18.1±2.3 9.1±1.1 188.4±23.4 13.8±0.1 207.8±1.6 136.1±16.9 7.1
M2E 12.7±1.9 6.3±0.1 179.9±27.1 12.5±1.8 283.4±2.3 143.9±13.4 7.2
M3O 6.2±1.9 3.1±1.3 42.6±12.9 5.7±2.4 137.3±1.1 74.2±8.0 5.4
M4O 6.9±1.2 3.5±0.5 52.8±9.0 7.0±1.2 152.1±1.3 75.1±5.7 5.9
5.4.2 Amount of minoxidil in the stratum corneum and hair follicles
The effect of nanoemulsion formulations on minoxidil penetration into the stratum corneum
was assessed by tape stripping, is shown in Figure 5.2. Application of M1E M2E, M3O,
resulted in more minoxidil being recovered in the stratum corneum than from control and
M4O. The minoxidil recovered from follicular casting is also shown in Figure 5.2; more
minoxidil was retained from the appendages after application of the formulation containing
OA than EU, although both were higher than the control which contained 60% ethanol.
However, the differences between these formulations (OA, EU) failed to reach statistical
significance.
Figure 5.2 Minoxidil retained in stratum corneum, hair follicles and skin layers (Mean ± SD,
n=4)
CM
1E
M2E
M3O
M4O
0
1 0 0
2 0 0
3 0 0
F o rm u la tio n s
Min
ox
idil
pe
ne
tra
tio
n (
g/c
m2
)
R e te n tio n in th e S C
R e te n tio n in H a ir fo llic le s
R e te n tio n in th e s k in
Am
ou
nt
of
min
oxi
dil
(µg/
cm2)

107
5.4.3 Amount of minoxidil retained in the skin layers (viable epidermis and dermis)
after 24h
The amount of minoxidil retained in the skin after 24 h from nanoemulsion formulations and
control is showed in Figure 5.2. Minoxidil retained in the skin from nanoemulsion
formulations were significantly higher than control and were in this order M1E>M2E> M3O>
M4O, the same pattern as receptor.
5.4.4 Jmax estimated, solubility in the stratum corneum SSC and diffusivity (D*) and SV
Maximum flux (calculated from steady state flux using Equation 1), permeability coefficient
KP (calculated from Equation 2) and the apparent diffusivity D* (diffusivity divided by path
length, from Equation 3) are shown in Table 5.3 (caffeine). Significantly enhanced fluxes
were observed for minoxidil with the nanoemulsions compared to the control. Apparent
diffusivity was also enhanced with the nanoemulsions
To elucidate the mechanisms by which maximum flux was enhanced in these formulations,
we examined the relationships between Jmax and some determinants of this parameter. As
seen in Figure 5.3A, the stratum corneum solubility of minoxidil was enhanced by the
nanoemulsions much more than that of the control (range, 34.7-283 mg/mL). Moreover,
minoxidil increased stratum corneum solubility, which was associated with an enhanced flux.
Figure 5.3B shows a clear relationship between effective diffusivity in the membrane and
Jmax, indicating that the nanoemulsion formulations have affected the epidermis so that
diffusivity also has become a major determinant for Jmax for this drug.
In addition, minoxidil has shown no relationship between SSC and solubility in formulations
(SV) for all nanoemulsion formulations (Fig 5.3C).

108
Figure 5.3 Minoxidil A - Jmax
values for all formulations versus solubility in the stratum
corneum (SSC
) (R2=0.77); B- J
max values for all formulations versus Diffusivity (D*) (R
2=
0.89); C- Solubility in the stratum corneum versus SV; D- Solute uptake
versus total solubility
parameters (yellow circle is control (60% ethanol/water), red is OA formulations and green
is EU formulations).
5.4.5 Minoxidil solubility in the vehicles
The solubility of minoxidil in the formulations is also shown in Table 5.3. The solubility of
minoxidil in the control (60% ethanol/water) was much less than in the corresponding values
of the nanoemulsions. EU tended to enhance the stratum corneum solubility of minoxidil
more than OA did.
5.4.6 Solubility in the stratum corneum and solvent uptake.
The solubility of caffeine in the stratum corneum for each of the different vehicles is shown
in Table 5.3. There were significant differences between the stratum corneum solubilities of
y = 1.1236xR² = 0.7778
0
50
100
150
200
0 50 100 150
J ma
x(µ
g/cm
2 /h
)
SSC (mg/mL)
y = 12.708xR² = 0.8997
0
50
100
150
200
0 5 10 15
J ma
x(µ
g/cm
2 /h
)
D* (cm/h x 1E4)
0
50
100
150
200
0 100 200 300
S SC
(mg/
mL)
SV
0
0.1
0.2
0.3
0.4
0.5
0.6
0.7
25 30 35
Solu
te u
pta
ke(m
g)
δTotal
A B
C D

109
minoxidil in the nanoemulsion vehicles compared to the control solution. We investigated
the possibility that the stratum corneum solubility was determined by the uptake of the
vehicle into the membrane, carrying solute with it. We explored whether vehicle uptake into
the stratum corneum was related to the properties of the vehicle. Figure 5.3D shows solute
uptake into the stratum corneum plotted against the total solubility parameter of the vehicle
(total); we found that solvent uptake into the stratum corneum is greatest for those
formulations where the total solubility parameter is lowest (Fig 5.3D).
Figure 5.4 SSC
(predicted) versus SSC
(measured) (yellow circle is control (60%
ethanol/water), red is OA nanoemulsion and green is EU nanoemulsion)
We also attempted to predict solubility in the stratum corneum from solvent uptake (Fig 6.4),
by assuming the solute was taken up by the stratum corneum partitions into a skin
compartment from the vehicle, using the equation:
SSC (predicted) = SSC (skin, control) + SV (vehicle) * Vup / VSC
Where Vup is solvent uptake and VSC is the volume of the stratum corneum. SSC (skin,
control) represents the solute in the skin compartment, derived from the experimental data
for a control solution:
SSC (skin, control) = SSC (exp, control) – SV (exp, control) * Vup (control) / VSC
Where SSC (predicted) was plotted against SSC (experimental) versus experiment stratum
corneum (Figure 5.4); a good relationship was found with minoxidil (R2=0.82).
5.4.7 Cumulative amount of caffeine in the receptor after 24 h
Two nanoemulsion formulations containing OA and EU as the oil phase and as penetration
enhancers have been characterised and tested in a previous study and have been used in
R² = 0.828
0
50
100
150
200
250
0 50 100 150
Pre
dic
ted
(S S
C)
SSC ( mg/mL) (experimental)

110
the present study (Table 5.2). The cumulative amount of caffeine penetrating the full-
thickness human skin from open, normal and block hair follicles from these formulations and
controls are shown in Figure 5.5A-C. The cumulative amount of caffeine penetrating through
human skin (µg/cm²) was plotted as a function of time (h) and the slope yielded the pseudo
steady-state flux JSS (µg/cm2/h) (Table 5.4). After 24 h exposure, the permeation of caffeine
delivered into the receptor from the nanoemulsions was significantly higher than the controls
(P<0.05).The highest permeation was seen from the open hair follicles Fig 5.5B. However,
there were no significant differences between open and normal hair follicles in the amount
of caffeine permeating after 24 h (Fig 5.5A&B).
The caffeine flux from nanoemulsion formulation systems was higher than the controls. The
caffeine flux from open hair follicles (OHF) was higher than from normal hair follicles (NHF)
and block hair follicles (BHF) from ME formulation systems. The transfollicular penetration
of caffeine from nanoemulsion formulations was also calculated and found to be higher than
controls (Fig 5.6A&B) (Table 5.4). Also, the transfollicular flux was higher for nanoemulsions
relative to controls (Table 5.4).

111
Table 5.4 The cumulative amounts (µg/cm2), fluxes (µg/cm2/h) and follicular penetration
(µg/one hair follicle) by follicular closing technique and open hair follicle technique using
Franz diffusion cells for 24 h from nanoemulsion formulations and controls.)
Formulations C1 C2 MO ME
Cumulative amount (µg/cm2) (NHF) 28.2±7 27.3±2.8 441.4±21.5 672.5±23.8
Cumulative amount (µg/cm2) (OHF) 67.5±10 20.6±2.6 845.9±105 884.2±98
Cumulative amount (µg/cm2) (BHF) 21.3±1.4 16.6±3.4 362.7±27 510.2±9.4
Cumulative amount (µg/cm2) (N-BHF) 12.2 14.9 168.7 288.9
Cumulative amount (µg/cm2) (O-BHF) 51.5 8.3 573.2 500.6
Transfollicular per one HF (N-BHF) 1.7 2.1 24.1 41.3
Transfollicular per one HF (O-BHF) 7.4 1.6 81.9 71.5
Flux (NHF) 0.6±1 1.3±0.1 21.4±1 32.6±1
Flux (OHF) 2.5 ±0.1 0.1±0.01 40.1±4.5 41.2±5
Flux (BHF) 1.1±0.02 0.9±0.1 17.6±1.3 24.7±0.4
Flux (N-BHF) 0.6 0.7 8.7 15
Flux (O-BHF) 1.1 0.3 27.9 22.7
Flux- Transfollicular per one HF (N-BHF) 0.1 0.9 1.2 2.1
Flux- Transfollicular per one HF (O-BHF) 0.2 0.04 4 3.2
HF = hair follicle; NHF = normal hair follicle, OHF = open hair follicle, BHF = blocked hair
follicle (Mean±SEM, n=3); N-BHF = Contribution to permeation by all the hair follicles;
O-BHF = Contribution to permeation by the open hair follicles.

112
A-
B-
C-
Figure 5.5 Permeation profiles of caffeine through: A- normal excised human skin; B-
Excised human skin (after opening the hair follicles); C- Excised human skin (after plugging
the hair follicles) from nanoemulsion formulations and controls (Mean±SEM, n=3).
MO (Nanoemulsion with oleic acid); ME (Nanoemulsion with eucalyptol); B (Blocked hair
follicles).
0
100
200
300
400
500
600
700
800
0 2 4 6 8 10 12 14 16 18 20 22 24
Cu
mu
lati
ve a
mo
un
t (µ
g/cm
2 )
Time (h)
C1
C2
MO (N)
ME (N)
0
200
400
600
800
1000
1200
0 2 4 6 8 10 12 14 16 18 20 22 24
Cu
mu
lati
ve a
mo
un
t (µ
g/cm
2)
Time (h)
C1
C2
MO (O)
ME (O)
0
100
200
300
400
500
600
0 2 4 6 8 10 12 14 16 18 20 22 24
Cu
mu
lati
ve a
mo
un
t (µ
g/cm
2 )
Time (h)
C1
C2
MO (B)
ME (B)

113
A-
B-
Figure 5.6 Permeation profiles of caffeine through excised human skin: A- Contribution to
permeation by all the hair follicles; B- Contribution to permeation by the open hair follicles
from nanoemulsion formulations and controls (Mean±SEM, n=3).
MO (Nanoemulsion with oleic acid); ME (Nanoemulsion with eucalyptol); N (Normal hair
follicles).
5.4.8 Amount of caffeine in the stratum corneum and in the hair follicles
The effect of nanoemulsion formulations and controls from different techniques on caffeine
penetration into the stratum corneum, which has been assessed by tape stripping, is shown
in Figure 5.7 and Table 5.5. More caffeine has been recovered from the stratum corneum
from nanoemulsions than from controls and similar pattern for both controls and
nanoemulsions from all techniques.
0
100
200
300
400
500
600
700
0 2 4 6 8 10 12 14 16 18 20 22 24
Cu
mu
lati
ve a
mo
un
t (µ
g/cm
2 )
Time (h)
C1
C2
MO (N)
ME (N)
0
100
200
300
400
500
600
700
0 2 4 6 8 10 12 14 16 18 20 22 24
Cu
mu
lati
ve a
mo
un
t (µ
g/cm
2 )
Time (h)
C1
C2
MO
ME
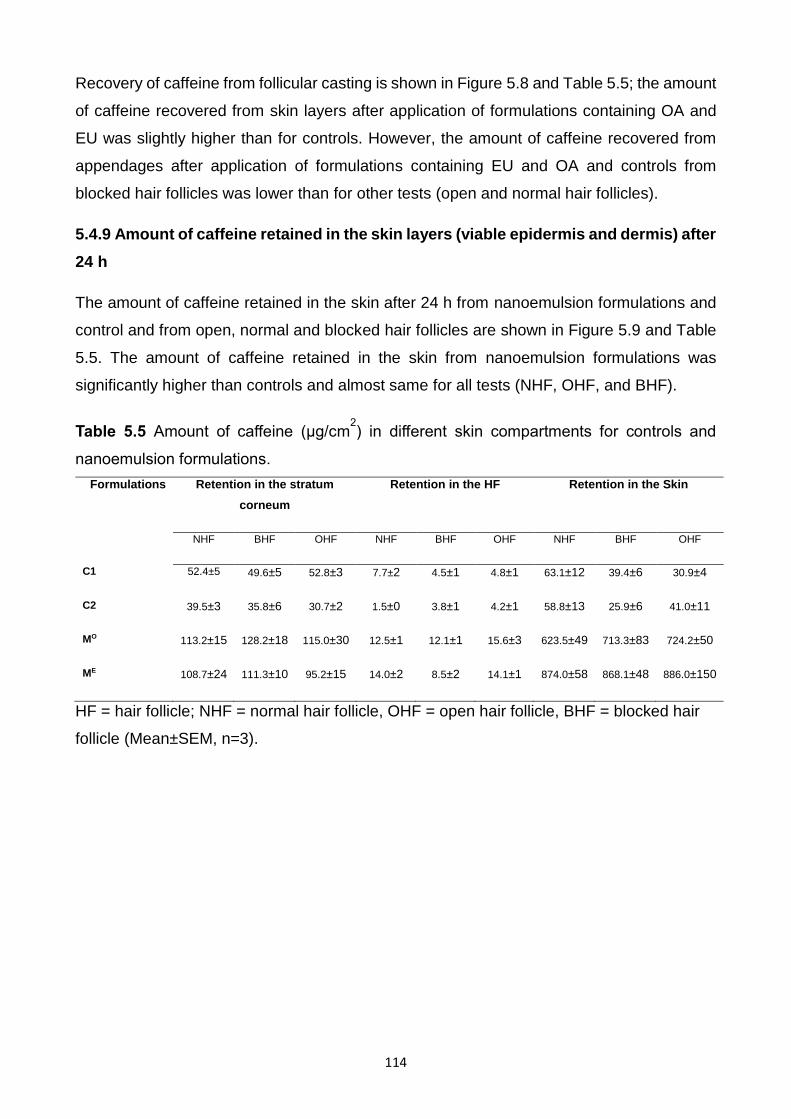
114
Recovery of caffeine from follicular casting is shown in Figure 5.8 and Table 5.5; the amount
of caffeine recovered from skin layers after application of formulations containing OA and
EU was slightly higher than for controls. However, the amount of caffeine recovered from
appendages after application of formulations containing EU and OA and controls from
blocked hair follicles was lower than for other tests (open and normal hair follicles).
5.4.9 Amount of caffeine retained in the skin layers (viable epidermis and dermis) after
24 h
The amount of caffeine retained in the skin after 24 h from nanoemulsion formulations and
control and from open, normal and blocked hair follicles are shown in Figure 5.9 and Table
5.5. The amount of caffeine retained in the skin from nanoemulsion formulations was
significantly higher than controls and almost same for all tests (NHF, OHF, and BHF).
Table 5.5 Amount of caffeine (µg/cm2) in different skin compartments for controls and
nanoemulsion formulations.
Formulations Retention in the stratum
corneum
Retention in the HF Retention in the Skin
NHF BHF OHF NHF BHF OHF NHF BHF OHF
C1 52.4±5 49.6±5 52.8±3 7.7±2 4.5±1 4.8±1 63.1±12 39.4±6 30.9±4
C2 39.5±3 35.8±6 30.7±2 1.5±0 3.8±1 4.2±1 58.8±13 25.9±6 41.0±11
MO 113.2±15 128.2±18 115.0±30 12.5±1 12.1±1 15.6±3 623.5±49 713.3±83 724.2±50
ME 108.7±24 111.3±10 95.2±15 14.0±2 8.5±2 14.1±1 874.0±58 868.1±48 886.0±150
HF = hair follicle; NHF = normal hair follicle, OHF = open hair follicle, BHF = blocked hair
follicle (Mean±SEM, n=3).

115
Figure 5.7 Caffeine retained in the stratum corneum from nanoemulsion formulations and
controls after 24 h (Mean ± SEM, n=3)
Figure 5.8 Caffeine retained in the hair follicles after topical administration of nanoemulsion
formulations & controls up to 24 h (Mean ± SEM, n=3)
N = normal hair follicle, O = open hair follicle, B = blocked hair follicle
C 1 C 2 0 MO
ME
0
5 0
1 0 0
1 5 0
2 0 0
F o rm u la tio n s
Am
ou
nt
of
Ca
ffe
ine
(
g/c
m2
)
T a p e s tr ip p in g (N )
T a p e s tr ip p in g (O )
T a p e s tr ip p in g (B )
Am
ou
nt
of
caff
ein
e (µ
g/cm
2 )
C 1 C 2 MO
ME
0
5
1 0
1 5
2 0
F o rm u la tio n s
Am
ou
nt o
f C
affe
ine
(
g/c
m2
)
R e te n tio n in H F (N )
R e te n tio n in H F (O )
R e te n t io n e in H F (B )
Am
ou
nt
of
caff
ein
e (
µg/
cm2 )

116
Figure 5.9 Caffeine retained in the viable epidermis and dermis from nanoemulsion
formulations and controls after 24 h (Mean ± SEM, n=3)
N = normal hair follicle, O = open hair follicle, B = blocked hair follicle
C 1 C 2 MO
ME
0
5 0 0
1 0 0 0
1 5 0 0
F o rm u la tio n s
Am
ou
nt
of
Ca
ffe
ine
(
g/c
m2
)
R e te n t io n in s k in (N )
R e te n t io n in s k in (O )
R e te n tio n in s k in (B )A
mo
un
t o
f ca
ffei
ne
(µg/
cm2)

117
5.4.10 Multiphoton microscopy imaging to evaluate follicular blocking technique and
assess the penetration of model fluorescent dye (Acriflavine)
Figure 5.10 illustrates representative images of normal, open and blocked follicles. When
the area around the follicle was imaged, both open hair follicles and normal hair follicles
showed cellular uptake of acriflavine in the viable layers. The EU nanoemulsion showed
uptake of acriflavine when follicles were unmodified while the OA nanoemulsion showed
acriflavine uptake into the viable cells with the follicles being opened. However, when the
follicles were blocked no visible uptake of acriflavine was seen in the viable cells from either
of the emulsions or the control.
5.5. Discussion
Nanoemulsions are composed of non-ionic surfactant (Volpo-N10) which is nontoxic and
two types of oil (OA and EU) which are themselves penetration enhancers (188, 216-218).
In order to assess the effect of these nanoemulsion formulations of minoxidil on the
accumulation and permeation through the skin, an in vitro study was carried out using full-
thickness human skin and Franz diffusion cells. The results of this study were similar to a
study done by Grice et al in 2010, in which they found that the minoxidil recovery from
appendages was of the same order as the cumulative amount of minoxidil penetrating
through the skin (45). In the current work, it was found that at early on in the experiments
the effect of formulations were similar to that of the control, but a change occurred after 4 h
similar to the Grice et al finding, and also similar to another study by Patois et al in 2011,
which showed that minoxidil penetrated excised pig skin after 6 h, suggesting that the dermis
has a longer lag time for penetration in the receiver (219). Our results showed that after 24
h only a small amount of minoxidil reached the receptor fluid. In 2011, Mura et al also found
that only small amount of minoxidil reached the epidermis after 8 h (220). The pH value of
skin is between 4.2 – 6.1, applied formulations outside of these pH values may lead to skin
damage (219). For the nanoemulsion formulations having EU as oil phase, the pH was
around 7.2 and the ionisation of minoxidil may have contributed to a high skin accumulative
profile from this formulation as the skin has a positive charge. However, the pH of
nanoemulsions with OA are at skin range (~5.4); these results are similar to Padois et al
findings (219). This study used ethanol as a co-surfactant and also the control contained
60% ethanol, therefore evaporation of the solvent could increase the viscosity of the vehicles
and reduce the solubility of minoxidil in the skin and thermodynamic activity of the drug in
the vehicles, (especially the control) and permeation (221) (222). Incorporation of minoxidil

118
in O/W nanoemulsion formulations increased the penetration drug flux significantly (3- to 9-
fold), compared with the control (Table 5.3), and these results are consistent with other
results that have been done to evaluate the transdermal delivery of several hydrophilic and
lipophilic drugs from nanoemulsion formulations (223). The mechanism for this increase is
due to increased solubility of these solutes in the stratum corneum (SSC) and also by
increased D* across the skin (Table 5.3). Our study also focused on the relationship between
Jmax and SSC, D*. A unique finding in this work is the linear relationship between Jmax and SSC
and D* from all formulations (Figure 5.3A&B). Similarly, Zhang et al showed a linear
relationship between Jmax and SSC for phenolic compounds (108). OA and EU are well known
penetration enhancers. It is believed that OA provides high permeation due to its cis double
bond at C9 which causes a kink in the alkyl chain and disrupts the skin lipid (224). Although
skin lipid is also disrupted by the nanoemulsion and shows enhanced penetration, it acts as
a solution (224). This could be contributed to a low percentage of enhancing chemicals
compared to the percentage in other formulations. So, the compounds of the vehicle are as
important as the structure of the vehicle (225). EU is believed to act by changing intercellular
lipid, disrupting the lipid structure organisation and increasing fluidisation which leads to
increased diffusivity of the drug (159). A study done by Obata et al in 1991 (226) suggested
that ethanol combined with relatively hydrophilic terpenes such as EU have a much greater
enhancing effect than lipophilic terpenes. It is also claimed that polar terpenes such as EU
could provide better enhancement for hydrophilic drugs than hydrocarbon terpenes such as
R-(+)-limonene (227, 228). In our study nanoemulsion formulations with EU gave the highest
permeation of minoxidil: these results are consistent with the microemulsion results
conducted with curcumin by Liu et al (2010). They reported that terpenes have a different
mechanism to enhance transdermal drug delivery: the first possibility proposed was that EU
enters the skin as a monomer to increase the solubility of drug in the skin, increases the
partitioning of drug in the skin and creates high drug concentration in the upper layers of the
skin (189). Our study agrees with this mechanism as the solubility of minoxidil from EU
nanoemulsions has a higher solubility in the stratum corneum than that of OA formulations.
Another mechanism depended on the direct drug transfer from nanoemulsion droplets to the
stratum corneum (189).
We showed in Figure 5.3D that the solute uptake into the stratum corneum was associated
with the HSPs of the vehicles. This suggests that the vehicle acts as a carrier for the solute
into the stratum corneum.
We also examined whether the uptake solvent of solutes into the stratum corneum may be
related to the solubility of the solutes in the stratum corneum. Figure 5.4 suggests that our

119
solubility model has good correlation between the predicted SSC and measured SSC for
minoxidil, as it provides a linear shape with (r2= 0.82). This supports the hypothesis that the
enhanced minoxidil permeation in this study is mainly due to an increased solubility of the
compounds in the skin (modified stratum corneum solubility). The model here is to induce
the idea that the solubility of a solute in the skin can be correlated to its solubility in the
formulations and the amount of vehicle absorbed by the stratum corneum: our finding is
supported by Zhang et al (108).
In the second part of the study, the penetration of substances into the skin occurred by two
main ways; the transfollicular and transepidermal (transcellular and intercellular) penetration
routes (229). This study used the normal hair follicles, opened hair follicles and blocked hair
follicles skin system. The penetration across open hair follicles presented two methods of
penetration, the transfollicular and transepidermal, while, the blocked hair follicles presented
only the transepidermal route. The different flux between open, and blocked hair follicles
skin was determined as the transfollicular penetration flux.
The caffeine loaded nanoemulsions were investigated for penetration in stratum corneum
and in hair follicles of human skin. A study by Ogiso et al in 2002 suggested that hair follicles
play an important role in penetration and reservoir processes (230). Cyanoacrylate skin
surface biopsy was performed to investigate the transfollicular drug delivery (Fig 5.5) as this
method provides selective qualitative and quantitative penetration of topically applied drugs
into the hair follicles (15). The amount of caffeine permeating the stratum corneum was
removed using tape stripping. Then, the follicular contents were removed by cyanoacrylate
skin surface biopsy. The caffeine permeating the rest of the skin was measured by mincing
and extracting the stripped skin. The transfollicular flux from nanoemulsion formulations was
higher than from controls. A study by Bhatia et al in 2013 on adapalene penetration in
porcine ear skin suggested that increased water content in the nanoemulsions, increased
the amount of drug in the stratum corneum and in the hair follicle (231). As the nanoemulsion
formulations in the study are O/W nanoemulsions, the finding of this study was consistent
with Bhatia et al’s findings. The mechanism of permeation enhancement with ME
formulations may be because of increase partitioning and diffusion of caffeine into the
stratum corneum. Hair follicles provide an attractive site in dermatology and can act as long
term reservoirs for topical application (232), whereas, drugs located in the uppermost cell
layers of the stratum corneum, are continuously depleted because of the physiological
process of desquamation (231), which suggest, that the stratum corneum provides only a
short term reservoir function. Drug depletion in hair follicles occurs primarily through the

120
slow process of sebum production and hair growth (14), (233). Colloidal systems such as
microemulsions have demonstrated good potential for targeting hair follicles. The present
study indicates that nanoemulsions with penetration enhancers (OA and EU), not only
increase the permeation through the stratum corneum, but also demonstrate optimal
penetration into the hair follicles. The flux of caffeine in the stratum corneum increased from
2.5 (µg/cm2) ± 0.1 in control (C1) to 40 (µg/cm2) ± 4.5 with OA and 41 (µg/cm2) ± 5 in EU
nanoemulsions and the penetration in the hair follicles also increased from 0.2 (µg/cm2) in
control (C1) to 4 and 3.2 (µg/cm2) with MO and ME, respectively. Therefore, nanoemulsions
were able to penetrate the hair follicle and increased the transfollicular caffeine penetration.
Faster absorption of caffeine was detected after 24 h when the hair follicles were open.
Otberg et al (234) conducted a similar study on caffeine in vivo and found that artificial
blocking of hair follicles led to passage through the interfollicular epidermis and its lipid
domain only and possibly through sweat glands. Blocking hair follicles led to prolonged time
for caffeine to penetrate the skin (234). The same study suggested that hair follicles can be
an important route for chemical compounds. This study also finds that hair follicles should
not be ignored in the development and optimisation of topically applied drugs and cosmetics.
The present study was only with caffeine, which is a model hydrophilic compound. The novel
follicular plugging method we developed was very effective in visualisation of the blocked
follicles both under the optical microscope while plugging and also allowed multiphoton
imaging to evaluate the penetration into and around the hair follicles. The increase in
observed acriflavine penetration was similar to the increase in caffeine penetration from the
Franz cell studies. Acriflavine stained the nuclei of the cells consistent with other
unpublished studies conducted. As with the follicular casting studies where the amount of
caffeine present in the hair follicle was calculated, we imaged the area of the hair follicle and
the skin around the hair follicle and observed a large amount of acriflavine (hydrophilic model
compound) present in the follicle and sweat glands. We also observed that when the follicles
were blocked off by the cyanoacrylate and acriflavine blocking procedure, the intercellular
area of viable layer cells seemed to have taken up some of the acriflavine delivered through
the OA nanoemulsion. However, the staining was unlike the nuclear staining observed
previously and was more localised around the cells. Further studies will be needed to further
understand this interesting observation and also to evaluate the effect of hair follicles on
percutaneous penetration of other compounds with different physicochemical properties.

121
Figure 5.10 Skin images after applying nanoemulsion formulations and controls.
τm (0-2000 ps)

122
5.6 Conclusion
In short, from these results for minoxidil transdermal penetration, we found that O/W
nanoemulsions containing OA and EU as oil phase and penetration enhancers were highly
effective in vitro. The transdermal flux of minoxidil increased 3~ 9-fold in contrast to the
control. Moreover, transport by the appendages can be a valuable route for minoxidil. The
mechanism of penetration from these formulations is by increasing the partitioning and
diffusivity of minoxidil in the stratum corneum. The results obtained from the transfollicular
study demonstrate that nanoemulsion formulations are not only promising vehicles for
transdermal delivery but also transfollicular delivery of the hydrophilic drug caffeine. The
imaging results from the skin confirm this finding that the hydrophilic model penetrated the
hair follicles. Therefore, further study of these advanced formulations and their mechanism
of action is needed in order to find suitable and safe formulations for transdermal and
transfollicular delivery of different lipophilicity drugs.

123
Chapter 6
A comparison of the penetration and permeation of caffeine into and through human
epidermis after application of various vesicle formulations
6.1 Abstract
A range of vesicles is now widely used to carry various solutes into and through the
epidermis. These usually have the active solute encapsulated within and may be modified
to confer flexibility and skin penetration enhancement. Here, we compared the ability of five
different vesicle systems to deliver a model hydrophilic drug, caffeine, into and through
excised human skin. In addition to lipids, the vesicle excipients included eucalyptol (EU) or
oleic acid (OA) as penetration enhancers, and decyl polyglucoside (DPGluc) as a non-ionic
surfactant. Vesicle particle sizes ranged between 135 and 158 nm and caffeine
encapsulation efficiencies were between 46% and 66%. Caffeine penetration and
permeation was measured using HPLC. We found that niosomes, which are liposomes
containing a non-ionic surfactant and transferosomes (ultraflexible vesicles) showed
significantly greater penetration into the skin and permeation across the stratum corneum.
Significant enhancement of caffeine penetration into hair follicles was found for
transferosomes and those liposomes containing OA.
We conclude that targeted delivery of the hydrophilic drug, caffeine, into the skin
compartments can be modified using optimised vesicular formulations.
6.2 Introduction
Topical drug delivery offers specific benefits over other administrative routes for local action
but the barrier nature of the skin presents a major obstacle for many drugs delivered into
and through it (235). Chemical strategies to reduce the effect of the barrier include the use
of penetration enhancers, such as OA or octyl salicylate, and the use of more advanced
colloidal systems such as microemulsions, solid lipid nanoparticles and nanostructured lipid
carriers. Liposomes are hollow spheres comprising phospholipid and an aqueous phase.
Hydrophilic drugs may be inserted in the aqueous compartment while lipophilic drugs can
be sequestered in the phospholipid. Many excipients including lipids, surfactants and
solvents have been added to improve the stability or other structural features of liposomes
(236). Cholesterol tends to make the liposome membrane less permeable by filling up holes
or disruptions (236). Jacobs et al (237) speculated that liposomes may either form a thin

124
lipid film on the surface of the skin, so that water loss is retarded, or combine with
intercellular skin lipids to form liquid-crystalline matrices in the uppermost skin layers.
Various forms of liposomes exist. Transferosomes are defined as vesicular particles
composed of phospholipids and surfactants such that the inner aqueous compartments are
surrounded by a highly elastic and adaptable lipid bilayer (238). They are metastable,
making them able to enter pores smaller than their size (239). They present a more flexible
transport system with improved vesicular stability and the potential to be used with diverse
active components (240). The flexibility is contributed in part to their relatively high
membrane hydrophilicity, which gives the membrane the ability to swell more than, for
example, conventional liposomes. Like liposomes, transferosomes are unilamellar or
multilamellar structures (241) and contain a surfactant as an edge activator (242, 243).
Niosomes are uni- or multi-lamellar spheroidal structures containing a mixture of cholesterol
and non-ionic surfactants such as alkyl ethers, esters or amides (221, 244). They have been
assessed as an alternative drug delivery system compared to conventional liposomes.
Niosomes offer higher physical and chemical stability (245) and a great variety of surfactant
choice (246). It is claimed that for topical applications, niosomes can increase the time of
drug residence in the stratum corneum and epidermis whilst decreasing drug systemic
absorption (246). Another study observed structural changes in the lipid interstitial spaces
of the stratum corneum after exposure of the skin to niosomes and suggested that these
changes may be responsible for the resultant enhanced penetration (247).
Skin appendages provide an alternative route for drug penetration through the skin.
Pertinent to drug penetration via hair follicles, the follicular infundibulum provides an
increase in the surface area, acting as a reservoir, and represents, at the lower end, an
interruption of the stratum corneum barrier (248). Some studies have focused on direct
targeting of hair follicles, such as with compounds for acne and alopecia therapies. Many
attempts have been made to measure substances retained in the hair follicles after topical
administration of model compounds such as dyes (249) and nanoparticles (213); however,
little has been done with therapeutic agents and this subject requires further investigation
(250).
This study aimed to investigate the feasibility of vesicle (liposome, transferosome and
niosome) structure to improve the delivery of the hydrophilic drug caffeine into appendages,
stratum corneum and through human skin. Differential stripping (40) or tape stripping is a
useful technique that allows measurement of the amount of solute retained in the stratum

125
corneum and of the amount of follicular retention by follicular casting. In order to target a
particular skin site after topical application, the formulation of caffeine was manipulated.
Liposome, transferosome and niosome formulations were prepared by the thin film-
hydration (TFH) method using DLPC and cholesterol (as lipid) and OA, EU, or DPGluc as
edge activators.
6.3 Materials and Methods
6.3.1 Materials
Caffeine, OA, EU, ethanol, cholesterol, dilauroyl L-α-phosphatidylcholine (DLPC, CAS #
18194-25-7) were obtained from Sigma-Aldrich Pty. Ltd. (Sydney, Australia). DPGluc (sold
as Oramix NS 10) was obtained from SEPPIC SA (France). All chemicals and solvents were
of analytical grade.
6.3.2 Vesicle preparation
Six different vesicles were prepared, with excipient mixtures as shown in Table 6.1. For all
vesicles, the excipients were mixed in a rotary flask in the ratios shown, followed by glass
beads (4 g) and chloroform (3 mL) treatments. Once the lipids were dissolved, the solvent
was gradually evaporated on a rotary evaporator at 30°C until a lipid film formed on the wall
of the flask. The flask was set aside for 2 h to eliminate residual chloroform, after which the
lipid film was stirred with 2 mL caffeine solution (2% in water) for 2 h at 30°C. The liposome
suspensions were extruded through a polycarbonate membrane with pore size 100 nm using
the Liposofast extruder (AVESTIN, Inc., Ottawa, Canada). Thirty-one cycles of extrusion
were performed for each vesicle type.
6.3.3 Vesicle characterisation
The average particle diameter, polydispersity index (PDI) and zeta potential of the vesicles
were measured with a Zetasizer Nano ZS (Malvern Instruments, Ltd, Malvern UK). Each
sample was measured three times and the mean value was calculated.
6.3.4 Caffeine encapsulation efficiency
To separate the non-encapsulated drug, the vesicle suspensions were centrifuged at 14000
rpm for 30 min at room temperature. The amounts of caffeine in the supernatant and also in

126
the clear solution were analysed by high performance chromatography (HPLC). Drug
encapsulation efficiency (EE%) was calculated as: EE% = 100* mass of incorporated drug/
total mass in vesicle preparation.
6.3.5 Caffeine skin permeation studies
Permeation studies using full-thickness human abdominal skin were performed in Franz
diffusion cells with an effective diffusion area of 1.33 cm² and a 3.4 mL receptor chamber
volume. The skin was provided by a female donor following elective surgery, with ethical
approval granted by The University of Queensland Human Research Ethics Committee
(Approval No. 2008001342). The skin was cut into discs and mounted in Franz diffusion
cells with the stratum corneum side facing upwards. The receptor contained PBS buffer (pH
7.4) at 35°C. A volume of 160 µL of the vesicle formulations and the control solution was
applied to the surface of the skin and the donor chamber was covered in parafilm for the
duration of the experiment to inhibit water evaporation. Several times over a 24 h period,
200 L of the receptor was withdrawn and replaced with the same amount of fresh PBS
buffer. After 24 h, the sample was taken, the cells dismantled and the skin in each cell was
wiped with cotton buds to remove any remaining formulation. Up to 20 tape strips were then
taken from each skin sample (D-Squame tapes, CuDerm Corp., TX). The tapes were placed
into separate vials and mixed overnight with 2 mL methanol to extract the caffeine removed
from the stratum corneum by the tapes. Follicular casting was performed after tape stripping.
One drop of superglue (LOCTITE®, Henkel Australia) was placed on a microscope slide
and pressed onto the surface of the stripped skin with light pressure for 15 min. The slide
was peeled carefully from the skin and the superglue containing caffeine sampled from the
follicles was dissolved by rubbing four times with acetone–soaked cotton buds. The cotton
buds were mixed overnight with 2 mL methanol. After follicular casting, the skin was
chopped into small pieces, homogenised and mixed overnight with 2 mL methanol. Receptor
fluid and extracts from tapes, casts and skin were analysed by HPLC.
6.3.6 Sample analysis
Caffeine was analysed by a sensitive and rapid HPLC method. The HPLC system consisted
of a Shimadzu SIL-20 a HT, CBM-20A system controller, a SPD-20A detector, LC-20AD a
pump and an auto injector. Isocratic separation was performed on a Phenomenex Luna C18
5μ (150×4.6 mm) column using 95% water, 2% acetonitrile, 2% tetrahydrofuran and 0.5%

127
acetic acid as the mobile phase, at a flow rate of 1 mL/min. Caffeine was detected at 273
nm.
6.3.7 Data analysis and Statistics
The cumulative amount (µg/cm²) penetrating per skin surface area was plotted against time
(h). The steady state flux JSS (µg/cm²/h) was derived from the slope of the linear portion of
the cumulative amount versus time (t) plot.
All data were analysed by one-way analysis of variance (ANOVA) with post-hoc
comparisons (Tukey) using GraphPad Prism 6 (GraphPad Software Inc. La Jolla, CA92037,
USA); P<0.05 was considered to be significant.
6.4 Results
6.4.1 Vesicle characterisation
Particle size, polydispersity indices (PDI), zeta-potentials and caffeine encapsulation
efficiencies of all vesicles are presented in Table 6.2. As shown by the low PDI values, all
vesicles had a narrow size distribution. The high negative zeta potential values for both
niosomes and the liposomes containing OA indicate that these materials, in particular, would
be stable in suspension. The encapsulation efficiencies were relatively similar across the
five vesicle types.
6.4.2 Permeation of caffeine from vesicles and control
The cumulative amounts of caffeine penetrating full-thickness human skin from each of the
test formulations over 24 h are shown in Figure 6.1 and overall steady-state fluxes calculated
from these plots are shown in Table 6.3. Niosomes and transferosomes had significantly
greater fluxes than other formulations, as indicated.
Other skin permeation parameters for caffeine from the six applications are illustrated in
Table 6.3 and Figure 6.2. Penetration of caffeine into the receptor was significantly
enhanced from the niosomes (N), compared to the aqueous control solution (C) and the
liposomes (L, LEU, LOA) and from the transferosomes (T), compared to control (C) and the
basic liposomes (L). In addition, total skin penetration (stratum corneum, hair follicles,
residual skin and receptor solution) was significantly enhanced by niosomes compared to

128
control (C) and the basic liposomes (L). Caffeine recovered from hair follicles after
transferosome application was 50% more abundant than with LOA and more than twice that
seen in all other formulations, although the differences did not reach statistical significance
(P=0.10, T vs. C). Similarly, stratum corneum and skin retention were enhanced with the
advanced formulations (niosomes, transferosomes and to a lesser extent, the liposomes
containing penetration enhancers EU and OA) but differences did not reach statistical
significance.
6.5 Discussion
The nano size range of the vesicles used in this study (128-158 nm) makes them suitable
for topical delivery. We (251) and others (252) have shown that by decreasing the vesicle
size, the penetration of the encapsulated drug into deeper skin layers can be enhanced.
Further reductions in vesicle size could be achieved by extrusion through smaller
membranes, particularly with ultraflexible materials such as transferosomes and
SECosomes (251). In addition to the narrow range of nano sizes in our series of vesicles,
the individual vesicles were shown to be homogeneous, as indicated by the low PDI values
(0.05 to 0.15). However, given this homogeneity in particle size seen across the range of
vesicle formulations, it is likely that factors other than particle size contributed to the
observed differences in caffeine flux and retention in skin compartments (Table 6.3, Figs.
6.1 and 6.2). Regarding the zeta potential, LOA, N possessed a negative surface charge
(Table 6.2) while LEU, T and L dispersion possessed a neutral charge, indicating that the
incorporation of edge activators into liposomes had an important influence on their surface
charge.
The encapsulation efficiencies seen here (46–66%) compare well with 30% found by Budai
and coworkers (253) for solid lipid nanocarriers based on soy or egg lecithin. Because
caffeine log p is -0.07 (KOW =0.85) it is reasonably soluble in both water and lipophilic
solvents. Therefore, it is able to enter both hydrophilic and lipophilic regions of the vascular
structure (254). The caffeine encapsulation efficiency was highest in the liposomes
containing EU. This may be due to the relatively hydrophilic nature of EU which results in
low permeability of vesicles.
Optimised vesicular systems can exert different functions upon topical delivery (255). They
can improve drug deposition in the skin at the site of action, with the additional goal of
decreasing systemic absorption and thus minimising adverse effects (133). They may also
provide targeted delivery to skin appendages. In an attempt to find a vesicular formulation

129
for topical delivery of caffeine, vesicular systems were formulated using OA, EU and decyl
polyglucoside (DPGluc) as edge activators. OA and EU are well known penetration
enhancers (256). DPGluc is a low irritant, non-ionic surfactant that is commonly used in
pharmaceutical and cosmetic formulations and can form vesicles including niosomes in
combination with appropriate amounts of cholesterol (257).
In this work, all formulations were able to achieve sustained delivery of caffeine into and
through the skin over 24 h, with no depletion of the donor material. As a percentage of the
total applied drug dose, total caffeine delivery ranged from 6.6% and 7.4% for the aqueous
solution and the conventional liposomes, up to 14.9% and 16.0% for the transferosomes
and niosomes, respectively. The greatest flux was seen for transferosomes and niosomes,
with apparent flux increases between 12 and 24 h for these formulations. Interestingly, these
were the vesicles containing DPGluc as edge activators. This hydrophilic surfactant has also
been shown to act as a penetration enhancer for dermal delivery of tretinoin when
incorporated into liposomes (258), while other non-ionic surfactants cause similarly
enhanced permeation fluxes, for example, with lidocaine (259). A relatively constant flux
after about 8 h was seen with the other formulations, including the liposomes containing EU
and OA. Given the relatively moderate enhancement of caffeine penetration seen with these
latter vesicles, it seems likely that their actions as penetration enhancers in those
formulations were not important factors. The combined functions of surfactant edge activator
and penetration enhancer would appear to explain the relative enhancement seen with
DPGluc. While their work relates to the more lipophilic oestradiol, it is interesting to compare
the findings of El Maghraby et al (260), where greater penetration was seen with surfactant-
containing liposomes than with OA as a penetration enhancer alone. The authors suggested
that liposomes increased oestradiol permeation by mechanisms that are additional to
penetration enhancing effects.
The niosomes and transferosomes also showed greater skin retention than other
formulations. In particular, penetration into hair follicles from transferosomes appeared to be
enhanced. The ultradeformable nature of these vesicles may allow them to gain access to
these appendages more readily. Motwani et al (261) suggested that polar drugs delivered
from vehicles which are poorly miscible with sebum will have little chance to reach deeper
parts of the hair follicles. On the other hand, lipophilic vehicles may assist the transport of
drugs dissolved in the oil phase and into the pilosebaceous units (244). Therefore,
enhancement of follicular penetration would rely on the solubility of drug in the formulation
and the compatibility of the formulation with the lipid environment of the sebum (261).

130
One way in which the non-ionic surfactant could enhance solute transfer from vesicles into
the skin could be to assist in absorption and fusion of the vesicle to the skin surface. This
could maximise the ability of the vesicle to structurally modify the barrier properties of the
skin, allowing the solute to pass more readily from its encapsulated environment into the
intercellular regions of the stratum corneum. Studies (132, 262, 263) conclude that: a)
absorption and fusion of niosomes and transferosomes into the surface of skin will enhance
drug permeation; b) the vesicles act as penetration enhancers to reduce the barrier
properties of the stratum corneum; and c) the lipid bilayers of niosomes act as a rate limiting
membrane barrier of solutes (264). The possible mechanism for liposome and niosome
formulations is structural modification of the stratum corneum. For transferosomes, both
phospholipid (DLPC) and non-ionic surfactant (e.g.,DPGluc) can act as penetration
enhancers, which are valuable for increasing the penetration of many drugs. These results
suggest that the mechanism of drug transport across skin depends on the compositions of
the vesicle formulation and the solute used.

131
Table 6.1. Liposome formulations showing excipient ratios and aqueous control
composition. All formulations contained caffeine, 2% w/v.
Table 6.2. Vesicle system characterisation and encapsulation efficiency (mean ± SD)
Name Description Composition
C Aqueous control solution 100% Water
L Conventional liposome DLPC:cholesterol 35:7
LEU Conventional liposome + eucalyptol DLPC:Eucalyptol:cholesterol 35:7:7
LOA Conventional liposome + oleic acid DLPC:Oleic acid: cholesterol 35:7:7
T Modified liposome Transferosome DLPC:DPGluc:cholesterol 35:7:7
N Modified liposome Niosome DPGluc:cholesterol 35:735:7
Formula Vesicle size
(nm)
PDI Zeta potential Encapsulation
efficiency %
L (liposomes) 137.1±1.3 0.06±0.03 2.3±0.7 48
LEU (liposomes + EU) 142.3±2.3 0.10±0.01 -9.5. ±0.5 66
LOA (liposomes + OA) 128.4±1.9 0.08±0.02 -51.0±2.7 50
T (transferosomes) 158.3±4.0 0.14±0.04 -18.3±0.2 47
N (niosomes) 135.2±2.3 0.15±0.02 -42.6±2.4 46

132
Figure 6.1. Permeation profiles of caffeine through excised human skin from various vesicle
systems and a control; (Mean ± SEM, n=4).
Table 6.3 Permeation parameters following 24 h application of caffeine from vesicle
formulations and controls to full-thickness human skin (Mean ± SD, n=4).
Formula JSS
(µg/cm²/h)
SC
retention
(µg/cm²)
Hair follicles
(µg/cm²)
Skin
retention
(µg/cm²)
Receptor @
24h(µg/cm²)
Total
(µg/cm2)
C (Control) 0.7±0.2 17.3±4.2 0.8±0.2 48.4±7.8 14.2±4.1 80.7±12.4
L (liposomes) 1.4±0.4 24.7±4.1 1.7±0.4 51.7±12.7 28.7±4.3 106.7±20.5
LEU (liposomes + EU) 1.8±0.7 32.8±5.1 1.6±0.4 95.7±11.0 35.8±15.8 166.0±26.8
LOA (liposomes + OA) 1.7±0.2 39.4±6.4 3.5±0.7 93.5±7.8 34.9±3.3 147.9±30.7
T (transferosomes) 4.1±0.8* 66.4±25.9 5.3±3.3 85.7±28.5 85.5±20.3* 242.9±77.6
N (niosomes) 6.6±0.6** 70.7±28.9 2.2±0.5 103.4±7.8 135.0±13.3** 285.3±50.8*
The total shown is the sum of retention in the stratum corneum (SC), hair follicles, residual
skin and receptor penetration.
Significant differences (1-way ANOVA/Tukey): *versus Control solution (C) and Liposomes
(L); **versus Control solution (C), Liposomes (L), Liposomes +EU (LEU), Liposomes + OA
(LOA)
0
20
40
60
80
100
120
140
160
0 4 8 12 16 20 24
Cu
mu
lati
ve a
mo
un
t (µ
g/cm
²)
Time (h)
N
T
LEU
LOA
L
C

133
Figure 6.2. Caffeine recovery from the stratum corneum (SC), hair follicles, residual skin
and receptor solution after application of vesicles and control for 24h (Mean ± SEM, n=4).
aAmount in receptor at 24 h; Transfersomes > Control solution (C] and Liposomes (L);
bAmount in receptor and total penetration at 24 h; Niosomes > Control solution (C), L =
Liposomes, LEU = Liposomes +EU, LOA = Liposomes + OA. (1-way ANOVA / Tukey)
6.6 Conclusion
The in vitro permeation of caffeine from vesicles with different compositions of penetration
enhancers and non-ionic surfactants have been studied and evaluated. Incorporating the
non-ionic surfactant DPGluc into liposomes enhanced skin penetration of caffeine more than
the penetration enhancers OA and EU. The results suggest that fusion of the vesicles with
the lipid of the stratum corneum and direct transfer of solute from the vesicle formulations to
the skin may contribute to the mechanism of drug permeation enhancement by
transferosomes and niosomes. The overall results indicate that the presence of penetration
enhancers in the vesicle components is not the important operating factor.
C LLE U
LOA T N
0
1 0 0
2 0 0
3 0 0 C
aff
ein
e p
en
etr
ati
on
(
g/c
m2
)
R e c e p to r p e n e t r a t io n
R e t e n t io n in t h e s k in
R e te n t io n in th e S C
R e t e n t io n in H a ir fo l l ic le s
b
a C
affe
ine
pen
etra
tio
n (
µg/
cm2)
134
Chapter 7
Conclusion and Future Directions
Skin delivery offers many benefits over conventional routes of administration. However, the
barrier nature of the stratum corneum presents an important issue for many drugs to be
delivered into and through the skin (2). Hence, many strategies have been used to overcome
the skin barrier. Penetration enhancers have been claimed to improve drug delivery and can
be used as oil phase or edge activators in advanced formulations such as microemulsions
and liposomes. This thesis started with using penetration enhancers with simple solutions
to explore the relationship between skin penetration maximum flux to the skin solubility for
different vehicle compositions. Then, I extended this approach by incorporating these
penetration enhancers into advanced formulations (microemulsions and vesicle systems) to
investigate their effect on skin permeation of model compounds. The third aim was to
investigate the effect of these penetration enhancers on follicular penetration of model
compounds.
7.1 Conclusion
7.1.1 Effect of Penetration Enhancers; Solution Studies
This study has shown that the permeation of caffeine, minoxidil, lidocaine and naproxen
were enhanced by specific vehicles that interacted with the skin (OA, EU, SLS and ethanol).
The greatest effects were seen on flux and diffusivity by the EU and OA vehicles on the
more hydrophilic compounds, caffeine and minoxidil. Enhancements in stratum corneum
solubility were predicted by experimentally determined uptake of solvent and solute. We
concluded that enhanced solute fluxes were mainly driven by increased diffusivity in the
stratum corneum, likely to be due to greater lipid fluidisation caused by the enhancers. Much
evidence in the literature suggests that vehicles can act by promoting partitioning of the skin.
The solubilities in the stratum corneum depend on the amount of vehicle absorbed in the
stratum corneum and the amount of solutes dissolved in the vehicles.
In the pretreatment study, there was enhancement of caffeine flux following pretreatment
with penetration enhancer vehicles of the heat separated epidermis. Enhancement could be
related to Hanson solubility parameters of the vehicle. Calibration of the solute flux and its
solubility in the stratum corneum data is a simple novel plotting procedure that separated
and quantified the effects of the vehicle on solute partition and diffusion. The treatment and
pretreatment results indicate that enhancement is related mainly to an increase in partition

135
into the skin with an increase in diffusivity. The diffusivity obtained for all compounds, was
unaffected by the inert control vehicles (controls) supporting the notion that Jmax is
determined by stratum corneum solubilities and not diffusivity. More investigations are
needed to understand the behaviours of different types of actives, and vehicles on the skin
to design a cosmetic and dermatological product with high strength and fewer side effects.
7.1.2 Synergistic skin penetration enhancer and nanoemulsion formulations promote
the human epidermal permeation of caffeine and naproxen
Nanoemulsions can be formed from different aqueous, surfactants, co-surfactants and oil
components. They are commercially feasible, simple and convenient vehicles to enhance
delivery of hydrophilic and lipophilic compounds with few side effects. The objective of this
study was to investigate the effect of nanoemulsions on improving the skin delivery of a
model hydrophilic (caffeine) and a lipophilic compound (naproxen). The nanoemulsions
were formulated with oleic acid (OA) and eucalyptol (EU) as penetration enhancers for both
caffeine and naproxen. Extensive physicochemical characterisation was undertaken to
evaluate the characteristics of the nanoemulsion systems generated. Evaluations were also
undertaken to understand the mechanism through which these systems enhance drug
delivery across skin. Similar to Zhang et al (108), we examined the maximum flux, solubility
in stratum corneum lipid components and diffusivity of both the model compounds, which
have different lipophilicity (caffeine -0.07 and naproxen 3.18) from saturated solutions. A
study was done on full-thickness skin and epidermal membranes. Our nanoemulsions were
characterised by their transparency, small size and low viscosity. Both the microemulsion
systems in this study significantly enhanced penetration of caffeine and naproxen. The
possible cause of enhancement may be due to alterations in the stratum corneum barrier
structure due in turn to the presence of EU and OA as penetration enhancers in the
formulation. The mechanism of action of these penetration enhancers depends on the
lipophilicity of the solute, with effects mediated by changes in diffusion being important for
the hydrophilic caffeine and effects on stratum corneum solubility being the major
determinant for the lipophilic dug naproxen. Nanoemulsions are promising vehicles to use
for systemic delivery, controlled release and improved bioavailability. More investigation will
allow the elucidation of mechanisms of nanoemulsion delivery into skin.

136
7.1.3 Appendageal delivery
A series of studies by the Lademann group has emphasised that hair follicles represent a
highly relevant and efficient penetration pathway and reservoir for topically applied
substances. The work in Chapter 6 has assessed the transepidermal and transfollicular
penetration flux and retention in the hair follicles, stratum corneum and in the skin for
different formulations and two actives. In the first part dealing with minoxidil penetration, we
found that O/W nanoemulsions containing OA and EU as combined oil phase and
penetration enhancers were highly effective in vitro with the transdermal flux of minoxidil
increasing 3 to 9- fold over the control. The mechanism of penetration from these
formulations is by increasing the partitioning and diffusivity of minoxidil in the stratum
corneum. In the second part of this work dealing with transfollicular penetration, storage of
caffeine in the hair follicles as well as retention in the stratum corneum and skin after 24 h
application of selected nanoemulsions and controls was studied. The results showed that
the permeation of caffeine delivered into the receptor from nanoemulsions was significantly
higher than for controls. The highest permeation was seen in the open hair follicles (OHF).
The caffeine flux from these OHF was higher than from the untreated and blocked hair
follicles. The transfollicular flux was higher from nanoemulsions relative to controls. Also,
the amount of caffeine recovered from appendages after application of formulations
containing EU and OA and controls from blocked hair follicles was lower than that from open
and normal hair follicles. These results demonstrate that nanoemulsion formulations are
promising vehicles for transfollicular delivery of the hydrophilic drug caffeine. More
understanding of the hair follicle structure and function will allow the design of improved
formulations for follicular delivery. More investigation is required to understand the influence
of the physicochemical properties of the penetrant and the vehicle on follicular targeting.
7.1.4 A comparison of the penetration and permeation of caffeine into and through
human epidermis after application of various vesicle formulations
Vesicle systems are widely applicable for topical administration. They can improve drug
penetration into the desired skin site, with the aim of reducing systemic absorption and side
effects. In addition, they are promising candidates for follicular delivery. The aim of this study
was to investigate the effect of vesicle-encapsulation of a model hydrophilic drug, caffeine
on its skin delivery. The in vitro permeation of caffeine from vesicles with different
compositions of penetration enhancers and a non-ionic surfactant was studied. Vehicles that
incorporated the non-ionic surfactant decyl polyglucoside (DPGluc) caused greater skin

137
penetration of caffeine than those containing either OA or EU as penetration enhancers. The
results suggest that fusion of the vesicles with the lipid of the stratum corneum and direct
transfer of solute from the vesicle formulations to the skin may contribute to the mechanism
of drug permeation enhancement by transferosomes and niosomes. The overall results
indicate that the presence of penetration enhancers in the vesicle components is not the
important operating factor. Further investigation will be carried out in ongoing studies with
fluorescently labelled liposomes.
7.2 Future Direction
Current Hansen solubility parameter models for predicting solubility and solute maximum
flux consider only the properties of the solute and either the vehicle or the skin. In future this
should be extended to take account of solute-vehicle, solute-skin and vehicle-skin
interaction, analogous to current attempts to develop quality structure–property relationships
(QSPR) models to account for formulation effects.
The formulations developed for enhanced permeation of model drugs in this thesis should
be extended and applied to therapeutic and diagnostic agents, many of which are
macromolecules, peptides or oligonucleotides. For example, targeted delivery of substances
for regional treatment or early detection of melanoma or other skin cancers is a promising
area of application.
The imaging techniques used to show alteration in stratum corneum morphological
properties following delivery of nanoemulsions to excised human skin need to be developed
further to allow quantitation of actual drug delivery to targeted skin sites.

138
List of References
1. Bensouilah J, and Buck P. Aromadermatology: aromatherapy in the treatment and care of common skin conditions. Abingdon: Radcliffe Publishing; 2006.
2. Barry BW. Dermatological formulations: percutaneous absorption. Informa Health Care; 1983. 3. Monteiro-Riviere NA. 1 Structure and Function of Skin. Toxicology of the Skin. 2010:1. 4. Montagna W. The Structure and Function of Skin 3E. Elsevier; 2012. 5. Brown MB, Martin GP, Jones SA, and Akomeah FK. Dermal and Transdermal Drug Delivery Systems:
Current and Future Prospects. Drug Delivery. 2006;13(3):175-87. 6. Lavker RM, and Sun T-T. Heterogeneity in epidermal basal keratinocytes: morphological and
functional correlations. Science. 1982;215(4537):1239-41. 7. Gilbert SF. The epidermis and the origin of cutaneous structures. 2000. 8. Fluhr JW, Mao-Qiang M, Brown BE, Wertz PW, Crumrine D, Sundberg JP, Feingold KR, and Elias PM.
Glycerol regulates stratum corneum hydration in sebaceous gland deficient (asebia) mice. Journal of Investigative Dermatology. 2003;120(5):728-37.
9. Zaiou M, and Gallo RL. Cathelicidins, essential gene-encoded mammalian antibiotics. Journal of molecular medicine. 2002;80(9):549-61.
10. Aiba S, and Katz SI. Phenotypic and functional characteristics of in vivo-activated Langerhans cells. The Journal of Immunology. 1990;145(9):2791-6.
11. Teunissen M. Dynamic nature and function of epidermal langerhans cellsin vivo andin vitro: a review, with emphasis on human Langerhans cells. The Histochemical journal. 1992;24(10):697-716.
12. Potten CS, and Allen TD. A model implicating the Langerhans cell in keratinocyte proliferation control. Differentiation. 1976;5(1):43-7.
13. Walters KA, and Roberts MS. In: Walters KA ed. Dermatological and Transdermal Formulations. New York: Marcel Dekker, Inc.; 2002:1-39.
14. Lademann J, Richter H, Schaefer UF, Blume-Peytavi U, Teichmann A, Otberg N, and Sterry W. Hair Follicles – A Long-Term Reservoir for Drug Delivery. Skin Pharmacology and Physiology. 2006;19(4):232-6.
15. Otberg N, Richter H, Schaefer H, Blume-Peytavi U, Sterry W, and Lademann J. Variations of hair follicle size and distribution in different body sites. J Invest Dermatol. 2004;122(1):14-9.
16. Ro BI, and Dawson TL. The role of sebaceous gland activity and scalp microfloral metabolism in the etiology of seborrheic dermatitis and dandruff. The journal of investigative dermatology Symposium proceedings / the Society for Investigative Dermatology, Inc [and] European Society for Dermatological Research. 2005;10(3):194-7.
17. Elias PM. Stratum corneum defensive functions: an integrated view. Journal of General Internal Medicine. 2005;20(5):183-200.
18. Gilchrest BA, Eller MS, Geller AC, and Yaar M. The Pathogenesis of Melanoma Induced by Ultraviolet Radiation. New England Journal of Medicine. 1999;340(17):1341-8.
19. Gawkrodger DJ. Dermatology. Edinburgh: Churchill Livingstone; 2002. 20. Elias PM. Epidermal lipids, barrier function, and desquamation. Journal of Investigative Dermatology.
1983;80(S44-9. 21. Roop D. Defects in the barrier. Science. 1995;267(5197):474-5. 22. Sloan KB. Prodrugs: topical and ocular drug delivery. New York: Dekker; 1992. 23. Bronaugh RL, and Maibach HI. Percutaneous absorption: drugs, cosmetics, mechanisms,
methodology. Boca Raton: Taylor and Francis; 2005. 24. Benson HAE. Transdermal Drug Delivery: Penetration Enhancement Techniques. Current Drug
Delivery. 2005;2(1):23-33. 25. Fox LT, Gerber M, Du Plessis J, and Hamman JH. Transdermal Drug Delivery Enhancement by
Compounds of Natural Origin. Molecules. 2011;16(12):10507-40. 26. Richard H. G, Jonathan H, and Daniel A. B. Transdermal drug delivery and cutaneous metabolism.
Xenobiotica. 1987;17(3):325-43.

139
27. Barry BW. Mode of action of penetration enhancers in human skin. Journal of Controlled Release. 1987;6(1):85-97.
28. Kornick CA, Santiago-Palma J, Moryl N, Payne R, and Obbens EA. Benefit-risk assessment of transdermal fentanyl for the treatment of chronic pain. Drug Safety. 2003;26(13):951-73.
29. Cleary GW. In: Shah VP, and Maibach HI eds. Topical Drug Bioavailability, Bioequivalence and Penetration. New York: Plenum Press; 1993:17-68.
30. Long C. In: Walters KA ed. Dermatological and transdermal formulations. New York: Marcel Dekker; 2002:41-60.
31. Cramer MP, and Saks SR. Translating safety, efficacy and compliance into economic value for controlled release dosage forms. Pharmacoeconomics. 1994;5(482-504.
32. Bos JD, and Meinardi MM. The 500 Dalton rule for skin penetration of chemical compounds and drugs. Exp Dermatol. 2002;9(165-9.
33. Steinstrasser I, and Merkle HP. Dermal metabolism of topically applied drugs: pathways and models reconsidered. Pharm Acta Helv. 1995;70(3-24.
34. Yano T, Negakawa. A., Tsuji. M., and Noda.K. Skin permeability of various non-steroidal anti-inflammatory drugs in man. Life Sci. 1986;39(1043-50.
35. Majhi PR, and Moulik SP. Physicochemical Studies on Biological Macro- and Microemulsions VI : Mixing Behaviors of Eucalyptus Oil, Water and Polyoxyethylene Sorbitan Monolaurate (Tween 20) Assisted by n-Butanol or Cinnamic Alcohol. Journal of Dispersion Science and Technology. 1999;20(5):1407-27.
36. Lane ME. Skin penetration enhancers. International Journal of Pharmaceutics. 2013;447(1–2):12-21. 37. Illel B, and Schaefer H. Transfollicular percutaneous absorption. Skin model for quantitative studies.
Acta Derm Venereol. 1987;68(5):427-30. 38. Meidan VM, Bonner MC, and Michniak BB. Transfollicular drug delivery—is it a reality? International
journal of pharmaceutics. 2005;306(1):1-14. 39. Vogt A, and Blume-Peytavi U. Die Biologie des menschlichen Haarfollikels. Der Hautarzt; Zeitschrift
fur Dermatologie, Venerologie, und verwandte Gebiete. 2003;54(8):692-8. 40. Teichmann A, Jacobi U, Ossadnik M, Richter H, Koch S, Sterry W, and Lademann J. Differential
Stripping: Determination of the Amount of Topically Applied Substances Penetrated into the Hair Follicles. Journal of General Internal Medicine. 2005;20(5):264-9.
41. Barry BW. Drug delivery routes in skin: a novel approach. Adv Drug Deliv Rev. 2002;54(Supplement):S31-S40.
42. Schaefer H, and Lademann J. The Role of Follicular Penetration. Skin Pharmacology and Physiology. 2001;14(Suppl. 1):23-7.
43. Knorr F, Lademann J, Patzelt A, Sterry W, Blume-Peytavi U, and Vogt A. Follicular transport route – Research progress and future perspectives. European Journal of Pharmaceutics and Biopharmaceutics. 2009;71(2):173-80.
44. Toll R, Jacobi U, Richter H, Lademann J, Schaefer H, and Blume-Peytavi U. Penetration profile of microspheres in follicular targeting of terminal hair follicles. J Invest Dermatol. 2004;123(1):168-76.
45. Grice JE, Ciotti S, Weiner N, Lockwood P, Cross SE, and Roberts MS. Relative uptake of minoxidil into appendages and stratum corneum and permeation through human skin in vitro. Journal of Pharmaceutical Sciences. 2010;99(2):712-8.
46. Stenn KS, and Cotsarelis G. Bioengineering the hair follicle: fringe benefits of stem cell technology. Current opinion in biotechnology. 2005;16(5):493-7.
47. Pfister WR, and Hsieh DS. Permeation enhancers compatible with transdermal drug delivery systems. Part I: selection and formulation considerations. Medical device technology. 1989;1(5):48-55.
48. Walker RB, and Smith EW. The role of percutaneous penetration enhancers. Advanced Drug Delivery Reviews. 1996;18(3):295-301.
49. Williams AC, and Barry BW. Penetration enhancers. Advanced Drug Delivery Reviews. 2004;56(5):603-18.
50. Santus GC, and Baker RW. Transdermal enhancer patent literature. Journal of controlled Release. 1993;25(1):1-20.

140
51. Patel HJ, Trivedi DG, Bhandari AK, and Shah DA. Penetration enhancers for transdermal drug delivery system: A review. IJPI’s Journal of Pharmaceutics and Cosmetology. 2011;1(2):67-80.
52. Barry BW. Novel mechanisms and devices to enable successful transdermal drug delivery. Eur J Pharm Sci. 2001;14(2):101-14.
53. Cornwell PA, Barry BW, Bouwstra JA, and Gooris GS. Modes of action of terpene penetration enhancers in human skin; differential scanning calorimetry, small-angle X-ray diffraction and enhancer uptake studies. International Journal of Pharmaceutics. 1996;127(1):9-26.
54. Bharkatiya M, and Nema RK. Skin penetration enhancement techniques. Journal of Young Pharmacists. 2009;1(2):110-5.
55. Danyi; Q, and Howard HXaMI. Chemical enhancements of transdermal drug delivery systems: Advantages and Challenges-part 1. Transdermal. 2010:5-11.
56. Fox LT, Gerber M, Plessis JD, and Hamman JH. Transdermal Drug Delivery Enhancement by Compounds of Natural Origin. molecules. 2011;16(12):10507-40.
57. Williams AC, and Barry BW. Penetration enhancers. Advanced Drug Delivery Reviews. 2012;64, Supplement(0):128-37.
58. Zupan JA. In: Merck & Co I ed. Google Patents. 1983. 59. Okabe H, Takayama K, Ogura A, and Nagai T. Effect of limonene and related compounds on the
percutaneous absorption of indomethacin. Drug design and delivery. 1989;4(4):313-21. 60. Hori M, Satoh S, Maibach HI, and Guy RH. Enhancement of propranolol hydrochloride and diazepam
skin absorption in vitro: effect of enhancer lipophilicity. Journal of Pharmaceutical Sciences. 1991;80(1):32-5.
61. Ibrahim SA, and Li SK. Efficiency of Fatty Acids as Chemical Penetration Enhancers: Mechanisms and Structure Enhancement Relationship. Pharm Res. 2010;27(1):115-25.
62. Aungst BJ. Structure/effect studies of fatty acid isomers as skin penetration enhancers and skin irritants. Pharm Res. 1989;6(3):244-7.
63. Aungst BJ, Rogers NJ, and Shefter E. Enhancement of naloxone penetration through human skin in vitro using fatty acids, fatty alcohols, surfactants, sulfoxides and amides. International Journal of Pharmaceutics. 1986;33(1):225-34.
64. Goodman M, and Barry BW. Lipid-protein-partitioning (LPP) theory of skin enhancer activity: finite dose technique. International Journal of Pharmaceutics. 1989;57(1):29-40.
65. Ernst E. Adverse effects of herbal drugs in dermatology. British Journal of Dermatology. 2000;143(5):923-9.
66. Idson B. Hydration and percutaneous absorption. Current Problems in Dermatology. 1978;7(132-41. 67. Roberts MS, Cross SE, and Pellett MA. In: Walters KA ed. Dermatological and Transdermal
Formulations. New York: Marcel Dekker; 2002:89-196. 68. Wiedmann TS. Influence of hydration on epidermal tissue. Journal of Pharmaceutical Sciences.
1988;77(12):1037-41. 69. Hikima T, and Maibach H. Skin Penetration Flux and Lag-Time of Steroids Across Hydrated and
Dehydrated Human Skin in Vitro. Biological & Pharmaceutical Bulletin. 2006;29(11):2270-3. 70. Walters KA, and Hadgraft J. Pharmaceutical skin penetration enhancement. Informa Health Care;
1993. 71. Wurster DE, and Kramer SF. Investigation of some factors influencing percutaneous absorption.
Journal of pharmaceutical sciences. 1961;50(4):288-93. 72. Bucks D, Maibach HI, and Guy R. Occlusion does not uniformly enhance penetration in vivo. DRUGS
AND THE PHARMACEUTICAL SCIENCES. 2005;155(65. 73. Higuchi T. Physical Chemical analysis of Percutaneous Absorption Process from Creams and
Ointments. J Soc Cosmet Chem. 1960;11(85-97. 74. Megrab NA, Williams AC, and Barry BW. Oestradiol permeation across human skin, silastic and snake
skin membranes: The effects of ethanol/water co-solvent systems. International Journal of Pharmaceutics. 1995;116(1):101-12.
75. Pellett MA, Roberts MS, and Hadgraft J. Supersaturated solutions evaluated with an in vitro stratum corneum tape stripping technique. International Journal of Pharmaceutics. 1997;151(1):91-8.

141
76. Twist JN, and Zatz JL. A model for alcohol-enhanced permeation through polydimethylsiloxane membranes. Journal of Pharmaceutical Sciences. 1990;79(1):28-31.
77. Henmi T, Fujii M, Kikuchi K, Yamanobe N, and Matsumoto M. Application of an Oily Gel Formed by Hydrogenated Soybean Phospholipids as a Percutaneous Absorption-Type Ointment Base. CHEMICAL & PHARMACEUTICAL BULLETIN. 1994;42(3):651-4_1.
78. Chia-Ming C, Flynn GL, Weiner ND, and Szpunar GJ. Bioavailability assessment of topical delivery systems: effect of vehicle evaporation upon in vitro delivery of minoxidil from solution formulations. International journal of pharmaceutics. 1989;55(2):229-36.
79. Megrab NA, Williams A, and Barry B. Oestradiol permeation through human skin and silastic membrane: effects of propylene glycol and supersaturation. Journal of controlled release. 1995;36(3):277-94.
80. Kemken J, Ziegler A, and Müller B. Influence of Supersaturation on the Pharmacodynamic Effect of Bupranolol After Dermal Administration Using Microemulsions as Vehicle. Pharm Res. 1992;9(4):554-8.
81. Dias MMR, Raghavan SL, Pellett MA, and Hadgraft J. The effect of β-cyclodextrins on the permeation of diclofenac from supersaturated solutions. International Journal of Pharmaceutics. 2003;263(1):173-81.
82. Thong HY, Zhai H, and Maibach HI. Percutaneous Penetration Enhancers: An Overview. Skin Pharmacology and Physiology. 2007;20(6):272-82.
83. Prausnitz MR. Microneedles for transdermal drug delivery. Advanced drug delivery reviews. 2004;56(5):581-7.
84. Sivamani RK, Stoeber B, Wu GC, Zhai H, Liepmann D, and Maibach H. Clinical microneedle injection of methyl nicotinate: stratum corneum penetration. Skin Research and Technology. 2005;11(2):152-6.
85. Sloan KB, and Bodor N. Hydroxymethyl and acyloxymethyl prodrugs of theophylline: enhanced delivery of polar drugs through skin. International Journal of Pharmaceutics. 1982;12(4):299-313.
86. Choi H-K, Flynn GL, and Amidon GL. Transdermal delivery of bioactive peptides: the effect of n-decylmethyl sulfoxide, pH, and inhibitors on enkephalin metabolism and transport. Pharm Res. 1990;7(11):1099-106.
87. Mezei M, and Gulasekharam V. Liposomes-a selective drug delivery system for the topical route of administration I. Lotion dosage form. Life Sci. 1980;26(18):1473-7.
88. Roberts MS, Cross SE, Pellett MA, and Walters KA. In: Walters KA ed. Dermatological and Transdermal Formulations. New York: Marcel Dekker; 2002:89-196.
89. Milewski M, and Stinchcomb AL. Estimation of Maximum Transdermal Flux of Nonionized Xenobiotics from Basic Physicochemical Determinants. Molecular pharmaceutics. 2012.
90. Lien EJ, and Tong GL. Physicochemical properties and percutaneous absorption of drugs. J Soc Cosmet Chem. 1973;24(371-84.
91. Lian G, Chen L, and Han L. An evaluation of mathematical models for predicting skin permeability. Journal of Pharmaceutical Sciences. 2008;97(1):584-98.
92. Magnusson BM, Anissimov YG, Cross SE, and Roberts MS. Molecular size as the main determinant of solute maximum flux across the skin. Journal of Investigative Dermatology. 2004;122(4):993-9.
93. Guy RH, and Hadgraft J. Selection of drug candidates for transdermal drug delivery. Marcel Dekker, New York; 1989.
94. Kasting GB, Smith RL, and Cooper E. Effect of lipid solubility and molecular size on percutaneous absorption. Skin pharmacokinetics. 1987;1(138-53.
95. Mitragotri S. A theoretical analysis of permeation of small hydrophobic solutes across the stratum corneum based on scaled particle theory. Journal of Pharmaceutical Sciences. 2002;91(3):744-52.
96. Roberts MS, Anderson RA, and Swarbrick J. Permeability of human epidermis to phenolic compounds. Journal of Pharmacy and Pharmacology. 1977;29(1):677-83.
97. Scheuplein RJ. Mechanism of percutaneous adsorption. Journal of investigative Dermatology. 1965;45(5):334-46.
142
98. Pugh WJ, Roberts MS, and Hadgraft J. Epidermal permeability — Penetrant structure relationships: 3. The effect of hydrogen bonding interactions and molecular size on diffusion across the stratum corneum. International Journal of Pharmaceutics. 1996;138(2):149-56.
99. Potts RO, and Guy RH. Predicting skin permeability. Pharm Res. 1992;9(5):663-9. 100. Anderson BD, and Raykar PV. Solute structure-permeability relationships in human stratum corneum.
J Invest Dermatol. 1989;93(2):280-6. 101. Potts RO, and Guy RH. A predictive algorithm for skin permeability: the effects of molecular size and
hydrogen bond activity. Pharm Res. 1995;12(11):1628-33. 102. Roberts MS, Anderson RA, Swarbrick J, and Moore DE. The percutaneous absorption of phenolic
compounds: the mechanism of diffusion across the stratum corneum. Journal of Pharmacy and Pharmacology. 1978;30(1):486-90.
103. Roberts MS, Pugh WJ, and Hadgraft J. Epidermal permeability: penetrant structure relationships. 2. The effect of H-bonding groups in penetrants on their diffusion through the stratum corneum. International Journal of Pharmaceutics. 1996;132(1-2):23-32.
104. Cross SE, Pugh WJ, Hadgraft J, and Roberts MS. Probing the Effect of Vehicles on Topical Delivery: Understanding the Basic Relationship Between Solvent and Solute Penetration Using Silicone Membranes. Pharm Res. 2001;18(7):999-1005.
105. du Plessis J, Pugh WJ, Judefeind A, and Hadgraft J. Physico-chemical determinants of dermal drug delivery: effects of the number and substitution pattern of polar groups. European journal of pharmaceutical sciences. 2002;16(3):107-12.
106. Zhang Q, Grice JE, Li P, Jepps OG, Wang GJ, and Roberts MS. Skin solubility determines maximum transepidermal flux for similar size molecules. Pharm Res. 2009;26(8):1974-85.
107. Zhang Q, Li P, Liu D, and Roberts MS. Effect of vehicles on the maximum transepidermal flux of similar size phenolic compounds. Pharm Res. 2013;30(1):32-40.
108. Zhang Q, Li P, and Roberts MS. Maximum transepidermal flux for similar size phenolic compounds is enhanced by solvent uptake into the skin. Journal of controlled release : official journal of the Controlled Release Society. 2011;154(1):50-7.
109. Bartek MJ, Labudde JA, and Maibach HI. Skin permeability in vivo: comparison in rat, rabbit, pig and man. Journal of Investigative Dermatology. 1972;58(3):114-23.
110. Ross JH, Dong MH, and Krieger RI. Conservatism in Pesticide Exposure Assessment. Regulatory Toxicology and Pharmacology. 2000;31(1):53-8.
111. Bond JR, and Barry BW. Limitations of hairless mouse skin as a model for in vitro permeation studies through human skin: hydration damage. Journal of investigative dermatology. 1988;90(4):486-9.
112. Coquette A, Berna N, Poumay Y, and Pittelkow MR. In: Kydonieus AF, and Wille JJ eds. Biochemical Modulation of Skin Reactions: Transdermals, Topicals, Cosmetics. New York: CRC Press; 2000:125-43.
113. Hancock BC, York P, and Rowe RC. The use of solubility parameters in pharmaceutical dosage form design. International Journal of Pharmaceutics. 1997;148(1):1-21.
114. Hildebrand JH, and Scott RL. The solubility of non electrolytes New York: Reinhold Publishing Corp.; 1950.
115. Hansen CM. The three dimensional solubility parameter and solvent diffusion co efficient. Copenhagen: Danish Technical Press; 1967.
116. Hansen CM. The three-dimensional solubility parameter-key to paint component affinities: I. solvents, plasticizers, polymers, and resins. II. Dyes, emulsifiers, mutual solubility and compatibility, and pigments. III. Independent cal-culation of the parameter components. Journal of Paint Technology. 1967;39(505-10.
117. Abbott S. An integrated approach to optimizing skin delivery of cosmetic and pharmaceutical actives. International journal of cosmetic science. 2012;34(3):217-22.
118. Hansen CM. The universality of the solubility parameter. Industrial & engineering chemistry product research and development. 1969;8(1):2-11.
119. Šentjurc M, Kristl J, and Abramović Z. Transport of liposome-entrapped substances into skin as measured by electron paramagnetic resonance oximetry in vivo. Methods in enzymology. 2004;387(267-87.

143
120. Abramovic Z, Sustarsic U, Teskac K, Sentjurc M, and Kristl J. Influence of nanosized delivery systems with benzyl nicotinate and penetration enhancers on skin oxygenation. Int J Pharm. 2008;359(1-2):220-7.
121. Azeem A, Khan ZI, Aqil M, Ahmad FJ, Khar RK, and Talegaonkar S. Microemulsions as a Surrogate Carrier for Dermal Drug Delivery. Drug Dev Ind Pharm. 2009;35(5):525-47.
122. Leite-Silva VR, de Almeida MM, Fradin A, Grice JE, and Roberts MS. Delivery of drugs applied topically to the skin. Expert Review of Dermatology. 2012;7(4):383-97.
123. Salerno C, Carlucci AM, and Bregni C. Study of in vitro drug release and percutaneous absorption of fluconazole from topical dosage forms. AAPS PharmSciTech. 2010;11(2):986-93.
124. Setya S, Talegonkar S, and Razdan B. Nanoemulsions: Formulation methods and stability aspects. World J Pharm Pharm Sci. 2014;3(2214-28.
125. Kogan A, and Garti N. Microemulsions as transdermal drug delivery vehicles. Advances in colloid and interface science. 2006;123(369-85.
126. Djordjevic L, Primorac M, Stupar M, and Krajisnik D. Characterization of caprylocaproyl macrogolglycerides based microemulsion drug delivery vehicles for an amphiphilic drug. International Journal of Pharmaceutics. 2004;271(1–2):11-9.
127. Bennett KE, Hatfield JC, Davis HT, Macosko CW, and Scriven LE. In: Robb ID ed. Microemulsions. Springer US; 1982:65-84.
128. Andersson M, and Löfroth J-E. Small particles of a heparin/chitosan complex prepared from a pharmaceutically acceptable microemulsion. International Journal of Pharmaceutics. 2003;257(1–2):305-9.
129. Kang BK, Chon SK, Kim SH, Jeong SY, Kim MS, Cho SH, Lee HB, and Khang G. Controlled release of paclitaxel from microemulsion containing PLGA and evaluation of anti-tumor activity in vitro and in vivo. International Journal of Pharmaceutics. 2004;286(1–2):147-56.
130. Pham TT, Jaafar-Maalej C, Charcosset C, and Fessi H. Liposome and niosome preparation using a membrane contactor for scale-up. Colloids and Surfaces B: Biointerfaces. 2012;94(0):15-21.
131. Chen J, Lu W-L, Gu W, Lu S-S, Chen Z-P, and Cai B-C. Skin permeation behavior of elastic liposomes: role of formulation ingredients. Expert Opinion on Drug Delivery. 2013;10(6):845-56.
132. Schreier H, and Bouwstra J. Liposomes and niosomes as topical drug carriers: dermal and transdermal drug delivery. Journal of Controlled Release. 1994;30(1):1-15.
133. El Maghraby GM, Barry BW, and Williams AC. Liposomes and skin: From drug delivery to model membranes. European Journal of Pharmaceutical Sciences. 2008;34(4–5):203-22.
134. El Maghraby GMM, Williams AC, and Barry BW. Interactions of surfactants (edge activators) and skin penetration enhancers with liposomes. International Journal of Pharmaceutics. 2004;276(1):143-61.
135. El Maghraby GMM, Williams AC, and Barry BW. Can drug-bearing liposomes penetrate intact skin? Journal of Pharmacy and Pharmacology. 2006;58(4):415-29.
136. Cevc G. Transfersomes, liposomes and other lipid suspensions on the skin: permeation enhancement, vesicle penetration, and transdermal drug delivery. Critical Reviews™ in Therapeutic Drug Carrier Systems. 1996;13(3-4).
137. Pastore MN, Kalia YN, Horstmann M, and Roberts MS. Transdermal patches: history, development and pharmacology. British journal of pharmacology. 2015;172(9):2179-209.
138. Michaels AS, Chandrasekaran SK, and Shaw JE. Drug permeation through human skin: Theory and invitro experimental measurement. AIChE Journal. 1975;21(5):985-96.
139. Twist J, and Zatz J. Influence of solvents on paraben permeation through idealized skin model membranes. J Soc Cosmet Chem. 1986;37(6):429-44.
140. Magnusson BM, Anissimov YG, Cross SE, and Roberts MS. Molecular size as the main determinant of solute maximum flux across the skin. The Journal of Investigative Dermatology. 2004;122(4):993-9.
141. Tojo K, Chiang CC, and Chien YW. Drug permeation across the skin: Effect of penetrant hydrophilicity. Journal of Pharmaceutical Sciences. 1987;76(2):123-6.
142. Hatanaka T, Shimoyama M, Sugibayashi K, and Morimoto Y. Effect of vehicle on the skin permeability of drugs: polyethylene glycol 400-water and ethanol-water binary solvents. Journal of Controlled Release. 1993;23(3):247-60.
144
143. Dias M, Hadgraft J, and Lane ME. Influence of membrane–solvent–solute interactions on solute permeation in skin. International Journal of Pharmaceutics. 2007;340(1–2):65-70.
144. Rosado C, Cross SE, Pugh WJ, Roberts MS, and Hadgraft J. Effect of vehicle pretreatment on the flux, retention, and diffusion of topically applied penetrants in vitro. Pharm Res. 2003;20(9):1502-7.
145. Gharagheizi F, Sattari M, and Angaji MT. Effect of Calculation Method on Values of Hansen Solubility Parameters of Polymers. Polymer Bulletin. 2006;57(3):377-84.
146. Hildebrand JH, and Scott RL. Regular solutions. Prentice-Hall; 1962. 147. Hildebrand JH, Prausnitz JM, and Scott RL. Regular and Related Solutions. The Solubility of Gases,
Liquids, and Solids. 1970. 148. Hansen CM. Hansen Solubility Parameters: A User’s Handbook. 2007. 149. Kligman AM, and Christophers E. Preparation of isolated sheets of human stratum corneum. Archives
of dermatology. 1963;88(6):702-5. 150. Anderson RA, Triggs EJ, and Roberts MS. The percutaneous absorption of phenolic compounds. 3.
Evaluation of permeability through human stratum corneum using a desorption technique. Aust J Pharm Sci. 1976;5(107-10.
151. Mitragotri S. In Situ Determination of Partition and Diffusion Coefficients in the Lipid Bilayers of Stratum Corneum. Pharm Res. 2000;17(8):1026-9.
152. Franz J, Thomas. Percutaneous apsorbition. on the relevance of in vitro data. J Investig Dermatol. 1975;64(3):190-5.
153. Abbott S, Hansen CM, Yamamoto H, and Valpey RS. In: Abbott S ed.: Hansen-Solubility.com; 2013. 154. Barry BW, Harrison SM, and Dugard PH. Correlation of thermodynamic activity and vapour diffusion
through human skin for the model compound, benzyl alcohol. The Journal of pharmacy and pharmacology. 1985;37(2):84-90.
155. Twist JN, and Zatz JL. Influence of Solvents on Paraben Permeation through Idealized Skin Model Membranes. Journal of the Society of Cosmetic Chemists. 1986;37(6):429-44.
156. Brinkmann I, and Müller-Goymann CC. Role of Isopropyl Myristate, Isopropyl Alcohol and a Combination of Both in Hydrocortisone Permeation across the Human Stratum corneum. Skin Pharmacology and Physiology. 2003;16(6):393-404.
157. Williams AC, and Barry BW. Terpenes and the Lipid–Protein–Partitioning Theory of Skin Penetration Enhancement. Pharm Res. 1991;8(1):17-24.
158. Gao S, and Singh J. In vitro percutaneous absorption enhancement of a lipophilic drug tamoxifen by terpenes. Journal of Controlled Release. 1998;51(2–3):193-9.
159. Williams AC, and Barry BW. The enhancement index concept applied to terpene penetration enhancers for human skin and model lipophilic (oestradiol) and hydrophilic (5-fluorouracil) drugs. International Journal of Pharmaceutics. 1991;74(2–3):157-68.
160. Fruijtier-Pölloth C. Safety assessment on polyethylene glycols (PEGs) and their derivatives as used in cosmetic products. Toxicology. 2005;214(1):1-38.
161. Ghanem A-H, Mahmoud H, Higuchi WI, Liu P, and Good WR. The effects of ethanol on the transport of lipophilic and polar permeants across hairless mouse skin: Methods/validation of a novel approach. International Journal of Pharmaceutics. 1992;78(1–3):137-56.
162. Kim D-D, Kim JL, and Chien YW. Mutual hairless rat skin permeation-enhancing effect of ethanol/water system and oleic acid. Journal of Pharmaceutical Sciences. 1996;85(11):1191-5.
163. Obata Y, Takayama K, Maitani Y, Machida Y, and Nagai T. Effect of ethanol on skin permeation of nonionized and ionized diclofenac. International Journal of Pharmaceutics. 1993;89(3):191-8.
164. Pershing LK, Silver BS, Krueger GG, Shah VP, and Skelley JP. Feasibility of Measuring the Bioavailability of Topical Betamethasone Dipropionate in Commercial Formulations Using Drug Content in Skin and a Skin Blanching Bioassay. Pharm Res. 1992;9(1):45-51.
165. Pershing LK, Lambert LD, and Knutson K. Mechanism of ethanol-enhanced estradiol permeation across human skin in vivo. Pharm Res. 1990;7(2):170-5.
166. Riviere JE, Brooks JD, Collard WT, Deng J, de Rose G, Mahabir SP, Merritt DA, and Marchiondo AA. Prediction of formulation effects on dermal absorption of topically applied ectoparasiticides dosed in vitro on canine and porcine skin using a mixture-adjusted quantitative structure permeability relationship. Journal of veterinary pharmacology and therapeutics. 2014;37(5):435-44.

145
167. Rosado C, Cross S, Pugh WJ, Roberts M, and Hadgraft J. Effect of Vehicle Pretreatment on the Flux, Retention, and Diffusion of Topically Applied Penetrants in Vitro. Pharm Res. 2003;20(9):1502-7.
168. Twist JNaZ, J. L. Influence of solvents on paraben permeation through idealized skin model membranes Journal of the Society of Cosmetic Chemists. 1968;37(6):429-44
169. Pastore MN, Kalia YN, Horstmann M, and Roberts MS. Transdermal patches: history, development and pharmacology. British Journal of Pharmacology. 2015;172(9):2179-209.
170. Danielsson I, and Lindman B. The definition of microemulsion. Colloids and Surfaces. 1981;3(4):391-2.
171. Naoui W, Bolzinger M-A, Fenet B, Pelletier J, Valour J-P, Kalfat R, and Chevalier Y. Microemulsion Microstructure Influences the Skin Delivery of an Hydrophilic Drug. Pharm Res. 2011;28(7):1683-95.
172. Azeem A, Khan ZI, Aqil M, Ahmad FJ, Khar RK, and Talegaonkar S. Microemulsions as a surrogate carrier for dermal drug delivery. Drug development and industrial pharmacy. 2009;35(5):525-47.
173. Talegaonkar S, Azeem A, Ahmad FJ, Khar RK, Pathan SA, and Khan ZI. Microemulsions: a novel approach to enhanced drug delivery. Recent patents on drug delivery & formulation. 2008;2(3):238-57.
174. Lindman B, Shinoda K, Olsson U, Anderson D, Karlström G, and Wennerström H. On the demonstration of bicontinuous structures in microemulsions. Colloids and Surfaces. 1989;38(1):205-24.
175. Shinoda K, and Lindman B. Organized surfactant systems: microemulsions. Langmuir. 1987;3(2):135-49.
176. Kreilgaard M. Influence of microemulsions on cutaneous drug delivery. Advanced Drug Delivery Reviews. 2002;54(Supplement):S77-S98.
177. Santos P, Watkinson A, Hadgraft J, and Lane M. Application of microemulsions in dermal and transdermal drug delivery. Skin Pharmacology and Physiology. 2007;21(5):246-59.
178. Lawrence MJ. Surfactant systems: their use in drug delivery. Chemical Society Reviews. 1994;23(6):417-24.
179. Zulauf M, and Eicke HF. Inverted micelles and microemulsions in the ternary system water/aerosol-OT/isooctane as studied by photon correlation spectroscopy. Journal of Physical Chemistry. 1979;83(4):480-6.
180. Carlfors J, Blute I, and Schmidt V. Lidocaine in microemulsion-a dermal delivery system. Journal of dispersion science and technology. 1991;12(5-6):467-82.
181. Chen H, Chang X, Weng T, Zhao X, Gao Z, Yang Y, Xu H, and Yang X. A study of microemulsion systems for transdermal delivery of triptolide. Journal of Controlled Release. 2004;98(3):427-36.
182. Golden GM, McKie JE, and Potts RO. Role of stratum corneum lipid fluidity in transdermal drug flux. Journal of Pharmaceutical Sciences. 1987;76(1):25-8.
183. Kreilgaard M, Pedersen EJ, and Jaroszewski JW. NMR characterisation and transdermal drug delivery potential of microemulsion systems. Journal of Controlled Release. 2000;69(3):421-33.
184. El Maghraby GM. Transdermal delivery of hydrocortisone from eucalyptus oil microemulsion: Effects of cosurfactants. International Journal of Pharmaceutics. 2008;355(1–2):285-92.
185. Zhang Q, Grice JE, Li P, Jepps OG, Wang GJ, and Roberts MS. Skin solubility determines maximum transepidermal flux for similar size molecules. Pharm Res. 2009;26(8):1974-85.
186. Kligman AM, and Christophers E. Preparation of Isolated Sheets of Human Stratum Corneum. Arch Dermatol. 1963;88(702-5.
187. Anderson R, Triggs E, and Roberts M. The percutaneous absorption of phenolic compounds. 3. Evaluation of permeability through human stratum corneum using a desorption technique. Aust J Pharm Sci. 1976;5(107-10.
188. Walker M, and Hadgraft J. Oleic acid — a membrane “fluidiser” or fluid within the membrane? International Journal of Pharmaceutics. 1991;71(1–2):R1-R4.
189. Liu C-H, and Chang F-Y. Development and Characterization of Eucalyptol Microemulsions for Topic Delivery of Curcumin. Pharmaceutical Society of Japan. 2010;59 (2):172—8
190. Lee P, Langer R, and Shastri VP. Novel Microemulsion Enhancer Formulation for Simultaneous Transdermal Delivery of Hydrophilic and Hydrophobic Drugs. Pharm Res. 2003;20(2):264-9.

146
191. Zhao X, Liu JP, Zhang X, and Li Y. Enhancement of transdermal delivery of theophylline using microemulsion vehicle. International Journal of Pharmaceutics. 2006;327(1–2):58-64.
192. Gursoy RN, and Benita S. Self-emulsifying drug delivery systems (SEDDS) for improved oral delivery of lipophilic drugs. Biomedicine & Pharmacotherapy. 2004;58(3):173-82.
193. Cal K, Janicki S, and Sznitowska M. In vitro studies on penetration of terpenes from matrix-type transdermal systems through human skin. International Journal of Pharmaceutics. 2001;224(1–2):81-8.
194. Peltola S, Saarinen-Savolainen P, Kiesvaara J, Suhonen TM, and Urtti A. Microemulsions for topical delivery of estradiol. International Journal of Pharmaceutics. 2003;254(2):99-107.
195. Kobayashi D, Matsuzawa T, Sugibayashi K, Morimoto Y, Kobayashi M, and Kimura M. Feasibility of use of several cardiovascular agents in transdermal therapeutic systems with l-menthol-ethanol system on hairless rat and human skin. Biol Pharm Bull. 1993;16(3):254-8.
196. Obata Y, Takayama K, Machida Y, and Nagai T. Combined effect of cyclic monoterpenes and ethanol on percutaneous absorption of diclofenac sodium. Drug Des Discov. 1991;8(2):137 - 44.
197. Tojo K, Chiang CC, and Chien YW. Drug permeation across the skin: effect of penetrant hydrophilicity. J Pharm Sci. 1987;76(2):123-6.
198. Koyama Y, Bando H, Yamashita F, Takakura Y, Sezaki H, and Hashida M. Comparative analysis of percutaneous absorption enhancement by d-limonene and oleic acid based on a skin diffusion model. Pharm Res. 1994;11(3):377-83.
199. Gao S, and Singh J. In vitro percutaneous absorption enhancement of a lipophilic drug tamoxifen by terpenes. Journal of controlled release : official journal of the Controlled Release Society. 1998;51(2-3):193-9.
200. Cross SE, Anderson C, and Roberts MS. Topical penetration of commercial salicylate esters and salts using human isolated skin and clinical microdialysis studies. British Journal of Clinical Pharmacology. 1998;46(1):29-35.
201. Bolzinger MA, Briançon S, Pelletier J, Fessi H, and Chevalier Y. Percutaneous release of caffeine from microemulsion, emulsion and gel dosage forms. European Journal of Pharmaceutics and Biopharmaceutics. 2008;68(2):446-51.
202. Naoui W, Bolzinger M-A, Fenet B, Pelletier J, Valour J-P, Kalfat R, and Chevalier Y. Microemulsion Microstructure Influences the Skin Delivery of an Hydrophilic Drug. Pharm Res. 2011;28(7):1683-95.
203. Koch RL, Palicharla P, and Groves MJ. Diffusion of [2-14C] diazepam across isolated hairless mouse stratum corneum/epidermal tissues. Journal of Investigative Dermatology. 1988;90(3):317-9.
204. Lauer A, Lieb L, Ramachandran C, Flynn G, and Weiner N. Transfollicular Drug Delivery. Pharm Res. 1995;12(2):179-86.
205. Schaefer H, Watts F, Brod J, and Illel B. Follicular penetration. Prediction of Percutaneous Penetration Methods, Measurements, Modelling. 1990;163(732.
206. Shelley WB, and Melton FM. Factors Accelerating the Penetration of Histamine Through Normal Intact Human Skin1. The Journal of Investigative Dermatology. 1949;13(2):61-71.
207. Feldmann RJ, and Maibach HI. Regional variation in percutaneous penetration of 14C Cortisol in Man1. Journal of Investigative Dermatology. 1967;48(2):181-3.
208. Tenjarla SN, Kasina R, Puranajoti P, Omar MS, and Harris WT. Synthesis and evaluation of N-acetylprolinate esters—novel skin penetration enhancers. International journal of pharmaceutics. 1999;192(2):147-58.
209. Mackee GM, Sulzberger MB, Herrmann F, and Baer RL. Histologic Studies on Percutaneous Penetration with Special Reference to the Effect of Vehicles12. The Journal of Investigative Dermatology. 1945;6(1):43-61.
210. Scheuplein RJ. Mechanism of percutaneous absorption. Journal of Investigative Dermatology. 1967;48(1):79-88.
211. Rolland A, Wagner N, Chatelus A, Shroot B, and Schaefer H. Site-specific drug delivery to pilosebaceous structures using polymeric microspheres. Pharm Res. 1993;10(12):1738-44.
212. Vogt A, Combadiere B, Hadam S, Stieler KM, Lademann J, Schaefer H, Autran B, Sterry W, and Blume-Peytavi U. 40 nm, but not 750 or 1,500 nm, nanoparticles enter epidermal CD1a+ cells after transcutaneous application on human skin. J Invest Dermatol. 2006;126(6):1316-22.
147
213. Lademann J, Knorr F, Richter H, Blume-Peytavi U, Vogt A, Antoniou C, Sterry W, and Patzelt A. Hair Follicles – An Efficient Storage and Penetration Pathway for Topically Applied Substances. Skin Pharmacology and Physiology. 2008;21(3):150-5.
214. Lademann J, Otberg N, Richter H, Weigmann H, Lindemann U, Schaefer H, and Sterry W. Investigation of follicular penetration of topically applied substances. Skin pharmacology and applied skin physiology. 2000;14(17-22.
215. Panigrahi L, Pattnaik S, and Ghosal SK. The effect of pH and organic ester penetration enhancers on skin permeation kinetics of terbutaline sulfate from pseudolatex-type transdermal delivery systems through mouse and human cadaver skins. AAPS PharmSciTech. 2005;6(2):E167-E73.
216. Touitou E, Godin B, Karl Y, Bujanover S, and Becker Y. Oleic acid, a skin penetration enhancer, affects Langerhans cells and corneocytes. Journal of Controlled Release. 2002;80(1–3):1-7.
217. Biruss B, Kählig H, and Valenta C. Evaluation of an eucalyptus oil containing topical drug delivery system for selected steroid hormones. International Journal of Pharmaceutics. 2007;328(2):142-51.
218. Ongpipattanakul B, Burnette RR, Potts RO, and Francoeur ML. Evidence that Oleic Acid Exists in a Separate Phase Within Stratum Corneum Lipids. Pharm Res. 1991;8(3):350-4.
219. Padois K, Cantiéni C, Bertholle V, Bardel C, Pirot F, and Falson F. Solid lipid nanoparticles suspension versus commercial solutions for dermal delivery of minoxidil. International Journal of Pharmaceutics. 2011;416(1):300-4.
220. Mura S, Manconi M, Valenti D, Sinico C, Vila AO, and Fadda AM. Transcutol containing vesicles for topical delivery of minoxidil. Journal of Drug Targeting. 2011;19(3):189-96.
221. Balakrishnan P, Shanmugam S, Lee WS, Lee WM, Kim JO, Oh DH, Kim D-D, Kim JS, Yoo BK, Choi H-G, et al. Formulation and in vitro assessment of minoxidil niosomes for enhanced skin delivery. International Journal of Pharmaceutics. 2009;377(1–2):1-8.
222. Mura S, Pirot F, Manconi M, Falson F, and Fadda AM. Liposomes and niosomes as potential carriers for dermal delivery of minoxidil. Journal of Drug Targeting. 2007;15(2):101-8.
223. Lee PJ, Langer R, and Shastri VP. Novel Microemulsion Enhancer Formulation for Simultaneous Transdermal Delivery of Hydrophilic and Hydrophobic Drugs. Pharm Res. 2003;20(2):264-9.
224. Osborne DW, Ward AJI, and O'Neill KJ. Microemulsions as topical drug delivery vehicles: in-vitro transdermal studies of a model hydrophilic drug. Journal of Pharmacy and Pharmacology. 1991;43(6):451-4.
225. Feldman Y, Kozlovich N, Nir I, Garti N, Archipov V, Idiyatullin Z, Zuev Y, and Fedotov V. Mechanism of Transport of Charge Carriers in the Sodium Bis(2-ethylhexyl) Sulfosuccinate−Water−Decane Microemulsion near the Percolation Temperature Threshold. The Journal of Physical Chemistry. 1996;100(9):3745-8.
226. Obata Y, Takayama K, Machida Y, and Nagai T. Combined effect of cyclic monoterpenes and ethanol on percutaneous absorption of diclofenac sodium. Drug design and discovery. 1991;8(2):137-44.
227. El-Kattan AF, Asbill CS, and Michniak BB. The effect of terpene enhancer lipophilicity on the percutaneous permeation of hydrocortisone formulated in HPMC gel systems. International Journal of Pharmaceutics. 2000;198(2):179-89.
228. Okabe H, Takayama K, Ogura A, and Nagai T. Effect of limonene and related compounds on the percutaneous absorption of indomethacin. Drug Des Deliv. 1989;4(4):313-21.
229. Grams YY. Leiden University, Faculty of Mathematics & Natural Sciences, Leiden-Amsterdam Center for Drug Research; 2005.
230. Ogiso T, Shiraki T, Okajima K, Tanino T, Iwaki M, and Wada T. Transfollicular drug delivery: penetration of drugs through human scalp skin and comparison of penetration between scalp and abdominal skins in vitro. Journal of Drug Targeting. 2002;10(5):369-78.
231. Bhatia G, Zhou Y, and Banga AK. Adapalene microemulsion for transfollicular drug delivery. Journal of Pharmaceutical Sciences. 2013;102(8):2622-31.
232. Konrádsdóttir F, Ogmundsdóttir H, Sigurdsson V, and Loftsson T. Drug targeting to the hair follicles: a cyclodextrin-based drug delivery. AAPS PharmSciTech. 2009;10(1):266-9.
233. Weigmann HJ, Lademann J, Schanzer S, Lindemann U, Von Pelchrzim R, Schaefer H, Sterry W, and Shah V. Correlation of the local distribution of topically applied substances inside the stratum

148
corneum determined by tape-stripping to differences in bioavailability. Skin pharmacology and applied skin physiology. 2000;14(98-102.
234. Otberg N, Patzelt A, Rasulev U, Hagemeister T, Linscheid M, Sinkgraven R, Sterry W, and Lademann J. The role of hair follicles in the percutaneous absorption of caffeine. Br J Clin Pharmacol. 2008;65(4):488-92.
235. Barry BW. Dermatological formulations: percutaneous absorption. New York: Marcel Dekker; 1983:127-280.
236. Sharma VK, Sarwa KK, and Mazumder B. Fluidity enhancement: a critical factor for performance of liposomal transdermal drug delivery system. Journal of Liposome Research. 2014;24(2):83-9.
237. Jacobs M, Martin GP, and Marriott C. Effects of Phosphatidylcholine on the Topical Bioavailability of Corticosteroids Assessed by the Human Skin Blanching Assay. Journal of Pharmacy and Pharmacology. 1988;40(12):829-33.
238. Jain S, Jain P, Umamaheshwari R, and Jain N. Transfersomes-a novel vesicular carrier for enhanced transdermal delivery: development, characterization, and performance evaluation. Drug development and industrial pharmacy. 2003;29(9):1013-26.
239. Cevc G, Gebauer D, Stieber J, Schätzlein A, and Blume G. Ultraflexible vesicles, Transfersomes, have an extremely low pore penetration resistance and transport therapeutic amounts of insulin across the intact mammalian skin. Biochimica et Biophysica Acta (BBA) - Biomembranes. 1998;1368(2):201-15.
240. Gupta A, Aggarwal G, Singla S, and Arora R. Transfersomes: A Novel Vesicular Carrier for Enhanced Transdermal Delivery of Sertraline: Development, Characterization, and Performance Evaluation. Scientia Pharmaceutica. 2012;80(4):1061-80.
241. Fang J-Y, Hong C-T, Chiu W-T, and Wang Y-Y. Effect of liposomes and niosomes on skin permeation of enoxacin. International Journal of Pharmaceutics. 2001;219(1–2):61-72.
242. Cevc G, Schätzlein A, and Blume G. Transdermal drug carriers: basic properties, optimization and transfer efficiency in the case of epicutaneously applied peptides. Journal of Controlled Release. 1995;36(1):3-16.
243. Paul A, Cevc G, and Bachhawat B. Transdermal immunisation with an integral membrane component, gap junction protein, by means of ultradeformable drug carriers, transfersomes. Vaccine. 1998;16(2):188-95.
244. Manosroi A, Wongtrakul P, Manosroi J, Sakai H, Sugawara F, Yuasa M, and Abe M. Characterization of vesicles prepared with various non-ionic surfactants mixed with cholesterol. Colloids and Surfaces B: Biointerfaces. 2003;30(1):129-38.
245. Vora B, Khopade AJ, and Jain NK. Proniosome based transdermal delivery of levonorgestrel for effective contraception. Journal of Controlled Release. 1998;54(2):149-65.
246. Manconi M, Sinico C, Valenti D, Lai F, and Fadda AM. Niosomes as carriers for tretinoin: III. A study into the in vitro cutaneous delivery of vesicle-incorporated tretinoin. International Journal of Pharmaceutics. 2006;311(1–2):11-9.
247. Hofland HEJ, van der Geest R, Bodde HE, Junginger HE, and Bouwstra JA. Estradiol Permeation from Nonionic Surfactant Vesicles Through Human Stratum Corneum in Vitro. Pharm Res. 1994;11(5):659-64.
248. Blume-Peytavi U, and Vogt A. Human hair follicle: reservoir function and selective targeting. British Journal of Dermatology. 2011;165(13-7.
249. Grams YY, and Bouwstra JA. Penetration and distribution of three lipophilic probes in vitro in human skin focusing on the hair follicle. Journal of controlled release. 2002;83(2):253-62.
250. Herkenne C, Alberti I, Naik A, Kalia YN, Mathy F-X, Préat V, and Guy RH. In vivo methods for the assessment of topical drug bioavailability. Pharm Res. 2008;25(1):87-103.
251. Geusens B, Van Gele M, Braat S, De Smedt SC, Stuart MCA, Prow TW, Sanchez W, Roberts MS, Sanders NN, and Lambert J. Flexible Nanosomes (SECosomes) Enable Efficient siRNA Delivery in Cultured Primary Skin Cells and in the Viable Epidermis of Ex Vivo Human Skin. Adv Funct Mater. 2010;20(23):4077-90.
252. Verma DD, and Fahr A. Synergistic penetration enhancement effect of ethanol and phospholipids on the topical delivery of cyclosporin A. Journal of Controlled Release. 2004;97(1):55-66.

149
253. Budai L, Kaszas N, Grof P, Lenti K, Maghami K, Antal I, Klebovich I, Petrikovics I, and Budai M. Liposomes for topical use: a physico-chemical comparison of vesicles prepared from egg or soy lecithin. Sci Pharm. 2013;81(4):1151-66.
254. Fadda AM, Baroli BM, Maccioni AM, Sinico C, Valenti D, and Alhaique F. Phospholipid-detergent systems: effects of polysorbates on the release of liposomal caffeine. Il Farmaco. 1998;53(10–11):650-4.
255. El Maghraby GM, Williams AC, and Barry BW. Can drug-bearing liposomes penetrate intact skin? The Journal of pharmacy and pharmacology. 2006;58(4):415-29.
256. Williams AC, and Barry BW. Skin absorption enhancers. Crit Rev Ther Drug Carrier Syst. 1992;9(3-4):305-53.
257. Manconi M, Sinico C, Valenti D, Lai F, and Fadda AM. Niosomes as carriers for tretinoin. III. A study into the in vitro cutaneous delivery of vesicle-incorporated tretinoin. Int J Pharm. 2006;311(1-2):11-9.
258. Manconi M, Sinico C, Caddeo C, Vila AO, Valenti D, and Fadda AM. Penetration enhancer containing vesicles as carriers for dermal delivery of tretinoin. Int J Pharm. 2011;412(1-2):37-46.
259. Sarpotdar PP, and Zatz JL. Evaluation of penetration enhancement of lidocaine by nonionic surfactants through hairless mouse skin in vitro. Journal of Pharmaceutical Sciences. 1986;75(2):176-81.
260. El Maghraby GMM, Williams AC, and Barry BW. Skin delivery of oestradiol from lipid vesicles: importance of liposome structure. International Journal of Pharmaceutics. 2000;204(1–2):159-69.
261. Motwani MR, and Rhein LD. Influence of vehicles on the phase transitions of. J Cosmet Sci. 2002;53(35-42.
262. El Maghraby GM, Williams AC, and Barry BW. Skin delivery of 5-fluorouracil from ultradeformable and standard liposomes in-vitro. The Journal of pharmacy and pharmacology. 2001;53(8):1069-77.
263. Uchegbu IF, and Vyas SP. Non-ionic surfactant based vesicles (niosomes) in drug delivery. International Journal of Pharmaceutics. 1998;172(1-2):33-70.
264. Alsarra IA, Bosela AA, Ahmed SM, and Mahrous GM. Proniosomes as a drug carrier for transdermal delivery of ketorolac. European journal of pharmaceutics and biopharmaceutics : official journal of Arbeitsgemeinschaft fur Pharmazeutische Verfahrenstechnik eV. 2005;59(3):485-90.
265. Namjoshi S, Caccetta R, Edwards J, and Benson HA. Liquid chromatography assay for 5-aminolevulinic acid: Application to in vitro assessment of skin penetration via Dermaportation. Journal of Chromatography B. 2007;852(1):49-55.
266. Dept of Health and Human Services FaDAF, Center for Drug Evaluation and Research (CDER), Center for Biologics Evaluation and Research (CBER). Guidance for Industry: Q2B Validation of Analytical Procedures: Methodology. http://www.fda.gov/downloads/drugs/guidancecomplianceregulatoryinformation/guidances/ucm073384.pdf. Accessed 14.06.11, 2011.
267. Zhang J, and Michniak-Kohn B. Investigation of microemulsion microstructures and their relationship to transdermal permeation of model drugs: Ketoprofen, lidocaine, and caffeine. International Journal of Pharmaceutics. 2011;421(1):34-44.
268. . Standard laboratory viscometers for liquids. http://en.wikipedia.org/wiki/Viscometer. Updated 20 April 2015, at 00:21.

150
Appendix
Materials and Methods
This chapter contains general materials and methods used in individual chapters of this
thesis. Common laboratory techniques have been used in regards to solutes penetration in
skin such as excised human skin preparation and transdermal delivery using Franz diffusion
cells. This chapter starts with a list of chemicals that have been used and then experimental
methods and procedures follow.
Chemicals
Caffeine, naproxen, minoxidil, lidocaine, ethanol, oleic acid (OA), eucalyptol (EU),
polyethylene glycol 400 (PEG400) and polyethylene glycol 6000 (PEG6000), cholesterol,
dilauroyl L-α-phosphatidylcholine (DLPC) were purchased from Sigma-Aldrich Pty. Ltd.
(Sydney, Australia). Mineral oil (MO) was purchased from Galtex (Australia, Ltd), Glycerol
from Ajax (a division of Naplex industries, Australia Pty. Ltd), Polyoxyl -20 Oleyl ether (Volpo-
N20) was purchased from CRODA (Croda Europe Ltd, United Kingdom) and Polyoxyl 10
Oleyl ether (Volpo-N10, also known as Brij96v) from UNIQEMA (Wilton, United Kingdom),
Decyl polyglucoside (DPGluc, sold as Oramix NS 10) was obtained from SEPPIC SA
(France). All chromatography reagents were analytical grade.
Drug models
All drugs have been chosen according to their lipophilicity (log P) and molecular weight (<
500) that are considered to be the most important physical properties determining
penetration through human skin. The physicochemical properties of the model compounds
are shown in Table 1

151
Table 1 Physicochemical properties of model compounds [Molecular weight (MW g/mol);
Lipophilicity (Log P); Melting point (MP °C); Molar volume (MV), Solubility in aqueous
solution (Saq mg/L); Dissociation constant (pKa)]
Compound MWa Log Pa MPa MVb Saq pKaa
Caffeine 194.19 -0.07 238 151.8 21600 10.4
Minoxidil 209.25 1.24 248 214.6 2200 4.61
Lidocaine 234.34 2.44 68.5 89.7 4100 7.9
Naproxen 230.26 3.18 153 142.6 15.9 4.2
aChemIDplus advanced-chemical information with searchable synonyms, structure,
formulas http://chem.sis.nlm.nih.gov/chemidplus/
bHSPiP program (Steven Abbott of Steven Abbott TCNF Ltd, ©2011 Steven Abbott and
Johann Wiechers)
Human skin preparation:
Skin preparation methods: full-thickness skin
The skin was provided by female donors undergoing elective surgical procedures. Ethical
approval was given by The University of Queensland Human Research Ethics Committee
(HREC Approval no. 2008001342) and donors gave informed consent.
The skin was placed stratum corneum down in a shallow tray and the fat was surgically
excised with a scalpel and discarded as pathological waste. In this process, the fat was
removed as completely as possible, taking care not to cut into the dermis below. The
remaining full thickness skin was placed flat on 2 sheets of Whatman filter paper, inside a
labelled manilla folder and sealed in an airtight ziplock plastic bag with air expelled. The full
thickness skin was frozen and stored flat at -20°C
Heat separated epidermal membrane
(Method of Kligman and Christopher 1963) (149)
The full thickness skin was immersed in hot water (60°C) for up to 60 seconds. After removal
of skin from the water and draining of excess water, the skin was placed with stratum
corneum side up on a cork board and secured with pins with slight stretching. Using a blunt
probe, the epidermis was carefully peeled from the dermis, taking care not to tear it. The
dermis was discarded, unless required.

152
The separated epidermal membrane (EM) was placed in a shallow tray containing about
30mm of water, so that the oily outer water resistant layer of the EM was facing up. The EM
was unrolled and carefully removed from the water on a piece of Whatman 541 filter paper.
The paper and EM were laid flat to air dry, placed on a cardboard support in a sealed zip-
lock bag and frozen at -20°C until required
Preparation of the stratum corneum
The stratum corneum was prepared from epidermal sheets by trypsin digestion (149). The
full-thickness skin was immersed in water at 60°C for 1 min that allowed the epidermis to be
teased off the dermis. The epidermis was floated overnight on a solution of 0.01% trypsin in
phosphate buffer saline (PBS) at 37°C. The viable epidermis was scraped off using cotton
buds and the remaining stratum corneum membrane was rinsed several times with distilled
water. The isolated stratum corneum sheets were placed flat on aluminium foil and stored
at -20°c until use.
Skin integrity:
To assess the resistance of the epidermis, samples of epidermis were mounted in Franz
cells: the receptor chamber was filled and 0.5-1 mL of PBS was added to the donor chamber.
The cells were equilibrated for 30 mins before transdermal electrical resistance
measurement was performed using a standard Multimeter with silver and silver chloride (Ag
& AgCl) electrodes one into each chamber.
Any reading above 20 KΩ is satisfactory (45, 265) a resistance less than 20 KΩ indicates
that the epidermal integrity may be compromised and the membrane should be replaced.
PBS was removed from the donor chamber and the surface of the skin gently blotted dry
with tissue paper before application of the solutions. The receptor chamber was also
emptied and refilled with new PBS.
The silver and silver chloride (Ag & AgCl) electrodes were prepared, according to the
Therapeutics Research Centre SOP (14/07/10), as described below:
Two silver rods (approx. 6 cm X 2-3 mm diam.) were polished with sandpaper before being
immersed in 1M KCl solution in a small beaker, not touching each other The rods were
connected to a constant current power supply (500 µA) for 1h. The AgCl electrode became
coated with a black AgCl deposit.

153
Skin permeation studies
Franz Diffusion Cells
In this thesis, Chapters 3, 4 and 5examined penetration from various formulations using
excised human epidermal membranes and full-thickness skin. Franz Diffusion Cells are the
most commonly used method for transdermal penetration studies. The membranes were cut
into discs (̰2 cm diameter), and mounted stratum corneum side uppermost between the
glass surfaces of the donor and receptor compartments. Vacuum grease was used as a
sealant on the edges that were not exposed to the penetrant. The exposed skin surface area
was 1.33 cm². Clamps were used to hold the cells together. The receptor was filled with an
appropriate buffer (usually PBS) and the required dose of the test substance was applied to
the membrane surface. The diffusion cells was placed in a perspex holder in a water bath,
to maintain the receptor phase temperature at 35°C, over a magnetic 15 point stirring plate.
Magnetic stirrers in the bottom of each receptor chamber maintained mixing in the receptor
fluid. Samples of receptor phase (200µl) were removed at regular time points and replaced
with same amount of fresh PBS buffer (152). Drug concentration in receptor samples was
determined by HPLC.
3.5.2 High performance liquid chromatography (HPLC)
3.5.2.1 Standard curve Samples preparation and analysis
Caffeine samples were dissolved in (PBS) pH 7.4. The internal standard was theophylline
(5µg/mL) dissolved in the same solvent as the samples. Samples were analysed by HPLC.
Minoxidil samples were dissolved in methanol then diluted using PBS pH 7.4. The internal
standard was Propyl paraben (5µg/mL) dissolved in the same solvent. Samples were
analysed by HPLC.
Lidocaine samples were dissolved in PBS pH 7.4. The internal standard was Bupivacaine
5µg/ml dissolved in the same solvent as the samples. Samples were analysed by HPLC.
Naproxen samples were dissolved in methanol then diluted using PBS pH 7.4. The internal
standard was Indomethacin 10µg/ml dissolved in the same solvent. Samples were analysed
by HPLC
All samples were analysed using HPLC system consisting of Shimadzu SIL-6B SCL-10 a
VP system controller, a SPD-10AV UV-VS detector, LC-10AD pump and an auto injector.
The mobile phase was pumped across the system at 1ml/min flow rate. The column was a
Phenomenex Luna 5 C18 (150×4.6mm).

154
Chromatographic conditions
Table 2 Schedule of operating conditions for chromatographic analyses
Drug name
Caffeine Minoxidil Lidocaine Naproxen
Wavelength 273 nm 281 nm 210 nm 230 nm
Mobile phase 20mL ACN, 20ml
THF, 5ml acetic
acid,950ml H₂O
0.01M NaH₂PO₃,60%
H₂O,40%ACN,2.5m
M SDS
0.05M Na₂HPO₄
buffer 73%, 27%ACN
45% CAN, 20%
Methanol, 35%
water and 4mL
Acetic acid
Internal standard (IS) Theophylline
(5 µg/ml)
Propyl paraben
(5 µg/ml)
Bupivacaine
(10µg/ml)
Indomethacin
(10µg/ml)
Dissolution solvent PBS Methanol PBS Methanol
HPLC system #4 Shimadzu class
VP software and
Excel 2002
#4 Shimadzu class
VP software and
Excel 2002
#4 Shimadzu class
VP software and
Excel 2002
#4 Shimadzu class
VP software and
Excel 2002
Validation method
Validation of assays includes testing for linearity, range, accuracy, precision, detection limit
(DL) and quantitation limit (QL) according to FDA guidelines (266). The DL and the QL were
based on the standard deviation of response (Q) and the slope of calibration curve (S).
DL=3.3Q / S
QL=10Q / S
Stock solutions (1mg/mL) of each compound were prepared by dissolving an accurate
amount of each compound in the solvents shown in Table 2. The standard curve was then
concentrated by serial dilutions of the stock dilution to the concentration differences shown
in Table 3.3. Analysis was based on peak areas. Caffeine, lidocaine and naproxen were
validated using 3 sets of standard curves plus 3 extra samples of lower limit of quantification
for caffeine and lidocaine in one day. The minoxidil method was validated using a set of
standard curves plus 2 extra samples for three days (interday) and one set of calibration
curves plus 2 extra samples in the morning and afternoon (intraday) (See Table 3).

155
Table 3 Validation results
Drug
Caffeine Minoxidil Lidocaine Naproxen
Linearity 0.1-10
(µg/ml)
0.05-6 (µg/mL). 0.3-10
(µg/ml)
0.15-10
(µg/ml)
Accuracy -2.0% Theoretical Conc.
µg/mL
Mean of
d conc
SD CV% Error
%
-0.5% -1.6%
0.5 0.47 0.01 1.5 -6.81
1 0.95 0.01 0.9 -5.2
Precision 2.4% Level Mean SD % cv 3.6% 4%
0.3µg/mL 0.31 0.01 1.9
3µg/mL 2.98 0.06 2.1
Limit of
quantitation
0.1 (µg/ml) 1.48 (µg/ml) 0.3215
(µg/ml)
0.15 (µg/ml)
Determination of Solubility in the vehicles or formulations (Sv)
Sv was determined in saturated solutions of the compounds in each vehicle or formulation.
An excess amount of the compound was added to 5 ml of the vehicle or formulation and the
samples were incubated in a water bath at 32°C for 24 h, with continuous magnetic stirring.
The samples were then centrifuged at 4000 rpm for 15 min and the supernatants were
analysed by validated HPLC methods, after appropriate dilution where necessary (106). The
Sv was described in Chapters 3, 4 and 5.
Determination of solubility in the stratum corneum (SSC)
Discs of stratum corneum (4 replicates for each compound) were weighed before using.
They were then equilibrated in a saturated solution 1mL of each solute at 32°C for 24 h,
according to established methods (150). At the end of the incubation period, the stratum
corneum was removed, blotted dry and extracted with 1 mL 70% ethanol/water for another
24 h, at the same temperature used for equilibrium (32°C). The SSC was determined from
the amount of recovered model compound in the extraction fluid, measured by HPLC divided
by the thickness and the area of the stratum corneum. The SSC was examined in Chapters
3, 4 and 5.
Solvent uptake
The total solvent uptake into the stratum corneum was determined from the weight
difference of a piece of the dry stratum corneum (about 0.6 mg) soaked in individual solvents
156
(1 mL) for 24 h at 35°C. The stratum corneum pieces were wiped three times with Kimwipe
tissues before being weighed again. Solvent uptake was described in Chapters 3 and 4.
Tape stripping
This technique has been used in Chapters 4, 5 and 6. It is a technique used to remove the
stratum corneum from skin by applying adhesive tape to the exposed skin surface, followed
by careful removal. After Franz diffusion studies were completed, skin was washed 3 times
with an ethanol moistened cotton bud or tissue. These wash samples were saved separately
for HPLC analysis. After 10 min air drying, the skin was subjected to up to 20 tape strips to
separate the stratum corneum from the epidermis. D-Squame tape (CuDerm Corp., USA)
was applied to the exposed skin surface for about 5 s at a standard pressure and then
carefully removed. Individual tapes were placed into separate vials and soaked overnight
with 2 mL methanol before being analysed by HPLC. The amount of absorbed material in
each tape was then determined. It represented material deposited within the stratum
corneum. The result of the first tape was discarded, as this represented surface deposited
material only.
Skin extraction.
Subsequent to tape stripping, the remaining skin was sliced into small sections;
homogenised and extracted overnight with 2 mL methanol under constant shaking. Caffeine
and naproxen concentrations in the extracts were determined by HPLC.
Extraction of skin was described in Chapters 4, 5 and 6.
Follicular casting
We used a technique known as the Lademann technique. It allows drugs deposited within
appendages to be sampled and quantified. The surface and stratum corneum-deposited
drugs were first removed by tape stripping 20 times. Following tape stripping, one drop of
superglue was placed on a frosted section of a glass microscope slide, which was then
pressed onto the surface of the stripped skin and held in place under light pressure for
several minutes. When the glue was hard, the slide was peeled carefully from the skin,
taking the contents of the skin appendages with it. The superglue was dissolved by rubbing
with acetone-soaked cotton buds (4 times) and the individual cotton buds containing the
sampled follicular contents were soaked overnight in 2 mL methanol before vortexing and
quantitation by HPLC. This technique was used in Chapters 5 and 6.

157
Open and closed hair follicles techniques
Hair follicle plugging
Our group developed a method to plug the hair follicles on excised skin to evaluate their
contribution in permeability across the skin. According to this method we closely identified
all the hair follicles in a marked region under the microscope (ZEISS, stemi 2000-C, Schott
(Germany) KL (200LED). The plugging procedure involved applying 0.1 μL acriflavine
solution (dissolved in milliQ water) to form a globule around the follicle and subsequently
adding 0.1 μL of ethyl cyanoacrylate, (Loctite Super Glue, Henkel, USA) on top of it. The
polar monomers of cyanoacrylate polymerised when they came in contact with the water
molecules in the presence of acriflavine dye. This dye-sensitised polymerisation forms long
and strong chains, thus plugging the skin and hair follicle. This technique was used in
Chapters 5
Validation for hair follicle plugging method
As this is a new method, we wanted to test its efficacy by conducting in vitro skin absorption
studies. As many of the follicles that could be identified under the microscope were plugged
by the above technique. Then 1 mL of 3% (w/v) solution of caffeine in water was applied as
the donor solution, with PBS at pH 7.4 as the receptor solution. The donor chamber was
wrapped with parafilm after adding of the solution to prevent evaporation. At different times
over 12 hours, 200 L of the receptor solution was withdrawn and replaced with the same
amount of fresh PBS. The sample thus withdrawn was analysed for caffeine levels by
sensitive and rapid HPLC. The sequence of events is shown in Figure 1.
Figure 1 Method of hair follicle plugging (a. hair follicle identification; b. application of 0.1μL
acriflavine solution dissolved in milliQ water; c. application of 0.1μl of ethyl cyanoacrylate
(super glue); d. overview of plugged hair follicles in the exposed area.

158
Nanoemulsion formulation preparation
The formulations were prepared by dissolving Volpo-N10 (surfactant) in ethanol (co-
surfactant). Then, oleic acid or eucalyptol (oil) was dissolved in the surfactant/ co–surfactant
mixture, followed by gentle mixing with PBS. The surfactant/co-surfactant (S/Co-S) weight
ratio was 1:1 and the weight ratio of oil: S/Co-S was 0.6:1:1. The resulting nanoemulsion
was a clear semi-liquid at room temperature. Caffeine, minoxidil and naproxen at 3% w/w,
2%w/w and 2% w/w, respectively were dissolved in the nanoemulsions and control
solutions. This preparation method was used Chapters 4 and 5.
Pseudo-ternary phase diagram
Oleic acid and eucalyptol were used as oil phase (O), Brij 96v was used as the surfactant,
and ethanol was used as the co-surfactant. The mixture of O with S/Co-S was prepared at
w/w ratios 0.6:1:1. Then, the O/(S/Co-S) mixture was titrated with water step by step. In
each step a mixer agitated the mixture to mix it thoroughly and the sample was checked
visually. If the sample was clear, it has become a nanoemulsion but if it was cloudy, it had
not become a nanoemulsion. The technique was designed to find the area of nanoemulsion
existence to be as correct as possible (267). Once the concentration ratio of the
nanoemulsion was selected, the drug was loaded and physicochemical properties were
tested at ambient temperature. The preparation was described in Chapter 4.
Vesicle preparation
Different vesicles were prepared with excipient mixtures. For all vesicles, the excipients were
mixed in a rotary flask in different ratios, followed by glass beads (4 g) and chloroform (3
mL). Once the lipids were dissolved, the solvent was gradually evaporated on a rotary
evaporator at 30 °C until a lipid film formed on the wall of the flask. The flask was set aside
for 2 hours to eliminate residual chloroform, after which the lipid film was stirred with 2 mL
caffeine solution (2% in water) for 2 hours at 30 °C. The liposome suspensions were
extruded through a polycarbonate membrane with pore size 100 nm using the Liposofast
extruder (AVESTIN, Inc., Ottawa, Canada). Thirty-one cycles of extrusion were performed
for each vesicle type. The study was described in Chapter 6.
Encapsulation efficiency
To separate the non-encapsulated drug, the vesicle suspensions were centrifuged at 14000
rpm for 30 min at room temperature. The amounts of solute in the supernatant and also in
the clear solution were analysed by HPLC. Drug encapsulation efficiency (EE%) was

159
calculated as: EE% = 100* mass of incorporated drug/total mass in vesicle preparation. The
study was described in Chapter 6.
Nanoemulsion and vesicle characterisation (These techniques were used in Chapters
4 and 6.)
Nanoemulsions were characterised by transmittance, droplet size, reflection index,
electrical conductivity and viscosity)
Vesicles were characterised by droplet size, zeta potential and polydispersity index (PDI).
Transmittance (Clarity)
The transmittance (T) of a sample is the ratio between the intensity of light that has passed
through a sample to the intensity of light when it entered a sample (T=Iincident/Itransmitted). It can
also be expressed as a percentage (T x 100). Transmittance measured under standard
conditions can be used as a measure of the clarity of a sample. It is generally accepted that
nanoemulsions are characterised by transmittance readings >90%. The clarity of
nanoemulsions in this work was determined by using a spectrophotometer (Hitachi U-1100;
acrylic cuvettes 10X10X45mm) at a wavelength of 650nm.
Dynamic light scattering (DLS)
Size (Z-average size) and polydispersity index (PDI (the width of particle size) of
microemulsions were measured using a Zetasizer Nano ZS (Malvern Instruments, Ltd,
Malvern, UK). The diameter of a sphere is determined by measuring the speed of the
random diffusion of molecules in the liquid due to the bombardment by surrounding solvent
molecules using the Dynamic Light Scattering (DLS) method (Malvern). The system
contains the optical unit for collection of raw data from samples, cells to hold the samples
and controls and software which calculates the results using established theories. The size
measurements were conducted using standard operating procedures (SOP) and reflective
index values for the water and oil phases. Nanoemulsions were diluted 1:100 in water and
measured in polystyrene cuvettes at 25°C.
160
Refractive index
The refractive indexes of nanoemulsion samples were measured with a refractometer (RFM
34) at room temperature.
Electrical conductivity (EC)
Nanoemulsion phase change analysis can be carried out by observing changes in
conductivity with the addition of water to the system. Phase changes are indicated by a
“percolation point”, over which a drop in conductivity is observed. Clarification of the
concentration ranges within which an O/W or W/O nanoemulsion is formed is confirmed
using a Digitor 31/2 Digit multimeter model Q1563. The values of EC measurements were
performed in triplicate using an electrical conductivity meter; this was done by using AgCl
and Ag conductivity electrodes at room temperature. The O/W nanoemulsion is conductive,
however, W/O emulsions show much greater resistance. Therefore, the conductivity
switched between two plateaus corresponding to water-continuous and oil-continuous
structure (202).
Viscosity measurements
The nanoemulsion viscosity was determined using a glass capillary viscometers or Ostwald
viscometers (Figure 2), named after Wilhelm Ostwald, at ambient temperature (24°C ± 1).
Another version is the Ubbelohde viscometer, which consists of a U-shaped glass tube held
vertically in a room temperature. In one arm of the U is a vertical section of precise narrow
bore (the capillary) glass. Above there is a bulb, with another bulb lower down on the other
arm. In use, liquid is drawn into the upper bulb by suction, and then allowed to flow down
through the capillary into the lower bulb. Two marks (one above and one below the upper
bulb) indicate a known volume. The time taken for the level of the liquid to pass between
these marks is proportional to the kinematic viscosity. Most commercial units are provided
with a conversion factor, or can be calibrated by a fluid of known properties. The time
required for the test liquid to flow through a capillary of a known diameter of a certain factor
between two marked points is measured. By multiplying the time taken by the factor of the
viscometer, the kinematic viscosity is obtained (268).
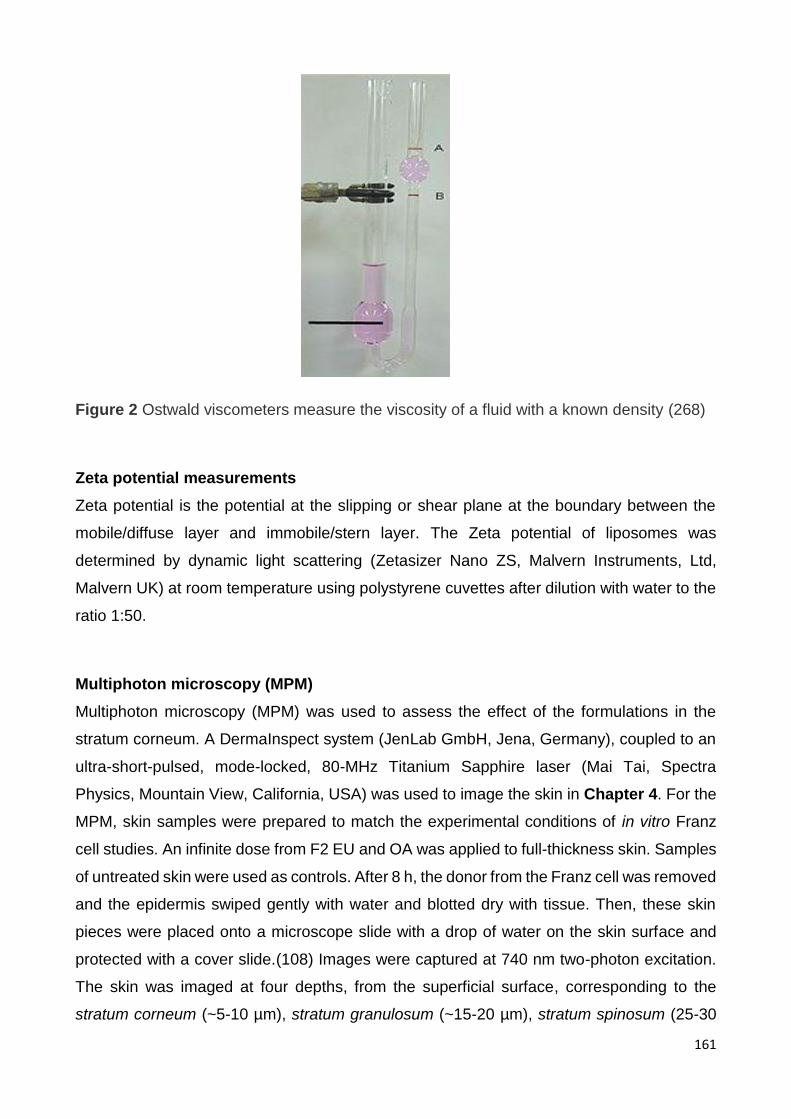
161
Figure 2 Ostwald viscometers measure the viscosity of a fluid with a known density (268)
Zeta potential measurements
Zeta potential is the potential at the slipping or shear plane at the boundary between the
mobile/diffuse layer and immobile/stern layer. The Zeta potential of liposomes was
determined by dynamic light scattering (Zetasizer Nano ZS, Malvern Instruments, Ltd,
Malvern UK) at room temperature using polystyrene cuvettes after dilution with water to the
ratio 1:50.
Multiphoton microscopy (MPM)
Multiphoton microscopy (MPM) was used to assess the effect of the formulations in the
stratum corneum. A DermaInspect system (JenLab GmbH, Jena, Germany), coupled to an
ultra-short-pulsed, mode-locked, 80-MHz Titanium Sapphire laser (Mai Tai, Spectra
Physics, Mountain View, California, USA) was used to image the skin in Chapter 4. For the
MPM, skin samples were prepared to match the experimental conditions of in vitro Franz
cell studies. An infinite dose from F2 EU and OA was applied to full-thickness skin. Samples
of untreated skin were used as controls. After 8 h, the donor from the Franz cell was removed
and the epidermis swiped gently with water and blotted dry with tissue. Then, these skin
pieces were placed onto a microscope slide with a drop of water on the skin surface and
protected with a cover slide.(108) Images were captured at 740 nm two-photon excitation.
The skin was imaged at four depths, from the superficial surface, corresponding to the
stratum corneum (~5-10 µm), stratum granulosum (~15-20 µm), stratum spinosum (25-30

162
µm) and stratum basale (35-40 µm). Keratinocyte morphology was used to confirm each of
these layers.
LaVision Multiphoton Microscope
LaVision Multiphoton Microscope (LaVision BioTec GmbH, Germany) was used to assess
the effect of these formulations in hair follicles and the area around hair follicles. A
multiphoton system, coupled to an ultra-short-pulsed Titanium Sapphire laser (Mai Tai,
Spectra Physics, Mountain View, California, USA) was used to image the skin. Full-
thickness abdominal skin was mounted in Franz diffusion cells and a finite dose of acriflavine
in the nanoemulsion formulations containing EU and OA and control (water) was applied.
Samples of untreated skin were used as controls. After 24 h, the cells were dismantled and
the skin was rinsed gently with water and blotted dry with a tissue. It was then placed directly
on a microscope slide. Images were captured by two photon excitation at 740 nm. The skin
was imaged at different depths, from the superficial surface, corresponding to the stratum
corneum (~5-10 µm), stratum granulosum (~15-20 µm), stratum spinosum (25-30 µm) and
stratum basale (35-40 µm). Keratinocyte morphology was used to confirm image depth in
each of these layers. Image analysis was done using Image J (Wayne Rasband, National
Institutes of Health, USA). These images were used in Chapter 5.