targeted inputs programme · tip 2000-01 targeted inputs programme food production and security...
TRANSCRIPT

TIP 2000-01 Targeted Inputs Programme
Food Production and Security
Module 1
Dr Pickford K. Sibale (team leader)
Dr A.M. Chirembo, Dr A.R. Saka and Mr V.O. Lungu
An evaluation study commissioned for the Ministry of Agriculture and Irrigation of the Government of Malawi by the U.K. Department for International Development


ACKNOWLEDGEMENTS
The consultants were able to achieve their objectives as contained in their Terms of Reference largely because of the support received from the management and staff of Chitedze Agricultural Research Station. They hosted us during the training of enumerators and also during the period of data entry, analysis and report write-up. We are grateful for all the logistical support rendered to us as we undertook this consultancy. We are also grateful to Mr. J.S. Funsani for managing our financial resources prudently and to Mr. K.J. Kamuona for assistance in typing the manuscript. We also extend our gratitude to all the heads of households we interviewed in 108 villages throughout Malawi. We appreciated their hospitality and patience as we intruded into their privacy with the many questions asked.


Table of Contents Introduction.......................................................................................................... 1
Methodology ......................................................................................................... 2
Sampling ............................................................................................................ 2 Questionnaire design.......................................................................................... 2 Pre-testing, amending and translating the questionnaires.................................. 4 Organization of field work................................................................................. 4 Planning for field work ...................................................................................... 5 Data processing.................................................................................................. 6 Evaluation approach .......................................................................................... 6 Poverty categories.............................................................................................. 7
The assets dimension ..................................................................................... 7 The income dimension................................................................................... 7 Composite assets and income index .............................................................. 9
Measurement of food security ........................................................................... 9
Results and discussion ....................................................................................... 11
Basic characteristics of the sample .................................................................. 11 Gender.......................................................................................................... 11 Age structure................................................................................................ 11 Marital status................................................................................................ 12 Household size ............................................................................................. 12 Languages .................................................................................................... 13 Area cultivated and total area of land .......................................................... 13
Proportion of female-headed households ........................................................ 14 TIP distribution ................................................................................................ 14
Receipt of TIP packs.................................................................................... 14 Poverty targeting.......................................................................................... 15 Timing of distribution.................................................................................. 15 Cases of non-receipt of TIP packs ............................................................... 17
Villages refusing to receive TIP .............................................................. 17 Villages not registered ............................................................................. 17
Distance to collection point ......................................................................... 17 Contents of TIP packs...................................................................................... 17
Number of bags inside the TIP packs .......................................................... 18 Condition of the TIP pack inputs ................................................................. 18 Quality of the TIP pack inputs ..................................................................... 19
Use of the TIP pack inputs............................................................................... 19 Use of TIP maize seed ................................................................................. 19 Use of TIP legume seed ............................................................................... 20 Use of TIP fertilisers.................................................................................... 22
Other inputs used by TIP recipients................................................................. 25 Non-TIP maize seed..................................................................................... 25
Type of seed bought................................................................................. 25 Amount of seed bought............................................................................ 25
Fertiliser ....................................................................................................... 27 TIP leaflet and agricultural extension.............................................................. 28
OPV maize ................................................................................................... 30

Food production............................................................................................... 31 Crop production in 1999-2000 cropping season.......................................... 32
Maize production ..................................................................................... 32 Legume production .................................................................................. 34
Production forecasts for 2000-01................................................................. 35 Maize production ..................................................................................... 35 Legume production .................................................................................. 36
Farmers perception of the state of their TIP maize and legume crops ........ 37 Deficit in food from own production ............................................................... 38 Months of food security ................................................................................... 40
Description of food secure and food insecure households .......................... 40 Months of food security by district.............................................................. 41
Sales and purchases of maize........................................................................... 42 Maize sales................................................................................................... 42 Maize purchases........................................................................................... 43
Conclusions......................................................................................................... 44
Appendix 1: Household Listing Form.............................................................. 49
Appendix 2: Questionnaires in English ........................................................... 53
Appendix 3: Questionnaires in Chichewa and Tumbuka .............................. 67
Appendix 4: Terms of Reference .................................................................... 100
Appendix 5: List of villages visited................................................................. 105

Index of tables Table 1: Gender of respondents ........................................................................... 11 Table 2: Age of respondents ................................................................................ 11 Table 3: Marital status of respondents................................................................. 12 Table 4: Household size....................................................................................... 12 Table 5: Summary statistics for household size................................................... 12 Table 6: Languages spoken by respondents ........................................................ 13 Table 7: Area of land cultivated (acres)............................................................... 13 Table 8: Total area in the holding (acres) ............................................................ 14 Table 9: Percentage of female headed households .............................................. 14 Table 11: Poverty profiles of TIP recipients and non-recipients ......................... 15 Table 12: Start of the rains and TIP distribution ................................................. 16 Table 13: Farmer's perception of the timing of TIP distribution ......................... 16 Table 14: Inputs found inside the TIP pack......................................................... 18 Table 15: Number of bags inside the TIP packs .................................................. 18 Table 16: Condition of the TIP pack inputs......................................................... 18 Table 17: Perceived quality of TIP pack inputs................................................... 19 Table 18: Use of TIP maize seed ......................................................................... 19 Table 19: How TIP maize seed was planted........................................................ 19 Table 20: Why maize seed was not planted or only some was planted............... 20 Table 21: Contribution of TIP maize seed to the household maize seed............. 20 Table 22: Use of legume seed.............................................................................. 21 Table 23: How legume seeds were planted ......................................................... 21 Table 24: Why legume seeds were not planted or only some were planted........ 21 Table 25: Contribution of TIP legume seed to the household legume seed ........ 22 Table 26: Use of TIP fertiliser ............................................................................. 22 Table 27: Reasons for not applying TIP fertiliser................................................ 23 Table 28: How TIP fertiliser was applied to maize ............................................. 23 Table 29: Time when basal fertiliser was applied ............................................... 23 Table 30: Application time for top dressing fertiliser.......................................... 24 Table 31: Application time for mixed (basal + top dressing) fertiliser ............... 24 Table 32: Contribution of TIP fertiliser to household fertiliser........................... 24 Table 33: Type of seed bought by farmers .......................................................... 25 Table 34: Total amount of seed bought and total amount of money spent on seed
by poverty level ........................................................................................... 26 Table 35: Total amount of seed bought and total amount of money spent on seed
by sex of respondent .................................................................................... 26 Table 36: Breakdown of local and hybrid maize seed bought by poverty level.. 26 Table 37: Breakdown of local and hybrid maize seed bought by sex of the
respondent .................................................................................................... 27 Table 38: Sources of fertiliser in 2000-01 ........................................................... 27 Table 39: Sources of finance for non-TIP fertiliser ............................................. 27 Table 40: Amount of fertiliser bought with cash or credit .................................. 28 Table 41: Frequency and % of respondents who followed maize planting
instructions................................................................................................... 28 Table 42: Were the instructions easy to follow?.................................................. 29 Table 43: Why instructions were not easy to follow ........................................... 29

Table 44: How often do you meet an agricultural extension officer? ................. 29 Table 45: Farmer’s awareness of OPVs............................................................... 30 Table 46: How did you know that maize seed was different? ............................. 30 Table 47: Farmers’ responses to HIV/AIDS questions ....................................... 31 Table 49: Maize production in 1999-2000 by receipt of SP2.............................. 32 Table 50: Food secure and food insecure people by receipt of SP2 .................... 33 Table 51: Maize production in 1999-2000 by poverty category, receipt of SP2 and
food security status of the households ......................................................... 34 Table 52: Legume production in 1999-2000 disaggregated by receipt of SP2
inputs............................................................................................................ 34 Table 53: Expected maize production in 2000-01 ............................................... 35 Table 54: Expected maize production in 2000-01 by food security status.......... 35 Table 55: Expected legume production in 2000-01............................................. 36 Table 56: Expected legume production in 2000-01 disaggregated by poverty
categories and by food security status ......................................................... 37 Table 57: Farmers perception of the state of their TIP maize and legume crops for
the 2000-01 crop season .............................................................................. 37 Table 58: Why don’t you expect a good maize and legume harvest for the 2000-01
crop season?................................................................................................. 38 Table 59: Months of food deficit ......................................................................... 39 Table 60: Food deficit months disaggregated by receipt of SP2 (%) .................. 39 Table 61: Percentage households by food security status and sex of respondent 40 Table 62: Percentage households by food security status and household size .... 40 Table 63: Percentage households by food security status and area cultivated .... 40 Table 64: Percentage households by food security status and receipt of TIP ..... 41 Table 65: Percentage households by food security status and poverty category. 41 Table 66: Mean months of food deficit and months of food security by district 42 Table 67: Mean months of food deficit and months of food security for
respondents that sold maize and respondents that did not sell maize.......... 42 Table 68: Percentage of farmers selling maize by receipt of SP2 (%) ................ 43 Table 69: Volume of maize purchases and money spent on the maize
disaggregated by months of food deficit...................................................... 43

Introduction The 2000-01 TIP campaign, which is a follow-up on the Starter Pack (SP) campaigns of 1998-99 (SP1) and 1999-2000 (SP2), intended to provide 1.5 million smallholder rural households with one Starter Pack containing 0.1 ha-worth of fertiliser, an open pollinated variety maize seed and legume seed in time for the start of the rains in the 2000-01 cropping season. The main objective of the TIP campaign was to increase household food security and it was envisaged as a programme that transfers resources to poor households in Malawi. The Evaluation Programme for the 2000-01 TIP comprises a set of five modules, of which Module 1 is an integral component. The Food Production and Security module was designed to provide forecasts on TIP’s contribution to national food production, as well as to show how the inputs contained in the TIP packs were used. It was also designed to evaluate the contribution of SP2 to household food security, and compare the expected food production of TIP recipients with that of non-recipients. The approach followed by Module 1 of the 2000-01 TIP Evaluation was the same as the one used for evaluating SP2. At the centre of this approach is the idea of triangulating results from different methods to arrive at trends and orders of magnitude when assessing the impact of TIP. The different methods that have been used include:
• year-to-year comparisons; • comparisons between TIP recipients and non-recipients or between SP2
recipients and non-recipients; and • farmers’ perceptions and experiences.
The food production and security survey has provided evidence on the following:
• estimates of staple food production in the 1999-2000 crop season; • production forecasts for 2000-01; • months of household maize self sufficiency and food security between the
2000 harvest and March-April 2001; • use of TIP inputs, and, if they were not used as instructed, why not; • how the use of inputs was affected by the delivery of the packs, especially the
timing of the delivery; • what proportion of the farmers’ total inputs came from TIP as compared with
inputs from other sources; • farmers’ perceptions on the state of their maize and legume crops, including
the perceived reasons for the condition of the crops; and • whether farmers received and understood the leaflets accompanying the packs.
The Module 1 study was contracted out to a team of consultants based at Chitedze Agricultural Research Station, who worked hand in hand with the Statistical Services Centre (SSC) of the University of Reading in the UK in the design of the survey, data entry and the overall management of the consultancy. Data analysis, interpretation and report writing was the sole responsibility of the consultants.
1


Methodology
Sampling Given that the administration of TIP 2000-01 was conducted by District Assemblies, rather than the Agricultural Development Divisions (ADDs) as was the case in the second year of the Starter Pack programme in 1999-2000, we chose to use the districts as the basis for our sampling scheme. The sampling scheme used 27 strata, each stratum representing one of the 27 districts of Malawi. Within each stratum, a 2-stage sampling scheme was used to randomly select 4 villages (1st-stage sampling) and 30 households (2nd-stage sampling). The selection of villages was limited to those with more than 40 households and less than 250 households. This was done to exclude small villages, where we could not get enough respondents, and large villages, where we could have spent a disproportionately long time just to complete the household listing form for each village. This limitation on village size was based on our assumption that the receipt and use of TIP packs would not be affected by the size of the village. For each village, a Household Listing Form (HLF) was completed on which all the household members were listed and 15 TIP recipients and 15 non-recipients were randomly selected for interviews (see Appendix 1). The Household Questionnaire (HQ) was administered to all the 30 selected households, with the 15 TIP recipients also answering the Individual Questionnaires (IQ). Where we had more than one TIP recipient per household (which was rare in TIP 2000-01), then more than one IQ was completed. The head of the household was interviewed, or a spouse in their absence. Copies of the questionnaires can be found in Appendix 2. The sampling frame used was the TIP Logistics Unit’s Register of Recipients for SP2. For each district, a big effort was made to cover all the 4 villages as originally selected. However, 2 replacement villages were used because of impassable roads in some flood-affected districts, especially in southern districts of Nsanje and Chikwawa. A total of 108 villages and 3030 households were visited by this survey.
Questionnaire design We designed and administered three different instruments to obtain information on food production and security under the second year of the Starter Pack programme in 1999-2000 (SP2) and food production forecasts under TIP. The design features were arrived at in joint discussions between consultants and the managers from the Statistical Services Centre (SSC) of the University of Reading, UK. These were based on selected and modified questions from Modules 1 and 2 of the SP2 Evaluation and on our Terms of Reference (see Appendix 3). The three instruments used were: the Household Listing Form (HLF), the Household Questionnaire (HQ) and the Individual Questionnaire (IQ). The main sections for each questionnaire are shown in Box 1.
2

Box 1: Main sections of the information collection instruments 1. Household Listing Form Total number of households Number of households that received a TIP pack Number of households that did not receive a TIP pack Number of female headed households Number of male headed households Distance from the distribution centre (km) Date of distribution (day/month/year) Whether the date of distribution was changed or not 2. Household Questionnaire Part A Whether or not the household received a TIP pack Whether or not the household used contents of the TIP pack, even if they did not receive a pack When rains first came in 2000-01 season When the first rains normally come Part B Basic characteristics of the sample population, i.e. inheritance pattern, sex, age, marital status, household size, language, land owned and cultivated, etc Part C (Wealth/poverty indicators) Livestock and other household assets Sources of cash income Part D (Production) Food production in 1999-2000 under SP2 Food production forecasts in 2000-01 under TIP Main household staple Whether or not they received SP2 in the 1999-2000 crop growing season Part E (Food self-sufficiency and security) Food self-sufficiency and food security under SP2 Sales and purchases of food between the 2000 harvest and March-April 2001 Whether the household received any food from government-aided programmes, from relatives or through ganyu labour Whether the household used any coping strategies to survive food shortages 3. Individual Questionnaire Part A Basic characteristics of the sample population, limited to age and sex of recipient Part B (Timeliness of pack delivery) When the farmer planted his/her maize in the 2000-01 crop season When the household received the TIP pack When the farmer planted TIP maize The farmer’s perception of the distribution time for TIP packs Preferred month for receiving the TIP pack
3

Part C (Content of the pack) Whether the “mother bag” containing the TIP inputs was tampered with The farmer’s perception of the quality of the TIP inputs Part D (Use of the inputs) Whether the farmers planted the maize/legume seed and, if not, what they did with it Whether the maize/legume was planted as recommended Whether the fertiliser was applied as recommended The proportion of maize/legume/fertiliser used on the household farm (to determine the contribution of TIP inputs in relation to inputs from other sources) Part E (OPV) Questions designed to assess whether the farmer knew that open pollinated variety (OPV) maize was given out in 2000-01 instead of hybrid maize Part F (Assessment of harvest) The farmer’s assessment of his/her expected harvest for the 2000-01 crop season Part G (TIP leaflet and extension) Whether farmers followed the instructions in the leaflet which came with the TIP packs Whether farmers made any contacts with the field assistant Whether farmers visited a field demonstration site Whether farmers received the HIV/AIDS messages included in the TIP pack. Whether farmers received a condom with the pack
Pre-testing, amending and translating the questionnaires The HLF, HQ and IQ were pre-tested at Kadyaudzu village near Msundwe in Lilongwe district to check on the design features of the questionnaires and whether any amendments or modifications to the questions would be called for. We also checked on how long it takes to complete each interview. After incorporating the amendments, the final English version of the HQ and IQ were translated into Chichewa and Tumbuka, the two languages spoken by most respondents. We would like to point out here that there were some variations between the two versions, and these variations were not noted until after the field survey. In the Chichewa version, one question was missed; the Tumbuka version also missed one question. Other differences were attributable to difficulties of translating English into these two languages. As a result, some information obtained from the survey has been deliberately excluded from the analysis.
Organization of field work Having completed the questionnaire design and translation, as well as the questionnaire pre-testing and amendments, we embarked on the training of enumerators and supervisors in readiness for fieldwork.
4

A total of 27 enumerators with a Malawi School Certificate of Education (MSCE) were hired on a temporary basis for the duration of the fieldwork (25 working days). In addition, nine supervisors were hired for a maximum period of 35 days. The supervisors were drawn from a pool of recently retired agricultural officers who had access to a motorbike and are very familiar with agricultural activities in the country. The training was conducted at Chitedze Agricultural Research Station for a period of four days. This included one day of field practical training in Kadyaudzu village that is not far away from Chitedze Agricultural Research Station. All Module 1 consultants took part in the training of the enumerators and supervisors.
Planning for field work During the training sessions, an outline of the fieldwork plan was provided to the enumerators and supervisors. Each supervisor was allocated three enumerators to cover three districts; whereas each of the three consultants coordinated and supervised three supervisors (covering nine districts). This allocation clearly identified the villages and districts where each team would operate at any one point in time. In a nutshell, one consultant was responsible for coordinating and supervising the work of three supervisors and nine enumerators in nine districts. Given that the sample of respondents would be drawn from 108 villages in 27 districts throughout the country, each one of the 27 enumerators was to cover four villages. Each of the nine supervisors, together with his team of three enumerators, would cover 12 villages in three contiguous districts. Each one of the three consultants was to supervise the work of three supervisors and nine enumerators, covering 36 villages in nine districts. The fieldwork was designed to be completed within 25 working days in March-April 2001. While in the field, the supervisor’s role was to identify the village, carry out the household listing for the village, assign one enumerator to interview the sampled respondents, and then move on to another village to repeat the cycle of activities before coming back to supervise the work of the first enumerator. This cycle of events would be repeated again until all the 12 villages in the three districts had been covered. The completion of the HLF was the first activity for the supervisor and the enumerators of the survey team upon reaching the village. Having listed all the households in the village, a random selection of 15 TIP recipients and 15 non- recipients was done using random numbers before interviewing the farmers. The quality control of completed questionnaires required that the supervisor, while in the field, checked for completeness and correctness of the filled-in questionnaire as well as checking for inconsistencies of responses provided by the farmers. Quality control was also undertaken by the consultants, both in the field and at Chitedze Agricultural Research Station, before the data were processed and analysed.
5

Data processing At the end of the fieldwork, all questionnaires were gathered together at Chitedze Agricultural Research Station and individually checked for completeness, correctness and consistency of responses by the consultants before data processing was started. A team of eight data entry clerks, including one supervisor, were hired for two weeks to enter the data. The data entry programme was prepared in Microsoft Access by the SSC, while Mr Carlos Barahona, one of the managers from SSC, provided overall guidance and closely supervised the data entry process. The data cleaning process involved producing summary statistics for all the variables and spotting any odd values, which were then checked against the questionnaires, and the database cleaned up. Any odd value that originated from the questionnaire was filtered out from the analysis wherever deemed necessary. Data analysis was carried out using SAS and Excel programmes. It should be pointed out that the estimates presented in our results section refer to our sample population and are unweighted. This is mainly due to the difficulty of deriving appropriate weights when using the SP2 Register of Recipients that, even when it was the best sampling frame available at the time of the survey, is known to have problems of omissions and duplications.
Evaluation approach The SP1 Evaluation approach set out to measure “incremental yield” from Starter Pack plots by comparing plots on which Starter Pack seed had been planted according to instructions with adjacent non-Starter Pack plots. The SP2 Evaluation adopted a different approach, based on the view that the comparison between the perfect Starter Pack plot and a perfect “control” plot was an artificial construct, since farmers had in fact used the Starter Pack inputs in different ways, often spreading them beyond the recommended 0.1 ha plot. Also, there was no perfect counterfactual, since results from SP1 suggested that many farmers used fertiliser from other sources on their non-Starter Pack maize crops. Thus, an attempt to measure the incremental yield attributable to Starter Pack, as if under experimental conditions, would not be accurate enough to merit the high cost of the exercise. Instead, the SP2 Evaluation decided to accept the multi-dimensional aspects of the use of inputs and the impact of Starter Pack. It did not aim for high levels of precision, but looked for trends and orders of magnitude. Our evaluation approach for TIP 2000-01 adopted the SP2 Evaluation approach. At the centre of this approach, is the idea that we can triangulate the results from different methods, which include:
• Year-to-year comparisons; • Comparisons between TIP recipients and non-recipients (the control group);
and • Farmers’ perception on the state of the crop and their experiences.
6

Poverty categories Our study used a poverty index based on assets and reported income. The index was derived as outlined below.
The assets dimension A combined assets index was calculated using the following information and corresponding weights shown in Box 2. Box 2: Weights for assets used to calculate the poverty index
Abbreviation
Asset
Weight
a 1 a 2 a 3 a 4 a 5 a 6 a 7 a 8 a 9 a10
Chicken (number) Ducks (number) Guinea fowls (number) Doves (number) Pigs (number) Goats (number) Cattle (number) Radio ownership (yes = 1; no=0) Bicycle ownership (yes = 1; no=0) Oxcart ownership (yes = 1; no=0)
2 2 2 2
15 10
100 7
20 100
The assets index was then calculated by multiplying the assets by their weights for each household and then calculating the sum of these products. The formula used is as shown below: Assets index = (a1 + a2 + a3 + a4) * 2 + (a5 * 15) + (a6 * 10)+ (a7 * 100) + (a8 * 7) +
(a9 * 20) + (a10 * 100). This assets index was then split into four categories as shown in Box 3. Box 3: Asset based categorisation of households
Assets index
Asset category
Category label
Less than 2 2 to 30 31 to 70 71 or higher
1 2 3 4
No assets Few assets Several assets Many assets
The income dimension The income index was calculated by taking into account the types of income shown in Box 4:
7

Box 4: Sources of income used to calculate the income index
Abbreviation Income Income
i 1 i 2 i 3 i 4 i 5 i 6 i 7 i 8 i 9 i10 i11 i12
All crops in the last 12 months Small business in the last month Crafts or artisan work in the last month Livestock sales in the last month Remittances in the last month Pension in the last month Ganyu in the last weeding season Salary in the last month Sale of fish in the last month Sale of charcoal or firewood (last month) Rent last month Other income last month
The income index was calculated using the following formula: Income Index = i1/12 + i2 + i3 + i4 + i5 + i6 + i7 + i8 + i9 + i10 + i11 + i12 This income index was then split into four categories as shown in Box 5. Box 5: Income based categorisation of households
Income index
Income category
Category label
0 to 100 >100 to 300 >300 to 800 >800
1 2 3 4
Up to MK 100 MK 101 to 300 MK301 to 800 MK 800 plus
8

Composite assets and income index The poverty index was formed by combining the two categorised indices as shown in Box 6. Box 6: Poverty index categories Assets index Income index Less than 2 2 to 30 31 to 70 71 or higher 0 to 100 1 1 2 3 >100 to 300 1 2 3 4 >300 to 800 2 3 4 5 >800 3 4 5 5 The resulting categories were labelled as shown in Box 7. Box 7: Labels for poverty categories
Category code Category label
1 Category 1 (poorest) 2 Category 2 3 Category 3 4 Category 4 5 Category 5 (least poor)
It is important to note that the use of this poverty index allows us to compare the impact of TIP on rural households according to their relative level of wealth/poverty. We did not attempt to classify these households in relation to an absolute poverty line such as that used by the Integrated Household Survey.
Measurement of food security There are three ways of defining food security. The first is to equate food security with access to maize (maize self-sufficiency). By this measure, certain parts of the country and certain segments of the population are chronically food insecure. The second is to equate food security with household income levels; the lower the income, the higher the food insecurity. This way of defining food security is certainly superior to equating food security with access to maize, but it also fails to take into account the significant coping strategies used by households during the lean months of the year (January to March). The main coping strategy for rural households is ganyu. However, income from ganyu is not all necessarily spent on food. Other coping strategies include:
9

• Changing dietary patterns (i.e. fewer meals per day; use of cheap ingredients such as maize bran (gaga); eating vegetables only or mangoes which are plentiful during the lean months).
• Changing spending patterns (i.e. decreasing expenditures on other needed
household items to buy food).
• Engaging in distress sales of property and indiscriminate sales of natural resources, e.g. firewood, charcoal, fish or wild animals.
The third approach is to define food security as a function of access, income levels and the use of coping strategies. Coping strategies, especially changing dietary patterns, should be viewed as a last resort measure to survive for rural households. All things being equal, a rural household that employs such last resort coping strategies should be viewed as food insecure. We believe that there is no better indicator of food insecurity at household level than this one. Module 1 of the TIP 2000-01 Evaluation adopted the third definition of food security, and thus posed questions on the use of coping strategies, and when the household started employing the coping strategies. Any household indicating that they had employed any one of the coping strategies was classified as food insecure, and the number of months of food insecurity were calculated. The food security classification was also cross tabulated against poverty categories to show the relationship between food insecurity and poverty. Finally, TIP 2000-01 Evaluation Module 1 has also attempted to characterize the districts which appeared to be food secure and those which appeared to be food insecure between the 2000 harvest and March-April 2001.
10


Results and discussion
Basic characteristics of the sample
Gender Table 1: Gender of respondents
TIP (%)
Non-TIP (%)
Male 63.1 72.4 Female 36.9 27.6 Total 100.0 100.0 No of responses 1427 1546
Out of the 1427 respondents in our sample who received the TIP pack, 63% of them were males and 37% of them were females. Among the non-recipients, 72% were males and 28% were females. These results indicate that around 9% more of the recipients were female, suggesting that there was some limited success in targeting TIP towards female-headed households. This is in agreement with the findings of the report of the Monitoring Component for TIP 2000-01, which found that around 8% more of the recipient households were female-headed1.
Age structure Table 2: Age of respondents
TIP (%)
Non-TIP (%)
Children (less than 15 years) 1.1 1.0 Adult (15-49 years) 58.8 77.8 Elderly (aged 50 or over) 40.1 21.2 Total 100.0 100.0 No. of responses 1423 1545
The data in Table 2 show that there were more elderly respondents among TIP recipients (40%) than among the non-recipients (21%). This shows that there was some measure of success in targeting the elderly in the TIP programme. This is in agreement with the findings of the Monitoring Component, which showed that some 9% more of the TIP recipient household heads were elderly. In our sample, 19% more of the recipient respondents were elderly.
1 Lawson, M., A. Cullen, B. Sibale, S. Ligomeka and F. Lwanda (March 2001), Targeted Inputs Programme (TIP); Findings of the Monitoring Component for TIP 2000-2001.
11

Marital status Table 3: Marital status of respondents
TIP (%)
Non-TIP (%)
Single 1.5 2.2 Married, spouse living at home 65.2 73.1 Married, spouse living elsewhere 3.0 4.1 Separated/divorced 9.8 7.8 Widow/Widower 17.0 9.5 Not stated 3.6 3.4 Total 100 100 No. of responses 1441 1566
Table 3 shows the marital status of household heads for TIP recipients and non- recipients. The data show that there were about 8% more widows/widowers among the recipient households than the non-recipient households. This is an indication that widows and widowers were, to some extent, successfully targeted. This observation is in agreement with the findings of the Monitoring Component report.
Household size Table 4: Household size
Number of people in household
TIP (%)
Non-TIP (%)
1 3.3 3.4 2 10.9 12.9 3 18.1 21.7 4 22.5 21.7 5 18.2 18.1
6 or more 26.7 21.9 Missing data 0.2 0.2 Total 100.0 100.0 No. of responses 1243 1348
Table 5: Summary statistics for household size
TIP Non-TIP Mean 5.0 4.7 Std. Dev. 2.4 2.2 Minimum 1 1 Maximum 19 16
Table 4 shows that there is no difference in the household size profile of TIP recipients and non-recipients. The summary statistics shown in Table 5 confirm that the two groups are very similar in household size. The average household size for TIP recipients is 5 persons with a standard deviation of 2.4, whereas the household size for non-recipients is 4.7 persons with a standard deviation of 2.2.
12
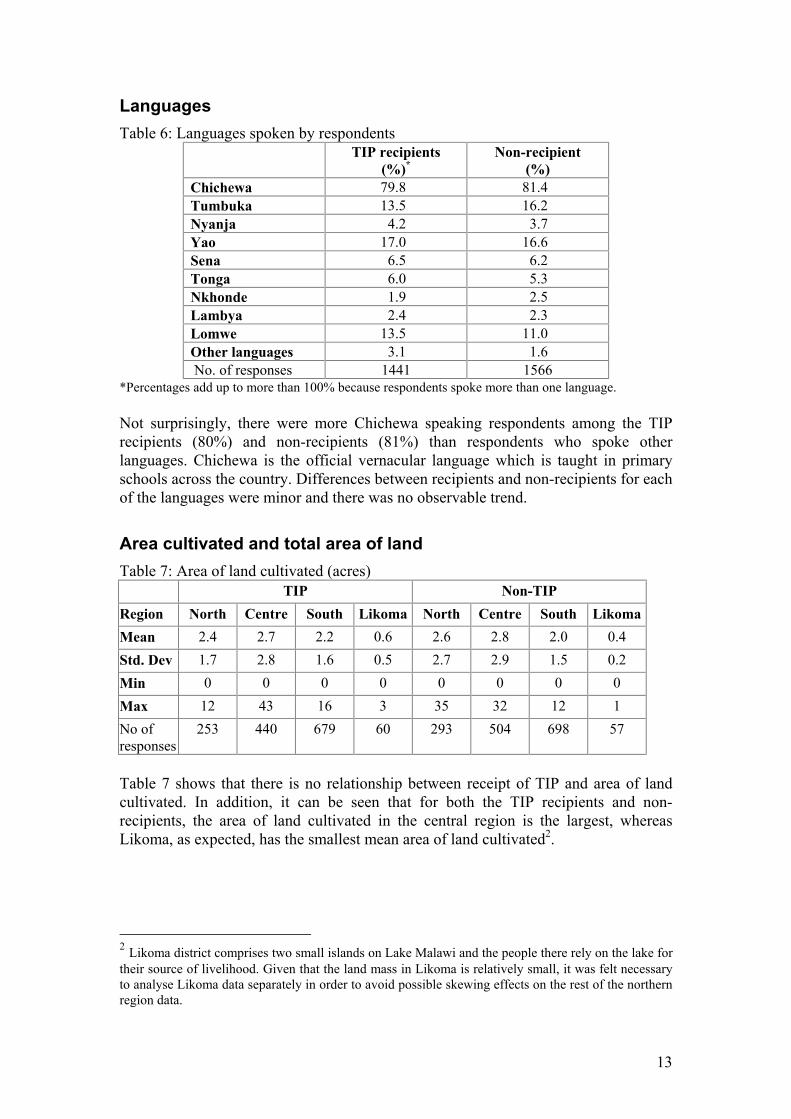
Languages Table 6: Languages spoken by respondents
TIP recipients (%)*
Non-recipient (%)
Chichewa 79.8 81.4 Tumbuka 13.5 16.2 Nyanja 4.2 3.7 Yao 17.0 16.6 Sena 6.5 6.2 Tonga 6.0 5.3 Nkhonde 1.9 2.5 Lambya 2.4 2.3 Lomwe 13.5 11.0 Other languages 3.1 1.6 No. of responses 1441 1566
*Percentages add up to more than 100% because respondents spoke more than one language. Not surprisingly, there were more Chichewa speaking respondents among the TIP recipients (80%) and non-recipients (81%) than respondents who spoke other languages. Chichewa is the official vernacular language which is taught in primary schools across the country. Differences between recipients and non-recipients for each of the languages were minor and there was no observable trend.
Area cultivated and total area of land Table 7: Area of land cultivated (acres) TIP Non-TIP Region North Centre South Likoma North Centre South Likoma Mean 2.4 2.7 2.2 0.6 2.6 2.8 2.0 0.4 Std. Dev 1.7 2.8 1.6 0.5 2.7 2.9 1.5 0.2 Min 0 0 0 0 0 0 0 0 Max 12 43 16 3 35 32 12 1 No of responses
253 440 679 60 293 504 698 57
Table 7 shows that there is no relationship between receipt of TIP and area of land cultivated. In addition, it can be seen that for both the TIP recipients and non-recipients, the area of land cultivated in the central region is the largest, whereas Likoma, as expected, has the smallest mean area of land cultivated2.
2 Likoma district comprises two small islands on Lake Malawi and the people there rely on the lake for their source of livelihood. Given that the land mass in Likoma is relatively small, it was felt necessary to analyse Likoma data separately in order to avoid possible skewing effects on the rest of the northern region data.
13

Table 8: Total area in the holding (acres) TIP Non-TIP
Region North Centre South Likoma North Centre South Likoma Mean 4.0 4.2 3.1 1.4 4.4 3.6 2.9 0.9 Std 3.0 4.5 2.3 1.2 4.2 3.3 2.0 0.6 Min 0 0 0 0 1 0 0 0 Max 21 43 20 7 50 32 15 3 No. of responses 258 440 679 60 299 508 700 58 Table 8 shows that there is no relationship between receipt of TIP and total area of land owned. In terms of the total area of land owned by households, farmers in the northern region own larger pieces of land (mean of 4.2 acres) than farmers from the centre (mean = 3.9 acres) or from the south (mean = 3.0 acres). Farmers from Likoma Island, own the smallest pieces of land (mean = 1.1 acres).
Proportion of female-headed households Table 9: Percentage of female headed households Region
Total No. of households
Total No. of female- headed households
% of female-headed households
North 2443 659 27.0 Centre 3301 792 24.0 South 4668 1285 27.5 Total 10,412 2736 26.3 The summaries in Table 9 come from the data collected in the HLFs. Although estimating the proportion of female headed households is not part of the objectives of this survey, this information comes as a sub product of the work carried out to be able to select our sample. We collected information on the sex of head of household in 10,412 households, that is all households in villages visited. The estimated proportion of female headed households is twenty six percent (26%). This compares well with the results of the Profile of Poverty in Malawi, 1998 report which indicated that in Malawi, just under 25% of households are female-headed3.
TIP distribution This section provides information on the proportion of households in rural Malawi that received TIP packs, the poverty targeting process and TIP distribution.
Receipt of TIP packs TIP was designed to reach 52% of rural households. The data in Table 10, which come from the HLFs, show that only 42% of the 10,412 rural households listed for our survey received TIP packs. It is evident, therefore, that the 2000-01 TIP campaign missed the target by 10%.
3 Profile of Poverty in Malawi, 1998: Poverty Analysis of the Malawi Integrated Household Survey, 1997-98. National Economic Council, November 2000.
14

Table 10: Proportion of households receiving TIP Region
Total No. of households in the sample
Total No. of households
that received TIP
% of households that received TIP
North Centre South
2443 3301 4668
997 1243 2234
40.8 37.7 47.9
Total 10,412 4474 42.1 Looking at the data across regions, the south registered a higher percentage rate (48%) of households that received TIP packs than the north (41%) or the centre (38%).
Poverty targeting Our study used a poverty index based on assets and reported income (see Poverty categories section in Methodology). Five levels of poverty were delineated. Table 11: Poverty profiles of TIP recipients and non-recipients TIP recipients Non-recipients Poverty Category % % Category 1 : Poorest Category 2 : Category 3 : Category 4 : Category 5 : Least Poor
29.2 18.3 17.1 14.0 21.4
26.4 13.6 18.9 16.6 24.5
Total No. of responses
100.0 1441
100.0 1566
Poverty categories 1 to 3 represent the poorest segment of the sample of respondents, with few or no assets. As the data in Table 10 show, of those who did not receive a pack, 59% are in the poorest three categories. On the other hand, of those who did receive a pack, 35% are in the least poor two categories (P4 to P5). What the data is showing is that the TIP campaign did not succeed in targeting the poorest categories. As Table 11 shows, the poverty profiles of recipients and non-recipients are very similar, with both the poorest and the least poor being TIP recipients and a substantial number of the poorest being non-recipients. This result coincides with the findings from the Monitoring Component.
Timing of distribution In this section, data on the timing of the distribution of TIP inputs, the perception of respondents on the timing of distribution of TIP inputs, and data on the distance to TIP inputs collection points is presented and discussed.
15

Table 12: Start of the rains and TIP distribution Received
TIP 2000/01
Start of rains 2000
Normal start of the rains
When would you like
to receive inputs Month % % % % August - 0.1 0.1 5.3 September - 0.3 0.3 17.6 October - 30.8 18.6 64.5 November 10.5 59.4 41.9 11.0 December 40.1 8.2 36.6 1.6 January 42.8 1.2 3.2 0.1 February 6.5 - - - March 0.1 - - - No of responses 1428 3018 3030 1429 A normal rainy season in Malawi begins with the start of rains in October in the southern region and then the rain belt moves up to the central region in late October to early November, and later to the northern region from mid-November to early December. In the 2000-01 agricultural season, the start of the rains was slightly early, with most areas receiving the first rains between October and December. TIP input distribution in 2000-01 began in November – mostly in the centre (4%) and the south (13%) – picked up in December and January 2001 and tailed off in February and March. Evidently, the 2000-01 TIP distribution was done 2 months late and this greatly reduced the impact of TIP on maize production. Column 5 of Table 12 shows that 82% of the farmers would prefer to receive inputs in September or October, which is a month before the start of a normal rainy season. This is the right time to distribute inputs to farmers as it would allow them sufficient time to plan for the season and prepare their gardens in time for planting. Table 13 provides data on farmers’ perceptions of the timing of TIP inputs distribution in the 2000-01 agricultural season. Table 13: Farmer's perception of the timing of TIP distribution
North Centre South % % % Timely 5.4 12.6 2.6 Late but planted 82.0 59.8 60.2 Too late to plant 10.8 23.0 30.8 Missing data 1.9 4.5 6.4 No. of responses 316 443 683
These results emphasize the findings above that distribution of TIP inputs was done late. A big proportion of respondents in the north (82%), the centre (60%) and the south (60%) indicated that distribution of TIP inputs was done late but they decided to plant anyway. Eleven percent (11%) of the respondents in the north, 23% in the centre and 31% in the south did not bother to plant the seeds because it was too late in the season.
16

Cases of non-receipt of TIP packs One of the most frequent observations made by the consultants when they visited villages during the survey was that TIP disrupted the social fabric in the rural areas. Most rural households did not understand that TIP was designed to target certain individuals in the community by virtue of their poverty status, households caring for orphans, old people or physically disabled people. They interpreted targeting as favouritism on the part of chiefs and local leaders. A total of 10 villages out of the 108 villages visited did not receive TIP packs either because they refused to receive the packs or because they were missing from the register.
Villages refusing to receive TIP
Out of the 108 villages visited, four villages completely refused to receive TIP. Two villages in Mzimba and one village each in Salima and Dedza refused to receive TIP packs because of the targeted nature of TIP. In Aaron Hara village in Mzimba, the Village Headman returned all coupons because the majority of his subjects threatened never to participate in village development work if they did not receive TIP packs. In Ajibu village in Dedza, all the villagers including their chief agreed not to receive TIP packs because they did not want to see anyone discriminated against. This was the same reason for refusal of TIP packs in the other two villages.
Villages not registered
In other cases, people did not receive TIP packs because the whole village was not registered. A total of six villages out of 108 villages sampled were not registered. These villages are: Kuchingoli village in Dedza; Aeroni village in Nkhotakota, Sitima village in Nkhotakota; Antonia village in Mchinji; Akumwinje village in Balaka and Nkalapa village in Machinga.
Distance to collection point The data shows that the average distance to the TIP pack collection points was 5.25 km with a standard deviation of 4.97. The minimum distance to a collection point was less than a kilometre and the maximum distance was 26 km. People from three out of the 108 villages had to walk 26 km to collect their TIP packs.
Contents of TIP packs In this section, we present information on the contents of TIP packs, i.e. whether the inputs were inside the pack or not; whether the packs were complete or had missing items; the condition of the inputs and the quality of the contents.
17

Were the inputs inside the pack? Table 14: Inputs found inside the TIP pack
Were inputs included in the TIP pack? YES (%) Maize 98.4 Legumes 86.3 Basal fertiliser 97.6 Top dressing fertiliser 97.5
In 98% of the instances, the maize and basal fertiliser were included in the packs. Top dressing fertiliser was included in the TIP packs in 97% of cases, whereas legumes bags were found inside the TIP pack in only 86% of cases.
Number of bags inside the TIP packs Table 15: Number of bags inside the TIP packs
% Three items missing 1.2 Two items missing 1.5 One item missing 13.3 Complete bag 82.0 At least one item duplicated 2.1 Total 100.0 No. of responses 1452
Some 82% of the TIP packs contained a complete set of the 4 items of inputs, i.e. maize, legumes, basal fertiliser and top dressing fertiliser bags. Thirteen percent (13%) of the TIP packs had one of the items missing; 2% of the packs had at least one item duplicated; and 3% had two or three items missing.
Condition of the TIP pack inputs Table 16: Condition of the TIP pack inputs Sealed Open but
OK Open with missing or damaged item
No. of responses
% % % Maize 80.8 15.6 3.6 1426 Legume 82.6 13.7 3.7 1157 Basal Fertiliser 80.8 14.5 4.8 1412 Top dressing Fertiliser 80.6 14.7 4.7 1408 About 4% each of the maize and legume bags were opened before they reached the recipient and the contents were either missing or in damaged condition. Five percent each of the basal and top dressing fertiliser bags were opened before reaching the recipient and the contents were either missing or in damaged condition. The rest of the bags were either sealed or open but the condition of the contents was OK.
18

Quality of the TIP pack inputs Table 17: Perceived quality of TIP pack inputs Good Poor Unusable % % % No. of responses Maize 95.4 4.4 0.3 1426 Legume 95.1 3.9 1.0 1177 Basal fertiliser 95.0 4.5 0.5 1410 Top dressing fertiliser 95.4 4.2 0.4 1407 The respondents rated the quality of the inputs as generally good. Only 4-5% of the respondents rated the maize, legume, basal fertiliser or top dressing fertiliser inputs poor or unusable.
Use of the TIP pack inputs In the following section, we provide data on the questions posed to TIP recipients to find out how the respondents used the TIP inputs.
Use of TIP maize seed Table 18: Use of TIP maize seed
% Planted all of it 65.0 Planted some of it 7.4 Ate it 2.1 Exchanged for food 0.5 Sold it 1.2 Stored it 0.1 Gave it away 23.3 Didn’t receive 0.7 No. of responses 1453
Seventy two percent (72%) of the respondents indicated that they either planted all of the maize seed (65%) or some of it (7%). Twenty three percent (23%) indicated that they gave the seed away. The rest of the respondents either ate the seed (2%), exchanged for food (0.5%) sold the seed (1%), stored the seed (0.1%) or did not receive the maize seed (0.7%). Table 19: How TIP maize seed was planted
%* Planted it together in one plot 87.6 Spread it out over a large area 6.2 Used to fill gaps 5.3 Not applicable i.e. did not plant 0.7 No. of responses 1053
*These % are calculated out of the number of farmers who planted all or some of the maize seed. Most of the TIP recipients (88%) planted the maize seed together in one plot. A few of them spread it out over a large area (6%) or used the maize seed to fill gaps (5%).
19

Table 20: Why maize seed was not planted or only some was planted %* Seed received too late in the season 77.6 No land left available for planting 10.2 Seed of poor quality 2.4 Did not like the variety 0.0 No. of responses 508
*These % are calculated excluding any farmers who planted all the maize seed. Of those respondents who did not plant the maize seed or planted only some of it, 78% indicated that they did so because the seed was received too late in the season to plant. Ten percent (10%) said they had no land left available for planting, while 2% indicated that the seed was of poor quality. Table 21: Contribution of TIP maize seed to the household maize seed
% All of it 12.2 More than half 7.8 Equal amounts 6.7 Around one quarter 12.4 Very little 38.7 None (did not plant) 20.6 Missing data 1.7 No. of responses 1429
Only 12% of the respondents indicated that TIP maize seed was all the seed they had in their households. This small group of respondents relied wholly on TIP maize seed. However, for 27% of households, TIP maize seed represented half or more of their total seed and another 12% said TIP’s contribution to the household maize seed was about one quarter. These findings show that the amount of TIP maize seed is not large compared to the total maize seed planted. However, TIP maize seed is an important source of seed in so far as it brings fresh vigorous seed to the household.
Use of TIP legume seed In this section, we explore (a) what the respondents used the legume seed for, (b) how the legumes were planted, (c) why some respondents did not plant the legume seeds or just planted some of it, and (d) the contribution of TIP legume seed in the household. Table 22 shows that only 35% of respondents planted all the legume seeds they received, while 8% planted some of the seed. A fairly large proportion of respondents (32%) ate the legume seed and another 18% gave the seed away.
20

Table 22: Use of legume seed % Planted all of it 35.1 Planted some of it 8.0 Ate it 31.8 Exchanged for food 0.3 Sold it 4.7 Stored it 0.6 Gave it away 18.4 Did not receive 0.6 No. of responses 1254
Note: This table includes only those respondents who received legume seed. Table 23: How legume seeds were planted
Yes (%)
No (%)
No reply recorded (%)
Number of respondents
Did you plant the legume seeds in one plot 58.4 33.6 8.0 464 Did you intercrop the maize and legume 38.2 53.2 8.6 464 Note: This table includes only those farmers who planted all the legume seeds. . The two questions posed in Table 23 are, in fact, one and the same question, i.e. by implication, farmers can either plant in one plot or they intercrop. The data shows that respondents who planted the legumes in one plot were in the range of 53% - 58%, whereas respondents who intercrop the legumes were in the range of 34% - 38%. The rest of the respondents did not provide replies to the questions. Table 24 presents information on why legume seeds were not planted or farmers only planted some of them. Farmers that planted all the seeds were excluded from this analysis. Table 24: Why legume seeds were not planted or only some were planted
% Seed received too late 55.6 No land left available for planting 7.5 Seed of poor quality 3.1 Did not like the variety 2.1 Total *68.3 No. of respondents 988
* Possible reasons for not planting were not exhausted. Of the respondents who did not plant the legume seed or planted only some of it, 56% did so because the seed was received too late, and 7% because they had no land left available for planting. During the SP2 scheme, only 25% of respondents did not plant legumes due to late receipt of the input. Table 25 presents data on the contribution of TIP legume seed to the household legume seed this season. All responses from farmers who received legume seed were included in the data analysis.
21

Table 25: Contribution of TIP legume seed to the household legume seed
% All of it 26.2 More than half 2.2 Equal amounts 2.2 Around one quarter 3.8 Very little 13.7 None (Did not plant) 44.8 Missing data 7.1 Total 100.0 No. of respondents 1254
Most of the respondents said TIP legume seed contributed very little or nothing at all to the legume seed in the household. However, 26% of respondents said that TIP legume seed was all the seed the household had for planting. This is the group of respondents who valued TIP legume seed most. TIP legume seed represented a much bigger proportion of total seed planted – for those who planted – than TIP maize seed.
Use of TIP fertilisers In this section, we provide information on the use of TIP fertiliser, and information on other fertiliser-related questions that we posed. Table 26 presents data on the use of basal and top dressing fertiliser. The analysis only includes those farmers who received either the basal or top dressing fertiliser. Table 26: Use of TIP fertiliser
Basal Top dressing % % Applied to TIP maize 61.4 60.9 Applied to rest of the maize field 30.4 30.8 Applied it on other crops 2.8 2.5 Gave it away 0.7 0.7 Sold it 2.6 3.5 Stored it 4.4 4.4 It was stolen 0.2 0.2 No. of responses 1423 1415
*Percentages add up to more than 100% because multiple responses were allowed. Sixty-one percent (61%) of respondents said that they applied the basal and the top dressing fertiliser to their TIP maize. Around 30% of respondents applied the basal and the top dressing fertiliser to the rest of their maize fields. Only 3% admitted to using the fertiliser on other crops, and a similar percentage admitted to selling it. An important observation to make is that even when TIP inputs are distributed late, as happened under the TIP 2000-01 campaign, most of the farmers still make use of the fertiliser received.
22

Table 27 presents the reasons why some of the respondents did not apply the TIP fertiliser. Table 27: Reasons for not applying TIP fertiliser
% My land does not need fertiliser 23.6 I only use organic fertiliser 4.3 I needed money, so I sold it 5.6 It came too late to use 35.7 No. of respondents 98
The main reason for not applying the TIP fertiliser was that it came too late to use (36% of the 98 respondents who said that they did not apply the fertiliser). The second most important reason was that the respondent’s land does not need fertiliser (24%). These were all respondents from Chikwawa and Nsanje districts. Table 28: How TIP fertiliser was applied to maize
% Basal separately 44.9 Top dressing separately 44.8 Basal and top mixed 53.3 No. of respondents 860
Note: only respondents who applied basal and top dressing fertiliser to maize are included. About 45% of the respondents applied basal and top dressing fertiliser to maize separately, as is recommended. Fifty-three percent (53%) of respondents mixed the basal and top dressing fertiliser before applying it to their maize. Table 29 presents data on application time for the basal fertiliser. Table 29: Time when basal fertiliser was applied
% During planting 10.5 After 1 week but before 2 weeks after planting 70.3 Three to four weeks after planting 14.3 Missing data 4.9 Total 100.0 Number of respondents 468
About 70% of respondents applied the basal fertiliser after a week but before two weeks from planting. This is the recommended time for basal fertiliser application. Some 10% of respondents applied the basal fertiliser at planting, while 14% applied the basal fertiliser three to four weeks after planting. Table 30 presents data on the application time for top dressing fertiliser.
23

Table 30: Application time for top dressing fertiliser % During planting 0.4 After germination, before two weeks after planting 12.7 Three weeks after planting 45.5 Four weeks to tasseling 38.3 Missing 3.2 Total 100.0 Number of respondents 473
About 45% of the respondents applied the top dressing fertiliser three weeks after planting. This is the period which is within the recommended time for top dressing a maize crop. Another 38% of the respondents applied the top dressing fertiliser between four weeks and tasseling. Table 31: Application time for mixed (basal + top dressing) fertiliser
% Within a week from planting 2.8 From germination to four weeks after planting 33.0 After first weeding but before tasseling 49.9 After tasseling 11.2 Missing 3.1 n 787
Fifty percent (50%) of the respondents that mixed the fertiliser applied it after first weeding but before tasseling. This time of application was fairly late in the cropping season and the maize crop may not have fully benefited from the fertiliser. Some 33% of those who applied mixed fertiliser did so between germination and four weeks after planting (including weeding). This was the correct time of application, and the maize crops may have used the fertiliser to the fullest advantage. Table 32: Contribution of TIP fertiliser to household fertiliser
% All of it 72.4 More than half 2.1 Equal amounts 2.9 Around one quarter 5.6 Very little 16.1 None 1.0 Total 100.0 No. of respondents 1226
Seventy-two percent (72%) of the respondents indicated that the TIP fertiliser was all the fertiliser the household had. This underscores the importance of TIP fertiliser to farmers. Farmers are aware that poor soil fertility is a major impediment for them to ensure their food security, yet this input remains unaffordable to many of the rural farmers. Therefore, they value TIP fertiliser greatly. A small proportion of respondents (16%) indicated that TIP fertiliser contributed very little to household fertiliser. It is our view that this group of respondents may have
24
been expressing the opinion that the quantity of TIP fertiliser was very little; too little to satisfy their fertiliser requirement in the household. Also, some of the respondents may be wealthier farmers who are able to buy fertiliser.
Other inputs used by TIP recipients The purpose of this section is to compare TIP as a source of inputs with other sources of inputs use by TIP recipient farmers in 2000-01.
Non-TIP maize seed
Type of seed bought
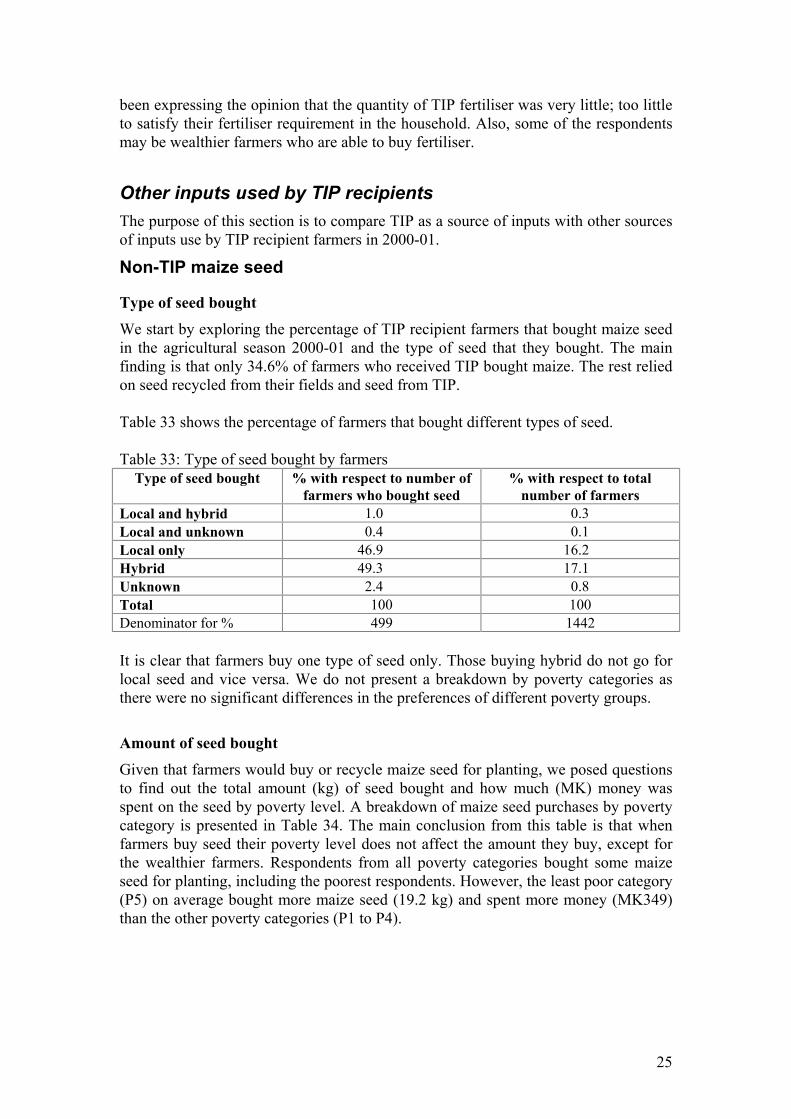
We start by exploring the percentage of TIP recipient farmers that bought maize seed in the agricultural season 2000-01 and the type of seed that they bought. The main finding is that only 34.6% of farmers who received TIP bought maize. The rest relied on seed recycled from their fields and seed from TIP. Table 33 shows the percentage of farmers that bought different types of seed. Table 33: Type of seed bought by farmers
Type of seed bought % with respect to number of farmers who bought seed
% with respect to total number of farmers
Local and hybrid 1.0 0.3 Local and unknown 0.4 0.1 Local only 46.9 16.2 Hybrid 49.3 17.1 Unknown 2.4 0.8 Total 100 100 Denominator for % 499 1442 It is clear that farmers buy one type of seed only. Those buying hybrid do not go for local seed and vice versa. We do not present a breakdown by poverty categories as there were no significant differences in the preferences of different poverty groups.
Amount of seed bought
Given that farmers would buy or recycle maize seed for planting, we posed questions to find out the total amount (kg) of seed bought and how much (MK) money was spent on the seed by poverty level. A breakdown of maize seed purchases by poverty category is presented in Table 34. The main conclusion from this table is that when farmers buy seed their poverty level does not affect the amount they buy, except for the wealthier farmers. Respondents from all poverty categories bought some maize seed for planting, including the poorest respondents. However, the least poor category (P5) on average bought more maize seed (19.2 kg) and spent more money (MK349) than the other poverty categories (P1 to P4).
25

Table 34: Total amount of seed bought and total amount of money spent on seed by poverty level
Farmer bought seed Amount of seed bought (kg)
Amount spent on seed (MK)
Poverty level Frequency %* Mean Std Dev. Mean Std Dev. P1 (Poorest) 145 34.5 13.8 13.5 159 518 P2 83 31.4 15.5 11.1 150 155 P3 83 33.7 14.2 10.9 149 152 P4 75 37.1 13.4 10.2 163 211 P5 (Least poor) 113 36.5 19.2 20.8 349 741 * Percentage with respect to the whole sample of TIP recipients. We also looked at the total amount of maize seed bought and the total amount of money spent on seed, by sex of the respondent. These data are presented in Table 35. Table 35: Total amount of seed bought and total amount of money spent on seed by sex of respondent
Farmer bought seed Amount of seed bought (kg)
Amount spent on seed (MK)
Sex of head of household
Frequency %* Mean Std Dev. Mean Std Dev.
Male 323 35.8 15.2 13.5 216 472 Female 170 32.2 15.5 16.4 173 477 * Percentage with respect to the whole sample of TIP recipients. There is no difference between male and female respondents in the total amount of seed bought. However it seems that male respondents are paying more for the seed. Further analysis by type of seed bought shows that male respondents reported higher average prices for local and hybrid seed. Our study did not collect information that could explain this difference. Table 36: Breakdown of local and hybrid maize seed bought by poverty level Poverty categories
Local maize seed bought Hybrid maize seed bought
No. of farmers
%* Mean (kg)
Std Dev. No. of farmers
%* Mean (kg)
Std Dev.
P1 71 16.9 15.3 17.4 71 16.9 12.2 8.2 P2 41 15.5 14.5 7.0 42 15.9 16.5 14.1 P3 39 15.8 17.3 12.2 42 17.1 11.0 8.9 P4 42 20.8 13.4 10.0 33 16.3 13.0 9.7 P5 48 15.5 24.2 21.9 63 20.3 15.5 19.6 * Percentage with respect to the whole sample of TIP recipients. Table 36 shows that the percentage of farmers buying seed (either local or hybrid) is between 15% and 20% for all poverty categories, without important differences between categories. The average volume of seed bought does not show a strong association with poverty categories either, except for the wealthiest farmers (P5).
26

Table 37: Breakdown of local and hybrid maize seed bought by sex of the respondent
Local maize seed bought Hybrid maize seed bought No of
farmers %* Mean
(kg) Std. Dev. No of
farmers %* Mean
(kg) Std Dev.
Male 158 17.5 17.3 15.6 164 18.2 12.9 10.7 Female 79 15.0 16.3 16.3 86 16.3 14.9 17.0 * Percentage with respect to the whole sample of TIP recipients. The main conclusion from Table 37 is that there are no differences in the type of seed bought by male and female respondents.
Fertiliser We needed to know how many respondents had only TIP fertiliser, and how many respondents had TIP fertiliser plus other fertiliser. For those who had other fertiliser, we also wanted to know the source of finance for this other fertiliser. The information is presented in Tables 38 and 39. Table 38: Sources of fertiliser in 2000-01
% Only TIP fertiliser 72.5 TIP plus other source 27.5 No. of respondents 1227
About 73% of respondents had no other source of fertiliser except TIP. This large group of respondents relied solely on TIP fertiliser for their maize crop. Only 28% of the respondents had other sources of fertiliser. Table 39: Sources of finance for non-TIP fertiliser
% with respect to farmers
that bought fertiliser % with respect to total
number of farmers
Basal Top
dressing
Basal Top
dressing % % % %
Credit 15.1 19.8 3.5 4.6 Cash 46.7 65.4 11.0 15.3 Gifts 5.0 5.6 1.2 1.3 Bought from TIP recipient 7.1 7.1 1.7 1.7 Stored from SP2 1.2 1.5 0.3 0.3 Other sources 1.5 1.5 0.3 0.3
* Percentages do not add to 100% because a farmer reporting having bought fertiliser might have bought basal fertiliser or top dressing or both. The main source of finance for fertiliser is farmers’ own cash, followed by credit. However, a maximum of 15.3% of all farmers bought fertiliser for cash and less than 5% used credit facilities. Other sources of finance are negligible.
27

Table 40: Amount of fertiliser bought with cash or credit Basal Top dressing Amount (kg) Credit (%) Cash (%) Credit (%) Cash (%) 1 to 5 17.6 20.9 14.9 15.8 5 to 20 17.6 17.7 11.9 14.5 20 to 50 49.0 44.9 64.2 48.4 Over 50 kg 15.7 16.5 9.0 21.3
Between 45% and 65% of purchases of fertiliser by TIP recipients were for amounts ranging between 20 and 50 kg. The proportion of purchases of more than 50 kg of fertiliser was at best 21%. Up to 38% were for amounts lower than 20 kg. Tables 38 and 40 demonstrate that the proportion of farmers who bought fertiliser is small (27%) and also that amounts purchased are small. When farmers bought fertiliser, less than one-fifth bought more than 50 kg.
TIP leaflet and agricultural extension The Module 1 study collected data about receipt of the agricultural communications messages and HIV/AIDS messages by TIP recipients. This information was designed to complement that collected by Module 3 of the 2000-01 TIP Evaluation, which looked in greater detail at agricultural communications messages and HIV/AIDS messages4. Out of 1451 respondents, 73% received the TIP leaflet which was enclosed in the TIP pack; 89% of those who received the TIP leaflet, received it in good condition. These findings indicate that we can be confident that 65% of the respondents received a readable leaflet with instructions about how to use the inputs. Table 41 presents information on the percentage of respondents who followed maize planting instructions contained in the TIP leaflet. Only those farmers who received the TIP leaflet in good condition (956 respondents) were included in the analysis. Table 41: Frequency and % of respondents who followed maize planting instructions
Yes No No reply % % % Maize ridges 85cm apart 55.4 38.8 5.8 Planting station 25cm apart 53.1 40.7 6.2 One plant per planting station 49.7 44.1 6.2
Out of 956 respondents, 55% said that they made ridges at 75cm apart, while 38% of the respondents said that they did not follow the instruction of making ridges at 75cm apart. For planting station instructions, only 53% of respondents claimed to have followed instructions of planting maize 25cm apart along the ridge. Fifty percent (50%) of respondents claimed to have followed the instruction of planting one maize seed per station.
4 Christopher Dzimadzi, Blessings Chinsinga; Regson Chaweza and Patrick Kambewa: TIP 2000-01 Evaluation Module 3: Agricultural Communications, July 2001.
28
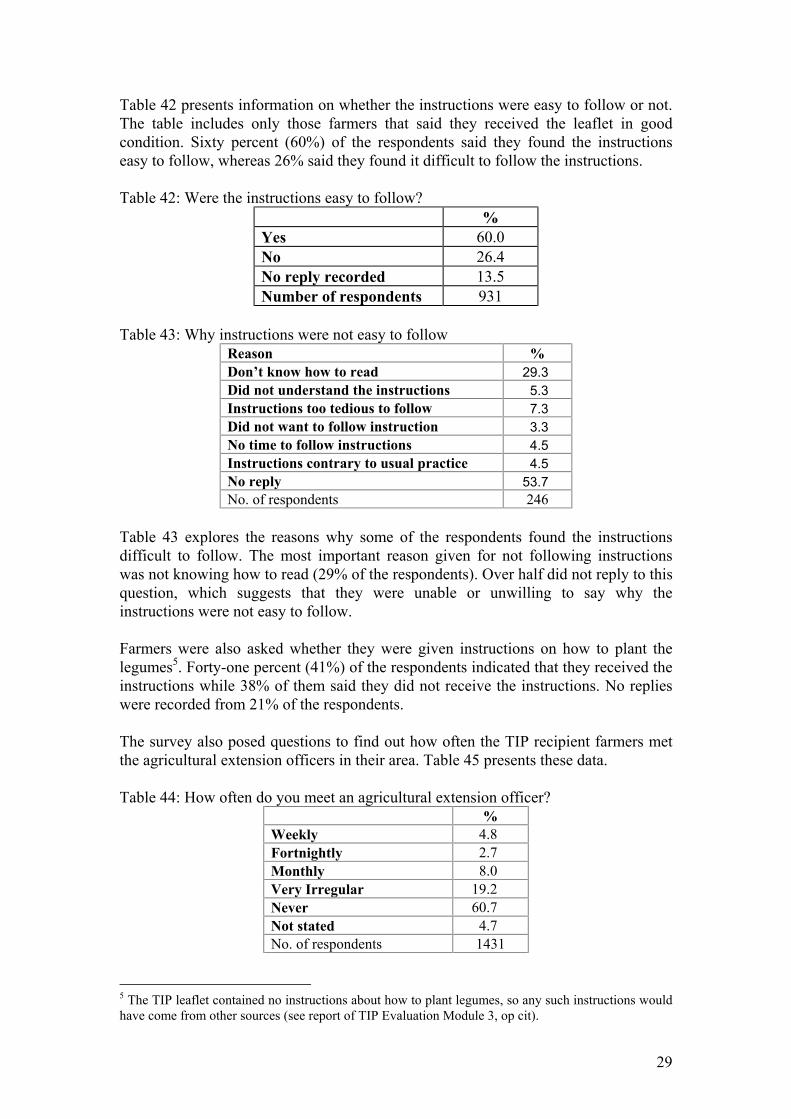
Table 42 presents information on whether the instructions were easy to follow or not. The table includes only those farmers that said they received the leaflet in good condition. Sixty percent (60%) of the respondents said they found the instructions easy to follow, whereas 26% said they found it difficult to follow the instructions. Table 42: Were the instructions easy to follow?
% Yes 60.0 No 26.4 No reply recorded 13.5 Number of respondents 931
Table 43: Why instructions were not easy to follow
Reason % Don’t know how to read 29.3 Did not understand the instructions 5.3 Instructions too tedious to follow 7.3 Did not want to follow instruction 3.3 No time to follow instructions 4.5 Instructions contrary to usual practice 4.5 No reply 53.7 No. of respondents 246
Table 43 explores the reasons why some of the respondents found the instructions difficult to follow. The most important reason given for not following instructions was not knowing how to read (29% of the respondents). Over half did not reply to this question, which suggests that they were unable or unwilling to say why the instructions were not easy to follow. Farmers were also asked whether they were given instructions on how to plant the legumes5. Forty-one percent (41%) of the respondents indicated that they received the instructions while 38% of them said they did not receive the instructions. No replies were recorded from 21% of the respondents. The survey also posed questions to find out how often the TIP recipient farmers met the agricultural extension officers in their area. Table 45 presents these data. Table 44: How often do you meet an agricultural extension officer?
% Weekly 4.8 Fortnightly 2.7 Monthly 8.0 Very Irregular 19.2 Never 60.7 Not stated 4.7 No. of respondents 1431
5 The TIP leaflet contained no instructions about how to plant legumes, so any such instructions would have come from other sources (see report of TIP Evaluation Module 3, op cit).
29

Sixty-one percent (61%) of the respondents have never met an agricultural extension worker. This is certainly a worrisome state of affairs, and it reflects the shortage of extension workers in rural areas which has come about by the high rate of attrition.
OPV maize Unlike the SP1 and SP2 schemes which distributed seed of maize hybrids, the TIP 2000-01 programme distributed open pollinated varieties of maize (OPVs). The survey included a question to find out whether the farmer realized that the maize seed given out was different from last season’s seed. If the answer to this question was yes, five structured answers were provided to enable us determine how the farmer know that the seed was different. Finally, we asked whether the farmer realized that the seed for this season could be recycled without loss of yield potential. If the farmer provided a negative response to either the first or last question, the enumerator was requested to provide factual information about OPV to the farmer. Table 45: Farmer’s awareness of OPVs Number of
respondents % replying
“yes” 1. Do you realize that maize seed given out is different? 1429 69.8 2. Do you realize that maize seed given out can be recycled? 1166 58.5 Table 46: How did you know that maize seed was different?
% Flintness 71.9 From leaflet 12.8 From radio 6.5 From Field Assistant 4.9 Other sources 3.9 Number of responses 1215
Seventy percent (70%) of the 1429 respondents had realized that the maize seed was different from the seed issued under the SP1 and SP2 schemes. Most knew that the maize seed was different from the flint texture of the grain, as hybrids normally are of dent texture. Very few farmers got the information from the leaflet (13%), the radio (7%), the Field Assistant (5%) or from other sources (4%). Fifty-eight percent (58%) of the 1166 respondents knew that the maize seed they received could be recycled without loss of yield potential. However, it is not clear whether this was because they knew about OPV maize or whether it was because the appearance of the seed was similar to local varieties which are recycled.
30

HIV/AIDS As the TIP pack contained a leaflet on HIV/AIDS, the survey asked the following questions:
1. Whether the farmer received a leaflet on HIV/AIDS along with the TIP pack. 2. Whether the farmer thought it was a good idea to include information on
HIV/AIDS in the pack. Table 47: Farmers’ responses to HIV/AIDS questions Number of
respondents % replying
“yes” Did you receive a leaflet on HIV/AIDS? 1435 49.1 Do you think it is good idea to include information? 1176* 78.7
* Only replies from the Chichewa version of the IQ, as the Tumbuka version missed out this question. Half of the respondents received the leaflet on HIV/AIDS along with the TIP pack, and over three-quarters (among those who replied to the Chichewa version of the IQ) indicated that it was a good idea to include information on HIV/AIDS in the pack. This shows that the rural households are keen to obtain more information on the HIV/AIDS pandemic.
Food production It is well known in Malawi that there are districts and pockets within districts that do not rely on maize only as their staple food. This survey, therefore, sought to find out the types of staple foods used by the households sampled. Multiple responses were allowed for this question in order to provide the opportunity to households to name types of staple foods they consume other than maize (see Table 48). The main staple food consumed by the majority of households in the sample is maize. Cassava is the second most important staple (10.4%) followed by rice (7.1%) and sorghum (7.1%).
• Cassava is an important staple in Nkhotakota, Nkhata Bay, Mulanje, Chitipa, Karonga, Likoma and Chiradzulu.
• Rice is an important staple in Karonga, Nsanje, Phalombe, Machinga and
Mangochi.
• Sorghum is an important staple in Nsanje, Mulanje and Chikwawa.
• Banana is an important staple in Chitipa, Thyolo and Mwanza. Table 48 also shows that there are some districts which rely solely on maize (Mzimba, Mchinji, Ntchisi and Salima), or predominantly on maize (Rumphi, Dedza, Dowa, Kasungu, Lilongwe, Ntcheu, Balaka and Zomba).
31

Table 48: Staple food by district Maize
% Rice %
Millet %
Cassava %
Sorghum %
Banana %
Total Respondents
Chitipa 98 1 2 22 1 36 120 Karonga 58 45 0 21 0 0 120 Mzimba 100 0 0 0 0 0 90 Nkhata Bay 76 0 2 69 0 2 121 Rumphi 100 0 0 1 0 0 110 Dedza 100 0 0 2 1 0 90 Dowa 100 0 1 0 0 0 108 Kasungu 100 0 0 4 0 2 116 Lilongwe 100 0 0 3 0 1 119 Mchinji 100 0 0 0 0 0 102 Nkhotakota 75 2 0 86 0 0 88 Ntcheu 100 0 0 1 1 0 119 Ntchisi 100 0 0 0 0 0 108 Salima 100 0 0 0 0 0 85 Balaka 100 0 0 1 0 1 106 Blantyre 99 3 0 4 0 2 122 Chikwawa 99 3 25 0 41 3 119 Chiradzulu 100 1 0 17 3 0 118 Machinga 100 30 1 0 1 0 105 Mangochi 100 23 0 0 0 0 120 Mulanje 98 9 1 24 44 0 105 Mwanza 100 0 1 7 0 11 115 Nsanje 93 37 87 0 90 2 120 Phalombe 99 33 0 0 3 0 117 Thyolo 100 0 0 8 1 22 121 Zomba 100 1 0 2 0 0 117 Likoma 100 0 0 17 0 0 119 Total 96.1 7.1 4.7 10.4 7.1 3.2 3010
Crop production in 1999-2000 cropping season
Maize production
Table 49 presents data on maize production for 1999-2000 for SP2 recipients and non-recipients. Table 49: Maize production in 1999-2000 by receipt of SP2
SP2 recipients Non-recipients
Production 50-kg bags
Production 50-kg bags
Mean 9.0 7.6 Std Dev. 7.8 7.6 Number of farmers 1447 989
SP2 recipients produced 9.0 50-kg bags on average, while non-recipients of SP2 produced 7.6 bags of maize of 50 kg. The contribution of SP2 to the household maize
32

production on the basis of the comparison of recipients and non-recipients is therefore estimated to be 1.4 50-kg bags. Another route to estimating the contribution of SP2 to the maize produced at the household level is to ask the farmer for his own perception of this contribution. Recipients of SP2 perceive that the free inputs programme contributed an average of 2.7 50-kg bags of maize to the household. This contrasts with farmer’s forecast of the contribution of SP2 to their production during last year’s Module 1 survey (before the 1999-2000 harvest), which was an average of 3.5 50-kg bags6. Thus, on average it can be said that SP2 contributed between 15% and 30% of the maize produced by those smallholder farmers that received the free inputs. The contribution is estimated at 1.4 bags (15%) by comparison with the control group or 2.7 bags (30%) according to farmers’ perceptions. Table 50 presents data on food security for SP2 recipients and non-recipients. The period referred to is from the maize harvest in 2000 up to the time of our survey in March-April 2001. Table 50: Food secure and food insecure people by receipt of SP2
SP2 (%)
Non-SP2 (%)
Food secure 32.8 33.8 Food insecure 67.2 66.2 No. of respondents 1615 1114
One-third of our sample was found to be food secure and two-thirds were found to be food insecure7, as shown in Table 50. There is no difference in the percentages of SP2 recipients and non-recipients that were food insecure. This shows that even those who received SP2 needed to adopt coping strategies at some time between the SP2 harvest in 2000 and the next harvest in 2001. Although the amount of maize produced by SP2 recipients was larger than the amount produced by non-recipients, this additional maize was not sufficient to last through the whole of the lean period since around two-thirds of smallholder farmers in Malawi are starting from a basis of low production and extreme poverty.
6 National Statistical Office, Government of Malawi (2000), Report of Starter Pack 1999-2000 agronomic survey (Module 1 of the 1999-2000 Starter Pack Evaluation). 7 See definition of food security in Measurement of Food Security section in Methodology.
33

Table 51: Maize production in 1999-2000 by poverty category, receipt of SP2 and food security status of the households
Food Secure Food Insecure
SP2
recipient SP2
non-recipient SP2
recipient SP2
non-recipient Poverty category
Maize production (50-kg bags)
Maize production (50-kg bags)
Maize production (50-kg bags)
Maize production (50-kg bags)
P1 9.0 6.2 6.4 5.4 P2 10.5 8.7 7.6 5.7 P3 11.8 8.8 7.6 6.6 P4 10.1 8.0 9.2 7.7 P5 14.0 13.1 9.3 8.7
Table 51 shows that there is a clear increasing trend in maize production from the poorest category (P1) to the least poor (P5). It also shows that for the group of food secure households, SP2 appears to have made a bigger impact on food production than for the group of food insecure households, especially in the lower poverty categories. The data show that in the food secure group, SP2 recipients in P1-P4 produced between two and three bags more than non-recipients; whereas in the food insecure group, SP2 recipients in P1-P4 only produced one to two bags more than non-recipients in the same poverty categories. This may be because the food insecure group tends to produce less food whether or not they receive SP2 owing to constraints such as land and labour shortages. The food secure group probably has better conditions to take full advantage of the free inputs.
Legume production
Out of 3030 respondents, about 34% of them produced legumes in 1999-2000 while 66% of them did not. Out of the same group of 3030 respondents, 20% of them produced legumes in 2000-01 while 80% of them did not. Table 52 presents data on legume production in 1999-2000, disaggregated by receipt of SP2 inputs. Table 52: Legume production in 1999-2000 disaggregated by receipt of SP2 inputs
SP2 recipients SP2 non-recipients Production
50-kg bags Production 50-kg bags
Mean 2.5 2.8 Standard deviation 2.6 2.3 No. of farmers 550 256
In the 1999-2000 season, the SP2 recipients produced on average 2.5 50-kg bags of legumes, as compared with non-recipients who produced 2.8 50-kg bags. It can be said that in 1999-2000 season, the Starter Pack inputs had little or no influence on mean legume production of those who produced legumes. However, among farmers who received SP2, 37% produced legumes while only 24% of non-recipients produced legumes. The effect of Starter Pack on legume production is reflected on the
34

increase of the proportion of farmers growing these crops, rather than the average production at household level. Farmers’ perception of the contribution of SP2 to the legume production (2.4 50-kg bags) almost coincides with their total legume production. This could be interpreted as a substitution effect for some farmers – those who planted the SP2 legumes but would have planted legumes even without SP2. However, there were 13% more farmers producing legumes among SP2 recipients compared with non-recipients, suggesting an addition to total production.
Production forecasts for 2000-01
Maize production
Comparison of TIP recipients and non-recipients
In this section, we present data on production forecasts for the 2000-01 maize harvest with or without TIP inputs. The data are based on farmers’ perceptions. Table 53 presents data on the expected maize production in 2000-01 harvest for both the TIP recipients and non-TIP recipients. Table 53: Expected maize production in 2000-01
TIP recipient TIP non-recipient Production
50-kg bags Production 50-kg bags
Mean 5.2 4.7 Standard deviation 6.1 6.3 No. of respondents 1239 1474
The average expected maize production per farmer who received TIP inputs is 5.2 50-kg bags in the 2000-01 season as compared with an average production figure of 9.0 bags for SP2 recipients in 1999-2000 season (see Table 49). For non-recipients of TIP, the average expected maize production figure is 4.7 50-kg bags, compared with 7.4 50-kg bags produced in 1999-2000. These results show the sharp decline in maize production this year, which farmers attribute mainly to two factors: too much rain or flooding and the late delivery of TIP. On the basis of the comparison between TIP recipients and non-recipients (the control group), the forecast contribution to production in 2000-01 from TIP is 0.5 50-kg bags – around 10% of total production. This is lower than SP1 – when around one-quarter of production was estimated to come from Starter Pack8 – and SP2. Table 54 presents data on expected maize production in 2000-01 disaggregated by food security status and receipt of TIP. Table 54: Expected maize production in 2000-01 by food security status 8 Levy, S., C. Barahona and I. Wilson: 1999-2000 Starter Pack Evaluation Programme Main Report, Statistical Services Centre, University of Reading, September 2000.
35

Food Secure
Food Insecure TIP recipient Non-recipient TIP recipient Non-recipient
Production 50-kg bags
Production 50-kg bags
Production 50-kg bags
Production 50-kg bags
Mean 6.8 6.3 4.3 3.9 Std Dev. 7.4 8 5.1 5.2 No. of respondents 404 475 783 945
The food secure respondents – irrespective of whether they received TIP inputs or not – expected to produce more maize than the food insecure respondents, by about 2.5 50-kg bags. The TIP recipients, among the food secure and food insecure groups, also expected to produce more maize in 2000-01 than the non-TIP recipients, by about 0.5 50-kg bags.
Farmers’ perception of the contribution of TIP to maize production
According to farmers’ perceptions, the contribution of TIP inputs to maize production was expected to be 2.2 50-kg bags of maize in 2000-01. This was lower than the forecast made last year for the contribution of SP2 (3.5 50-kg bags9). Nevertheless, it is high compared with the forecast based on the comparison between TIP recipients and the control group.
Legume production
Table 55: Expected legume production in 2000-01
TIP recipient TIP non-recipient Production
50-kg bags Production 50-kg bags
Mean 2.7 2.7 Standard deviation 2.8 2.4 No. of respondents 304 203
The expected legume production in 2000-01 for TIP recipients was the same as for non-TIP recipients (2.7 bags of 50 kg each). This gives the impression that the TIP campaign is expected to have no impact at all on legume production in 2000-01. However, the percentage of TIP recipients that planted legumes is higher by some nine percentage points than the percentage of non-recipients that planted legumes: 23% and 14% respectively. Thus TIP will have had some impact on production of legumes in 2000-01, albeit less than in 1999-2000.
9 National Statistical Office, Government of Malawi, (2000), Report of Starter Pack 1999-2000 agronomic survey (Module 1 of the 1999-2000 Starter Pack Evaluation).
36

Table 56 presents data on the expected legume production in 2000-01 disaggregated by poverty categories and by food security status. Table 56: Expected legume production in 2000-01 disaggregated by poverty categories and by food security status
Food secure Food insecure
Poverty category Production
(50-kg bags) Production
(50-kg bags) P1 2.2 2.2 P2 2.5 2.6 P3 2.4 2.5 P4 3.2 2.7 P5 3.3 3.2
There is no evidence of differences in legume production between food secure and food insecure households. A slight trend to increase production from the poorest to the least poor categories can be observed.
Farmers perception of the state of their TIP maize and legume crops Table 57: Farmers perception of the state of their TIP maize and legume crops for the 2000-01 crop season
Do you expect a good harvest this year? Maize %
Legumes %
Yes 9.5 6.1 No 62.2 31.7 Did not plant 24.2 51.5 No reply recorded 4.0 10.7 Total 100.0 100.0 No. of respondents 1440 1406
Sixty-two percent (62%) of the respondents did not expect a good maize harvest in 2000-01 crop season. Similarly, 32% of the respondents did not expect a good legume harvest in 2000-01 crop season. Over half of the respondents did not plant the TIP legumes. With this information in mind, we proceeded to find out the reasons why farmers did not expect good harvests of maize and legumes.
37

Table 58: Why don’t you expect a good maize and legume harvest for the 2000-01 crop season?
MAIZE LEGUME Reasons %* %*
Not enough fertiliser 13.8 5.2 TIP fertiliser received too late 17.8 6.7 Not enough seed 14.6 18.2 TIP seed received too late 46.0 41.4 Too much rain/flooding 69.8 59.6 Too little rain/drought 2.8 2.3 Pests and diseases 5.6 7.9 Didn’t have enough help 0.7 0.9 I was sick 0.4 1.6 No. of respondents 896 445 * Multiple responses were allowed. Therefore, total % need not add up to 100%. For maize, the most important reasons for not expecting a good harvest were:
1. Too much rain/flooding 2. TIP seed received too late 3. TIP fertiliser received too late 4. Not enough seed 5. Not enough fertiliser
For legumes, farmers cited the following reasons for expecting a poor harvest:
1. Too much rain/flooding 2. TIP seed received too late 3. Not enough seed 4. Pests and diseases 5. TIP fertiliser received too late
The farmers’ replies support the conclusion that the TIP campaign was less successful than the SP1 or SP2 schemes because of late distribution of inputs as well as the heavy rains or floods experienced in the 2000-01 season.
Deficit in food from own production The study looked at food self-sufficiency of smallholder farm households. The months of food self sufficiency were derived from questions about the month a respondent harvested maize in 1999-2000 and the month the maize run out. The number of months of food self sufficiency were subtracted from 12 (the number of months in a year) for each respondent to obtain the number of months that the household experienced a deficit of food from its own production (i.e. was not food self-sufficient)10.
10 ‘Months of food deficit’ is defined as the number of months that a household does not have food from their own harvest. Our survey only recorded data for maize; therefore, food is equivalent to maize, in our definition of months of food deficit. ‘Months of food deficit’ is derived from the difference between 12 and the number of months of maize self-sufficiency.
38

Table 59 presents data on deficit months for 1986 respondents. Data were filtered out for respondents where inconsistencies were found. Table 59: Months of food deficit
Number of months of food deficit % 0 4.8 1 10.0 2 12.8 3 15.8 4 12.6 5 11.7 6 9.0 7 7.2 8 6.3 9 4.3
10 3.3 11 1.4 12 0.9
Total 100.0 Number of farmers 1986
Out of 1986 respondents in our sample, only 5% of them produced enough maize to feed themselves twelve months in a year and therefore had zero months of food deficit. The other 95% had a food deficit: 72% of the households visited had 1-6 months of maize deficit in a year, while 23% had more than 6 months of maize deficit. Table 60: Food deficit months disaggregated by receipt of SP2 (%)
Deficit months SP2 recipients SP2 non-recipients 0 5.2 4.3 1 10.3 9.4 2 13.1 12.3 3 15.0 16.9 4 13.4 11.3 5 11.5 12.1 6 8.2 10.2 7 7.2 7.1 8 5.9 7.0 9 4.8 3.4
10 3.1 3.6 11 1.3 1.7 12 1.1 0.6
Total 100.0 100.0 No. of respondents 1200 786
The data in Table 60 shows that there was no effect of SP2 inputs on the number of food deficit months for the 1986 respondents sampled. Further data analysis for the 1986 respondents showed that the SP2 recipients had on average 4.4 food deficit months against 4.5 food deficit months for SP2 non-recipients.
39

Disaggregating the same data from the 1986 respondents by food security status showed that the food secure respondents had fewer food deficit months on average (4.0 months) than the food insecure respondents (4.6 months).
Months of food security As was shown in Table 59, only 5% of the 1986 respondents had no food deficit by the time of the survey in March-April 2001. The rest of the respondents experienced food deficits ranging from 1 month to 12 months. However, it does not necessarily mean that they were all food insecure, because some of them rely on other food crops than maize, or they can buy maize to supplement their own maize harvest. We define ‘months of food security’ as the number of months a household has food of any type to eat, without resorting to use of coping strategies. The months of food security were calculated using the maize harvest month in 2000 as baseline compared with the month a household first employed any of the eight coping strategies listed in Questions E6 and E7 of our HQ. Households that did not employ any of the coping strategies by the time of the survey in March-April 2001 were considered to have a full compliment of 12 months of food security. As Table 50 showed, one-third of the 2847 respondents in the survey were found to be food secure, while two-thirds were food insecure.
Description of food secure and food insecure households In this section, we describe the food secure and food insecure households by the sex of the respondent, by household size, by area of land cultivated, by receipt of TIP and by poverty categories. Table 61: Percentage households by food security status and sex of respondent
Food secure Food insecure % %
Male 68 68 Female 32 32 No. of respondents 893 1808
Table 62: Percentage households by food security status and household size
Household size Food secure Food insecure % %
0-5 persons 63 65 > 5 37 35 No. of respondents 877 1757
Table 63: Percentage households by food security status and area cultivated
Area cultivated Food secure Food insecure % %
1 acre or less 30 33 More than 1 acre 70 67 No. of respondents 960 1933
40

Table 64: Percentage households by food security status and receipt of TIP Food secure Food insecure % %
TIP recipients 47 48 Non-recipients 53 52 Number of respondents 965 1925
Table 65: Percentage households by food security status and poverty category
Poverty Category Food secure Food insecure % % Category 1: Poorest 20 32 Category 2: 15 17 Category 3: 17 18 Category 4: 18 14 Category 5: Least Poor 30 19 Number of respondents 968 1944
The tables show that the sex of the respondent, the household size (when categorised as up to 5 members and more then 5 members), area of land cultivated (1 acre or less and more than 1 acre) do not make a difference in whether a household is food secure or not. It is also clear that receiving TIP is not associated with food security status. However, there is a distinction between the group of food secure and food insecure households in relation to their poverty profile. This can be seen in the fact that food insecure households have a larger percentage of the poorest households (32%) than the food secure (20%). At the other end of the poverty scale, a higher percentage of households in the least poor categories belong to the food secure group (30%) than to the food insecure group (19%). It is interesting to note that we found food secure households in the poorest category and food insecure households in the least poor category. This goes to show that although maize production is a key part of food security at the household level, food security is not only determined by maize production but by other factors such as availability of other food crops and other sources of income.
Months of food security by district Table 66 presents data on months of food security by district, and compares it with data on months of food deficit by district. Likoma district had respondents with the highest number of months of food deficit (9 months)11 followed by Mzimba district (5.9 months) and Zomba district (5.8 months). Respondents from Ntcheu district had the lowest number of months of food deficit (2.4 months) followed by respondents from Balaka and Machinga districts (2.8 months). 11 It is not surprising that respondents from Likoma district registered many months of food deficit given that people on the island own very small pieces of land.
41

Table 66: Mean months of food deficit and months of food security by district District Food
Deficit Food Security District Food
Deficit Food
Security Months Months Months Months Balaka 2.8 10.1 Mulanje 5.5 9.8 Blantyre 4.2 9.6 Mwanza 5.1 8.8 Chikwawa 4.1 10.0 Mzimba 5.9 7.7 Chiradzulu 3.9 9.8 Nkhata Bay 4.6 9.8 Chitipa 4.0 8.5 Nkhotakota 5.1 9.0 Dedza 4.5 8.5 Nsanje 5.1 9.0 Dowa 3.7 8.6 Ntcheu 2.4 9.5 Karonga 4.8 9.3 Ntchisi 4.7 8.1 Kasungu 3.9 9.0 Phalombe 3.7 9.4 Likoma 9.0 9.5 Rumphi 4.4 7.9 Lilongwe 4.5 9.0 Salima 4.9 8.7 Machinga 2.8 10.1 Thyolo 4.2 9.3 Mangochi 4.2 9.4 Zomba 5.8 8.8 Mchinji 3.9 9.0 With regard to months of food security, there is not a single district in Malawi which registered a full 12 months of food security. The districts that registered the highest number of months of food security were Balaka (10.1 months), Machinga (10.1 months), Chikwawa (10.0 months), Mulanje, Nkhata Bay and Chiradzulu (9.8 months each). The districts that registered the lowest number of months of food security were Mzimba (7.7 months), Rumphi (7.9 months) and Ntchisi (8.1 months).
Sales and purchases of maize
Maize sales Out of 2939 respondents, only 15% sold maize between the 2000 harvest and the time of our survey in March-April 2001, while 81% did not sell any maize during this period. No replies were recorded from 4% of the respondents. Generally it is assumed that rural households would sell maize soon after harvest because they need cash. In addition to finding out the extent of maize sales, the survey wanted to find out whether those who sell their maize are more maize self-sufficient than those who do not sell their maize. Table 67: Mean months of food deficit and months of food security for respondents that sold maize and respondents that did not sell maize
Months of Food Deficit Months of Food Security Sold maize 3.8 9.3 Did not sell maize 4.6 9.1 The data in Table 67 show that those who sold maize had on average fewer months of food deficit (3.8 months) – implying a slightly higher level of maize self-sufficiency – than those who did not sell maize (4.6 months). They also had marginally more months of food security than the respondents who did not sell their maize (9.3 months versus 9.1 months).
42

Table 68: Percentage of farmers selling maize by receipt of SP2 (%) SP2 recipients SP2 non-recipients Sold their maize 16 12 Did not sell their maize 80 79 Number of respondents 985 281 Table 68 shows that there is no difference between SP2 recipients and non-recipients in terms of sales of maize.
Maize purchases A total of 1821 respondents (60.5% of the sample), bought maize in the period between the 2000 harvest and our survey in March-April 2001. Table 69 presents data – disaggregated by months of food deficit – on the volume of maize purchases and the money spent on them by these respondents. Table 69: Volume of maize purchases and money spent on the maize disaggregated by months of food deficit Months of food deficit Mean number of
50kg bags bought Mean amount spent
(MK) 0 2.3 640 1 1.8 424 2 2.0 689 3 2.9 679 4 2.9 783 5 3.2 811 6 3.1 857 7 2.9 822 8 4.1 1198 9 4.1 1289
10 3.7 1148 11 4.3 1686
The data in Table 69 show a trend for increasing number of bags bought as the number of months of food deficit increases from 0 to 11 months. There is also a corresponding increase in money spent on buying the maize from 0 to 11 months of food deficit. It is not surprising that respondents with higher number of months of food deficit had to buy more maize, given that they harvested less maize from own production.
43


Conclusions We estimate that the proportion of TIP recipients out of the total population of
households in rural Malawi was 42%. This indicates that the 2000-01 TIP campaign missed the target by 10%.
Community targeting did not succeed in targeting the poor. The poverty profiles
of TIP recipients and non-recipients are similar. The wealth/poverty breakdown of the sample showed that 59% of respondents who did not receive TIP packs belonged to the poorest three categories. On the other hand, 35% of respondents who received TIP packs belonged to the wealthiest two categories.
We found evidence that there was some preference for selecting households with the elderly, widows/widowers and female heads. These results coincide with the findings of the Monitoring Component.
TIP distribution happened too late for farmers to make effective use of the inputs.
Distribution was done mostly in December and January 2001. This translated into an average delay of 2 months in distribution of inputs. This late distribution of inputs adversely affected crop production. A majority of farmers (64%) indicated that they would prefer to receive inputs in September or October to give sufficient time to plan for the season and prepare their gardens.
The TIP campaign disrupted the social fabric in rural areas. Most rural people did
not understand that TIP was designed to target certain individuals in the community, by virtue of their poverty status or vulnerability (orphans, the aged or physically disabled). They interpreted targeting as favouritism on the part of chiefs or local leaders. Out of the 108 villages visited, four villages completely refused to receive TIP because of the problems targeting would cause in their communities.
The average distance travelled by respondents to the TIP inputs collection point
was 5.25 km. The minimum distance was less than a kilometre, while the maximum distance travelled was 26 kilometres.
Some 82% of TIP recipients received complete packs containing all four inputs
i.e. maize, legumes, basal fertiliser and top dressing fertiliser. About 81% of the maize, basal fertiliser and top-dressing fertiliser were received in sealed packs. For legumes, 83% of the bags were received sealed. Some 14-15% of input bags were received open but OK, while 4-5% were open with missing or damaged items.
Sixty-five percent (65%) of TIP recipients planted all of the TIP maize seed; 7%
of the respondents planted some of the maize seed, while 23% gave it away. The rest of the respondents (5%) either ate the seed, exchanged for food, sold it or stored it. Three-quarters of those who did not plant the TIP maize argued that the seed was received too late in the season to plant.
44

Only 35% of TIP recipients planted all the legume seed that they received, while 32% ate the seed, 18% give it away and 8% planted only some of it. The rest of the respondents either sold the seed, exchanged it for food, or stored it. The most important reason for not planting the legume seeds was that the seed was received too late for planting. Some 58% of the respondents planted the legumes in one plot, while 38% intercropped the maize and legumes.
Sixty-one percent (61%) of TIP recipients applied the basal and the top dressing
fertiliser to their TIP maize. About 30% applied the fertiliser to the rest of their maize fields. Late receipt of fertiliser was the main reason for not applying fertiliser (36%), while 24% said their land does not need fertiliser.
In terms of following instructions, about 45% of TIP recipients applied the basal
and top dressing fertiliser to their maize crops separately, as recommended, while 53% mixed the basal and top dressing fertiliser before applying it to their maize.
Of those who received TIP, 73% had no other source fertiliser except TIP
fertiliser. Only 28% had other sources of fertiliser. Sixty-five percent (65%) of TIP recipients received the TIP leaflet which was
included within the TIP pack in good condition. Of these, 60% said that they found the instructions easy to follow, while 26% said that they found the instructions difficult to follow. The main reason for finding the instructions difficult to follow was not knowing how to read. Sixty-one percent (61%) of the respondents have never met an agricultural extension worker in their area, while 19% meet their agricultural extension officer very irregularly.
SP2 recipients produced 9.0 50-kg bags of maize on average in 1999-2000, while
SP2 non-recipients produced 7.6 bags. The contribution of SP2 to the household maize production on the basis of the comparison of recipients and non-recipients is estimated to be 1.4 50-kg bags. Another route to estimating the contribution of SP2 to the maize produced at the household level is to ask the farmer for his own perception of the contribution. Recipients of SP2 perceive that the free inputs programme contributed an average of 2.7 50-kg bags of maize to the household.
Expected maize production by TIP recipients in 2000-01 was 5.2 50-kg bags per
household, while non-recipients expected to produce 4.7 bags. On this basis, TIP was forecast to contribute around 0.5 50-kg bags per household to total production. Late distribution of TIP inputs and the heavy rains were the main causal factors for the reduced yields compared with SP1 and SP2.
Sixty-two percent (62%) of TIP recipients did not expect a good maize harvest in
2000-01. Similarly, 32% did not expect a good legume harvest in 2000-01. The main reasons for not expecting good maize and legume harvests in 2000-01 was that there was too much rain or flooding and that TIP seed was received too late.
Only about 5% of the whole sample (TIP recipients and non-recipients) produced
enough maize from their own gardens to feed themselves from the 2000 harvest to
45

March-April 2001. Some 72% of the households visited had maize deficits ranging from 1 to 6 months, while 23% had more than 6 months of maize deficit.
Only 33% of the whole sample (TIP recipients and non-recipients) were food
secure between the 2000 harvest and the time of the survey in March-April 2001, while 67% were food insecure. SP2 did not reduce the proportion of farmers that was food insecure during this time, as the additional maize produced was not enough to last through the whole of the lean period.
Over 80% of the whole sample (TIP recipients and non-recipients) did not sell any
maize from the 1999/2000 harvest, and there was no difference between SP2 recipients and non-recipients. However, 60% of the sample bought maize. The number of bags of maize purchased and the amounts spent increased in line with increasing months of food deficit.
46


Appendix 1: Household Listing Form
49

TIP 2000-2001 EVALUATION
CHITEDZE RESEARCH STATION FOOD PRODUCTION AND SECURITY EVALUATION
MODULE 1
HOUSEHOLD LISTING FORM
CONFIDENTIAL AND ANONYMOUS IDENTIFICATION PANEL
DISTRICT VILLAGE NAME VILLAGE CODE
Total number of households Number of households that received TIP pack Number of household that did not receive TIP Pack Number of female headed households Number of male headed households Distance from distribution centre km
Early Mid
Date of distribution (day/month/year)
Month
Late
Was the day of distribution changed Yes No Control panel
Name Date Enumerator Superviser Consultant Data entry clerk

Households that received TIP Pack
To be filled in after the list is
complete Household number Gender of head of household
Sequential
number Selected?
Put an X if yes Male Female Male Female Male Female Male Female Male Female Male Female Male Female Male Female Male Female Male Female Male Female Male Female Male Female Male Female Male Female Male Female Male Female Male Female Male Female Male Female Male Female Male Female Male Female Male Female Male Female Male Female Male Female Male Female Male Female Male Female Male Female Male Female Male Female Male Female Male Female Male Female Male Female Male Female Male Female Male Female Male Female Male Female Male Female Male Female Male Female Male Female Male Female Male Female Male Female
Page ______ of _______

Households that DID NOT received TIP Pack
To be filled in after the list is complete
Household number Gender of head of household
Sequential number
Selected? Put an X if yes
Male Female Male Female Male Female Male Female Male Female Male Female Male Female Male Female Male Female Male Female Male Female Male Female Male Female Male Female Male Female Male Female Male Female Male Female Male Female Male Female Male Female Male Female Male Female Male Female Male Female Male Female Male Female Male Female Male Female Male Female Male Female Male Female Male Female Male Female Male Female Male Female Male Female Male Female Male Female Male Female Male Female Male Female Male Female Male Female Male Female Male Female Male Female Male Female Male Female
Page ______ of ______

Appendix 2: Questionnaires in English
53

For office use only.
Village code
Household code
Individual code
Household questionnaire final version in English.doc
1
TIP 2000-2001 EVALUATION
FOOD PRODUCTION AND SECURITY EVALUATION MODULE 1
HOUSEHOLD QUESTIONNAIRE CHITEDZE RESEARCH STATION
CONFIDENTIAL AND ANONYMOUS PART A IDENTIFICATION PANEL
DISTRICT VILLAGE NAME VILLAGE CODE HOUSEHOLD NUMBER
Household received a TIP Pack Yes 1 No 2 Household used any TIP Pack contents even if you didn’t receive a TIP Pack
Yes 1
No 2
Early 1 Mid 2
When did the rains start this year (Write down the month and tick the appropriate box)
Month
Late 3
Early 1 Mid 2
When do the rains start normaly (Write down the month and tick the appropriate box)
Month
Late 3 Control panel
Name Date Enumerator Superviser Consultant Data entry clerk
Before starting the interview read the following anonymity statement
We are working for Chitedze Research Station on behalf of the University of Reading in England. All the information collected is confidential and nobody will be able to identify you or use the information against you. To make sure of this, we will not write down your name so you can speak to us freely. Because we will not ask your name we will address you as Bambo or Mai.
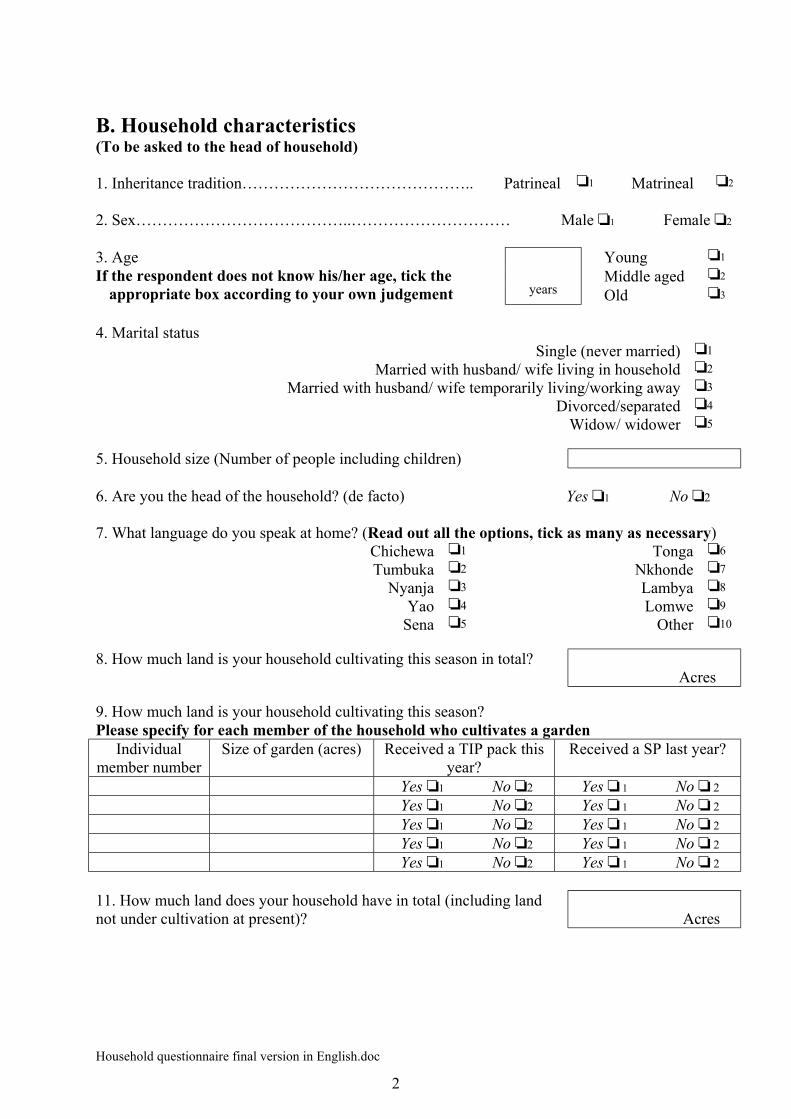
Household questionnaire final version in English.doc
2
B. Household characteristics (To be asked to the head of household) 1. Inheritance tradition…………………………………….. Patrineal 1 Matrineal 2 2. Sex…………………………………..………………………… Male 1 Female 2
Young 1 Middle aged 2
3. Age If the respondent does not know his/her age, tick the
appropriate box according to your own judgement
years
Old 3 4. Marital status
Single (never married) 1 Married with husband/ wife living in household 2
Married with husband/ wife temporarily living/working away 3 Divorced/separated 4
Widow/ widower 5 5. Household size (Number of people including children) 6. Are you the head of the household? (de facto) Yes 1 No 2 7. What language do you speak at home? (Read out all the options, tick as many as necessary)
Chichewa 1 Tonga 6 Tumbuka 2 Nkhonde 7
Nyanja 3 Lambya 8 Yao 4 Lomwe 9
Sena 5 Other 10 8. How much land is your household cultivating this season in total?
Acres 9. How much land is your household cultivating this season? Please specify for each member of the household who cultivates a garden
Individual member number
Size of garden (acres) Received a TIP pack this year?
Received a SP last year?
Yes 1 No 2 Yes 1 No 2 Yes 1 No 2 Yes 1 No 2 Yes 1 No 2 Yes 1 No 2 Yes 1 No 2 Yes 1 No 2 Yes 1 No 2 Yes 1 No 2 11. How much land does your household have in total (including land not under cultivation at present)?
Acres

Household questionnaire final version in English.doc
3
C. Wealth Indicators Livestock 1. Does your household keep any livestock? Yes 1 No 2 2. How many of the following animals does your household own? (Read out each type of animal in the list and note down the number against it. Put zero for none).
Type Number Type Number Chicken Pigs
Doves Goats Ducks Cattle
Guinea fowls Oxen (pulling/cultivating) Other assets 3. Does your household have any of the following? (Read out each option, tick as many as necessary)
Plough/Ridger Yes 1 No 2 Bicycle Yes 1 No 2 Radio Yes 1 No 2 Ox-cart Yes 1 No 2
Sources of income and employment
Crops 1 Remittances 2 Small business 3 Pension 4 Artisan 5 Ganyu wages 6
4. What sources of cash income does your household have? Read out all options so that the respondent is aware of them. Tick as many as necessary.
Sale of livestock & livestock products
6 Salary from employment
8
Main staple food crop (last harvest)………………... Main cash crop (last harvest)………………………. Sale of dimba crop (last harvest)…………………… Small business (last month)………………………… Artisan (last month)………………………………… Sale of livestock and livestock products (last month) Remittances (last month)…………………………… Pension (last month)………………………………... Ganyu wages (last weeding period)….…………….. Salary from employment (last month)……………… Sale of fish (last month)…………………………….. Sale of charcoal and firewood (last month)…………
5. Roughly how much income did you get from these sources in the time period mentioned (MK)? Read out all the options. Write zero if none.
Rent (last month) ….………………………………. Other income (last month)………………………….

Household questionnaire final version in English.doc
4
D. Production
Maize 1 Rice 2
Millet 3 Cassava 4
Sorghum 5
1. What is your main staple food crop? (Multiple responses are allowed)
Banana 6 2. Did you receive a Starter Pack last season (1999-2000)? Yes 1 No 2 3. How much maize did you harvest in the following cropping seasons? (50 kg bags)
Cropping Season Total Production Contribution from Starter Pack/TIP Scheme
Don’t know
1999 to 2000 1 2000 to 2001 expected 1 4. How much legumes did you harvest in the following cropping season? (50 kg bags)
Cropping Season Total Production Contribution from Starter Pack/TIP Scheme
Don’t know
1999 to 2000 1 2000 to 2001 expected 1 E. Food Self-sufficiency and food security If the main staple food is other than cassava, ask questions 1 to 3. If main staple is cassava, go to question 4. 1. When did you harvest your staple food last year (2000)? Write N/A if staple food is cassava
Month
Year
2. Did you sell any staple food from last year’s harvest (2000)? Yes 1 No 2 If no go to question 3 If yes,
How much (kg)? How much income did you realise from these sales?
3. Has your staple food that you harvested last season run out? Yes 1 No 2 If no go to question 5 If yes,
In which month did it run out? Month
Year

Household questionnaire final version in English.doc
5
If no, How many more months will the food last?
4. If the main staple food is cassava, ask How many months did you not have cassava to eat? 5. Over the current cropping season (2000/2001), a) Did you buy any staple food at the market in 1999/2000? Yes 1 No 2 If yes, i) How many 50 kg bags of maize (approx.). ii) How much did you pay for food/maize in total MK? b) Will you need to buy staple food at the market in this year? Yes 1 No 2 c) Did you receive any food through ganyu? Yes 1 No 2 d) Did you get any food from your friends or relatives? Yes 1 No 2 e) Did you give any food to your family or to friends? Yes 1 No 2 e) Did you receive any food from (read out all the options)
Food for Work programme Yes 1 No 2 Under Five programme Yes 1 No 2
Food aid Yes 1 No 2 Other Yes 1 No 2
6. Over the last year Did you do any of these:
When did you do it for the first time?
Month Early Mid Late Eat only one meal a day? Yes 1 No 2 1 2 3
Eat nsima from green maize (chitubu)? Yes 1 No 2 1 2 3 Eat madeya/gaga? Yes 1 No 2 1 2 3
Eat fruit only (no nsima)? Yes 1 No 2 1 2 3 Eat vegetables only (no nsima)? Yes 1 No 2 1 2 3
7. Did you reach a point when you had to Month Early Mid Late
Sell any one of your animals to buy food? Yes 1 No 2 1 2 3 Sell any other possessions to buy food? Yes 1 No 2 1 2 3
Rely on fruit (masuku), mushrooms, etc as a staple Yes 1 No 2 1 2 3 Do you have any comments? This is the end of the interview for households that didn’t receive a TIP package. If the household received TIP package start the individual now.
Remember to thank the respondent.

For office use only.
Village code
Household code
Individual code
Individual questionnarie final version in English.doc
1
TIP 2000-2001 EVALUATION
CHITEDZE RESEARCH STATION INDIVIDUAL QUESTIONNAIRE
FOOD PRODUCTION AND SECURITY EVALUATION
MODULE 1
CONFIDENTIAL AND ANONYMOUS
PART A IDENTIFICATION PANEL
DISTRICT VILLAGE NAME VILLAGE CODE HOUSEHOLD NUMBER INDIVIDUAL NUMBER
Young 1 Middle aged 2
Age of respondent If the respondent does not know his/her age, tick the
appropriate box according to your own judgement
years
Old 3 Sex…………………………………..………………………… Male 1 Female 2 Control panel
Name Date Enumerator Superviser Consultant Data entry clerk
Before starting the interview read the following anonymity statement
We are working for Chitedze Research Station on behalf of the University of Reading in England. All the information collected is confidential and nobody will be able to identify you or use the information against you. To make sure of this, we will not write down your name so you can speak to us freely. Because we will not ask your name we will address you as Bambo or Mai.

Individual questionnarie final version in English.doc 28/09/01 14:45
2
B. TIMELINESS OF PACK DELIVERY
Early 1 Mid 2
1. If you planted your own maize (not TIP) this year, when did you plant it? (Write down the month and tick the appropriate box)
Month
Late 3
Early 1 Mid 2
2. When did you receive the TIP pack (Write down the month and tick the appropriate box)
Month
Late 3
Early 1 Mid 2
3. If you planted TIP maize this year, when did you plant your TIP maize? (Write down the month and tick the appropriate box, if not planted write N/A)
Month
Late 3
Timely 1 Late but planted 2
4.How did you rate the timeliness of distribution in relation to your normal time of planting?
Too late to plant 3 5.Which month would you like to receive the TIP pack?
Month
C. CONTENT OF THE PACK 1. How many bags did you receive of:
Maize Soya beans Groundnuts Fertiliser (basal - grey)
Beans Fertiliser (top dressing - white) 2. What was the condition of the bags that you received (tick the appropriate box) Sealed Open but
contents OK Open with missing or
damaged contents Didn’t receive
Maize 1 2 3 4 Legumes 1 2 3 4 Fertilizer (basal - grey) 1 2 3 4 Fertilizer (top dressing - white) 1 2 3 4 3. Rate the quality of the contents: (tick the appropriate box) good poor unusable N/A Maize 1 2 3 4 Legumes 1 2 3 4 Fertilizer (basal - grey) 1 2 3 4 Fertilizer (top dressing - white) 1 2 3 4

Individual questionnarie final version in English.doc 28/09/01 14:45
3
D. USE OF THE INPUTS I. MAIZE 1. How did you use the maize seed? (Tick more than one if necessary) Planted all of it 1 Sold it 6 Planted some of it 2 Stored it 7 Ate it 3 Gave it away 8 Exchanged for food 4 Other, specify Didn’t receive 5 2. If not planted at all, or planted just part of it, why? (Tick more than one if applicable)
Seed received too late in the agricultural season 1 No land left available for planting 2
Seed of poor quality 3 Did not like the variety 4
3. What proportion of all maize seed that you planted came from the TIP pack this season? (tick one box only)
All of it More than half
Equal amounts
Around 1/4 Very little None
1 2 3 4 5 6 4. How did you plant the TIP maize? Did you… (Tick more than one if necessary)
Plant it all together in one plot? 1 Spread it out over a larger area? 2 Use to fill gaps in your garden? 3
Not applicable 4 5. What is the origin of the other seed that you planted (non-TIP seed) this season? a) Bought seed (Tick more than one if necessary)
How much (kg) How much (MK) Local variety 1
Hybrid/Improved seed 2 Don’t know 3 Didn’t buy 4
b) Recycled seed (Tick more than one if necessary)
How much (kg) Seed from last year’s SP harvest 1
Seed from SP2 which was not planted but stored to plant this year 2 Local variety 3
Last year’s bought seed (not SP) 4 Last year’s seed received from agricultural programmes (not SP) 5
Don’t know 6 Didn’t recycle seed 7

Individual questionnarie final version in English.doc 28/09/01 14:45
4
II. LEGUMES 1. How did you use the legume seed? (tick more than one if necessary) Planted all of it 1 Sold it 6 Planted some of it 2 Stored it 7 Ate it 3 Gave it away 8 Exchanged for food 4 Other, specify Didn’t receive 5 If planted all of it go to question 3
2. If not planted at all or planted just part of it, why? (Tick more than one if applicable)
Seed received too late in the agricultural season 1 No land left available for planting 2
Seed of poor quality 3 Did not like the type of legume 4
3. What proportion of all legume seed that you planted came from the TIP pack this season? (Read out all options, tick only one)
All of it More than half
Equal amounts
Around 1/4 Very little None
1 2 3 4 5 6 4. Did you plant the legumes them all together in one plot? Yes 1 No 2 5. Did you intercrop the maize and the legumes? Yes 1 No 2 III. FERTILIZER 1. What did you do with the fertiliser? (Tick more than one if necessary) Basal (grey) Top dressing (white) Applied it to TIP maize Yes 1 No 2 Yes 1 No 2 Applied it to rest of the maize field Yes 1 No 2 Yes 1 No 2 Used it on other crops Yes 1 No 2 Yes 1 No 2 If yes, other crops, specify which crop
or crops
Basal (grey) Top dressing (white) Gave it away Yes 1 No 2 Yes 1 No 2 Sold it Yes 1 No 2 Yes 1 No 2 Stored it Yes 1 No 2 Yes 1 No 2 It was stolen Yes 1 No 2 Yes 1 No 2 Other, specify

Individual questionnarie final version in English.doc 28/09/01 14:45
5
2. If you didn’t apply any of the TIP fertiliser, why not? (If applied, go to question 3)
My land doesn’t need fertiliser Yes 1 No 2 I only use organic fertiliser Yes 1 No 2
I needed the money, so I sold it Yes 1 No 2 It came too late to use Yes 1 No 2
Other (please specify) 3. If you applied fertiliser to the maize, how did you apply the fertiliser? (Tick no more than two answers)
Basal (grey) dressing separately 1 Top (white) dressing separately 2
Basal + Top dressing mixed 3 (If applied mixed fertiliser go to part c) a) If you applied the basal to the maize, when did you apply the basal fertiliser?
During planting 1 After a week but before two weeks after planting 2
Three to four weeks after planting 3 Did not apply 4
b) If you applied the top dressing to the maize, when did you top dress?
During planting 1 After germination but 2 weeks after planting 2
3 weeks after planting 3 4 weeks to tasseling 4
After tasseling 5 Did not apply 6
c) If you applied the mixed fertiliser to the maize, when did you apply the mixed fertiliser? (if the farmer did not mix fertiliser go to question 4)
Within a week from planting 1 From germination to 4 weeks after planting (including weeding) 2
After weeding but before tasseling 3 After tasseling 4 Did not apply 5
4. Apart from the fertiliser which you were given in your TIP, where else did you obtain fertiliser for your garden? (Write zero if no other fertiliser was obtained)
basal top dressing Credit scheme kg kg
Own cash kg kg Gifts from relatives kg kg
Bought fertiliser from TIP beneficiaries kg kg
Stored fertiliser from SP2 kg kg Others (please specify) kg kg

Individual questionnarie final version in English.doc 28/09/01 14:45
6
5. What proportion of all the fertiliser that you applied came from the TIP pack this season? (Tick only one option)
All of it More than half
Equal amounts
Around 1/4 Very little None
1 2 3 4 5 6 E. OPEN POLLINATED VARIETY 1. Did you realise that the maize seed given out this season is different from last season?
Yes 1 No 2
2. If yes, how did you know that the seed was different? (Tick more than one box if necessary)
It looks flint and poundable 1 The leaflet in the pack said it was different 2
I heard on the radio 3 The extension field assistant told me 4
Other 5 3. Do you realise that seed for this season can be recycled again without loss of yield potential?
Yes 1 No 2
If answer to E1 or E3 is NO, then enumerator provides factual information on the difference between hybrid and OPV: This year the TIP pack provided maize seed from Open Pollinated Varieties, their yield is the same as hybrid in your plot, you don’t have to buy fresh seed every year – you can use it again, and it is just as poundable as your local variety.
F. FARMERS’ PERCEPTION 1. How far away is the garden where you used TIP inputs km Go with the farmer to his/her garden where the TIP inputs have been used and ask questions 2 to 8. In the exceptional case when it is impossible to go to the garden, make sure you still ask these questions at the farmer’s house. 2. What is the size of your garden? Acres 3. Do you expect a good harvest of maize this season? Yes 1 No 2 Didn’t plant 3 (if yes go to question 8)

Individual questionnarie final version in English.doc 28/09/01 14:45
7
4. If no, why not? (Tick as many responses as appropriate)
Not enough fertiliser 1 TIP fertiliser received too late 2
Not enough seed 3 TIP seed received too late 4
Too much rain/flooding 5 Too little rain/drought 6
Pests/diseases 7 Didn’t have enough help in the garden (lack of labour) 8
I was sick 9 Other, please specify 10
5. Approximately how many 50 kg bags do you expect to harvest?
Check here if Don’t know 1 6. Do you expect a good harvest of legume this season?
Yes 1 No 2 Didn’t plant 3
(if yes go to question 8) 7. If no, why not? (Tick as many responses as appropriate)
Not enough fertiliser 1 TIP fertiliser received too late 2
Not enough seed 3 TIP seed received too late 4
Too much rain/flooding 5 Too little rain/drought 6
Pests/diseases 7 Didn’t have enough help in the garden (lack of labour) 8
I was sick 9 Other, please specify 10
8. Approximately how many 50 kg bags do you expect to harvest?
Check here if Don’t know 1 G. TIP LEAFLET & EXTENSION 1. Did you receive a leaflet with instructions on how to use TIP inputs?
Yes 1 No 2
2. What was the condition of the leaflet?
Good 1 Damaged 2
3. Did you follow the instructions in the leaflet? For maize:
Ridges are 75cm apart (approx.) Yes 1 No 2 Planting stations are 25cm apart (approx.) Yes 1 No 2
One plant per planting station Yes 1 No 2

Individual questionnarie final version in English.doc 28/09/01 14:45
8
4. Were you given instructions on how to plant the legumes? Yes 1 No 2 5. Did you find the instructions in the leaflet easy to follow? Yes 1 No 2 If yes go to question 14 6. If NOT, why? (Tick as many as necessary)
Don’t know how to read 1 Did not understand the instructions 2
Instructions were too tedious to follow 3 Did not want to follow instructions 4
No time to follow instructions 5 Instructions contrary to my usual farming practice 6
Damaged leaflet 7 Other, please specify 8
7. How often do you meet the extension field assistant? (Tick only one option)
Never 1 Very irregular 2
Weekly 3 Fortnightly 4
Monthly 5 8. Have you visited a starter pack demonstration plot this year? Yes 1 No 2 9. Did you receive any of these in your pack?
A leaflet on HIV/AIDS Yes 1 No 2 A Chishango Yes 1 No 2
10. Do you think it is a good idea to include information on HIV/AIDS in the pack?
Yes 1 No 2
11. Do you think it is a good idea to include a Chishango in the pack?
Yes 1 No 2
This is the end of the interview
Remember to thank the respondent
For the enumerator to fill in after the interview: 1 Do you visit the farmer’s garden? Yes 1 No 2
2. If not, why not?

Appendix 3: Questionnaires in Chichewa and Tumbuka
67

Questionnaires in Chichewa and Tumbuka.doc 03/15/01 5:56 AM
TIP 2000-2001 EVALUATION
FOOD PRODUCTION AND SECURITY EVALUATION MODULE 1
HOUSEHOLD QUESTIONNAIRE CHITEDZE RESEARCH STATION
CONFIDENTIAL AND ANONYMOUS PART A IDENTIFICATION PANEL
DISTRICT VILLAGE NAME VILLAGE CODE HOUSEHOLD NUMBER
Kodi munyumba muno munalandira TIP Pack Eya 1 Ayi 2 Kodi munagwiritsa ntchito zipangizo za TIP Pack ngakhale simunalandire nawo TIP Pack
Eya 1
Ayi 2
Kodi mvula inayamba liti kugwa chaka chatha (Chongani
mwezi ndi nthawi) Mwezi mayambiro 1
mkati 2 mapeto 3 Kodi zaka zonse mvula imayamba mwezi wanji? (Chongani
mwezi ndi nthawi) Mwezi mayambiro 1
mkati 2 mapeto 3 Control panel
Name Date Enumerator Superviser Consultant Data entry clerk
Musanayambe kucheza nawo alimi, awuzeni kuti zonse zimene anene, zikhala za chinsinsi. Ife tachokera ku Chitedze Research Station ndipo tikugwira ntchito iyi m’malo mwa University of Reading, yaku Mangalande. Zonse zimene mutiuze pano zikhala za chinsinsi, ndiye mukhale omasuka ndipo musaope kuti tikawauza ena. Chifukwa cha ichi, pano sitikufunsani kuti mutiuze dzina lanu; tikamacheza pano tizingokutchulani kuti Bambo kapena Mayi. B. M’mene banja liri.

Questionnaires in Chichewa and Tumbuka.doc 03/15/01 5:56 AM
(Mafunsowa funsani mkulu wapa banja) 1. Kodi kuno mwambo wanu ndi wa chikamwini kapena mumalowola?
Chikamwini 1 Kulowola 2
2. Mwamuna kapena mkazi Mwamuna 1 Mkazi 2 3. Muli ndi zaka zingati? Zaka:................
Sindidziwa Wamg’ono 1
Wamkulu 2 Nkhalamba 3 4. Ndinu wokwatiwa?
Sindinakwatilepo 1 Eya, Mwamuna/Mkazi wanga ali pompano 2
Eya, koma mwamuna/mkazi wanga anachokapo/akugwira ntchito kwina 3 Ayi, chikwati chinatha 4
Ayi, Bambo/Mayi anatisiya 5 5. Kuphatikiza ndi ana, kodi m’nyumba muno anthu mulipo angati? 6. Kodi ndinu wamkulu wa pa banja? Eya 1 Ayi 2 7. Kodi ntchito yanu yeniyeni ndi chiani? (Auzeni mayankho onse, koma chongani yankho limodzi)
Mlimi 1 Ndimagwira ntchito pa Estate 6 Ndimachita businesi ya ying’ono 2 Ndine Tenanti pa Estate 7
Ndimagwira ntchito za luso 3 Sindigwira ntchito 8 Ndimagwira ntchito ku boma 4 Other 9
Ndimagwira ntchito pandekha 5 8. Kodi mumalankhula chinenero chanji? (Auzeni mayankha onse, chongani zinenero zonse zimene amalankhula) Chichewa 1 Tonga 1 Tumbuka 2 Nkhonde 2 Nyanja 3 Lambya 3 Yao 4 Lomwe 4 Sena 5 zilankhulo zina 5

Questionnaires in Chichewa and Tumbuka.doc 03/15/01 5:56 AM
9. Kodi chaka chino, inu ndi onse a m’banja lanu, mwalima maekala angati? Please specify for each member of the household who cultivates a garden
Individual member number
Size of garden (acres) Received a TIP pack this year?
Received a SP last year?
Eya 1 Ayi 2 Eya 1 Ayi 2 Eya 1 Ayi 2 Eya 1 Ayi 2 Eya 1 Ayi 2 Eya 1 Ayi 2 Eya 1 Ayi 2 Eya 1 Ayi 2 Eya 1 Ayi 2 Eya 1 Ayi 2 10. Kuphatikizapo malo amene simunalime chaka chino, munda wanu ndi waukulu bwanji, maekala angati)?
Ekala
C. Kafukufuku wa chuma chimene ali nacho Ziweto 1. Kodi pa banja pano mumasunga ziweto? Eya 1 Ayi 2 2. Kodi muli ndi ziweto zingati za mitundu iyi? (Auzeni mitundu yonseyi ndipo lembani nambala ya ziweto zimene ali nazo).
Type Number Type Number Nkhuku Nkhumba
Nkhunda Mbuzi Abakha Ng’ombe
Nkhanga Ng’ombe zokoka ngolo/ abulu) Chuma china 3. Kodi pa banja pano muli ndi zinthu izi? (Auzeni mayankho onse, ndipo muchonge zonse zimene ali nazo)
Pulawo/Rija Eya 1 Ay 2 Njinga Eya 1 Ayi 2 Wailesi Eya 1 Ayi 2 Ngolo Eya 1 Ayi 2
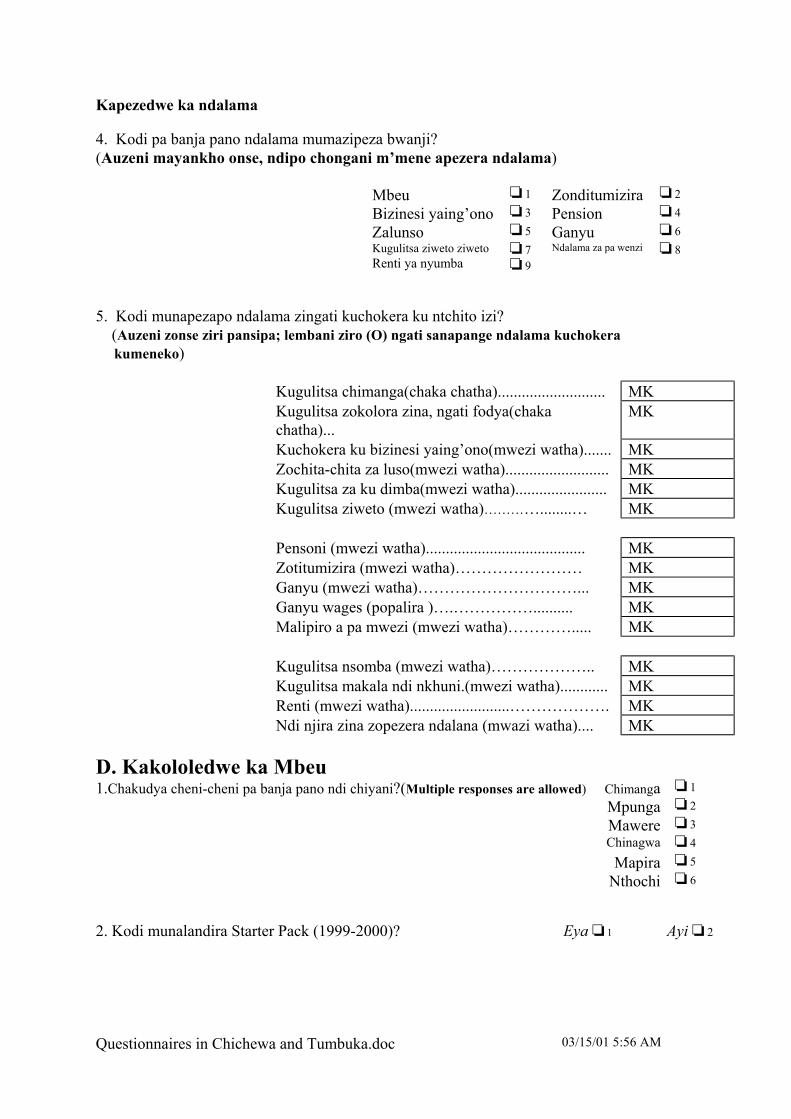
Questionnaires in Chichewa and Tumbuka.doc 03/15/01 5:56 AM
Kapezedwe ka ndalama 4. Kodi pa banja pano ndalama mumazipeza bwanji? (Auzeni mayankho onse, ndipo chongani m’mene apezera ndalama) Mbeu 1 Zonditumizira 2 Bizinesi yaing’ono 3 Pension 4 Zalunso 5 Ganyu 6 Kugulitsa ziweto ziweto
Renti ya nyumba 7 9
Ndalama za pa wenzi
8
5. Kodi munapezapo ndalama zingati kuchokera ku ntchito izi? (Auzeni zonse ziri pansipa; lembani ziro (O) ngati sanapange ndalama kuchokera kumeneko) Kugulitsa chimanga(chaka chatha)........................... MK Kugulitsa zokolora zina, ngati fodya(chaka
chatha)... MK
Kuchokera ku bizinesi yaing’ono(mwezi watha)....... MK Zochita-chita za luso(mwezi watha).......................... MK Kugulitsa za ku dimba(mwezi watha)....................... MK Kugulitsa ziweto (mwezi watha)…………........… MK Pensoni (mwezi watha)........................................ MK Zotitumizira (mwezi watha)…………………… MK Ganyu (mwezi watha)…………………………... MK Ganyu wages (popalira )….…………….......... MK Malipiro a pa mwezi (mwezi watha)…………..... MK Kugulitsa nsomba (mwezi watha)……………….. MK Kugulitsa makala ndi nkhuni.(mwezi watha)............ MK Renti (mwezi watha).........................………………. MK Ndi njira zina zopezera ndalana (mwazi watha).... MK D. Kakololedwe ka Mbeu 1.Chakudya cheni-cheni pa banja pano ndi chiyani?(Multiple responses are allowed) Chimanga 1 Mpunga 2 Mawere 3 Chinagwa 4 Mapira 5 Nthochi 6 2. Kodi munalandira Starter Pack (1999-2000)? Eya 1 Ayi 2

Questionnaires in Chichewa and Tumbuka.doc 03/15/01 5:56 AM
3. Kodi munakolora matumba angati a 50 kg a chimanga?
Cropping Season Zonse pamodzi Za Starter Pack/TIP Scheme Sindi- dziwa
1999 to 2000 1 2000 to 2001(Chiyembekezo) 1 4. Kodi mbeu ya soya kapena mtedza, munakolora matumba angati a 50 kg?
Cropping Season Zonse pamodzi Za Starter Pack/TIP Scheme
Sindi- dzwia
1999 to 2000 1 2000 to 2001(Chiyembekezo) 1 E. Kakwaniridwe ka chakudya pa banja (Ngati chakudya cheni-cheni pa banja, sichinangwa, funsani mafunso 1 mpaka 3. Ngati chakudya ndi chinangwa, funsani funso 4). 1. Kodi chaka chathachi munakolora liti chakudya chanu? (Write N/A if staple food is cassava)
Mwezi
Chaka
2. Kodi munagulitsapo zokolora zanu za chaka chatha? Eya 1 Ayi 2 Ngati yankho ndi Ayi, funsani funso 3) Ngati munagulitsapo,
Munagulitsa ma kilogramu angati? Munapeza ndalama zingati?
3. Kodi chimanga chanu chimene munakolora chilipo kapena chinatha?
Chilipo 1 Chinatha 2
Ngati chinatha, chinatha mwezi uti? Mwezi
Chaka
Ngati chilipo, mukuyembekeza kuti patsala miyezi ingati kuti
chithe?
4. Ngati chakudya chanu pakhomo pano ndi chinagwa, panali miyezi ingati imene simunadye chinagwa?

Questionnaires in Chichewa and Tumbuka.doc 03/15/01 5:56 AM
5. Muchaka chino cha (2000/2001), a) Munagulapo chakudya ku msika? Eya 1 Ayi 2 Ngati munagulapo,
i) Munagulapo ma kilogramu angati? (moyerekeza). ii) Munalipira ndalama zingati MK?
b) Mukuganiza kuti chaka chino mugulanso chakudya pa msika? Eya 1 Ayi 2 c) Mukachita ganyu, amakupatsani chakudya monga ufa? Eya 1 Ayi 2 d) Munalandira chimanga kuchokera kwa achibale/abwenzi anu? Eya 1 Ayi 2 e) Kodi munawagawirapo chakudya kwa a chibale kapena abwenzi anu? Eya 1 Ayi 2 f) Munalandilapo chakudya kuchokera ku ma bungwe awa? Eya 1 Ayi 2
Food for Work programme Eya 1 Ayi 2 Under Five programme Eya 1 Ayi 2
Food aid Eya 1 Ayi 2 Other Eya 1 Ayi 2
6. Kodi mu chaka chathachi, kapena kumayambiliro a chaka chino, zinthu zinafika poyipa kuti munachitapo zina mwa izi?:
Mwezi uti?
Mwezi Mayambiliro
Mka ti
Kothera
Kudya kamodzi pa tsiku? Eya 1 Ayi 2 1 2 3 Kudya nsima ya (chitibu)? Eya 1 Ayi 2 1 2 3
Kudya madeya/gaga? Eya 1 Ayi 2 1 2 3 Kudya zipatso basi (osadya nsima)? Eya 1 Ayi 2 1 2 3
Kudya masamba okha (osadya nsima)? Eya 1 Ayi 2 1 2 3 7. Zinthu zinafika poyipitsitsa kuti munachitapo izi? Mwezi Maya
mbiliro Mka ti
Kothera
Kugulitsa ziweto kuti mugule chakudya? Eya 1 Ayi 2 1 2 3 Kugulitsa katundu wa panyumba kuti mugule chakudya? Eya 1 Ayi 2 1 2 3
Kungodalira masuku, mango kapena bowa? Eya 1 Ayi 2 1 2 3 Kodi muli ndi zakukhosi pa nkhani ya Stata Paki zoti mungatiuze? Apa ndipothera kucheza ndi mlimi amene sanalandile TIP Pack. Ngati mlimi analandira TIP Pack, yambani kucheza naye pofunsa mafunso a mu Individual Questionnaire. Kumbukilani kuthokoza mlimi amene munacheza naye.

Questionnaires in Chichewa and Tumbuka.doc 03/15/01 5:56 AM
TIP 2000-2001 EVALUATION
FOOD PRODUCTION AND SECURITY EVALUATION MODULE 1
HOUSEHOLD QUESTIONNAIRE CHITEDZE RESEARCH STATION
CONFIDENTIAL AND ANONYMOUS PART A IDENTIFICATION PANEL
DISTRICT VILLAGE NAME VILLAGE CODE HOUSEHOLD NUMBER
Kasi banja likapokera sitata paki Enya 1 Yayi 2 Kasi banja likagwirisa nelute sitata paki naga uli likapokera yayi?
Enya 1
Yayi 2
Kasi vula yakupandila vingoma yikafika mwezi nguni? (Lembani mwezi wake ndipo chongani kabokosi kamoza
kakwenerera)
Mwezi
Pakwamba 1
Pakati 2 Kuumaliro 3 Kasi nyengo zose vula yakupandila yikwamba mwezi uli?
(Lembani mwezi wake ndipo chongani kabokosi kamoza kakwenerera)
Mwezi
Pakwamba 1
Pakati 2 Kuumaliro 3 Control panel
Name Date Enumerator Superviser Consultant Data entry clerk
Pambere mundayambe kuchezga na walime, muwazge mazgo agha:
Ise tikugwira nchito ku Chitedze Research Station mumalo mwa wanyithu wa ku Univerite ya Reading ku Mangalande. vyose ivyo tidumbiskanenge pano, vyatekha-tekha, nakuti ise tamuyowoyaso na munthu munyake chara, panji ku runura zina linu nanyengo na yimoza yayi. Ichi ndicho chifukwa chake tikhumbenge kuti mutiphalire zina lino yayi. Vyose ivyo tiyowoyenge vya chisisi pera.

Questionnaires in Chichewa and Tumbuka.doc 03/15/01 5:56 AM
B. VINTHU IVYO VILI PANYUMBA YA MULIMI (Agha nimafumbo ghakufumba mulala ndipo mwenecho wa banja lose) 1. Mwenecho wakatundu pa banja Kuchama
lume 1 Kuchanakazi 2
2. Kasi banalume panji mwanakazi? Mwanalune 1 Mwanakazi 2 3. Kasi mwene banja wakawa pa uli? (Pala mwene banja wakuvimanya yayi virimika vyake,
chongani tumabokosi kwakuyaniskane na umo mwene banja walili)
Virinuka
Munyamaya 1
Doda 2 Mudala 3 4. Umoliliri banja la mwene banja
Waliyekha (ndipo wandatolepo panji kutengwapo) 1 Ngwakutora panji kutengwa ndipo wakukhala pa nyumba 2
Ngwakutora panji kutengwa, ndipo mwanalume panji mwanakazi wakukhala kunyake 3 thengwa yili kumala panji wali kulekana waka 4
Chokolo 5 5. Kasi wanthu mbalinga mu banja ili? 6. Kasi imwe ndimwe wenecho wanyumba ndipo mukukhala penepano?
Enya 1 Yayi 2
7. Kasi munyumba mwinu muno mukuyowoya chiyowoyero uli? (Zunulani viyowoyero vyose, ndipo chongani vyose ivyo vikuyowoyeka)
Chichewa 1 Tonga 6 Tumbuka 2 Nkhonde 7
Nyanja 3 Lambya 8 Yao 4 Lomwe 9
Sena 5 Chinyake ndiyo woyerouli inco mukumanya
10
8. Kasi banja lino lose chaka chino likulima ma ekala ghalinha?
Ekala

Questionnaires in Chichewa and Tumbuka.doc 03/15/01 5:56 AM
9. Kasi munthu wali yole mu banja mwinu umu wakulima ma ekala ghalinga? (Yezgani kukumbuka ma ekala ghose agho wanthu wamunyumba mwinu walima chaka chino)
Nambala ya wanthu
Ukulu wake wa munda Kasi mukapokera sitata paki chaka chino?
Kasi mukapokera sitata paki chaka chino?
1 Ekala Enya 1 Yayi 2 Enya 1 Yayi 2 2 Ekala Enya 1 Yayi 2 Enya 1 Yayi 2 3 Ekala Enya 1 Yayi 2 Enya 1 Yayi 2 4 Ekala Enya 1 yayi 2 Enya 1 Yayi 2 5 Ekala Enya 1 yayi 2 Enya 1 Yayi 2
10. Kasi banja linu lina malo ghakulu uli? (Apatikusazgako na agha mundapandepo vinthu)
Ekala
C. VINTHU VYA VUWONESKA KUTI MUNTHU NIMUSAMBAZI Viweto 1. Kasi mukusunga viweto pa nyumba pano? Enya 1 Yayi 2 2. Pala mukusunga viweto, tiphalireni unandi wake wa viweto vyo ivyo vikusungika pa nyumba yinu? (Wazgano mutundu uli wose wa viweto uvo talemba, ndipo lembani unandi wake wa viweto. Lembani zero pala chiweto chamunthu uwo palije).
Mtundu Unandi Mtundu Undandi Nkhuku Nkhumba
Nkhunda Mbuzi Va baka Ng’ombe
Nkhanga Nkhambako Katundu munyake pa nyumba 3. Kasi pa nyumba yinu pa kusangika chimoza panji vyese ivi niyowoyenge apa? (Chongani vyose ivyo mulimi wa zumulenge)
Majamba ghakulimira ng’ombe
Enya 1 Yayi 2 Njinga Enya 1 Yayi 2
Radio Enya 1 Yayi 2 Chikochikari Enya 1 Yayi 2

Questionnaires in Chichewa and Tumbuka.doc 03/15/01 5:56 AM
Kusanga ndarama pa nyumba na malo ghakugwirako nchito
4. Kasi ndarama pa nyumba panji banja linu pano ndarama mukuzisanga uli? (Werengani vyose ivi talembe apa kuti mulime wasankhapo ntowa zose izi wakusangila ndarama pa nyumba)
Mbuto panji mbeu 1 Kupokera makopala kufuma ku wa bale wa pa nchito
2
Kabisinesi kachoka 3 Penshoni 4 Twakupanga-panga 5 Kulima ganyu 7 Kugulisa viweto, mkaka,
vikumba panji nyama ya viweto Nanga vinyake vilipo? 9
6 Kufuma ku nchito iyo munthu wakugwira Renti ya nyumba 10
8
5. Pala mungakumbuka makora, mukugomezga kuti mu kasangapo ndarama zilinga pa vinthu ivyo ni zunulenga apa (MK)? (Werengani nthawi zose izo munthu wangasangila ndarama ndipo nulemba ndarama izo wakasanga chaka chamala, panji mwezi wamala). Kugulisa mbuto yaya chakurya (vingoma panji mayao, chaka chamala) MK Kugulisa mbuti yakusangilapo ndarama para ngati foja, tea, coffee, skaura chaka chamala MK Kugulisa mbeti za kumadimba chaka chamala MK Kufuma ku ka bizinesi kachoko mwezi wa mala uwu MK Kufuma ku tunthu twakupanga-panga pa nyumba MK Kuguliska viweto, na myama panji mukana na vikumba vyawo mwezi wamala MK Kupokera ndarama kufuma kuwabale awo wakugwira nchito mwezi wamala MK Kufuma ku penishoni yinu mwezi wamala MK Kufuma ku ganyu mwezi wa mala MK Kufuma ku nchito iyo mukugwira mwezi wamala Kufuma kwa kugulisa somba mwezi wamala Kufuma kwa kugulisa mikala mwezi wamala Kufuma ku Renti ya nyumba mwezi wamala Nanga kunyake uku wakasangila ndarama mwezi wamala ni nkhu, ndipo ndarama zilinga D. KAGAWIRO NA KAPOKERERO KA SITATA PAKI 1. Kasi nimbeu uli iyo mukulima iyo ndiyo ya chakurya chino cha zuwa-mazuwa? (Werengani vyose ndipo munthu wa ngazigora kwa kuyaniskana na umo wakuryera pa nyumba yake na banja lose)
Vingoma 1
Mpunga 2 Lipoko 3 Vinkhawo 4 Mapira 5 Matochi 6 2. Kasi mukapokera sitata paki chaka chamala (1999-2000)? Enya 1 Yayi 2

Questionnaires in Chichewa and Tumbuka.doc 03/15/01 5:56 AM
3. Kasi mukasangapo viuna yinandi uli ya vingoma chaka chamala, ndipo chaka chino mukugomezga kuti musangenge vuna ya uli unandi wake?(Lembani mathumba gha 50 kg bags)
Chirimika Vuna yose yavingoma
Kasi pa vuna iyo mukasanga ni mathumba ghalinga ghakafuma ku sitata paki
Nkuma-nyachara
Chaka chamala (1999 to 2000) 1 Chaka chino 2000 to 2001 1 4. Kasi mukasanga vuna yinandi uli ya nchunga nasoya chaka chamala, ndipo chaka chinu mukugomezga kuti musange vuna ya uli unandi wake? (Lembani mathumba gha 50 kg bags)
Chirimika Vuna yose yavingoma
Kasi pa vuna iyo mukasanga ni mathumba ghalinga
ghakafuma ku sitata paki
Nkuma-nyachara
Chaka chamala (1999 to 2000) 1 Chaka chino 2000 to 2001 1 E. UNANDI NA KU KWANIRA KWA VYA KURYA PA NYUMBA Pala chakuraya cha zuwa na zuwa ni vingoma, Lipoko, mupunga, mapira panji matochi, wazgore mafumbo namala 1 mupaka 3. Pala chakurya zazawa nazuwa ai vinkhawo, lutani ku fumbo nambala 4. 1. Kasi chakurya chinu icho mukugomezga pano pa nyumba, mukakolola pa uli chaka chamala (2000)? (Lembanipo N/A pala chakurya icho ni vinkhawo)
Mwezi
Chaka
2. Kasi mukagulisapo chakurya chino chaka chamala (2000)?
Enya 1 Yayi 2
Pala zgoro ni Yayi, lutani ku fumbo la chitatu Pala zgoro ni Eya,
Mukasangapo unandi uli wa vuna (kg)? Nanga ndarama mukasangapo zilinga?
3. Kasi chakurya chino cha zuwa na zuwa icho mukakolola chaka chamala chili kumala sono?
Eya 1 Yayi 2
(Pala chindamale lutani ku fumbo nambala 5) Pala enya,
Chakurya ichi chikamala mwezi nkuni? Mwezi
Chaka
Pala enya, Pala chakurya ichi chindamale, kwakhala mwezi yilinga kuti
chakurya ichi chimalirethu?

Questionnaires in Chichewa and Tumbuka.doc 03/15/01 5:56 AM
4. Pala chakurya chinu cha zuwa na zuwa in vinkhawo, kasi ni mwezi yilinga iyo imwe mulikukhalopo kwa mbula kurya sima ya vinkhawo vya mu munda winu?
5. Muchaka chino chavula ya sono (2000/2001), a) Muli kugulapo chakurya cha zuwa na zuwa kufuma ku wanthu panji kumareketa mu chaka chamala (1999/2000)?
Enya 1 Yayi 2
Pala Enya,
i) Muli kugulapo ma thumba ghalinga gha vingoma gha 50 kg?
ii) Kasi kuti mugule vya kurya muli kusakazapo ndarama zilinga (MK)?
b) Kasi mukogomezga kuti mugulenge chakurya cha zuwa na zuwa chaka chino?
Enya 1 Yayi 2
c) Kasi muli kuchitapo ganyu kuti musange chakurya ? Enya 1 Yayi 2 d) Kasi imwe muli kupokerapo chakurya kufuma kwa wabale panji kuwabweziwinu?
Enya 1 Yayi 2
e) Kasi imwe muli kuwapapo chakurya wabale winu panji wabwezi winu?
Enya 1 Yayi 2
f). Kasi muli kupokerapo vya kurya ku fuma uku? (Werengani ndipo mulime wasankhepo uko wali kupokerako chakurya)
Kugwira nchito kuti upokerepo chakurya Enya 1 Yayi 2 Ku purogiramu ya wane wachoko awo vyaka vyawo vindakwane 5 Enya 1 Yayi 2
Kufuma ku vya kurya ivyo wakupeleka wa boma panji tuma bungwe twakupambana-pambana
Enya 1 Yayi 2
Kasi kulipo kunyake uko muli kupokerako chakurya Enya 1 Yayi 2 6. Kasi kuyambira chaka chamala, muli kuchitapo chimoza cha ivi?
Mpauli apo muka yambila ivi?
Mwezi Kukwamba
Pakati Kuuma-liro
Kurya sima kamoza pa zuwa,? Enya 1 Yayi 2 1 2 3 Muli kuryapo chithibu? Enya 1 Yayi 2 1 2 3
Muli kuryapo gaga? Enya 1 Yayi 2 1 2 3 Muli kuryapo vipaso pera mwambule sima)? Enya 1 Yayi 2 1 2 3 Muli kuryapo mphangwe kwambula sima)? Enya 1 Yayi 2 1 2 3

Questionnaires in Chichewa and Tumbuka.doc 03/15/01 5:56 AM
7. Kasi yikafipo nyengo ya kuti Mwezi Pakwamba
Pakati Pauma-liro
Mukagulisapo viweto kuti mugule cha kurya? Enya 1 Yayi 2 1 2 3 Muli kugulisapo katundu wali yose kuti mugule chakurya? Enya 1 Yayi 2 1 2 3 Panji apo njala yikazozopa mukuryapo vipaso (ngati
masuku), nkhowane panji vinyake vili vyose Enya 1 Yayi 2 1 2 3
Sono tifika kufupi na kumaliro kwa kuchezga kwithu, kasi mungawa na timakani twakuti muyowoyepo? Umu ndiwo umaliro wa kuchezga kwa mlimi uyo wakaleka kupokera sitata paki. Pala mulimi wakapokera sitata paki, lutirirani kufumba ma fumbo gha pa Individual Questionaire
Pa umaliro penecho, muwongeni mulimi uyo mwa chezga naye.

Questionnaires in Chichewa and Tumbuka.doc 03/15/01 5:56 AM
TIP 2000-2001 EVALUATION
CHITEDZE RESEARCH STATION INDIVIDUAL QUESTIONNAIRE
FOOD PRODUCTION AND SECURITY EVALUATION
MODULE 1
CONFIDENTIAL AND ANONYMOUS PART A IDENTIFICATION PANEL
DISTRICT VILLAGE NAME VILLAGE CODE HOUSEHOLD NUMBER INDIVIDUAL NUMBER
Kodi muli ndi zaka zingati? Ngati mulimi sadziwa chaka chake chobwadwira,
chongani mu kabosi kali kumanjaku molingana ndi m’mene mukumuonera msinkhu wache
Zaka
Mwana 1
Wamkulu 2 Wokalamba 3 Mwamuna kapena mkazi?.........………………………… Mwamuna 1 Mkazi 2 Control panel
Name Date Enumerator Superviser Consultant Data entry clerk
Musanayambe kucheza nawo alimi, awuzeni kuti zonse zimene anene, zikhala za chinsinsi.
Ife tachokera ku Chitedze Research Station ndipo tikugwira ntchito iyi m’malo mwa University of Reading, yaku Mangalande. Zonse zimene mutiuze pano zikhala za chinsinsi, ndiye mukhale omasuka ndipo musaope kuti tikawauza ena. Chifukwa cha ichi, pano sitikufunsani kuti mutiuze dzina lanu; tikamacheza pano tizingokutchulani kuti Bambo kapena Mayi.
B. NTHAWI YOLANDIRA STATA PAKI

Questionnaires in Chichewa and Tumbuka.doc 03/15/01 5:56 AM
1. Kodi munabzala liti chimanga chanu (osati cha Stata Paki)?
(Lembani mwezi ndi kuchonga mukabosika)
Mwezi Koyamba 1
Mkati 2 mapeto 3 2. Kodi munalandira liti Stata Paki ? (Lembani mwezi ndi
kuchonga mukabosika)
Mwezi Koyamba 1
Mkati 2 mapeto 3 3. Kodi chimanga cha Stata Paki munabzala mwezi uti?
(Lembani mwezi ndi kuchonga mukabosika)
Mwezi Koyamba 1
mkati 2 mapeto 3 4. M’mene mukuonera inu, mukuganiza kuti Stata Paki munalandira nthawi yabwino poyerekeza ndi nthawi yobzalira?
Nthawi ya bwino 1
Mochedwa, koma tinabzala Mochedwa ndipo sitinabzale
2 3
5.Tchulani mwezi umene mufuna kuti muzilandira Stata Paki.
Mwezi
C. MAFUNSO OKHUDZA ZA STATA PAKI 1. Kodi munalandira matumba angati?:
Chimanga Soyabean Mtedza Feteleza (woyambira) Nyemba Fetileza (wobeleketsa)
2. Kodi matumba a Stata Paki munalandira akuoneka bwanji? (chongani mkabokosika) Osatsegula Otsegulidwa
koma zonse zili bwino
Otsegulidwa koma zina zitabedwa kapena
kuonongeka
Sindinala- ndire
Chimanga 1 2 3 4 Soyabean 1 2 3 4 Feteleza (wakuda) 1 2 3 4 Feteleza (woyera) 1 2 3 4

Questionnaires in Chichewa and Tumbuka.doc 03/15/01 5:56 AM
3. Kodi nanga “Kolite” yake inali bwanji?: (chongani mkabokosika)
Yabwino Yoyipa
Yoti sungagwiritse
ntchito Chimanga 1 1 1 Soyabean 2 2 2 Feteleza (wakuda) 3 3 3 Feteleza (woyera) 4 4 4 D. KAGWILITSIDWE NTCHITO KA STATA PAKI I. CHIMANGA 1. Kodi chimanga munachita nacho chiyani? (Chongani mumabokosi amene munatero) Ndinabzala chonse 1 Ndinachigulitsa 6 Ndinabzalako pang’ono 2 Ndinasunga 7 Ndinadya 3 Ndinampatsa wina 8 Ndinasinthitsa ndi chakudya 4 (Other, specify) Sindinalandire 5 2. Ngati simunabzale, kapena munabzala pang’ono pokha, chifukwa chiani? (Ngati munatero chongani mukabokosika)
Ndinalandira mochedwa 1 Ndinalibe malo oti nkubzalapo 2 Mbeu yake inali yowonongeka 3
Mtundu wake wa mbeu sindinaufune 4 3. Poyerekeza chimanga chonse chimene mwabzala chaka chino, chimanga cha Stata Paki chinali chochuluka bwanji? (Chongani kabokosi kamodzi basi)
Chonse Kupitilira theka
Theka ndi theka
Chokwanila 1/4 yokha
Pang’ono kweni-kweni
Sindinabzalepo
1 2 3 4 5 6 4. Munabzala bwanji chimanga chanu cha Stata Paki? (chongani mabokosi oyenera)
Chonse ndinabzala malo amodzi? 1 Ndinabzala patali patali? 2
Ndinapakiza? 3 Not applicable 4

Questionnaires in Chichewa and Tumbuka.doc 03/15/01 5:56 AM
5. Kodi chimanga chanu (osati cha Stata Paki) munachipeza kuti? a) Ndinachita chogula (Chongani kabokosi kamodzi basi)
Makilogramu angati (kg)
Ndalama zingati (MK)
Chimanga cha makolo 1 Chimanga chogula ku msika 2
Sindikudziwa 3 Sindinagule 4
b) Ndinasankha ku Nkhokwe (Chongani mabokosi oyenera)
Makilogramu angati (kg)
Chimanga cha Stata Paki wa chaka chatha 1 Chimanga cha Stata Paki chimene ndinasunga 2
Chimanga cha makolo 3 Chimanga chimene ndinagula chaka chatha 4 Chimanga chimene ndinalandira ku APIPI 5
Sindidziwa 6 Sindinasankhe cha munkhokwe 7
II. MTEDZA KAPENA SOYABEANS 1. Kodi mbeu ya mtedza/soyabean munayigwiritsa ntchito bwanji? (Chongani mabokosi oyenera) Ndinabzala zonse 1 Ndinagulitsa 6 Ndinabzala pang’ono 2 Ndinasunga 7 Ndinadya 3 Ndinampatsa wina 8 Ndinasinthitsa ndi chakudya 4 Other, specify Sindinalandire 5 Ngati munabzala zonse, yankhani funso No. 3
2. Ngati simunabzale kapena munabzala pang’ono pokha, ndi chifukwa chiani munatero? (Chongani mabokosi oyenera)
Ndinalandira mbeu mochedwa 1 Malo onse anali atatha 2
Mbeu yake inali yowonongeka 3 Mtundu wa mbeu yake sindinayifune 4
3. Poyerekeza ndi mbeu zina za soya kapena nyemba zimene mwabzala chaka chino, mbeu yanu ya soya/mtedza inali yochuluka bwanji? (Werengani zonse koma chongani bokosi limodzi)
Yonse Kuposa theka Theka ndi theka
Yokwanira 1/4 yokha
Pang’ono kweni-kweni
Sindinabzale
1 2 3 4 5 6

Questionnaires in Chichewa and Tumbuka.doc 03/15/01 5:56 AM
4. Kodi soya/mtedza munabzala malo amodzi? Eya 1 Ayi 2
5. Kodi soya/mtedza munabzala muchimanga? Eya 1 Ayi 2 III. FETELEZA 1. Kodi feteleza munagwiritsa ntchito yanji?(Chongani mabokosi oyenera) Wokulitsa (wakuda) Wobeleketsa (woyera) Ndinathira ku chimanga cha Stata Paki Eya 1 Ayi 2 Eya 1 Ayi 2 Ndinathira ku chimanga changa china Eya 1 Ayi 2 Eya 1 Ayi 2 Ndinathira mu mbeu zina, monga Eya 1 Ayi 2 Eya 1 Ayi 2 fodya, thonje etc.
Wokulitsa (wakuda) Wobeleketsa (woyera) Ndinawapatsa anthu ena Eya 1 Ayi 2 Eya 1 Ayi 2 Ndinagulitsa Eya 1 Ayi 2 Eya 1 Ayi 2 Ndinasunga Eya 1 Ayi 2 Eya 1 Ayi 2 Anandibela Eya 1 Ayi 2 Eya 1 Ayi 2 Other, specify
2. Ngati simunagwilitse ntchito feteleza wanu, chifukwa chiani? (Ngati munagwilitsa ntchito yankhani funso No.3)
Nthaka yanga siyifuna feteleza Eya 1 Ayi 2 Ndinagwilitsa ntchito manyowa Eya 1 Ayi 2
Ndinagulitsa kuti ndipeze ndalama Eya 1 Ayi 2 Ndinalandira mochedwa Eya 1 Ayi 2
Other (please specify) 3. Ngati munathira feteleza ku chimanga, munathila bwanji? (Chongani mabokosi osapitilira awiri)
Wokulitsa (wakuda) ndinathira payekha 1 Wobeleketsa (woyera) ndinathira payekha 2
Ndinasakaniza woyera ndi wakuda ndikukathila 3 (Ngati munaphatikiza feteleza, yankhani funso No. 3c) a) Ngati munathila woyambilira ku chimanga payekha, munathila liti?
Pobzala 1 Pasanathe milungu iwiri kuchokera pobzala 2
Patatha milungu inayi kuchokera pobzala 3 Sindinathile 4

Questionnaires in Chichewa and Tumbuka.doc 03/15/01 5:56 AM
b) Ngati munathila feteleza wobeleketsa ku chimanga payekha, munathila liti?
Pobzala 1 Patatha milungu iwiri chimanga chitamera 2 Patatha milungu itatu chimanga chitamera 3
Pakati pa milungu inayi ndi nthawi imene ngayaye zimatuluka 4 Ngayaye zitatuluka kale 5
Sindinathile 6 c) Ngati munasakaniza feteleza pothira ku chimanga, munathila nthawi yanji?
Patatha mulungu umodzi kuchokera pobzala
1
Patatha milungu inayi kuchokera pobzala 2 Mutapalila kamodzi koma ngayaye zisanatuluke 3
Ngayaye zitatuluka 4 Sindinathile 5
4. Kupatulako feteleza amene munalandira mu Stata Paki, kodi feteleza wina amene
munathira m’munda mwanu munampeza kuti? (Lembani ziro ngati simunapeze feteleza wina)
Wokulitsa Wobeleketsa
Ngongole kg kg Munagula nokha kg kg
Anakupatsani achibale kg kg
Munagula kwa ena amene analandira feteleza wa Stata Paki kg kg Munagwiritsa ntchito feteleza amene munasunga kg kg
Others (please specify) kg kg 5. Poyerekeza feteleza yense amene munathila m’munda mwanu chaka chino, feteleza wa Stata Paki anali wochuluka bwanji? (Chongani kabokosi kamodzi basi)
Yense Kuposa theka Theka ndi theka
Pafupi-fupi 1/4 Pang’ono chabe
Sindinathire
1 2 3 4 5 6 E. MBEU ZIMENE MWALANDIRA CHAKA CHINO 1. Kodi munazindikira kuti mbeu yimene mwalandira chaka chino ndiyosiyana ndi mbeu ya chimanaga imene munalandira mbuyomu?
Eya 1 Ayi 2

Questionnaires in Chichewa and Tumbuka.doc 03/15/01 5:56 AM
2. Ngati munazindikira, munadziwa bwanji kuti ndi yosiyana?(Chongani mabokosimu oyenera) ndi choncho)
Chikuoneka kuti ndichokonoka 1 Kapepala kananena kuti ndichosiyana 2
Ndinamva pa Wailesi 3 Anandiuza Mulangizi 4
Other 5 3. Kodi mukudziwa kuti mbeuyi mutha kubzala zaka zingapo koma ikubeleka bwino lomwe?
Eya 1 Ayi 2
Ngati yankho la E1 kapena E3 lili ayi, enumerator amuuze mlimi kuti mbeuyi ndi ya OPV; imene imabeleka zokolola ngati mbeu ya hybrid; ndipo mlimi atha kuibzala zaka zingapo isanathe mphamvu yobeleketsa, ndiponso ndi yokonoka.
F. MALINGALIRO A MULIMI Mumufunse mulimi kuti akutengeleni ku munda wake. Muli kumundako, mufunseni mafunso awa: 1. Kodi munda wanu uli potalika bwanji ?
km
(Pitani ndi mlimi kumunda kwache kumene wabzala Stata Paki, ndiye mumufunse mafunso
kuchokera No. 2 mpaka No. 8. Pokhapokhapo ngati nkosatheka kupita naye kumunda mufunseni mlimi mafunsowa pa nyumba pake.)
2. Kodi munda wanu umene mwabzala Stata Paki ndi waukulu bwanji?
Maekala
3. Pa mundawu, mukuyembekeza kukolora zochuluka chaka chino?
Eya 1 Ayi 2 Sindinabzale 3
(Ngati akuyembekezera kukolora zambiri, funsani funso No. 8) 4. Ngati sakuyembekeza kukolora zambiri, chifukwa chiani?
Feteleza anali wochepa 1 Tinalandira feteleza mochedwa 2
Mbeu inali yochepa 3 Tinalandira mbeu ya Stata Paki mochedwa 4
Mvula inachuluka chaka chino 5 Mvula inachepa chaka chino 6
Matenda achuluka 7 Ndinalibe munthu woti ndikundithandiza kulima 8
Ndimadwala 9 Other, please specify 10

Questionnaires in Chichewa and Tumbuka.doc 03/15/01 5:56 AM
5. M’mene tikuonela chimanga chanu cha Stata Paki, mukuganiza kuti zokolora zake zingalingane ndi za hybrid?
Chongani mukabokosika aka ngati simukudziwa 1 6. Mukuyembekeza kukolora soya/mtedza wambiri chaka chino?
Eya 1 Ayi 2 Didn’t plant 3
(Ngati ndi tero pitani pafunso No. 8) 7. Ngati sitero, ndi chifukwa chiyani zinthu zili choncho ? (Chongani mabokosi oyenera)
Feleteleza anali wochepa 1 Feteleza wa Stata Paki ndinalandila mochedwa 2
Mbeu inali yochepa 3 Mbeu ya Stata Paki ndinalandira mochedwa 4
Mvula inali yambiri 5 Mvula inali yochepa 6
Matenda ochuluka 7 Ndinalibe wondithandiza kulima m’munda) 8
Ndimadwala 9 Other, please specify 10
8. Mukuyembekeza kukolola matumba angati a 50 kg a soya/mtedza
Chongani bokosi ili ngati simudziwa 1 G. MAFUNSO A KAPEPALA NDI ULANGIZI WA ULIMI 1. Munalandira ka pepala kokuuzani umo mugwilitsire ntchito zimene mwalandira mu Stata paki
Eya 1 Ayi 2
2. Kodi kapepala kamene munalandira kanali bwino-bwino kapena kanali kowonongeka?
Kabwino 1 Kowonongeka 2
3. Kodi munatsatira malangizo a mupapelawa? Chimanga:
Mizere yotalikna 75cm (Pafupi-fupi.) Eya 1 Ayi 1 Mapando otalikirana 25cm (pafupi-fupi.) Eya 2 Ayi 2
Mbeu imodzi pa phando Eya 3 Ayi 3 Mtedza/soyabean 4. Kodi panali malangizo obzalira mbeu ya mtedza/soya? Eya 1 Ayi 2 5. Kodi malangizowo anali osabvuta powatsatira? Eya 1 Ayi 2 (Ngati anali osabvuta pitani ku funso No. 9) 6. Ngati anali obvuta powatsatira, ndi chifukwa chiani? (Chongani mabokosi oyenera)

Questionnaires in Chichewa and Tumbuka.doc 03/15/01 5:56 AM
Sindidziwa kuwelenga 1 Sindidziwa zimene malangizo amafuna kunena 2
Malangizo ake anali obvuta kuti ndiwatsatire 3 Sindinafune kuti nditsate malamulowo 4
Ndinalibe nthawi yotsatira malamulowo 5 Malamulowo sangwilizana ndi zimene ndimachita masiku onse 6
Kapepala kanali kowonongeka 7 Other, please specify 8
7. Kodi mumakumana kangati ndi alangizi anu a zaulimi? (Chongani kabokosi kamodzi)
Sindinakumane nawo 1 Timakumana pa kanthawi 2
Timakumana kamodzi pa mulungu 3 Timakumana kamodzi pakatha milungu iwiri 4
Timakumana kamodzi pakatha mwezi 5 8. Kodi chaka chino mwauonapo munda wa chitsanzo wa Stata Paki? Eya 1 Ayi 2 9. Kodi munalandirapo zinthu izi mu Stata Paki yanu?
Kapepala konena nkhani ya HIV/AIDS Eya 1 Ayi 2 Kondomu ya Chishango Eya 1 Ayi 2
10. Kodi ndi bwino kuti azipeleka timapepala tonena nkhani ya Edzi mu Stata Paki?
Eya 1 Ayi 2
11. Kodi ndi bwino kuti azipeleka kondomu ya chishango mu Stata Paki?
Eya 1 Ayi 2
Apa ndi pothera pocheza ndi mlimi
Kumbukilani kumuthokoza mulimi
Mafunso oyankhidwa ndi Enumerator akatsiliza kucheza ndi mlimi: 1 Kodi munakafikako kumunda wa mulimi? Eya 1 Ayi 2
2. Ngati simunapiteko, chifukwa chiani?

Questionnaires in Chichewa and Tumbuka.doc 03/15/01 5:56 AM
TIP 2000-2001 EVALUATION
CHITEDZE RESEARCH STATION INDIVIDUAL QUESTIONNAIRE
FOOD PRODUCTION AND SECURITY EVALUATION
MODULE 1
CONFIDENTIAL AND ANONYMOUS
PART A IDENTIFICATION PANEL
DISTRICT VILLAGE NAME VILLAGE CODE HOUSEHOLD NUMBER INDIVIDUAL NUMBER
Kasi mukawa pa uli? (Pala awo mukuwafumba wakumanya yayi virimika
vyawo, mushonge tu ma bokosi kwakuyaniskana naumo munga-ghanaghara umo walili)
Vyaka
Munyamata 1
Doda 2
Mudala 3
Kasi nimwanakazi panja mwanalume? Mwanalume
1 Mwanakazi
2 Control panel
Name Date Enumerator Superviser Consultant Data entry clerk
Pambere mundayambe kuchezga na walime, muwazge mazgo agha: Ise tikugwira nchito ku Chitedze Research Station mumalo mwa wanyithu wa ku Univerite ya Reading ku Mangalande. vyose ivyo tidumbiskanenge pano, vyatekha-tekha, nakuti ise tamuyowoyaso na munthu munyake chara, panji ku runura zina linu nanyengo na yimoza yayi. Ichi ndicho chifukwa chake tikhumbenge kuti mutiphalire zina lino yayi. Vyose ivyo tiyowoyenge vya chisisi pera.

Questionnaires in Chichewa and Tumbuka.doc 03/15/01 5:56 AM
B. MAFIKIRO GHA SITATA PAKI 1.Kasi vingoma vinu na vinu, vya imwe mwawene, muliku
pandapo? Pala muli kupanda, mukapanda pa uli? (Lembani mwezi, ndipo muchonge kuti kasi mpa kwamba, pakuti, panji kuumaliro wa mwezi)
Mwezi
Kukwamba 1
Pakati 2 Kuumaliro 3 2. Kasi Sitata Paki mukapokera pa uli? (Lembani mwizi, ndipo
muchonge kuti kasi mpha kwamba, pakati panja pa umaliro wa mwezi)
Mwezi
Pakwamba 1
Pakati 2 Kuumaliro 3 3. Kasi mukapokera Sitata Paki chaka chino? Pala mukapokera,
mukapanda pa uli?(Lembani mwezi, ndipo muchonge kuti kasi mpakwamba, pakati panji pa umaliro wa mwezi)
Mwezi
Pakwamba 1
Pakati 2 Kuumaliro 3
Yakiza pa nyengo 1 Yikachedwa kweni nili kupanda 2
4. Kasi Sitata Paki yikiza uli pa kulinganizga na umo mukupandira vingoma nyengo zose mwawenecho?
Yikachedwe chomeni ndipo nindaponde 3
5. Nanga mpha mwezi uli umo mukughana ghana imwe kuti wamupileninge Sitata
Paki?
Mwezi C. CONTENT OF THE PACK 1. Kasi mukapokera tuma bagi tumalinga twa mbeu na feteleza ivyo vikawa mu thumba likulu la Sitata Paki.
Vingoma Soya) Skawa Feteleza wakwamba wakukuliska )
Nchunga Feteleza wakubakiska) 2. Kasi tumabag tuchokotuchoko uli mukapokera tukawa uli?(Chongani mutumabosi twa kwenerera) Kakujalik
a Kakujulika ndipo vyamu kati ikamwa makora
Kakujulika ndipo vyamukati vyakwana panjo kusowa
Nkumanga chara
Vingoma 1 2 3 4 Skawa panji soya 1 2 3 4 Feteleza wakukuliska) 1 2 3 4 Feteleza wakubabiska 1 2 3 4

Questionnaires in Chichewa and Tumbuka.doc 03/15/01 5:56 AM
3. Pakughana ghana kwa imwe, kasi vinthu ivyo vikawa mu sitata paki vikawone kanga uli? (Chongani kabokosi ka kwenerera) Vikawa
makora Vikawa makora viwi yayi
Vyakwa-nangika
Vikuni-nkhwaskayayi
Vingoma 1 2 3 4 Nchunga panji soya 1 2 3 4 Feteleza waku kuliska 1 2 3 4 Feteleza wakubabiska 1 2 3 4 D. KAGWIRISKIRO NCHITO KA SITATA PAKI I. VINGOMA 1. Kasi mbeu ya vingoma mukachita nayo vichi? (Chonganipo ivyo vikachitika) Mukapanda vyose
1 Mukagulisa 6
Muli kupandapo mbeu zinyake
2 Muli kusunga 7
Muri kunja 3 Muli kupa wanthu wanyake
8
Mukusinthiska na vyakurya 4 Panji muli kuchita nayo uli?
Mukapokera yayi 5 2. Pala mbeu ya vingoma vya sitata paki mundapande, panji muli kupandapo yichoko waka, tiphalireni chifukwa chake? (Munga chonga tunandi kwa ku yaniskana na umo wazgorera mulimi)
Mbeu yikiza mwa kuchedwa chomeni 1 Malo ghakulimapo nilije 2
Mbeu yikawa yakwanangike 3 Mtundu wake wa mbeu nikautemwa yayi 4
3. Kasi unandi wake wa mbeu vingoma mu ya sitata paki ukawa uli pa ku yaniskana na mbeu iyo mukapanda imwe mwawenecho? (Chongani ba bokosi kamoza pera)
Yose yikara ya sitata paki
Kujumpha hafu
Vyakuyane wake
panji kota1/4 Pachoko chomene
Nkapoka sitata paki
yayi 1 2 3 4 5 6
4. Kasi vingoma vya sitata paki mukavipanda uli?(Chongani kwa kuyaniskana na umo wa zgorera munthu)
Nkapanda vyose mbeu ya sitata paki pa puloti limozi 1 Nkapanda pa malo ghakulu kujumpha ghala wakayowoya wa sambizgi ? 2
Nkapanda mumunda wose umo vingoma vyane vikafwamo? 3

Questionnaires in Chichewa and Tumbuka.doc 03/15/01 5:56 AM
Panji, ivi kuti vikuninkhwaska yayi 4 5. Kasi mbeu ya vingoma iyo mukapanda yinu na yinu, mukayitolankhu? a) Pala mukagula (Chongani ngati niumo wa zgoerea)
Unandi wake (kg)
Mutenfo (MK)
Vingoma vya lokolo 1 Vingoma vyakuchita gula ku musika, nget Hybrid,
composite 2
Nkhumanya chara 3 Nkhagula yayi 4
b) Vingoma vya nyengo zose (Chongani kwa kuyane sikana na umo wazgorera munthu)
Hou mudi (kg) Napanda vingoma vya sitata paki wa chaka chamala 1 Napanda sitata paki uyo nkasunga wachaka chamala 2
Napanda vingoma ma vyane mavyane va lokolo 3 Napanda vingoma vyane na vyane ivyo nikasunga chaka chamala 4
Napanda vingoma ivyo nikagula ku ADMARC 5 Napanda vingoma vya chaka chamala ivyo nikapoka ku maprogiramu
ghanyake, negeti ni APIP nkumanya chara 6
Nkupanda vingoma vyane yayi, chifukwi chakuti nkhugula vingoma vya mbeu chaka na chaka
7
II. NCHUNGA NA SOYA 1. Kasi mbeu ya nchunga na soya muli kuyigwiriska uli nchito? (Chongani na umo wazgorera munthu) Mukapanda vyose 1 Mukagulisa 6 Muli kupandapo mbeu zinyake
2 Muli kusunga 7
Muri kurya 3 Muli kupa wanthu wanyake
8
Mukusinthiska na vyakurya 4 Panji muli kuchita nayo uli?
Mukapokera yayi 5 Pala munthu wakapanda vyose nchunga na soya, bwenu lutani ku fumbo la namabla 3.
Pala yayi lutani ku nambala 2. 2. Pala mbeu ya Sitata paki ya nchunga na soya mundapande, panji muli mukupandape pachoko waka, mutiphalire chifukwa chake.? (Chongani kwa kuyaniskana na umo wazgorera munthu)
Mbeu yikiza mwa kuchedwa chomene 1 Malo ghakulimapo nilije 2
Mbeu yikawa yakwanangike 3

Questionnaires in Chichewa and Tumbuka.doc 03/15/01 5:56 AM
Mtundu wake wambue nikautemwa yayi 4 3. Kasi unandi wake wa mbeu ya nchunga na soya mu Sitata Paki ukawa uli pakuya niskama nambeu iyo mukapanda, mukapanda imwe mwa wenecho? ? (Wazgani mazyose ghose, kweni chongani kamoza pera) Yose yikawa ya Sitata Paki
Kujumpha hafu
Vyakuyane waka
Panji kota 1/4 Pachoko chomeni
Nkapoka Sitata Paki
yayi 1 2 3 4 5 6
4. Kasi nchunga na soya mukapanda mamalo ghamoza ugeti ni umo wakayowoyera wa sambizgi wa vya ulimi?
Enya 1 Yayi 2
5. Kasi nchunga na soya mukapanda pamoza na vingoma? Enya 1 Yayi 2 III. FETELEZA 1. Kasi feteleza uyo mukapokera, muli kuchita nayo vichi? (Chongani kwakuyaniskane na umo wazgorera munthu) Feteleza wakukuliska Feteleza wakubabiska Nkathira yose kuvingoma vya sitata paki Enya 1 Yayi 2 Enya 1 Yayi 2 Nkhathira ku vingoma vinyake ivyo nikapanda mumunda wane
Enya 1 Yayi 2 Enya 1 Yayi 2
Nkhathira ku mbuto zinyake za mumunda wane
Enya 1 Yayi 2 Enya 1 Yayi 2
(Pala zgoro ndakuti mukhothira ku mbuto zinyake, mbuto izi ni vichi)?
Feteleza wakukuliska Feteleza wakubabiska Nkapeleka kuwanthu Enya 1 Yayi 2 Enya 1 Yayi 2 Nkagulisa Enya 1 Yayi 2 Enya 1 Yayi 2 Nkasunga Enay 1 Yayi 2 Enya 1 Yayi 2 Wanthu wakanibera Enya 1 Yayi 2 Enay 1 Yayi 2 Panji nthawi zinyake izo mukachita nayo feteleza ni vichi?
2. Pala mukaleka kuthira feteleza wa sitata paki, mukachitachi nayo?(Pala munthu uyu wakathire feteleza, lutani ku fumbo nambala 3)
Munda wane uli na vundira kale Enya 1 Yayi 2 Mumunda wane nkhuthiramo manyowa pera Enya 1 Yayi 2
Nkakhumbanga ndarama, soni nili kugulisa Enya 1 Yayi 2 Feteleza waka chedwa chomene sononindagwiriske nchito Enya 1 Yayi 2
Vilipo vinyake ivyo muli kuchita nayo feteleza

Questionnaires in Chichewa and Tumbuka.doc 03/15/01 5:56 AM
3. Pala mukathira feteleza kuvingoma, feteleza uyu mukathira uli? (Chongani zgon limoza panji ghawiri pera)
Nkathira wakukuliska vingoma pa yekha 1 Nkathira wakubabiska vingoma pa yekha 2
Mkasazga wakakuliska na wakubabiska 3 (Pala munthu uyu wakathira feteleza wakusazga, lutani ku chigawa chachitatu,c) a) Pala mukathira feteleza wakukuliska ku vingoma, mukathira uli?
Nkhathira panyengo yakupandira vingoma 1 Pakati pa sabata yimoza na ziwili zakupandira 2
Pakati pa jumpha ma sabata ghatatu panji ghanayi kufuma apo nkapandira 3 Nkhathira yayi feteleza wane 4
b) Pala mukathira feteleza wakubabiskira ku vingoma, mkathira nyengo uli?
Nyengo ya ku panda vingoma 1 Vingoma vyati vyamera ndipo pa kumpha masbata ghawiri 2
Poti pajumpha masabata ghatatu na umo nikapandira vingoma 3 Apo kukati kwa khala masabata ghanayi kuti vingoma vinda fume 4
Vingoma vya fuma 5 Nhathira yayi 6
c) Pala mukathira feteleza akusazga ku vingoma, mukathira nyengo nji? (Pala mulimi wa kaskazga yayi feteleza, lutani ku fumbo nambala 4)
Sbata yimoza yindamale kufuma apo nkapandira 1 Pakati pakumera nama sabata ghanayi fufuma apo nikapandira panyengo yake
hata(kupalira) 2
Apo nikati namala kuhata (kupalira) kweni pambere vinda fume vingoma 3 Ndipo vingoma vya fuma 4
Nkhathira yayi fetleza 5 4. Kasi feteleza munyake, pa chanya pa feteleza wa Sitata Paki, mukagulaposo? Pala
mukagulapa, mukakagula nkhuni. (Mulembepo ziro pala munthu wakagulaposo feteleza munyake yayi)
Wakukulliska Wakubasiska
Pa ngongole kg kg Ndarama zane kg kg
Wakanipa wabale kg kg
Nkhagula ku wanthu awa wakapokera sitata paki kg kg Wakawe feteleza uyo nkhasunga wa sitata paki ya chaka
chamala kg kg
(Munyake waka fuma nkhuni) kg kg

Questionnaires in Chichewa and Tumbuka.doc 03/15/01 5:56 AM
5. Kasi unandi wake wa feteleza uyo muli kuthira wa sitata paki wakawa uli pa kuyaniskana na feteleza yose uyo muli kuthira mumunda winu? (Chongani kamoza pera) Yose yikari ya
sitata paki Kujumpha
hafu Vyakuyane
wake Panji kota
1/4 pachoko chomeni
Nkapoka sitata paki
yayi 1 2 3 4 5 6
E. MBEU YAKU TCHOKOLEKA YA VINGOMA 1. Kasi muli kuwonapo mphambano pakati pa mbuto ya mbeu ya chaka chino na chaka chamala?
Enya 1 Yayi 2
2. Pala mphambano mukayiwona, chivichi icho chikamumanyiskani kuti pali mphambano? (Chongani mabokosi kwakuyaniskane na umo wazgoerea munthu)
Chikuwoneka kuti ngati nchakotchokoleka 1 Nkhamanya chifukwa chakuti ndivyo vikalembeka pakapela ako kakawa mukati 2
Nkapulika pa radiyo 3 Wasambizgi withu wa vya ulimi wakaniphalira 4
Kasi chifukwa chinyake chilipo icho mukamanyira kuti mbuto zakupambana 5 3. Kasi mukumanya kuti mbuto ya sitata paki yachaka chino yikukozgana na ya lokolo ?
Enay 1 Yayi 2
Pala mazgoro kumafumbo ghapachanya ndakuti yayi, imwe mukufumba mafumbo mulime mulongosoloerni mulimi kupambana kwa hayibulidi na mbeyu sono ya sitata paki iyo yikukozgana nalokolo. Mulongosole kuti mbuto ya vingoma ya chaka chino yikukozgona na lokolo, kweni yikupambika mwakuyana na hayibulidi, ndipo munthu kuti wakugula mbeu chaka na chaka yayi ngati niumo tikachitira na hayibulidi, ndipo mbuto yake nga kutchokorera ngeti vingoma vya lokolo.
F. UMO WAKUWONERA MBUTO KUMUNDA WALIMI 1. Kasi pala mamayilosi ghalinga apo muli ku panda mbuto ya sitata paki?
km
Pala kumunda uko wali ku panda mbeu ya sitata paki mpafuki, lutani kwene kuko kumunda ndipo
mulime mukamufumbire ma fumbo nambala 2 - 8 kwenekuko kumunda. Pala kumunda nkutali, fumbani ma fumbo apgha panyumba penepapa.
2. Kasi munda winu uli na ma ekala ghalinga?? Ekala 3. Kasi mukugomezga kuti mukololenge vingoma vinandi chaka chino panji yayi?
Enya 1 Yayi 2 nkhumanya yayi 3
(Pala mulimi wazgora kuti Enya, mbwenu lutani ku fumbo namabla 8).

Questionnaires in Chichewa and Tumbuka.doc 03/15/01 5:56 AM
Pala yayi lutani ku fumbo nambala 4. 4. Pala yayi, chifukwa uli? (Chongani tose kuyaniskana na umo wazgorera mulimi)
Feteleza yose wakawa wakuchepa 1 Feteleza wa sitata paki wakachedwa kwiza 2
Mbeu yose yikawa ya kuchepa 3 Mbeu ya sitata paki yikachedwa 4
Vula yikawa yinandi chomene 5 Vula yikawa ya kuchepa 6
Chifukwa cha vibenene na matenda 7 Nkhongono zikawa za kuchepa tawanthu tiri wachoko 8
Nkaluwalonga 9 Yowoyani vifukwa vinyake 10
5. Kasi mukughanaghana kuti mukolorenge ma thumba ghalinga vingoma gha 50kg?
Pala mulimi wakumanya yayi, changani apa 1 6. Kasi mukugomezga kuti mukolorenge makora mbuto yinu ya nchunga na soya chaka chino?
Enya 1 Yayi 2 Nkhumanya yayi 3
(Pala mulimi wakumanya lutani ku fumbo nambala 8. Pala yayi, lutani fumbo nambala 7) 7. Pala yayi, chifukwa uli? (Chonani vyose ivyo wazumula mulimi)
Feteleza yose wakawa wakuchepa 1 Feteleza wa sitata paki wakachedwa kwiza 2
Mbeu yose yikawa ya kuchepa 3 Mbeu ya sitata paki yi kachedwa 4
Vula yikawa yinandi chomene 5 Vula yikawa yakuchepa 6
Chifukwa cha vibenene na matenda 7 Nkhongono zikawa za kuchepa tawanthu tiri wachoko) 8
Nkaluwalanga 9 Yowoyani vifukwa vinyake 10
8. Kasi mukuzomerga kuti mukolorenge ma thumba ghalonga gha 50kg gha nchunga na sota chaka chino?
Pala mulimi wakumanya yayi, chongani apa 1 G. TUMAPEPALA TWAKULONGOSOLA VYA MUKATI MWASITATAT PAKI 1. Kasi kapepala kakulongosola umo mupandirenge mbeu ya sitata paki mukapokera?
Enya 1 Yayi 2
2. Kasi timapepala utu tukawonekanga uli?
Tukawa makora 1

Questionnaires in Chichewa and Tumbuka.doc 03/15/01 5:56 AM
Tukawa twakukeluke 2 3. Kasi mafumbo mukaghalondezga makora na umo wakafumbira pa kachipepala? Kupanda vingoma wakati:
Mizere yiwe 75 centimitala kufuma pa unyake kufika pa unyake) Enya 1 Yayi 2 Mabawa ghakupanda limoza kufika panyake Enya 1 Yayi 2
Chingowe chimoza pa bawu limoza Enya 1 Yayi 2 4. Kasi kachipepala ka kulongosola umo mungapandira nchunga na soya kakawamo?
Enya 1 Yayi 2
5. Kasi mukachisanga chipusu kulondezga ivyo wakalemba pakapepala?
Yes 1 No 2
(Pala Enya, lutani kufumbo namabla 9. pala yayi lutani ku fumbo nambala 6) 6. Pala yayi, chifukwa? (Chongani kwakuyaniskana na umo wazgorera mulimi)
Nkhumanya yayi kuwazga 1 Nkhalondezga makora yayi vyo vikalembeka 2
Ivyo vikalembeka vikawa vinandi nakuti vikawa vya kuvuska 3 Nkakhumba yayi kulondezga ivyo vikalembeka 4
Nyengo nkawavye yakuwazgira kapepala 5 Ivyo vikalembeka vikupambana na ivyo wasambizi withu wali kutisambizga 6
Kachipepala kakawa kakukeluka 7 Pala chifukwa chiyani chilipo, ni vichi? 8
7. Kasi wa sambizgiwa ugiri kacala mukukumana nawo kalinga? (Chongani kamoza pela)
Tikukumana nawo yayi 1 Panyengo-panyengo 2
Kamoza pa sabata 3 Kamoza pa masabata ghawiri 4
Kamoza pa mwezi 5 8. Kasi muli kuwonapo ka munda ka chiwoneskero umo mukwenera ku pandira mbeu za sitata paki?
Enya 1 Yayi 2
9. Kasi mukapokerapo kamoza ka ivi?
Kapepala ka kulongosola za HIV/AIDS Enya 1 Yayi 2 Chishango Enya 1 Yayi 2
10. Kasi nchiweni panji yayi kuti mu sitata paki wacwikengemo malingizgo gha za HIV/AIDS?
Enya 1 Yayi 2
Uwu ndiwo umaliro wkuchezga kwithu kumbukirani kuwonga mulimi uyo mwa
chezganga nayo

Questionnaires in Chichewa and Tumbuka.doc 03/15/01 5:56 AM
Pala enumerator wamala kuchezga namulimi, wazgore yekha mafumbo agha
1 Kasi mwanguluta ku munda uko mulimi wakalima mbeu ya sitata paki?
Enya 1 Yayi 2
2. Pala yayi, chifukwa ni vichi?


Appendix 4: Terms of Reference
100

ANNEX 1 : TERMS OF REFERENCE CONTACT NAME: 2000-01 TIP Evaluation Module 1: Food Production and Security. CONTRACT NUMBER: MAL/ 2001 APPENDIX 1: The Services Under the Contract for Module 1 Consultants shall provide the services outlined in the following Terms of Reference to the Lilongwe office of the Department for International Development (DFID) of the United Kingdom. Basic Information Module 1: Food Production and Security is part of the Evaluation Programme for the 2000-01 Targeted Inputs Programme (TIP). The Statistical Services Centre (SSC) of the University of Reading, United Kingdom, is managing the 2000-01 TIP Evaluation for DFID-Lilongwe. Background The 2000-01 TIP, a component of Malawi’s National Safety Net Strategy, intended to provide 1.5 million rural smallholder households with one Starter Pack containing 0.1 ha-worth of fertiliser, open pollinated variety maize seed and legume seed in the time of start of the rains. The TIP campaign follows on from the Starter Pack (SP) campaigns in 1998-99 and 1999-2000. A key objective of the TIP campaign is to increase household food security amongst rural smallholders in Malawi. The 1998-99 and 1999-2000 SP campaigns (SP1 and SP2) were designed to cover all rural smallholder households, providing 2.86 million packs. This year’s TIP targeted roughly half this number of beneficiaries. TIP 2000-01 is envisaged as a programme for transferring resources to poor households. The 1999-2000 Starter Pack Evaluation Module 1 survey set out to assess the contribution of Starter pack to staple food production in 1998-99. It also examined farmers’ use of Starter pack inputs in the 1999-2000 season. In the 1999-2000 Starter pack Evaluation, Module 2 contained similar questions to the Module 1 study on staple food production in 1998-99 and included farmers’ production forecasts for 1999-2000. In addition, last year’s Module 2 survey measured months household food security in 1998-99. Overall Objectives Module 1: Food Production and Security will provide forecasts for the TIP’s contribution to national food production, as well as showing how the inputs contained in the TIP packs were used. It will also estimate the contribution of SP2 to household food security. In view of the targeted nature of the TIP, the module will compare the expected food production of recipients with that of non-recipients in different poverty categories. Scope of Work The Food Production and Security module will comprise a nation-wide survey of pack recipients and non-recipients focusing on national food production in SP2 and TIP 2000-01 and on household food security inSP2. the food security section of the household questionnaire will include a series of questions designed to throw light on the difference between months of household food self-sufficiency (attributable to Starter Pack inputs and other own-farm production) and total months of household food security/insecurity. The SP1 Evaluation set out to measure ‘incremental yield’ from Starter Pack plots by comparing plots on which Starter Pack seed been planted according to instructions with adjacent non-Starter Pack plot. The SP2 Evaluation adopted a different approach, based on the view that the comparison between the perfect Starter pack plot and a perfect ‘control’ plot was an artificial construct, since farmers had in fact used the Starter Pack inputs in different ways, often spread them beyond the 0.1ha SP1 suggested that many farmers used fertilizer from other sources on their (non-starter Pack) maize crops. Thus, an

attempted to measure the incremental yield attributable to Starter Pack as if under experimental conditions would not be accurate enough to merit the high cost of the exercise. 4.3 Instead, the SP2 Evaluation decided to accept the multi-dimensional aspects of the use of inputs and impact of Starter Pack. It did not aim for high levels of precision, but looked for trends and others of magnitude. The consultants for Module 1 of the 2000-01 TIP Evaluation will use the SP2 Evaluation approach. At the center of this approach is the idea that we should triangulate the results from different methods. The different methods to be used are: • year-to-year comparisons • comparisons between recipients and non-recipients (the’ control group’) • farmers’ perceptions and experience. The 2000-01 TIP is distributing open pollinating variety (OPV) maize seed. This has the advantage that the seed can be saved and planted in future season. The Food Production and Security module will include questions to establish whether the farmers are aware of the different properties of this types of seed, and whether this affects their production forecasts for 2000-01. Methodology/Approach The work for Module 1 will be carried out as stipulated in the Schedule of Activities agreed with the SSC (see Appendix 2) and according to the Budget (see Appendix 3). The work will consist of the phases: Phase 1 will comprise questionnaire design, pre-testing and finalisation sampling to select sites for the main fieldwork phase; and recruitment and training of field personnel. As part of preparation for training, the Consultants will translate the questionnaires into Chichewa and Tumbuka and will prepare a field manual with clear instructions for field supervisors and enumerators sampling procedures and questionnaire administration. Phase 2 ( the main fieldwork phase) will take the form of a survey to be carried out in 108 sites, which will be selected by agreement between the Consultants and the SSC. Four sites will be selected at random within each of the 27 districts of Malawi. In each case site, the Consultants’ team will interview the heads of 30 households, selected at random, and any other member of the household who receive a TIP. A strict system of supervision will be implemented by the Consultant to ensure the quality of the fieldwork results. Phase 3 will comprise data entry, analysis and writing up of the final report (“the Report”), as well as presentation of results at the final workshop of the 2000-01 TIP Evaluation, to be held shortly after the end of the project. The questionnaires will be modified versions parts of the 1999-2000 starter Pack Evaluation Module 1 household and individual questionnaires and of the Module 2 household questionnaire. They will include sections designed to collect data on livelihood assets, landholdings size and area cultivated. Parts of last year’s Module 1 and Module 2 questionnaires will not need to be repeated, while others be altered to reflect the nature of the TIP, in particular, its poverty targeting objective and the use of OPV maize seed. As the 2000-01 TIP Evaluation comprises a set of modules, the Consultants for Module 1 may be required to coordinate with consultants from other modules. Such Coordination will be facilitated by the SSC. The Consultants may be asked to incorporate questions of interest to other modules, and they should attempt to accommodate such requests wherever possible. The Consultants will play a leading role in carrying out the study and presenting the results, but should accept reasonable advice and guidance from the SSC on methodological issues. Personnel The Consultants for Module 1 are: Dr Pickford K. Sibale (the Team Leader, Dr A.M. Chirembo, Dr A.R. Saka and Mr V.O. Lungu.

The Consultants will recruit and manage 9 supervisors and 27 enumerators for the main fieldwork phase. Each supervisor will be responsible for 3 enumerators and 12 sites. Since supervisors will require motorbikes to carry out their work in an efficient and timely manner, access to a motorbike will be a condition of their recruitment (except in areas where public transport provides an adequate alternative). The Consultants will train the supervisors and enumerators to a high standard and supervise them closely. For the fieldwork phase, the Team Leader and two other Consultants will form a team of three Field Coordinators. Each of the three Field Coordinators will be responsible for supervising group of three supervisors and nine enumerators to ensure that their work is of good quality. For data entry, Consultants will recruit ten qualified data entry clerk and a data entry supervisor. The Consultants will manage the data entry personnel to ensure a high standard of performance. Expected Outcome and Deliverables The study will provide evidence on: • Staple food production in 1999-2000 and production forecasts for 2000-01. • Months household food self-sufficiency and food security in 1999-2000. • How and where the maize and legume seeds were planted in 2000-01 and how the fertilizer was
used (usage of TIP inputs). • Whether farmers received the leaflets accompanying the pack, and whether they understood them. • If farmers did not use the packs as instructed, why? • What proportion of the farmers’ gardens received TIP inputs compared with inputs from other
sources? • How was the use of the Starter Pack affected by the delivery of the packs, especially its timing? • How was the use of the Starter Packs affected by the content of the packs? • Farmers’ perceptions of the state of their maize and legume crops, including the perceived reasons
for the state of these crops. Results should be presented at national and regional levels, with breakdowns at sub-regional levels where appropriate. The data from Modules 1 and 2 of the 1999-2000 starter Pack Evaluation Programme should be used as a baseline, and comparisons should be made where relevant. Since the sample will not be proportional to population size, the Consultants will use a weighting system (using census information on population by district) to scale up the results to give regional and national estimates. The analysis of TIP recipient and non-recipients groups will be carried out for different categories of household according to size of household, poverty level, gender of household head, landholding size and area cultivated. The SSC has developed a livelihood assets-based poverty index for rural Malawi from the work undertaken for the 1999-2000 Starter Pack Evaluation. This index should be used by the Consultants for Module 1 of the 2000-01 TIP Evaluation to show their results by poverty categories. The main outcome of the work will be the Report. This should be around 20,000 words long and must be submitted to Dr H. Potter, DFID, British High commission, P.O. Box 30042 Lilongwe 3. Malawi on diskette and had copy by 6 July 2001, with copies to the SSC. In the Report, the Consultants will analyse the interpret the information collected and suggested possible conclusion, setting out clearly their assumptions and arguing whether the evidence collected can be used to confirm or reject these assumptions. The Consultants should differentiate between conclusive and suggestive evidence. Primary data gathered under the Contract must be computerized and full, clean copies of these raw data files, with a detailed explanation of their contents, must be delivered to the SSC on diskette by 6 July 2001. Full copies of questionnaires and other data collection tools must also be provided. The final installment of payment under the Contract will be payable on acceptane by the SSC of the Report. Should the SSC require any reasonable amendments or additions to the Report in order that the Report shall meet the required professional standards for acceptance, the Consultants will carry out such work at no extra charge by 31 July 2001.

The Consultants will incur financial penalties for the late delivery of the 5% of the Consultants’ fee will be deducted if the Report is received by DFID after 6th July 2001, rising to 15% if the Report is received by DFID after 13th July 2001 and 30% if the Report is received by DFID after 20th July 2001. The Team Leader will submit brief progress reports and accounts of expenditure to the SSC on 19th March, 20th April and 18th May 2001, and will present final accounts on 6th July 2001. The accounts of expenditure should be presented according to the stipulated in Appendix 4.


Appendix 5: List of villages visited
105

VILLAGE SECTION EPA DISTRICT RDP 1 Mpalaskaba Kopakopa Chitipa South Chitipa Chitipa 2 Adam Kamene Damasika Chitipa North Chitipa Chitipa 3 Adam Sokola Misuku Chitipa Chitipa 4 Amon Kakomo Misuku Chitipa Chitipa 5 Mwakikome Ngana Kaporo North Karonga Karonga 6 Amos Mwenechilanga Wiliro Karonga Centre Karonga Karonga 7 Benjamin Chawinga Ujiji Kaporo North Karonga Karonga 8 Bunganilo 1 Nyungwe 2 Karonga South Karonga Karonga 9 Amosi Jere Emfeni Emfeni Mzimba South Mzimba
10 Aaron Mvula Engucwini Bwengu Mzimba Rumphi North Mzimba 11 Aaron Hara Njoka Manyamula Mzimba Central Mzimba 12 Aaron Nqumayo Emtiyani Njuyu Mzimba Central Mzimba 13 Mkuonda Chituka Chintheche Nkhata Bay Nkhata Bay 14 Berewa Chombe Nkhata Bay Nkhata Bay Nkhata Bay 15 Bulukutu Kalwe Mpamba Nkhata Bay Nkhata Bay 16 Bwanthuwa Thanula Mpamba Nkhata Bay Nkhata Bay 17 Matendevu Bata Bolero Rumphi Rumphi North Mzimba 18 Baghaya Ng'onga South Muhuju Rumphi Rumphi North Mzimba 19 Bingo Mphompha A Mphompha Rumphi Rumphi North Mzimba 20 Bingo Chimyanga Muhuju Rumphi Rumphi North Mzimba 21 Kuchingoli Makwinja Kaphuka Dedza Dedza Hills 22 Abraham Bolera Mtakataka Dedza Bwanje Valley 23 Ajibu Monje Mayani Dedza Dedza Hills 24 Aliberito 1 Kamenyagwaza Bembeke Dedza Dedza Hills 25 Goma Mtengowanthenga Chibvala Dowa Dowa East 26 Bakali Matekwe Mponela Dowa Dowa West 27 Banga Mbangala Chisepo Dowa Dowa West 28 Bazale Kumphela Mndolera Dowa Dowa West 29 Katchembere Chipala Chipala Kasungu Kasungu 30 Adam Mphonde Mkhota A Santhe Kasungu Kasungu 31 Amoni Chaima North Santhe Kasungu Kasungu 32 Aramu Kaluluma Central Kaluluma Kasungu Kasungu 33 Kalamula Mlezi Chigonthi Lilongwe Lilongwe East 34 Abrahamu Kalima Mpingu Lilongwe Lilongwe West 35 Akaleamadziwana Mthilira Thawale Lilongwe Lilongwe West 36 Amidu Malangalanga Ming'ongo Lilongwe Lilongwe West 37 Chiluzi Kapiri South Kalulu Mchinji Mchinji 38 Abiyuti Kamwendo East Chioshya Mchinji Mchinji 39 Abulamu Zali Mikundi Mchinji Mchinji 40 Amtonia Nkhwazi North Msitu Mchinji Mchinji 41 Sitima Mphandamadzi Mwansambo Nkhotakota Nkhotakota 42 Aaroni Msenjere Nkhunga Nkhotakota Nkhotakota 43 Ali Kanyenda Sasani Linga Nkhotakota Nkhotakota 44 Ambali Chisoti Linga Nkhotakota Nkhotakota 45 Chimkwandala Tchauya Kandeu Ntcheu Ntcheu 46 Adamu Bawi Manjawira Ntcheu Ntcheu 47 Agabu Sharpevale Sharpe Valley Ntcheu Bwanje Valley 48 Akubilila 2 Mwalawoyera Bilila Ntcheu Bwanje Valley 49 Kamtchere Chenje Kalira Ntchisi Ntchisi 50 Akimu Tsabvu West Chipuka Ntchisi Ntchisi

VILLAGE SECTION EPA DISTRICT RDP 51 Amoni Amoni Chipuka Ntchisi Ntchisi 52 Banja Mtsiro Chikwatula Ntchisi Ntchisi 53 Namilaza Matenje West Khombedza Salima Salima 54 Abrahimu Kasache Khombedza Salima Salima 55 Akumzizima Ngodzi East Chipoka Salima Salima 56 Amini Makioni East Khombedza Salima Salima 57 Makoloje Nkaya Utale Balaka Balaka 58 Abudu Mbela Bazale Balaka Balaka 59 Akumwinje Mbaza Mpilisi Balaka Balaka 60 Alli Mgomwa Utale Balaka Balaka 61 Kaponya Matindi East Chipande Blantyre Shire Highlands 62 Amosi Chigumula South Ntonda Blantyre Shire Highlands 63 Bakili Dziwe Kunthembwe Blantyre Shire Highlands 64 Bakili Soche South Ntonda Blantyre Shire Highlands 65 John Changa Mitole Chikwawa Chikwawa 66 Agusu Thapa Livunzu Chikwawa Chikwawa 67 Alindiamawo Mitsumwa Dolo Chikwawa Chikwawa 68 Alkuleti Nyamikuyu Dolo Chikwawa Chikwawa 69 Mtembo Chitera South Mombezi Chiradzulu Shire Highlands 70 Anderson Chisombezi West Mombezi Chiradzulu Shire Highlands 71 Augustine Nyungwe Mombezi Chiradzulu Shire Highlands 72 Balala Nalanda Thumbwe Chiradzulu Shire Highlands 73 Nkalapa Chilemba Mbonechera Machinga Kawinga 74 Adamson Chidothe Chikweo Machinga Kawinga 75 Adamu Bakali Chikweo Machinga Kawinga 76 Afuleki Nampeya Nampeya Machinga Kawinga 77 Chikowi Makoli Maiwa Mangochi Mangochi 78 Abasi Makoli Maiwa Mangochi Mangochi 79 Afiki Masakasa Chilipa Mangochi Bwanje Valley 80 Ailoni Ngapani Katuli Mangochi Namwera 81 Naveya Kunselema Kamwendo Mulanje Mulanje 82 Beni Thuchila East Thuchila Mulanje Mulanje 83 Bodole M'motola 1 Milonde Mulanje Mulanje 84 Bokosi Misanjo Mulanje Boma Mulanje Mulanje 85 Mulongoti Kambale Neno Mwanza Mwanza 86 Amosi Kunenekude Mwanza Mwanza Mwanza 87 Benalita Kunenekude Mwanza Mwanza Mwanza 88 Biliwili Chiwembu Mwanza Mwanza Mwanza 89 Kasume Nyachikadza Nyachilenda Nsanje Nsanje 90 Akina Njiza Nyachilenda Nsanje Nsanje 91 Alindamawo Tsanya B Magoti Nsanje Nsanje 92 Alufazema Mpembamoyo Makhanga Nsanje Nsanje 93 Bandawe Wowo Nkhulambe Phalombe Phalombe 94 Bokosi Phalombe Naminjiwa Phalombe Phalombe 95 Bona 2 Chigumukire Tamani Phalombe Phalombe 96 Bwanali Mnyambwa Nkhulambe Phalombe Phalombe 97 Jarason Muonekera Matapwata Thyolo Thyolo 98 Andinyaza Mangwalala Masambanjati Thyolo Thyolo 99 Bandawe Mikolongwe Matapwata Thyolo Thyolo
100 Bwanali Mikolongwe Matapwata Thyolo Thyolo

VILLAGE SECTION EPA DISTRICT RDP 101 Mpheula Sumani Malosa Zomba Zomba 102 Achilaga Potani Thondwe Zomba Zomba 103 Adamu Potani Thondwe Zomba Zomba 104 Adimu Mikunga Malosa Zomba Zomba 105 Chalunda Likoma 106 Chilongola Likoma 107 Kachere Likoma 108 Munyanje Likoma