target-specific nmr detection of protein-ligand ...10.1007/s10858-016-0076... · target-specific...
TRANSCRIPT

1
Target-specific NMR detection of protein-ligand interactions with antibody-relayed 15N-
group selective STD
Anasztázia Hetényi,1 Zsófia Hegedűs,2 Roberta Fajka-Boja,3 Éva Monostori,3 Katalin E.
Kövér,4 Tamás A. Martinek2
1Department of Medical Chemistry, University of Szeged, Dóm t. 8., H-6720 Szeged,
Hungary
2SZTE-MTA Lendület Foldamer Research Group, Institute of Pharmaceutical Analysis
Department, University of Szeged, Somogyi u. 4, H-6720 Szeged, Hungary
3Lymphocyte Signal Transduction Laboratory, Institute of Genetics, Biological Research
Center of the Hungarian Academy of Sciences, Temesvári krt. 62, H-6726 Szeged, Hungary
4Department of Inorganic and Analytical Chemistry, University of Debrecen, Egyetem tér 1.,
H-4032 Debrecen, Hungary
Supporting Information
2
Recombinant human anti-Gal-1 monoclonal antibody expression and purification
Materials: RPMI (Gibco, Invitrogen), penicillin and streptomycin (Biogal Pharmaceutical
Company), glutamine (Sigma-Aldrich), Foetal calf serum (FCS, Gibco, Invitrogen), Algal
Amino Acid Mixture (U-15N, 98%) (NLM-2161-1, CIL) Protein-G-Sepharose 4B (Sigma-
Aldrich), ELISA plate (Costar), goat anti-mouse Ig-ATTO488 (DaAKO), molecular weight
marker (Thermo Scientific), all other reagents were purchased from Sigma-Aldrich.
Production: Hybridoma cell line producing mouse human galectin-1 (Gal-1) specific antibody,
2C1/6 was developed in our laboratory(Kovacs-Solyom et al. 2010) using classical hybridoma
technique.(Hulette et al. 1985) The antibody producing cells were kept in an incubator with 5 %
CO2 at 37 °C and cultured complete medium (CM) consisting of RPMI complemented with 5%
FCS, penicillin and streptomycin (100 IU/ml and 100 µg/ml, respectively) and l-glutamine (2
mM).
Generation of 15N labelled anti-Gal antibody: Antibody producing hybridoma cells were
metabolically labelled with 100 mg of 15N-labelled algal amino acid mixture in 100 ml of
labelling medium (LM) and cultured in a humidified incubator with 5% CO2 at 37 °C. The cells
were diluted to a concentration of 2 x 10⁵ / ml LM at every third and cell culture supernatant
was collected.
Purification: Hybridoma supernatant was loaded onto a column filled with Protein-G-
Sepharose 4B. After binding immunoglobulins to the matrix, the column was washed with
phosphate buffered saline (PBS) until there was a protein free flow. The bound proteins were
then eluted with 0.1 M Glycin-HCl pH 2.7 and the eluate was immediately dropped into1 M
Tris pH 8.8 to correct the acidic pH and avoid antibody inactivation. Finally, the protein
containing fractions were collected and dialyzed into distilled water and lyophilized.
Determination of isotope incorporation: Unlabeled and 15N labelled anti-Gal-1 mAb were
reduced with a buffer containing 5 mM DTT in 6M guanidine hydrochloride, 100 mM Tris, pH
8.0 and incubated for 30 minutes at 37°C. Protein concentrations were 15 mg/ml. Samples were
diluted with 100 mM Tris, pH 8 buffer to 1.5 mg/ml concentration and tryptic digestion was
performed using 1:20 protease to protein ratio, overnight 37 °C. Digestions were quenched by
addition of trifluoracetic acid to a final concentration of 1%. Samples were analyzed via HPLC-
MS/MS using a C18 column (Phenomenex, Aeris WP XB-C18, 250 mm x 4.6 mm) with a

3
gradient from 5 to 60 % ACN containing 0.1% HCOOH over 60 minutes at 0.7 ml/min flow
rate. Mass spectra were recorded using Thermo Scientific LTQ-XL mass spectrometer using
collision induced dissociation (CID) for fragmentation. Spectra were analyzed with PEAKS
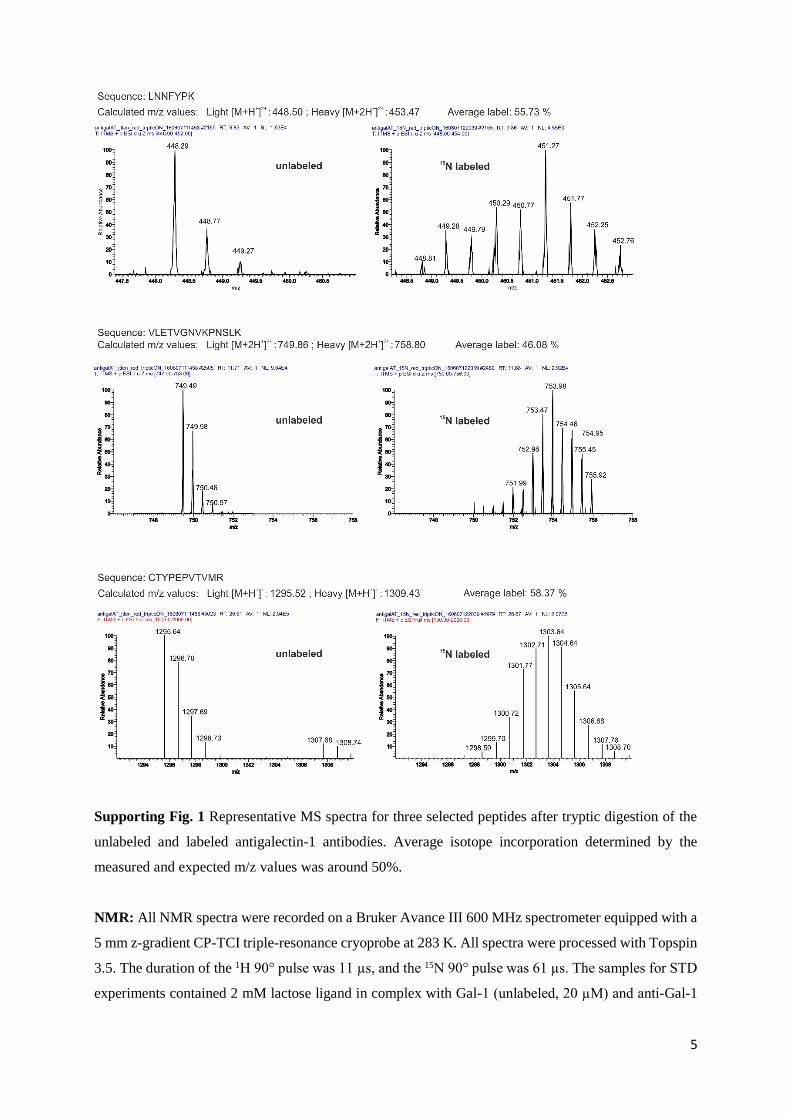
Studio software (Bioinformatics Solutions Inc.) and three representative peptide sequence was
selected for analysis (Supporting Figure 1.). Isotope incorporation was calculated based on the
difference between the expected and detected m/z values.
SDS-gelelectrophoresis: Samples were loaded onto a 10 % SDS-polyacrylamide gel in 1, 5
and 10 µg quantity. After running, the gel was stained with Commassie brilliant blue and
destained in 10% acetic acid.
ELISA: Gal-1, 5 µg / 100 µl / well, was bound to the wells of ELISA plates overnight at 4 oC.
After saturating the plate with 3 % gelatin in PBS for 1 hour at 37 oC, 15N-labelled or unlabeled
2C1/6 antibody in various dilutions were incubated for 3 hours at 37 oC then the wells were
washed with PBS-Tween20, horse radish peroxidase (HRPO) labelled rabbit anti-mouse Ig-was
added for 1 hour at 37 oC. The reaction was developed after washing with orthophenilene
diamine and H2O2 and stopped with 4M H2SO4. Finally, the color reaction was measured at
492nm using ELISA reader.
Cytofluorimetry: Gal-1 secreting human melanoma cell line, C32, was used to test the activity
of 15N labelled 2C1/6 anti-Gal-1 antibody with cytofluorimetry. Melanoma cells, C32 were
suspended in FACS buffer (PBS containing 1% FCS and 0.1% Na-azide) and 15N-labelled or
unlabeled 2C1/6 was added in different concentrations before and after lyophilisation and
analyzed with FACS calibur (Becton&Dickinson) cytofluorimeter.
Production and purification of recombinant wild-type human gal-1: For wild-type (wt) gal-
1, the huGal-1 cDNA sequence was amplified and cloned (forward primer:
5’CGCCATATGGCTTGTGGTCTGGTCG; reverse primer:
5’CGGGATCCTCAGTCAAAGGCCACACATTTGAT) into the pET26b bacterial expression
vector and transformed to BL21(DE3)RIL E. coli.
Bacteria expressing wt gal-1 were grown in LB containing 15 μg ml-1 kanamycin (Kan) with
10.4 μg ml-1 chloramphenicol (Cm) or 15 μg ml-1 Kan, respectively. The expression and
purification steps were identical for the two proteins. The starter pellet from 1 ml of LB culture
was inoculated into 500 ml of LB medium, followed by culturing at 37 °C. When OD600 was in

4
the range 0.5-0.7, expression was induced with 0.5 mM isopropyl β-D-thiogalactopyranoside,
followed by overnight incubation at 18 °C. The induced culture was pelleted (4500 rpm, 17
min, 4 °C) and stored at -80 °C.
All purification steps were performed at 4 °C. The cell pellet from the 500 ml induced LB
culture was resuspended in 50 ml of ice-cold lysis buffer (50 mM Tris pH 7.5, 10 mM EDTA,
1 mM PMSF, 4 mM β-mercaptoethanol (BME)) with gentle pipetting. The cell culture was
lysed with a French press. After centrifugation, the supernatant was filtered and applied to a 3
ml α-lactose agarose column. Tris buffer (50 mM Tris pH 7.5, 1 mM PMSF, 4 mM BME) was
used for equilibration (45 ml) and washing (35 ml). Bound proteins were eluted with 5 ml of
elution buffer (30 mM β-lactose, 50 mM Tris pH 7.5, 4 mM BME) into 5 ml of 50 mM Tris pH
7.5, 4 mM BME solution, to avoid precipitation due to high concentration. A further 6 fractions
(0.5 ml each) were collected without additional dilution. The absorbance (OD280) of the
fractions was measured, and fractions with OD > 0.1 were collected and dialyzed for 24 h at 4
°C (dialysis tube D9652, Sigma-Aldrich, MWCO=12 kDa). The dialysis buffer (10 mM NH4Ac
pH 7.4, 4 mM BME) was exchanged at regular intervals. After 1 h dialysis, 1 l of buffer was
replaced; 3 h later, overnight and after another 3 h dialysis, 5 l of fresh buffer was used. Protein
contents were estimated via OD280 measurements. Protein solutions were filtered through a
0.2 μm PVDF membrane and lyophilized in aliquots. This method usually yielded 7-10 mg of
wt gal-1 from 500 ml of cell culture. Protein concentrations were validated with the bicinchonic
acid (BCA) assay (Thermo Scientific), using BSA for calibration.
Preparation of E.Coli lysate: Cultured BL21 E.Coli was centrifuged and the pellet was resuspended in
20 mM Na-phosphate buffer (pH7.5) containing protease inhibitor (leupeptin, 1 g/ml). The
suspension was sonicated in two cycles using short pulses (20 seconds) with pauses (20 seconds) on
ice, using 20% vibration amplitude (QSonica, Q500 instrument). Lysate was centrifuged at 13.000 rpm
for 5 minutes at room temperature to remove cell debris. Total protein concentration was determined
by BCA assay (ThermoFisher Scientific) using the manufacturer’s protocol.
5
Supporting Fig. 1 Representative MS spectra for three selected peptides after tryptic digestion of the
unlabeled and labeled antigalectin-1 antibodies. Average isotope incorporation determined by the
measured and expected m/z values was around 50%.
NMR: All NMR spectra were recorded on a Bruker Avance III 600 MHz spectrometer equipped with a
5 mm z-gradient CP-TCI triple-resonance cryoprobe at 283 K. All spectra were processed with Topspin
3.5. The duration of the 1H 90° pulse was 11 µs, and the 15N 90° pulse was 61 µs. The samples for STD
experiments contained 2 mM lactose ligand in complex with Gal-1 (unlabeled, 20 µM) and anti-Gal-1

6
mAb (15N labelled, 10 µM), phosphate buffer, pH 7.4, in 500 μL 90% H2O, 10% D2O. The 1H STD
spectrum was obtained using the standard pulse sequence with on-resonance irradiation at 0.5 ppm and
off-resonance irradiation at 40 ppm, respectively. A train of 90° Gaussian pulses of 50 ms applied for 2
s was used for selective saturation. A relaxation delay of 3 s, relaxation filter of 50 ms and 512 transients
were used for the difference spectrum in 1h 12 min. The antibody-relayed 15N-GS STD spectrum was
recorded with the pulse sequence of Figure 2. A train of BIRD pulse with Δ = 600 ms and N = 8 was
applied for 1H-15N saturation of the 15N-labelled mAb. The 15N carrier frequency was set to 117 ppm for
on-resonance and to -270 ppm for off resonance irradiation, respectively. Any undesired partial
saturation of ligand magnetization was cancelled out in the difference spectrum as the proton carrier
frequency remained constant. A relaxation delay of 4 s, relaxation filter of 50 ms, and 1k transients were
used for the difference spectrum in 7h 8 min.
Supporting Fig. 2 A) 1H NMR, B) 1H STD and C) 15N-GS STD spectra of the ternary system
15N-mAb/Gal-1/lactose in cell lysate. The 1H STD spectrum was recorded with standard pulse
sequence, on-resonance irradiation at 0.5 ppm and 512 scans. The 15N-GS STD sequence was
run with on-resonance irradiation at 117.0 ppm and 1k scans.

7
Supporting Fig. 3 A) Attenuation of mAb amide protons arises from both direct saturation and
inverse heteronuclear NOE effect in the proposed 15N-GS STD sequence of Fig. 2, B)
Attenuation arises solely from heteronuclear NOE in the modified 15N-GS STD sequence using
15N inversion pulses only, C) Attenuation arises solely from direct saturation in the modified
15N-GS STD sequence with repeated BIRDd pulse. All three spectra were recorded with on-
resonance irradiation at 117.0 ppm and 1k scans.
Hulette C, Effros R, Walford R (1985) A Method for Production of Human Monoclonal-Antibodies to
Hla by Human-Human Hybridoma Technology Fed Proc 44:1881-1881
Kovacs-Solyom F et al. (2010) Mechanism of tumor cell-induced T-cell apoptosis mediated by
galectin-1 Immunol Lett 127:108-118 doi:10.1016/j.imlet.2009.10.003