tanzania - program in support of the secondary education ... · program in support of the secondary...
TRANSCRIPT
AFRICAN DEVELOPMENT FUND
UNITED REPUBLIC OF TANZANIA
PROGRAM IN SUPPORT OF THE SECONDARY EDUCATION DEVELOPMENT PLAN
APPRAISAL REPORT
HUMAN DEVELOPMENT DEPARTMENT (OSHD) June 2007

TABLE OF CONTENTS Page PROGRAM INFORMATION BRIEF, CURRENCIES AND MEASURES, LIST OF TABLES, (iii-vii) LIST OF ANNEXES, LIST OF ABBREVIATIONS, EXECUTIVE SUMMARY, PROGRAM LOGICAL FRAMEWORK 1. INTRODUCTION 1 2. SOCIO-ECONOMIC AND FINANCIAL FRAMEWORK 2 2.1 Macroeconomic Performance and Stability 2 2.2 Fiduciary Framework and Review 3 2.3 Social Indicators and Poverty Profile 4 2.4 Structural Reform and the Outlook for Poverty Reduction 5 2.5 Bank Group Experience with Budget Support in Tanzania 6 3. THE EDUCATION SECTOR 6 3.1 Structure and the Status of the Education System 6 3.2 Institutional Framework of the Sector 8 3.3 Education Financing and External Assistance 9 3.4 Education Policy Framework and Planning 11 3.5 Challenges and Constraints in the Education Sector 12 4. THE SECONDARY EDUCATION SUB-SECTOR 12 4.1 Secondary Education 12 4.2 Secondary Education Development Plan 14 5. THE PROGRAM 17 5.1 Program Concept and Rationale 17 5.2 Bank Support for the Sector and Lessons Learned 18 5.3 Program Area and Beneficiaries 19 5.4 Strategic Context 19 5.5 Program Objective 20 5.6 Program Description 20 5.7 Financing Arrangements 22 5.8 Environmental Impact 23 6. PROGRAM IMPLEMENTATION 23 6.1 Institutional Arrangements 23 6.2 Implementation Schedule 24 6.3 Procurement Arrangements 25 6.4 Disbursement Arrangements 25 6.5 Monitoring and Evaluation 25 6.6 Financial Reporting and Auditing 26 6.7 Aid Coordination 26 7. PROGRAM SUSTAINABILITY AND RISKS 27 7.1 Recurrent Costs 27 7.2 Program Sustainability 27 7.3 Critical Risks and Mitigating Measures 28
ii
8. PROGRAM BENEFITS 28 8.1 The Economic and Educational Context 28 8.2 Poverty Reduction 29 8.3 Impact on Gender 29 8.4 Impact on HIV/AIDS 30 9. CONCLUSIONS AND RECOMMENDATIONS 30 9.1 Conclusions 30 9.2 Recommendations and Conditions for Loan Approval 30
LIST OF TABLES Table 1: Public Education Budget 10 Table 2: Budgetary Allocations by Education Sub-Sectors 10 Table 3: Projections and Outcomes, Form I enrolments 15 Table 4: Secondary Education Development Plan – Financing Situation 16 Table 5: The Social Impact of Female Secondary Education 29
LIST OF ANNEXES Annex I: Map of the United Republic of Tanzania Annex II IMF’s Assessment of Tanzania Macroeconomic Framework Annex III: Fiduciary Risk Assessment AnnexIV: Institutional Arrangement for SEDP AnnexV: SEDP Management and Monitoring Framework Annex VI: Environmental and Social Management Framework Annex VII: On-going Bank Group Operations in Tanzania Annex VIII: Program Formulation Process
This report was prepared by Mr Abdi Younis, Education Specialist, OSHD.2, Mr Moses Ayiemba, Architect, OSHD.2, and Ms Halima Hashi, Social Sector Specialist, TZFO, following an appraisal mission to Tanzania April/May 2007. Fiduciary assessment was undertaken by Mr Andrew Clark, Macro-economist, OSGE.1. Further inquiries may be directed to the authors or Mr Tom Hurley, Director, OSHD (Extension 2046), or Mr Sibry Tapsoba, Division Manager, OSHD.2 (Extension 3120).
iii
AFRICAN DEVELOPMENT FUND Temporary Relocation Agency
BP 323, 1002 Belvedere, Tunis, Tunisia Tel: (216) 71 335 511; Fax: (216) 71 351 933
Website: www.afdb.org
PROGRAM INFORMATION SHEET Date: May 2007
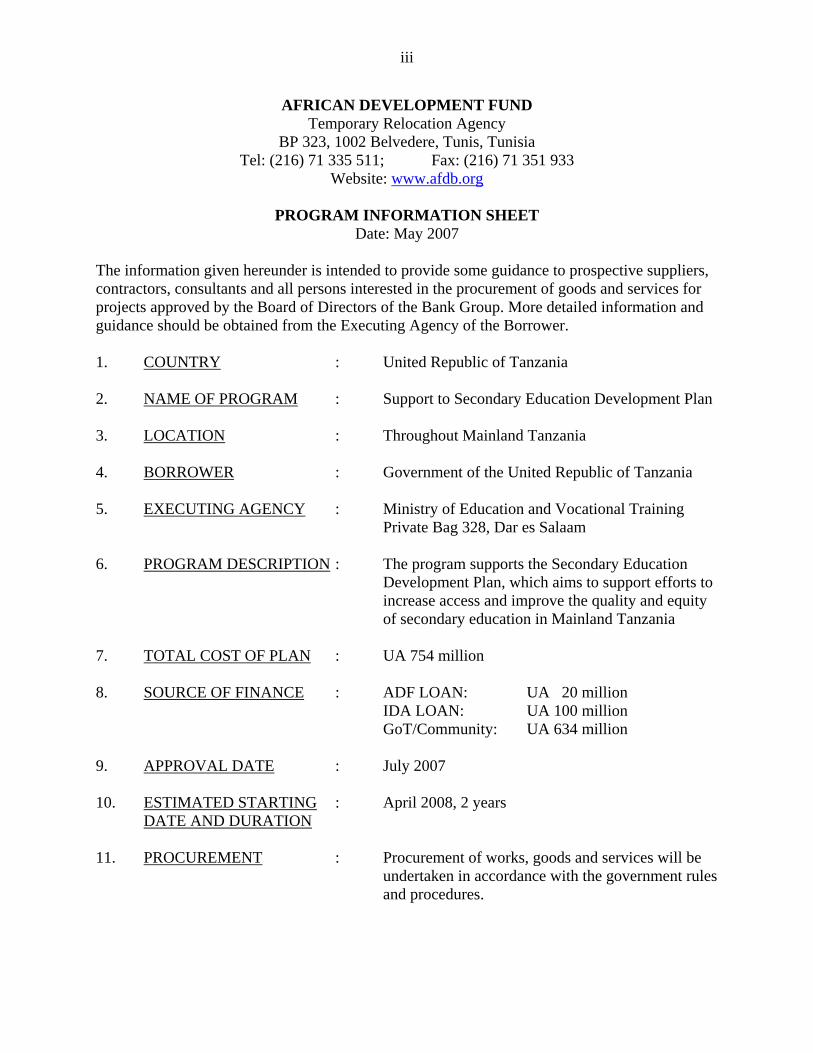
The information given hereunder is intended to provide some guidance to prospective suppliers, contractors, consultants and all persons interested in the procurement of goods and services for projects approved by the Board of Directors of the Bank Group. More detailed information and guidance should be obtained from the Executing Agency of the Borrower. 1. COUNTRY : United Republic of Tanzania 2. NAME OF PROGRAM : Support to Secondary Education Development Plan 3. LOCATION : Throughout Mainland Tanzania 4. BORROWER : Government of the United Republic of Tanzania 5. EXECUTING AGENCY : Ministry of Education and Vocational Training Private Bag 328, Dar es Salaam 6. PROGRAM DESCRIPTION : The program supports the Secondary Education
Development Plan, which aims to support efforts to increase access and improve the quality and equity of secondary education in Mainland Tanzania
7. TOTAL COST OF PLAN : UA 754 million 8. SOURCE OF FINANCE : ADF LOAN: UA 20 million IDA LOAN: UA 100 million GoT/Community: UA 634 million 9. APPROVAL DATE : July 2007 10. ESTIMATED STARTING : April 2008, 2 years DATE AND DURATION 11. PROCUREMENT : Procurement of works, goods and services will be
undertaken in accordance with the government rules and procedures.

iv
CURRENCY EQUIVALENT (May 2007)
National Currency : Tanzania Shilling (TZS) 1 UA = 1901.03 TZS
1 UA = 1.52418 USD 1 USD = 1250 TZS
WEIGHTS AND MEASURES
Metric System
FISCAL YEAR 01 July to 30 June
LIST OF ABBREVIATIONS
ACSEE Advanced Certificate of Secondary Education Examination ACSE Advanced Certificate of Secondary Education ADB African Development Bank ADF African Development Fund AIDS Acquired Immune Deficiency Syndrome BEDC Basic Education Development Committee CSEE Certificate of Secondary Education Examination CSE Certificate of Secondary Education EMIS Education Management Information System ESDP Education Sector Development Program GDP Gross Domestic Product GER Gross Enrolment Ratio GoT Government of Tanzania GPI Gender Parity Index HIV Human Immunodeficiency Virus JAST Joint Assistance Strategy for Tanzania JCE Junior Certificate Examination IDA International Development Association LGA Local Government Authority MDGs Millennium Development Goals MoEVT Ministry of Education and Vocational Training MTEF Medium Term Expenditure Framework NER Net Enrolment Ratio NSGRP National Strategy for Growth and Reduction of Poverty PEDP Primary Education Development Program PER Public Expenditure Review PMO-RALG Prime Minister’s Office, Regional Administration and Local Government PSLE Primary School Leaving Examination SEDP Secondary Education Development Plan TZFO Tanzania Field Office
v
EXECUTIVE SUMMARY Program Background The proposed program in support of the Secondary Education Development Plan has its basis in the government’s Education and Training Policy and the Education Sector Development Program (ESDP). The ESDP provides direction in the development of education and is based on a comprehensive analysis of the education sector in Tanzania. It defines the country’s educational priorities and was developed with extensive participation of all stakeholders. Under the ESDP, a Primary Education Development Program (PEDP) for the period 2002 -2006 and Secondary Education Development Plan (SEDP) for the period 2004 – 2009 were also developed. The proposed ADF education program is planned to fit into this education development framework by supporting the strategies expressed in the ESDP and the implementation of the programs contained in the SEDP. The National Strategy for Growth and Reduction of Poverty (NSGRP) (2005/06 to 2009/10) is the current organizing framework for economic and social development in Tanzania. The NSGRP is committed to the Millennium Development Goals (MDGs) and seeks to reduce poverty by focusing on the following three clusters: (i) growth and reduction of income poverty; (ii) improvement of quality of life and social well-being, and (iii) good governance. The program will support education development, which is included in the second cluster. Sector Goal and Program Objectives The overall national sector goal for education is ensuring equitable access to quality primary and secondary education, universal literacy and expansion of higher, technical and vocational education. The objective of this ADF program is to support the implementation of SEDP, which aims to contribute to increased access and improved quality and equity of secondary education. Brief Program Description The program will support the implementation of activities supported by SEDP. These activities include the expansion and improvement of physical facilities; provision of teaching and learning materials; training of teachers; reduction of barriers to secondary education for children from poor households through the provision of scholarships; supporting programs aimed at improving the retention of girls in schools; and strengthening of the capacity for education management. Source of Finance The total estimated cost of the SEDP over the five year (2004-2009) period was TZS 1,433,084 million (equivalent to about UA 754 million). SEDP is currently funded by government and community resources and an IDA credit of US$ 150 million (about UA 100 million) provided through sector budget support. The ADF program will contribute UA 20 million to the implementation of the plan.
vi
Program Implementation The Ministry of Education and Vocational Training, in collaboration with the Prime Minister’s Office, Regional Administration and Local Government, is responsible for the implementation of SEDP. The ADF program will support the implementation of SEDP. Therefore it will use the institutional arrangements already in place for the implementation of SEDP. The preparation of the work plans and their execution are decentralized and are carried out at the school and local government council levels. Conclusions and Recommendations The proposed program responds to Tanzania’s need to increase access and improve the quality and equity of education. It will contribute to the Government’s effort to increase access and improve secondary education, especially in remote rural areas with little access to secondary education. The program will support the implementation of the government’s Secondary Education Development Plan (SEDP). It is recommended that an ADF loan not exceeding UA 20.00 million be extended to the Government of Tanzania in the form of sector budget support, for the purpose of implementing the program as described in this report, subject to conditions specified in the Loan Agreement.
vii
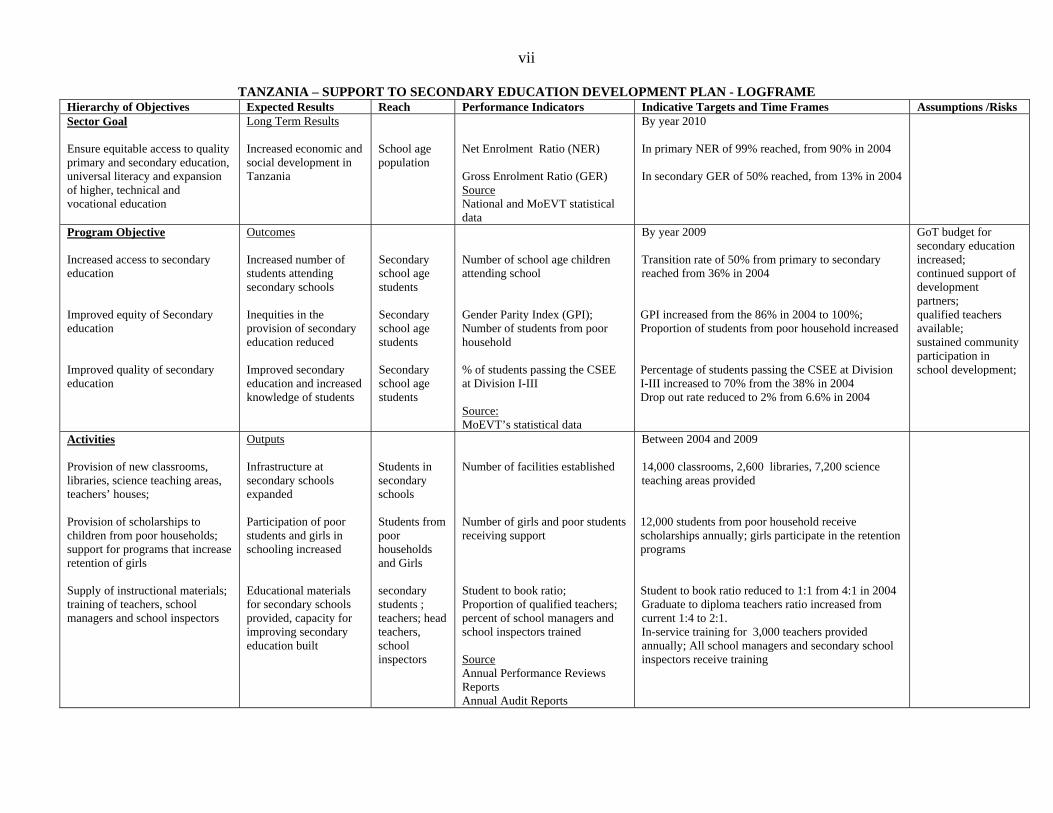
TANZANIA – SUPPORT TO SECONDARY EDUCATION DEVELOPMENT PLAN - LOGFRAME Hierarchy of Objectives Expected Results Reach Performance Indicators Indicative Targets and Time Frames Assumptions /Risks Sector Goal Ensure equitable access to quality primary and secondary education, universal literacy and expansion of higher, technical and vocational education
Long Term Results Increased economic and social development in Tanzania
School age population
Net Enrolment Ratio (NER) Gross Enrolment Ratio (GER) Source National and MoEVT statistical data
By year 2010 In primary NER of 99% reached, from 90% in 2004 In secondary GER of 50% reached, from 13% in 2004
Program Objective Increased access to secondary education Improved equity of Secondary education Improved quality of secondary education
Outcomes Increased number of students attending secondary schools Inequities in the provision of secondary education reduced Improved secondary education and increased knowledge of students
Secondary school age students Secondary school age students Secondary school age students
Number of school age children attending school Gender Parity Index (GPI); Number of students from poor household % of students passing the CSEE at Division I-III Source: MoEVT’s statistical data
By year 2009 Transition rate of 50% from primary to secondary reached from 36% in 2004 GPI increased from the 86% in 2004 to 100%; Proportion of students from poor household increased Percentage of students passing the CSEE at Division I-III increased to 70% from the 38% in 2004 Drop out rate reduced to 2% from 6.6% in 2004
GoT budget for secondary education increased; continued support of development partners; qualified teachers available; sustained community participation in school development;
Activities Provision of new classrooms, libraries, science teaching areas, teachers’ houses; Provision of scholarships to children from poor households; support for programs that increase retention of girls Supply of instructional materials; training of teachers, school managers and school inspectors
Outputs Infrastructure at secondary schools expanded Participation of poor students and girls in schooling increased Educational materials for secondary schools provided, capacity for improving secondary education built
Students in secondary schools Students from poor households and Girls secondary students ; teachers; head teachers, school inspectors
Number of facilities established Number of girls and poor students receiving support Student to book ratio; Proportion of qualified teachers; percent of school managers and school inspectors trained Source Annual Performance Reviews Reports Annual Audit Reports
Between 2004 and 2009 14,000 classrooms, 2,600 libraries, 7,200 science teaching areas provided 12,000 students from poor household receive scholarships annually; girls participate in the retention programs Student to book ratio reduced to 1:1 from 4:1 in 2004 Graduate to diploma teachers ratio increased from current 1:4 to 2:1. In-service training for 3,000 teachers provided annually; All school managers and secondary school inspectors receive training
1. ORIGIN AND HISTORY OF THE PROGRAM 1.1 Tanzania is one of the poorest countries in Africa. Its per capita GDP stood at around US$300 in 2005 compared to sub-Saharan Africa’s average of US$568. It is estimated that about 36 percent of the population live below the poverty line. Poverty is also more prevalent among the rural areas, where 87% of the poor live although they account for 67 percent of the population. The UNDP’s 2006 Human Development Report ranks Tanzania 162 out of 177 countries. 1.2 The government’s overall objective is the reduction of poverty. The National Strategy for Growth and Reduction of Poverty (NSGRP) (2005-2010), which is widely known by its Swahili acronym of MKUKUTA, is the current framework for economic and social development in Tanzania. The NSGRP is committed to the Millennium Development Goals (MDGs) and seeks to reduce poverty by focusing on the following three clusters: (i) growth and reduction of income poverty; (ii) improvement of quality of life and social well-being, and (iii) good governance. 1.3 The proposed ADF education program has its basis in the government’s Education and Training Policy and the Education Sector Development Program (ESDP). The ESDP is the education sector’s response to the government policy of poverty reduction. The ESDP provides direction in the development of education and is based on a comprehensive analysis of the education sector in Tanzania. It defines the country’s educational priorities and was developed through extensive participation of all stakeholders. Under the ESDP, a Primary Education Development Program (PEDP) for the period 2002-2006 and Secondary Education Development Plan (SEDP) for 2004–2009 were also developed. The proposed ADF education program is planned to fit into this education development framework by supporting the strategies expressed in the ESDP and the implementation of the programs contained in the SEDP. 1.4 In June 2005 the Ministry of Education submitted a proposal requesting ADF assistance in the improvement of secondary education. Consequently, in July 2006 the Bank undertook an identification mission to explore priority areas for support in the sector under a new ADF education program. The identification mission met government officials and representatives of development partners active in the education sector and agreed that future ADF assistance will be within the context of the Education and Training Policy and will support priorities set in the Education Sector Development Program (ESDP). Within the sector development program, it was also agreed that future ADF support to the sector should primarily focus on the secondary education sub-sector with the aim of contributing to efforts to increase access and improve the quality of secondary education. 1.5 The expansion of primary education in recent years has created a huge demand for secondary education. Consequently, the secondary education sub-sector expanded, largely as a result of the establishment of community secondary schools. But the expansion is inadequate to meet the demand for secondary education and the quality of secondary education provided remains very poor, adversely impacting on the skill levels of the working population. To address the serious access, quality and equity issues in secondary education, the government formulated the SEDP, which is the first phase (2004-2009) of a 15 year program. SEDP is supported by
2
government and community resources and an IDA credit provided through sector budget support, but nonetheless remains seriously under-funded. It was therefore agreed during the preparation mission of February 2007 that the new ADF program should support the implementation of SEDP to assist the country address the access, quality and equity issues in secondary education. Furthermore, in order to ensure the maximum effectiveness of the ADF program, ADF resources will also be made available through a sector budget support. The ADF program will only cover Mainland Tanzania and will not include Zanzibar as the SEDP covers the mainland only. Also, at present the requirements for sector budget support are not in place in Zanzibar and all assistance to the education sector in Zanzibar is provided through project support. The program was appraised by a Bank mission that visited Tanzania in April/May 2007. 1.6 The program will support government efforts to increase access and improve the quality and equity of secondary education provided in Tanzania. This is consistent with the country’s strategies for reducing poverty as the program will support the second cluster of the NSGRP, namely improvement of quality of life and social well-being. In addition, the support is consistent with the Bank’s education sector policy and complements the assistance provided by other development partners, as well as building on the achievements of ADF Education II Project, which provided support for improvements in the quality of secondary education. 1.7 The sector budget support funding modality adopted for the program is in line with the Joint Assistance Strategy for Tanzania (JAST) approved by the government in December 2006 and supported by the Bank and other development partners. Under the JAST, Tanzania’s preferred mode of assistance is general budget support. 2. SOCIO-ECONOMIC AND FINANCIAL FRAMEWORK 2.1. Macroeconomic Performance and Stability 2.1.1 The early post-independence years in Tanzania were characterized by tight administrative control of economic activity and economic stagnation. By the early 1990s a program of economic reform and more liberal trade and agricultural marketing arrangements was being implemented. The initial objective was to restore macroeconomic stability and then use this as the platform for accelerated growth and poverty alleviation. A greater emphasis on private sector development, measures to improve the economy’s supply response, increased government revenues and a reorientation of public expenditure toward social spending would, it was hoped, lay the basis for a gradual reduction in the dependence on external assistance. 2.1.2 Over the past decade Tanzania has made major strides with important elements of this economic reform. The growth in real GDP has accelerated to an average of 6.2 percent in the past five years. This impressive growth has translated into a lower growth of real GDP per capita (around 3.5 percent) because of population increase. Inflation has declined to around 5 percent. 2.1.3 The external position has been broadly satisfactory, but a benign outcome has depended heavily on donor assistance. Tanzania’s exports (particularly of non-traditional exports such as gold) have improved in recent years, but in 2005 exports amounting to 14 percent of GDP were well below the Sub-Saharan average of 40 percent. Strong growth in imports meant that the trade
3
balance widened, but the current account balance improved quite strongly in relation to GDP because of large inflows of donor assistance and debt relief under the Heavily Indebted Poor Country (HIPC) Initiative. External debt is at a sustainable level, and Tanzania continues to receive external debt relief from a wide variety of multilateral and bilateral agencies. Tanzania’s debt outlook has improved further following its qualification for debt relief from the World Bank and the African Development Bank under the Multilateral Debt Relief Initiative (MDRI) approved in April 2006. 2.1.4 Fiscal performance has also been satisfactory but here too external assistance has played an important role. Expenditure management has substantially improved since introducing a process of prioritization of expenditures through a Medium Term Expenditure Framework (MTEF). This in turn has enabled the composition of expenditures to improve in favor of spending for the priority sectors, including health and education. Spending on education has increased from 16.7 percent of the national budget in 2000/01 to a forecast 19.8 percent in 2006/07. Revenue performance has remained weak, but the resulting budget deficit has been largely financed by external assistance. 2.1.5 Overall, Tanzania is rated as a good performer in its macroeconomic reform effort. In February 2007, the IMF completed the sixth and last review of the country’s economic performance under a three-year Poverty Reduction and Growth Facility arrangement and commended the authorities for the sustained strong economic performance. The Fund also approved a Policy Support Instrument for Tanzania, thereby signifying its endorsement of the country’s macroeconomic policy framework. Annex II presents the IMF’s assessment of Tanzania’s macroeconomic framework. 2.2 Fiduciary Framework and Review 2.2.1 An assessment of Tanzania’s fiduciary framework, comprising the public financial management and the procurement system, is carried out in the context of Public Expenditure and Financial Accountability Reviews (PEFAR). These are normally conducted every year to eighteen months. The overall purpose of the PEFAR is to provide Government and Development Partners with a comprehensive, integrated and candid assessment of Tanzania’s key fiduciary risks as reflected in the Governments resource allocation, resource management and control, resource utilization and accountability processes, and to make recommendations for improving the public finance management framework, institutional performance and capacity building. The 2005/6 PEFAR focused on the central Government and noted that generally Tanzania has a sound system of formal rules for financial management and extensive training has taken place on the application of the financial rules and regulations. It noted that most of the recommendations contained in the 2001 Country Financial Accountability Assessment (CFAA) and the 2003 Country Procurement Assessment Report (CPAR) have been implemented or are already being addressed through the Public Finance Management Reform Program (PFMRP). The reports made a number of significant conclusions including the acknowledgement that since 2003, through two reviews there have been major improvements in Public Financial Management (PFM) systems. More recently, the 2007/8 PEFAR included a fiduciary assessment of local governments and an update of the 2003 CPAR with a detailed review of the procurement reforms undertaken to date.
4
2.2.2 Technical assistance for the implementation of the recommendations of the PEFAR is being provided through the PFMRP, while policy dialogue takes place within the context of the General Budget Support (GBS) framework. The Bank Group participates in the PFMRP through the ongoing institutional support project that is providing for procurement reforms and it is also a member of the GBS donor group. Overall, Tanzania has demonstrated an increasingly positive track record in improving its public financial management framework and procurement system, thereby leading to increasing levels of budget and sector budget support since 2001. 2.2.3 Within the 2007 PEFAR, there was a partial analysis of public expenditure covering the main Ministries that undertake Education sector expenditure, which provides a view of the financing framework in Education. The draft report highlights some necessary improvements with budget planning, including medium-term strategic prioritization and the large number of disjointed and labor intensive stages in the budget process. These issues are being addressed within the PFMRP. It highlighted that decades of external assistance based on projects and basket funding, rather than budget or sector budget support, have undermined budget planning. The robustness of the MTEF is currently being specifically addressed as part of the GBS process. Aligning support to the SEDP in a multi-year predictable way, through this sector support, will assist in more predictable medium-term budgeting. The report stresses the need for sector Ministries to manage their cash flow more robustly. This is not a problem for the recurrent education budget which over the last two fiscal years can be categorized as one of full and timely release from the Ministry of Finance which has ensured consistent and predictable cash-flow forecasts and releases by Ministries. There is concern with the development budget where there has been some over-spending of budgeted funds at the Ministry Level. It highlighted that one of the major impediments to the effective implementation of the development budget was the slow disbursement from donor activities. It also noted the number of different donor disbursement mechanisms undermining the planning process, which this Sector Budget Support will help mitigate, but also the need for the Ministry of Education to engage more robustly in the budget process. It did note the complexity of the budget process itself, which is a cross-sector feature and not unique to education, although amplified for the education sector due to the number of ministries involved in education expenditure. Annex III provides a more detailed fiduciary review based on the PEFAR reports. 2.3. Social Indicators and Poverty Profile 2.3.1 Despite macroeconomic stability and high GDP growth rates in recent years, on a per capita basis Tanzania remains one of the poorest countries in the world. Its per capita GDP of around US$300 is well below the average for sub-Saharan Africa of US$568. The UNDP Human Development Report of 2006 indicates that the country ranked 162 out of 177 countries in the Human Development Index for 2004. Based on the most recent Household Budget Survey (HBS) for Tanzania Mainland,1 19 percent of households were below the food poverty line in 2001. Using the broader definition of basic needs rather than food poverty, the incidence of poverty was 36 percent in 2001. After a decade of improved economic performance, this is scarcely better than the 1991 poverty incidence of 39 percent. Poverty is very much a rural phenomenon
1 National Bureau of Statistics Tanzania, Household Budget Survey 2000/01, July 2002.
5
in Tanzania; the rural population accounts for 67 percent of the total, but 87 percent of all poor people live in rural areas. 2.3.2 There are successes to record with regard to non-income poverty. There has been considerable improvement in access to schooling following implementation of the PEDP in 2002 and the SEDP in 2004. In 2006 the Net Enrolment Rate (NER) for primary reached 96 percent, with a Gender Parity Index (GPI) of 99 percent. The transition rate to secondary has reached 49 percent, up from 22 percent a mere five years ago, with an improving GPI of 92 percent. The child mortality rate has improved, together with under-five nutritional status, more reliable surveys suggest that the HIV/AIDS prevalence rate of 7 percent is lower than previously estimated, and there has been some limited progress in access to clean drinking water. 2.3.3 Nonetheless, the stark reality is that generally good macroeconomic management and economic growth have not translated into a significant decline in poverty. Life expectancy is a low 46.5 years, one in ten children dies before the age of 5 years, child malnutrition is 38 percent for the under-fives, and the MDG targets in areas such as child mortality and access to safe water are likely to prove challenging. The overall picture that emerges is that many people in Tanzania have not yet benefited from the economic growth of recent years. 2.3.4 Tanzania is currently pursuing the second phase of its poverty reduction strategy, the National Strategy for Growth and Reduction of Poverty, which is widely known by its Swahili acronym of MKUKUTA. This is aimed at improvement in broader social indicators (especially education and health) as well as a reduction in income poverty. 2.4. Structural Reform and the Outlook for Poverty Reduction 2.4.1 The critical socio-economic question for Tanzania is why the generally good record of macroeconomic management and impressive growth has not translated into a more rapid reduction in poverty. A number of specific explanations have been offered.2 One possibility is that there are longer than expected lags between recovery from the pre-1995 stagnation and the payoff in poverty reduction. A further explanation, and one consistent with the evidence that poverty in Tanzania is overwhelmingly a rural phenomenon, is that agricultural growth has been consistently lower than overall GDP growth. However, a clear picture of the poverty situation will emerge after the results of the on-going HBS expected to be completed in 2008 are finalized. 2.4.2 While these specific issues play a role in explaining why economic growth has not brought about a faster reduction in poverty, a major constraint limiting faster growth has been poor private sector development. Burdensome procedures, high start-up costs and poor infrastructure are all cited as important factors undermining private investment in Tanzania. 2.4.3 Second, it has become widely understood that human capital weakness is one of the major impediments to sustainable growth. The country does not have an adequate workforce (in either quantitative or qualitative terms) to support private sector development and more rapid economic growth. The Government has itself acknowledged that the policy emphasis of the 2 See for example the analysis in International Monetary Fund, United Republic of Tanzania: Ex Post Assessment of Longer-Term Program Engagement, IMF Country Report No. 06/198 Washington DC., June 2006, Vols 1 and 2.

6
1960s up to the early 1980s placed strong reliance on government control of the economy and the public sector, a reliance which also influenced the form and direction of education and training policies. The result was a highly restricted educational system.3 Little more than half the age group went to primary school (NER in 1980-85 averaged 56 percent) and as recently as 1990 only 15.4 percent of primary school leavers moved on to secondary school. Regional comparisons of participation rates in secondary showed that Tanzania lagged far behind neighboring countries. In the late 1990s the secondary GER in Tanzania was a meager 5 percent, compared to 26 percent in Kenya, 12 percent in Uganda, 28 percent in Zambia and 44 percent in Zimbabwe. 2.5 Bank Group Experience with Budget Support in Tanzania 2.5.1 The Bank Group approved two budget support operations in Tanzania. The first budget support, the Poverty Reduction Support Loan (PRSL), was approved in October 2004. The PRSL built on the progress achieved in the previous policy-based operations and focused on (i) the promotion of an enabling environment for private sector development; (ii) the development of micro finance; and (iii) strengthening public financial management. The Project Completion Report carried out for the operation reports that the intervention has been successfully implemented, indicating the country’s readiness for budget support operations. 2.5.2 The second budget support operation, PRSL II, was approved in June 2006. It focuses on Cluster I and II of the Government’s Poverty Reduction Strategy, that is, enhancing growth and reducing income poverty, and improvement of quality of life and social well-being. In selecting the areas, key considerations included the need to deepen the reform agenda in critical policy areas including those that were covered under the first PRSL. The PRSL II builds on the progress already achieved under the first operation and the prospect of it being satisfactorily implemented is high. 2.5.3 Given the satisfactory implementation of earlier Bank budget support operations and the existence of a sound fiduciary framework as pointed out in section 2.2, it is appropriate to extend the budget support approach in the provision of assistance to the education sector in Tanzania. The adoption of this modality of funding for the proposed program is also justified as it is in line with the Joint Assistance Strategy that underlines Government leadership of the development process, as well as alignment and harmonization of donor support to enhance aid effectiveness. 3. THE EDUCATION SECTOR 3.1 Structure and Status of the Education System 3.1.1 From its unpromising situation 15 years ago, Tanzania’s education system has improved markedly in recent years. Formal education in Mainland Tanzania is structured into a system of 2 years of pre-primary, 7 years of primary, 4 years of lower secondary (“secondary ordinary level” in Tanzanian usage), 2 years of upper secondary (“secondary advanced level”) and 3 years or more of post-secondary education. 3 Ministry of Education and Culture, Education and Training Policy, 1995, page xiii.
7
3.1.2 Pre-primary education is intended for children aged 5-6 and coverage is surprisingly widespread for a low-income country. In 2006 the NER for the 5-6 age group reached 28.5 percent, with an almost equal ratio between boys and girls. Pre-primary is a government affair, with private institutions accounting for only 2.3 percent of enrolments. The Social Welfare Department of the Ministry of Labour, Youth Development and Sports has registered 762 day care centers, each of which has 50-100 children enrolled, and these are concentrated in urban areas, accessible to those able to pay fees ranging between TSh3,000 to TSh300,000 per month. 3.1.3 Primary education in 2006 comprised enrolments of 7,959,884 in 14,700 schools. Girls and boys are equally enrolled (GPI = 0.99). The teacher to student ratio is 1:52 and in some regions (Mwanza, Rukwa, Shinyanga) the average teacher to student ratio exceeds 1:60. Primary schooling is almost exclusively government run, with only 1 percent of enrolments in private schools. In 2006 the NER was over 96 percent, a substantial improvement on the 2002 NER of 81 percent. Late starting means that there are substantial over-age enrolments, and this is reflected in a GER of 112.7 percent in 2006. Dropout and repeater rates have been improving, but remain high for the transition between Standards IV and V, principally as a consequence of the Standard IV Primary School Examination. After Standard IV, 10.9 percent of students repeat and 7.4 percent dropout. 3.1.4 Primary completion rates have to be interpreted cautiously in Tanzania. Measured only as enrolments in each grade, the improving repeater and dropout rates mean that cohort retention between Standards I and VII has reached 78 percent, with girls doing somewhat better than boys (79 percent versus 77 percent). However, the completion rate falls drastically if primary completion is interpreted to mean attainment of the certificate which certifies a pass in the Standard VII Primary School Leaving Examination (PSLE). In 1998 only 21.3 percent of candidates passed. In 2005, 61.8 percent of candidates passed.4 The argument in Tanzania is that the quality improvements (textbooks, materials, classrooms) made possible by the Primary Education Development Program have brought about a systematic improvement in the PSLE pass rate.5 3.1.5 Secondary education (reviewed in detail in Chapter 4) is displaying dramatic change. In past years its most notable characteristic was its small size, with a GER for Forms 1-4 of only 10 percent in 2002 and of 1.8 percent for Forms 5 and 6. Since then the number of schools has more than doubled (from 1,024 in 2002 to 2,289 in 2006) with government schools accounting for most of the increase (599 to 1,690).6 Enrolments have more than doubled (323,418 for Forms 1-6 in 2002) to 675,672 in 2006.
4In 2005 520,717 students were enrolled in Standard VII. Of these, 493,946 sat the PSLE and 304,936 passed. “Completion” in terms of those enrolled in Standard VII and who achieved a PSLE pass is therefore 58.6 percent. Of those who passed, a total of 243,359 were offered a place in either a Government or private secondary school. Measured in terms of Standard VII enrolment, the transition rate to secondary school is therefore 46.7 percent. The survival rate from Standard I in 1999 (736,088 enrolments) to Form 1 in 2006 is 33 percent. 5United Government of Tanzania, Education Sector Situation Analysis, Final Report, 2005, page 38 offers an opposing view, suggesting that new methods of defining pass and fail are largely responsible for the observed improvement in the pass rate. 6Government schools in Tanzania include not only those which are built and run by government but also those which are built by the community and then operated and managed by government.

8
3.1.6 Secondary schooling in Tanzania is driven heavily by the requirements of external exams. There is an examination after Form 2, and then more critically, because it certifies both the end of the cycle and admission to upper secondary, the Certificate of Secondary Education Examination (CSEE) takes place after Form 4. The Advanced Certificate of Secondary Education Examination (ACSEE) is taken at the end of Form 6 and provides the competitive basis for admission to higher education. 3.1.7 Post-secondary education and training takes place (i) in a diverse range of some 1,000 TVET colleges and institutions, many of them very small but in total servicing 150,000 students per year;7 (ii) 13 teachers’ colleges which train Diploma teachers and 19 which train Grade A teachers (16,668 students were enrolled in these colleges in 2005); and (iii) 8 public universities and 13 private universities with a total of 37,576 enrolments in 2005, including 12,940 in the Open University. 3.1.8 HIV/AIDS is a cross-cutting issue that impacts on all levels of education. Data from the Teachers’ Service Commission show that the cumulative number of deaths of teachers recorded between 2000 and 2004 was 4,015. Taking into account the causes of death recorded and the profiles of terminal diseases, it is probable that many of these deaths were HIV related. The reduction of the number of pupils due to HIV/AIDS is harder to measure, since “truancy” is the major reported reason for dropout from school and this may conceal a variety of reasons for absenteeism, including HIV/AIDS. 3.2 Institutional Framework of the Sector 3.2.1 Education in Tanzania is organizationally complex. Several Ministries share in the management of the formal education system: 3.2.2 The Ministry of Education and Vocational Training oversees:
• Pre-primary and primary education • Adult and non-formal education • Secondary education – O-level and A-level • Teacher training and management of the teaching force • The vocational Education and training sub-sector • Support institutions such as Institute of Education for curriculum development,
National Examinations Council, Tanzania Library Services Board, Institute of Adult Education, Agency for Development and Education Management
• The School Inspectorate. 3.2.3 The Regional Administration and Local Government (responsible to the Prime Minister’s Office, PMO-RALG) handles the day to day operations of primary education such as resource mobilization, management of teachers, financing and payment of school supplies.
7 These numbers are approximate because not all institutions are registered, but were estimated by the United Government of Tanzania, Education Sector Situation Analysis, Final Report, 2005, page 60.
9
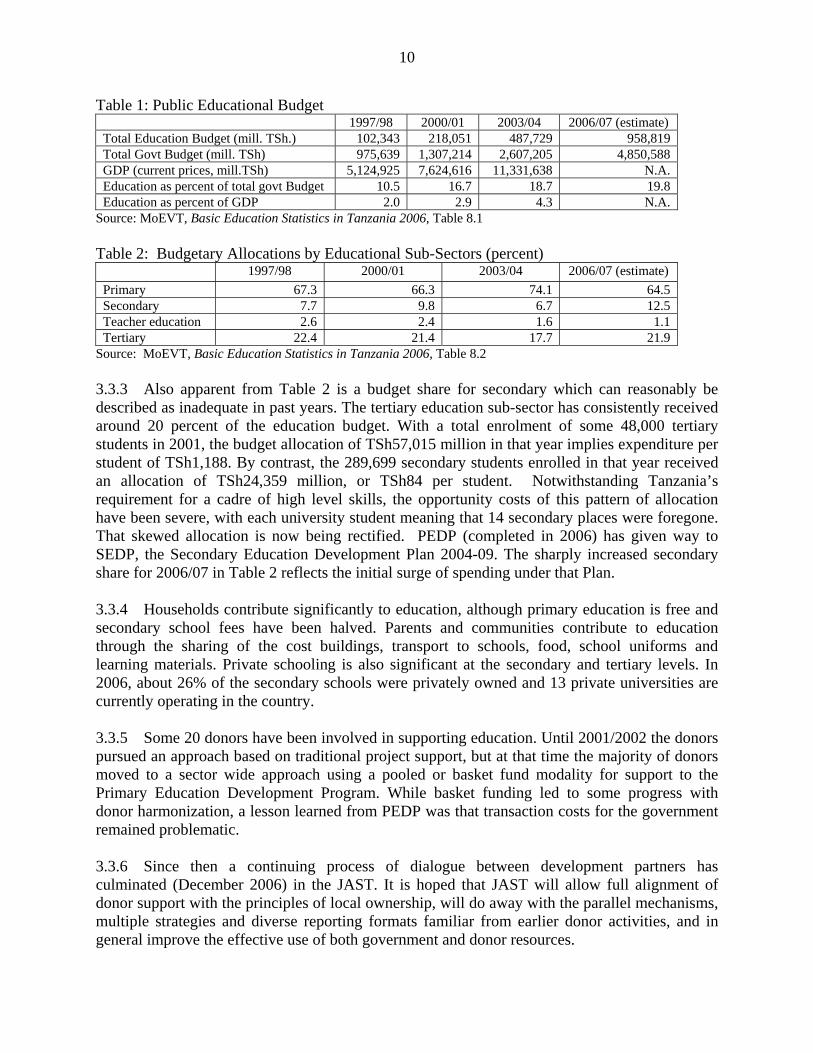
3.2.4 The Ministry of Higher Education, Science and Technology handles university education and science and technical education, in addition to its broader science and technology portfolio. It also coordinates key quality assurance and control instruments, the Higher Education Accreditation Council and the National Council for Technical Education. 3.2.5 Other Ministries (Ministry of Community Development, Gender and Children; Ministry of Finance) are involved in different aspects of the formal education system; and there are several other Ministries, agencies and parastatals providing specific sector training in areas such as health, agriculture, tourism and communication. Altogether there are about 15 Ministries, agencies and parastatals involved in formal education. 3.2.6 A key element of the Education Sector Development Program (see section 3.4) was the development of institutional reform. Decentralization of function was a key element of this reform. Central Government would focus on policy formulation, provision of regulatory frameworks and monitoring and evaluation; Local Government Authorities (LGAs) with extensive community involvement would implement programs; and an enabling environment would be provided for the private sector. Progress has been made, but the sheer number of actors has limited the implementation of effective reform. 3.2.7 Within the decentralization framework, PMO-RALG’s main responsibility is to ensure that Districts fulfil their role of sector supervision and coordination and that resources allocated to schools are used effectively and appropriately. Significant progress has been made in this direction, but the Government recognizes that due to the rise in sectoral responsibilities to be undertaken by LGAs and the subsequent higher inter-governmental transfers, improvements in terms of institutional and fiscal capacity at the local level will need to be continued. 3.3 Education Financing and External Assistance 3.3.1 In the late 1990s, the adoption of the MTEF was an important step in strengthening the budget process and improving linkages between policy, planning and budgeting. There are, however, still some difficulties in encompassing all education expenditure, as there are multiple ministries and government agencies involved in education. In addition, there are problems in tracking private expenditure. 3.3.2 Despite the problems in tracking all the expenditure on education from various sources, the main developments in education financing are clear. First, over the last ten years there has been a substantial increase in the amount of the public budget allocated to education (Table 1). Indeed, education has virtually doubled its share of the public budget, and has more than doubled as a share of GDP. Second, the sub-sectoral allocations (Table 2) display a skewed pattern which is only now being rectified. The allocation for primary schooling has been appropriately high in a country where in 1997/98 the primary NER was only 56.7 percent. Clearly apparent in Table 2 is the impact of the PEDP which, with substantial support from development partners, ran from 2002-06. Spending under PEDP peaked in 2003/04, and this surge is prominent in Table 2. But to sustain gains in access to primary education and further improve its quality, the government is committed to maintaining the allocation of high proportion of the education budget to primary education.
10
Table 1: Public Educational Budget 1997/98 2000/01 2003/04 2006/07 (estimate) Total Education Budget (mill. TSh.) 102,343 218,051 487,729 958,819 Total Govt Budget (mill. TSh) 975,639 1,307,214 2,607,205 4,850,588 GDP (current prices, mill.TSh) 5,124,925 7,624,616 11,331,638 N.A. Education as percent of total govt Budget 10.5 16.7 18.7 19.8 Education as percent of GDP 2.0 2.9 4.3 N.A.
Source: MoEVT, Basic Education Statistics in Tanzania 2006, Table 8.1 Table 2: Budgetary Allocations by Educational Sub-Sectors (percent) 1997/98 2000/01 2003/04 2006/07 (estimate) Primary 67.3 66.3 74.1 64.5 Secondary 7.7 9.8 6.7 12.5 Teacher education 2.6 2.4 1.6 1.1 Tertiary 22.4 21.4 17.7 21.9
Source: MoEVT, Basic Education Statistics in Tanzania 2006, Table 8.2 3.3.3 Also apparent from Table 2 is a budget share for secondary which can reasonably be described as inadequate in past years. The tertiary education sub-sector has consistently received around 20 percent of the education budget. With a total enrolment of some 48,000 tertiary students in 2001, the budget allocation of TSh57,015 million in that year implies expenditure per student of TSh1,188. By contrast, the 289,699 secondary students enrolled in that year received an allocation of TSh24,359 million, or TSh84 per student. Notwithstanding Tanzania’s requirement for a cadre of high level skills, the opportunity costs of this pattern of allocation have been severe, with each university student meaning that 14 secondary places were foregone. That skewed allocation is now being rectified. PEDP (completed in 2006) has given way to SEDP, the Secondary Education Development Plan 2004-09. The sharply increased secondary share for 2006/07 in Table 2 reflects the initial surge of spending under that Plan. 3.3.4 Households contribute significantly to education, although primary education is free and secondary school fees have been halved. Parents and communities contribute to education through the sharing of the cost buildings, transport to schools, food, school uniforms and learning materials. Private schooling is also significant at the secondary and tertiary levels. In 2006, about 26% of the secondary schools were privately owned and 13 private universities are currently operating in the country. 3.3.5 Some 20 donors have been involved in supporting education. Until 2001/2002 the donors pursued an approach based on traditional project support, but at that time the majority of donors moved to a sector wide approach using a pooled or basket fund modality for support to the Primary Education Development Program. While basket funding led to some progress with donor harmonization, a lesson learned from PEDP was that transaction costs for the government remained problematic. 3.3.6 Since then a continuing process of dialogue between development partners has culminated (December 2006) in the JAST. It is hoped that JAST will allow full alignment of donor support with the principles of local ownership, will do away with the parallel mechanisms, multiple strategies and diverse reporting formats familiar from earlier donor activities, and in general improve the effective use of both government and donor resources.
11
3.3.7 Two key changes underpin these principles and aspirations. First, the major donors who supported the PEDP pooled-fund mechanism have now decided to adopt budget support modalities. About 42 percent of external assistance was provided in 2006/7 through general budget support. This is not intended to be fully prescriptive and there is no single approach to budget support. For example, the World Bank/IDA is a key partner in SEDP, and is providing funds through targeted sector budget support with specific tranche release conditions. 3.3.8 Second, the main thrust of budget support is that development assistance is provided within the framework of the NSGRP (2005-2010) or MKUKUTA. Education is part of MKUKUTA Cluster 2, Improvement in the quality of life and social well-being. The critical feature of MKUKUTA is that it is an outcomes or results-based mechanism with specific targets, indicators and monitoring systems. Development partners can therefore align their support with these monitoring systems. While specific outcomes such as classrooms built or textbooks supplied continue to be important benchmarks and milestones, success in development assistance is ultimately measured by achievement of the MKUKUTA operational targets of access, equity and quality in education. 3.4 Education Policy Framework and Planning 3.4.1 Recent years have seen a fast pace of policy development for education. First the Education and Training Policy of 1995 set out a comprehensive vision of quality, access and equity at all levels of education. The Education Sector Development Program (ESDP), approved by Government in 2000, attempted to translate that vision into comprehensive and complementary sub-sector strategies. The first sub-sector to be addressed was primary schooling. The Primary Education Development Program (PEDP) received strong support from development partners and there were impressive achievements, with the primary NER increasing from 59 to 96 over the years 2000 to 2006. The second phase of the ESDP focused on secondary education, through a master plan prepared in 2000 which evolved into the Secondary Education Development Plan (SEDP), scheduled to run between 2004 and 2009. 3.4.2 In addition to these specific sub-sectoral plans, two further developments have been critical to the evolution of education policy. The first (and already described briefly above) is the development of the over-arching framework of the National Strategy for Growth and Poverty Reduction. A review in 2004 of the earlier Poverty Reduction Strategy provided the key lesson that Government policies would have to support faster growth if Tanzania were to meet the MDGs by 2015. The new 5-year National Strategy for Growth and Reduction of Poverty, approved by Parliament in April 2005, adopts an outcome-based approach, moving from a sector based prioritization of interventions to three major clusters of outcomes. These clusters are (i) Growth and reduction of income poverty, (ii) Improved quality of life and social well being (which includes education targets) and (iii) Good governance and accountability. 3.4.3 Second, there has been general recognition that the shift towards a sector wide approach now requires a broader planning, budgeting and monitoring process covering all sub-sectors. It is important for the implementation of education policy to note the on-going wider institutional reforms: public financial management, local government, public service and legal sector reforms. And, in a move which brings the Education Sector Development Program full circle, the
12
Education Sector Review of 2006 reiterated the importance of sector policy dialogue, a sector performance assessment framework, sector public expenditure review and above all anchoring each sector reform process within the overall strategic framework. 3.5 Challenges and Constraints in the Education Sector 3.5.1 The challenges facing the Tanzania education sector are many. Chief among these challenges is the need to improve the quality of primary education, increase access and improve the quality and equity of secondary and tertiary education, and improve planning and institutional arrangements. Inadequate provision of access-increasing and quality-improving inputs, such as classrooms, qualified teachers, and instructional materials, brought about by resource constraints, is a major impediment to overcoming these challenges. Weaknesses in planning and institutional arrangements are also constraints to the efficient allocation and use of available resources. In addition, the widespread poverty in the country and the severe impact of HIV/AIDs are also immense constraints to the provision of quality education. 3.5.2 The studies carried out for the Joint Education Sector Review of 2006 provide a useful summation of the policy measures that can in due course bring about sustained improvements in resources. The measures highlighted include the need for continued work developing full-sector planning to avoid fragmentation of the sub-sectors (sector-wide planning and budgeting need a strong relation to the poverty reduction strategy); the revision and updating of sub-sector planning and prioritization (including costing) within this global reform of the education sector; and, in addition to improving coordination between the sub-sectors, the complexities created by the number of ministries and training institutions require rationalization and simplification. 4. THE SECONDARY EDUCATION SUB-SECTOR 4.1 Secondary Education 4.1.1 The secondary school subsystem has two levels, Forms 1-4 leading to a Certificate of Secondary Education (CSE) qualification, and Forms 5 and 6 leading to an Advanced Certificate of Secondary Education (ACSE) qualification. Selection to join both levels is highly competitive, through the PSLE and CSEE respectively. Both examinations therefore serve two purposes, that of certification and selection. Those who pass ACSE are eligible to join universities and institutions of higher learning for degrees and advanced diplomas. 4.1.2 There are four categories of secondary school ownership: government, community, private and seminaries. Those schools which are built by the community but operated and managed by government are considered government schools. Most growth over the last ten years has come from these community-built schools. In 1997 non-government schools (371) slightly outnumbered government schools (350) but by 2006 the number of government schools had risen to 1,690, against 599 non-government schools. The driving factor behind this dramatic increase was the general freeing-up of policies and structures in Tanzania from the early-1990s, exemplified in the option for communities to build their own secondary schools and have them staffed and operated by government.

13
Access and equity 4.1.3 Until very recent years the dominating feature of secondary school was its restrictive size. Eligibility for secondary school entry depended upon passing the PSLE. With its origin in colonial times, when its purpose was to select a small academic elite who would progress to secondary school and then to a university scholarship, the PSLE functioned as a classic “gatekeeper” examination. In 1998 only 21.3 percent of candidates passed PSLE. Most of these progressed to secondary school, with a Standard VII/Form 1 transition rate of 19.1 percent. By 2005 61.8 percent of candidates passed the exam and 49.3 percent of primary leavers were able to make the transition to Form 1. GER for Forms 1-4 has now reached 20.2 percent (NER = 13.4). In 2006 there were 675,672 students enrolled in secondary education, an increase of 133 percent on the enrolment five years previously. 4.1.4 Overall growth has been dramatic, but equity issues are still prominent. Gender equity has improved. Females have slightly increased their share of secondary enrolments over time, and in 2006 made up 48 percent of the Form 1 intake. Female GER for Forms 1-4 is now 19.3 percent, with a GER of 21.0 percent for males. However, females drop out of secondary school at a faster rate than males, and by Form 6 only 38 percent of students are female. The female GER of 2.4 percent for Forms 5 and 6 is not much more than half the male figure of 4.1 percent. Truancy is the main reason for dropping out of school for both boys and girls, but pregnancy is an additional reason for the higher proportion of girls dropping out of school compared to boys. Some actions instituted by the government to improve retention of girls in the schools include polices allowing girls to resume school after pregnancies, programs that empower girls to express their feelings, and summer science and mathematics camps that cultivate girls interest in these subjects and assist them to improve their performance in these areas. 4.1.5 Regional disparities persist:
• In Dar Es Salaam 51.4 percent of primary school leavers were selected for secondary
school in 2005; in Dodoma the equivalent figure was 37.2 percent and in Kigoma and Morogoro the percentages were 30.2 and 27.0 respectively.
• The national average GER for Forms 1-6 of 14.8 percent conceals regional variations of 7.1 percent in Tabora, 7.4 percent in Lindi, 20.4 percent in Dar Es Salaam and 35.2 percent in Kilimanjaro.
• In Dar Es Salaam the average distance to secondary school is only 2.5km. In Lindi the distance is 25.1km, and in Rukwa and Shinyanga the distances are 21.3km and 20.5km respectively.
• There are considerable regional disparities in gender equity. The Gender Parity Index (GPI) for Forms 1-4 varies from 0.72 in Mara to 1.07 in Kilimanjaro.
Quality of secondary education
4.1.6 If judged solely by the changing pattern of exam results, the quality of secondary education in Tanzania is improving. The pass rate in the Form 2 exam increased from 67 percent in 2003 to 73 percent in 2005; in the Form 4 exam (CSEE) the pass rate has improved from 75
14
percent in 1996 to 90 percent in 2005; and in the Form 6 exam (ACSEE) the pass rate has increased from 90 percent in 1997 to 96 percent in 2006. 4.1.7 However, although the trend of examination pass rates is improving, the majority of the passes are still in lower end of the pass mark. In 2005, 55.7 percent of the Form 4 exam passes were in the lowest grade (Division IV) while the other three Divisions (I, II and III) made up 33.6 percent (I, 5.2; II, 6.5, III, 21.9). The concentration of the pass rates on the lower end of the examination scale is related to the inadequate provision of quality improving inputs. For example:
• Between 2004 and 2006 alone, 1,050 community secondary schools were built. These
exemplify and embody parental aspirations for their children’s future after years of tightly restricted access to post-primary opportunities. However, such structures are necessarily basic, and libraries and laboratories are non-existent. Communities generally lack the resources to build science teaching facilities and where these facilities exist, they are often in poor condition. SEDP estimated that 4,000 science teaching areas would need to be built by 2009/10 just to remedy the lack of science teaching facilities in currently underserved areas. There is a continuing challenge to provide textbooks for all subjects on a 1:1 student: textbook ratio. Science equipment and materials are in acutely short supply.
• Class size is around 40 students. However, the only way this could be accomplished in the face of rapidly-rising student numbers and insufficient provision of classrooms was to move to a double shift system. This is now widespread, and it has reduced instructional time to less than 5 hours a day.
• There is a substantial shortage of qualified secondary teachers, especially in science, mathematics and English language. Government has responded to the shortage by introducing short-duration in-service training of Form 6 graduates. The Teacher Development and Management Strategy to be launched in 2007 is looking at longer-term methods of training and retaining secondary teachers. Estimates of teachers required cannot always be taken at face value, since they depend not just on the student: teacher ratio and teacher attrition but also on policy variables such as curriculum structure, instructional hours, and class size. With these caveats noted, SEDP estimated that some 6,600 new teachers would be required in 2007, rising to 14,000 in 2015.
4.2 Secondary Education Development Plan (SEDP) 4.2.1 The overall goal of the SEDP is to increase the proportion of primary leavers completing secondary education with acceptable learning outcomes. It is to be implemented over 15 years, with the first phase covering the period 2004-09. The Plan has five program areas:
• Improvement of access. The goal is to reach a transition rate of 50 percent from primary
to secondary by 2009. • Equity improvement, with the objective of ensuring equity of participation where gender
and income inequalities are severe and in underserved geographical locations.
15
• Quality improvement, as measured by a rise in the Form 4 pass rate to 70 percent8 and implemented through a reformed curriculum.
• Management reforms, by devolution of responsibilities to lower levels of management. • Management system improvement, through a strengthened inspectorate and greater
effectiveness of the regulatory framework, monitoring and evaluation, and resource use.
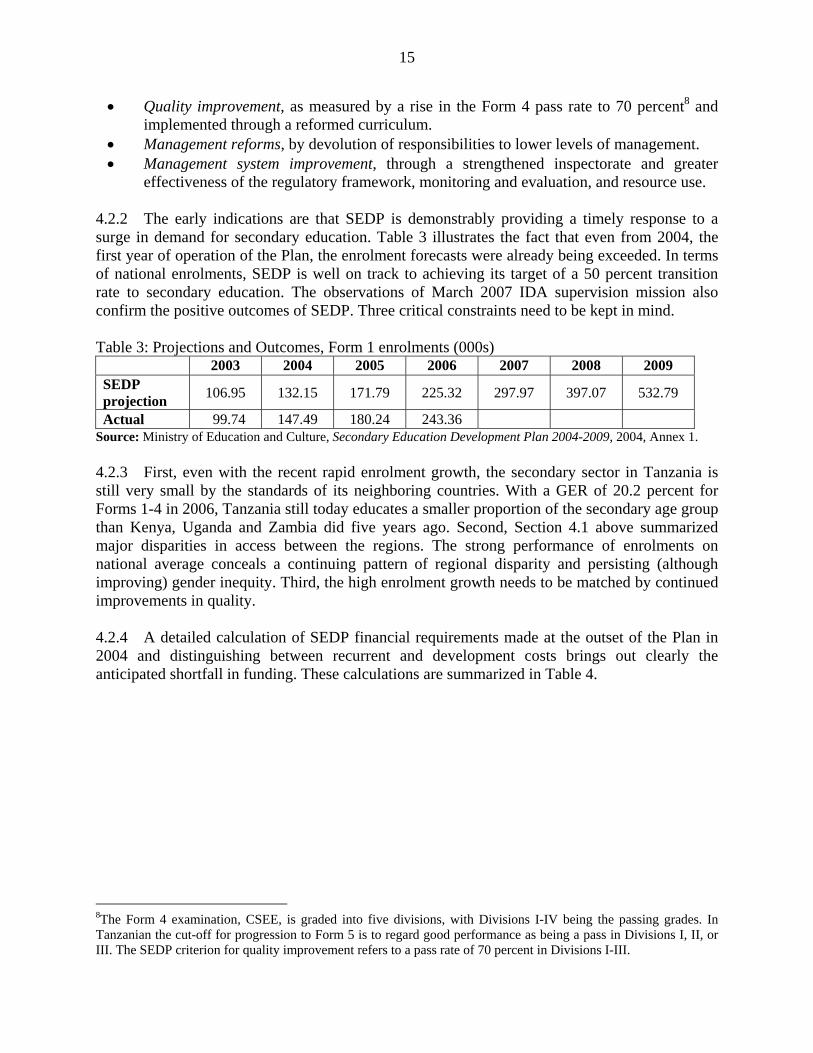
4.2.2 The early indications are that SEDP is demonstrably providing a timely response to a surge in demand for secondary education. Table 3 illustrates the fact that even from 2004, the first year of operation of the Plan, the enrolment forecasts were already being exceeded. In terms of national enrolments, SEDP is well on track to achieving its target of a 50 percent transition rate to secondary education. The observations of March 2007 IDA supervision mission also confirm the positive outcomes of SEDP. Three critical constraints need to be kept in mind.
Table 3: Projections and Outcomes, Form 1 enrolments (000s) 2003 2004 2005 2006 2007 2008 2009 SEDP projection 106.95 132.15 171.79 225.32 297.97 397.07 532.79
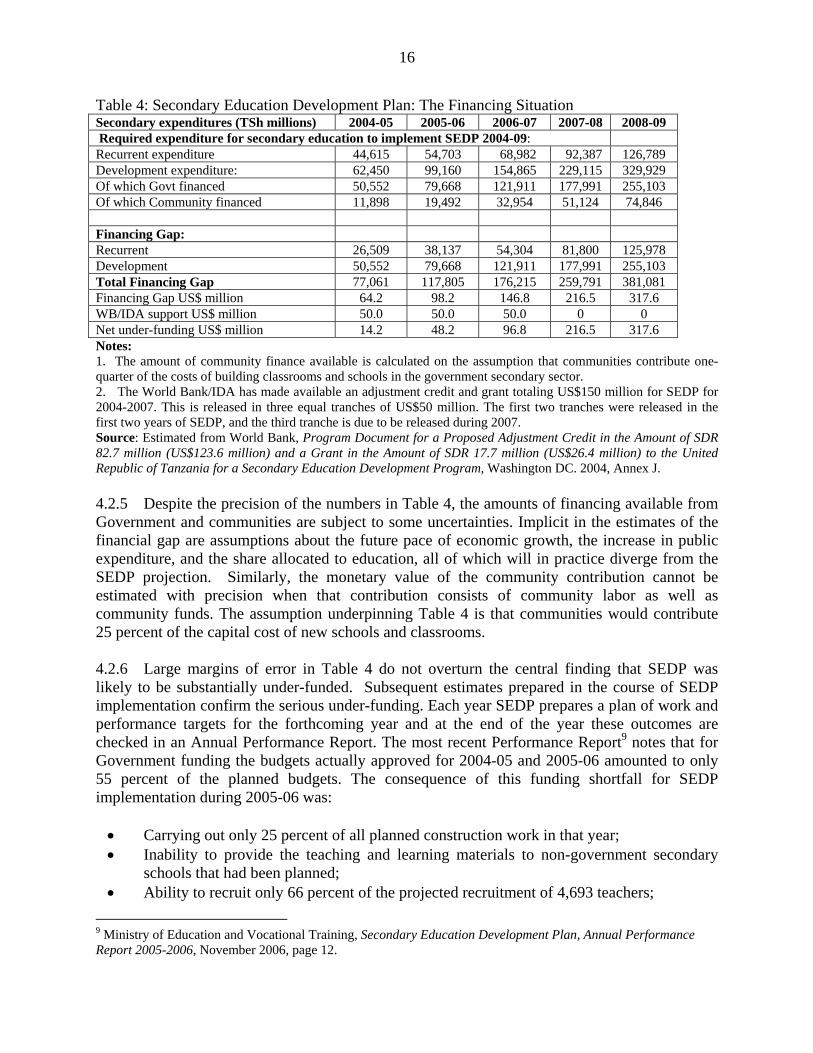
Actual 99.74 147.49 180.24 243.36 Source: Ministry of Education and Culture, Secondary Education Development Plan 2004-2009, 2004, Annex 1. 4.2.3 First, even with the recent rapid enrolment growth, the secondary sector in Tanzania is still very small by the standards of its neighboring countries. With a GER of 20.2 percent for Forms 1-4 in 2006, Tanzania still today educates a smaller proportion of the secondary age group than Kenya, Uganda and Zambia did five years ago. Second, Section 4.1 above summarized major disparities in access between the regions. The strong performance of enrolments on national average conceals a continuing pattern of regional disparity and persisting (although improving) gender inequity. Third, the high enrolment growth needs to be matched by continued improvements in quality. 4.2.4 A detailed calculation of SEDP financial requirements made at the outset of the Plan in 2004 and distinguishing between recurrent and development costs brings out clearly the anticipated shortfall in funding. These calculations are summarized in Table 4.
8The Form 4 examination, CSEE, is graded into five divisions, with Divisions I-IV being the passing grades. In Tanzanian the cut-off for progression to Form 5 is to regard good performance as being a pass in Divisions I, II, or III. The SEDP criterion for quality improvement refers to a pass rate of 70 percent in Divisions I-III.
16
Table 4: Secondary Education Development Plan: The Financing Situation Secondary expenditures (TSh millions) 2004-05 2005-06 2006-07 2007-08 2008-09 Required expenditure for secondary education to implement SEDP 2004-09: Recurrent expenditure 44,615 54,703 68,982 92,387 126,789 Development expenditure: 62,450 99,160 154,865 229,115 329,929 Of which Govt financed 50,552 79,668 121,911 177,991 255,103 Of which Community financed 11,898 19,492 32,954 51,124 74,846 Financing Gap: Recurrent 26,509 38,137 54,304 81,800 125,978 Development 50,552 79,668 121,911 177,991 255,103 Total Financing Gap 77,061 117,805 176,215 259,791 381,081 Financing Gap US$ million 64.2 98.2 146.8 216.5 317.6 WB/IDA support US$ million 50.0 50.0 50.0 0 0 Net under-funding US$ million 14.2 48.2 96.8 216.5 317.6 Notes: 1. The amount of community finance available is calculated on the assumption that communities contribute one-quarter of the costs of building classrooms and schools in the government secondary sector. 2. The World Bank/IDA has made available an adjustment credit and grant totaling US$150 million for SEDP for 2004-2007. This is released in three equal tranches of US$50 million. The first two tranches were released in the first two years of SEDP, and the third tranche is due to be released during 2007. Source: Estimated from World Bank, Program Document for a Proposed Adjustment Credit in the Amount of SDR 82.7 million (US$123.6 million) and a Grant in the Amount of SDR 17.7 million (US$26.4 million) to the United Republic of Tanzania for a Secondary Education Development Program, Washington DC. 2004, Annex J. 4.2.5 Despite the precision of the numbers in Table 4, the amounts of financing available from Government and communities are subject to some uncertainties. Implicit in the estimates of the financial gap are assumptions about the future pace of economic growth, the increase in public expenditure, and the share allocated to education, all of which will in practice diverge from the SEDP projection. Similarly, the monetary value of the community contribution cannot be estimated with precision when that contribution consists of community labor as well as community funds. The assumption underpinning Table 4 is that communities would contribute 25 percent of the capital cost of new schools and classrooms. 4.2.6 Large margins of error in Table 4 do not overturn the central finding that SEDP was likely to be substantially under-funded. Subsequent estimates prepared in the course of SEDP implementation confirm the serious under-funding. Each year SEDP prepares a plan of work and performance targets for the forthcoming year and at the end of the year these outcomes are checked in an Annual Performance Report. The most recent Performance Report9 notes that for Government funding the budgets actually approved for 2004-05 and 2005-06 amounted to only 55 percent of the planned budgets. The consequence of this funding shortfall for SEDP implementation during 2005-06 was:
• Carrying out only 25 percent of all planned construction work in that year; • Inability to provide the teaching and learning materials to non-government secondary
schools that had been planned; • Ability to recruit only 66 percent of the projected recruitment of 4,693 teachers;
9 Ministry of Education and Vocational Training, Secondary Education Development Plan, Annual Performance Report 2005-2006, November 2006, page 12.
17
• Inability to provide sufficient educational materials for special needs students as targeted for the year;
• Inability to carry out the planned number of inspection and support services; 4.2.7 The findings of the Performance Report suggest that the under-funding of SEDP is having an inevitable effect on the provision of school infrastructure, teachers and educational materials. In the face of high enrolment growth, the consequences for the quality of secondary education in terms of insufficient classrooms, lack of science teaching facilities, and a shortage of teachers and teaching materials are both apparent and serious. With the release of the third and final tranche of IDA support during 2007, the problem of funding SEDP during 2008 and 2009 will become even more acute. 5. THE PROGRAM 5.1 Program Concept and Rationale 5.1.1 Tanzania has made significant progress in the expansion of secondary education in the past decade, but access to secondary education is still low and the quality of secondary education remains a challenge. The Ministry of Education and Vocational Training has recognized that a broad program approach is the best instrument to reach the government's educational goals. A Secondary Education Development Plan (SEDP) has thus been drawn up to serve as the framework for supporting the development of secondary education. 5.1.2 SEDP was prepared with the extensive participation of all stakeholders in the education sector of Tanzania and is designed to be implemented through a SWAp arrangement. It has clear targets, a critical intervention and institutional framework for its implementation, and is planned to maximize resource utilization and attainment of set objectives. Development partner contributions specifically allocated to the cost of the program have been limited to the ear-marked budgetary support from the IDA. One explanation for this is that at the time SEDP was being formulated in 2004, the focus of other major development partners supporting the education sector was on primary education. And, when the primary education program they were supporting closed in 2006, assistance from the development partners moved to general budget support. Therefore, because most development assistance now takes place through general budget support, the role of other development partners cannot be separately identified. However, as detailed in section 4.2, it is clear that the overall financial resources available are not adequate for the full implementation of the plan. The proposed ADF program can assist in meeting some of the resources requirement of SEDP during the final two years (2008 and 2009) of the plan. The ADF support for the implementation of SEDP is therefore appropriate and will further Tanzania’s attempts to realize its educational goals. 5.1.3 Support for SEDP is also consistent with the country’s strategies for reducing poverty as the program will support the second cluster of the NSGRP, namely improvement of quality of life and social well-being. In addition, the program is consistent with the Bank’s education sector policy which advocates improvement in the quality of basic and upper secondary education as a way of improving the provision of middle level skills in regional member countries. The ADF

18
program will also reinforce the achievements of the completed ADF Education II Project, which provided support for improvements in the quality of secondary education. 5.2 Bank Support for the Sector and Lessons Learned 5.2.1 To date the Bank has funded three education projects in Tanzania. The first two projects approved in 1978 and 1998 for ADF loans of UA 6.45 million and UA 20.00 million respectively are complete. The third project approved in 2003 is on-going and is due for completion in 2008. The projects aimed in general to increase access and improve the quality of primary, secondary and technical vocational education and build capacity for educational planning and management. 5.2.2 The on-going Support to the Strategic Action Plan for Vocational Education and Training Project aims to upgrade vocational teaching centers through the provision of infrastructure and educational materials and build capacity for training in vocational education and training. After some delay the implementation of the project activities are now on track. Construction at all six vocational centers is underway and the contract for training activities has been finalized. Disbursement rate is low, but 60% of the funds are committed and the remaining 40%, which is for equipment, the provision of which is to be phased with the construction works, will be committed before the end of the year. All project activities are expected to be completed by the project closing date of December 2008. The recently completed Education II Project has established 108 secondary science laboratories and 220 primary school classrooms, supported in-service training for over 1300 secondary school teachers and 3,500 primary school teachers and provided science and mathematics textbooks for students in 306 secondary schools and over a million primary school textbooks. The project completion report has been prepared in the second quarter of 2007. 5.2.3 Lessons learned from the implementation of the earlier projects will inform the new program. For example:
• Providing three science laboratories to each of the 36 secondary schools supported by
Education II Project was found to be too costly. Under SEDP the number of science laboratories provided to any school will be determined by school enrolments and in most cases not more than one science teaching area will be provided to any school.
• The bulk supply of textbooks to schools was found to be inefficient as the supply of the books is not always based on accurate information about the schools. This approach of providing textbooks also does not encourage the flourishing of local publishers and local book suppliers. Under SEDP the schools are receiving capitation grants which they use for the purchase of learning and teaching materials, including textbooks. This enables the schools to procure the books they need and in the quantities they can afford.
• The use of contractors to undertake the construction works under the project turned out to be problematic, largely due to the weak capacity of many of the contractors and the remoteness of many of the project sites. Under SEDP the schools and the local communities are responsible for the construction works at their schools. This is less costly and more sustainable approach to school infrastructure development.
19
5.2.4 Lessons learned from 2006 review of the Bank’s portfolio in Tanzania have also been taken into account in the design of the program. Among the lessons pointed out in the review is “the need for the Bank to re-examine its procedures to take into account emerging aid delivery modalities, in the context of harmonization of donors’ procedures to lessen the transaction costs placed on Government agencies that currently now have to cope with diverse donors’ procedures. This entails a move from project approach to sector-wide approach and direct budget support, and the Bank Group would have to take due cognizance of this move in its country programming and portfolio management”. The proposed ADF program has taken this recommendation into account and resources under the program will be channeled through sector budget support. Existing government procedures and institutional arrangements will also be used to deliver the assistance. 5.3 Program Area and Beneficiaries The ADF program aims to support the implementation of activities under the SEDP, which supports schools throughout Mainland Tanzania. Therefore secondary school students throughout the Mainland will benefit from the expanded and improved learning conditions. But since one of the objectives of SEDP is to improve the provision of secondary education in underserved remote areas, many of the beneficiaries of the program are expected to be students from rural communities. Other beneficiaries of the program will include students from poor households who will receive scholarships, under-qualified teachers who will receive in-service training to upgrade their qualifications, and school head teachers and school inspectors who receive training that will enhance their capacities to fulfill their duties more effectively. 5.4 Strategic Context 5.4.1 The program aims to contribute to the objectives of the Secondary Education Development Plan (SEDP) for 2004-2009, which is the basis for a Sector Wide Approach (SWAp) to the development of the secondary sub-sector. The SEDP is the first phase of a comprehensive program for the development of secondary education over a 15-year period. It aims primarily at contributing to improved access to quality formal and non-formal secondary education. In this context, the SEDP is the government’s instrument for advancing Tanzania’s MDG’s for secondary education. By supporting the objectives of the SEDP, the ADF support will therefore contribute to efforts aimed at reaching the MDGs. 5.4.2 SEDP guides the allocation of resources from the government budget and from the development partners for secondary education. The funds from the ADF support will therefore be focused on supporting the implementation of activities contained in SEDP. The ADF program will also be using existing funding modalities and institutional arrangements, thus improving their efficient utilization. Under the Joint Assistance Strategy for Tanzania, Tanzania’s preferred mode of assistance is general budget support. The Joint Program Document (JPD) prepared by Tanzania’s Development Partners Group also promotes this mode of assistance. Funds from the ADF program will therefore be provided through sector budget support. In this regard, the program is in line with the Bank’s strategy for 2006-2010 set out in the Cover Note for JAST and the JDP as well as the ADF-X lending program that was approved by the Boards in May 2007

20
5.4.3 It should also be pointed out that the sector policy and fiduciary frameworks that are in place meet the Bank’s conditions for providing assistance through sector budget support. And, this funding modality is the one through which the IDA assistance for SEDP is channeled. 5.4.4 Finally, given that the SEDP objectives are key elements of the government’s poverty reduction strategy, the ADF program will, through the SEDP, contribute to efforts to reduce poverty in the country. In Tanzania, human capital weakness is one of the major impediments to sustainable growth. The country does not have an adequate workforce (in either quantitative or qualitative terms) to support private sector development and more rapid economic growth. This is to a large extent due to the inadequate provision of secondary education in the country. By supporting the expansion and improvements of the quality of secondary education, the ADF support will assist in building the middle level skills needed for enhancing economic growth. 5.5 Program Objective The overall national sector goal for education is ensuring equitable access to quality primary and secondary education, universal literacy and expansion of higher, technical and vocational education. The objective of this ADF program is to support the implementation of SEDP, which aims to contribute to increased access and improved quality and equity of secondary education. 5.6 Program Description 5.6.1 SEDP has five program areas as follows: (i) improvement of access (ii) equity improvement; (iii) quality improvement; (iv) management reform and devolution of authority; and (v) education management system improvement. Each of these programs has sub-programs along with objectives, strategies and targets. The details under each program are as follows:
(a) Improvement of access 5.6.2 In view of the need to improve access to secondary education, the aim of this program is to assist increase the transition rate from primary to lower (O level) secondary education; increase the transition rate from lower secondary to upper (A level) secondary education; reduce failure rate at Form 2; and reduce the drop-out rate. This will be achieved through:
• Optimum utilization of teachers, tutors and physical facilities; • Expansion of school facilities, especially in underserved areas; • Support to the non-Government schools to increase their enrolment; • Expansion of open and distance learning programs; • Reduction of dropout, repetition and failure rates at all levels; and • Improving affordability by reduction of household education costs.
5.6.3 Under the program, in addition to expanding facilities through the provision of development grants to schools, policy measures such as raising the average number of students per teacher, increasing the average number of teaching periods per week, increasing class size, especially at upper secondary, expanding open and distance learning programs, reducing tuition
21
fees by half, and providing scholarships to students from poor household, are used to increase enrolment at the secondary level.
(b) Equity improvement
5.6.4 Given the disparities in the provision of secondary education in the country, this program aims to ensure equity of participation across geographical, gender, different disadvantaged groups and income levels so as to achieve balanced development. This will be achieved through:
• Providing schools in underserved areas; • Giving scholarships to children from poor families; • Improving education facilities for disadvantaged groups; • Improving facilities in schools with disabled children; and • Improving the performance and retention of girls.
(c) Quality improvement
5.6.5 The objective of this program is to have a responsive curriculum that addresses the skill needs of the population and an efficient and effective delivery system of the curriculum. This would mean an adequate and qualified number of teachers, as well as sufficient and appropriate teaching and learning materials, should be available in all schools to raise student achievement, and appropriate mechanisms for testing learning competencies must be in place. This is planned to be achieved through:
• Focusing and streamlining the curriculum by creating core subjects and structuring of the syllabi to address cross cutting issues such as HIV/AIDS, the environment and gender and health habits in the appropriate subjects;
• Training adequate number of teachers and tutors for all schools and colleges through a combination of expanded pre-service, continuous in-service and open and distance teacher education programs;
• Providing adequate financing for the provision of teaching and learning materials, through the introduction of capitation grants to schools, with the aim of achieving a student-book ratio of 1:1; and
• Improving the setting and relevance of examinations. (d) Management reforms
5.6.6 A number of operational functions for schools have been managed from the center. Most such functions will be devolved to the regions, districts and schools to improve the decision making process, encourage community participation and increase effectiveness and efficiency of the system. This is to be achieved through:
• Devolving authority of financial/operational management of schools to school boards; • Promoting accountability of heads of schools by reviewing reporting lines, regularity, and
their terms of recruitment, retention and promotion; • Developing school plans for execution; and • Training school heads, board members and management team.
22
(e) Education management system improvement
5.6.7 This program aims to strengthen the MoEVT’s capacity so that it becomes more efficient in executing its core functions of policy formulation, curriculum development and review, quality assurance, supervision, monitoring and evaluation, the coordination of program implementation and the provision of the regulatory framework. This will be achieved through:
• Strengthening the inspection system and regulatory mechanisms; • Providing capacity building at all levels for the implementation of SEDP; • Improving access to and use of Education Management Information System (EMIS) at all
levels; • Establishing communication and publicity for SEDP; • Strengthening monitoring and evaluation mechanisms.
5.6.8 The ADF program will support the implementation of all the programs under SEDP. It will contribute to the:
• provision of development grants to the schools for the improvement and expansion of the physical facilities;
• provision of capitation grants to the schools for the provision of teaching and learning materials and training of teachers;
• provision of scholarship to children from poor households; • support of programs that improve girls achievement and retention in the schools; • strengthening of the capacity for education management.
5.7 Financing Arrangements 5.7.1 The implementation of activities under SEDP started in late 2004 and since then many of the planned activities have been undertaken. However, because of the high demand for secondary education and the limited available resources, partial implementation of SEDP activities has been achieved. For example in 2005/2006, 1914 classrooms were planned to be constructed, but 1569 (about 80%) were built. Similarly, 3,094 teachers were recruited instead of the 4,693 planned, a shortfall of one-third of expected outputs. The ADF support can assist in meeting some of the resource requirements of SEDP. 5.7.2 The estimated total cost of SEDP over the five year plan period was TZS 1,433,084 million (equivalent to about US$ 1,146 million). The Plan is currently in its third year of implementation and is supported by government and community resources and an IDA credit of US$ 150 million. The IDA credit is provided through sector budget support, and in three tranches of US$ 50 million each. The first two tranches have already been disbursed and the remaining tranche of US$ 50 million will be disbursed in 2007. But there are two more years, 2008 and 2009, still left from the plan. The ADF support of UA 20 million will therefore meet some (about 6%) of the resource gaps that SEDP will experience in 2008 and 2009. Furthermore, in order to ensure the maximum effectiveness of the ADF support, ADF funds would also be made available through a sector budget support, to be disbursed in two tranches of UA 10 million each to support the implementation of SEDP work programs of 2008 and 2009.

23
5.7.3 Examination of Table 4 indicates that, in the original costing of SEDP, the financing gaps for 2008 and 2009 were estimated to be about US$ 216 and 326 million respectively. The ADF contribution of UA 20 million (about US$ 30 million) will meet about 7% and 5% of the financing gap of 2008 and 2009 respectively if provided in two tranches (one in 2008 and one 2009) of UA 10 million (US$ 15 million) each. To further address the problem of the financing gap the government is planning to approach IDA to provide a supplementary loan to support SEDP for the remaining years of the Plan. 5.7.4 However, it should be pointed out that SEDP is a plan that has to be continually updated, and because of the huge increases in secondary education enrolments in recent years, the resource requirements of the Plan are much higher than the original estimates. It is also significant to note that in addition to the provisions by the central government, significant resources from the LGAs and the communities, primarily for the construction of classrooms, is going to the sub-sector, following a government decision that every ward in the country should have at least one secondary school. 5.7.5 The rationale for choosing the financing modality of sector budget support for the program is based on the following: Tanzania’s preferred mode of assistance is budget support; sound fiduciary arrangements that meet the development partners’ requirement for budget support exist; the Bank implemented successfully earlier budget support operations in Tanzania; the IDA support for SEDP is being channeled through this mode of funding. 5.8 Environmental Impact The activities to be implemented under SEDP include new construction of school facilities. The ADF support for the implementation of SEDP activities is therefore classified as category II according to the Bank’s environmental guidelines. The government prepared an Environmental and Social Management Framework (ESMF). The Framework identifies mechanisms for identifying adverse environmental and social impacts associated with the implementation of activities supported by the SEDP. It also contains measures that need to be taken to mitigate the adverse impacts and actions that can assist in improving the physical and social environment of the schools. Furthermore, the ESMF outlines the responsibilities of various actors such as the school boards and the LGAs in addressing environmental and social concerns. A summary of socio-environmental impacts and mitigating measures are presented in Annex VI. 6. PROGRAM IMPLEMENTATION 6.1 Institutional Arrangements 6.1.1 The ADF program will use the institutional arrangements already in place for the implementation of SEDP. The MoEVT, in collaboration with the Prime Minister’s Office, Regional Administration and Local Government (PMO-RALG), is responsible for the implementation of the plan under the following institutional arrangements (Annex IV). 6.1.2 An Inter-ministerial Committee (ISC) is the overall coordinating committee of the ESDP. At the next lower level are sub-sectoral development committees, which include a Basic
24
Education Development Committee (BEDC) which deals with pre-primary, primary, secondary, non-formal, teacher education and vocational education and training. The development of SEDP is supervised by BEDC and the implementation of programs supported by SEDP is mainstreamed into the existing structures of MoEVT and PMO-RALG. At the MoEVT level, the Director of Secondary Education oversees the implementation of activities supported by SEDP, including development of work plans and monitoring of progress. The MoEVT is responsible for ensuring that the SEDP work plans and reports are prepared and submitted to BEDC on time and that all aspects of SEDP implemented by at the Ministry level, including capacity building and facilitation, are carried out in time. 6.1.3 The planning and implementation of the activities under SEDP are decentralized (Annex V). The secondary schools develop their school development plans and the Local Government Authorities (LGA) consolidate the school development plans into LGA education plans. The LGAs are also responsible for ensuring that the procedures laid down for use of resources are adhered to and that the performance reports, which are a consolidation of school reports, are prepared and submitted to the MoEVT. The Regional Secretariat, which is an extension of PO-RALG in the regions and has specialists in various sectors including physical planning and engineering services, provides advice to the Councils and secondary schools in the preparation of SEDP development plans, plans of action and performance reports. It also assists in the consolidation of council education plans, budgets and reports at the regional level in line with statutory requirements. 6.1.4 A recent modification in the institutional arrangements is the establishment of the position of a secondary education coordinator at each district. The increased number of schools and the government plans to decentralize more functions to the lower levels necessitated the creation of the position. The coordinators will assist schools and districts in monitoring the implementation of the programs and capacity building of schools and communities in the management of school development activities. The coordinators received training aimed at assisting them carry out their duties effectively. 6.2 Implementation Schedule The ADF support will be completed within a period of two years from date of effectiveness of the loan, assumed to be in the second quarter of 2008, and the implementation plan of the program will be as follows: ACTIVITY RESPONSIBLE AGENCY TARGET DATE Appraisal Mission ADF/GoT April 2007 Loan Negotiations ADF/GoT July 2007 Board Approval ADF July 2007 Loan Signature GoT/ADF October 2007 Loan Effectiveness GoT/ADF April 2008 Release of first tranche ADF June 2008 Annual Progress Report for 2008 GoT May 2009 Release of second tranche ADF June 2009 Annual Progress Report for 2009 GoT June 2010

25
6.3 Procurement Arrangements 6.3.1 Procurement under SEDP is decentralized and carried out using national procurement laws in accordance with Public Procurement Act (PPA) 2005. A review carried out in 2005 concluded that Tanzania had a broadly sound system of formal rules for procurement (see details in section 2.2). Detailed procurement rules and procedures for SEDP are outlined in the Procurement Manual (PM) developed for the Plan. The rules and procedures in the PM are in accordance with the regulations set in the PPA, which have been reviewed and found to be consistent with Bank’s rules and procedures and therefore acceptable to the fund. 6.3.2 Each secondary school, through a School Procurement Committee (SPC), is responsible for approving contracts with a limited threshold. The School Boards (SB) are required to approve the contracts of value above SPC thresholds. The procurement above approved SB thresholds is undertaken by Ministerial Tender Board (MTB). The functions of MoEVT with regard to procurement of work are confined to quality assurance, inspection and technical support in terms of preparing standard drawings, bidding documents, bill of quantities and technical specifications. 6.4 Disbursement Arrangements 6.4.1 The ADF loan of UA 20 million will be disbursed in two tranches of UA 10 million each following the entry into force of the loan agreement and fulfillment of specific conditions. The government will be required to open a special account with the Bank of Tanzania into which the funds will be disbursed. The funds will subsequently be transferred to the Treasury and ear-marked to support the SEDP. The release of the first tranche will be subject to the presentation by the government of a costed annual work plan for 2008 and a satisfactory performance report for implementation of the activities planned for 2007. For the release of the second tranche, the government will be required to present a costed annual work plan for 2009 and a satisfactory performance report for implementation of the activities planned for 2008. 6.4.2 The proposal to disburse the funds in two tranches is based on the fact that by the time the ADF loan enters into force only two years will be left for the implementation period of SEDP. Therefore in order to link the provision of the ADF support to the annual work plans and performance reports, the disbursement of the ADF funds will be broken into two tranches, one in each of the remaining years of SEDP. 6.5 Monitoring and Evaluation 6.5.1 While specific outputs such as classrooms built or textbooks supplied continue to be important benchmarks and milestones, success in achieving the stated program outcomes will be measured by achievement of the SEDP operational targets of access, equity and quality in education. The indicators for these targets include: by 2009, (i) transition rate of 50% from primary to secondary reached from the 36% in 2004, (ii) gender parity index of 100% attained from the 86% in 2004, (iii) the percentage of students passing the CSEE at Division I-III increased to 70% from the 38% at 2004, and (iv) drop out rate reduced to 2% from the 6.6% in 2004. SEDP progress indicators for monitoring program achievements are consistent with those
26
outlined in National Strategy for Growth and Poverty Reduction for targets in education. Changes in these indicators are monitored annually through the data collected from the schools and analysis by the policy and planning department of the MoEVT. Recent improvements in the Education Management and Information System of the MoEVT should assist in better monitoring and evaluation of the outcomes. Annual Joint Sector Reviews, where all education sector stakeholders, including government, CSO’s and development partners, provide venues for assessment of progress being made towards achievement of stated outcomes. 6.5.2 Monitoring and evaluation of program outputs are carried out through the preparation of annual work plans and annual performance reports for the implementation of the planned activities. The work plans are designed to meet SEDP’s annual targets and the performance reports cover progress measured against indicators set for SEDP. However, since the outputs that can be delivered depend on the budget available, the outputs stated in the work plans may vary from those set in SEDP projections. The performance reports present the extent to which the outputs in the work plans have been realized. They also report annual changes in the outcome indicators. The work plans and the performance reports are reviewed by all stakeholders. The Bank through its staff at TZFO will participate in these reviews and will provide inputs. 6.6 Financial Reporting and Auditing 6.6.1 An elaborate system of financial management and accounting guidelines has been developed for SEDP. The councils, schools and institutions that receive SEDP funds are therefore expected to follow these guidelines. In addition, to ensure efficient monitoring of the SEDP expenditure, the beneficiaries have their accounts audited by government auditors. SEDP utilizes the services of government internal auditors based at the MoEVT, zones, regions and councils. The auditors check the financial systems, operations and physical performance of the SEDP activities. The auditors visit the schools regularly to ensure that the SEDP activities are running as planned and examine issues such as enrolment figures reported by the schools, which form the basis for determining the capitation grant that goes to a school. 6.6.2 At the national level, the National Audit Office is responsible for the statutory audit of SEDP activities. The audit of the financial statements include: an assessment of the adequacy of accounting and internal controls systems to monitor expenditures and other financial transactions and ensure safe custody of SEDP-financed assets; a determination as to whether the implementing agencies of SEDP activities have maintained adequate documentation on all relevant transactions; and verification that expenditure submitted is eligible for financing, and identification of any ineligible expenditures. 6.7 Aid Coordination 6.7.1 Tanzania has made great progress in strengthening harmonization of its development assistance. The government finalized in December 2006 a Joint Assistance Strategy (JAST), which serves as the framework for guiding cooperation with development partners. It is expected that implementation of the JAST will enhance national ownership and leadership of the development process with a view to achieving increased aid effectiveness. The JAST serves as a
27
mechanism for channeling donor resources to support growth and poverty reduction oriented initiatives through result-based resource allocations, as stipulated in the NSGRP. 6.7.2 Education development is part of Cluster 2 of the NSGRP and the Development Partners (DPs) are committed to supporting the government in its efforts to increase access and improve the quality of education in the country. The DPs are also supportive of the government initiatives of mainstreaming cross-cutting issues such as gender and HIV/AIDS. Coordination of dialogue between the Government, DPs, and other stakeholder, including Civil Society Organizations (CSOs), is facilitated by the Prime Minister’s Office which chairs the Inter-Ministerial Steering Committee (IMSC) comprising Permanent Secretaries of Ministries and the Advisory Committee (AC), which is composed of Directors of Policy and Planning of Ministries and representatives of stakeholder DPs and CSOs. Below the IMSC are Sub-Sector Development Committees which are responsible for over-seeing development of sub-sectors in line with national polices. Annual Joint Reviews of the sector are undertaken to ensure effective integration of development assistance into policy formulation, planning and budget systems. The Bank, through its country office, participates in the sector reviews and the monthly meetings of the education Development Partner Group (DPG) and will take part in the reviews of the annual work plans and performance reviews of SEDP. 7. PROGRAM SUSTAINABILITY AND RISKS 7.1 Recurrent costs 7.1.1 SEDP is not a traditional capital expenditure project requiring careful attention to the possible neglect of recurrent costs. The Plan itself provides an integrated financial framework in which both the capital expenditure required for the program components and the associated recurrent cost implications are taken into account. By supporting the overall Plan, the proposed ADF assistance will therefore implicitly work within that integrated financial framework. 7.1.2 Recurrent expenditure for items such as maintenance of facilities and the provision of science teaching materials, is a persistent problem associated with expansion of the sector. In conceptual terms the answer lies in fully identifying all recurrent requirements through the integrated approach to capital and recurrent costs that is being followed by SEDP. In practical terms, SEDP disbursed TSh.4.3 billion in 2005-06 to secondary schools as a Capitation Grant. Using the Capitation Grant, schools were able to purchase teaching and learning material including textbooks, reference books and supplementary readers. 7.2 Program Sustainability 7.2.1 The sustainability of the proposed program derives principally from the fact that it will support a clearly identified national priority. With a largely successful program of primary expansion (PEDP) having been achieved, the Secondary Education Development Plan is currently the centerpiece of national education policy. SEDP is firmly embedded in the evolution of a strategy for education development in Tanzania, an evolution which started with the broad aspirations of the Education and Training Policy of 1995 and which is now embodied in the outcomes-based approach and performance targets of the National Strategy for Growth and
28
Poverty Reduction. In specific financial terms, the scale of Government commitment is shown in the fact that the share of the public education budget allocated to secondary education has been historically low (only 6.7 percent in 2003-04) but jumped to 12.5 percent in 2006-07. 7.2.2 Sustainability is also enhanced by the fact that SEDP is a program that demonstrably enjoys strong community support. SEDP addresses the access, equity and quality of secondary education, and the surging demand for places since 2004 (and the willingness of communities to build over 1,000 schools since then) is testimony to the depth of community support. 7.3 Critical risks and mitigating measures One risk associated with the program is that the expansion of secondary enrolments continues at such a rapid pace that balanced growth is threatened by critical resource shortages, especially of qualified teachers. Basic classrooms to accommodate extra students can be built quite quickly by a community; providing a qualified teacher is a slower process. Government is responding to this risk in two ways. The Teacher Development and Management Strategy (TDMS) to be launched in 2007 is looking at longer-term methods of training and retaining secondary teachers. Implicit in setting up the TEDP was the acknowledgement that lengthy periods of full-time pre-service teacher education may not be the most-effective way of preparing teachers. Second, Government has responded to the requirement for additional teachers by incorporating into SEDP programs of short-duration in-service training. In 2005-06 1,337 diploma and licensee teachers were enrolled in in-service programs, and 570 diploma tutors were enrolled in upgrading programs. 8. PROGRAM BENEFITS 8.1 The Economic and Educational Context 8.1.1 In recent years secondary education has become a focus of increasing policy debate and analysis in developing countries. The reason for this lies predominantly in the worldwide demand for secondary education. Efforts to achieve Education for All (EFA) as part of the Millennium Development Goals have had a direct impact on secondary education. As more countries have approached universal primary schooling, rising individual and family aspirations have resulted in sharply rising demand for secondary education. Because EFA policies in practice place lower secondary education within the realm of basic education, secondary education has become an integral part of EFA efforts. Furthermore, there has been some international reassessment of the important role of secondary education in economic and social development. 8.1.2 Globalization, the increased importance of knowledge as a driving force in economic development and the consequent skill-biased nature of technological changes in the workplace are putting additional pressure on national governments to revamp their secondary education systems in order to produce school-leavers who are well prepared for work. Economies increasingly need a more sophisticated labor force equipped with competencies, knowledge, and workplace skills that cannot be developed only in primary school or in low-quality secondary school programs. Tanzania is at an early stage of economic development, but there is now
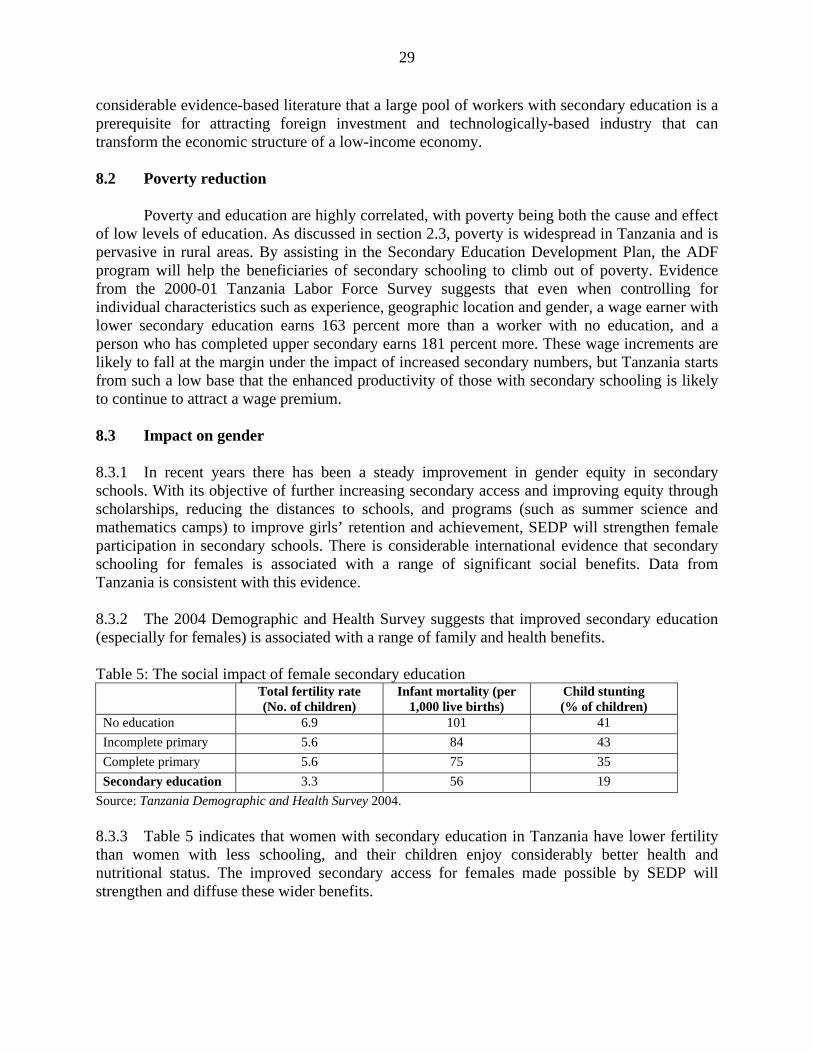
29
considerable evidence-based literature that a large pool of workers with secondary education is a prerequisite for attracting foreign investment and technologically-based industry that can transform the economic structure of a low-income economy. 8.2 Poverty reduction Poverty and education are highly correlated, with poverty being both the cause and effect of low levels of education. As discussed in section 2.3, poverty is widespread in Tanzania and is pervasive in rural areas. By assisting in the Secondary Education Development Plan, the ADF program will help the beneficiaries of secondary schooling to climb out of poverty. Evidence from the 2000-01 Tanzania Labor Force Survey suggests that even when controlling for individual characteristics such as experience, geographic location and gender, a wage earner with lower secondary education earns 163 percent more than a worker with no education, and a person who has completed upper secondary earns 181 percent more. These wage increments are likely to fall at the margin under the impact of increased secondary numbers, but Tanzania starts from such a low base that the enhanced productivity of those with secondary schooling is likely to continue to attract a wage premium. 8.3 Impact on gender 8.3.1 In recent years there has been a steady improvement in gender equity in secondary schools. With its objective of further increasing secondary access and improving equity through scholarships, reducing the distances to schools, and programs (such as summer science and mathematics camps) to improve girls’ retention and achievement, SEDP will strengthen female participation in secondary schools. There is considerable international evidence that secondary schooling for females is associated with a range of significant social benefits. Data from Tanzania is consistent with this evidence. 8.3.2 The 2004 Demographic and Health Survey suggests that improved secondary education (especially for females) is associated with a range of family and health benefits. Table 5: The social impact of female secondary education
Total fertility rate (No. of children)
Infant mortality (per 1,000 live births)
Child stunting (% of children)
No education 6.9 101 41 Incomplete primary 5.6 84 43 Complete primary 5.6 75 35 Secondary education 3.3 56 19
Source: Tanzania Demographic and Health Survey 2004. 8.3.3 Table 5 indicates that women with secondary education in Tanzania have lower fertility than women with less schooling, and their children enjoy considerably better health and nutritional status. The improved secondary access for females made possible by SEDP will strengthen and diffuse these wider benefits.
30
8.4 Impact on HIV/AIDS As part of its program of quality improvement, a key SEDP strategy is to restructure the curriculum so that the syllabi designed take into account cross-cutting issues such as HIV/AIDS and health and hygiene. In addition to giving importance to the teaching of information on sexual and reproductive health (SRH), sexually transmitted infections (STI), and HIV/AIDS, SEDP is carrying out the training of teachers in SRH/STI and HIV/AIDS. Up to June 2006 2,500 teachers had been trained in teaching issues of prevention and life skills. 9. CONCLUSIONS AND RECOMMENDATIONS 9.1 Conclusions To address the inadequate provision of educational services in the country, the government of Tanzania formulated a policy framework, outlining the policies and strategies for the development of the education sector, and also developed an education sector development program that translates the priorities in the policy framework into an implementation plan. The ADF assistance will support these policies and strategies by contributing to the implementation of the secondary education development plan aimed at increasing access and the improvement of the quality and equity of secondary education provided in the country. It will contribute to efforts to provide resources for the improvement of the physical facilities, the provision of teaching and learning materials, the training of teachers, reduction of barriers to secondary education by children from poor households, supporting programs that improve girls’ retention and achievement, and the strengthening of the capacity for education management. 9.2 Recommendations and Conditions for Loan Approval It is recommended that an ADF loan not exceeding UA 20.00 million be granted to the government of Tanzania for the purpose of supporting the implementation of the program described in this report. The loan will be subject to the following specific conditions: (a) Conditions Precedent to Entry into Force of the Loan of Agreement The entry into force of the Loan Agreement shall be subject to the fulfillment by the Borrower of the provisions of Section 5.01 of the General Conditions Applicable to Loan and Guarantee Agreements. (b) Conditions Precedent to Disbursement The Fund’s obligation to make the disbursement of the loan shall be conditional upon the entry into force of the Loan Agreement and the fulfillment by the borrower of the following conditions:
i) For the release of the first tranche of UA 10 million, the Borrower shall have provided evidence satisfactory to the Fund of: (a) having opened a foreign currency account (the “Special Account”) at the Bank of Tanzania, into which the proceeds of the loan shall be
31
deposited (paragraph 6.4.1); (b) the work program for SEDP for the year 2008/2009; and (c) a satisfactory annual performance report of the implementation of the SEDP work program for the year 2006/2007 (paragraph 6.4.1).
ii) For the release of the second tranche of UA 10 million, the Borrower shall have provided
evidence satisfactory to the Fund of: (a) the work program for SEDP for the year 2009/2010 and (b) satisfactory annual performance report of the implementation of the SEDP work program for the year 2007/2008 (paragraph 6.4.1).
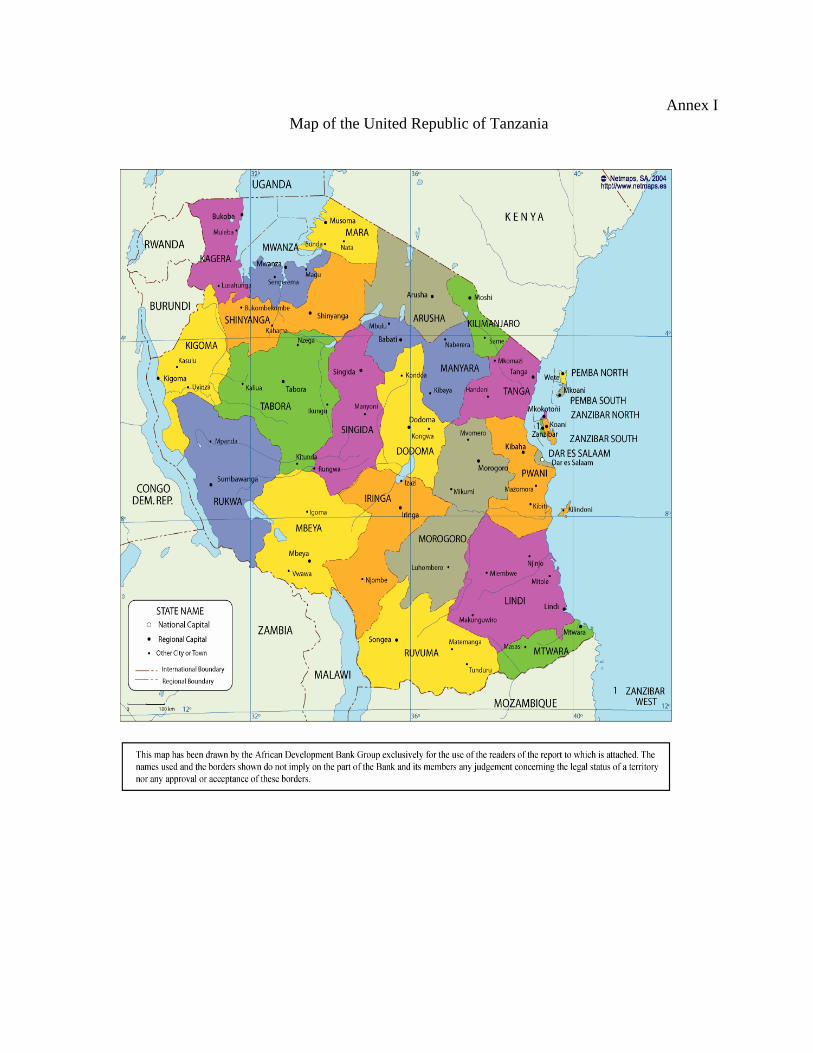
Annex I Map of the United Republic of Tanzania

Annex II
IMF’S ASSESSMENT OF TANZANIA’S MACROECONOMIC FRAMEWORK
Press Release No. 07/26 International Monetary Fund FOR IMMEDIATE RELEASE Washington, D.C. 20431 USA February 16, 2007 IMF Executive Board Completes Sixth Review Under Tanzania's PRGF Arrangement and Approves a Three-Year Policy Support Instrument Press Release No. 07/26 February 16, 2007
The Executive Board of the International Monetary Fund (IMF) today completed the sixth and last review of Tanzania's economic performance under a three-year Poverty Reduction and Growth Facility (PRGF) arrangement (see Press Release No. 03/128). The completion of the review enables a further release of SDR 2.8 million (about US$4.2 million) and will bring the total disbursements under the arrangement to SDR 19.6 million (about US$29.4 million).
The Executive Board also approved a three-year Policy Support Instrument (PSI) for Tanzania to support the country's economic efforts. The PSI seeks high and sustainable growth and more rapid poverty reduction based on enhancing public resource mobilization and efficiency of spending, increasing the financial sector's contribution to growth and the effectiveness of the monetary policy, and improving the business climate. Approval of a PSI for Tanzania signifies IMF endorsement of the policies outlined in the program.
The IMF's framework for PSIs is designed for low-income countries that may not need, or want, IMF financial assistance, but still seek IMF advice, monitoring and endorsement of their policies. PSIs are voluntary and demand driven. PSI-supported programs are based on country-owned poverty reduction strategies adopted in a participatory process involving civil society and development partners and articulated in a Poverty Reduction Strategy Paper (PRSP). This is intended to ensure that PSI-supported programs are consistent with a comprehensive framework for macroeconomic, structural and social policies to foster growth and reduce poverty. Members' performance under a PSI is normally reviewed semi-annually, irrespective of the status of the program. (see Public Information Notice No. 05/145).
Following the Board's discussion on Tanzania, Mr. Murilo Portugal, Deputy Managing Director and Acting Chairman, stated:
"Tanzania has achieved sustained strong economic performance through market-oriented policies within an appropriate macroeconomic framework. To consolidate recent successes, Tanzania will need to maintain sound policies and steadily pursue key structural reforms, including in the critical energy sector, and capacity building to remove key impediments to growth and achieve lasting inroads against poverty.
"The Tanzanian authorities are undertaking actions and commitments to address the allegations of an impropriety in the management of the government external payment arrears account managed by the Bank of Tanzania. The authorities remain committed to transparency and to consult with the Fund in adopting and implementing appropriate remedial measures.
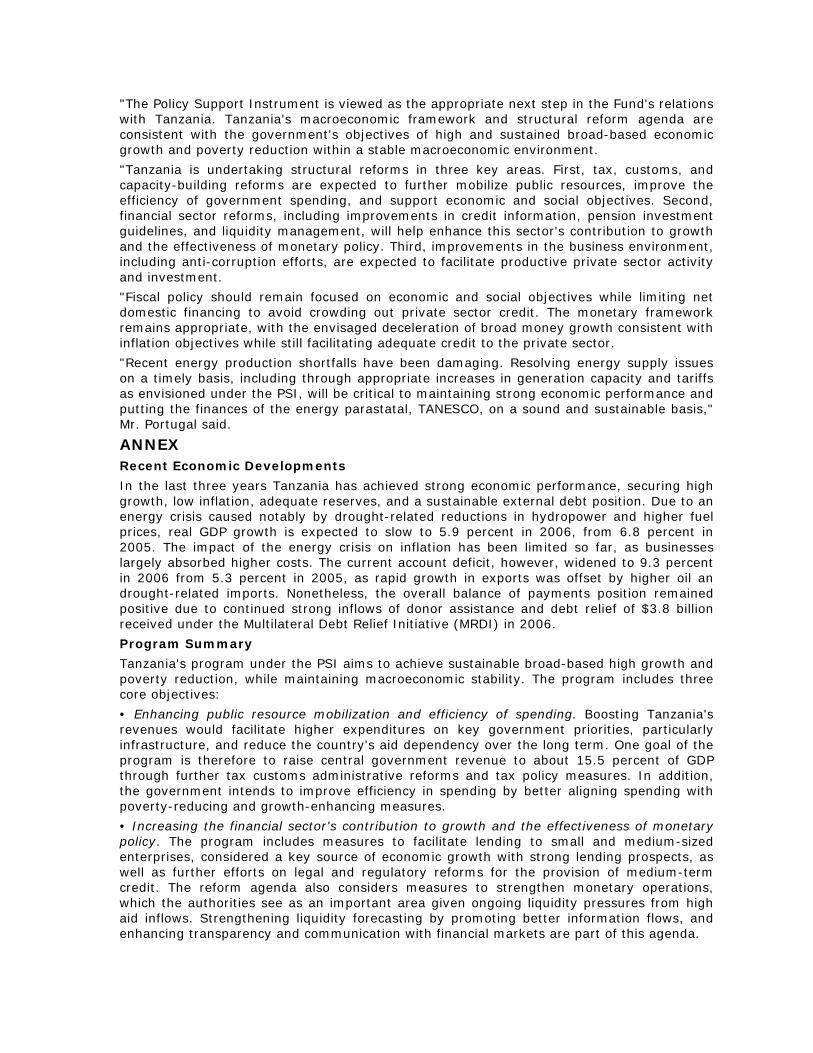
"The Policy Support Instrument is viewed as the appropriate next step in the Fund's relations with Tanzania. Tanzania's macroeconomic framework and structural reform agenda are consistent with the government's objectives of high and sustained broad-based economic growth and poverty reduction within a stable macroeconomic environment.
"Tanzania is undertaking structural reforms in three key areas. First, tax, customs, and capacity-building reforms are expected to further mobilize public resources, improve the efficiency of government spending, and support economic and social objectives. Second, financial sector reforms, including improvements in credit information, pension investment guidelines, and liquidity management, will help enhance this sector's contribution to growth and the effectiveness of monetary policy. Third, improvements in the business environment, including anti-corruption efforts, are expected to facilitate productive private sector activity and investment.
"Fiscal policy should remain focused on economic and social objectives while limiting net domestic financing to avoid crowding out private sector credit. The monetary framework remains appropriate, with the envisaged deceleration of broad money growth consistent with inflation objectives while still facilitating adequate credit to the private sector.
"Recent energy production shortfalls have been damaging. Resolving energy supply issues on a timely basis, including through appropriate increases in generation capacity and tariffs as envisioned under the PSI, will be critical to maintaining strong economic performance and putting the finances of the energy parastatal, TANESCO, on a sound and sustainable basis," Mr. Portugal said.
ANNEX Recent Economic Developments
In the last three years Tanzania has achieved strong economic performance, securing high growth, low inflation, adequate reserves, and a sustainable external debt position. Due to an energy crisis caused notably by drought-related reductions in hydropower and higher fuel prices, real GDP growth is expected to slow to 5.9 percent in 2006, from 6.8 percent in 2005. The impact of the energy crisis on inflation has been limited so far, as businesses largely absorbed higher costs. The current account deficit, however, widened to 9.3 percent in 2006 from 5.3 percent in 2005, as rapid growth in exports was offset by higher oil an drought-related imports. Nonetheless, the overall balance of payments position remained positive due to continued strong inflows of donor assistance and debt relief of $3.8 billion received under the Multilateral Debt Relief Initiative (MRDI) in 2006.
Program Summary
Tanzania's program under the PSI aims to achieve sustainable broad-based high growth and poverty reduction, while maintaining macroeconomic stability. The program includes three core objectives:
• Enhancing public resource mobilization and efficiency of spending. Boosting Tanzania's revenues would facilitate higher expenditures on key government priorities, particularly infrastructure, and reduce the country's aid dependency over the long term. One goal of the program is therefore to raise central government revenue to about 15.5 percent of GDP through further tax customs administrative reforms and tax policy measures. In addition, the government intends to improve efficiency in spending by better aligning spending with poverty-reducing and growth-enhancing measures.
• Increasing the financial sector's contribution to growth and the effectiveness of monetary policy. The program includes measures to facilitate lending to small and medium-sized enterprises, considered a key source of economic growth with strong lending prospects, as well as further efforts on legal and regulatory reforms for the provision of medium-term credit. The reform agenda also considers measures to strengthen monetary operations, which the authorities see as an important area given ongoing liquidity pressures from high aid inflows. Strengthening liquidity forecasting by promoting better information flows, and enhancing transparency and communication with financial markets are part of this agenda.

• Improving the business environment and enhancing investment. Further improving the business environment will facilitate private sector activity and investment. The program envisages efforts to remove key bottlenecks and impediments, including inadequate infrastructure and energy provision, weak governance and an overly burdensome regulatory environment. IMF EXTERNAL RELATIONS DEPARTMENT
Public Affairs Media Relations
Annex III Page 1 of 7
Fiduciary Risk Assessment 1. Tanzania has demonstrated an increasingly positive track record in directing its limited public resources towards the reduction of poverty. Also, significant improvements have been made and continue to be made in PFM. These improvements have been reflected in the increasing levels of budget and sector budget support since 2001, which includes 42% (more than $660 million in 2006/7) of all donor funds now being provided in general budget support. The HIPC assessment of 200410 ranked Tanzania as a top performer requiring ‘little’ upgrading of its PFM system. Tanzania has recently undertaken two PFM assessments, in 2005/6 and 2007 (although the results of the 2007 review on Local Governments has yet to be formally released), using the Public Expenditure and Financial Accountability (PEFA) Assessment methodology. The first assessment looked at the full budget and accounting cycle at the central level and the second at the district and local level. PFM weaknesses remain and with lower than necessary levels of human capacity fiduciary risks do exist, although they have reduced significantly since 2002. 2. The PEFA assessment is retrospective but it also includes a prediction of performance at the end of 2006 and early 2007, based on reforms and improvements planned or already underway. The PEFA team’s prediction is for further strengthening of the overall position and individual indicators during 2006 and 2007, through the PFMRP. The PEFAR is a detailed public financial management review providing a detailed review of the current status of PFM reforms and processes as well as a comprehensive overview of reforms and perspectives for subsequent years. The objective is to provide a benchmark against which to track progress in PFM performance over future years and to permit comparisons with other countries undertaking PEFA assessments. Moreover it provides a comprehensive evaluation of the priorities and the optimal focus of efforts in PFM. 3. The main statutory document which sets the framework within which PFM is exercised in Tanzania is the Public Finance Act (2001) and Public Finance Regulations (2001) which define in great detail the roles, functions and responsibilities in management of government revenue and expenditure. It clearly states the roles and responsibilities of all actors in the PFM system, including the Minister and Ministry of Finance, the Paymaster General, the Accountant General, the Accounting Officers and Warrant Holders in the Ministries Departments and Agencies (MDAs), as well as the Controller and Auditor General. It specifies the responsibilities of the Minister of Finance, together with the powers he may delegate to senior officials. The Act also defines the responsibilities of the Secretary to the Treasury, as well as those of the Controlling Officers, who are appointed by the President to be the Head of a Ministry or Department and are responsible for the collection, receipt and disbursement of public money. 4. Another key PFM-related Act is the Public Procurement Act – also of 2001, although it was amended in 2005, which defines the public procurement system and procedures. The
10 http://www1.worldbank.org/publicsector/pe/HIPC/HIPCBoardPaperApril2005.pdf.
Annex III Page 2 of 7
Act established the Public Procurement Regulatory Authority (PPRA). The Act describes the rules for and methods of public procurement, which are to be applied, as well as setting out the main principles and procedures for the different types of procurement available to the Ministry, Department or Agency. Finally, it identifies the tenderer’s right to request a review, as well as the need to undertake an audit of procurement activities and the production of an annual report by the Director of the PPRA to the Minister of Finance. 5. The PEFA assessment in Tanzania is one of twelve that have been completed or are at final stages of approval (these include Zambia, Ghana, Afghanistan, Kyrgyz Republic, Mozambique, Tanzania, Uganda, Guatemala, Panama, Bangladesh, Moldova and Fiji). The PEFA reviews were undertaken in full collaboration with the Government of Tanzania, which has accepted the findings and has drawn up an action plan (within the PFMRP) to prioritize and take forward the numerous recommendations. Tanzania achieved 5As (top marking), 10Bs, 14Cs and 3Ds – these results compare very favourably with reports undertaken in other countries and reflect one of the best PFM systems, ranked against other countries who have completed a PEFA assessment, and well above average scores11. 6. The PEFA assessment is a structured methodology, which enables country PFM performance to be measured and evaluated over time. It concentrates on the national government’s PFM system and the operations at the sub-national government level. The main areas that are covered are:
• Credibility of the budget – whether the budget is realistic and is implemented as intended.
• Comprehensiveness and transparency – whether the budget and the fiscal risk oversight are comprehensive and whether fiscal and budget information is accessible to the public.
• Policy-based budgeting – whether the budget is prepared with due regard to government policy.
• Predictability and control in budget execution – whether the budget is implemented in an orderly and predictable manner and there are arrangements for the exercise of control and stewardship in the use of public funds, including procurement.
• Accounting, recording and reporting — whether adequate records and information are produced, maintained and disseminated to meet decision-making control, management and reporting purposes.
• External scrutiny and audit – whether appropriate arrangements are in place for scrutiny of public finances and whether the Executive follows up these views.
• Donor Practices – whether donors are predictable in their provision of budget support and provision of financial information and proportion of aid using national systems.
11 For a detailed summary of the findings of PEFA reviews see, ‘PFM Performance Measurement Framework: Report on Early Experience from Application of the Framework’, November 2006. http://www.pefa.org/PEFA%20Website%20--%20CURRENT%204-9-03/REEAF-Nov.3,2006.pdf.

Annex III Page 3 of 7
7. Credibility of the Budget: The credibility of the budget is the strongest part of the Tanzanian PFM system. There is negligible variance in terms of aggregate expenditure out-turn compared to the original approved budget, although the composition of expenditure remains somewhat volatile. In terms of revenue, out-turns in 2004/05 actually exceeded projections and in previous years revenue out-turns have met budgeted revenue collection targets. All expenditure arrears were cleared as of December 2000. There are very few new expenditure arrears and where they exist they are always remedied quickly. 8. Comprehensiveness and Transparency: As part of the IFMIS system the Government introduced the Government Financial Statistics (GFS)-based economic classifications for the central government budget and these were rolled out to local authorities in 2004. Budget documentation includes the relevant documentation and non-donor funded extra budgetary spending is less than 5%, which is one of the best in Africa. There is a clear and transparent formula based mechanism for the transfer of block grants from central government to local government. The report highlights some weaknesses in the oversight of aggregate fiscal risk, although this is solely related to parastatals and not sub-national governments. Key fiscal information is published, including external audit reports, although the format is not easily understood to the general public. 9. Policy Based Budgeting: There is orderliness and participation in the annual budget formulation process as a comprehensive budget calendar exists and detailed budget guidelines are produced. A 3-year MTEF is prepared and the Government includes this three year rolling MTEF in its budgetary system. There are some concerns that recurrent costs of project investments are not adequately planned for, although this relates as much to donor practices of non-reporting of activities and cost over-runs in projected activities. 10. Predictability and control in budget execution: Information on taxpayer responsibilities are set out, although the information is not always clear. The Tax Revenue Board and Tribunal have been established and discretionary powers in tax legislations have been largely removed. A tax registration system does exist and penalties for non-compliance exist although the impact of these penalties needs to be strengthened. Predictability in the availability of funds for commitment of expenditures is increasing, and although budget adjustments are frequent they are done in a transparent manner. All foreign debt is recorded on a computerized debt management system and all loans and guarantees are now approved by the Ministry of Finance. In terms of payroll controls, the Integrated Human Resource Payroll Management System (IHRPMS) is generally considered robust and the possibility of ghost employees is now significantly reduced. On the non-salary expenditure side, the internal control system has a comprehensive set of controls and extensive training has taken on the application of the financial rules and regulations. The internal audit function exists and many of the regulatory institutional and programmatic measures on which to build an effective internal audit function are now in place. 11. With respect to procurement, the CPAR of 2003 made several recommendations including: (i) separating the operational and regulatory functions of the Central Tender Board and transforming the Central Tender Board into a regulatory authority responsible for procurement policy and monitoring of public procurement; (ii) fully decentralizing
Annex III Page 4 of 7
procurement operations to MDAs; (iii) establishing a new cadre of procurement specialists and a system of certification for the same; (iv) restructuring the composition of the District Tender Boards to exclude councilors; (v) establishing a whistle-blowing mechanism to curb corruption in procurement, and; (vi) replacing the system of pre-shipment inspection by destination inspection. 12. The PEFAR report of 2005/6 highlighted the recent reforms of the procurement system that has ensured that Government obtains better value for its financial resources. The most critical achievement was the enactment of the new Public Procurement Act in May 2005, which abolished the Central Tender Board, fully decentralized the procurement function to MDAs and established a procurement oversight body, the Public Procurement Regulatory Authority (PPRA). Since its enactment, the PPRA has put priority on the dissemination of the new Act and the associated Regulations through several workshops and seminars. The Government has appointed the Board of Directors of PPRA and its Chief Executive Officer. The organization structure of the PPRA has been approved by its Board of Directors, and the PPRA is now fully staffed. In addition, the Government has fully operationalized the Public Procurement Appeals Authority (PPAA) by appointing board members, setting up a permanent office for it and issuing the Public Procurement Appeals Rules that sets up the procedure to be used by the Appeals Authority in handling complaints. 13. With the operationalization of the PPAA, Tanzania now boasts a fairly comprehensive and robust complaints review mechanism. At the local government level, the district tender boards have already been restructured and politicians are no longer involved in the procurement process. The influence of local politicians in the award of contracts has therefore been severely curtailed as a result of the ongoing procurement reforms. It is also worth noting that the Bank Group is working closely with the Government in this area and approved a project to provide support to the PFMRP in December 2004, specifically focusing on improving the procurement system. A recent donor review of the draft PEFAR findings stated that the strengthened procurement system has been crucial in the increased budget support as well as the increasing use of national systems by donors. It did highlight however that there were still some challenges in managing the procurement system largely at the Local Government level where capacity is weak, although it was noted that the challenges are being addressed through multi-year engagement in the Local Government Reform Program and the PFMRP. 14. Accounting, Recoding and Reporting: The timeliness and regularity of accounts reconciliation is of high quality and reconciliations of Treasury accounts are undertaken monthly and there is no major backlog. There are some weaknesses in the information on resources received by front line service delivery units. The quality and timeliness of in-year budget reports are also high, with internal budget reports produced within 2 weeks of month end and quarterly budget reports being published on the Ministry of Finance’s website. The quality and timeliness of annual financial statements are done so in a timely manner as evidenced by the reduced number of adverse audit reports. Despite previous problems with publication of audit reports, the 2004/5 NAO Audit Report was of international standard and released within 9 months as required by the Public Finance Act, as assessed as part of the Government’s GBS Performance Assessment Framework (PAF). A specialized committee of
Annex III Page 5 of 7
the legislature examines audit reports and completes hearings within 12 months with follow-up recommendations made. In terms of corruption measures, various organizations have been set up and a National Anti-Corruption Strategy and Action Plan are in place. 15. A safeguards assessment of the Bank of Tanzania (BOT) is crucial given that it is the institution through which funds for budget support are channeled. To this end, the IMF completed the safeguards assessment of the BOT in December 2003 and noted that while the bank had a relatively strong internal control environment, some vulnerability existed, notably in the external audit and financial reporting areas. In order to address these vulnerabilities, the IMF made a number of recommendations, most of which the BOT has since implemented. These include: (i) annual external audits that are conducted in accordance with International Standards on Auditing (ISA); (ii) adoption of International Accounting Standards (IAS) as the financial reporting framework; (iii) establishment of a formal process of reconciling accounting data to the program data reported to the Fund; (iv) publication of the full audited financial statements on a timely basis, within five months of the financial year's end, and; (v) adoption of an audit charter for the internal audit function to strengthen audit methodologies and procedures. Credibility of the Reform Program (PFMRP) 16. The Government’s PFM Reform Program was first developed in the late 1990s, to bring greater coordination to the different initiatives underway. However in general the funding of the components of the PFMRP remained as individual arrangements between the relevant department and the donor. This resulted in piecemeal PFM reforms being taken forward in an un-sequenced manner. In addition, linkages were not developed to other reform processes in government including the Public Sector Reform Program. 17. In 2001, the first in-depth comprehensive diagnostic work of PFM was undertaken through the CFAA. The process of discussing the findings and recommendations at a consultative workshop, and of action planning based on the findings and recommendations were pursued by the Government to revive the PFMRP by developing a revised, integrated PFMRP action plan. This brought together the ongoing reforms with the implications of the CFAA and other assessments (such as the first HIPC Assessment and Action Plan and the IMF’s Fiscal Transparency ROSC), and established arrangements for the coordination of the different projects within that framework. In addition, a CPAR was prepared in 2003 which identified key improvements required in the procurement function, which were taken into account during the revision of the PFMRP. At the time the PFMRP involved a set of medium-term reform projects including strengthening of PFM policy development, budget management, procurement, external resource management, and external audit, and roll out of the Integrated Financial Management Information System (IFMIS). In fact, the PEFAR 2005/6 report found that the IFMIS system has been transformational for the PFM system and assessed implementation of the IFMIS system as truly impressive. The IFMIS system has become a model in Africa and countries such as Malawi have chosen to implement the Tanzanian system.

Annex III Page 6 of 7
18. By 2005, this reform program had become a government-led, coordinated process. Comprehensive arrangements are in place and are fully established. The Government has demonstrated significant leadership and administrative capacity. A monitoring and evaluation framework for the PFMRP has been development. In terms of capacity there is an overarching framework for Government and donors on the PFMRP agenda, including on the support provided by donors for implementation, including a joint funding mechanism to pool assistance from donors supporting the PFMRP. A single set of planning, budgeting and financial management arrangements apply to the Basket Fund, executed by the Government. This has reduced transaction costs and allowed the Government to concentrate on important PFM reforms. 19. The PFM reform program in Tanzania is credible in that:
• There has been Parliamentary approval of the new and updated Public Finance and Public Procurement Acts, which provides a robust legal framework for instilling fiscal discipline and strengthening accountability and transparency.
• The establishment of the overarching PFMRP, which provides a comprehensive Government owned strategy around which donor capacity building support has been aligned.
• The establishment of the joint Government-donor Group of PFM meeting regularly to discuss PFM issues and it being directly linked to the General Budget Support Review and PAF indicators.
• Continued fiscal discipline staying within the approved budget. This has been maintained over a number of years and has increased significantly the credibility of the annual budget.
• The rolling out of IFMIS and the specific allocation of Government resources to the roll out of the IFMIS system including at the Local Government Level.
• Linked to the IFMIS system, the establishment of a Centralized Payment System which along with IFMIS has been operating in all Ministries.
20. Progress on the reforms – and the quality of what is delivered – is monitored both through individual project and program mechanisms and at a higher level through the GBS Joint Reviews. The specific benchmarks in the PAF and the PFMRP are 100% consistent so improvements in PFM are directly linked to donors’ budget support. Key recommendations from PFMRP are addressed systematically and are taken as PAF actions. Together these mechanisms provide a systematic and thorough monitoring process to review progress. Problems are now not avoided but they are identified relatively early, the machinery exists to raise them with the Government and to address them. It is acknowledged that there is strong country leadership of the PFMRP and issues of human and institutional capacity inhibiting the realization of benefits from PFM reform are being systematically assessed and supported by donors through a Basket Technical Assistance Fund. Support to PFM is therefore significant and is in fact one area where substantial amounts of training have already been delivered. The increasing use of the GBS process and PFMRP will assist in this area, including continue Bank engagement in this area from the Bank Group’s Country Office.
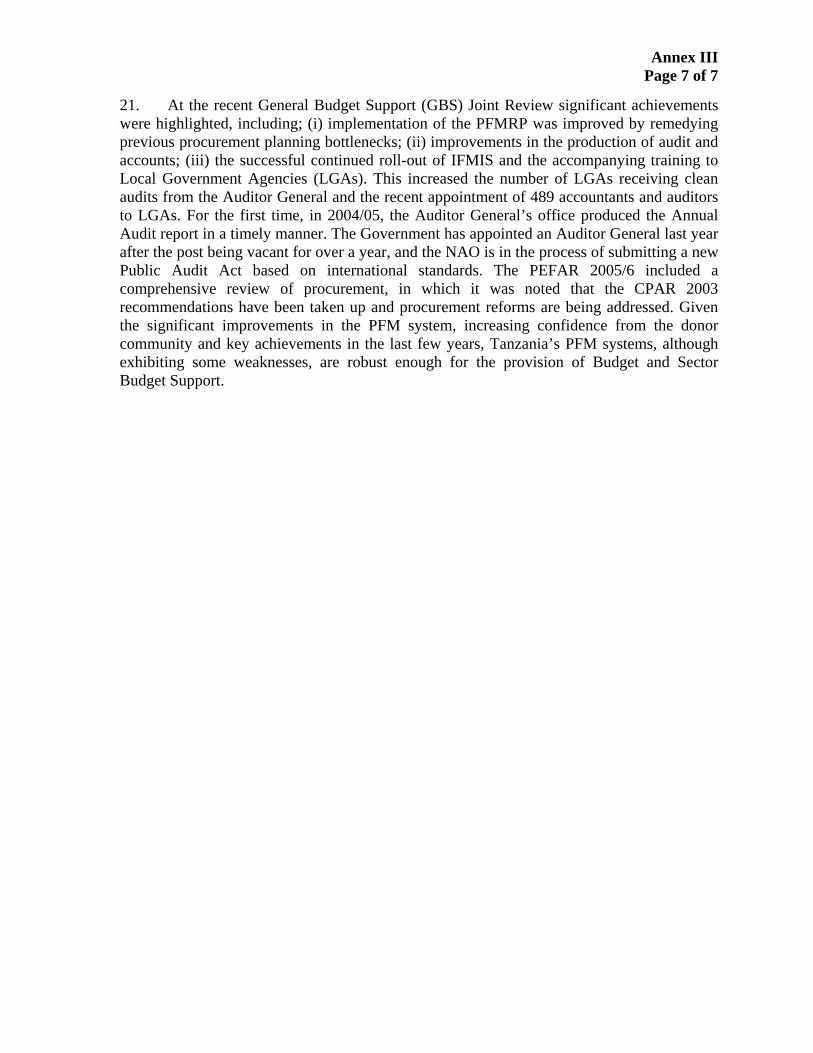
Annex III Page 7 of 7
21. At the recent General Budget Support (GBS) Joint Review significant achievements were highlighted, including; (i) implementation of the PFMRP was improved by remedying previous procurement planning bottlenecks; (ii) improvements in the production of audit and accounts; (iii) the successful continued roll-out of IFMIS and the accompanying training to Local Government Agencies (LGAs). This increased the number of LGAs receiving clean audits from the Auditor General and the recent appointment of 489 accountants and auditors to LGAs. For the first time, in 2004/05, the Auditor General’s office produced the Annual Audit report in a timely manner. The Government has appointed an Auditor General last year after the post being vacant for over a year, and the NAO is in the process of submitting a new Public Audit Act based on international standards. The PEFAR 2005/6 included a comprehensive review of procurement, in which it was noted that the CPAR 2003 recommendations have been taken up and procurement reforms are being addressed. Given the significant improvements in the PFM system, increasing confidence from the donor community and key achievements in the last few years, Tanzania’s PFM systems, although exhibiting some weaknesses, are robust enough for the provision of Budget and Sector Budget Support.
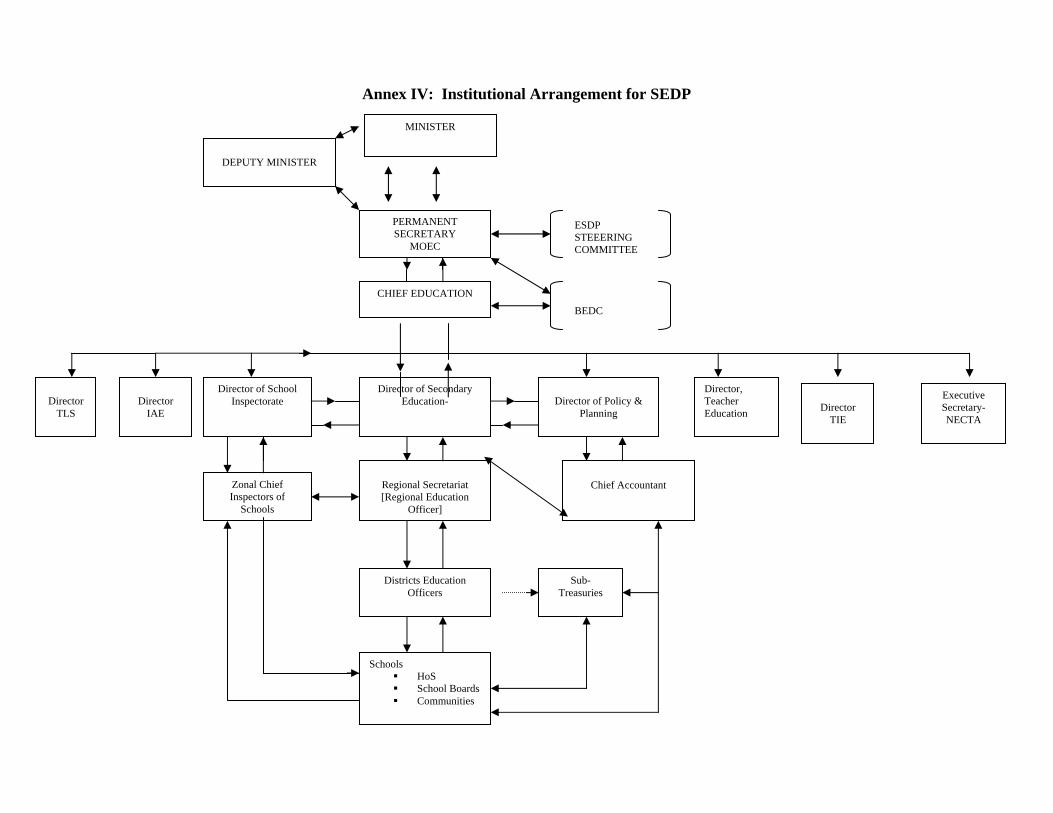
Annex IV: Institutional Arrangement for SEDP
ESDP STEEERING COMMITTEE
BEDC
MINISTER
PERMANENT SECRETARY
MOEC
CHIEF EDUCATION
Director of Secondary Education-
Regional Secretariat [Regional Education
Officer]
Districts Education Officers
Schools HoS School Boards Communities
Executive Secretary- NECTA
Director of Policy &
Planning
Director, Teacher Education
Director
TIE
Director of School Inspectorate
Director
IAE
Chief Accountant
Sub-Treasuries
Director
TLS
Zonal Chief Inspectors of
Schools
DEPUTY MINISTER
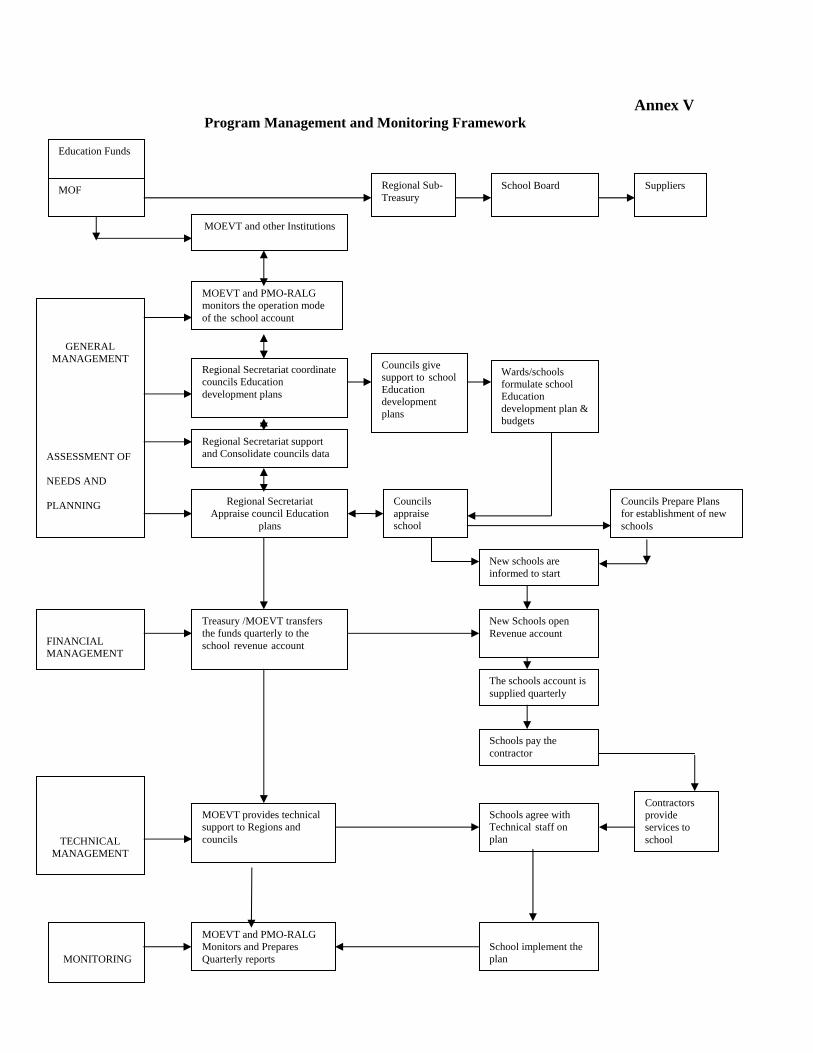
Annex V Program Management and Monitoring Framework
Education Funds
MOF
MOEVT and other Institutions
School Board Suppliers
GENERAL MANAGEMENT
ASSESSMENT OF
NEEDS AND
PLANNING
MOEVT and PMO-RALG monitors the operation mode of the school account
Regional Secretariat coordinate councils Education development plans
Regional Secretariat support and Consolidate councils data
Regional Secretariat Appraise council Education
plans
Councils give support to school Education development plans
Wards/schools formulate school Education development plan & budgets
FINANCIAL MANAGEMENT
Treasury /MOEVT transfers the funds quarterly to the school revenue account
Councils appraise school
New schools areinformed to start
New Schools open Revenue account
TECHNICAL
MANAGEMENT
MOEVT provides technical support to Regions and councils
MONITORING
MOEVT and PMO-RALG Monitors and Prepares Quarterly reports
The schools account is supplied quarterly
Schools pay the contractor
Schools agree with Technical staff on plan
Contractors provide services to school
School implement the plan
Regional Sub- Treasury
Councils Prepare Plans for establishment of new schools
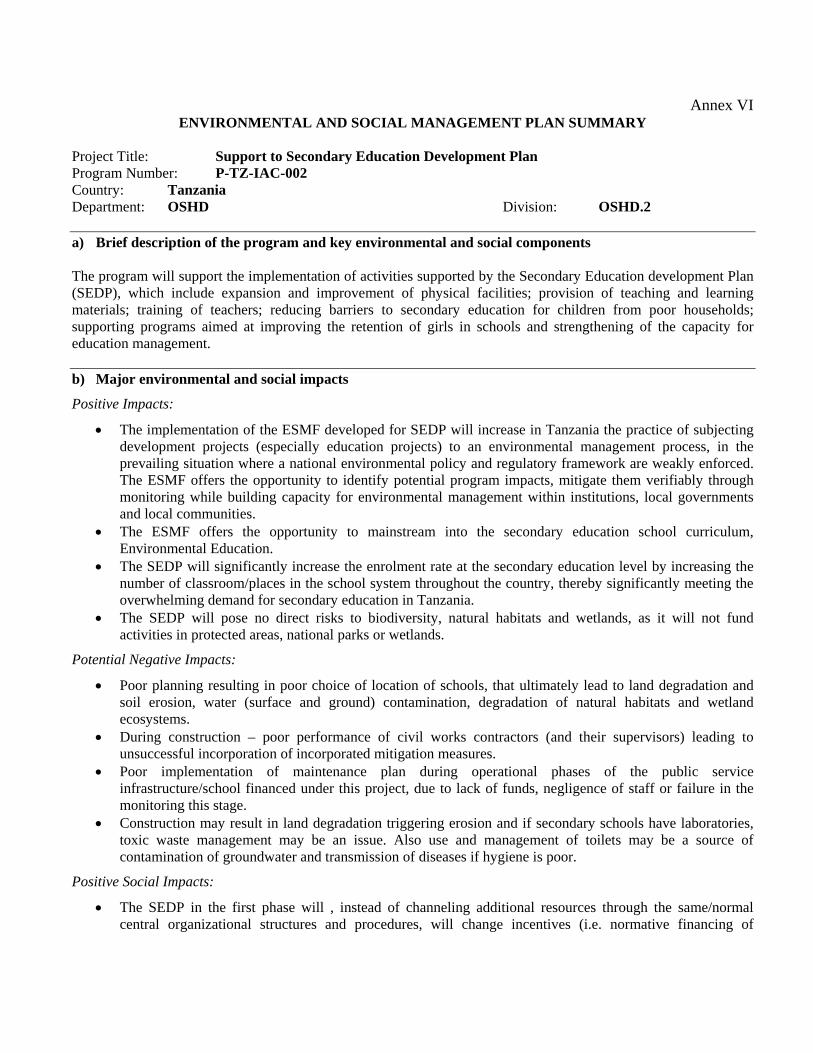
Annex VI ENVIRONMENTAL AND SOCIAL MANAGEMENT PLAN SUMMARY
Project Title: Support to Secondary Education Development Plan Program Number: P-TZ-IAC-002 Country: Tanzania Department: OSHD Division: OSHD.2 a) Brief description of the program and key environmental and social components The program will support the implementation of activities supported by the Secondary Education development Plan (SEDP), which include expansion and improvement of physical facilities; provision of teaching and learning materials; training of teachers; reducing barriers to secondary education for children from poor households; supporting programs aimed at improving the retention of girls in schools and strengthening of the capacity for education management. b) Major environmental and social impacts
Positive Impacts:
• The implementation of the ESMF developed for SEDP will increase in Tanzania the practice of subjecting development projects (especially education projects) to an environmental management process, in the prevailing situation where a national environmental policy and regulatory framework are weakly enforced. The ESMF offers the opportunity to identify potential program impacts, mitigate them verifiably through monitoring while building capacity for environmental management within institutions, local governments and local communities.
• The ESMF offers the opportunity to mainstream into the secondary education school curriculum, Environmental Education.
• The SEDP will significantly increase the enrolment rate at the secondary education level by increasing the number of classroom/places in the school system throughout the country, thereby significantly meeting the overwhelming demand for secondary education in Tanzania.
• The SEDP will pose no direct risks to biodiversity, natural habitats and wetlands, as it will not fund activities in protected areas, national parks or wetlands.
Potential Negative Impacts:
• Poor planning resulting in poor choice of location of schools, that ultimately lead to land degradation and soil erosion, water (surface and ground) contamination, degradation of natural habitats and wetland ecosystems.
• During construction – poor performance of civil works contractors (and their supervisors) leading to unsuccessful incorporation of incorporated mitigation measures.
• Poor implementation of maintenance plan during operational phases of the public service infrastructure/school financed under this project, due to lack of funds, negligence of staff or failure in the monitoring this stage.
• Construction may result in land degradation triggering erosion and if secondary schools have laboratories, toxic waste management may be an issue. Also use and management of toilets may be a source of contamination of groundwater and transmission of diseases if hygiene is poor.
Positive Social Impacts:
• The SEDP in the first phase will , instead of channeling additional resources through the same/normal central organizational structures and procedures, will change incentives (i.e. normative financing of
capitation grants) and accountabilities for results ( i.e. devolution of authority to lower levels). This will ensure a participatory process in planning and will raise incomes at lower levels.
• Through increase enrolment in secondary education, additional opportunities for public health awareness and education for protection and prevention against HIV/AIDS will be available for secondary school going age among boys and girls. It is this age group that is particularly vulnerable to this epidemic.
Potential Adverse Social Impacts
• No participatory process involving local communities in the preparation of their District and Regional
Secondary Schools Development Plans by their Local Governments. • Exclusion of vulnerable groups from participating in and benefiting from project activities, i.e., from
barriers to access to/ enrolment in secondary schools due to stigmatization, harmful cultural practices, acute poverty among vulnerable groups, discrimination, lack of participation in the planning process etc.
• Land acquisitions/use resulting in involuntary resettlement from impacts on people, land, property, including access to natural and other economic resources.
c) Enhancement and mitigation program The environmental and social screening form and checklist contained in the framework are specifically designed to ensure that adverse social impacts from SEDP activities are identified and captured in the planning stages and there-in effectively mitigated. Both environmental and social mitigation measures would be verifiable monitored during the various stages of the program cycle. d) Institutional arrangements and capacity building requirements The main institutions with key responsibilities for environmental and social management are:
• The Ministry of Education and the Presidents Office - Regional Administration and Local Government; • The National Environment Management Council (NEMC) • Local Government Authorities • The School Boards
e) Public consultations and disclosure requirements The program is designed to operate in a participatory approach where all activities will be implemented in close collaboration with local communities to increase their sense of ownership of the improved facilities under the program. f) Estimated costs The SEDP will finance all necessary capacity building activities at various levels for the ESMF implementation and monitoring in collaboration with the NEMC. All measures are mainstreamed in the program design, so that cost is integrated in the cost of different activities. g) Implementation schedule and reporting For environmental issues: 1) tree planting should be able to control erosion and at the same time provide shade and improve the landscape; 2) school management will put in place regular and laboratory waste management mechanisms; 3) health services will be provided to school children. The environmental management and monitoring will be implemented following the same program schedule as all activities are mainstreamed in the program design. Achievements/problems will be reported in the program progress reports and should be timely addressed by the Local Government Authorities through technical assistance to the School Boards, to enable them to perform the duties assigned to them in this ESMF. The Local Government Authorities and School Boards will also be assisted by service providers in situations where there is no in-house capacity to perform these roles.

Annex VII Ongoing Bank Group Operations in Tanzania, As at June 2007
Sector/ Project Fund
Source Approval
Date Sign. Date
Date Effective
Net Amount (UA mil)
Amount Disb.
(UA mil)
Disb. Ratio (%)
Last Disb.
Deadline
Last Audit
Report A. Agriculture Sector 1. Agric. Marketing Systems Dev. Programme ADF Ln 18Sep02 12May03 15Dec03 15.90 6.63 41.71 31Dec08 2006 ADG Gr 18Sep02 12May03 15Dec03 1.00 0.73 73.24 31Dec08 2006 2. District Agricultural Sector Investment ADF Ln 24Nov04 11Feb05 20Jul05 36.00 1.19 3.31 30Jun12 2006 ADG Gr 24Nov04 11Feb05 20Jul05 7.00 0.04 0.5 30Jun12 2006 Subtotal 59.90 8.59 14.34 B. Multisector 3. Institutional Support Project for Good Governance ADG Gr 13Dec04 11Feb05 11Feb05 4.80 0.66 13.77 31Dec08 4. Poverty Reduction Support Loan II (PRSL) ADF Ln 28Jun06 31Aug06 50.00 - 0 31Dec07 Subtotal 54.80 0.66 1.21 C. Social Sector 5. Education II Project ADF Ln 10Dec97 08May98 06Jan99 20.00 19.19 95.93 30Jun07 2006 6. Support to Strategic Action Plan for Voc.Tech.Edu ADF Ln 09Jul03 15Sep03 16Feb04 14.22 0.27 1.93 31Dec08 ADG Gr 09Jul03 15Sep03 16Feb04 1.60 - 0 31Dec08 7. Alternative Learning & Skills Development In Zanzibar ADF Ln 31Oct00 30Jan01 24Dec01 5.56 3.26 58.65 30Jun07 2005 ADG Gr 31Oct00 30Jan01 24Dec01 1.01 0.66 65.42 30Jun07 2005 8. Support to Maternal Mortality Reduction ADF Ln 11Oct06 29Nov06 05Mar07 40.00 - 0 31Dec12 9. First Health Rehabilitation Project ADF Ln 03Dec97 08May98 10Sep99 15.00 11.76 78.42 30Jun07 2005 10. Small Entrepreneurs Loan Facility ADF Ln 11Nov98 04Dec98 29Jul99 8.00 7.66 95.78 31Jul07 2006 Subtotal 105.39 42.81 40.62 D. Transport Sector 11. Roads Rehabilitation/Upgrading Project ADF Ln 03Sep01 28Sep01 05Nov01 38.65 14.27 36.91 30Mar09 2005 12. Zanzibar Roads Upgrading Project ADF Ln 09Jun04 24Jun04 05Oct04 16.22 4.41 27.18 31Dec07 ADG Gr 09Jun04 24Jun04 05Oct04 0.71 0.25 35.59 31Dec07 Subtotal 55.58 18.93 34.06 E. Water and Sanitation Sector 13. Rural Water Supply & Sanitation Program( ADF Ln 13Sep06 29Nov06 14Mar07 45.00 - 0 31Dec11 ADG Gr 13Sep06 29Nov06 14Mar07 10.00 - 0 31Dec11 14. Dar Es Salaam Water Supply & Sanitation ADF Ln 17Dec01 29May02 19Nov03 36.94 10.26 27.77 31Dec07 2006 ADG Gr 17Dec01 29May02 19Nov03 1.31 0.57 43.69 31Dec07 2006 15. Monduli District Water Project ADG Gr 27Nov03 10Feb04 10Feb04 15.51 7.37 47.49 31Dec08 2005 Subtotal 108.76 18.20 16.73

Annex VIII
PROGRAM FORMULATION PROCESS ACTIVITY DATE 1. Government for a new ADF education program June 2005 2. Identification Mission July 2006 3. Internal Working Group (IWG) and Country Team
Meeting for the inclusion of the program in the lending program
27 July 2007
4. Preparation Mission 30 January – 17 February 2007 5. Internal Working Group (IWG) Meeting 16 March 2007 6. Inter-Departmental Working Group Meeting 30 March 2007 7. Appraisal Mission 17 April – 4 May 2007 8. Internal Working Group (IWG) Meeting 24 May 2007 9. Inter-Departmental Working Group Meeting 7 June 2007 10. Senior Management Committee Meeting 15 June 2007 11. Submission for Translation 18 June 2007 12. Grant Negotiations 2-3 July 2007 13. Board Presentation 25 July 2007