tanzania - export investment tanzania - mining industry value ... (formerly african barrick gold)...
TRANSCRIPT
Q4 2016www.bmiresearch.com
TANZANIAMINING REPORTINCLUDES 5-YEAR FORECASTS TO 2020
Published by:BMI Research

Tanzania Mining Report Q4 2016INCLUDES 5-YEAR FORECASTS TO 2020
Part of BMI’s Industry Report & Forecasts Series
Published by: BMI Research
Copy deadline: September 2016
ISSN: 1755-7895
BMI Research2 Broadgate CircleLondonEC2M 2QSUnited KingdomTel: +44 (0) 20 7248 0468Fax: +44 (0) 20 7248 0467Email: [email protected]: http://www.bmiresearch.com
© 2016 Business Monitor International LtdAll rights reserved.
All information contained in this publication iscopyrighted in the name of Business MonitorInternational Ltd, and as such no part of thispublication may be reproduced, repackaged,redistributed, resold in whole or in any part, or usedin any form or by any means graphic, electronic ormechanical, including photocopying, recording,taping, or by information storage or retrieval, or byany other means, without the express written consentof the publisher.
DISCLAIMERAll information contained in this publication has been researched and compiled from sources believed to be accurate and reliable at the time ofpublishing. However, in view of the natural scope for human and/or mechanical error, either at source or during production, Business MonitorInternational Ltd accepts no liability whatsoever for any loss or damage resulting from errors, inaccuracies or omissions affecting any part of thepublication. All information is provided without warranty, and Business Monitor International Ltd makes no representation of warranty of any kindas to the accuracy or completeness of any information hereto contained.


CONTENTS
BMI Industry View ............................................................................................................... 7Table: Tanzania - Mining Industry Value . . . . . . . . . . . . . . . . . . . . . . . . . . . . . . . . . . . . . . . . . . . . . . . . . . . . . . . . . . . . . . . . . . . . . . . . . . . . . . . . . . . . . . . . . . . . . . . . . . . . . . . . . . . . . . . 7
Table: Tanzania - Key Mining Projects . . . . . . . . . . . . . . . . . . . . . . . . . . . . . . . . . . . . . . . . . . . . . . . . . . . . . . . . . . . . . . . . . . . . . . . . . . . . . . . . . . . . . . . . . . . . . . . . . . . . . . . . . . . . . . . . . 7
Latest Developments & Structural Trends ..................................................................................................... 8
SWOT .................................................................................................................................... 9
Industry Forecast .............................................................................................................. 10Gold: Growth To Remain Slow ................................................................................................................... 10
Latest Developments ............................................................................................................................... 10Table: Gold Production Forecast (Tanzania 2014-2020) . . . . . . . . . . . . . . . . . . . . . . . . . . . . . . . . . . . . . . . . . . . . . . . . . . . . . . . . . . . . . . . . . . . . . . . . . . . . . . . . . . . . . . . . . . . . . . 10
Structural Trends ................................................................................................................................... 11
Industry Risk Reward Ratings .......................................................................................... 15Tanzania Risk Reward Index ...................................................................................................................... 15
Rewards ............................................................................................................................................... 15
Industry Rewards ................................................................................................................................... 15
Country Rewards ................................................................................................................................... 15
Risks .................................................................................................................................................... 15
Industry Risks ........................................................................................................................................ 15
Country Risks ........................................................................................................................................ 15
Africa - Risk/Reward Index ........................................................................................................................ 16
Key Takeaways ...................................................................................................................................... 16
Latest Revisions ..................................................................................................................................... 17Table: Africa - Mining Risk/Reward Index . . . . . . . . . . . . . . . . . . . . . . . . . . . . . . . . . . . . . . . . . . . . . . . . . . . . . . . . . . . . . . . . . . . . . . . . . . . . . . . . . . . . . . . . . . . . . . . . . . . . . . . . . . . . . 18
Regulatory Development .................................................................................................. 19Trade & Investment Risk Analysis ............................................................................................................. 20
Commodities Forecast ..................................................................................................... 24Commodities Outlook ............................................................................................................................... 24
Table: BMI Commodities Price Forecasts . . . . . . . . . . . . . . . . . . . . . . . . . . . . . . . . . . . . . . . . . . . . . . . . . . . . . . . . . . . . . . . . . . . . . . . . . . . . . . . . . . . . . . . . . . . . . . . . . . . . . . . . . . . . . . 24
Competitive Landscape .................................................................................................... 26Key Players .......................................................................................................................................... 26
Table: Tanzania - Main Mining Companies . . . . . . . . . . . . . . . . . . . . . . . . . . . . . . . . . . . . . . . . . . . . . . . . . . . . . . . . . . . . . . . . . . . . . . . . . . . . . . . . . . . . . . . . . . . . . . . . . . . . . . . . . . . . 27
Company Profile ................................................................................................................ 28Barrick Gold - Q4 2016 ............................................................................................................................ 28
Table: Select Commodities - Price Forecasts . . . . . . . . . . . . . . . . . . . . . . . . . . . . . . . . . . . . . . . . . . . . . . . . . . . . . . . . . . . . . . . . . . . . . . . . . . . . . . . . . . . . . . . . . . . . . . . . . . . . . . . . . . 30
Company Strategy .................................................................................................................................. 32Table: Barrick Gold - Key Projects . . . . . . . . . . . . . . . . . . . . . . . . . . . . . . . . . . . . . . . . . . . . . . . . . . . . . . . . . . . . . . . . . . . . . . . . . . . . . . . . . . . . . . . . . . . . . . . . . . . . . . . . . . . . . . . . . . . . . 33
Table: Barrick Gold - Key Financial Data . . . . . . . . . . . . . . . . . . . . . . . . . . . . . . . . . . . . . . . . . . . . . . . . . . . . . . . . . . . . . . . . . . . . . . . . . . . . . . . . . . . . . . . . . . . . . . . . . . . . . . . . . . . . . 34
Tanzania Mining Report Q4 2016
© Business Monitor International Ltd Page 4

Table: Gold - Operational Highlights, 2015 . . . . . . . . . . . . . . . . . . . . . . . . . . . . . . . . . . . . . . . . . . . . . . . . . . . . . . . . . . . . . . . . . . . . . . . . . . . . . . . . . . . . . . . . . . . . . . . . . . . . . . . . . . . . 35
Regional Overview ............................................................................................................ 36Sub-Saharan Africa Overview .................................................................................................................... 36
Table: SSA - Government Involvement In Mining Sector . . . . . . . . . . . . . . . . . . . . . . . . . . . . . . . . . . . . . . . . . . . . . . . . . . . . . . . . . . . . . . . . . . . . . . . . . . . . . . . . . . . . . . . . . . . . . . 42
Methodology ...................................................................................................................... 44Industry Forecast Methodology ................................................................................................................ 44
Sources ................................................................................................................................................ 45
Risk/Reward Index Methodology ............................................................................................................... 46Table: Weighting Of Indicators . . . . . . . . . . . . . . . . . . . . . . . . . . . . . . . . . . . . . . . . . . . . . . . . . . . . . . . . . . . . . . . . . . . . . . . . . . . . . . . . . . . . . . . . . . . . . . . . . . . . . . . . . . . . . . . . . . . . . . . . . 47
Tanzania Mining Report Q4 2016
© Business Monitor International Ltd Page 5


BMI Industry View
BMI View: Tanzania's gold sector will remain pressured by low gold prices, which will discourage
production growth over coming years. Beyond our forecast period to 2020, the country's mining sector
could diversify as various miners are looking to invest in the country's nickel, coal and uranium resources.
Table: Tanzania - Mining Industry Value
2014e 2015e 2016f 2017f 2018f 2019f 2020f
Mining Industry Value, USDbn 0.86 0.80 0.81 0.81 0.81 0.82 0.83
Mining Industry Value, USDbn, % y-o-y -7.40 -3.50 -2.00 -0.40 0.10 0.60 2.20
e/f = BMI estimate/forecast. Source: UN Data, BMI
Table: Tanzania - Key Mining Projects
Commodities Mine Mine TypePrimaryCompany
SecondaryCompany Notes
Coal - Thermal Shikula Open Pit
SyrahResources Ltd(100%) na The project is under exploration stage.
Copper Ibaga Open Pit
LiontownResources(100%) na
Project is currently in explorationstage which shows high grades ofcopper and zinc products, drilling tostart in 2014.
Coal - Thermal Rukwa na Kibo Mining naResources: 109 Mt (71.33 MtIndicated/38.05 Mt Inferred).
Iron Ore Liganga na NDCSichuanHongda
July 2013 - The exploration findingshave discovered over 364mnt of coalat the project. The project is expectedto be completed by 2018.
Coal - Thermal Mchuchuma na NDCSichuanHongda
2013 - The project involves 3mnt perannum coal mine and is expected tobe completed by 2017; July 2013 -The exploration findings havediscovered over 219mnt of iron oredeposits.
Gold Chunya na Shanta naGold: 1.3moz resources. Productionstart date remains uncertain.
na = not available. Source: Company announcements, BMI
Tanzania Mining Report Q4 2016
© Business Monitor International Ltd Page 7
Latest Developments & Structural Trends
■ Tanzania, currently Africa's fourth-largest gold producer, will see modest growth in output due to mineclosures and a limited number of projects in the pipeline. Ongoing labour unrest, illegal mining, powershortages and gold price weakness will also temper the sector's production outlook. Acacia Mining(formerly African Barrick Gold) and Resolute Mining have ceased production at two mines due todepleted reserves. Acacia Mining and AngloGold Ashanti have warned about impending job cuts in thenorth of the country. Given that Tanzania relies upon gold for over 40.0% of its exports, the downturn inthe sector is likely to have serious repercussions for the economy as a whole.
■ Despite this, a number of new projects will ensure the country's production growth remains positive overthe coming quarters. For instance, CATA Mining's Mara gold mine, the second largest project in theregion, following Acacia Mining's North Mara gold mine, is expected to begin production in Q316. Theminer has invested over USD54mn to develop the project. Further, Shanta Gold recorded goldproduction of 24,522 ounces (koz) at its New Luika gold mine in Tanzania in Q315. The recordproduction was benefited from a 33% q-o-q improvement in gold ore grade efficiencies and a 25%increase in tons milled during the quarter.
■ Shanta Gold has laid out a five-year mine plan for its New Luika mine in Tanzania. The new mine plan,which will include underground mining and an ongoing surface mining and tailings recovery project,estimates an average production of 84koz annually over the next five years. An underground extension tothe mine will produce 310koz and add USD72mn to the project value. The underground development isestimated to have an up-front cost of USD38mn. Under the plan, the open pit will run until 2018. NewLuika is expected to produce a total of 443koz of gold during the 2016-2022 period, of which 310,000ozwill be from underground, 133koz from open pit and 19koz from the tailings project.
Tanzania Mining Report Q4 2016
© Business Monitor International Ltd Page 8

SWOT
SWOT Analysis
Strengths ■ Low level of risk with regards to trade and investment, crime and security, and labour
and logistics capabilities.
■ The majority of mineral deposits are high-grade when compared globally, which
provides companies with greater margins. Vast swathes of untapped coal reserves
have only just started attracting interest.
Weaknesses ■ Widespread corruption, an inefficient and unreliable legal system, and a varying level
of government accountability and transparency pose operating difficulties for firms.
• Prohibitive mining code, with high taxes and high levels of government involvement.
This makes Tanzania one of the most taxed countries when compared to east and
southern Africa.
• Inadequate infrastructure, which is unable to meet the demands of the mining sector.
This will likely deteriorate as the mining sector grows, unless there is substantial
investment in electricity supplies and transport routes.
Opportunities ■ The country's mining sector will remain attractive to foreign investment from China, as
China seeks to gain control of gold and nickel assets in Africa to fill its structural
deficit.
■ Uranium mining could be developed over the long term, as China and India seek to
develop their nuclear power capacity.
Threats ■ Continued gold price declines could hurt miner's profit margins and halt current
operations or stop new projects from coming online altogether.
■ A collapse in gold prices could place financial strains on mining operations.
■ A surge in illegal mining and trespassing by local citizens on mining
operations could lead to elevated operational and security risks at certain mines.
Tanzania Mining Report Q4 2016
© Business Monitor International Ltd Page 9

Industry Forecast
Gold: Growth To Remain Slow
BMI View: Tanzania's gold production growth will slow as subdued gold prices will slow new projects
coming online. In addition, ongoing power shortages will continue to pose significant risk to miners
operating in the sector. Despite this, production will be supported by a number of ongoing projects.
Latest Developments
■ Tanzania, currently Africa's fourth-largest gold producer, will see modest growth in output due to mineclosures and a limited number of projects in the pipeline. Ongoing labour unrest, illegal mining, powershortages and gold price weakness will also temper the sector's production outlook. Acacia Mining(formerly African Barrick Gold) and Resolute Mining have ceased production at two mines due todepleted reserves. Acacia Mining and AngloGold Ashanti have warned about impending job cuts in thenorth of the country. Given that Tanzania relies upon gold for over 40.0% of its exports, the downturn inthe sector is likely to have serious repercussions for the economy as a whole.
■ Despite this, a number of new projects will ensure the country's production growth remains positive overthe coming quarters. For instance, CATA Mining's Mara gold mine, the second largest project in theregion, following Acacia Mining's North Mara gold mine, is expected to begin production in Q316. Theminer has invested over USD54mn to develop the project. Further, Shanta Gold recorded goldproduction of 24,522 ounces (koz) at its New Luika gold mine in Tanzania in Q315. The recordproduction was benefited from a 33% q-o-q improvement in gold ore grade efficiencies and a 25%increase in tons milled during the quarter.
■ Shanta Gold has laid out a five-year mine plan for its New Luika mine in Tanzania. The new mine plan,which will include underground mining and an ongoing surface mining and tailings recovery project,estimates an average production of 84koz annually over the next five years. An underground extension tothe mine will produce 310koz and add USD72mn to the project value. The underground development isestimated to have an up-front cost of USD38mn. Under the plan, the open pit will run until 2018. NewLuika is expected to produce a total of 443koz of gold during the 2016-2022 period, of which 310,000ozwill be from underground, 133koz from open pit and 19koz from the tailings project.
Table: Gold Production Forecast (Tanzania 2014-2020)
2014e 2015e 2016f 2017f 2018f 2019f 2020f
Gold Mine Production, moz 1.48 1.49 1.52 1.53 1.55 1.58 1.62
Gold Mine Production Volumes, % y-o-y 7.50 1.30 1.50 0.90 1.40 1.90 2.40
e/f = BMI estimate/forecast. Source: USGS, BMI
Tanzania Mining Report Q4 2016
© Business Monitor International Ltd Page 10

Structural Trends
SSA's Growth To Find Floor In 2016
Regionally, Tanzania will follow a similar muted growth trajectory in comparison to the country's regional
peers. Although Sub-Saharan Africa (SSA) holds significant growth potential due to the region's vast
reserves of high-grade minerals, mine output growth will continue to face headwinds from a combination of
low mineral prices, elevated production costs and a slowdown in capital expenditure (capex) over our
forecast period to 2020. We forecast SSA's mineral production growth (coal, copper, platinum, gold, iron
ore) to average just 0.9% annual growth during 2016-2020, significantly lower than the average annual
figure of 4.2% during 2011-2015 (see: 'Africa Mining: The Four Key Themes', April 4).
Within SSA, gold production will be a relative growth bright spot, averaging annual growth of 3.3% during
2016-2020. The key driver behind the sector's strong growth is expanding output from a number of major
projects, most notably, the Kibali mine, a joint venture of Randgold Resources and AngloGold Ashanti in
the Democratic Republic of Congo (DRC) (see: 'Gold: Growth To Remain Strong', March 1). The DRC and
to a lesser extent Zambia and Mozambique will be the key mining bright spots, with mining industry value
growing in those countries by USD2.0bn, USD0.3bn, USD0.2bn during 2016-2020, respectively.
Tanzania Mining Report Q4 2016
© Business Monitor International Ltd Page 11

Growth To Hit Bottom In 2016
Sub-Saharan Africa - Average Annual Regional Mine Production Growth (%)
Source: USGS, BMI
Modest Growth Due To New Projects
Despite the ongoing difficulties for the country's gold sector, other projects will ensure a modest production
growth outlook over our forecast period to 2019. For instance, Acacia's North Mara mine is expected to see
ore grades decline marginally as the Gokona pit transitions from an open pit to underground operation. Yet
once the underground portion starts commercial production, higher ore grades are expected. Thus, output
declines in the shorter term are expected to abate in the years ahead. Lake Victoria Mining Company, a
US-based exploration and development firm, has seven gold projects in development in Tanzania, though
production dates have yet to be announced. Additionally, Tanzania's state-owned Stamigold Biharamulo
mine is expected to increase output to 40,000 ounces (koz), up from 10.6koz in 2014. We forecast annual
gold production to grow from an estimated 1.52 million ounces (moz) in 2016 to 1.62moz in 2020.
Tanzania Mining Report Q4 2016
© Business Monitor International Ltd Page 12

Subdued Growth Ahead
Select African Countries - Gold Production Growth y-o-y (%)
Ghana Tanzania South Africa Mali
2015
e
2016
f
2017
f
2018
f
2019
f
2020
f
-10
-5
0
5
10
15
e/f = BMI estimate/forecast. Source: USGS, BMI
Challenges To Curb Growth
Tanzania's gold output growth will continue to be hindered by the country's inadequate
infrastructure Tanzania's power infrastructure continues to be underdeveloped and plagued by inefficiencies
due to under-investment over the past decade. As a result, World Economic Forum scored Tanzania 132 out
of 144 countries for quality of electricity supply in 2014. In addition, the country's power generation relies
heavily on costly natural gas imports and unreliable hydropower.
Besides power shortages, the threat of strikes remains a significant downside risk given the fraught relations
between workers and employees. Weakness in gold prices and elevated cash costs will mean miners find
themselves increasingly unable to meet demands for wage increases. We forecast gold prices to average
USD1,350/oz during 2016-2017, significantly lower than the USD1,418/oz average over 2011-2015.
However, the gold sector's modest growth outlook is supported by Chinese investment entering the
country's transport sector. The Chinese government will provide investment to construct a new port in the
Tanzania Mining Report Q4 2016
© Business Monitor International Ltd Page 13
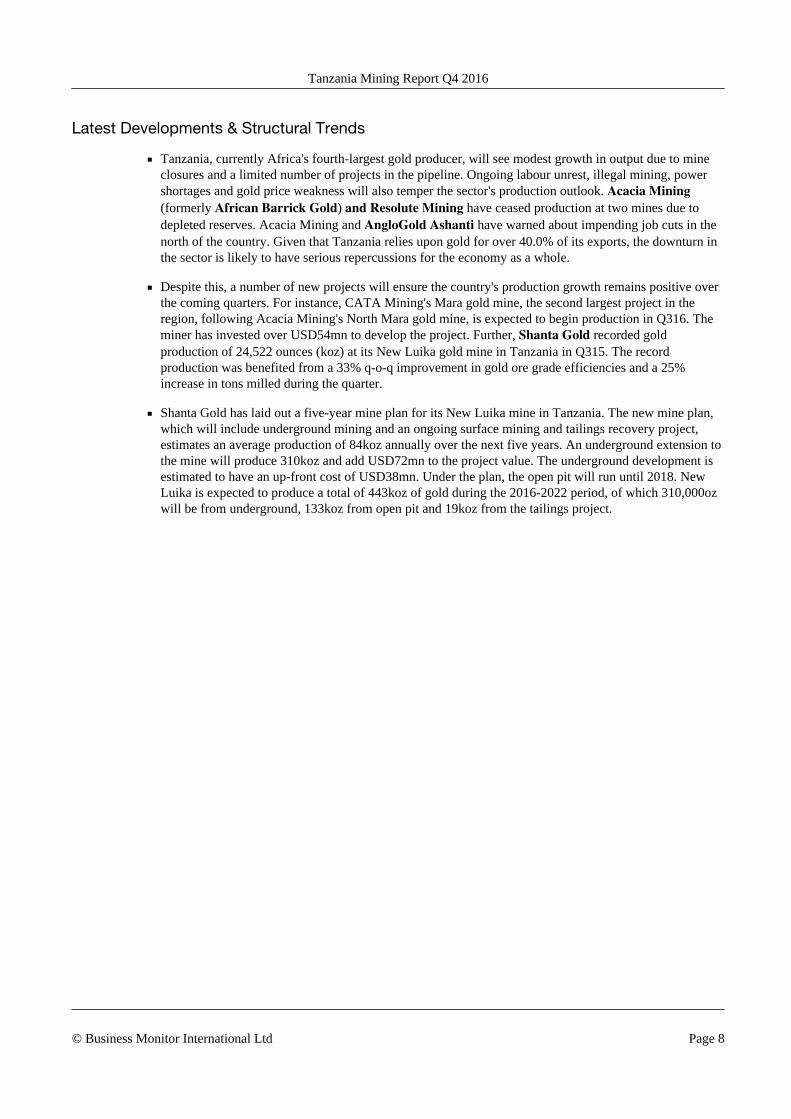
town of Bagamoyo. The development, worth an estimated USD10bn will see a new port, export processing
zone and interlinking rail and road infrastructure built, in an attempt to relieve some of the pressure on the
congested port of Dar es Salaam.
Prices To Head Gradually Higher
Global - Gold Price, Mining Industry Value & Tanzania Mining Industry Value
Global - Mining Industry Value, USDbn (LHS) Global - Gold, USD/oz (LHS)Tanzania - Mining Industry Value, USDbn (RHS)
2010
2011
2012
2013
2014
e
2015
e
2016
f
2017
f
2018
f
2019
f
2020
f
1,000
750
1,250
1,500
1,750
0.6
0.7
0.8
0.9
1
1.1
f = BMI forecast. Source: National sources, BMI
Tanzania Mining Report Q4 2016
© Business Monitor International Ltd Page 14

Industry Risk Reward Ratings
Tanzania Risk Reward Index
Tanzania sits close to the bottom in our Q416 Africa Mining Risk/Reward Index, ranking 14th out of 16
countries, with an overall score of just 33.4 out of 100.
Rewards
Industry Rewards
In Q416, Tanzania scores a poor 22.5 out of 100 for Industry Rewards. This is due to the small contribution
of the mining sector to GDP and our outlook for contraction in the country's mining industry value.
Country Rewards
Tanzania's score of 44.9 out of 100 for Country Rewards is due to the country's weak labour market and
physical infrastructure. Tanzania's tax regime for miners is also relatively burdensome, lowering its score in
this category.
Risks
Industry Risks
Tanzania's score remains at 47.0 out of 100 for Industry Risks in Q416. An uncompetitive regulatory
framework combined with weak global gold prices weakens the country's score in this category.
Country Risks
Tanzania scores 49.6 out of 100 for Country Risks. Although the country's long-term policy continuity is
stable, Tanzania's long-term economic rating is weak. In addition, corruption and the country's complex
bureaucracy remain a major deterrent to investment.
Tanzania Mining Report Q4 2016
© Business Monitor International Ltd Page 15

Africa - Risk/Reward Index
BMI View: Africa will continue to attract investment due to the region's vast mineral reserves. However,
persistently low commodity prices and deteriorating regulatory environments and will dampen the region's
investment outlook.
Key Takeaways
■ Downward revisions to our global commodity price forecasts have reduced reward scores across theboard.
■ Africa's vast mineral reserves will continue to offer significant rewards to investors. This is illustrated bythe concentration of countries in the two right-hand quadrants (high reward) of our Africa Mining Risk/Reward chart (see below).
■ Operational risks within African mining sectors remain above the global average.
■ Botswana is the region's top performer in our Africa Mining Risk/Reward Index due to the country'sadvantage of low corruption and an excellent political framework. Despite this, Botswana's score isundermined by a lack of diversity, given that mining activity is centred heavily around the diamondsector.
■ Zambia's increasing mineral policy uncertainty is becoming the greatest risk for mining sector investmentin the country.
Tanzania Mining Report Q4 2016
© Business Monitor International Ltd Page 16
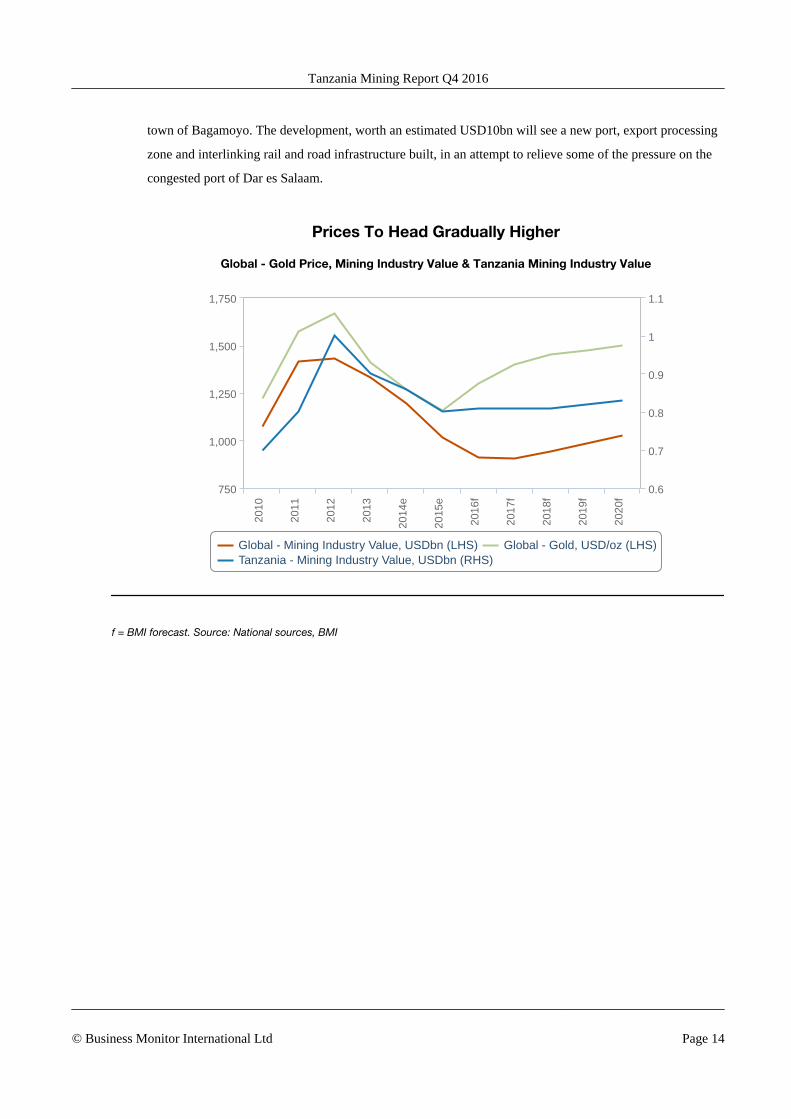
Risks To Remain Elevated
Africa - Mining Risk (vertical) & Reward (horizontal axis)
Note: Scores are out of 100, with 100 the best. The intersection of the vertical and horizontal lines represents the global average.
Source: BMI
Latest Revisions
Botswana - Botswana's industry rewards fell from 57.5 to 55.0 out of a 100 in Q316. The key reason for the
downwards revision is that the expansion of Botswana's mining industry will be tempered by weakness in
global diamond prices over the next few quarters, with the country's largest producer, Debswana, revealing
plans to scale back production at two of its mines over the next three years.
Angola - Angola's country risks improved from 23.2 to 28.4 out of a 100 for Q316. The government looks
to mineral extraction as a means of diversifying the economy and easing its reliance on oil and gas exports.
Diamonds will remain the mainstay of the industry, with state-owned mining company currently increasing
production to mitigate recent price falls. A lack of sufficient mining-related infrastructure remains an
ongoing obstacle to mining activity in the country and the government is looking increasingly to source
much-needed investment by exploring partnerships overseas. We expect this to be a long-running theme
which should create opportunities for investors and new entrants over the next few years.
Tanzania Mining Report Q4 2016
© Business Monitor International Ltd Page 17

Table: Africa - Mining Risk/Reward Index
Rewards Risks
Industry Country Rewards Industry Country Risks
Risk/RewardIndex
RegionalRanking
Botswana 55.0 57.6 55.5 69.2 69.4 69.3 59.6 1
Namibia 55.0 48.6 53.7 45.2 57.6 51.4 53.0 2
South Africa 47.5 63.5 50.7 50.0 63.7 56.8 52.5 3
DR Congo 70.0 20.2 60.0 41.2 19.4 30.3 51.1 4
Ghana 45.0 60.2 48.0 51.6 59.8 55.7 50.3 5
Zambia 45.0 61.8 48.4 51.8 49.2 50.5 49.0 6
Côte d'Ivoire 55.0 31.8 50.4 55.8 29.5 42.6 48.0 7
Angola 55.0 33.5 50.7 51.0 28.4 39.7 47.4 8
Guinea 55.0 37.3 51.5 47.8 25.5 36.7 47.0 9
Mozambique 45.0 50.4 46.1 50.4 43.0 46.7 46.3 10
Liberia 45.0 38.5 43.7 49.0 45.7 47.3 44.8 11
Zimbabwe 45.0 46.9 45.4 34.0 18.9 26.4 39.7 12
Mali 37.5 23.9 34.8 48.2 42.2 45.2 37.9 13
Mauritania 37.5 29.0 35.8 51.2 32.8 42.0 37.7 14
Sierra Leone 27.5 32.1 28.4 46.4 44.2 45.3 33.5 15
Tanzania 22.5 44.9 27.0 45.0 47.4 46.2 32.7 16
Note: Scores are out of 100, with 100 the best. Last updated: April 4, 2016. Source: BMI
Tanzania Mining Report Q4 2016
© Business Monitor International Ltd Page 18
Regulatory Development
BMI View: Tanzania's mining sector will remain uncompetitive, compared to the country's regional peers,
as a result of the government's decision to raise taxes on the industry. The country's mining code
will become increasingly problematic as weak commodity prices will increasingly pressure miners' profit
margins.
Tanzania's mining code will limit new entrants from entering the country's mining sector. The code will be a
strong push factor for existing miners to focus on their assets elsewhere. The government implemented
the mining code in 2010 at the height of the commodity price boom. The code sought to increase local
ownership of mines and move the sector away from foreign miner control. The code awarded the Minister
of Mines the right to make regulations relating to foreign mining companies operating in Tanzania to list on
the local stock exchange.
A rise in royalty rates on gold exports, implemented in July 2012, will continue to weigh on producers
especially as gold prices continue to decline. The law increased royalty rates from 3% of netback value to
4% of gross value in a bid to increase government revenue from Tanzania's mineral resources. The law also
stipulated companies were required to pay the government 0.3% of annual turnover, an increase from the
previous requirement to pay a maximum of USD200,000 per annum.
The decision in Q413 to cancel over 100 mining licences provides further evidence of difficulties in the
regulatory environment. Then-President Jakaya Kikwete stated that ownership of mineral rights without
developing the associated deposits was against the law. The cancelled rights will be repossessed and re-
awarded to small-scale miners.
The Mining Code
The Tanzanian mining industry is administered by the Ministry of Energy and Minerals. The 2010 Mining
Act, approved by parliament in April of that year, will be the principal legislation governing the application
and grant of mineral rights (mining and exploration licences) and the trading of minerals. The main points
of the new law are summarised below.
■ Mineral rights and licences for small-scale mining operations (involving capital expenditure of less thanUSD100,000) will be reserved exclusively to Tanzanian citizens and corporate bodies under the exclusivecontrol of Tanzanian citizens.
Tanzania Mining Report Q4 2016
© Business Monitor International Ltd Page 19

■ Licences to mine for gemstones are only to be granted to Tanzanians, except for cases where the ministerof energy and mines determines that outside skills, technology or investment are required. However, theparticipation of a foreign investor would have to be below 50%.
■ The Act gives the minister power to prescribe a standard Mining Development Agreement form for allprojects exceeding USD100mn.
■ The Act gives the minister power to make regulations authorising the government of Tanzania toparticipate in the conduct and financing of mining operations and to give the government a free carriedinterest in all mining projects, the level of which is not set by statute, but rather by negotiation betweenthe government and the relevant mineral rights holder.
■ Royalties will now be levied on the gross value of minerals, rather than net as before.
■ The Act requires a greater degree of disclosure by the holders of mineral rights in respect of reports,records and general information.
Royalty rates have also increased: on precious and base metals from 3% to 4%; on diamonds from 5% to
6%; with a flat rate of 7% for uranium and a standard 3% for other minerals.
A reconnaissance licence is issued for one year and is renewable for a period not exceeding a year. The
reconnaissance licence holder may apply for a prospecting licence covering all, or part of the area. A
prospecting licence is issued for a period of up to three years and is renewable twice for a period of up to
two years each time. At each renewal, at least 50% of the area is relinquished. A mining licence will only be
granted to the holder of a prospecting licence over the area. The licence is granted for a period of 25 years
or the life of the mine. It is renewable for a period not exceeding 15 years.
Section 15 of the Mining Act defines the terms and conditions to be included in a mineral licence. Sections
38 (5) and 64 of the Mining Act 1998 describe the framework of environmental considerations during the
licensing process. The act requires commissioning of independent consultants of international standing to be
shortlisted by the project proponent, and approved by the government to undertake environmental impact
assessment on the proposed mining operations. Tanzania has established a National Environment
Management Council, which necessitates segment-specific requirements to be addressed in mineral titles.
Trade & Investment Risk Analysis
Economic Openness - Tanzania benefits from vast natural resources that offer numerous investment
opportunities in the extractive, agricultural and tourism sectors. We forecast robust long-term economic
growth as the country looks to benefit from its nascent offshore gas sector and the investment influx aimed
at developing this sector and infrastructure projects. Tanzania also benefits from its membership with the
East African Community that fosters regional economic integration and trade. However, the dearth of
Tanzania Mining Report Q4 2016
© Business Monitor International Ltd Page 20

critical infrastructure and inadequate logistics networks have resulted in low industrialisation in the country
and low foreign direct investment inflows in comparison to regional peers such as Kenya.
Capital goods imports will continue to dominate trade in our medium- to long-term forecast. Overall trade
volumes remain low and the trade deficit is set to widen with imports outpacing exports. As the country
relies heavily on its agricultural and mining sectors, businesses face significant medium-term risks due to
adverse weather conditions (namely El Niño), subdued commodity prices and weak global demand for
commodities. Consequently, BMI awards Tanzania a score of 42.3 out of 100 for Economic Openness,
placing it in 17th place out of 48 states in the Sub-Saharan Africa (SSA) region, and 128th out of 201 states
worldwide.
Behind Regional Peers
Select Countries - Economic Openess Risk Index
Congo (DRC) Mozambique South Africa Tanzania Zambia
2016f
0
20
40
60
80
f = BMI forecast. Source: BMI Operational Risk Index. See Operational Risk Service For More Detail
Government Intervention - Bureaucratic procedures for licenses and permits continue to be burdensome
and time-consuming and this is highlighted by the protracted time it takes to open and close a business,
register property and obtain construction permits. According to the World Bank's Doing Business report it
takes on average three years to close a business. The recovery rate for creditors on insolvent firms is only
Tanzania Mining Report Q4 2016
© Business Monitor International Ltd Page 21

21.9 US cents on the dollar with judgments typically made in local currency which is subject to volatility.
This significantly increases risks to investment in the country. Furthermore, business registration fees and
charges for foreign companies are significantly higher than for domestic companies. Corruption is endemic,
though measures to combat it have been ramped up since 2015 and are applied impartially to foreign and
domestic investors; rent-seeking persists in government procurement, privatisation, taxation, and customs
clearance.
Additionally, investors continue to face challenges receiving payment for services rendered for government
sponsored projects. Lack of court capacity remains an issue as investment-related disputes in Tanzania can
be protracted by up to four years, despite the establishment of a computerised arbitration system.
Intellectual property protection is low and the legal risks are further compounded by inadequate legal
penalties for counterfeiters. BMI therefore gives Tanzania a score of 34.2 out of 100 for Legal Risks,
placing it 21st regionally out of 48 SSA states. With this score, Tanzania places behind Mozambique and
Zambia, but ahead of Kenya.
Significant Regulatory Risk
Select Countries - Government Intervention Risk Index
Congo (DRC) Mozambique South Africa Tanzania Zambia
2016f
0
20
40
60
80
f = BMI forecast. Source: BMI Operational Risk Index. See Operational Risk Service For More Detail
Tanzania Mining Report Q4 2016
© Business Monitor International Ltd Page 22

Legal - Perceptions of widespread corruption in the judiciary also extend to other key government
institutions in the country. This point is exemplified by the fact that Transparency International's 2013
Global Corruption report concluded that with 56% of people surveyed having paid a bribe to at least one
state and non-state official, including religious groups, the media and political parties. Accountability is also
low among government officials; according to the Bertelsmann Stiftung Transformation Index 2014, it is
estimated that 20% of the state's annual budget is lost to corruption.
As a result of this state of affairs, firms face numerous risks, such as unfair competition with local firms and
a lack of visibility within courts, and government decisions that diminish the appeal of the Tanzanian
business environment. BMI gives Tanzania a score of 35.2 out of 100 for Legal Risks, placing it 19th
regionally among its SSA peers. With this score, Tanzania places between Mauritania and Mali with scores
of 36.1 and 34.5, respectively.
Legal System To Remain Weak
Select Countries - Legal Risk Index
Congo (DRC) Mozambique South Africa Tanzania Zambia
2016f
0
20
40
60
f = BMI forecast. Source: BMI Operational Risk Index. See Operational Risk Service For More Detail
Tanzania Mining Report Q4 2016
© Business Monitor International Ltd Page 23

Commodities Forecast
Commodities Outlook
Table: BMI Commodities Price Forecasts
Commodity UnitCurrent
PriceYTD
(% Chg)1 Year
(% Chg)2015(ave)
YTD (ave)
2016f(ave)
2017f(ave)
Agriculture
Class III Milk (Third-Month) USD/cwt 16.92 19.3 1.9 15.75 14.41 13.30 14.50
Cocoa (London) GBP/tonne 2,403 6.2 16.5 2,098 2,228 2,130 2,150
Coffee USc/lb 139 9.6 4.0 132 127 130 135
Corn USc/bushel 324 -9.8 -17.0 377 370 380 410
Cotton USc/lb 72 13.2 13.5 63.3 63.1 63.0 66.0
Feeder Cattle USc/lb 150 -10.0 -29.9 202.3 150.8 na na
Lean Hogs USc/lb 67 12.2 -12.5 69 73.1 na na
Live Cattle USc/lb 117 -13.9 -22.2 146 125.9 na na
Palm Oil (Third-Month) MYR/tonne 2,500 0.6 23.2 2,235 2,526 2,500 2,350
Rough Rice USD/cwt 10 -16.7 -18.8 11.1 10.7 10.7 11.0
Soybean USc/bushel 1,016 16.6 -2.8 945 985 975 1,000
Sugar #11 USc/lb 20 31.9 90.2 13.1 16.47 16.00 16.40
Wheat USc/bushel 425 -9.7 -19.2 507 459 500 495
Energy
Coal, Thermal (Newcastle) USD/tonne 67.0 32.4 11.6 62.1 53.1 53.0 57.0
Brent Crude USD/bbl 44.5 19.2 -11.8 53.6 42.1 46.5 57.0
OPEC Basket, Oil USD/bbl 41.1 31.4 -12.5 49.5 37.3 43.5 54.0
WTI Crude USD/bbl 42.2 13.9 -6.2 48.8 40.5 46.0 57.0
Natural Gas (HH) USD/mnBtu 2.6 10.7 -9.0 2.63 2.23 2.43 2.85
Natural Gas (NBP) USD/mnBtu 4.3 -11.8 -31.8 6.49 4.38 4.00 4.35
JKM LNG USD/mnBtu 5.8 -15.2 -27.5 7.47 4.98 4.50 3.90
Metals
Aluminium USD/tonne 1,648 9.3 1.8 1,681 1,567 1,600 1,625
Copper USD/tonne 4,824 2.5 -9.1 5,493 4,731 4,900 5,000
Gold USD/oz 1,346 26.8 21.8 1,160 1,244 1,300 1,400
Iron Ore (62% CFR, Qingdao) USD/tonne 61 39.0 7.4 55.5 53 53 45
Lead USD/tonne 1,832 2.2 4.2 1,794 1,751 1,750 1,800
Nickel USD/tonne 10,825 22.7 -2.9 11,877 9,029 9,000 10,500
Palladium USD/oz 731 30.1 20.6 690 570 na na
Tanzania Mining Report Q4 2016
© Business Monitor International Ltd Page 24

BMI Commodities Price Forecasts - Continued
Commodity UnitCurrent
PriceYTD
(% Chg)1 Year
(% Chg)2015(ave)
YTD (ave)
2016f(ave)
2017f(ave)
Platinum USD/oz 1,184 32.8 19.6 1,054 992 na na
Silver USD/oz 20 46.5 32.2 15.7 17 na na
China Domestic Hot RolledSteel Average CNY/tonne 2,749 37.9 29.3 2,244 2,496 na na
Tin USD/tonne 18,525 27.3 17.4 16,029 16,481 16,500 17,500
Zinc USD/tonne 2,286 42.1 21.5 1,938 1,883 1,900 2,050
na = not available. Note: Correct as of August 10 2016. Source: BMI
Tanzania Mining Report Q4 2016
© Business Monitor International Ltd Page 25
Competitive Landscape
BMI View: Major gold miners will continue to dominate Tanzania's mining sector over the coming years.
The country's high regulatory risk will limit new entrants from entering the sector.
Key Players
Gold Sector:
Acacia Mining - Formerly known as African Barrick Gold (ABG), Acacia Mining is a separate,
subsidiary company of global gold miner Barrick Gold. ABG was spun off from Barrick in February 2010.
Its mining portfolio covers three mines in north-west Tanzania: North Mara, Bulyanhulu and Buzwagi. In
Q414, the company announced it would begin underground mining at North Mara, which was previously
opencast.
AngloGold Ashanti - Operates in the north of the country, producing gold from its mine at Geita. Geita is
the largest contributor to AngloGold Ashanti's gold production outside the company's native South African
mines. According to the Tanzania Minerals Audit Agency, the Geita mine produced 447 thousand ounces
(koz) in 2014, accounting for 32.2% of the country's total gold output.
Helio Resources - Engaged in exploration and drilling for its proposed SMP gold project in western
Tanzania.
IMX Resources - Australian company engaged in exploration and mining in Tanzania. It has interests in
platinum, nickel, copper and gold. Its projects in Tanzania include the Mibango and the Luwumbu projects.
Lake Victoria Mining Company - Focused on developing gold mines in Tanzania's Lake Victoria
Greenstone Belt. The company current has seven projects under development.
Diamond Sector:
Midlands Minerals Tanzania - Subsidiary of Canada-based Midlands Minerals, a gold- and diamond-
mining company. The parent company has gold properties in Ghana, as well as gold and diamond properties
in Tanzania. Its properties in Tanzania include the Itilima gold and diamond property and the New Kilindi
gold property. The Itilima gold property is 75%-owned by Midlands and 25% by a local Tanzanian partner.
At present, the company is prioritising its operations in Ghana over those in Tanzania.
Tanzania Mining Report Q4 2016
© Business Monitor International Ltd Page 26

Petra Diamonds - The firm owns the Williamson mine, known for its world-famous bubblegum pink
diamonds. Petra is Tanzania's only major diamond producer.
Table: Tanzania - Main Mining Companies
Company Sub-SectorFiscal
End YearMarket Cap
(USDmn)Emplo
yeesRevenue(USDmn)
Net Income(USDmn)
Capex(USDmn)
ProfitMargin (%)
AngloAmericanPLC
Diversified Metals& Mining 12/2015 14,568 91,000 20,455 -5,624 4,053 -27.5
Barrick GoldCorp Gold 12/2015 21,761 17,260 9,029 -2,838 1,713 -31.4
PetraDiamondsLtd
Precious Metals &Minerals 06/2015 826 4,428 425 49 267 11.4
na = not available/applicable. Source: Bloomberg
Tanzania Mining Report Q4 2016
© Business Monitor International Ltd Page 27

Company Profile
Barrick Gold - Q4 2016
BMI View: Barrick Gold will remain the leading global gold miner, supported by high-grade reserves and
competitively low operating costs. Improving gold prices will support the firm's efforts to rein in debt and
increase profit margins.
SWOT Analysis
Strengths ■ World's largest gold mining company gives it significant economies of scale, able to
maintain output levels and reduce costs despite weak prices.
■ Retains largest proven and probable gold reserves of 92.0moz, with average reserve
grade of 1.32 grams per tonne. The average reserve grade at core mines is even
higher, at 1.88 grams per tonne.
■ Strong production exposure to stable developed markets in US and Canada, and
diversified production across emerging markets in Africa and Latin America.
Weaknesses ■ Full-year capital expenditure (capex) fell by 30.0% y-o-y in 2015, hindering ability to
grow reserves and develop assets, and 2016 guidance remains slightly lower still,
between USD1.4-1.6bn.
■ Although total debt declined in 2015, it remains elevated, around USD6.8bn. The total
debt/equity ratio reached 105x in 2015, its highest level on record. Elevated debt and
high interest expenses limits cash flow and may weight on future investments.
■ In March, the firm was fined USD9.8mn and nine current and former employees face
criminal charges over the cyanide spill at the Veladero mine in Argentina in September
2015.
Opportunities ■ Improving gold prices will increase profit margins and support growth. We forecast
gold to average USD1,275/oz in 2016 and USD1,350/oz in 2017.
■ Company's size lends it financial flexibility to acquire small gold mining firms at a time
when valuations remain subdued.
Tanzania Mining Report Q4 2016
© Business Monitor International Ltd Page 28

SWOT Analysis - Continued
Threats ■ Pascua-Lama project on the Chilean/Argentine border remains suspended and the
Cerro Casale project in Chile remains delayed, limiting two potential new sources to
expand the company's reserves.
■ Firm is vulnerable to potential implementation of stricter mining regulations, for
example in Argentina, following the September 2015 cyanide spill at the Veladero
mine.
Tanzania Mining Report Q4 2016
© Business Monitor International Ltd Page 29

Table: Select Commodities - Price Forecasts
2014 2015 2016f 2017f 2018f 2019f 2020f
Gold, USD/oz 1,266 1,160 1,275 1,350 1,400 1,450 1,500
Gold price, ave, % y-o-y -10.2 -8.3 9.9 5.9 3.7 3.6 3.5
Copper price, three-month, USD/tonne, ave 6,830 5,493 4,900 5,000 5,200 5,300 5,500
Copper price, three-month, ave, % y-o-y -7.1 -19.6 -10.8 2.0 4.0 1.9 3.8
f = BMI forecast. Source: Bloomberg, BMI
Company Overview
Toronto-based Barrick Gold remains the world's largest gold mining company by mined output, with
6.1moz reported production in 2015. The firm operates 14 mines in 10 countries, along with several projects
in development. The Americas is Barrick's largest revenue base, generating approximately 62.0% of total
production in 2015. The firm remains particularly focused on developing its Goldrush project in the US
state of Nevada.
US, Gold To Dominate Revenue Stream
Barrick Gold - Revenue By Geography (LHC) & Segment (RHC), 2015
Source: Bloomberg
Tanzania Mining Report Q4 2016
© Business Monitor International Ltd Page 30

Competitive Landscape
Globally, gold miners will continue to prioritise cutting costs and shedding non-core assets, as the rebound
in gold prices over the coming quarters will be modest. Chinese firms in particular will look to purchase
foreign, high-quality assets offloaded by overleveraged majors. Barrick Gold, Newmont Mining,
AngloGold Ashanti and Goldcorp will remain the largest producers, with the top 10 miners accounting for
approximately one-quarter of global output.
Further Consolidation Ahead
Global Gold Market Share By Production Volume (%), 2015
Source: Bloomberg, BMI
Latest Financial Results
In Q116, Barrick reported EBITDA of USD696mn and a net loss of USD83mn. The firm achieved a fourth
consecutive quarter of positive free cash flow, with USD181mn. Barrick reported year-to-date debt
reduction of USD842mn and remains on track to reduce debt by USD2.0bn over the 2016 fiscal year. The
firm produced 1.3moz of gold, a slight decline from 1.4moz in Q115 due to divested mines. Barrick's costs
Tanzania Mining Report Q4 2016
© Business Monitor International Ltd Page 31

remain globally competitive and in line with annual targets, with all-in sustaining costs of USD706/oz and
cash costs of USD553/oz for the quarter.
Debt Outlook To Improve
Barrick Gold - 2025 USD Bond Yield (%, LHS) & 5 Year CDS (RHS)
Source: Bloomberg, BMI
Company Strategy
Barrick will continue to prioritise free cash flow growth and improving its asset portfolio to better withstand
volatile gold prices over the coming years. The company projects lower annual copper and gold production
in 2016 on the back of decreasing capital expenditure (capex) and mine divestitures. 2016 capex is expected
to be between USD1.4-1.6bn, down from USD1.7bn in 2015 and significantly lower than 2.4bn in 2014.
Barrick Gold will continue to lower debt levels, reporting a USD3.1bn reduction in 2015 and estimating at
least a USD2.0bn decline in 2016, through selling non-core assets and creating new joint ventures and
partnerships. The firm will also remain cost competitive, targeting 2016 average gold cash costs between
USD540-580/oz, down from USD596/oz in 2015.
Optimising the asset portfolio will continue to be a key strategy for reducing debt and operating costs for
Barrick. On January 11, Barrick completed the sale of the firm's 50% stake in Round Mountain and the
Tanzania Mining Report Q4 2016
© Business Monitor International Ltd Page 32

wholly-owned Bald Mountain mine in Nevada to Kinross Gold for USD610mn. In December 2015, Barrick
sold its 70% stake in the Spring Valley project and wholly-owned Ruby Hill mine in Nevada to subsidiaries
of Waterton Precious Metals Fund for USD110. Also in December 2015, the firm completed the sale of a
50% stake in the Zaldivar mine in Chile to Antofagasta.
Austerity To Remain
Barrick Gold - Capital Expenditures (USDmn)
Est = estimate. Source: Bloomberg
Table: Barrick Gold - Key Projects
Country Mineral Mine PhaseCapex(USDmn) Notes
United States Gold Turquiose Ridge Expansion 300-325Increase production from 280kozpa to500kozpa
Chile/Argentina Gold Pascua-LamaNewproject 8,500 Stalled, estimated production 800-805kozpa
Chile Gold Cerro CasaleNewproject 6,000 Reserves of 17.4moz
United States Gold GoldrushNewproject 1,000 Estimated 440kozpa, expected 2021
Peru Gold Lagunas Norte Expansion 640 Estimated 240kozpa, expected late 2021
Tanzania Mining Report Q4 2016
© Business Monitor International Ltd Page 33
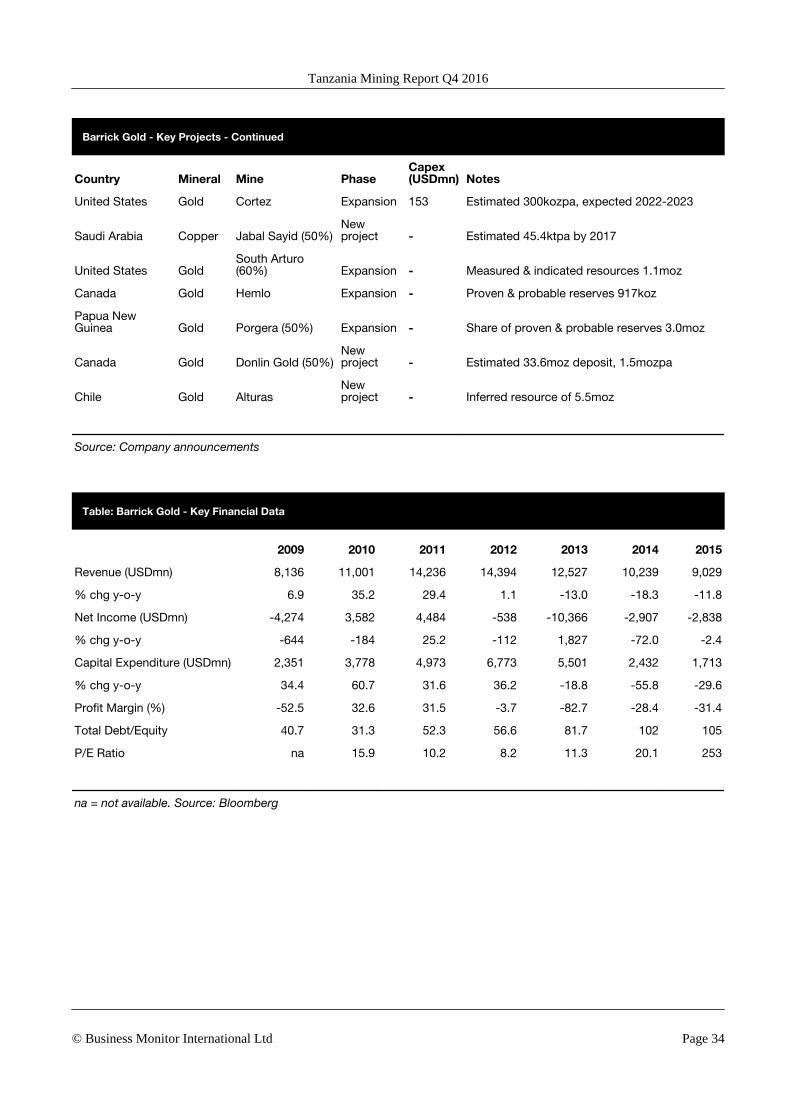
Barrick Gold - Key Projects - Continued
Country Mineral Mine PhaseCapex(USDmn) Notes
United States Gold Cortez Expansion 153 Estimated 300kozpa, expected 2022-2023
Saudi Arabia Copper Jabal Sayid (50%)Newproject - Estimated 45.4ktpa by 2017
United States GoldSouth Arturo(60%) Expansion - Measured & indicated resources 1.1moz
Canada Gold Hemlo Expansion - Proven & probable reserves 917koz
Papua NewGuinea Gold Porgera (50%) Expansion - Share of proven & probable reserves 3.0moz
Canada Gold Donlin Gold (50%)Newproject - Estimated 33.6moz deposit, 1.5mozpa
Chile Gold AlturasNewproject - Inferred resource of 5.5moz
Source: Company announcements
Table: Barrick Gold - Key Financial Data
2009 2010 2011 2012 2013 2014 2015
Revenue (USDmn) 8,136 11,001 14,236 14,394 12,527 10,239 9,029
% chg y-o-y 6.9 35.2 29.4 1.1 -13.0 -18.3 -11.8
Net Income (USDmn) -4,274 3,582 4,484 -538 -10,366 -2,907 -2,838
% chg y-o-y -644 -184 25.2 -112 1,827 -72.0 -2.4
Capital Expenditure (USDmn) 2,351 3,778 4,973 6,773 5,501 2,432 1,713
% chg y-o-y 34.4 60.7 31.6 36.2 -18.8 -55.8 -29.6
Profit Margin (%) -52.5 32.6 31.5 -3.7 -82.7 -28.4 -31.4
Total Debt/Equity 40.7 31.3 52.3 56.6 81.7 102 105
P/E Ratio na 15.9 10.2 8.2 11.3 20.1 253
na = not available. Source: Bloomberg
Tanzania Mining Report Q4 2016
© Business Monitor International Ltd Page 34

Table: Gold - Operational Highlights, 2015
CompanyProduction
(koz)
Production(% global
total)Cash Costs
(USD/oz)
All-InSustaining
Costs(USD/oz)
Reserves('000
tonnes)
ReservesContainedGold (moz)
Ore Grade(oz/tonne)
Barrick 6,117 12.0 596 831 2,160 91.9 0.042
Newmont 5,035 9.9 633 898 2,158 73.7 0.034
AngloGold Ashanti 3,947 7.7 712 910 1,154 51.7 0.045
Goldcorp 3,464 6.8 605 893 1,195 40.7 0.034
Kinross 2,595 5.1 684 971 1,478 34.0 0.023
Newcrest 2,420 4.7 863 na 3,912 75.0 0.02
Gold Fields 2,099 4.1 1,026 1,007 491 46.2 0.948
Polyus 1,763 3.5 424 610 986 2.1 0.07
Sibanye 1,536 3.0 852 1,036 967 31.0 0.03
Yamana 1,275 2.5 596 868 781 15.9 0.02
Randgold 1,211 2.4 679 na 137 15.0 3.67
na = not available. Source: Bloomberg, Company announcements
Tanzania Mining Report Q4 2016
© Business Monitor International Ltd Page 35

Regional Overview
Sub-Saharan Africa Overview
BMI View: Sub-Saharan Africa's mining sector growth will slow as low mineral prices will drive further
consolidation, production cuts and divestments among metal producers. While our outlook remains bleak,
some bright spots remain, as both Mozambique and the DRC will continue to see solid industry growth over
the coming quarters.
Key Themes:
■ Low metal prices will result in further significant divestment of assets, output cuts and bankruptcies asboth mining and metal companies remain under significant stress.
■ Chinese and Indian outbound mining investment will remain resilient due to Sub-Saharan Africa(SSA)'s vast mineral reserves and low production costs.
■ The implications of low mineral prices, mining royalty hikes, and labour unrest, will be high on thepolitical agenda in SSA countries with a large mining sector
■ SSA's natural resources sector will remain a crucial contributor to GDP over the next five years in spiteof lower commodity prices causing mining companies to delay projects and slash capex.
Tanzania Mining Report Q4 2016
© Business Monitor International Ltd Page 36

Value To Base
North Africa & SSA - Mining Industry Value (USDbn)
Mining industry value
2011 2012 2013 2014 2015e 2016f 2017f 2018f 2019f
20
40
60
80
100
e/f = BMI estimate/forecast. Source: BMI
1. Next Phase Of Divestments, Production Cuts And Bankruptcies
Although we forecast that metal prices will stabilise in 2016, mining sector companies will remain under
significant pressure due to declining profit margins. We expect to see miners increasingly surrender to a
'lower for longer' price outlook, which will result in further significant divestment of assets, output cuts and
bankruptcies. Further cuts are only the next stage, rather than the end of a dramatic restructuring of the
mining and commodities trading industry that will continue in 2016 (see: 'Global Mining: The Five Key
Themes', December 17, 2015).
Within SSA, South Africa will be hit hardest by further divestments within the sector. For instance, on
December 8, 2015, Anglo American announced plans to divest, halt or close a majority of the firm's assets.
Pursuant to the firm's strategy, South Africa will be hit hardest - most notably, the country's coal industry,
as Anglo accounts for nearly 21.5% of the country's total thermal coal production. Furthermore, Anglo's
plans to cut employment will hit the sector as well, as Anglo employs over 24,500 people in its thermal coal
Tanzania Mining Report Q4 2016
© Business Monitor International Ltd Page 37

operations, while the firm's total employment within South Africa totals 72,000 (see: 'Anglo American's
Plan: South Africa To Be Hit Hardest', December 15, 2015).
Anglo's strategy follows on previous cuts and divestment made in 2015. For instance, in December the
firm's De Beers unit sold the Kimberley diamond mines, the firm's oldest diamond operation in South
Africa, to a consortium led by Petra Diamonds and South African firm Ekapa Mining for USD7.2mn.
Prior to that, in September 2015, the firm's South African subsidiary Anglo American Platinum sold the
Rustenburg platinum mines to Sibanye Gold for USD308mn (see: 'The End Of The Diversification
Strategy', March 18).
South Africa To Take The Brunt
Anglo American - No. Of Employees (LHC) & Share Per Country (%, RHC), 2014
Source: Bloomberg, Company Report, BMI
2. Africa To Remain Key Destination For Chinese & Indian Outbound Investment
Chinese and Indian outbound mining investment will remain resilient due to the region's vast mineral
reserves and low production costs. Although Chinese overseas investment experienced a lull during 2015,
the region will remain a major player in mining investment over the coming years. Over 2015, China
accounted for almost 12.0% of global merger and acquisition investment, totalling 28 deals, worth an
estimated USD2.7bn. Although China's total overseas mining investment fell by 50.1% y-o-y in 2015,
Tanzania Mining Report Q4 2016
© Business Monitor International Ltd Page 38

China's mining investment in the Middle East & Africa dropped only slightly, by 9.8%, maintaining a
significant value of USD588mn. Meanwhile, Indian firms will continue to ramp up investment in overseas
coal projects (see: 'Africa To Remain Key Mining Investment Destination', 21 December, 2015).
■ Investment To Focus On Africa- Chinese and Indian firms will increasingly invest in African countries,such as Mozambique and the DRC, rather than South Africa. South Africa's investment attractivenesswill decrease due to both ongoing power shortage and labour unrest, which will increase operationalchallenges within the country. For instance, global mining investment in Mozambique grew by anenormous 710% y-o-y during 2015, compared to only a 22.8% y-o-y increase in investment in SouthAfrica.
■ China To Favour Copper Investment - Chinese overseas investment will increasingly focus on copperprojects in Africa, in particular the DRC. The key factor behind the shift towards ramping up overseascopper investment is the result of China's copper consumption continuing to outstrip domesticproduction. Chinese firms will increasingly invest in the DRC, supported by the country's low productioncosts and the biggest undeveloped high-grade copper deposits in the world. For instance, in December2015, China-based Zijin Mining Group invested USD412mn in Canadian firm Ivanhoe Mines' Kamoacopper project. Ivanhoe also agreed to divest 1.0% of Kamoa for USD8.3mn to Hong Kong-basedCrystal River Global.
■ India To Favour Coal Investment - India will increasingly focus on developing coal projects overseasin order to meet domestic coal demand. As such, Mozambique, which holds vast coal reserves and wasthe second highest African recipient of Indian foreign direct investment in 2015, will continue to be a keytarget of investment. Notable developments in Mozambique include India-based International CoalVentures Private Limited's Zambeze and Tete East thermal coal projects in the resource-abundantMoatize coal basin, and Chinese firms Triton Minerals' Ancuabe and Syrah Resources' Balamagraphite projects.
Tanzania Mining Report Q4 2016
© Business Monitor International Ltd Page 39

Persistent Deficit Despite Weak Consumption Growth
China - Production Balance As % Of Total Consumption
Note: Negative share shows that the country's production balance is in deficit. Source: National sources, BMI
3. Government Involvement To Curb Investment Attractiveness
The implications of low mineral prices, mining royalty hikes, and labour unrest, will be high on the political
agenda in SSA countries with a large mining sector (see: 'Mining: The Political Flashpoints In 2016',
March 30). Government intervention will play out through economic or regulatory measures in response to
a variety of political, economic and populist concerns.
Tanzania Mining Report Q4 2016
© Business Monitor International Ltd Page 40

Mineral Policy Uncertainty To Increase
Select Countries - Government Involvement
Source: BMI
The table below illustrates the key countries where we expect government intervention will continue to
increase in 2016.
Tanzania Mining Report Q4 2016
© Business Monitor International Ltd Page 41
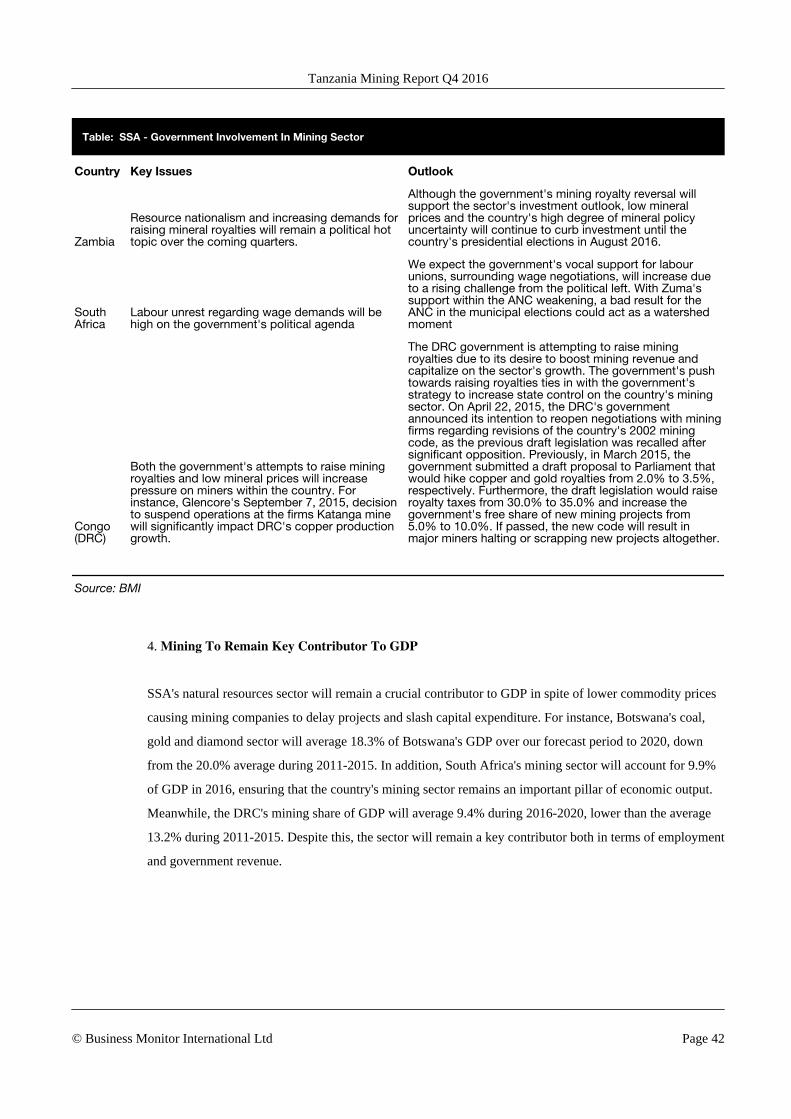
Table: SSA - Government Involvement In Mining Sector
Country Key Issues Outlook
Zambia
Resource nationalism and increasing demands forraising mineral royalties will remain a political hottopic over the coming quarters.
Although the government's mining royalty reversal willsupport the sector's investment outlook, low mineralprices and the country's high degree of mineral policyuncertainty will continue to curb investment until thecountry's presidential elections in August 2016.
SouthAfrica
Labour unrest regarding wage demands will behigh on the government's political agenda
We expect the government's vocal support for labourunions, surrounding wage negotiations, will increase dueto a rising challenge from the political left. With Zuma'ssupport within the ANC weakening, a bad result for theANC in the municipal elections could act as a watershedmoment
Congo(DRC)
Both the government's attempts to raise miningroyalties and low mineral prices will increasepressure on miners within the country. Forinstance, Glencore's September 7, 2015, decisionto suspend operations at the firms Katanga minewill significantly impact DRC's copper productiongrowth.
The DRC government is attempting to raise miningroyalties due to its desire to boost mining revenue andcapitalize on the sector's growth. The government's pushtowards raising royalties ties in with the government'sstrategy to increase state control on the country's miningsector. On April 22, 2015, the DRC's governmentannounced its intention to reopen negotiations with miningfirms regarding revisions of the country's 2002 miningcode, as the previous draft legislation was recalled aftersignificant opposition. Previously, in March 2015, thegovernment submitted a draft proposal to Parliament thatwould hike copper and gold royalties from 2.0% to 3.5%,respectively. Furthermore, the draft legislation would raiseroyalty taxes from 30.0% to 35.0% and increase thegovernment's free share of new mining projects from5.0% to 10.0%. If passed, the new code will result inmajor miners halting or scrapping new projects altogether.
Source: BMI
4. Mining To Remain Key Contributor To GDP
SSA's natural resources sector will remain a crucial contributor to GDP in spite of lower commodity prices
causing mining companies to delay projects and slash capital expenditure. For instance, Botswana's coal,
gold and diamond sector will average 18.3% of Botswana's GDP over our forecast period to 2020, down
from the 20.0% average during 2011-2015. In addition, South Africa's mining sector will account for 9.9%
of GDP in 2016, ensuring that the country's mining sector remains an important pillar of economic output.
Meanwhile, the DRC's mining share of GDP will average 9.4% during 2016-2020, lower than the average
13.2% during 2011-2015. Despite this, the sector will remain a key contributor both in terms of employment
and government revenue.
Tanzania Mining Report Q4 2016
© Business Monitor International Ltd Page 42

Share Of GDP To Fall
Select Countries - Mining Industry Value, % Of GDP
Note: The 'All Africa Average' line represents the average contribution of each mining sector to total country GDP for all the sub-
Saharan African countries we cover: Angola, Botswana, Congo (DRC), Côte d'Ivoire, Ghana, Guinea, Liberia, Mali, Mauritania,
Mozambique, Namibia, Sierra Leone, South Africa, Tanzania, Zambia, and Zimbabwe. f = BMI forecast. Source: UN Data, World
Bank, BMI
Tanzania Mining Report Q4 2016
© Business Monitor International Ltd Page 43

Methodology
Industry Forecast Methodology
BMI's industry forecasts are generated using the best-practice techniques of time-series modelling and
causal/econometric modelling. The precise form of model we use varies from industry to industry, in each
case being determined, as per standard practice, by the prevailing features of the industry data being
examined.
Common to our analysis of every industry is the use of vector autoregressions. Vector autoregressions allow
us to forecast a variable using more than the variable's own history as explanatory information. For
example, when forecasting oil prices, we can include information about oil consumption, supply and
capacity.
When forecasting for some of our industry sub-component variables, however, using a variable's own
history is often the most desirable method of analysis. Such single-variable analysis is called univariate
modelling. We use the most common and versatile form of univariate models: the autoregressive moving
average model (ARMA).
In some cases, ARMA techniques are inappropriate because there is insufficient historic data or data quality
is poor. In such cases, we use either traditional decomposition methods or smoothing methods as a basis for
analysis and forecasting.
BMI mainly uses OLS estimators and in order to avoid relying on subjective views and encourage the use
of objective views, BMI uses a 'general-to-specific' method. BMI mainly mainly uses a linear model, but
simple non-linear models, such as the log-linear model, are used when necessary. During periods of
'industry shock', for example poor weather conditions impeding agricultural output, dummy variables are
used to determine the level of impact.
Effective forecasting depends on appropriately selected regression models. BMI selects the best model
according to various different criteria and tests, including but not exclusive to:
■ R2 tests explanatory power; adjusted R2 takes degree of freedom into account;
■ Testing the directional movement and magnitude of coefficients;
■ Hypothesis testing to ensure coefficients are significant (normally t-test and/or P-value);
■ All results are assessed to alleviate issues related to auto-correlation and multi-collinearity.
Tanzania Mining Report Q4 2016
© Business Monitor International Ltd Page 44
BMI uses the selected best model to perform forecasting.
Human intervention plays a necessary and desirable role in all of BMI's industry forecasting. Experience,
expertise and knowledge of industry data and trends ensure that analysts spot structural breaks, anomalous
data, turning points and seasonal features where a purely mechanical forecasting process would not.
Sector-Specific Methodology
■ Industry value
The mining industry value is the amount that the mining sector (mining activity and downstream services)
contributes to the country's GDP. Our historic figures are taken from the national statistics agency from the
respective countries, and so the exact definition might vary slightly between countries. Forecast growth
rates take into account our in-house assumptions for investment and production growth in key mining
segments of the country, as well as commodity prices for key minerals over the five-year forecast period.
■ Production volumes
Production forecasts are for mined production (ore and concentrates) rather than refined production, and
refer to contained metal. Coal production forecasts are simply for tonnage of coal. Our forecasting
methodology is based on investment plans by major players and an assessment of how these plans will be
affected by our expectations for several factors including:
■ Commodity prices
We have our own in-house commodity price forecasts, which are part of the commodities strategy service
we provide to clients. Commodity price forecasts are created by combining our analysis of macroeconomic
factors, country-by-country supply and demand, financial market flows and technical chart patterns.
■ Regulatory developments
In combination with our country risk analysts we are able to formulate regulatory trajectories per country,
highlighting potential for regulatory change, both positive and negative.
Sources
We use a combination of national statistics, multilateral sources (US Geological Survey, UN, Energy
Information Administration, etc) and company information to populate our historical data series. Our
forecasts are formulated using the proprietary techniques detailed above.
Tanzania Mining Report Q4 2016
© Business Monitor International Ltd Page 45

Risk/Reward Index Methodology
BMI's Risk/Reward Index provide a comparative regional ranking system evaluating the ease of doing
business and the industry-specific opportunities and limitations for potential investors in a given
market. The index divides into two distinct areas:
Rewards
Evaluation of the sector's size and growth potential in each state, and also broader industry/state
characteristics that may inhibit its development. This is further broken down into two sub categories:
■ Market Rewards: this is an industry-specific category that takes into account current industry size andgrowth forecasts, the openness of market to new entrants and foreign investors, to provide an overallscore for potential returns for investors.
■ Country Rewards: this is a country-specific category, and the score factors in favourable political andeconomic conditions for the industry.
Risks
Evaluation of industry-specific dangers and those emanating from the state's political/economic profile that
call into question the likelihood of anticipated returns being realised over the assessed time period. This is
broken down into two sub categories:
■ Market Risks: this is an industry-specific category. The score covers potential operational risks toinvestors, regulatory issues inhibiting the industry and the relative maturity of a market.
■ Country Risks: this is a country-specific category in which political and economic instability,unfavourable legislation and a poor overall business environment are evaluated.
We take a weighted average, combining market and country risks, or market and country rewards. These
two results provide an overall Risk/Reward Index, used to create our regional ranking system for the risks
and rewards of involvement in a specific industry in a particular country.
For each category and sub-category, each state is scored out of 100 (with 100 the best), with the overall
Risk/Reward Index a weighted average of the total score. As most of the countries and territories evaluated
are considered by BMI to be 'emerging markets', our index is revised on a quarterly basis. This ensures that
the score draws on the latest information and data across our broad range of sources, and the expertise of
our analysts.
Tanzania Mining Report Q4 2016
© Business Monitor International Ltd Page 46

BMI's approach in assessing the risk/reward balance for mining industry investors globally is fourfold:
First, we identify factors (in terms of current industry/country trends and forecast industry/country growth)
that represent opportunities to would-be investors. Second, we identify country and industry-specific traits
that pose or could pose operational risks to would-be investors. Third, we attempt to identify objective
indicators that may serve as proxies for issues/trends to avoid subjectivity.
Finally, we use our proprietary Country Risk Index (CRI) in a nuanced manner to ensure that only the
aspects most relevant to the mining industry are incorporated. Overall, the system offers an industry-
leading, comparative insight into the opportunities/risks for companies worldwide.
Sector-Specific Methodology
In constructing this index, the following indicators have been used. Almost all indicators are objectively
based. Given the number of indicators/datasets used, it would be inappropriate to give all sub-components
equal weight. Consequently, the following weighting has been adopted:
Table: Weighting Of Indicators
Weighting, %
Rewards 70, of which
Industry Rewards 80, of which
Mining output, USDbn 33
Sector growth, % y-o-y 33
Mining sector, % of GDP 33
Country Rewards 20, of which
Labour market infrastructure 25
Physical infrastructure 25
Tax 25
Scope of State 25
Risks 30, of which
Industry Risks 50, of which
Metals prices 25
Average change in metal prices 10 year 25
Mining regulatory framework 25
Mining legal framework 25
Tanzania Mining Report Q4 2016
© Business Monitor International Ltd Page 47

Weighting Of Indicators - Continued
Weighting, %
Country Risks 50, of which
Long-term economic rating 25
Corruption 25
Bureaucracy 25
Long-term policy continuity 25
Source: BMI
Tanzania Mining Report Q4 2016
© Business Monitor International Ltd Page 48