tankers performing international salvage union 17 march 2004 peter m. swift
TRANSCRIPT
Tankers PERFORMING
INTERNATIONAL SALVAGE UNION
17 March 2004
Peter M. Swift
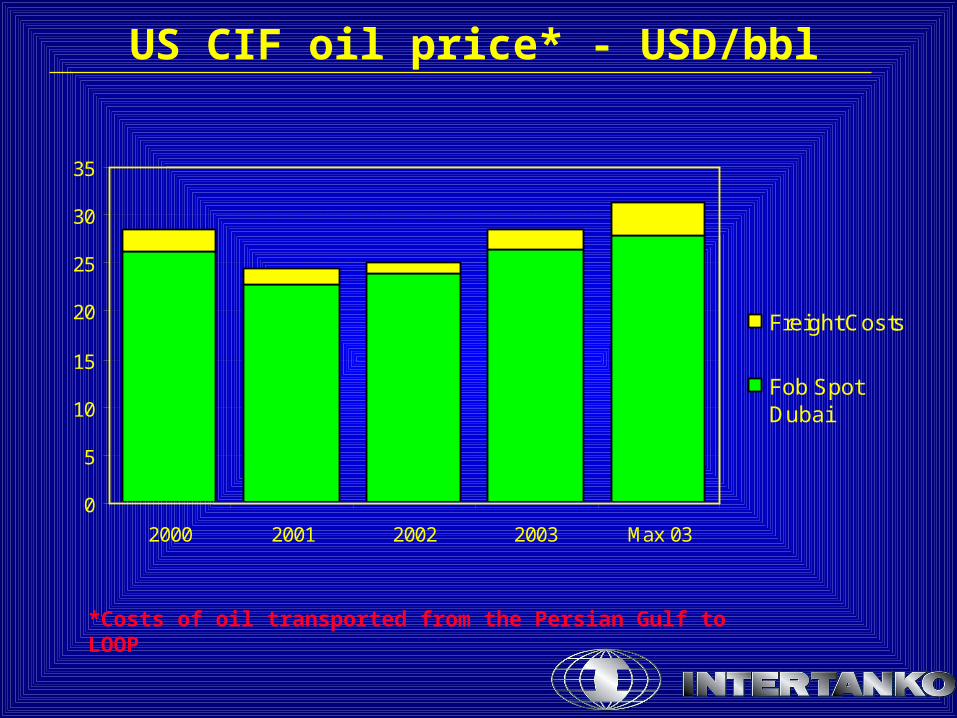
US CIF oil price* - USD/bbl
0
5
10
15
20
25
30
35
2000 2001 2002 2003 Max 03
Freight Costs
Fob SpotDubai
*Costs of oil transported from the Persian Gulf to LOOP
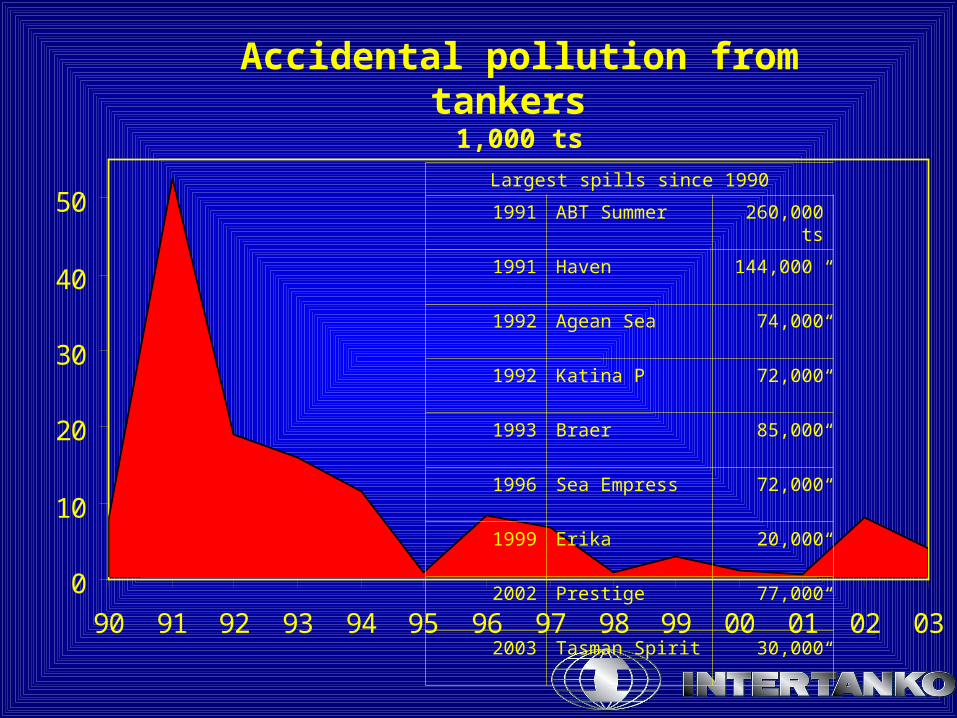
Accidental pollution from tankers 1,000 ts
0
10
20
30
40
50
90 91 92 93 94 95 96 97 98 99 00 01 02 03
Largest spills since 1990
1991 ABT Summer 260,000 ts
1991 Haven 144,000 ”
1992 Agean Sea 74,000 ”
1992 Katina P 72,000 ”
1993 Braer 85,000 ”
1996 Sea Empress 72,000 ”
1999 Erika 20,000 ”
2002 Prestige 77,000 ”
2003 Tasman Spirit 30,000 ”
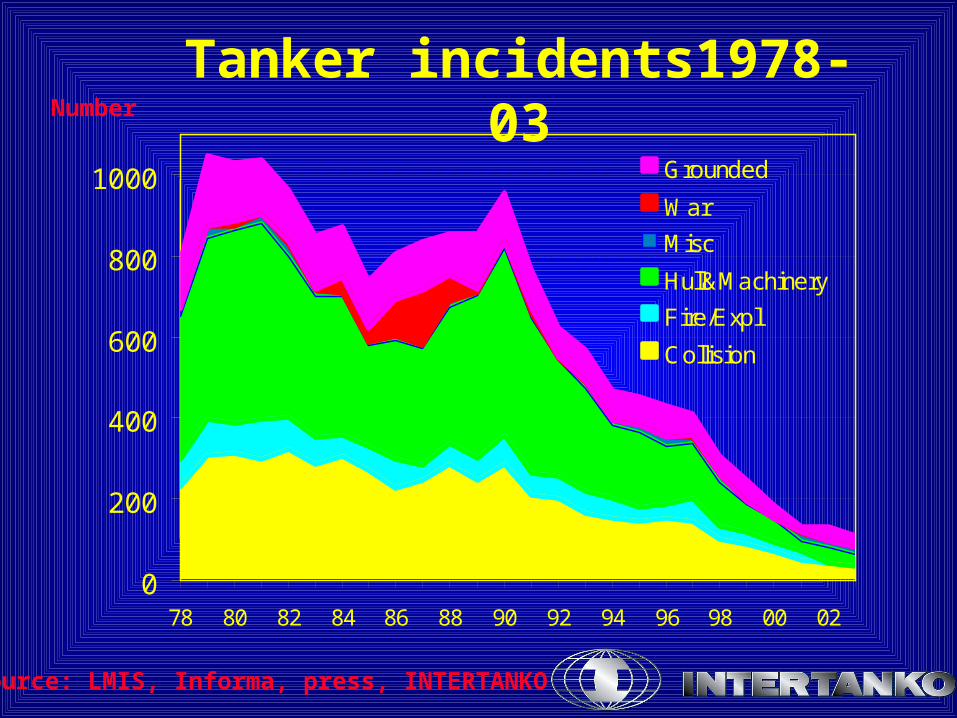
Tanker incidents1978-03
0
200
400
600
800
1000
78 80 82 84 86 88 90 92 94 96 98 00 02
Grounded
War
Misc
Hull&Machinery
Fire/Expl
Collision
Source: LMIS, Informa, press, INTERTANKO
Number
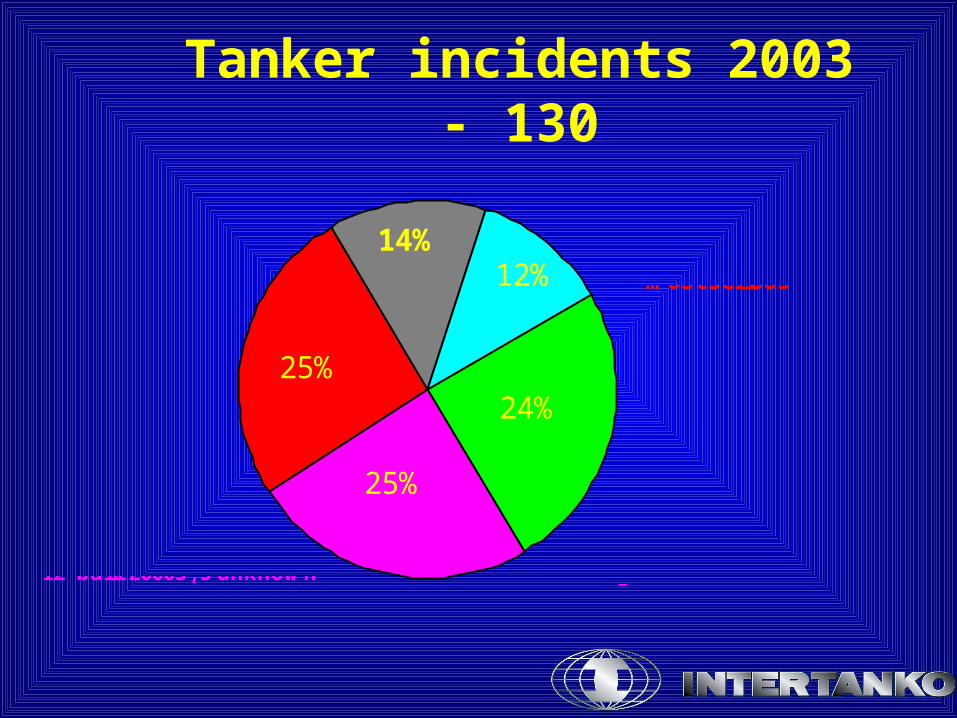
Tanker incidents 2003 - 130
12%
25%
24%25%
14%
Collision
Groundings
Hull&machinery: 28
13 engine,6 steer/prop/rudder5 hull5 other
Fire&Expl.
Misc.
.
dw t. Tankers involved
36 below 10,00038 10-29,999 dw t35 30-99,999 dw t17 > 100,000 dw t
Age tankers involved :
24 built 1970s or earlier48 built 1980s43 built 1990s12 built 2000s, 3 unknow n
7 involving pollution of
which Tasman Spirit most serious
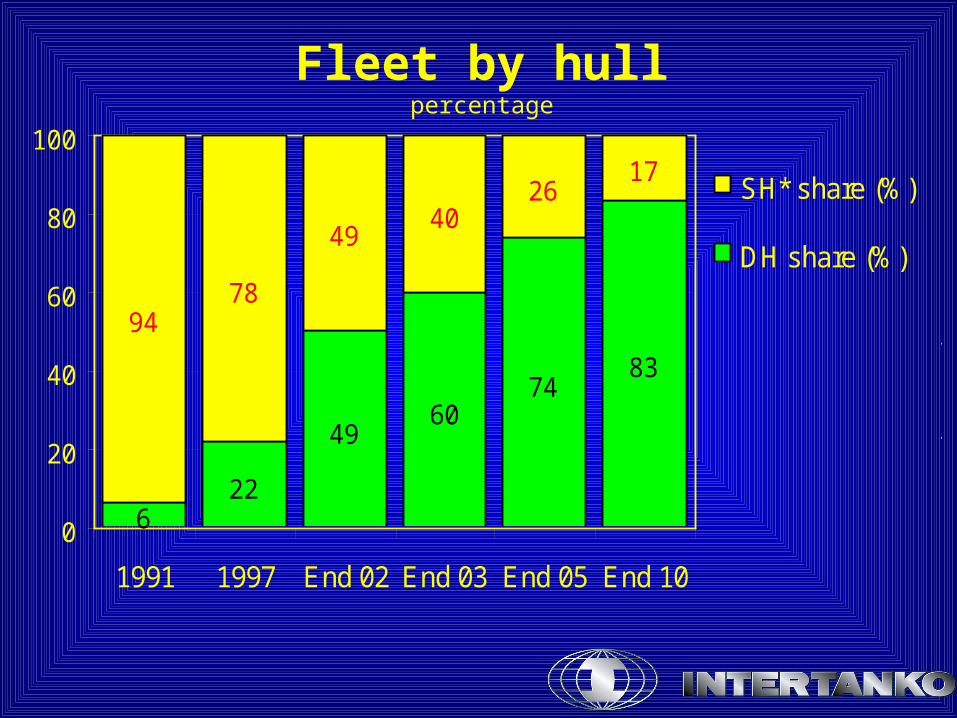
Fleet by hullpercentage
622
6074
83
9478
4940
2617
49
0
20
40
60
80
100
1991 1997 End 02 End 03 End 05 End 10
SH* share (%)
DH share (%)
End 05, all tankers
built 1982 and earlier goneEnd 10, all tankers built 1987 and earlier gonetrading beyond 2010 subject to administrations
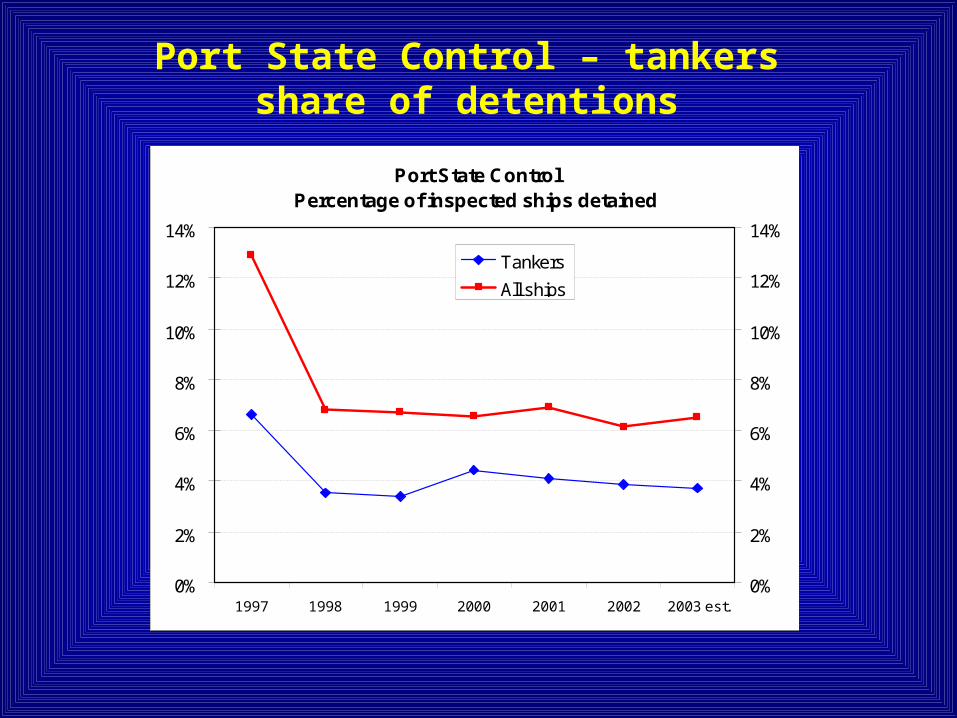
Port State Control – tankers share of detentions
Port State ControlPercentage of inspected ships detained
0%
2%
4%
6%
8%
10%
12%
14%
2003 est.2002200120001999199819970%
2%
4%
6%
8%
10%
12%
14%
Tankers
All ships
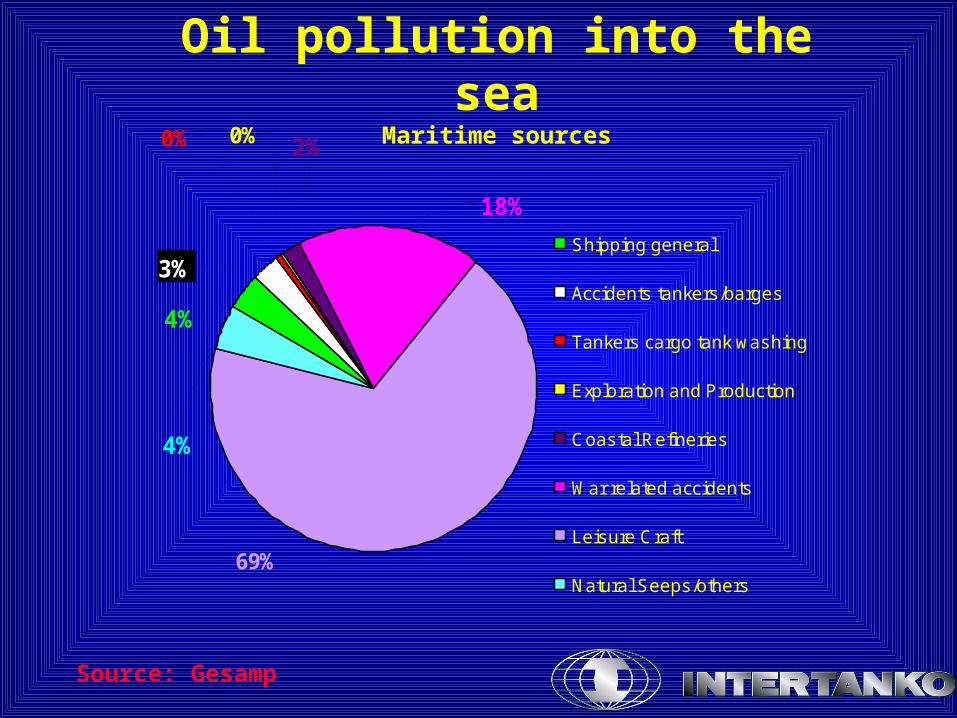
Oil pollution into the seaMaritime sources
Source: Gesamp
4%
69%
4%
2%
3%
0% 0%
18%
Shipping general
Accidents tankers/barges
Tankers cargo tank washing
Exploration and Production
Coastal Refineries
War related accidents
Leisure Craft
Natural Seeps/others
Tanker: 3%Shippping: 8% of which tanker accidents 2.8%
Tankers PERFORMING
Not complacent. More to do……………
Improved feedback and analysis
Better information sharing
Strengthened partnerships
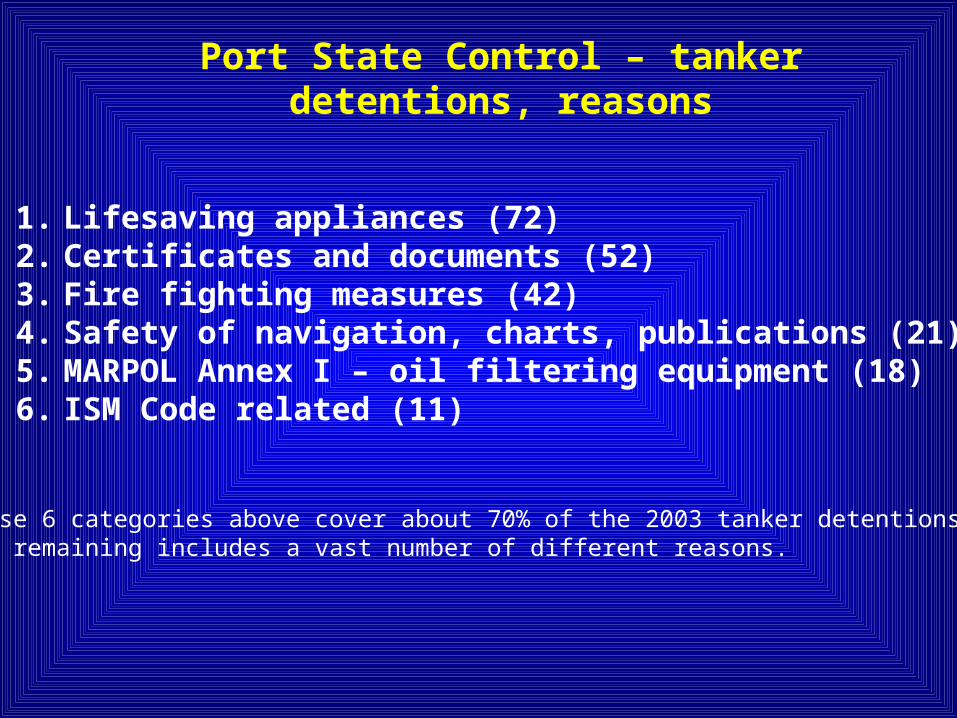
Port State Control – tanker detentions, reasons
1. Lifesaving appliances (72)2. Certificates and documents (52)3. Fire fighting measures (42)4. Safety of navigation, charts, publications (21)5. MARPOL Annex I – oil filtering equipment (18)6. ISM Code related (11)
These 6 categories above cover about 70% of the 2003 tanker detentions.The remaining includes a vast number of different reasons.
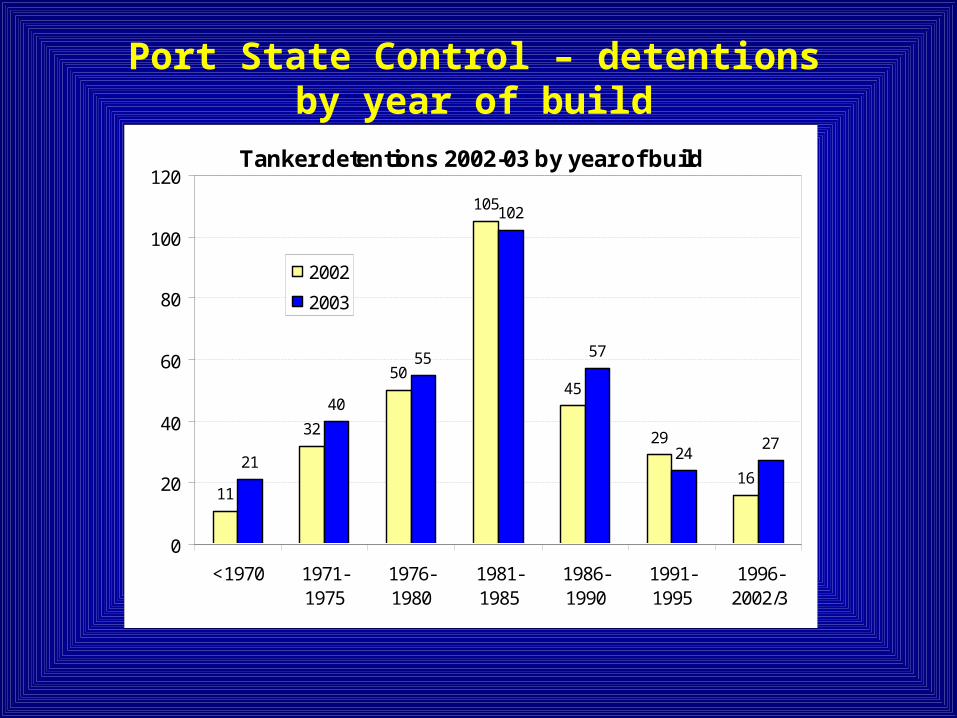
Port State Control – detentions by year of build
Tanker detentions 2002-03 by year of build
11
32
50
105
45
29
1621
40
55
102
57
2427
0
20
40
60
80
100
120
<1970 1971-1975
1976-1980
1981-1985
1986-1990
1991-1995
1996-2002/3
2002
2003
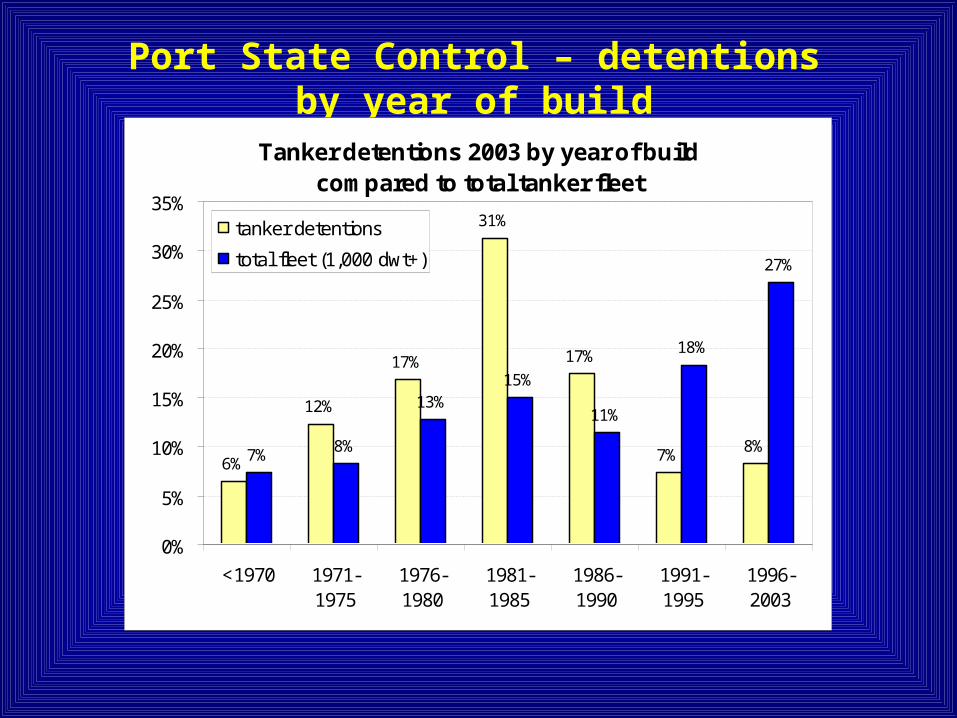
Port State Control – detentions by year of build
Tanker detentions 2003 by year of buildcompared to total tanker fleet
6%
12%
17%
31%
17%
7% 8%7% 8%
13%15%
11%
18%
27%
0%
5%
10%
15%
20%
25%
30%
35%
<1970 1971-1975
1976-1980
1981-1985
1986-1990
1991-1995
1996-2003
tanker detentions
total fleet (1,000 dwt+)
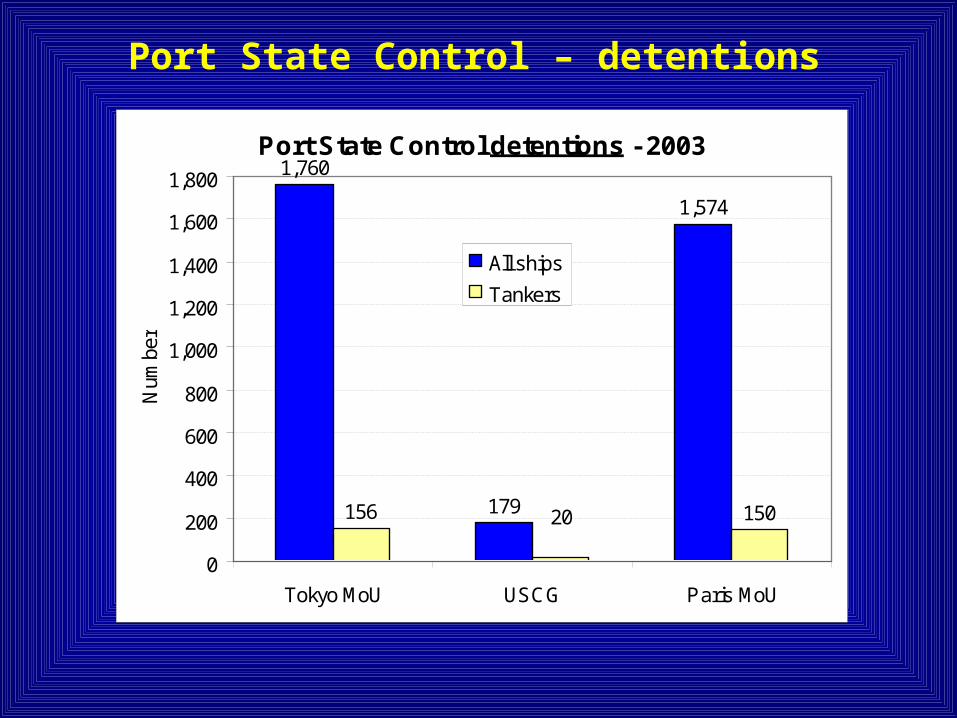
Port State Control – detentions
Port State Control detentions - 2003
156 150
1,760
179
1,574
20
0
200
400
600
800
1,000
1,200
1,400
1,600
1,800
Tokyo MoU USCG Paris MoU
Num
ber
All ships
Tankers
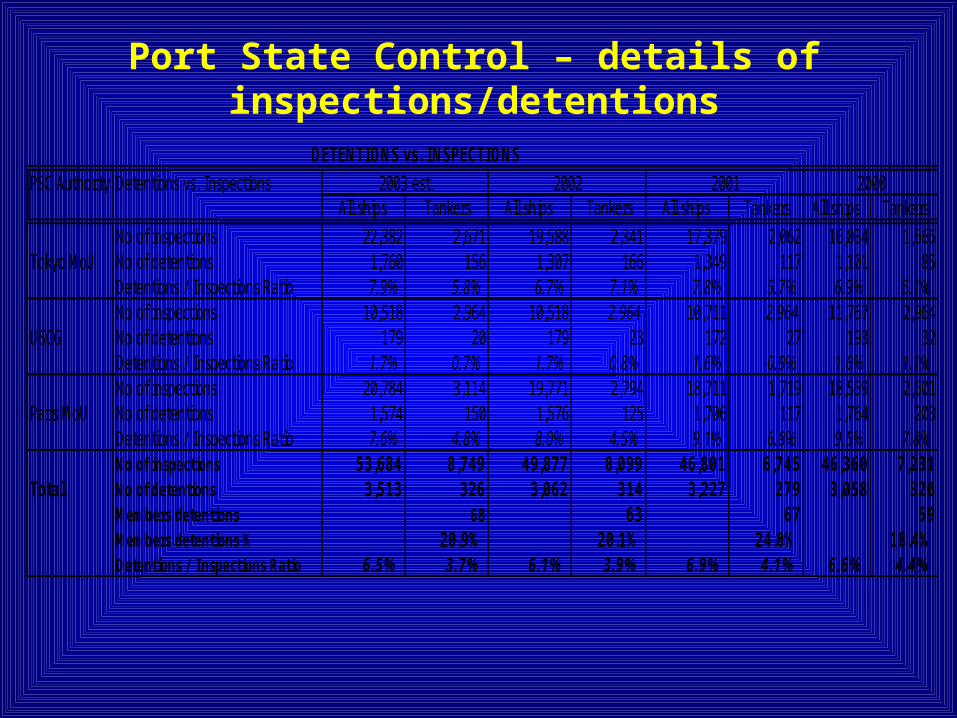
Port State Control – details of inspections/detentions
PSC Authority Detentions vs. InspectionsAll ships Tankers All ships Tankers All ships Tankers All ships Tankers
No of inspections 22,382 2,671 19,588 2,341 17,379 2,062 16,034 1,666Tokyo MoU No of detentions 1,760 156 1,307 166 1,349 117 1,101 85
Detentions / Inspections Ratio 7.9% 5.8% 6.7% 7.1% 7.8% 5.7% 6.9% 5.1%No of inspections 10,518 2,964 10,518 2,964 10,711 2,964 11,767 2,964
USCG No of detentions 179 20 179 23 172 27 193 32Detentions / Inspections Ratio 1.7% 0.7% 1.7% 0.8% 1.6% 0.9% 1.6% 1.1%No of inspections 20,784 3,114 19,771 2,794 18,711 1,719 18,559 2,601
Paris MoU No of detentions 1,574 150 1,576 125 1,706 117 1,764 203Detentions / Inspections Ratio 7.6% 4.8% 8.0% 4.5% 9.1% 6.8% 9.5% 7.8%No of inspections 53,684 8,749 49,877 8,099 46,801 6,745 46,360 7,231
Total No of detentions 3,513 326 3,062 314 3,227 279 3,058 320Members detentions 68 63 67 59Members detentions % 20.9% 20.1% 24.0% 18.4%Detentions / Inspections Ratio 6.5% 3.7% 6.1% 3.9% 6.9% 4.1% 6.6% 4.4%
2000DETENTIONS vs. INSPECTIONS
2003 est. 2002 2001
Tankers PERFORMING
Improved Feedback Mechansims
A new approach to Accident Investigations ?
Involvement of Shipbuilders beyond the One-Year Guarantee Period
Greater use of the Tanker Structure Cooperative Forum
Extension of Common Rules and Goal Based Standards for Newbuildings to Maintenance and Surveys of Ships in Service
Joint development of Industry Guidelines for “Best Practice”
Tankers PERFORMING
Better information sharing
Information sharing between inspection regimes
Cargo information – MSDS et al
Ship’s particulars and records
Ship’s performance (e.g. through expanded EQUASIS)
Enhanced incident reporting (e.g. including CHIRP)
BUT also need to recognise and deal with the impediments, such as recrimination, commercial disadvantaging and criminalisation, and the lack of incentives for openness
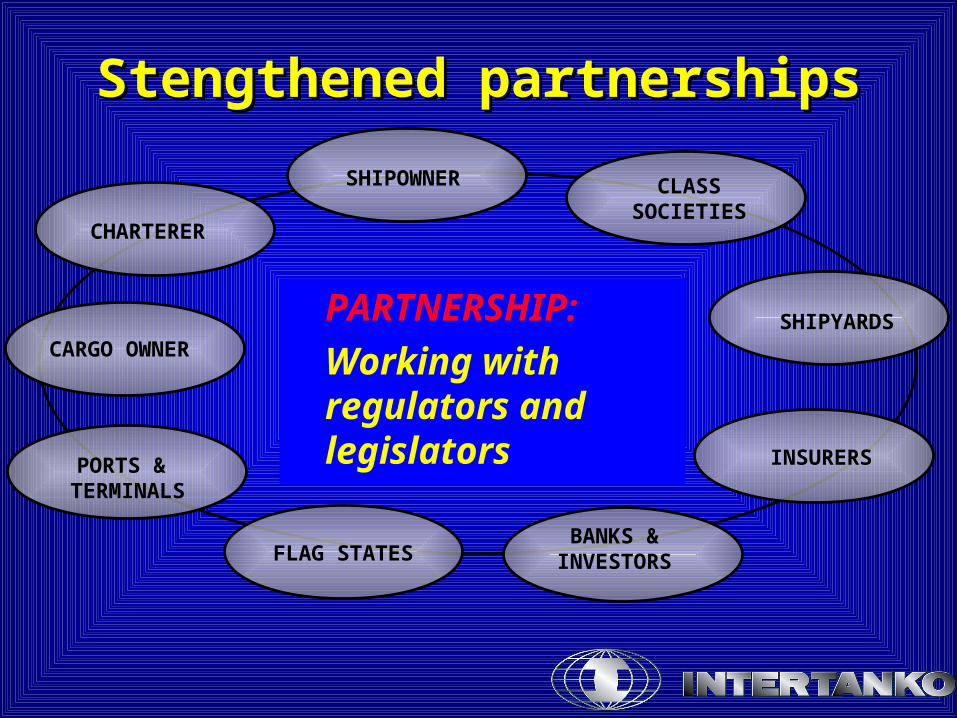
Stengthened partnershipsStengthened partnerships
SHIPOWNER
SHIPYARDS
INSURERS
BANKS &INVESTORS
CARGO OWNER
CHARTERER
PORTS & TERMINALS
CLASSSOCIETIES
FLAG STATES
PARTNERSHIP:Working with regulators and legislators
Tankers PERFORMING
More to do
Owners to be better prepared to handle a casualty- More drills, ERS, incident and media handling
And we need governments to deliver
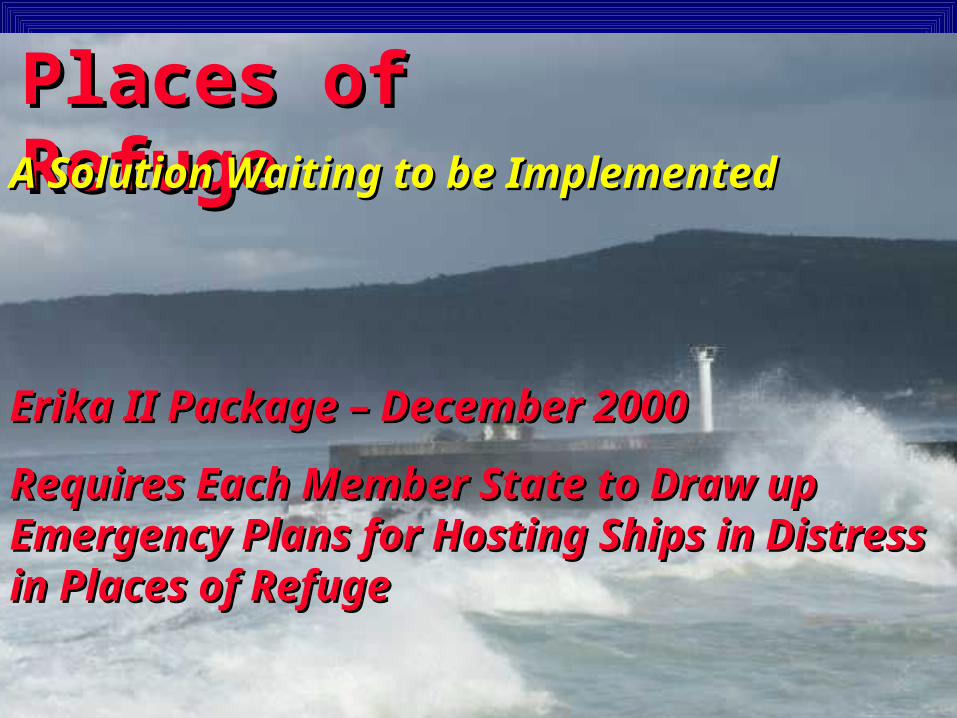
Places of RefugePlaces of RefugeA Solution Waiting to be ImplementedA Solution Waiting to be Implemented
Erika II Package – December 2000Erika II Package – December 2000
Requires Each Member State to Draw up Requires Each Member State to Draw up Emergency Plans for Hosting Ships in Emergency Plans for Hosting Ships in Distress in Places of RefugeDistress in Places of Refuge
Conventions – A STATUS REPORT
CONVENTION :Carriage of Hazardous and Noxious Substances by Sea (HNS 1996)
RATIFIED BY :Angola, Morocco, Russian Federation, Tonga
EU Transport Council, December 2002: ”ENCOURAGES Member States, as soon as possible, to ratify or accede to the International Convention on Liability and Compensation for Damage in Connection with the Carriage of Hazardous and Noxious Substances by Sea, 1996”
Conventions – A STATUS REPORT
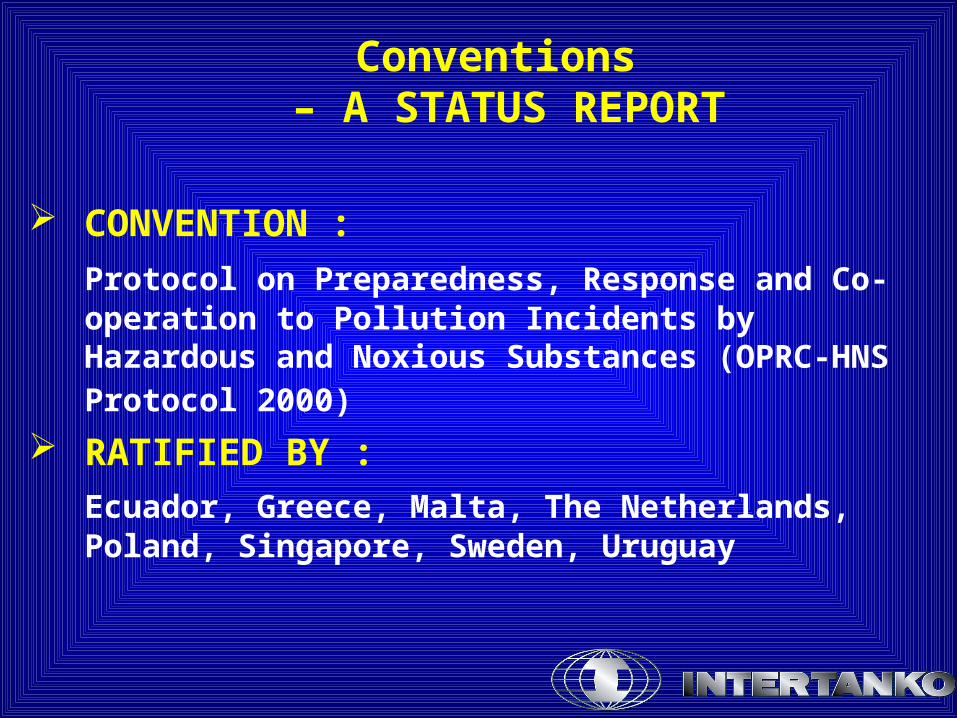
CONVENTION :
Protocol on Preparedness, Response and Co-operation to Pollution Incidents by Hazardous and Noxious Substances (OPRC-HNS Protocol 2000)
RATIFIED BY :
Ecuador, Greece, Malta, The Netherlands, Poland, Singapore, Sweden, Uruguay
Conventions – A STATUS REPORT
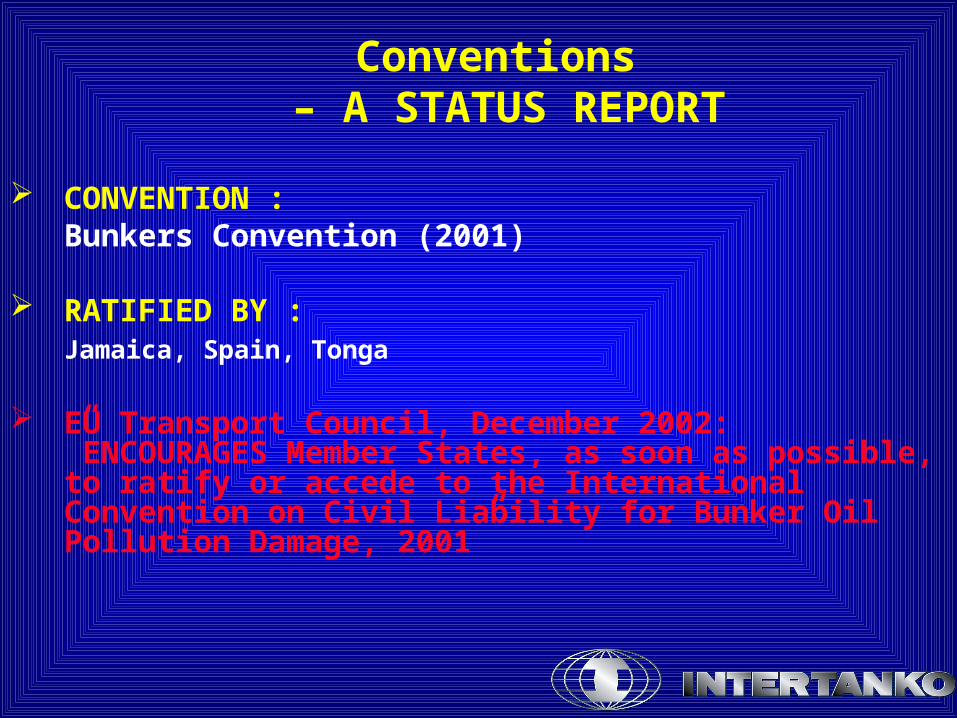
CONVENTION :Bunkers Convention (2001)
RATIFIED BY :Jamaica, Spain, Tonga
EU Transport Council, December 2002: ”ENCOURAGES Member States, as soon as possible, to ratify or accede to the International Convention on Civil Liability for Bunker Oil Pollution Damage, 2001”
Conventions – A STATUS REPORT
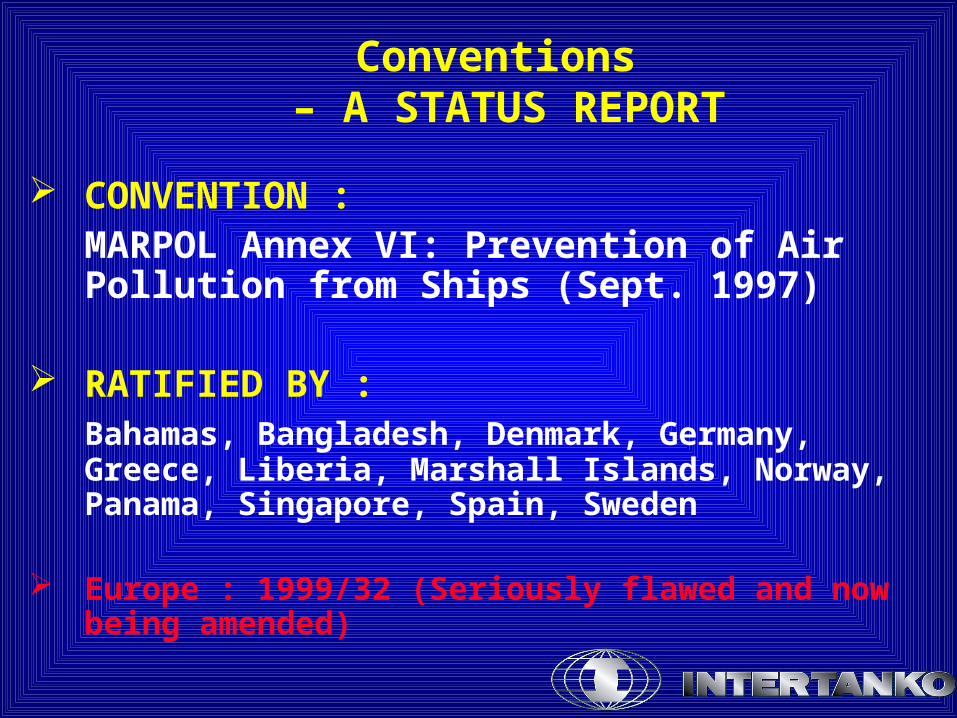
CONVENTION :MARPOL Annex VI: Prevention of Air Pollution from Ships (Sept. 1997)
RATIFIED BY :Bahamas, Bangladesh, Denmark, Germany, Greece, Liberia, Marshall Islands, Norway, Panama, Singapore, Spain, Sweden
Europe : 1999/32 (Seriously flawed and now being amended)
Conventions – A STATUS REPORT
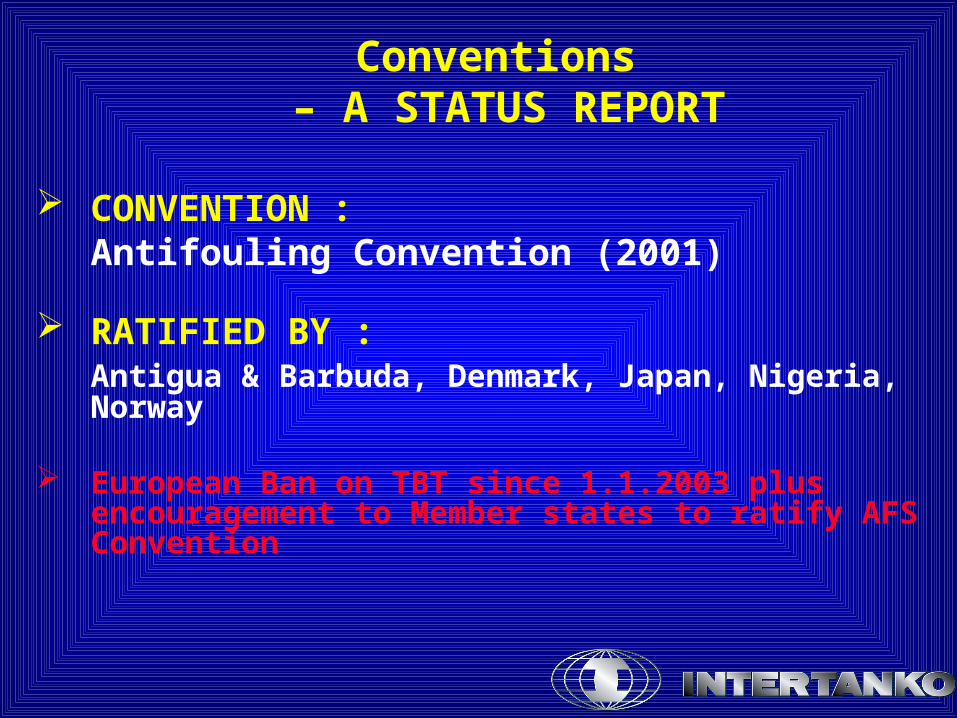
CONVENTION :Antifouling Convention (2001)
RATIFIED BY :Antigua & Barbuda, Denmark, Japan, Nigeria, Norway
European Ban on TBT since 1.1.2003 plus encouragement to Member states to ratify AFS Convention
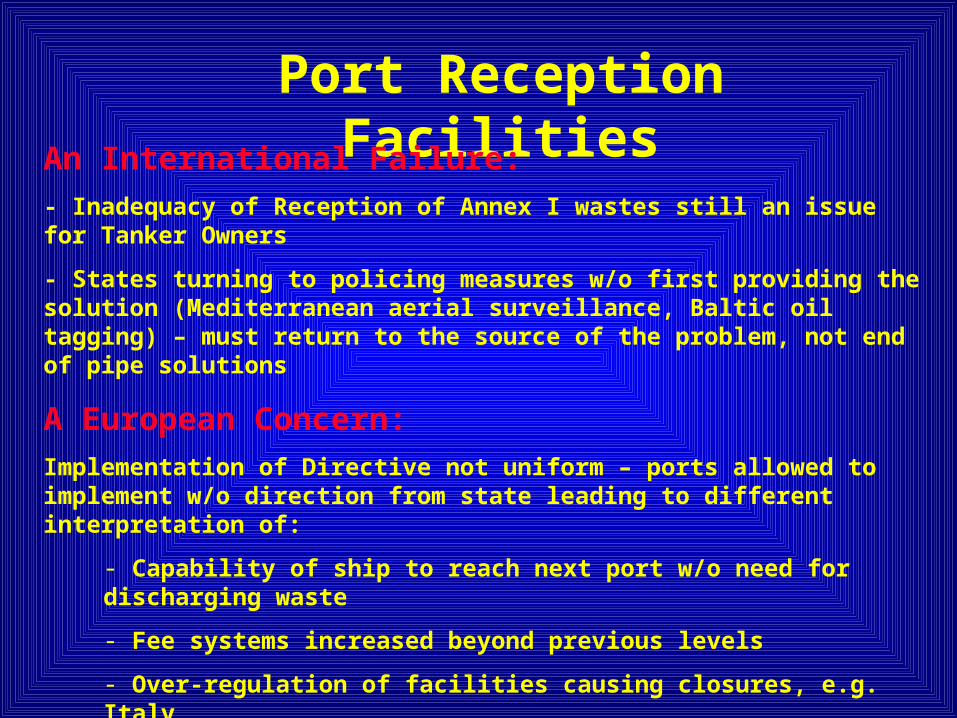
Port Reception Facilities
An International Failure:
- Inadequacy of Reception of Annex I wastes still an issue for Tanker Owners
- States turning to policing measures w/o first providing the solution (Mediterranean aerial surveillance, Baltic oil tagging) – must return to the source of the problem, not end of pipe solutions
A European Concern:
Implementation of Directive not uniform – ports allowed to implement w/o direction from state leading to different interpretation of:
- Capability of ship to reach next port w/o need for discharging waste
- Fee systems increased beyond previous levels
- Over-regulation of facilities causing closures, e.g. Italy
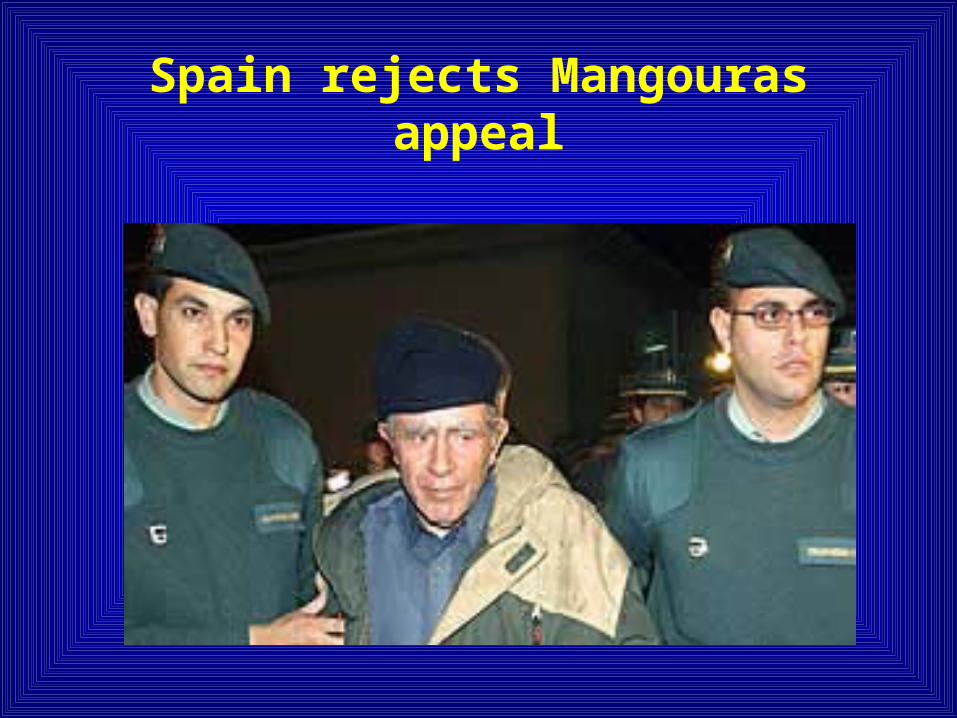
Spain rejects Mangouras appeal
Thank you
www.intertanko.com