tanium oxide nanotubes anodized in aqi t ueous and non...
TRANSCRIPT
Journal of Ceramic Processing Research. Vol. 9, No. 5, pp. 449~451 (2008)
449
J O U R N A L O F
CeramicProcessing Research
Titanium oxide nanotubes anodized in aqueous and non-aqueous electrolytes
Seong-Je Choa,b, Kyu-Shik Muna, Dae-Jin Yangb, Hun-Parkb, Yong-Joon Parkc, Jong-Oh Kimd and Won-Youl Choia,*aDept. of Metal and Materials Engineering, Kangnung National University, Kangnung, KoreabDept. of Materials Science and Engineering, KAIST, Daejeon, KoreacMajor of Advanced Materials Engineering, Kyonggi University, Suwon, KoreadDept. of Civil Engineering, Kangnung National University, Kangnung, Korea
Titanium oxide nanotubes having a very large surface area are very attractive for battery, gas sensor, photo catalytic applications,and as biomaterials. Titanium of 99.7% purity was anodized in 1 M potassium phosphate monobasic (KH2PO4) water solution,glycerine, and ethylene glycol with 0.15 M, 0.17 M, and 0.075 M NH4F. Titanium oxide nanotubes were fabricated at an anodizationmaximum potential of 25 V in the aqueous solution, 50 V in glycerine, and 60 V in the ethylene glycol solution. The maximum lengthsof nanotubes were 3.0 μm, 14 μm, and 164 μm, respectively. The diameter and length of the titanium oxide nanotubes werecompared. The diameters of nanotubes were from 100 nm to 150 nm in the aqueous and ethylene glycol solutions but on the otherhand the diameter was 60 nm in glycerine. These differences come from the properties of the anodization solution such as the viscosityand ionic strength of the solutions (electric conductance) and these are key factors for titanium anodization. After anodization,annealing at 500 oC for 30 minutes was followed and the anatase phase appeared on the surface of the titanium nanotube. Fromelectron-diffraction patterns obtained by the fast Fourier transform (FFT) of HRTEM images, the measured angle betweenthe (011) and (101) planes was 82.2o, which was consistent with the theoretical value of the anatase structure. From results of thisstudy, we could control the morphology of titanium oxide nanotube arrays by anodization.
Key words: TiO2 nanotubes, Morphology, Aqueous, Glycerine, Ethylene glycol.
Introduction
The surface of “valve metals” (Al, Ti, Ta, Nb, V, etc.) areinstantaneously covered with a native passivation oxidelayer when these metals are exposed to an oxygen-containing environment [1, 2]. The passivation oxide layergives excellent resistance even to various acid solutions.Creating a passivation oxide layer is good property fornanotube arrays so we dissolved the oxide layer of valvemetals with fluoride ions in some solutions by ananodization method. Titanium oxide is a promising materialbecause of its biocompatibility, self-cleaning ability,gas-sensing capability, photo-electrochemical conversioncapacity, and photo-catalytic ability.
Over decades many porous materials made by anodizinghave been reported in particular anodic aluminum oxide(AAO) [3-8]. Recently, we have reported the mechanismand parameters controlling the formation in fluoride-containing electrolytes [9]. From these results, the appliedvoltage is the driving force for anodization but a high voltageleads to micro discharges and a sponge form oxide layerin an aqueous electrolyte. The fabrication of self-alignedvalve metal oxide nanotubes have been attracting considerablefundamental and technological interest because of the
important applications in sensing, separation, electronics,optoelectronics, and as biomaterials [10-12]. In this study,we report the forming method of TiO2 nanotubes indifferent solutions such as an aqueous solution, glycerine,and ethylene glycol. The morphologies of TiO2 nanotubesmade with different solutions were compared and thecrystal structure was analyzed. We suggest it is possibleto control the morphology of TiO2 nanotubes.
Experimental
Titanium foil of 2 mm thickness with a large surfacearea 20 × 20 mm (99.7% purity, Aldrich Chemical CompanyInc., Milwaukee, U.S.A.) was used as the anodes. Wepolished the titanium electrode with SiC 4-6 μm grit(#2000) and cleaned with acetone, isopropanol (2-Propanol),methanol and de-ionized water with ultra sonication todegrease the surfaces prior to the experiments. The counterelectrode was tantalum foil 0.25 mm thick and 50 × 50 mm(99.9% purity, Aldrich Chemical Company Inc., Milwaukee,U.S.A.). Metal electric wires were attached to the twoelectrodes and sealed by polyester to separate them fromthe acid electrolyte. The anodization experiments wereconducted at a constant potential with a DC power supply(E3643A, Agilent Technologies, Inc.). The time variablecurrent was monitored using a digital multimeter (Model34401A, Agilent Technologies, Inc.) interfaced with acomputer. The temperature of the electrolyte was controlled
*Corresponding author: Tel : +82-33-640-2483Fax: +82-33-642-2245E-mail: [email protected]

450 Seong-Je Cho, Kyu-Shik Mun, Dae-Jin Yang, Hun-Park, Yong-Joon Park, Jong-Oh Kim and Won-Youl Choi
in a water bath and the pH was measured with a pH meter(Model PH211, Hanna Instruments, U.S.A.). For the surfacemorphological assessment and the length analysis oftitanium oxide nanotubes, top view, profile, and bottom viewscanning electron microscope (SEM; Model FE-SEM S-4700, Hitachi) observations were carried out.Characterization of the materials produced was made byX-ray diffractometry (XRD, Rigaku D/MAX-RC) usingCu Kα radiation. Characterization of the anodic growthtitania nanotubes was made by transmission electronmicroscopy (TEM) (Philips CM 200), fast Fourier transform(FFT) and selected-area electron diffraction (SAED).
Results and Discussion
To control the morphologies of the titanium oxidenanotubes array, we have studied the mechanism of TiO2
anodization by changing the solution. Fig. 1 shows top-viewSEM images of the titanium oxide nanotube arrays; (a) inaqueous solution, (b) in glycerine, and (c) in ethylene glycol,respectively. There were some differences among themorphologies of the nanotube arrays. In the aqueous solutionand ethylene glycol, the outer diameter of the nanotubeswas about 110-130 nm but in glycerine it was 60 nm. Thesedifferences arise from the conductivity and viscosity ofthe anodization solutions. The diameter of the nanotubeanodized in glycerine was narrow. This was due to the highviscosity of glycerine and low mobility of the fluoride ions.
Figure 2 shows profile SEM images of the titanium oxidenanotube arrays; (a) in aqueous solution, (b) in glycerine,and (c) in ethylene glycol, respectively. In these aqueoussolutions, the lengths of nanotubes are 3 μm, 14 μm, and164 μm, respectively. A high conductivity or ionic strengthof the anodizing solution is needed to make TiO2 nanotubeslong, but too high a conductivity causes micro-arcs, and
namely, electrical breakdown. A high electrical conductivityof the solution makes the nanotube short by a micro-arc.In aqueous solutions, their high electrical conductivitiesgive a limit in length. In the case of glycerine, having alow electrical conductivity make it a good candidateelectrolyte, but its high viscosity cannot make longTiO2 nanotubes. The fluoride ions could not be attractedto the anode after the nanotube length grows above a limit.This is the reason that glycerine is not a good electrolytefor growing long TiO2 nanotubes. The longest TiO2
nanotubes were obtained in ethylene glycol because it hada lower viscosity than glycerine.
Figure 3 shows X-ray diffraction patterns excited withCu Kα radiation. TiO2 nanotubes from all of the electrolyteswere changed to the anatase structure after annealing at
Fig. 1. Top-view SEM images of the titanium oxide nanotube arrays; (a) in aqueous solution, (b) in glycerine, and (c) in ethylene glycol.
Fig. 2. Profile SEM image of the titanium oxide nanotube arrays; (a) in aqueous solution, (b) in glycerine, and (c) in ethylene glycol.
Fig. 3. X-ray diffraction patterns using Cu Kα radiation showing theanatase structure after annealing at 500 oC for 30 minutes; (a) annealedat 500 oC for 30 minutes, (b) as-anodized, (c) Ti plate.
Titanium oxide nanotubes anodized in aqueous and non-aqueous electrolytes 451
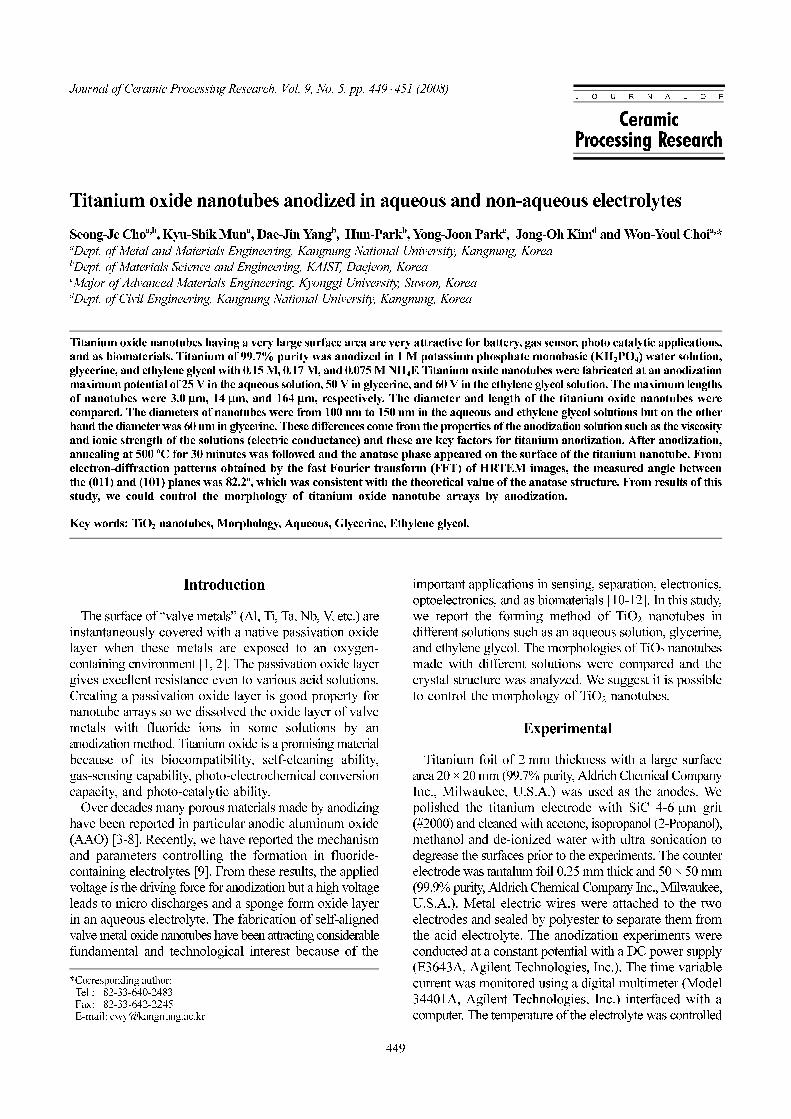
500 oC for 30 minutes. The microstructure of the TiO2
nanotube was also investigated by high-resolutiontransmission electron microscopy (HRTEM). Figure 4shows micrographs of individual titania nanotube. A bright-field TEM image showed that the outer diameter of thenanotube and tube wall thickness, as shown in Fig. 4(a),were 100 nm and approximately 20 nm, respectively. Theelectron diffraction pattern inset in Fig. 4(a) has severalcontinuous rings which indicates that the nanotube wascomposed of randomly oriented TiO2 crystallites. A fewlarge crystallites diffracted more strongly and make thering pattern “spotty”. In some cases, a tube consisted of verylarge crystallites. Figure 4(b) shows a HRTEM image ofsuch a can. The lattice image was clearly observed,indicating a high crystallinity. Crystal fringes can be seenthat have a separation of 3.51 Å corresponding to thespacing of the (101) lattice planes of the anatase TiO2
structure. Inset in Fig. 4(b) shows the electron-diffractionpattern obtained by the fast Fourier transform (FFT) ofthis region. The electron diffraction spots were indexedbased on the anatase structure. The angle measured betweenthe (011) and (101) planes of 82.2o, as compared to thetheoretical value of 82.15o, was consistent with the anatasestructure.
Conclusions
We suggest that it is possible to control the morphologyof TiO2 nanotubes by suitable choice of an electrolyte.The key factors are the viscosity of the electrolyte and
electrical conductivity of the electrolyte. To obtain the longTiO2 nanotubes, an electrolyte with low viscosity and a lowelectrical conductivity should be chosen. TiO2 nanotubesfrom all of the electrolytes changed to the anatase structureafter annealing at 500 oC for 30 minutes. From an electron-diffraction pattern obtained by the fast Fourier transform(FFT) of HRTEM, the angle measured between the (011)and (101) planes was 82.2o, which was consistent with thetheoretical value for the anatase structure.
Acknowledgements
This work was supported by the Korea ResearchFoundation Grant funded by the Korean Government(MOEHRD) (KRF-2007-314-D00108), grant No. RTI05-01-02 from the Regional Technology Innovation Programof the Ministry of Knowledge Economy (MKE), and “New.Renewable Energy Technology Development Program(2007-N-PV08-P-01)” of Korea Energy ManagementCorporation.
References
1. H. Masuda and K. Fukuda, Science, 268, (1995) 1466.2. H. Masuda, H. Yamada, M. Satoh, H. Asoh, N. Masashi
and T. Tamura, Appl. Phys. Lett., 71 (1997).3. D. Crouse, Y. Lo, A.E. Miller and M. Crouse, Appl. Phys.
Lett., 71 (2000) 49.4. A. Johansson, E. Widenkvist, J. Lu, M. Boman and U.
Jansson, Nano Lett., 5 (2005) 1603.5. S.Z. Chu, K. Wada, S. Inoue, M. Isogai and A. Yasumori,
Adv. Mater., 17 (2005) 2115.6. N. Myung, J. Lim, J. Fleurial, M. Yun, W. West and D.
Choi, Nanotechnology, 15 (2004) 833.7. S.Z. Chu, K. Wada, S. Inoue and S.J. Todoroki, Electrochem.
Soc., 149 (2002) B321.8. B.J. Das, Electrochem. Soc., 151 (2004) D46.9. S.J. Cho, J.O. Kim, D.J. Yang and W.Y. Choi, Materials
Science Forum, 544-545 (2007) 67.10. S.B. Lee, D.T. Mitchell, L. Trofin, T.K. Nevanen, H.
Soderlund and C.R. Martin, Science, 296 (2000) 2198.11. S.H. Oh, R.R. Finones, C. Daraio, L.H. Chen and S. Jin,
Biomat., 26 (2005) 4938.12. G. Mor, O. Varghese, M. Paulose, K. Ong and C.A. Grimes,
Thin solid Film, 496 (2006) 42.13. H. Tsuchiya, J.M. Macak, A. Ghicov, L. Taveira and P.
Schmuki, Corrosion Science, 47 (2005) 3324.
Fig. 4. Microstucture of annealed titanium oxide nanotube; (a)bright-field TEM image, corresponding SAED pattern in inset,(b) HRTEM image of a fractured part, FFT electron-diffractionpattern of the region A in inset.