tanford energy system innovations steam to hot water …
TRANSCRIPT

STANFORD ENERGY SYSTEM INNOVATIONS
Steam to Hot Water in 33 Months
Joseph Kearney: Stanford University
Adam Dell: Stanford University
Damon Ellis: Whiting-Turner Contracting
Patrick Kantor: Whiting-Turner Contracting

Meeting Agenda
o Introduction / Project Overview
o Underground Construction
Design / Installation
Leak Detection
Water Treatment
Schedule Flexibility
o Building Conversions
Design
Installation
Improve Summer Delta T
Improve Winter Delta T
o Questions?

Project Overview
Stanford Energy System Innovations (SESI) is the sustainable energy program
designed to meet the energy needs of Stanford campus through at least 2050.
After four years of planning and three years of construction and implementation,
SESI came online in late March 2015 via a new Central Energy Facility.
The Stanford Campus transitioned from a
natural-gas cogeneration plant to a heat
recovery system, including replacing 22
miles of underground piping and
retrofitting 155 buildings – all while the
campus remained operational.

Project Overview: Conversion from Cogeneration to Heat Recovery
Electricity
Reduce campus greenhouse gas emissions by 68% (and growing)
Reduce potable water use 15%
Will save $459 million compared to cogeneration over next 35 years
Allows for expansion of campus
Creates foundation for green energy portfolio
System at end of useful life when contract expired in 2015
1980’s technology, was at 50% overall efficiency
Used 100% natural gas - produced 90% of campus carbon emissions
Used 25% of campus potable water

Project Overview: Cost & Schedule Overview
Central Energy Facility
$260M construction cost*
3 year construction duration
Five transformers provide 20mva; total electrical capacity of 100mva
Two 5M gallon cold water tanks; 90k ton-hour capacity
One 2M gallon hot water tank; 600mmbtu capacity
Three heat recovery chillers with 2,500 ton capacity
Three backup chillers with 3,000 ton capacity, and nine cooling towers with 9,000 GPM capacity
Three gas powered hot water generators with 1,800 HP
Piping and Building Conversions
$210M construction cost*
3 year construction duration
22 miles of Low Temperature Hot Water Piping
5 miles of electrical duct bank
154 buildings converted from steam to LTHW
Steam plant constructed for process steam needs; 24,000 lb/hr
*funded via cash and debt (open market – bonds
and commercial paper). Cost recovery via utility
rates per federal OMB guidelines

LTHW Piping – Design / Installation
Proven System Established design specifications
Obtained OSHPD alternate material approval
Based on heat recovery chiller specification (170° supply, 130° return)
Minimum 12psi dp at furthest lines
Sized based on campus and hospital capital plans for year 2050
Based on above, pipe size ranged from 24” to 4”. Most laterals were 4”-6”, most mains were 8”-12”
Easier Installation
Shallow Bury: eliminated vaults, anchors & expansion joints. Decreased cost and schedule.
Self-Restrained
Direct Bury Valves

LTHW Piping – Design / Installation
Inspections Stanford had full time inspector
Third Party inspector used for all welds, leak detection wiring, and joint kit installation.
100% visual and 100% Ultrasonic inspections.
6 leaks occurred in 4,400 welds
Scheduling/Phasing Schedule driven by Building Conversions
Work area was approx. 300-500 LF per crew. This will give a large enough work site to be efficient, while at the same time not impacting campus traffic.
June 2012 – August 2014
22 miles of LTHW piping

LTHW Piping – Design / Installation
Material Availability Plan for long lead times
Stanford bulk ordered with 25% drawings (not recommended).
Plan for 16-20 week lead time for pipe and valves.
Need location for inventory
Performing work on new LTHW system
Inspections insured that installed pipe was kept clean. However strainers needed to be cleaned out after connection to new plant.
Stanford crews need to be trained on how to install/modify LTHW pipe system

LTHW Piping – Leak Detection
Leak Detection System System was used to find leaks during startup.
Bad wiring connections were found using system, and repairs made.
System is now complete and operational.
We have a few sections on campus that are not tied into leak detection system – these will require manual testing.
Vendor requires training and certification for installers.
Hold detailed installation meeting with leak detection vendor prior to installation of pipe. Proper installation of leak detection wiring from the beginning will help throughout construction (for identifying leaks) and make for a more efficient commissioning process.

LTHW Piping - Flushing & Water Treatment
European Water Treatment Pipe requires “European treated water”. A fill skid was used to remove
oxygen and adjust pH. Additionally side steam water treatment was installed at one of the regional heat exchangers.
Oxygen was not fully removed until the water was heated.

LTHW Piping - Schedule Flexibility
Implement regional heat exchangers to allow for phased conversions. SESI built 4 temporary regional heat exchange substations to convert steam to LTHW

LTHW Piping - Schedule Flexibility
12

LTHW Piping - Schedule Flexibility
13

Building Conversions - Design
Skid Design Dimensions of skids important to allow:
Standardization more efficient fabrication
easier integration into campus controls
easier fit into existing mechanical rooms
faster install, with reduced shutdown duration
Installation in existing and active buildings
Heat Exchanger Capacity Based on review of as-built documentation as well
as building trend data. Important data for design: HHW flow, HHWS/R temps, HHWS/R pressure, HHW kBTU/hr, DHW demand
Redundancy We included redundant HHW pumps
For a few critical buildings we included redundant HX skids
Controls Need to review overall campus controls integration
and needs.
Our solution included a meter/controller that communicates via both Modbus and BacNet

Building Conversion - Installation
Can we shut down the building?
Complete Shutdown
Phased Installation
Parallel Installation
Install T’s & Valves
Is there room within the building?
YES – 25%
YES – 40% NO – 75%
NO – 35%
Is there room for a partial installation?
NO – 5%
Temporary Skid
YES – 30%
Install tees and valves into mechanical rooms (during normal building shutdown/closure) to allow for minimal building shutdown duration.

Building Conversion - Installation
Jordan Hall – Academic Building Complete Shutdown

Building Conversion - Installation
Florence Moore Student Resident Hall
Parallel Installation

Building Conversion - Installation
18
Lane School of Medicine
Lab/Research Building Phased Installation

Building Conversion - Installation
Cantor Arts Temporary Skid

Building Conversions – Summer Delta T
Run building side HHW with lowest setpoints possible. Base these setpoints on either building demand or outside air temperature.
Aggressively reset HHW setpoints. This may show rooms or zones that run cold. These areas can be improved to allow entire building to operate more efficiently.
Eliminate/Reduce HHW bypass. This will improve LTHWR temperature.
Review/Understand which campus buildings require the highest HHWS. These buildings will limit the LTHWS production.

Building Conversions – Winter Delta T
Locate all buildings with Preheat and Reheat Coils
Re-pipe, Add Valves, Change Coils

Question?
Design Installation
Leak Detection
Water Treatment Schedule Flexibility
Design Installation
Improve Winter Delta T
Improve Summer Delta T
Underground Piping Building Conversions
Overall System Performance
System Performance
Life Cycle Cost Analysis
Heat Recovery in US Regions
Reduced Power Consumption

68% Greenhouse Gas Emissions Reduction (and Growing)

15% Potable Water Savings
1.00
1.50
2.00
2.50
3.00
3.50
4.00
Do
mes
tic
Wat
er u
se (m
gd)
Stanford UniversityDomestic Water Demand Projections
Current water supply limit

Current Plan Results – Year 1
Plant efficiency is on track to meet estimated green house gas (68%) and water (15%) reductions.
No gas was burned at the plant from June through mid November 2015 as planned. All campus heat came from heat recovery.
Plant performance will be audited after a full annual cycle is complete on June 30, 2016. Estimates to date show that design assumptions are being met.

Energy Options Considered in 2011 (Present Value Cost)
Life Cycle Cost Analysis • Stanford had to select a new energy plant because the cogen contract was expiring and
the plant was at the end of its useful life
• For major capital projects Stanford uses Life Cycle Cost Analysis comparing the Present Value Cost (PVC) of available options to inform the economic part of the decision making process
• In 2011 SESI provided the lowest PVC of any option and was $303 million less than continuing on with third party cogeneration. As a result of better than expected long term 25 year solar PV electricity generation contracts that PVC has been reduced by another $156M which increase the estimated life cycle savings over third party cogeneration to $459 million. See previous slide.

Project Overview: Cost Overview
$153
$435
$549 $579
$547
$449 $474 $546
$593
$477
$145
$312
$286 $284
$289
$214 $198
$220
$234
$188
$648
$570
$549 $491
$483
$242
$54
$54
$54
$58
$647
$39
$8 $45
$14 $466
$564 $456 $387
$411
$1,593
$1,356 $1,392 $1,399
$1,333 $1,371
$1,290 $1,276 $1,267
$1,134
-0.2
0.4
1.0
1.6
2.2
2.8
3.4
4.0
4.6
5.2
5.8
6.4
7.0
7.6
8.2
8.8
9.4
10.0
-$100
$200
$500
$800
$1,100
$1,400
$1,700
$2,000
1. Business As Usual 2. New Cogen(Steam)
3. New Cogen (HW) 4. Gas Power(Turbine) + Heat
Recovery
5. Gas Power (ICEngines) + Heat
Recovery
6. PG&E, No HeatRecovery
7. PG&E + HeatRecovery
8. PG&E + 20%Photovoltaic Power
+ Heat Recovery
9. PG&E + 33%Photovoltaic Power
+ Heat Recovery
DA + 53%Photovoltaic Power
+ Heat Recovery
GH
G (
mill
ion
to
ns)
; Wat
er (
mill
ion
ccf
)
PV
C 2
01
5-2
05
0 (
Mill
ion
s)
Stanford UniversityCentral Energy Facility Replacement Options (August 2015 update)
Electricity
Natural Gas
O&M
Capital
Water
GHG
Steam Options Hot Water Options
Major Heat Recovery
On-site Gas Cogeneration Options Grid Power Options Grid + PV
Modest Heat Recovery
Actual
PG&E = Electricity from Pacific Gas & Electric Company
DA = Electricity from an Energy Service Provider under the California Direct Access program

Why Heat Recovery is Possible
88%
53%
Large scale deployment of heat recovery
Combining best heating and cooling technologies in Europe and North America

Heat Recovery in Other US Regions
(6,000)
(4,000)
(2,000)
-
2,000
4,000
6,000
1-J
an
8-J
an
15
-Jan
22
-Jan
29
-Jan
5-F
eb
12
-Fe
b
19
-Fe
b
26
-Fe
b
4-M
ar
11
-Mar
18
-Mar
25
-Mar
1-A
pr
8-A
pr
15
-Ap
r
22
-Ap
r
29
-Ap
r
6-M
ay
13
-May
20
-May
27
-May
3-J
un
10
-Ju
n
17
-Ju
n
24
-Ju
n
1-J
ul
8-J
ul
15
-Ju
l
22
-Ju
l
29
-Ju
l
5-A
ug
12
-Au
g
19
-Au
g
26
-Au
g
2-S
ep
9-S
ep
16
-Se
p
23
-Se
p
30
-Se
p
7-O
ct
14
-Oct
21
-Oct
28
-Oct
4-N
ov
11
-No
v
18
-No
v
25
-No
v
2-D
ec
9-D
ec
16
-Dec
23
-Dec
30
-Dec
mm
btu
Stanford University Heat Recovery Potential
Heat Recovery Potential
CoolingHeating
53%88%
Cooling Load = 60,265,616 Ton-Hr/723,187 MMbtu
Heating Load = 610,205 MMbtu
(10,000)
(8,000)
(6,000)
(4,000)
(2,000)
-
2,000
4,000
6,000
8,000
10,000
1-J
an
8-J
an
15
-Jan
22
-Jan
29
-Jan
5-F
eb
12
-Fe
b
19
-Fe
b
26
-Fe
b
4-M
ar
11
-Mar
18
-Mar
25
-Mar
1-A
pr
8-A
pr
15
-Ap
r
22
-Ap
r
29
-Ap
r
6-M
ay
13
-May
20
-May
27
-May
3-J
un
10
-Ju
n
17
-Ju
n
24
-Ju
n
1-J
ul
8-J
ul
15
-Ju
l
22
-Ju
l
29
-Ju
l
5-A
ug
12
-Au
g
19
-Au
g
26
-Au
g
2-S
ep
9-S
ep
16
-Se
p
23
-Se
p
30
-Se
p
7-O
ct
14
-Oct
21
-Oct
28
-Oct
4-N
ov
11
-No
v
18
-No
v
25
-No
v
2-D
ec
9-D
ec
16
-Dec
23
-Dec
30
-Dec
mm
btu
University of Illinois (Urbana-Champaign) Heat Recovery Potential
Heat Recovery Potential
CoolingHeating
65%55%
Cooling Load = 83,019,213 Ton-Hr/996,231 MMbtu
Heating Load = 1,657,534 MMbtu
(4,000)
(3,000)
(2,000)
(1,000)
-
1,000
2,000
3,000
4,000
1-J
an
8-J
an
15
-Jan
22
-Jan
29
-Jan
5-F
eb
12
-Fe
b
19
-Fe
b
26
-Fe
b
4-M
ar
11
-Mar
18
-Mar
25
-Mar
1-A
pr
8-A
pr
15
-Ap
r
22
-Ap
r
29
-Ap
r
6-M
ay
13
-May
20
-May
27
-May
3-J
un
10
-Ju
n
17
-Ju
n
24
-Ju
n
1-J
ul
8-J
ul
15
-Ju
l
22
-Ju
l
29
-Ju
l
5-A
ug
12
-Au
g
19
-Au
g
26
-Au
g
2-S
ep
9-S
ep
16
-Se
p
23
-Se
p
30
-Se
p
7-O
ct
14
-Oct
21
-Oct
28
-Oct
4-N
ov
11
-No
v
18
-No
v
25
-No
v
2-D
ec
9-D
ec
16
-Dec
23
-Dec
30
-Dec
mm
btu
University of California (Davis) Heat Recovery Potential
Heat Recovery Potential
CoolingHeating
63%49%
Cooling Load = 30,058,818 Ton-Hr/360,706 MMbtu
Heating Load = 642,480 MMbtu
1 3 2
4
1 - Stanford
2 – U of Illinois 3 – UC Davis 4 – Similar at university in New England
(62% Cooling, 43% Heating)
Reduced Power Consumption on Campus
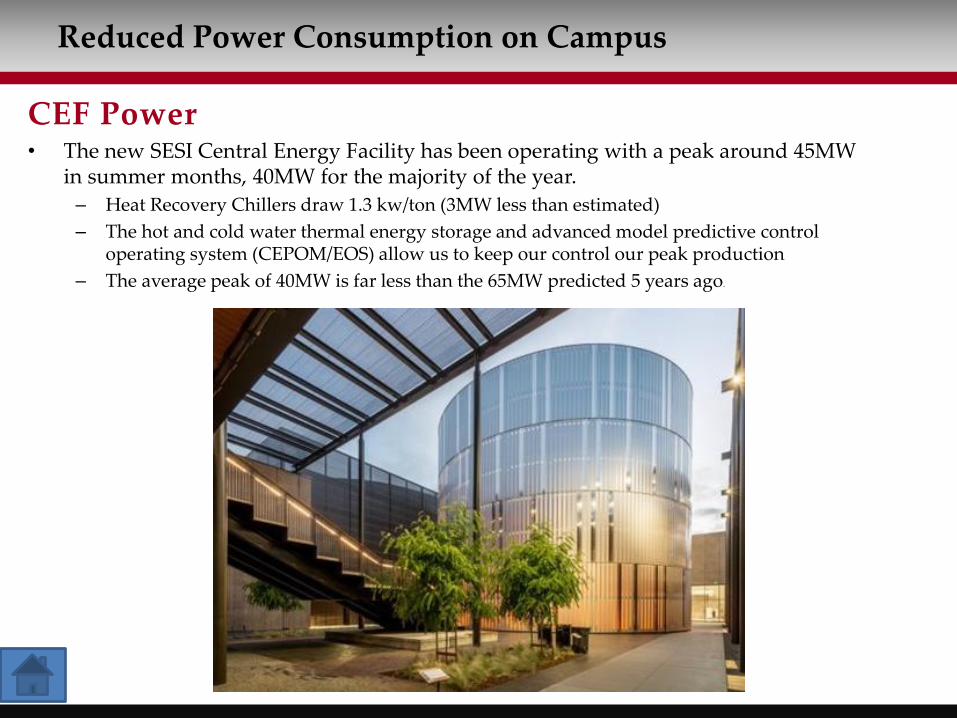
CEF Power • The new SESI Central Energy Facility has been operating with a peak around 45MW
in summer months, 40MW for the majority of the year.
– Heat Recovery Chillers draw 1.3 kw/ton (3MW less than estimated)
– The hot and cold water thermal energy storage and advanced model predictive control operating system (CEPOM/EOS) allow us to keep our control our peak production
– The average peak of 40MW is far less than the 65MW predicted 5 years ago.