tampa electric company big bend unit #2 neural … library/research/coal/major...neural network...
TRANSCRIPT

Tampa Electric Company
Big Bend Unit #2
Neural Network Based Intelligent Sootblowing System
Project Performance and Review
DOE Award number DE-FC26-02NT41425
Reporting Period Jul 2002 to December 2004 Issued April, 2005
Prepared For
Mr. John Rockey,Project Manager Advanced Energy Systems
U.S. Department of Energy, NETL
Prepared By
Tampa Electric Company 702 North Franklin Street
Tampa, Florida 33602
And
Pegasus Technologies, Inc. Mentor, Ohio 44060
i

ii

DISCLAIMER
This report was prepared as an account of work sponsored by an agency of the United States Government. Neither the United States Government nor any agency thereof, nor any of their employees, makes warranty, express, or implied, or assumes any legal liability or responsibility for the accuracy, completeness, or usefulness of any information, apparatus, product, or process disclosed, or represents that its use would not infringe privately owned rights. Reference herein to any specific commercial product, process, or service by trade name, trademark, manufacturer, or otherwise does not necessarily constitute or imply its endorsement, recommendation, or favoring by the United States Government or any agency thereof. The views and opinions of authors expressed herein do not necessarily state or reflect those of the United States Government or any agency thereof.
iii

ABSTRACT Cost effective generation of electricity is vital to the economic growth and stability of this nation. To accomplish this goal a balanced portfolio of fuel sources must be maintained and established which not only addresses the cost of conversion of these energy sources to electricity, but also does so in an efficient and environmentally sound manner. Conversion of coal as an energy source to produce steam for a variety of systems has been a cornerstone of modern industry. However, the use of coal in combustion systems has traditionally produced unacceptable levels of gaseous and particulate emissions, albeit that recent combustion, removal and mitigation techniques have drastically reduced these levels.
With the combustion of coal there is always the formation and deposition of ash and slag within the boilers. This adversely affects the rate at which heat is transferred to the working fluid, which in the case of electric generators is water/steam. The fouling of the boiler leads to poor efficiencies due to the fact that heat which could normally be transferred to the working fluid remains in the flue gas stream and exits to the environment without beneficial use. This loss in efficiency translates to higher consumption of fuel for equivalent levels of electric generation; hence more gaseous emissions are also produced. Another less obvious problem exists with fouling of various sections of the boiler creating intense peak temperatures within and around the combustion zone. Total nitrogen oxides (NOx) generation is primarily a function of both “fuel” and “thermal” NOx production. Fuel NOx which generally comprises 20%-40% of the total NOx generated is predominately influenced by the levels of oxygen present, while thermal NOx which comprises the balance is a function of temperature. As the fouling of the boiler increases and the rate of heat transfer decreases, peak temperatures increase as does the thermal NOx production.
Due to the composition of coal, particulate matter is also a by-product of coal combustion. Modern day utility boilers are usually fitted with electrostatic precipitators to aid in the collection of particulate matter. Although extremely efficient, these devices are sensitive to rapid changes in inlet mass concentration as well as total mass loading. Traditionally, utility boilers are equipped with devices known as sootblowers, which use, steam, water or air to dislodge and clean the surfaces within the boiler and are operated based upon established rule or operator’s judgment. Poor sootblowing regimes can influence particulate mass loading to the electrostatic precipitators.
The project applied a neural network intelligent sootblowing system in conjunction with state-of-the-art controls and instruments to optimize the operation of a utility boiler and systematically control boiler slagging/fouling. This optimization process targeted reduction of NOx of 30%, improved efficiency of 2% and a reduction in opacity of 5%. The neural network system proved to be a non-invasive system which can readily be adapted to virtually any utility boiler.
Specific conclusions from this neural network application are listed below. These conclusions should be used in conjunction with the specific details provided in the
iv

technical discussions of this report to develop a thorough understanding of the process.
1) A fully functional neural network intelligent sootblowing system was implemented on the boiler which included modeling, identification of key parameters, quantification, and optimization of the sootblowing systems in a manner to target NOx and opacity reductions while improving efficiency.
2) Neural network intelligent sootblowing systems (NN-ISB) can easily be
incorporated into an operators standard routines, which may allow more time to perform other functions. An automated advancement in sootblowing testing was conceived, programmed and tested during this project. The tests were programmed to be performed by the pre-installed links of the NN-ISB. This ensured correct DCS and PLC interfaces had been achieved; more closely simulated the final interfaces, and gave more precision to the time stamping of the testing.
3) Unit efficiency contribution was calculated by using the total Performance
Efficiency Index. Measurements ranged from an improvement of 10 BTU/kWhr at high load to 50 BTU/kWhr at low load when comparing the open-loop to closed-loop NN-ISB tests. When the closed-loop NN-ISB was compared against the 2002 baseline year, improvements of 20 BTU/kWhr at high load points to 420 BTU/kWhr at low load were observed. However, several other operational conditions may have contributed to these values such as reduced header pressure, fuels, excess O2 levels, etc.
4) NOx reductions recorded by the NN-ISB ranged from no measurable
difference to 8.5% NOx reduction as compared to baseline conditions using a variety of coal and unit operating conditions.
5) Opacity measurements during the same period of NOx data acquisition
indicated no measurable difference, while examination of the opacity trends during open-loop and closed-loop, showed an improvement ranging from 1% to 1.5% over the range during sootblowing activities.
6) Improvements to the Human Machine Interface (HMI) portion of the project
were enhanced which may help lead to acceptance of future operators and thus provide addition benefits into daily operation.
v

TABLE OF CONTENTS Page TITLE i DISCLAIMER iii
ABSTRACT iv
TABLE OF CONTENTS vi LIST OF GRAPHICAL MATERIAL viii TABLE OF ABBREVIATIONS ix
1.0 INTRODUCTION 1
1.1 Schedule Overview 1
2.0 BACKGROUND AND HISTORY 2 2.1 Industry Need and Background 2 2.2 Project Technology Background 5
2.2.1 Heat Flux Sensors 5 2.2.2 Slag Sensors 5 2.2.3 Heat Transfer Advisor 6 2.2.4 Acoustic Pyrometer Plane Temperature 6 2.2.5 Sootblower Control System 6 2.2.6 On-Line Efficiency Performance Monitor 7 2.2.7 Data Validation 7 2.2.8 SUN Workstation 8 2.2.9 Neural Network Process Description 8 2.2.10 Water Cannons 9
2.3 Big Bend 2 COS/NN-ISB Communications & Architecture 10
3.0 PROJECT DESCRIPTION REVIEW 12 3.1 Introduction to Review 12 3.2 Demonstration Phases 12
3.2.1 Phase I Review 12 3.2.2 Phase II Review 14 3.2.3 Phase III Review 15
4.0 DISCUSSION OF OTHER TECHNOLOGY RESULTS 17
4.1 Project Technology Results 17 4.1.1 Heat Flux Sensors 17 4.1.2 Slag Sensors 18 4.1.3 Heat Transfer Advisor 18 4.1.4 Acoustic Pyrometer Plane Temperature 19
vi

4.1.5 Sootblower Control System 19 4.1.6 Heat Transfer Advisor and Performance Monitor 19 4.1.7 Data Validation 20 4.1.8 SUN Workstation 20 4.1.9 Water Cannons 20
5.0 TECHNICAL PERFORMANCE AND RESULTS 22
5.1 Introduction to Results 22 5.2 Data Selection 22 5.3 Benefits for Efficiency 25
5.3.1 Introduction on Efficiency 25 5.3.2 Notes on Efficiency Data 26 5.3.3 Observations on Efficiency 28
5.4 Benefits for NOx 31 5.4.1 Introduction on NOx 31 5.4.2 Observations on NOx 32
5.5 Benefits for Opacity 36 5.5.1 Introduction on Opacity 36 5.5.2 Observations on Opacity 37
5.6 Additional Benefits 43 5.6.1 Integration of Sensors and Optimization 43 5.6.2 Automated Testing and Human Factors 43 5.6.3 Boiler Drum Level and Pressure Discussion 44 5.6.4 Tube Temperatures 44
5.7 Novel Technology Development or Uses. 45 5.7.1 Patentable Material 45 5.7.2 Pegasus PERFIndex package 45
6.0 LESSONS LEARNED 47 6.1 Future NOx formation investigations 47 6.2 Sensor Integration 47 6.3 Sootblowing Maintenance 47
7.0 COMMERCIAL REVIEW 48 7.1 Demonstration Benefits 48 7.2 Application Economics 49 7.3 TECO Specific Benefits 49 7.4 Economic Benefits to the United States of America 50
8.0 CONCLUSION 51
8.1 Body of Conclusion 51 8.2 Unit Breadth of operation 52
APPENDIXES A1 HISTORICAL MONTHLY REPORTS A2 CLYDE BERGEMANN WATER CANNON TEST RESULTS
vii

A3 SOLVERA/STOCK REPORT FOR THE SLAG SENSORS
viii

LIST OF GRAPHICAL MATERIAL Number Title Page Figure 1 Demonstration System Configuration 4 Figure 2 Typical Water Cannon System 9 Figure 3 COS/NN-ISB Communications and Architecture 10 Figure 4 Unit-Load and O2 in open-loop mode 24 Figure 5 Unit-Load and O2 in closed-loop mode 25 Figure 6 Open loop Total Fuel Instrument Graph 27 Figure 7 Closed loop Total Fuel Instrument Graph 27 Figure 8 Open Loop Performance Efficiency Index 29 Figure 9 Closed Loop Performance Efficiency Index 29 Figure 10 Closed & Open Loop PERFIndex 30 Figure 11 Baseline, Open & Closed Loop Efficiency Benefits 31 Figure 12a Unit-Load vs. NOx Closed-loop mode for extended data set 33 Figure 12b Unit-Load vs. NOx in Closed Loop Mode 33 Figure 13a Unit-Load vs. NOx in Open Loop Mode 34 Figure 13b Unit-Load and NOx extended data 35 Figure 14 Comparison Load and Duct NOx, open and closed-loop 35 Figure 15 Unit-Load and Duct NOx in Baseline mode 36 Figure 16 Frequency distribution in open-loop mode for Opacity 38 Figure 17 Frequency distribution in closed-loop mode for Opacity 39 Figure 18 Trend plots for Unit-Load and Opacity in open-loop mode 40 Figure 19 Trend plots for Unit-Load and Opacity in closed-loop mode 40 Figure 20a Opacity Trends of Closed Loop vs. Extended Open Loop Data 41 Figure 20b Sootblower Steam Flow vs. Opacity during open and closed-loop 41 Figure 21 Unit-Load vs. Opacity under baseline conditions (year 2002 data) 42 Table 1 Table of Abbreviations & Units ix Table 2 Coal Analysis 23 Table 3 High Load Tube Temperature Effects 44
ix

TABLE OF ABBREVIATIONS Abbreviation Name Engineering
Unit # Pounds lbs. mmBTU Millions of British Thermal Units same NOx Nitrous Oxides inclusive of EPA recordable species #/mmBTU O or O2 Oxygen % ASME – PTC 4 American Society Mechanical Engineers Performance
Test Codes PTC 4-1988
CEMS Continuous Emissions Monitoring System Closed Loop, All equivalently refer to Pegasus systems providing a
bias to the control loop. The Pegasus system may be providing one all or some bias signals to a control loop in automatic mode.
CL, In Service
EPA Environmental Protection Agency ESP Electrostatic Precipitator DCS Distributed Control System(s) DOE U.S. Department of Energy NETL National Energy Technology Laboratory NN Neural Network NN-ISB Neural Network Based Intelligent Sootblowing COS or Neural Network Based Combustion Optimization
System
NN-COS OOS Out-Of-Service OPM On Line Performance Monitor Open Loop, All equivalently refer to Pegasus systems not
providing a bias to the control loop. The Pegasus system may be providing an advisory value to the DCS during such operation.
OL, Not in Service
PM Particulate Mater. Note within this report limited PM plant data will be supplanted by the use of opacity as a surrogate measurement which was available on a steady basis.
Table 1
x

1. INTRODUCTION This final report describes the Neural Network Intelligent Soot Blowing project that was implemented at Tampa Electric’s Co.’s (TECO) Big Bend Power Station. This demonstration project was granted to TECO under DOE award number DE-FC26-02NT41425 and received cost sharing from the U.S. Department of Energy and was administrated by the National Energy Technology Laboratory (NETL). At the time of award this installation was the first domestic project to use neural network technology to optimize the sootblowing actions of the boiler. The project demonstrated and assessed a range of technical and economic issues associated with the sensing, management, display and human interface of sootblowing goals as they relate to emissions and efficiency of coal fired utility boilers. To achieve the objectives the effort was divided into three phases; Preliminary Engineering, Installation and Model Building, Tuning and Benefits Demonstration.
1.1. Schedule Overview:
The project was awarded to TECO Q2 2002 Contract with Pegasus Technologies Q2 2002 Phase I Preliminary Engineering start Q1 2003 First Monthly Report of Status Q1 2003 NN-ISB Computer and Software installed at site Q1 2003 ACM Software initially installed at site Q2 2003 Parametric testing plans prepared and reviewed Q2 2003 Parametric testing start Q3 2003 Problems with EtaPRO BCCs observed and reported Q3 2003 Auto testing implemented Q4 2003 Pegasus/TECO plan bypass of BCCs Q4 2003 Parametric testing of regrouped sootblowers Q4 2003 Preliminary models implemented at site Q1 2004 Controlled testing to verify operation in advisor mode Q1 2004 Pre/Post/Bias processing implemented at site Q1 2004 Preliminary finding reported Q1 2004 Controlled closed-loop testing initiated Q2 2004 Model and logic refinements implemented at site Q3 2004 Path Forecasting added to logic refinements Q3 2004 Controlled Open-Loop and Closed-Loop test data acquired Q3 2004 Data review, analysis, and reporting Q4 2004
1

2. Background and History
2.1. Industry Need and Background
Tampa Electrics Big Bend Unit 2 is designed to serve a single turbine generator, and is a Riley Stoker Single drum radiant boiler having pressurized furnace operation. The boiler was designed for a safe drum operating pressure of 2,875 psig and will produce 2,868,000 lbs. steam/hr continuously at 2,600 psig and 1000°F at the superheater outlet when supplied with feedwater at 487°F at the economizer inlet. The steam outlet temperatures of the superheater and high temperature reheater are both 1000°F, and the pressures are 2,600 psig and 552 psig, respectively. The boiler is fired with bituminous coal.
One of the effects of burning coal in utility boilers such as Big Bend Unit 2, is the buildup of soot and slag on the heat transfer surfaces within the boiler. This buildup causes a redistribution/reduction of the heat transferred across the various sections of the unit, resulting in a redistribution/reduction of heat absorption, which often leads to an efficiency penalty and increased NOx emissions. Adverse efficiency impacts arise from numerous factors inclusive of, but not necessarily limited to; incomplete combustion, , unbalanced steam generation, excessive use of desuperheater sprays, and high exit gas temperatures. Thermal NOx generation has been well documented to be largely a function of temperatures within and around the combustion zone, but can extend into the upper pass of the boiler. As the boiling section of the furnace becomes excessively slagged, the heat transfer ability is impaired resulting in higher temperatures within that region and carrying back into later sections of the unit. Hence, higher levels or hot spots of NOx can be generated. Additionally, traditional and uncontrolled sootblowing can have negative impacts upon particulate matter, (PM) emissions, due to rapid and excessive expulsion of soot from the furnace to PM collection systems, which are usually electrostatic precipitators, (ESP). ESP’s emissions are sensitive to inlet mass loading. Accordingly rapid and excessive increases in inlet grain loading to an ESP can result in higher PM emission rates.
Routine based sequencing of sootblowers has traditionally been the method employed by power plants both domestically and abroad as the standard means to improve cleanliness within boilers. These systems are generally automated, and are initiated by a master control device; however some systems are operated manually via operators, whose operation is dictated by protocols or generic procedures. In any case, operators are challenged with a number of non-linear and conflicting objectives while ensuring that the boiler is stable and capable of meeting system dispatch requirements. These methods result in indiscriminate cleaning of the entire boiler or sections thereof regardless of whether portions may already be clean. Hence, traditional methods of sootblowing may be effective in assuring that a boiler is clean, but fail to optimize the heat transfer rates therein so as to maximize its operation relative to emissions and unique unit performance.
The industry has of recent been introduced to a number of “Intelligent” rule-based systems that derive their knowledge base from operator experiences, static plant design data, and general thermal principles. Whereas, these systems are better than the traditional methods,
2

they fail to fully respond to the dynamic operation and condition of boilers. Rule-based systems are not readily adaptable to transitional operation of present day boilers which as a result of deregulation are subject to volatile changes in operation and fuel types or blends. Additionally, rule-based systems are only as good as the rules that drive them and established rules cannot accommodate the diverse set of operating conditions that may be encountered on a daily basis.
For the most part, utility boilers are equipped with sootblowers, which are lances that use water, air, or steam to blow soot from the selected surface. The number of lances ranges from several to over a hundred. One of TECO’s project’s objectives had been to integrate directional water cannons to selectively remove slag. Traditional sootblowing schemes involve fixed schedules for activating the blowers or the experience of the operators who manually activate various fixed sequences. Independent manual sequencing of specific sootblowers has shown benefits in the area of efficiency improvement, NOx reduction, and other areas which improve efficiency and reliability. Additional, hard to quantify, gains that may have has been realized were:
• Tube erosion (minimized), • Auxiliary power consumption (minimized), • Levelized extraction steam flow • Opacity (non-captured particulate generation) managed to minimize impact on ESP. • Sootblowing steam consumption and the related efficiency benefit. • The number of activations and SB steam consumption (minimized) can affect the areas of
maintenance and other effects in the long run.
The goal of the project was to develop a NN-ISB system module that proactively modified the sequence of sootblowing in response to real-time events or conditions within the boiler, in lieu of general rule based protocols. Specifically, the TECO project attempted to reduce baseline NOx emissions by up to 30%, improve efficiency by 2% and reduce particulate matter, as measured by an opacity instrument by 5%. The NN-ISB attempted to accomplish much of these values while relying upon other project equipment such as slag sensors, water cannons and the acoustical pyrometers. The ability to intelligently blow soot to satisfy multiple and specific user identified objectives had not been integrated to an automatic and adaptable neural network driven sootblower sequencer prior to the execution of this project. The NN-ISB module provided an asynchronous, event-driven technology that is adaptable to changing boiler conditions. Some of the basic technology components for the project were commercially proven on other types of boilers, but were new to the Riley Turbo pressurized units. Additionally, the project also included the use and application of several novel components and/or systems. The goal of the project was to employ synergistic approaches, using all the equipment. The complexity of the individual components and the combination thereof, coupled with satisfying multiple objectives in a dynamic real-time environment was considered beyond the capability of typical plant operators, and time or rule based systems thus lending the process suitable for a neural network system.
3

The advantages of knowledge capture and adaptive counter-intuitive interactions with the NN-ISB provide the opportunity for a modular sootblowing optimization system. Furthermore, since all utility boilers that fire pulverized coal and start-up oils generate varying levels of soot and slag, the commercialization and benefits of this innovative technology have the potential to be readily and easily applied to a large population of power plants.
Additionally, technology advancements in the past few years have resulted in the introduction of several diverse systems that could further enhance the basic process of sootblowing. Specifically, robust temperature measurement products have emerged that allow localized measurement of fireside temperatures and heat transfer rates in both the furnace zone as well as the convection and backpass regions.
A block flow diagram of the configuration for demonstration at the Big Bend Station is shown in Figure 1. A discussion of this configuration and the rationale for its selection and scale is presented in the remainder of this section.
Pegasus Data Base
Executive Pegasus Innovative InfoProcess
Goals
OptionalDisplays
Specificationof Key Data
API
Neural Net Model
OptimizerPegasus GESA
CombustionOptimization
SB CalculationsSensors & DCS
Sootblow Controller
A P I
Constraints
Min. Requirements
Efficiency Info
EfficiencyNOx
Figure 1 Demonstration Systems Configuration
4

2.2. Project Technology Background The original project proposal envisioned that the various equipment and systems to support the overall objectives and targets to improve unit performance. It should also be noted that the proposal listing was preliminary and that the final supply as described herein is slightly different.
• Sixteen (16) heat flux sensors • Eight (8) slag sensors • Two (2) acoustic pyrometry temperature profiling grids • One (1) sootblower control system (interface) • One (1) Bi-directional communications link between the sootblower interface and the
Plant DCS • One (1) on-line efficiency performance monitor • One (1) data validation monitor • One (1) SUN workstation with communication link between the SUN and Plant DCS • Four (4) directional water cannons system complete with pumps
2.2.1. Heat Flux Sensors Sixteen heat flux sensors were provided during the project by the Hukseflux via Clyde Bergemann as part of the water cannon supply and mounted in appropriate locations. Because of the relatively low slagging conditions in the upper furnace of Big Bend, heat flux sensors were selected by Clyde Bergemann to provide indication of the level of ash buildup. The heat flux sensors were intended to provide indication of slag formation and had a redundant, dual thermocouple approach. The sensor body, weld metal, and lead wire sheath were constructed of a proprietary Haynes alloy and contained four (4) type-K thermocouples configured into two redundant pairs. The TC leads were housed in a standoff tube which terminated into a junction box.
The sensors were mounted within the walls of water wall tubes, each with four microscopic thermocouples embedded within a section of the wall. The lead-outs are also embedded within the tube and shielded from the furnace completely. The sensors are supplied completely prefabricated in an approximately 18” length of tube with all certificates of origin required for installation into the existing boiler walls which required scaffold and competent welders. A section of water wall was replaced. This new section contained the Heat Flux sensor assembly pre-mounted, and welded. The actual profile of the heat flux sensor is similar in shape to a typical tube but had ribbed internals. The surface thermocouples are located at a distance from the surface so as to correlate with the actual tube surface temperature. Likewise, the embedded thermocouples are located at a depth to correlate with the water/steam temperature. This positioning of the thermocouples, and the measurement of the temperature differential between the two through a known thermal conductivity provides a direct indication of the heat flux passing through the material.
5

2.2.2. Slag Sensors
Eight slag sensors were provided by Solvera/Stock Equipment to the project and were mounted in close proximity to the heat flux sensors for evaluation. The sensor body was comprised of a proprietary alloy capable of utilization in the lower furnace environment. The internals are a proprietary high temperature ceramic alloy with a stainless steel inner conductor. The sensor was intended to detect the presence of slag by measuring its electrical conductivity. Ash but no slag – one conductivity. Slag – a significantly different conductivity. The sensors were installed in the membrane portion of the waterwalls using a 1/8” NPT connection. This technology was new to the marketplace and was attempted because of its novel methods and low cost.
2.2.3. Heat Transfer Advisor
General Physics provided their EtaPro 8 software tool for determination of enthalpy changes within each boiler heat transfer section. This tool was developed over a period of time and attempted to take into account the DCS provided signals for steam side pressure/temperature on a zone by zone basis. The output of this system was intended to be a zone by zone determination of heat transferred from the flue gas into the steam system.
2.2.4. Acoustic Pyrometer Differential Plane Temperature Measurement
Solvera/Stock Equipment provided the temperature measurement system to provide continuous information regarding internal temperatures related to the combustion processes for furnace exist gas temperatures and economizer outlet temperatures. The systems utilized the fundamental principle that the velocity of sound through a medium is proportional to the temperature of the medium. Therefore, by accurately knowing when a sound is generated, when it is received and the distance between the source and the receiver, the average temperature between the two points can be determined. Two sound generators were provided at each plane along with several receivers. Due to the pressurized boiler application, all the equipment required purge air for cooling. Each path gave a unique temperature reading. Some higher order mathematics allows determination of the temperature at each point of intersection between one path and another.
2.2.5. Sootblower Control System
The sootblower control system was provided by Solvera/Stock Equipment which provided an integrated state-of-the-art sootblower interface control known as SBC 1000.
6

It is mounted in an internationally accepted card cage and was enclosed in the existing control cabinet. The main panel was pre-wired and tested. The operator interface panel has been mounted in the main control room and has been connected to the control logic cabinet via RS232. The SBC 1000 provided a bi-directional link between the actual sequencing panel and the plant DCS. This allowed information related to sootblower execution to be data logged, transmitted for neural network analysis, transmitted to other devices for interactive optimization and receive optimization sequencing from the NN-ISB.
2.2.6. On-Line Efficiency Performance Monitor
The General Physics EtaPro 8 software package included an on-line efficiency performance module designed to help provide information necessary to run a power plant more efficiently. Data (temperatures, pressures, flows, etc…) are collected approximately once per minute from the distributed control system (DCS), then checked for reasonableness and averaged or statistically smoothed. Data substitution is performed for data failing the reasonableness check. Validated values are sent to the performance calculations, where performance parameters are calculated. Those outputs are then displayed on graphical display screens, and also stored in a database.
2.2.7. Data Validation
The Advanced Calibration Monitor (ACM) supplied by PCS is a computerized calibration monitoring system with capabilities for automatically assessing the health and validity of instrumentation associated with this project. ACM was used in part to perform calibration monitoring and data validation functions including: • Providing early warning of problems with instrumentation, • Detecting specific plant instruments that have drifted or failed, • Quantifying precisely the amount of instrument drift, • Providing accurate replacement values for faulted instruments, • Identifying specific instruments requiring attention during an outage, • Assessing individual equipment health, and, • Assessing overall plant health and operating conditions
The pattern recognition methodology embedded in the ACM is a proprietary software algorithm used to model the behavior of any process or system characterized by numerical data. Conceptually, ACM monitors a system and then makes judgments based on past experience. It does this by creating a mathematical model of the system from data representing past system performance. The mathematical model created by ACM was used to generate estimates of values associated with the system under investigation. These modeled values act as predictions
7

of how the system should be behaving based on past experience. The modeled values computed by ACM are then compared with the actual measured values associated with the system to determine system abnormalities and to perform many other desirable data analyses.
2.2.8. SUN Workstation
The NN-ISB utilized the performance and computing environment of the SUN hardware platform which uses the Solaris operating system and development environment. The neural network software functions with up to six processes running in parallel. For experimentation reasons the combustion optimization system and Intelligent Sootblowing systems were originally going to be installed on separate machines. This was modified during the course of the project such that both NN systems were operating on a single workstation.
2.2.9. Neural Network Process Description
Major components include an Executive component for coordinating all tasks associated with the NN-ISB, and an Optimizer that determined the optimum heat distribution based on the target objectives. The innovative information process would normalize the different factors desired under the target objective list into a quantity that can be used by the Optimizer. A model was included for projecting the timing of soot buildup. The system included a process for generating and maintaining various constraints of the system. These could be either physical limitations of the sootblowing system (e.g., only 2 blowers in service at any one time), or operational constraints of the boiler (e.g., maintaining reheat temperature or minimizing thermal transients on pipes).
The system utilized an Application Programming Interface (API) for several key components and sensors mentioned earlier in this section. Units with pre-existing sootblowers would not have to change to accommodate this project.
The Human Machine Interface (HMI) for the operators were programmed into the existing DCS. A “standard” set of displays were coded for activating intelligent sootblowing, versus time sequence blowing. Additionally, system overview displays were created to track information and key parameters of interest.
A significant base of analytical (heuristic) knowledge existed when sootblowing normally was engaged. This knowledge resided with the operators and engineering personnel. This knowledge was codified through a combination of parametric tests with the resulting data captured and then embodied as part of the constraints of the NN-ISB. The installation and parametric testing process produced additional data that related a new set of factors.
A key component of this project was the use of neural networks, which provided the ability to build non-linear empirical models. This technology, through the use of Pegasus’s NeuSIGHT has the benefit of being able to self-retune the system while on-line. This is an important feature which takes into account changing fuel conditions,
8

equipment performance, and environmental conditions. This capability maximizes the benefit from the NeuSIGHT Optimization function.
Other technologies used for the NN-ISB included: Genetic Search Algorithms (GESA) which reduce the search time and increase the accuracy for finding global optimum values for optimizing values on-line efficiently. Data visualization techniques such as three dimensional graphs for model validation, plus X-Y plots and strips charts to facilitate data pruning, model validation and system acceptance by plant personnel. Additional screens and entry forms have been developed for operators and engineers to interact with the system. Off-line data analysis was also performed using the Pegasus Athena product. This graphical analysis tool can help analyze data in 1,2,3 and 4 dimensions with a special application developed with the National Science Foundation for reducing N-dimensional data to three dimensional graphical representation. Much of the data in this final report was compiled using these data visualization techniques.
2.2.10. Water Cannons Complete with Water Boosting Pumps
Due to the high heat release of the Riley wet bottom units which create high thermal NOx the project included water cannons to minimize slag in the furnace and optimize radiant heat absorption in the water walls. The water cannons used a carden joint to pivot the water lance to a specified angle which were adjusted via one horizontal and one vertical DC drive controlling both x,y positioning and the speed of the lance. The primary control of the cannons were through Allen Bradley SLC 5/04 series PLC’s connected to the data highway. The system also included an AnySpeed booster pump skid complete with pumps, valves, and associated controls to supply water to the cannons at pressures up to 450 psig.
Figure 2 Typical Water Cannon System
9

2.3. BIG BEND 2 COS/NN-ISB COMMUNICATIONS AND ARCHITECTURE The diagram below shows the communications layout at Big Bend 2 for the NN-ISB:
Shared Monitor, Keyboard and Mouse
Pegasus COS/ISB
Switch
TCP/IP Network
OPC, TCP/IP
Dual Speed 10/100 Mbps Switch
WesAPI, TCP/IP
PI-API, TCP/IP
TCP/IP
Solvera Sootblowing Control System
WestinghouseWesStation
PI Server, EtaPRO
TCP/IP
Network Printer Network Printer (Postcript)
TCP/IP
TCP/IP
OPC, TCP/IP
Clyde Bergemann Water Cannon Control System
Figure 3 Communications Architecture
The combustion optimization (COS) and sootblowing NN-ISB software were loaded onto one workstation. For the purpose of this demonstration the models were partitioned so that they could remain fully separate or work interactively. This was an important architecture outcome since it will allow upgrades to the existing neural network in the industry, as well as be applied to new installations with relative ease. The existing station DCS is outlined below, but it should be noted that the NN-ISB demonstrated can readily be adapted to virtually any DCS manufacture. 1. WesStation (Drop 213): This is a TCP/IP communication link which utilizes WesApi to
read input points from the WDPF DCS for the COS and NN-ISB. It writes out neural net biases and permissives to the WesStation and to the DCS for combustion optimization.
2. PI Server: This is a TCP/IP communication link which utilizes the PI API to read heat rate
and other associated inputs for the NN-ISB software. 3. Solvera Sootblowing System - SBC 1000: This communication link utilized the OPC
standard and read the current state of the sootblowers for input into the NN-ISB. The NN-
10

ISB net then determined which group(s) of sootblowers to utilize and then wrote the results back into the SBC 1000.
4. ACM: The Advanced Calibration Monitoring (ACM) software produced by Performance
Consulting Services allowed the plant to monitor the condition of sensors throughout the plant. The ACM software indicated which sensors were failing, the theory included that it would also save time and labor by allowing service technicians to locate bad sensors. The ACM software is running on a PC card locating inside of the Pegasus computer.
5. All Other Sensors: Sensors in the project were all connected to the DCS as their main
input host. From there the information was disseminated through the communications architecture.
11

3. PROJECT DEMONSTRATION REVIEW 3.1. Introduction to Review The project was full-scale and established statistically significant results for emissions reduction and unit performance enhancements. As noted in other sections, the unit is rated at a nominal 455MW and was well suited to demonstrate the technology’s applicability to other utility boilers. The unit experienced a variety of typical unit situations during the project which is representative of units across the United States. These experiences included unplanned outages, tube leaks, weather situations including an abnormally busy hurricane season, steam pressure adjustments, situational unit de-rates, fuel condition changes including wet fuel days, operational equipment outages, and normal wear and tear on the unit which is also symbolic of the installed U.S. fleet. Since this was a full-scale demonstration, there is a “lessons-learned” section so that future applications of this technology will benefit and may also be of benefit to other technologies that use all or part of the project identified herein. 3.2. Demonstration Phases The project was broken down into three (3) discrete phases to provide control of the project and ensure that the established milestones were achieved on schedule and budget, these include, Phase I - Preliminary Engineering Phase II - Procurement & Installation of major components, and model development Phase III - Model tuning, optimization and demonstration of benefits
3.2.1. Phase I Review
Phase I was divided into numerous tasks wherein some were linked together and others independent. This phase primarily related to fully investigating whether Big Bend Units #1 or #2 should be the demonstration candidate, based upon numerous factors Big Bend Unit 2 was selected. The unit had a detailed and thorough review conducted of its equipment and instrumentation to further define outstanding work requirements. In parallel with the foregoing, limited and specific equipment was purchased and installed so that an accurate and complete effort could be expended to document the performance of the unit. Performance monitors were installed at this point which collected data continuously to account for changes which occurred during the course of the project. Preliminary engineering along with material specifications for other necessary equipment was also performed. As with each phase, monthly reports were furnished documenting the results and information obtained to date and is available as an appendix to this report.
• Preparation of the NEPA Statement was completed.
12

• Site Condition Assessment – The work involved a thorough review of the Riley turbo units to determine the best candidate for demonstration. Some of the elements that were evaluated included, future outage schedules, maximization and use of existing equipment, ease of adaptation of new equipment and systems, unit reliability and repeatability. The unit selected was Big Bend Unit 2. Some instruments were installed during various unit outages. The Pegasus equipment did not require an outage for installation, although some of the related DCS logic work was performed during common outages.
• Detailed Plan Development – After the condition assessment task was completed the
project developed a detailed plan taking into account the unique requirements of the unit. During this task, refinements to the work scope were necessary.
• Selective Procurement – In order to adequately document and monitor baseline
conditions of the unit, specific supplies of equipment were procured and installed to begin the data acquisition phase. The installation of the efficiency program took longer than expected. To facilitate reporting and comparing of baseline vs runtime results the PERFIndex calculation was performed on baseline as well as runtime data. The PERFIndex (PERformance Efficiency Index) calculation is an automated calculation expressed in the same units as Heat Rate (BTU/kWhr) and follows the ASME Performance Test Codes PTC 4-1988 while also including the aux-power, SH, RH steam temperatures and spray flow loss calculations. Thus the calculation was used to consistently analyze the baseline as well as runtime data. Pegasus specific equipment that arrived early on site included the SUN hardware in preparation for Phase II.
• Baseline Unit Performance – As noted earlier Big Bend Unit 2 experienced a variety
of typical unit situations during the project which is very representative of units across the United States. These experiences included unplanned outages, tube leaks, weather situations including an abnormal hurricane season, steam pressure adjustments, situational unit de-rates, fuel condition changes including wet fuel days, operational equipment outages, and normal wear and tear on the unit which is symbolic of the installed U.S. fleet. Baseline values for NOx, efficiency, opacity and operational information were taken over a longer period of time than originally planned so that data could be correctly compared to the optimization of the NN-ISB system. Unit operation was matched to similar circumstances so the unit could be compared in a similar fashion. The data collected post-optimization could then be compared to baseline conditions wherein detailed analyses could be performed to ascertain actual benefits for this technology.
• Preliminary Engineering –Much of the focus in this task was directed toward
engineering of the water cannon installation and associated hardware required to be mounted on the boilers.
13

• Balance of Procurement Documentation – This phase used the results of the foregoing, preliminary engineering task, to develop and prepare purchase specifications of major equipment.
• Phase I Reporting – This task included briefings and preparation of documentation
associated with Phase I activities.
3.2.2. Phase II Review Phase II included procurement of the balance of hardware and equipment necessary to assess the performance of the NN-ISB System. Also accomplished was the detailed software engineering necessary in the building of the neural net model. The sootblowing hardware was installed during this period. The neural network software model was also built through testing of the sootblowing patterns to determine optimum patterns for maximum benefits. This testing was performed by combustion experts, with the help of TECO station personnel, who possess a unique knowledge about the boiler unit operation. The boiler characterization information was automatically collected through an interface of the DCS by the neural network software programmed and installed in the SunStation. After the boiler characterization tests were completed, the information was used to build the model and define operating constraints associated with the boiler operation. A significant advancement in sootblowing testing was conceived, programmed and tested during this phase. The tests were programmed to be performed by the installed NN-ISB. This ensured correct DCS and PLC interfaces had been achieved; more closely simulated the final interfaces, and gave more precision to the time stamping of the testing. • Detailed Engineering – On-going engineering was performed throughout the phase to
support the equipment fabrication, inspection and installation of the sootblower system, including support for their communications links and the architecture for the gathering of data from the newly installed sensors and systems.
• Balance of Equipment Procurement – Pegasus procured and assisted with anticipated
architecture requirements for various subprograms and sub-vendors including such items as the PCS ACM program. This involved engineering and coordination with TECO for DCS and point access as well as final decisions regarding target specifications.
• Installation of Equipment, Hardware and Software – The software products and
equipment were properly and successfully installed per the recommendations. Limited and specific testing was performed on this equipment during this task to ensure that it operates with the facilities requirements. At this stage communications and data needs were identified between the sensors and technologies to point out needs between the systems.
14

• Model Development – Pegasus was primarily responsible for development of the model to control the sootblowing, with some important identification of unit constraints and tradeoffs by TECO personnel. This was a significant work effort and was accomplished after the results of the parametric testing had been completed and the data obtained.
• Model and Equipment Validation – After the model was constructed a series of tests
were performed to ensure that the correct variables were identified and prioritized within the model that affect emissions and efficiencies via operation of the sootblowers and COS system. Constraints within the NN-ISB were also reviewed by TECO participation to ensure protection of the station equipment.
• Phase II Reporting - This task included briefings and preparation of documentation
associated with Phase II activities.
3.2.3. Phase III Review Phase III defined the successful operation of the NN-ISB module. Baseline data as defined above was collected up to this point to evaluate the success of this project. During this evaluation, other qualitative and quantitative benefits were observed for reporting. Some of the variables evaluated included auxiliary power consumption, air heater inlet temperatures, frequency of usage, attemperator steam use, visual fouling, and overall efficiency and reliability. This phase was divided into five tasks, inclusive of a dedicated project briefing task.
• Model Tuning – After we verified that the core elements of the NN-ISB were
satisfactorily installed and operational, detailed model tuning began. During this task the unit was operated in a variety of conditions which included some non ideal variations as reported previously. This helped to define acceptable operating limits and define constraints that the NN system uses to optimize the system. The effort was of course a joint effort of the Pegasus and TECO team, but it should be sited that the site engineers interest and involvement was of particular importance to help schedule and orchestrate the unit old and newly installed systems.
• System Optimization – As noted above, this task allowed for necessary adjustments
and for the system to “learn” and make recommendations to the operation of the unit. This task consisted of both advisory (open-loop) and automatic (closed-loop) operation. The advisory mode provided recommendations to the operator and engineers on the project who then used that information to further tune the system. This also proved very valuable in assessing and chronicling the activity, performance, and status of the other new sensors and systems.
• Benefits Demonstration – This task in conjunction with the foregoing, demonstrated
the benefits derived from using a NN-ISB system. This report is the foundation for the quantitative and qualitative results.
15

• Phase III Briefing – TECO to DOE
• Final Reporting – This task involves collection of prior reports, lessons learned, and
other information into a final report, complete with presentation. This document serves as that vehicle. In summary, Pegasus in conjunction with TECO and Solvera operated a closed-loop neural network NN-ISB system on Big Bend unit #2. The product had an asynchronous module combining the benefits of the neural network technology with the sootblowing operation knowledge of experts in the field, and expertise from the station. The application has been adaptive over all load ranges.
16

4. DISCUSION OF OTHER TECHNOLOGY RESULTS 4.1. Project Technology Results
The section discusses and provides operational data relating to the products, services and equipment supplied as part of the NN-ISB program. As noted in section 2 of this report the major pieces of equipment that are reported upon included,
• Sixteen (16) heat flux sensors • Eight (8) slag sensors • Two (2) acoustic pyrometry temperature profiling grids • One (1) sootblower control system (interface) • One (1) on-line efficiency performance monitor • One (1) data validation monitor • One (1) SUN workstation with communication link between the SUN and Plant DCS • Four (4) directional water cannons system complete with pumps
4.1.1. Heat Flux (HF) Sensors Sixteen heat flux sensors were provided during the project by the Hukseflux via Clyde Bergemann as part of the water cannon supply and mounted in appropriate locations. Clyde Bergemann had typically used another manufacturer for the supply of this equipment, but due to business considerations switched suppliers. Accordingly, there was a limited amount of experience with this supplier. TECO via its mechanical/boiler contractor were instructed to install the sensors in predetermined locations within the boiler. These were installed as described in section 2.2.1 of this report. Particular care was taken around the location of the TC sensors and the lead out connections. Specific welding procedures were provided by and the installation was witnessed by Clyde Bergemann representatives. Shortly after the installation of these sensors, (December 2002), failures were observed. Since the sensors included a redundant pair of TC’s the backup set was used. These also failed within a short period of time. After investigations by TECO, Clyde Bergemann and Hukseflux it was determined that sulfide attack was corroding the TC leads. Another partial set of HF sensors were supplied and again installed per the suppliers recommendations. These sensors in conjunction with the remaining sensors that were originally installed also failed after a short period of time. After further investigation the manufacturer stated that it would use an alternate welding procedure for the manufacture of the sensors. A complete set of replacement sensors were supplied by Clyde Bergemann and installed by TECO and its contractors. Some of these sensors also failed over time, however were not as pronounced as the original set of sensors. Product information provided by Hukseflex on their website is shown below.
17

Hukseflex Product Information
A heat flux sensor (1) is incorporated in the waterwall of a boiler. By measuring the flux as a function of time, the process of soot accumulation can be followed. The heat flux sensor functions as a slagging and fouling sensor.
4.1.2. Slag Sensors
Eight slag sensors were provided by Solvera/Stock Equipment to the project and were mounted in close proximity to the heat flux sensors for evaluation. Two of these sensors were mounted in close proximity of the Hukseflex heat flex sensors for comparison purposes before the entire set was installed. After testing was completed it was determined that no statistical correlation existed between the slag sensors and the heat flux sensors. A detailed report for this portion of the project is contained in the appendix.
4.1.3. Heat Transfer Advisor
As noted in section 2, General Physics provided their EtaPro 8 software tool for determination of enthalpy changes within each boiler heat transfer section. This tool was abandoned at the middle of the project due to a lack of consistency with the data provided.
18

4.1.4. Acoustic Pyrometer Differential Plane Temperature Measurement
Solvera/Stock Equipment provided the temperature measurement system to provide continuous information regarding internal temperatures related to the combustion processes for furnace exist gas temperatures and economizer outlet temperatures. The systems initially provided good/reasonable data, however over time proved problematic due to mechanical and severe duty application. As earlier noted, two sound generators were provided at each plane along with several receivers. Each device was also fitted with combination cooling and sealing air, since the unit was pressurized. Over the course of several months after the installation both receiver and sound generator failures were observed. In general, the receivers suffered from corrosion and high heat attack. The sound generators had problems with the amplification system which was not originally supplied with any oil lubrication system. This was later supplied at the tail end of the project. Failures were also observed with the rubber hose connection that allowed the pulse of air to enter the boiler. Unfortunately due to the unreliable nature of the system it was not used as a modeling input.
4.1.5. Sootblower Control System
The sootblower control system was provided by Solvera/Stock Equipment which provided an integrated state-of-the-art sootblower interface control known as SBC 1000. This product was developed and used at another TECO facility. It uses object based control and has diagnostic tools to allow both operations and maintenance to evaluate the operation of any specific sootblower. This includes steam consumption and amperage, as compared against a programmable baseline trend. For everyday use the system is user friendly, however for more advanced functions and troubleshooting, it requires a trained technician. The system is currently in use and is the hub for all functions between the NN-ISB and the sootblowers.
4.1.6. On-Line Efficiency Performance Monitor
The General Physics EtaPro 8 software package included an on-line efficiency performance module designed to help provide information necessary to run a power plant more efficiently. Data (temperatures, pressures, flows, etc…) were collected approximately once per minute from the distributed control system (DCS). This system was not used due to poor and nonrepeatable outputs. The PERFIndex was used as a substitute for this product which is acknowledged as valid albeit that it requires additional work to calculate. The PERFIndex (PERformance Efficiency Index) calculation is an automated calculation expressed in the same units as Heat Rate (BTU/kWhr) and follows the ASME Performance Test Codes PTC 4-1988 while also including the aux-power, SH, RH steam temperatures and spray flow loss calculations. The calculation was used to consistently analyze the baseline as well as runtime data.
19

4.1.7. Data Validation
The Advanced Calibration Monitor (ACM) supplied by PCS is a computerized calibration monitoring system with capabilities for automatically assessing the health and validity of instrumentation associated with this project. The core element of this product is a pattern recognition methodology. Whereas, Pegasus supported the use of this product for data validation for real-time inputs into the NN-ISB, the station reported that it was an extremely difficult product to use and that it would also provide invalid data since it did not have the capability to extrapolate nor could it recognize bad data during the training process.
4.1.8. SUN Workstation
The NN-ISB utilized the performance and computing environment of the SUN hardware platform which uses the Solaris operating system and development environment. The neural network software functions with up to six processes running in parallel. The station is currently transferring all control functions to Ovation/Emerson for the DCS system and avoids stand alone PLC’s and computer based systems whenever possible. Pegasus programming was not compatible with the stations platform so the SUN station or equivalent was required. No problems have been reported with this system and in the event of problem the system has been configured such that the NN-ISB function will discontinue its operation leaving the unit to operate on its conventional control curves, which can be manually biased by the operator.
4.1.9. Water Cannons Complete with Water Boosting Pumps
Due to the high heat release of the Riley wet bottom units which create high thermal NOx the project included water cannons to minimize slag in the furnace and optimize radiant heat absorption in the water walls. Due to the design of the Riley Turbo furnaces, which have high heat release numerous problems were seen with this system. For pressurized furnace applications, sealing air is absolutely critical. The system failed on several occasions due to loss of or low sealing air resulting in major damage to the water cannons and loss of sealing to the furnace which required the unit to be taken off-line for repairs. Clyde Bergemann also used Sundyne’s AnySpeed pumps and skids for control of flow and pressure to the water cannon lances. Numerous failures of the variable speed drive systems lead to frequent loss of the entire water cannon system. During periods when the water cannon system and the heat flux sensors were both operational, it was discovered that the system could not spray/target water across the width of the furnace. This was in part due to the firing configuration of the Riley units, which have a total of 48 coal nozzles on a single elevation, 24 on each side firing toward the center line of the furnace. In order for the water stream to reach the other side of the unit, it had to jet 60’ across the length of the furnace through the gas flux of all these burners. At low to mid load operation, the water jets had marginal success at accomplishing the task. However, at mid to high load operation the water jet was easily dispersed and vaporized. Due to these concerns and issues a detailed test was conducted in July 2004 to determine if the data
20

provided to the NN-ISB was considered useful and could be a control for the targets of the program. The results of that test concluded that the water cannon system was not suitable for this program. The results of that test are included in the appendix.
21

5. TECHNICAL RESULTS AND DISCUSSION 5.1. Introduction to Results This section contains the discussion of benefits observed during the project. The data was reviewed, analyzed and commented upon for several key areas. This section has main headings relating to the primary objectives of the project namely, NOx, efficiency, and opacity relationships. Additional benefits and observations are included after the discussions of the primary objectives. Immediately following the Technical Results and Discussion section is a lessons learned discussion which addresses non data specific observations. 5.2. Data Selection Unit operation data was reviewed using several different time spans to identify data periods representing comparable unit operating conditions under both, open-loop and closed-loop modes of operation. Open-loop data was considered more favorable in many cases than baseline data to use for comparison purposes since the unit underwent various modifications since the inception of the project. When selecting data for comparative analysis, several issues were considered, including: • Known dates of monitored operation within the available test window will be used. • Identify data periods with similar Unit operating conditions (as represented by important
Unit operating parameters) for each mode of operation. Examples include MW, fuel, ambient weather conditions at the unit in Tampa Florida, other plant manual setting, etc.
• Exclude data periods involving significant gaps in availability of operating data. This helps ensure consistency of data trends during any particular operating mode and helps account for normal transitions as observed on a day-to-day basis.
• Identify data periods with unit operating trends in close proximity during both modes of operation. This should also help maximize correlation to seasonal variations.
• The data should include days of contiguous operation in each mode. • Equal number of data records from both operating modes must be used for comparative
frequency analysis. • The fuel bunkered for those days was similar for the periods of the test. • Consider baseline data to be for the period January 1, 2002 to December 31, 2002 which
is used in part because the full year data is well documented and spans the start of the project date. Note: Due to pressure part wall thinning the unit was operated at lower operating pressures which impacted the units ability to be operated at high loads and could also alter heat rate performance as discussed in latter sections.
Extensive data review and analysis resulted in the selection of an open-loop, closed-loop and extended set of data. The extended set of data was used to offset the loss of a non-certified NOx instrument during the open-loop time period, and to also extend the opacity data to ensure that all operating conditions were observed. Data representing open-loop operating mode was collected
22

from September 14, 2004 to September 17, 2004. Unit operating data from September 29, 2004 to October 2, 2004 was selected to represent closed-loop operation. Each dataset was comprised of an identical number of data records with data values averaged over a 15 minute time period. Also in each case, short time gaps (5 in case of open-loop data and 3 in case of closed-loop data) of a few minutes were noted and eliminated from consideration due to restart/reboot issues related to the data acquisition systems. The time gaps were short in duration and have no appreciable impact on the data set. The coal blend used during the open-loop, closed-loop and extended set was documented for each test period. Two predominate types of fuel were used during the tests, the Standard H which produces higher NOx as compared to the lower NOx fuels which were Standard L and Ziegler. Although, the ratio of Standard L and Ziegler varied between the tests no adjustments were made to account for discrepancies due to fuel changes since i) the combined input was relatively constant and ii) these low NOx fuels produce similar emissions and slagging characteristics within Big Bend Unit 2.
Higher NOx N/A Higher NOx Lower NOx Lower NOx NOx Contribution Standard H Limestone Pittsburgh 8 Standard L Ziegler Total Coal Supply
Coal Blend Data for NOx & PM Open-Loop Dates (The Extended Set) 10/2/2004 1054.92 0.00 0.00 515.53 662.55 2233.0 10/3/2004 3242.21 0.00 0.00 856.78 1402.01 5501.0 10/4/2004 3182.21 0.00 0.00 632.79 0.00 3815.0 % of Total 64.76 0.00 0.00 17.36 17.88
Coal Blend Data for Open-Loop Test Dates 9/13/2004 2500.11 0.00 0.00 0.00 1050.89 3551.0 9/14/2004 2466.12 0.93 0.00 201.68 1176.27 3845.0 9/15/2004 2041.19 0.00 0.00 541.69 1039.12 3622.0 9/16/2004 2027.67 0.00 0.00 572.10 1128.23 3728.0 9/17/2004 930.11 0.00 100.88 283.44 538.57 1853.0 % of Total 60.03 0.01 0.61 9.63 29.72
Coal Blend Data for Closed-Loop Test Dates 9/28/2004 2855.40 0.00 0.00 0.00 593.60 3449.0 9/29/2004 2238.88 0.00 0.00 0.00 1508.12 3747.0 9/30/2004 2064.53 0.00 0.00 0.00 1409.47 3474.0 10/1/2004 1618.32 0.00 0.00 141.17 1337.51 3097.0 10/2/2004 1054.92 0.00 0.00 515.53 662.55 2233.0 % of Total 61.45 0.00 0.00 4.10 34.45
Table 2 Coal Analysis
Excess oxygen was also considered extremely important to ensure that the test results were representative. Figures 4 and 5 show trend plots for unit load and flue gas excess oxygen for the two modes of operation. Each mode of operation shows unit load of around 375MW at the upper
23

load range and around 133MW at the lower load range. Analysis of several other parameters also showed a correlation between the two modes of operation. However note that not all numbers are the same. For example the O2 average is slightly higher in the front portion of the open-loop time period. Also highest load is higher in open-loop mode, while closed-loop mode had a more extended period at mid load.
Trend Plots for Unit Load and Average-Flue-Gas-O2, Open-loop Mode
100
150
200
250
300
350
400
Number of Data Records (15 minute averages)
Uni
t Loa
d (M
W)
1
1.5
2
2.5
3
3.5
4
4.5
5
Ave
rage
Flu
e G
as O
2 (%
)
GEN_LOAD_MWAVG_FLUEGAS_O2
Figure 4: Trend plots for Unit-Load and Average-Flue-Gas-O2 in open-loop mode
24

Trend Plots for Unit Load and Average-Flue-Gas-O2, Closed-loop Mode
100
150
200
250
300
350
400
Number of Data Records (15 minute averages)
Uni
t Loa
d (M
W)
1
1.5
2
2.5
3
3.5
4
4.5
5
Ave
rage
Flu
e G
as O
2 (%
)
GEN_LOAD_MWAVG_FLUEGAS_O2
Figure 5: Trend plots for Unit-Load and Average-Flue-Gas-O2 in closed-loop mode
5.3. Benefits for Efficiency
5.3.1. Introduction on Efficiency
As noted earlier in the report, one of the effects of burning coal in utility boilers is the buildup of soot and slag on the heat transfer surfaces within the boiler. This adversely affects the rate at which heat is transferred to the water/steam subsequently used by the turbine. Fouling of the boiler leads to poor efficiencies due to the resistance to heat transfer through built up ash. If there were complete coverage of the tube surfaces such heat that would normally be transferred remains in the flue gas stream and exits to the environment without beneficial use. In other situations (commonly understood in the case of wall tubes) preferential coating of key areas helps overall efficiency. Non optimal cleaning or coating can create loss in efficiency that in turn translates to higher consumption of fuel for equivalent levels of electric generation. In turn non-optimal cleaning also creates more total gaseous emissions.
Adverse efficiency impacts arise from numerous factors inclusive of, but not necessarily limited to; incomplete combustion, unbalanced steam generation, excessive use of desuperheater sprays, and high exit gas temperatures. Traditional sootblowing schemes
25

involve fixed schedules for activating the blowers which were developed for a common but none the less specific operating condition.
The automated closed-loop activation of the blowers during this project has shown that NN-ISB may have the following benefits in efficiency:
• Dry gas loss as a major element in efficiency calculations is reduced. • Unit load and efficiency benefits improve across the load range and increase more as
the load decreases. • Examination of the efficiency trends during a segment of open-loop and closed-loop,
points to an improvement of 10BTU/kWhr to 50BTU/kWhr over the range during closed-loop control of the NN-ISB as compared to standard activities.
• Added to this efficiency benefit would be the decrease in steam generation used as a function of sootblowing. This reduction of sootblowing can be seen best in the next section coving opacity.
• When comparing the 2002 baseline efficiency improvement against the closed-loop data set an apparent reduction of 20 BTU/kWhr at high load points and up to 420 BTU/kWhr at low load was observed. However, numerous physical, operational and fuel changes may account for much of these improvements.
5.3.2. Notes on Efficiency Data The unit wide heat rate calculation or On-Line Efficiency Performance Monitor (OPM) supplied by General Physics was not functional as mentioned in Section 4 during the baseline or for the open-loop and closed-loop data acquisition periods. Accordingly, the PERFIndex calculation was performed on these data sets. One notable instrument compensation event occurred at the plant site which involved the “master” total fuel measurement. This is seen as an offset in the data. The subject instrument data could be compensated and thus a back fit of the data was performed for this instrument to ensure consistency of the reported results. Below is the mathematical proof of the offset and resultant formula so that any result can be reviewed. The first two graphs show the difference that occurred between the open-loop and closed-loop data relating to this instrument measurement. The calculations that follow the graphs are the geometrical translation of the data, and the resulting formula.
26

y = 0.2055x - 4.3758
0
10
20
30
40
50
60
70
80
0 50 100 150 200 250 300 350 400
Unit MW
Fuel
BTU
Com
pens
ated
TOT_FUEL_BTU_COMPLinear (TOT_FUEL_BTU_COMP)
Figure 6: Open-loop Total Fuel Instrument Data Graph
y = 0.2481x - 17.361
0
10
20
30
40
50
60
70
80
90
0 50 100 150 200 250 300 350 400
Unit MW
Fuel
BTU
Com
pens
ated
TOT_FUEL_BTU_COMPLinear (TOT_FUEL_BTU_COMP)
Figure 7: Closed-loop Total Fuel Instrument Data Graph
27

The two formulas are below where Yo is the fuel value open-loop and Yc is the fuel value during the closed-loop session of tests. X in both equations represents MW of the unit.
Open-loop for the instrument Yo=0.2055x - 4.3758
Closed-loop for the instrument Yc=0.2481x – 17.361
The intersection of these two curves is at 304.81 ie. 305MW and thus an intersecting fuel point of 58.26. Hence the correction for the offset in instrumentation between the two test periods are [ 10.02 + Yc(0.828)=Yo ] for the new Total Fuel reading. This in turn is used in the calculation of Unburned Carbon Loss and the Dry Gas Loss.
5.3.3. Observations on Efficiency Benefits
Efficiency was one of the modeled goals for the NN-ISB. The goals of the NN-ISB can be weighted between one another. In all cases the results reported below are covering the same data time, when the goals were evenly weighted. Thus a feature that could subsequently be tuned by the unit personnel would be to weight the NN-ISB more to one priority rather than another. This is similar to operations directives given by supervisors to operators to pay particular attention to certain operating aspects of the unit.
As shown in the next series of plots there is a substantial benefit in dry gas loss, and that contribution is reflected in the PERFIndex. Improvement in dry gas loss was a prediction in the NN-ISB project submittal. This resulted in an improvement of 10 BTU/kWhr at high load and 50 BTU/kWhr at low load when comparing the open-loop to closed-loop NN-ISB tests. Greater results at low load were observed when compared to the 2002 baseline data. Figures (6, and 7) The open-loop data also contains data at an intermediate load.
28

Figure 8: Open Loop Performance Efficiency Index (BTU/kWhr)
Figure 9: Closed Loop Performance Efficiency Index
29

350
400
450
500
550
600
650
700
120 170 220 270 320 370
Unit MW
PER
FInd
ex
(BTU
/kW
hr)
Open Loop EfficiencyClosed Loope EfficiencyLinear (Closed Loope Efficiency)Linear (Open Loop Efficiency)
Closed Loop
Open Loop
Figure 10: Closed Loop and Open Loop PERFIndex
The project improvement for the NN-ISB portion not inclusive of any reduction in SB steam flow is shown in the following graph. The linear regressions from the charts above have been plotted against the baseline for easier comparison. The improvement (reduction) was 20 BTU/kWhr at the comparable high load points and up to 420 BTU/kWhr at low load when compared against the 2002 baseline data (figure 11) There is also a measurable benefit for efficiency brought about by the redistribution of sootblowing steam and the ensuing average reduction of steam usage.
30

Baseline Efficiency vs MW
0
200
400
600
800
1000
1200
1400
120 170 220 270 320 370 420
MW
PER
FInd
ex
Baseline
Open
Closed Loop
Figure 11: Baseline, Open Loop, and Closed Loop Performance Efficiency Benefits
5.4. BENEFITS FOR NOx
5.4.1. Introduction on NOx
Reduction of NOx was one of the primary objectives. Two sets of data are provided representing the resulting NOx benefit brought about through NN-ISB since this unit is considered highly sensitive relative to NOx formation. NOx formation and disassociation with subsequent reformation takes place in certain temperature ranges. Sootblowing optimization has two effects; one reflects to furnace combustion, the other to NOx formation. Altering the cleaning of various boiler sections in turn causes changes in the furnace area of fuel and air control points, as well as temperatures in the furnace area. It is presumed that most of the NOx formation and/or re-formation is thermal NOx related. Since temperatures can still be statistically high enough in the pendant and upper pass region of the boiler there is still a statistical chemical probability of thermal NOx formation. The data and graphs show a range of differences in sootblowing service. The conclusion is that NN-ISB may have an effect on NOx formation. The degree of this effect is in part dependant on unit conditions, load transitions, gas flows, and individual unit physical and sootblowing construction. For this particular application the use of water cannons was thought to have a major impact upon control of slagging and fouling in the furnace. However, since that element of the project (water cannons as explained in
31

section 4.1.9 in this report) proved unsuccessful, the obtainment of the target objective for NOx reductions (30%) were not realized.
The automated closed-loop activation of the blowers during this project has shown that NN-ISB has the following potential benefits for NOx reductions: • Temperature control and sootblowing action in the upper furnace and lower pendant
areas have an impact on NOx formation and/or re-formation. • Both alterations of the furnace combustion and upper furnace temperatures contribute
to reduced NOx formation. It is suggested in the lessons learned section that subsequent investigations may find value in quantizing the thermal profiles even better than have been attempted in this program. One of the conclusions of this project are that SB in the upper passes effects resultant NOx. This may directly relate to the dissociation and reformation of NOx molecules as reported in other experiments particularly those associated with water cannons that showed reported evidence of NOx being reduced below the nose of the boiler, but the stack CEMS showed no final change in NOx. In this experiment due in part to the non-functioning water cannons furnace NOx could be considered a constant and point to the conclusion that SB in the upper and backpass’ support have measurable and important affects on the final NOx results.
• Unit load and NOx benefits can improve across the load range and increase even more as the load decreases and the associated degrees of freedom are increased from mechanical or design maximums.
5.4.2. Observations on NOx Benefits
Tests were conducted to evaluate the impact of the NN-ISB system on NOx emissions over different unit operating periods. Data analysis helped select datasets which represented comparable data trends. It should be noted; the non-certified NOx analyzer for Big Bend Unit 2 was out of service during the open-loop data period identified earlier (i.e. during September 14, 2004 to September 17, 2004). Consequently, for evaluating the NOx benefits, a separate open-loop dataset (a.k.a. the extended set) was selected once the non-certified NOx analyzer became operational. The time frame used for open-loop NOx was changed to 10/2/04 11:09 to 10/04/04 to 21:39, which is shown in Figure 13a. This data set was extended to 10/05/04 until 18:38 to include a post load shedding excursion which is shown in Figure 13b. Figure 12a is a plot of raw data for the entire test period, inclusive of closed-loop, open-loop and the extended data. The graph includes gross megawatts for the unit and the NOx emissions. The data label “NOx_In” represents that the NN-ISB was in service, while “NOx_Out” notes that the NN-ISB was not in service. Of particular note are the NOx profiles following a low load event. This unit is prone to waterwall fouling after a period of high load operation, which causes the thermal NOx to increase. A low load event allows the slag accumulations to shed from the waterwalls and hence lower NOx is realized until the walls are again fouled.
32

0
0.1
0.2
0.3
0.4
0.5
0.6
0.7
0.8
1 28 55 82 109 136 163 190 217 244 271 298 325 352 379 406 433 460 487 514 541 568 595 622 649 676
Patern Number
Uni
t NO
x lb
s/m
mB
TU
0
50
100
150
200
250
300
350
400
Uni
t MW
nox_in
nox_out
GEN_LOAD_MW
Figure 12a: Unit-Load vs NOx for closed-loop, open-loop mode and the extended data
Unit Load vs. Duct Nox in Closed-loop Mode
0.3
0.35
0.4
0.45
0.5
0.55
0.6
0.65
0.7
100 150 200 250 300 350 400Unit Load (MW)
Duc
t NO
x (L
bs/m
mB
TU)
DUCT_NOX_LBS/MMBTULinear (DUCT_NOX_LBS/MMBTU)
Figure 12b: Relationship between Unit-Load and Duct NOx in closed-loop mode
Using the raw data as shown in Figure 12a, Figure 12b was created plotting unit load against the corresponding NOx emission for only the closed-loop period of operation. A linear relationship
33

was used to describe NOx vs load since the Riley units are similar to wall fired units. This graph is the basis for comparison in the subsequent figures.
Unit Load vs. Duct NOx, Open-loop Test
0.3
0.35
0.4
0.45
0.5
0.55
0.6
0.65
0.7
0.75
320 330 340 350 360 370 380Unit Load (MW)
Duc
t NO
x (L
bs/m
mB
TU)
DUCT_NOX_LBS/MMBTU-Open-loop
Linear (DUCT_NOX_LBS/MMBTU-Open-loop)
Figure 13a: Relationship between Unit-Load and Duct NOx during open-loop test
The graph shown above, Figure 13a is a plot of NOx vs. load for the open-loop test period and does not contain data for the extended period. A linear representation was also performed for comparative purposes.
To ensure that the potential for NOx reductions due to the NN-ISB was fully understood and evaluated the extended data set was compared against the closed-loop data set in Figure 13b. In order to quantify the NOx benefits for analogous unit conditions, operating data between 300-380MW was selected. The extended data includes a post load shedding event which was similar to that seen in the closed-loop test. Using this extended set of data produces NOx emissions results which suggest that little to no reductions were produced. The data sets for the non-extended open-loop test was compared to the closed-loop mode of operation which is represented if Figure 14. Again, operating data was selected in the 300-380MW range to ensure controlled conditions. The results of this examination yields data that indicate a 3.5% to 8.5% reduction in NOx using the closed-loop mode.
34

0.3
0.35
0.4
0.45
0.5
0.55
0.6
0.65
0.7
0.75
290 300 310 320 330 340 350 360 370 380 390
Unit MW
Uni
t NO
x m
mB
TU
nox_innox_outLinear (nox_in)Linear (nox_out)
Figure 13b: Unit-Load and NOx extended data
Unit Load vs. Duct NOx during Open-loop and Closed-loop Modes of Operation
0.5
0.55
0.6
0.65
0.7
0.75
300 310 320 330 340 350 360 370 380
Unit Load (MW)
Duc
t Nox
(Lbs
/mm
BTU
)
DUCT_NOX_LBS/MMBTU-Open-loop
DUCT_NOX_LBS/MMBTU-Closed-loop
Linear (DUCT_NOX_LBS/MMBTU-Open-loop)
Linear (DUCT_NOX_LBS/MMBTU-Closed-loop)
Figure 14: Comparison of relationship between Unit-Load and Duct NOx during open-
loop and close-loop conditions
35

In addition to open-loop and closed-loop data comparisons, the 2002 baseline data was also reviewed to observe perceived NOx reductions resulting from the NN-ISB. The baseline NOx vs. load relationship for 2002 is shown in Figure 15. The 2002 NOx trend is very similar to the closed-loop mode of operation. Accordingly, the NN-ISB as compared to the baseline year only provided marginal reductions in NOx. It should be noted that these results are expected since the program originally included water cannons, which were not available for neural network control. Ideally the water cannons were to provide cleaning/deslagging of the furnace while concurrently optimizing heat rate. Since the water cannons were not available the unit was subject to excessive water wall slagging, leading to higher temperatures in the combustion zone and hence higher levels of thermal NOx emissions.
Unit Load vs. Duct NOX, Baseline Data, Year 2002, 1 Hour Averages
0.2
0.3
0.4
0.5
0.6
0.7
0.8
100 150 200 250 300 350 400 450Unit Load (MW)
Duc
t NO
x (L
bs/m
mB
TU)
DUCT_NOX_LBS/MMBTULinear (DUCT_NOX_LBS/MMBTU)
Figure 15: Relationship between Unit-Load and Duct NOx in baseline mode
5.5. Benefits for Opacity
5.5.1. Introduction on Opacity
Reduction in particulate matter (PM) emissions was one of the project objectives. Depending upon the ESP design, operation can be sensitive to rapid changes in inlet mass concentration as well as total mass loading. Excessive soot removal and/or inappropriate
36

cleaning strategies can overload the ESP. Overloading of an ESP can cause inhibit the ESPs processing capacity and potentially result in increased PM emissions. Tighter control of inlet temperatures to the ESP, coordination of sootblowing activities, ESP rapping execution, and reduction in unburned carbon are factors that may also contribute to decreasing PM generation. The impact on opacity was analyzed considering the following factors: • The frequency of opacity values. • Examination of the opacity trends during open-loop and closed-loop, indicated an
apparent improvement of 1% to 1.5% over the range during sootblowing activities. • Similar to the NOx evaluation, an extended set of open-loop data was reviewed
wherein the results indicated little to no improvement.
5.5.2. Observations on Opacity Benefits
Frequency distributions for opacity while in open-loop and closed-loop mode are shown in figures 16 and 17 respectively. Comparisons of the histograms in figures 16 and 17 indicate a reduction in opacity excursions during closed-loop mode of operation. The slightly higher number of opacity excursions at the top end are attributable to the greater variability in unit load during closed-loop mode of operation. This fact is evident from figures 18 and 19 which show trend plots for unit load and opacity over time during the two modes of operation. Rapid variations in unit load correlate to opacity excursions however are a function of required dispatch events and grid requirements.
37

Open Loop Histogram
0
20
40
60
80
100
120
140
160
180
200
4 8 12 16 20 More
Bin
Frequency
Frequency
Bin Frequency4 08 6
12 7916 17720 29
More 1
Figure 16: Frequency distribution in open-loop mode for Opacity
38

Closed Loop Histogram
0
20
40
60
80
100
120
140
160
180
4 8 12 16 20 More
Bin
Frequency
Frequency
Bin Frequency4 08 2
12 10316 17120 12
More 4
Figure 17: Frequency distribution in closed-loop mode for Opacity
39

Trend Plots for Unit Load and Opacity-6-Min-Averages, Open-loop Mode
100
150
200
250
300
350
400
Number of Data Records (15 minute averages)
Uni
t Loa
d (M
W)
0
5
10
15
20
25
Opa
city
, 6 M
in A
vera
ges
(%)
GEN_LOAD_MWOPACITY_6_MIN
Figure 18: Trend plots for Unit-Load and Opacity in open-loop mode
Trend Plots for Unit Load and Opacity-6-Min-Averages, Closed-loop Mode
100
150
200
250
300
350
400
Number of Data Records (15 minute averages)
Uni
t Loa
d (M
W)
0
5
10
15
20
25
Opa
city
, 6 M
in A
vera
ges
(%)
GEN_LOAD_MWOPACITY_6_MIN
Figure 19: Trend plots for Unit-Load and Opacity in closed-loop mode
40

0
5
10
15
20
25
290 300 310 320 330 340 350 360 370 380 390
Unit MW
Opa
city
%
Opacity_InOpacity_OutLinear (Opacity_In)Linear (Opacity_Out)
Figure 20a Opacity Trends of Closed Loop vs. Extended Open Loop Data
The extended data used to evaluate the NOx is also shown in figure 20a for opacity consideration. No statistically significant difference between these two data sets is evident.
Sootblower Steam Flow vs. Opacity Trends during Open-loop and Closed-loop Mode
0
5
10
15
20
25
0 10 20 30 40 50 60 70 80Sootblower Steam Flow
Opacity, 6 Min Averages (%)
Opacity, Closed-loopOpacity, Open-loopLinear (Opacity, Open-loop)Linear (Opacity, Closed-loop)
Figure 20b: Sootblower Steam Flow vs. Opacity trends during open-loop and closed-loop
41

Opacity trends during open-loop and closed-loop were also compared against sootblower activation events as shown in figure 20b. The actual data and trends in figure 23 illustrate opacity reductions during closed-loop mode of operation, but may be attributable to variation in load profiles. The data points relating to no sootblowing activity were culled out from the graph in figure 20b for both operating modes to facilitate analysis. Examination of the opacity trends during open-loop and closed-loop, points to an improvement of 1% to 1.5% over the entire range of sootblowing activities.
In addition to the data from open-loop and closed-loop modes of operation, baseline data (from year 2002) spanning over an extended period of time was reviewed to obtain information regarding opacity trends under different unit operating conditions. Such a review helped identify baseline conditions prior to the installation of various equipment, instrumentation and control components of the NN-ISB project. The relationship between unit load and opacity as observed during baseline conditions is shown in figure 21.
Unit Load vs. Opacity-6-Min-Averages, Baseline Data, Year 2002, 1 Hour Averages
0
5
10
15
20
25
30
100 150 200 250 300 350 400 450Unit Load (MW)
Opa
city
, 6 M
in A
vera
ges
(%)
OPACITY_6_MINLinear (OPACITY_6_MIN)
Figure 21: Unit-Load vs. Opacity under baseline conditions (year 2002 data)
42

5.6. Additional Benefits
5.6.1. Integration of Sensors and Optimization
Prior to this project sootblowing sensors and controls were often treated as islands. Wall sensors would be tied only to wall blowers. Upperpass sensor would also be tied to a specific set of blowers. Often this had been done due to the sensors being added to address a particular unit problem. Hence they were installed as islands of help for sootblowing. These components and systems had never been fully integrated with any type of master or comprehensive goal identified. What was evaluated in this project was that a NN-ISB system has the ability to understand, evaluate and optimize the process as an entire system of multiple real-time objectives. The integration of the sensors went well, and provided the following observations. Communication was established to the neural network system with all sensors and elements of the project. The experimental sensors and calculations were at sometimes overlapping in information provided. This was a benefit in that it allowed contingency project paths and analysis. The multiple sources of information were used in order to complete the project analysis, and provide substitution where needed. All sensors and systems included modern communications configuration that enabled these systems to be integrated successfully. Thus the project proved that all such systems could be linked together without the concern of proprietary networks getting in the way.
5.6.2. Automated Testing and Human Factors
A significant advancement in sootblowing testing was conceived, programmed and tested during the project. Automated or scheduled testing is done as part of the parametric tests. The parametric tests were programmed to be performed during the installation of the NN-ISB system. First this ensured correct DCS and PLC interfaces had been achieved early in the project. Secondly, this closely simulated the final interfaces, and gave more precision to the time stamping of the testing. We believe that this helped operator acceptance of the technology due in part to it helping operators visualize the final system working, and would ease their burden in accomplishing the required test efforts.
The operator screens for all COS and NN-ISB applications were integrated to the DCS control systems. This maintained the relationship of the optimization systems being in supervisory control. Operators are currently comfortable with this solution and it allows them to easily visually if the system is in Manual, Auto, or Optimization (Pegasus) mode. In the future this should allow for the even greater comfort with these systems from a human factors point of view. As such future engineers or management may want to move to a system where the Optimized control mode is the defacto condition, thus the Auto mode and the Optimization mode would be one in the same. The operator would have a selection of Auto (implied with optimization) and Manual modes.
43

5.6.3. Boiler Drum Level and Pressure Discussion
The East and West boiler drum level measurements were analyzed for effects due to sootblowing. There were mixed results. The data was analyzed in the following manner. The open-loop and closed-loop data was edited first by removing all MW_change rate conditions that exceeded 0.5MW/min. This limited the drum level disturbance due to normal load variation. Secondly the data was separated for low load operation (133 and 144MW) and high load (above 366MW) data. The coefficient of variation for low and high load of both the East and West drum levels were calculated and were statistically similar within the normal band of error. However in open and closed-loop there was a 2.1 to 1.4 reduction in standard deviation of boiler drum pressure. Given that the nominal drum pressure during the test was 2049 the absolute variation would again not be considered significant, however the minimum to maximum pressure variation open to closed-loop was and 11.5 and 6.4 respectively, during these otherwise stable data conditions. One might be able to infer that sootblowing had less upsetting effect on boiler drum conditions however we would have to conclude that despite the best ability to edit the data; this may still not merit being ranked as an analytically proven benefit.
5.6.4. Tube Temperatures
The important tube section temperatures were analyzed for effect. The results were nominally the same for high load data of interest (366MW and higher). The observations are as follows and show some slight interest. The superheat average temperatures are almost identical as one might expect. We can also note that the average cold reheat was essentially the same (symbolized by blue highlighting). The yellow highlighting shows a no statistical difference on superheat standard deviation. It can however be seen that there was a small 2-3 degree decrease in the standard deviation of the reheat temperatures (green highlighting) as compared to normal open-loop operation. There also seemed to be some stabilization of the reheat temperatures especially on the east side.
Closed Loop High Load Analysis Open Loop
Min Max Avg Std-Dev Min Max Avg StdDev 675 679 676 0.832 COLD_REAHET_TEMP 673 679 677 0.998 982 1021 1003 8.270 W_REAHEAT_TEMP_OUT 985 1032 1009 9.401 1001 1044 1015 9.324 E_RH_TEMP_OUT 984 1040 1014 11.920 997 1027 1009 6.922 RH_TEMP_OUT_AVG 988 1032 1012 9.038 999 1004 1002 0.951 W_SH_TEMP_OUT 1000 1004 1002 0.685 999 1004 1002 0.792 E_SH_TEMP_OUT 1000 1004 1002 0.658
Table 3 High Load Tube Temperature Effects
The reheat temperatures at lower loads showed more variation since the unit typically does not maintain temperatures at those lower loads which is common with many units. However, the reheat average outlet temperature at the two low load temperatures was 979
44

and 946 for closed-loop and open-loop, respectively. This was one of the reasons for the improved efficiency at lower loads.
5.7. Novel Pegasus Technologies items developed or used within this project.
5.7.1. Patent Submission
Patentable items are being reviewed for formal submission to the United States Patent Office (USPO). They have areas of direct benefit to the United States installed fleet. One of the patents application attributes is that they will allow Intelligent Sootblowing with a minimum or no additional new sensors. The novel uses include Path Forecasting and for anticipation of unit restrictions. .
5.7.2. PERFIndex Several challenges relating to the measurement or calculation of efficiency variables often arise during the implementation of the Pegasus optimization technology. Some boilers may not have all the instrumentation necessary for a traditional heat rate calculation. Certain units may have computer generated calculations that are suspect, non-repeatable, intermittently unavailable, or simply not yet installed. Performance calculations that require operator inputs for fuel related variables, meteorological data and assorted other variables may be neglected. Of particular importance in the case of this project the calculated performance variable may have so much variability or noise associated with it that the resulting change due to the adjustment of the control variables is lost within the normal deviation. To overcome these obstacles it has become necessary to develop an efficiency related index that would serve to provide data which is reliable and can quickly be implemented. The Performance Efficiency Reference Index (or PERFIndex) is a variable often displayed in BTU’s/kWh (North America). Resolution of data is also an important factor to enhance an online heat rate calculation. For example, a reasonable goal is to improve heat rate by 0.25% to > 1%. The heat rate inputs are inherently very noisy. Typical values of noise within the heat rate of +/- 2% are even present during steady state boiler conditions. This is greater than the amount of expected improvement, in other words, the signal to noise ratio presents a difficult situation for proper engineering evaluation. By using a sum of losses approach, these factors can be separated from the mechanical and maintenance factors that a combustion optimization system cannot influence. This reduces the number of high noise variables and makes the improvements more noticeable. The PERFIndex is designed to minimize the impact of this noise and focus on the higher resolution of components affected by combustion optimization. The PERFIndex can give a reliable index for measuring this improvement.
45

The components of the PERFIndex calculation are designed to include elements of boiler efficiency and steam side unit heat-rate over which operators and likewise optimization systems can have influence. Elements of heat rate influenced by mechanical performance problems are purposefully excluded from the calculation. The PERFIndex is not meant to be a calculation of absolute heat rate, but rather a special purpose set of calculations to provide a quantifiable number to show the improvements that the optimizer has provided relative to absolute unit heat rate. By providing the PERFIndex calculated value and the individual components used in the calculation the user can easily determine what efficiency components dominate the result, where efficiency improvements have been made, and where further efficiency improvements can be made. The PERFIndex addresses the specific question of how to measure unit performance improvements in real-time that often are less than 1%. The use of the ultimate analysis fuel table and real time sensors of the fuel being consumed at the moment of combustion allows for operations to obtain uncompromised computation.
46

6. LESSONS LEARNED Since this was a full-scale demonstration, there is a “lessons-learned” section so that future applications of this technology will benefit and may also be of benefit to other technologies that use all or part of the project identified herein. 6.1. Future NOx formation investigations It is perceived that both the alteration of the furnace combustion and upper furnace temperatures may contribute to reduced NOx formation. It is suggested by this project that subsequent investigations may find value in quantizing the thermal profiles even better than have been attempted in this program. One of the conclusions of this project is that sootblowing in the upper passes effects resultant NOx. This may directly relate to the dissociation and reformation of NOx molecules as reported in other experiments particularly those reported in early water cannon testing. Those tests had showed evidence of NOx being reduced below the nose of the boiler, but the stack CEMS showed no final change in NOx. In this experiment due in part to the non-functioning water cannons furnace NOx could be considered a constant. One may infer from the results that sootblowing in the upper and backpasses have measurable albeit minimal affects on NOx reductions. Thus in future NOx or efficiency projects, the sootblowing patterns should not be dismissed and in fact need to be detailed as to their effect in order to have a comprehensive analysis on any such future project. 6.2. Sensor Integration
As stated above the experimental sensors and calculations were at times overlapping in the information they provided. Thus two lessons can be learned; one is that furnace gas exit temperature (FGET) is an important measurement and the repeatability and reliability of the sensor/signal may be more valuable rather than its absolute accuracy. Secondly, for future experimentation there was a benefit in that overlapping measurements allowed contingency project paths and analysis, but also fully installed projects may choose from the sensor technology that most suits their interest and unit configuration, rather than needing all sensors on all units.
6.3. Sootblowing Maintenance
This report supports the conclusion that sootblowing is important to emissions reductions, capital (boiler) preservation, as well as variable cost of operations (efficiency). Accordingly, it supports periodic review of the maintenance budgets for the sootblowing equipment. While the project showed that the NN-ISB can optimize around out-of-service sootblowers it cannot replace the physical cleaning of the related boiler areas.
47

7. COMMERCIAL REVIEW The NN-ISB vendor, Pegasus has been active in the development of the market using this technology. A marketing plan has been outlined for the sales of the Neural Network Intelligent Sootblowing Offering to electricity generating organizations that primarily operate coal-fired units. They expect a high degree of market success based on the plan to key in on a sector of this market that has not been addressed to date. Many executives in generating companies have expressed the desire to be able to operate in the most optimal manner and generally would embrace a solution that provides such capabilities. The NN-ISB provides generating companies an integrated solution that will assist in optimal economic and environmental real-time online operation of a unit. It is modular in design and can be readily applied to a variety of power generating units. The solution architecture and infrastructure allows full or staged deployment depending on the generating companies needs (plans, schedule and budget). The technology applied throughout allows unit flexibility (i.e. existing systems can be integrated within the overall solution) and is extensible (new modules/new equipment can be readily modeled and incorporated), allowing future changes in physical equipment and lowest “life-cycle” costs. This minimizes the system requirements and helps to facilitate employing a NN-ISB system . As noted, this project was operated as a full-scale demonstration. As such, it provided an opportunity to evaluate various benefits, which will in whole or part be transferred directly or extrapolated for use not only on mid-sized utility boilers but also small and large alike. The benefits, which have been demonstrated when used in conjunction with the Pegasus NeuSIGHT combustion optimizer as an operating platform, have yielded benefits in emissions of NOx, efficiency, and opacity albeit compromised by the lack of the water cannon and other key components intended for this project. The integration of a NN-ISB has shown the potential to provide benefits beyond that realized with a manual sequencing protocol. This not only includes NOx and efficiency, but also benefits to unit operations such as a higher integration of sootblowing systems, less total sootblowing and the associated less wear and tear on SB equipment. Based upon the equipment already installed at a particular location the return on investment may be quick. This type of project should provide significant benefits to not only U.S. utilities, but to utilities worldwide. 7.1. Demonstration Benefits Based on the results of this demonstration project it has been shown that the NN-ISB demonstrated optimization of the soot blowing system and boiler combustion characteristics as follow:
• Perform soot blowing operation to stabilize the unit • Maintain or improve heat rate within the constraints of required unit operational limits • Optimize the operation of the soot blowing hardware to ensure that optimal soot blowing
occurs throughout the full load range of the boiler.
48

• Potential reduction in NOx emissions • Potential reduction in opacity • Reduced auxiliary power consumption • Incorporate known knowledge and first principles relationships to check and validate current
state of boiler and provide input to control and optimization system to ensure constraints relating to specific boiler zones are consistent and not violated.
• Minimize over-blowing and associated tube-wear • Remain within safety and combustion operations constraints at all times 7.2. Application Economics The following section provides a description and explanation of the economic and operating assumptions for the project. The Big Bend Unit Station maintains four coal-fired utility boilers. Three boilers are 445 MW Riley Turbo® opposed wall wet bottom fired units, and one is a 486 MW Combustion Engineering tangential fired coal unit. Depending on capacity factor, the NOx emitted from each unit range from an estimated 6,000-8,700 tons based on 1999 emissions from the EPA Acid Rain website. The coal burned in each unit is estimated at 1 million tons per year and for illustrative purposes assumed to be $40 per ton, which could be representative of coal prices in the industry. Based upon these assumptions for every 10% NOx reduction an annual reduction of 600 tons would be realized. If TECO were allowed to participate in a NOx trading program (which is not permitted) and using the November 2004 price of $3,625 per ton, this would have amounted to a revenue stream of $2,175,000. Efficiency improvements also can provide savings to a utility. Again using the assumptions stated above, coal consumption at 1 million tons and assuming a heat rate improvement of 1% (10,000 tons) would amount to annual savings of $400,000. The efficiency improvement would also result in a 1% reduction of SO2 and CO2. 7.3. TECO Specific Benefits The demonstration of this project at the Big Bend electric generating facility provided Tampa Electric the opportunity to increase its awareness and understanding of the role that sootblowing activities contribute to the improvement of NOx, heat rate and opacity. Whereas the water cannon portion of this project proved to be unsuccessful and significantly compromised the level of obtainment of the project goals several improvements were identified. The most significant portion of the project involved the restructuring of the sootblowing groups to smaller and specific groups. Regardless of whether the NN-ISB was in or out-of-service this provided for improved cleaning and also a reduction in steam consumption. In addition, the coordinated control used for sootblowing activities as provided by the NN-ISB did provide for better stabilization of unit operation as compared to the former mode of sootblowing operation wherein the operator would initiate a master command to run all blowers. Although many of the project objectives resulted in no to marginal improvements it is intuitively clear that intelligent sootblowing practices can provide increased benefits as compared to time or simple rule-based routines.
49

7.4. Economic Benefits to the United States The following project goals were stated in the original proposal and were achieved in varying stages of success. • Promote the use of coal in a more environmentally friendly manner. By making the use of
coal more fuel-efficient it automatically reduces all pollutants on a per megawatt basis. In addition the significant reduction in NOx and PM emissions will lower the resistance to the use of coal as an energy supply fuel.
• Rapid deployment into the market. All coal-fired boilers employ the use of soot blowers.
These soot blowers all require control systems. The present control systems cannot obtain these results. This product is essentially a soot blower control system whose chief advantage is the software it employs. No new hardware needs to be developed although the installations may need to purchase new computers. All of the hardware is of the ‘off the shelf’ type. This was accomplished and there has already been significant commercial interest in the domestic market.
• Universal acceptance. All coal fired boilers employ soot blowers that need control systems.
The advantages of this system have been desired by the entire fleet of coal fired boilers and have been extremely cost effective. The fuel savings and avoided NOx reduction control costs could provide rapid returns on investment.
• Reduced all emissions on a per MW basis. This includes green house gas emissions,
providing coal with another reduction in its environmental disadvantage to natural gas. • US revenues expanded through worldwide market acceptance. The same rapid deployment
capability and acceptance will apply to offshore coal fired boilers. Since the US is presently the world leader in Artificial Intelligence (AI) of which these neural network systems are a subset there should be minimal competition from offshore suppliers.
50

8. CONCLUSION
8.1. Body of Conclusion
This DOE sponsored project facilitated successful demonstration of a neural network based intelligent sootblowing (NN-ISB) system at Tampa Electric Company's Big Bend Power Station Unit #2. The NN-ISB system was made available for closed-loop (automatic) control around the clock and under various unit operating conditions. The system optimizes sootblowing and combustion characteristics of a coal-fired power plant by adjusting several boiler parameters as well as sootblower activation signals through the control system(s). The NN-ISB simultaneously achieves multiple process improvement objectives. The main quantifiable objectives of the intelligent sootblowing system for this project were to reduce NOx emissions, PM emissions and improve efficiency. System operation in closed-loop mode versus open-loop (manual mode) during the demonstration period indicated improvements in the targeted key parameters as well as other secondary benefits,. Overall the NOx emission reductions recorded by the NN-ISB application achieved nil to 8.5% which included a variety of operating conditions. Efficiency improvements of 10 BTU/kWhr at high load and 50 BTU/kWhr at low load were shown when comparing the open-loop to closed-loop NN-ISB tests. The recorded efficiency improvement for the NN-ISB in closed-loop operation versus the 2002 baseline values indicated 20 BTU/kWhr at comparable high load points and up to 420 BTU/kWhr at low loads, however several other factors may have contributed to these values. There was also measurable benefit for efficiency brought about by the redistribution of sootblowing steam and the ensuing average reduction of steam usage. The analysis of opacity data depicted in figure 20 shows a reduction of nil to 1.5% over the range during sootblowing activities.
In addition to the main benefits, several other secondary benefits were also observed. These included; • The total sootblower work was lower with the optimization system engaged. This
reduction in sootblower usage should help sootblower maintenance as well as tube erosion.
• Full integration of sensors technology and optimization was completed. This proves that the islands of automation can and should be eliminated to provide the overall best results.
• The Human Machine Interface portion of the project was improved for daily operation. • The boiler drum and pressure operation was qualitatively stated by the operators to be
improved especially in specific conditions where they previously had difficulty. • Steam tube temperatures benefited and showed less deviation at high load conditions
where this can be a critical parameter.
51

8.2. Unit Breadth of Operation Normal runtime application has shown closed-loop application covering a good breadth of unit operation. Most of the major fuels typically purchased by the plant have been used during these periods. This is partially shown in the fuels table 2 shown earlier in this report. The load variations ranged over the full spread of the unit and have included new high loads since the October 2002 outage as well as lower than average loads to accommodate condenser maintenance work. Unit condition variations have occurred over the past months consistent with normal plant maintenance. These include work on the mills, and the afore mentioned condenser work, instrument repair and calibration. Thus the breadth of operation was wide and meaningful in carrying forward these results to other units of the domestic and international fleet.
Appendixes A1 HISTORICAL MONTHLY REPORTS A2 CLYDE BERGEMANN WATER CANNON TEST RESULTS
1A3 SOLVERA/STOCK REPORT ON THE SLAG SENSORS
52
APPENDIX I
HISTORICAL MONTHLY REPORTS
2

3
Requested Upcoming Assistance, detail of any Obstacles: Pegasus has identified and reported problems with cleanliness factor calcs generated by EtaPRO. As configured
currently the calcs are of limited value to ISB implementation. As of December 1, 2003 General Physics data is
Tampa Electric, Neural Network Sootblowing Project UpdateNovember 30, 2003
This information is being provided to you pursuant to the reporting requirements of Contract #BBX-09-02-02109 between Tampa Electric Company (TECO) and Pegasus Technologies, Inc. (Pegasus). If you have any questions on the information please contact: Neel Parikh (440) 358-7397 Dave Wroblewski (440) 358-7039 Peter Reck (440) 357-7794 TECO Sootblowing - job #132 Completed Progress and Activity to date:
P.O. issued, Kickoff meeting for the project held at site. Obtained Sootblowing related Checklist information from customer. Obtained revised I/O list from customer. Review information and seek clarifications. I/O list finalized. Data communications and networking layout and requirements reviewed and agreed upon with customer. Sun system and relevant peripherals acquired, installed and delivered to plant site. Development and testing of datalink to Solvera system. Interfaced with Solvera and Clyde Bergemann to resolve data communications and system setup issues. Reviewed boiler cleanliness information requirements with customer. EtaPRO information received. EtaPRO boiler cleanliness data quality report submitted to customer. NeuSIGHT® workstation configured and installed at site. Input datalink communications to WDPF, PI and Solvera systems is functional. Output datalink verified using temporary tags. Technical review, evaluation, analysis and research related to 2nd stage processing and AI techniques. In progress. Software development activities pertaining to 2nd stage processing techniques are in progress. Literature review and patent search to ensure uniqueness and differentiation of the proposed technology. Finalized a sub-contract with PCS to implement ACM software. ACM software implementation is in progress. I/O list for monitoring approved by TECO. Participated in project meetings at site. Provided relevant information and updates. Prepared and presented a joint paper at the Electric Power 2003 conference and the PowerGen 2003 conference. Parametric testing at site based on unit availability and maintenance activities. In progress. (eg.water cannons, sub groups) Data analysis and visualization. This is an ongoing activity. Develop neural network models and validate relationships. This is an ongoing activity. Initiated closed-loop operation of available combustion parameters. Regularly issued SB status reports for maintenance purposes. Prepared and presented reports outlining project status and key observations. Completed training session with plant operators and engineers on use of the Pegasus optimization system. Obtained selected baseline data in electronic format from TECO.
This months completed activities: Continued with checkout and PRELIMINARY tuning of pre, post, PdbCALCS logic and trigger conditions for
supporting closed-loop operation based on 1st stage neural network model. Conducted limited advisory mode testing with available parameters. Pegasus was constrained due to unit
availability problems. Made progress with ACM implementation tasks. Proposed on-site ACM training dates. Awaiting TECO feedback. Pegasus submitted and TECO approved parametric test plan encompassing Pegasus suggested sootblower sub-
groups and longer dwell times. Pegasus plans to conduct parametric testing per this approved plan as soon as the unit becomes available.
Collaborated with Solvera/Stock Equipment to support resolution of obstacles/issues identified. Obtained selected baseline data in electronic format from TECO. Software development activities continued to progress. Furnished information to support PowerGen paper presentation.

Tampa Electric, Neural Network Sootblowing Project UpdateJanuary 31, 2004
This information is being provided to you pursuant to the reporting requirements of Contract #BBX-09-02-02109 between Tampa Electric Company (TECO) and Pegasus Technologies, Inc. (Pegasus). If you have any questions on the information please contact: Neel Parikh (440) 358-7397 Dave Wroblewski (440) 358-7039 Mark Coffin (865) 310-3858 TECO Sootblowing - job #132 Completed Progress and Activity to date:
P.O. issued, Kickoff meeting for the project held at site. Obtained Sootblowing related Checklist information from customer. Obtained revised I/O list from customer. Review information and seek clarifications. I/O list finalized. Data communications and networking layout and requirements reviewed and agreed upon with customer. Sun system and relevant peripherals acquired, installed and delivered to plant site. Development and testing of datalink to Solvera system. Interfaced with Solvera and Clyde Bergemann to resolve data communications and system setup issues. Reviewed boiler cleanliness information requirements with customer. EtaPRO information received. EtaPRO boiler cleanliness data quality report submitted to customer. NeuSIGHT® workstation configured and installed at site. Input datalink communications to WDPF, PI and Solvera systems is functional. Output datalink verified. Technical review, evaluation, analysis and research related to 2nd stage processing and AI techniques. In progress. Software development activities pertaining to 2nd stage processing techniques are in progress. Literature review and patent search to ensure uniqueness and differentiation of the proposed technology. Finalized a sub-contract with PCS to implement ACM software. ACM software implementation is in progress. I/O list for monitoring approved by TECO. Participated in project meetings at site. Provided relevant information and updates. Prepared and presented a joint paper at the Electric Power 2003 conference and the PowerGen 2003 conference. Parametric testing at site based on unit availability and maintenance activities. In progress. (eg.water cannons, sub groups) Data analysis and visualization. This is an ongoing activity. Develop neural network models and validate relationships. This is an ongoing activity. Initiated closed-loop operation of available combustion parameters. Regularly issued SB status reports for maintenance purposes. Prepared and presented reports outlining project status and key observations. Completed training session with plant operators and engineers on use of the Pegasus optimization system. Obtained selected baseline data in electronic format from TECO. Pegasus identified and reported problems with cleanliness factor calcs generated by EtaPRO. As configured currently the
calcs are of limited value to ISB implementation. As of December 1, 2003 General Physics data was not usable and hence as notified to TECO earlier, Pegasus has moved on to using an alternate set of boiler and calculated parameters to support modeling and system operation over the entire load range.
This months completed activities: Continued closed-loop testing with available parameters and unit operating conditions. Very limited amount of parametric testing could be conducted due to unit availability issues. Continued with checkout and tuning of pre, post, PdbCALCS logic and trigger conditions for supporting closed-
loop operation based on 1st stage neural network model. Processing logic modifications are in progress to support parametric testing with two element pairs of blowers.
Analyzed parametric test data and worked on report. Made progress with ACM implementation tasks. The software changes made by Solvera on Dec 22, 2003 incorrectly altered the indexing of other tags, hence the
tag IDs and relevant descriptions didn't match. Pegasus coordinated with Solvera to fix and test this problem. Solvera software needed modifications to send right 'bit' indicating SB system was in remote (Pegasus) mode.
4Pegasus coordinated with Solvera to fix and test this problem.
Continued with review, research and documentation of ISB processing techniques.
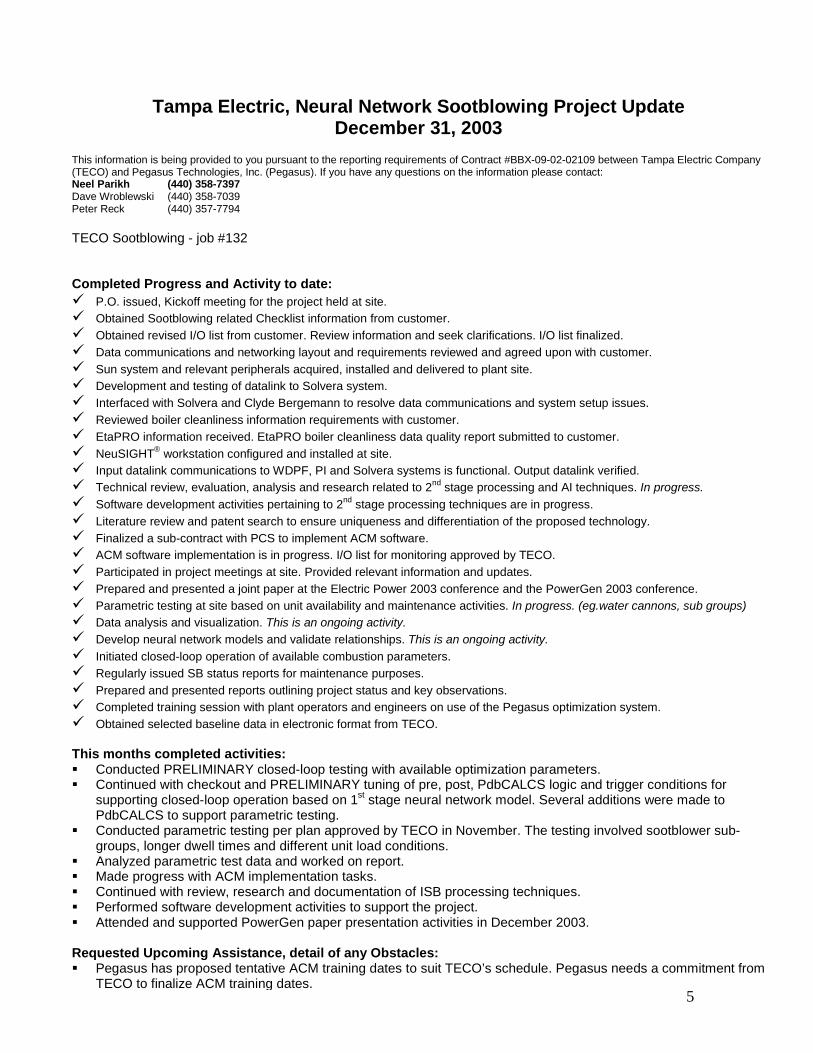
Tampa Electric, Neural Network Sootblowing Project UpdateDecember 31, 2003
This information is being provided to you pursuant to the reporting requirements of Contract #BBX-09-02-02109 between Tampa Electric Company (TECO) and Pegasus Technologies, Inc. (Pegasus). If you have any questions on the information please contact: Neel Parikh (440) 358-7397 Dave Wroblewski (440) 358-7039 Peter Reck (440) 357-7794 TECO Sootblowing - job #132 Completed Progress and Activity to date:
P.O. issued, Kickoff meeting for the project held at site. Obtained Sootblowing related Checklist information from customer. Obtained revised I/O list from customer. Review information and seek clarifications. I/O list finalized. Data communications and networking layout and requirements reviewed and agreed upon with customer. Sun system and relevant peripherals acquired, installed and delivered to plant site. Development and testing of datalink to Solvera system. Interfaced with Solvera and Clyde Bergemann to resolve data communications and system setup issues. Reviewed boiler cleanliness information requirements with customer. EtaPRO information received. EtaPRO boiler cleanliness data quality report submitted to customer. NeuSIGHT® workstation configured and installed at site. Input datalink communications to WDPF, PI and Solvera systems is functional. Output datalink verified. Technical review, evaluation, analysis and research related to 2nd stage processing and AI techniques. In progress. Software development activities pertaining to 2nd stage processing techniques are in progress. Literature review and patent search to ensure uniqueness and differentiation of the proposed technology. Finalized a sub-contract with PCS to implement ACM software. ACM software implementation is in progress. I/O list for monitoring approved by TECO. Participated in project meetings at site. Provided relevant information and updates. Prepared and presented a joint paper at the Electric Power 2003 conference and the PowerGen 2003 conference. Parametric testing at site based on unit availability and maintenance activities. In progress. (eg.water cannons, sub groups) Data analysis and visualization. This is an ongoing activity. Develop neural network models and validate relationships. This is an ongoing activity. Initiated closed-loop operation of available combustion parameters. Regularly issued SB status reports for maintenance purposes. Prepared and presented reports outlining project status and key observations. Completed training session with plant operators and engineers on use of the Pegasus optimization system. Obtained selected baseline data in electronic format from TECO.
This months completed activities: Conducted PRELIMINARY closed-loop testing with available optimization parameters. Continued with checkout and PRELIMINARY tuning of pre, post, PdbCALCS logic and trigger conditions for
supporting closed-loop operation based on 1st stage neural network model. Several additions were made to PdbCALCS to support parametric testing.
Conducted parametric testing per plan approved by TECO in November. The testing involved sootblower sub-groups, longer dwell times and different unit load conditions.
Analyzed parametric test data and worked on report. Made progress with ACM implementation tasks. Continued with review, research and documentation of ISB processing techniques. Performed software development activities to support the project. Attended and supported PowerGen paper presentation activities in December 2003.
Requested Upcoming Assistance, detail of any Obstacles:
5
Pegasus has proposed tentative ACM training dates to suit TECO’s schedule. Pegasus needs a commitment from TECO to finalize ACM training dates.

Tampa Electric, Neural Network Sootblowing Project UpdateFebruary 29, 2004
This information is being provided to you pursuant to the reporting requirements of Contract #BBX-09-02-02109 between Tampa Electric Company (TECO) and Pegasus Technologies, Inc. (Pegasus). If you have any questions on the information please contact: Neel Parikh (440) 358-7397 Dave Wroblewski (440) 358-7039 Mark Coffin (865) 310-3858 TECO Sootblowing - job #132 Completed Progress and Activity to date:
P.O. issued, Kickoff meeting for the project held at site. Obtained Sootblowing related Checklist information from customer. Obtained revised I/O list from customer. Review information and seek clarifications. I/O list finalized. Data communications and networking layout and requirements reviewed and agreed upon with customer. Sun system and relevant peripherals acquired, installed and delivered to plant site. Developed and tested datalink to Solvera system. Interfaced with Solvera and Clyde Bergemann to resolve data communications and system setup issues. Reviewed boiler cleanliness information requirements with customer. NeuSIGHT® workstation configured and installed at site. Input datalink communications to WDPF, PI and Solvera systems is functional. Output datalink verified. Technical review, evaluation, analysis, research and software development related to 2nd stage processing and AI techniques.
In progress. Literature review and patent search to ensure uniqueness and differentiation of the proposed technology. Finalized a sub-contract with PCS to implement ACM software. ACM software implementation is in progress. I/O list for monitoring approved by TECO. Participated in project meetings at site. Provided relevant information and updates. Prepared and presented a joint paper at the Electric Power 2003 conference and the PowerGen 2003 conference. Parametric testing at site based on unit availability and maintenance activities. In progress. (eg.water cannons, sub groups) Data analysis and visualization. This is an ongoing activity. Develop neural network models and validate relationships. This is an ongoing activity. Initiated closed-loop operation of available combustion parameters. Regularly issued SB status reports for maintenance purposes. Prepared and presented reports outlining project status and key observations. Completed training session with plant operators and engineers on use of the Pegasus optimization system. Obtained selected baseline data in electronic format from TECO. Pegasus identified and reported problems with cleanliness factor calcs generated by EtaPRO. As configured currently the
calcs are of limited value to ISB implementation. As of December 1, 2003 General Physics data was not usable and hence as notified to TECO earlier, Pegasus has moved on to using an alternate set of boiler and calculated parameters to support modeling and system operation over the entire load range.
Implemented and verified automated parametric test methods to support efficient testing and project execution. This months completed activities: Modified PdbCALCS processing logic to support automated parametric testing with two element pairs of blowers. Prepared and submitted a parametric test plan for testing with two element pairs of blowers. Plan approved by
TECO personnel. Initiated parametric testing with two element pairs of sootblowers and varying deadtimes between blower
operations. Per agreement with TECO, this is intended to free up the top down association of blower rules. Continued with checkout and tuning of pre, post, PdbCALCS logic and trigger conditions for supporting closed-
loop operation based on 1st stage neural network model. Analyzed parametric test data and generated a report including observations from test runs with four sootblowers
per group. The report was submitted to TECO personnel. Coordinated with TECO and PCS to schedule ACM training at site in the 2nd week of March.
6 Continued with review, research and documentation of ISB processing techniques. The service rules and
evaluation will allow an optimal path to be achieved while accounting for OOS blowers, header limits, time limits

Tampa Electric, Neural Network Sootblowing Project UpdateOctober 31, 2003
This information is being provided to you pursuant to the reporting requirements of Contract #BBX-09-02-02109 between Tampa Electric Company (TECO) and Pegasus Technologies, Inc. (Pegasus). If you have any questions on the information please contact: Neel Parikh (440) 358-7397 Dave Wroblewski (440) 358-7039 Peter Reck (440) 357-7794 TECO Sootblowing - job #132 Completed Progress and Activity to date:
P.O. issued, Kickoff meeting for the project held at site. Obtained Sootblowing related Checklist information from customer. Obtained revised I/O list from customer. Review information and seek clarifications. I/O list finalized. Data communications and networking layout and requirements reviewed and agreed upon with customer. Sun system and relevant peripherals acquired, installed and delivered to plant site. Development and testing of datalink to Solvera system. Interfaced with Solvera and Clyde Bergemann to resolve data communications and system setup issues. Reviewed boiler cleanliness information requirements with customer. EtaPRO information received. EtaPRO boiler cleanliness data quality report submitted to customer. NeuSIGHT® workstation configured and installed at site. Input datalink communications to WDPF, PI and Solvera systems is functional. Output datalink verified using temporary tags. Technical review, evaluation, analysis and research related to 2nd stage processing and AI techniques. In progress. Software development activities pertaining to 2nd stage processing techniques are in progress. Literature review and patent search to ensure uniqueness and differentiation of the proposed technology. Finalized a sub-contract with PCS to implement ACM software. ACM software implementation is in progress. I/O list for monitoring approved by TECO. Participated in project meetings at site. Provided relevant information and updates. Prepared and presented a joint paper at the Electric Power 2003 conference. Parametric testing at site based on unit availability and maintenance activities. In progress. (eg.water cannons, sub groups) Data analysis and visualization. This is an ongoing activity. Develop neural network models and validate relationships. This is an ongoing activity. Initiated closed-loop operation of available combustion parameters. Regularly issued SB status reports for maintenance purposes. Prepared and presented reports outlining project status and key observations. Completed training session with plant operators and engineers on use of the Pegasus optimization system.
This months completed activities: Developed, commissioned and began checkout of PRELIMINARY pre, post, PdbCALCS logic and trigger
conditions for supporting closed-loop operation based on 1st stage neural network model. Advisory mode testing with available parameters. Started closed-loop testing with available combustion parameters. Collaborated with project partners to support resolution of obstacles/issues identified. Continued review, research and documentation of 2nd stage processing techniques. Software development activities continue to progress. Continued with ACM implementation tasks. Collected and analyzed relevant data. I/O list for data validation
submitted to customer for approval. Requested selected baseline data in electronic format from TECO.
Requested Upcoming Assistance, detail of any Obstacles: Completion of necessary work to be done by Clyde Bergemann (CB). Understand a unit outage is required. This
is a critical path item for parametric testing pertaining to furnace area cleaning. Pegasus is barred from progress
7
in this area until critical path is cleared. Pegasus has identified and reported problems with cleanliness factor calcs generated by EtaPRO. As configured
currently the calcs are of limited value to ISB implementation. Pegasus is awaiting resolution of this matter

Tampa Electric, Neural Network Sootblowing Project UpdateSeptember 30, 2003
This information is being provided to you pursuant to the reporting requirements of Contract #BBX-09-02-02109 between Tampa Electric Company (TECO) and Pegasus Technologies, Inc. (Pegasus). If you have any questions on the information please contact: Neel Parikh (440) 358-7397 Dave Wroblewski (440) 358-7039 Jim Donegan (610) 430-3525 TECO Sootblowing - job #132 Completed Progress and Activity to date:
P.O. issued, Kickoff meeting for the project held at site. Obtained Sootblowing related Checklist information from customer. Obtained revised I/O list from customer. Review information and seek clarifications. Data communications and networking layout and requirements reviewed and agreed upon with customer. Sun system and relevant peripherals acquired, installed and delivered to plant site. Development and testing of datalink to Solvera system. Interfaced with Solvera and Clyde Bergemann to resolve data communications and system setup issues. Reviewed boiler cleanliness information requirements with customer. EtaPRO information received. NeuSIGHT® workstation configured and installed at site. Input datalink communications to WDPF, PI and Solvera systems is functional. Output datalink verified using temporary tags. Technical review, evaluation, analysis and research related to 2nd stage processing and AI techniques. In progress. Software development activities pertaining to 2nd stage processing techniques are in progress. Literature review and patent search to ensure uniqueness and differentiation of the proposed technology. Finalized a sub-contract with PCS to implement ACM software. ACM software implementation is in progress. Participated in project meetings at site. Provided relevant information and updates. Prepared and presented a joint paper at the Electric Power 2003 conference. Parametric testing at site based on unit availability and maintenance activities. In progress. (eg.water cannons, sub groups) Data analysis and visualization. This is an ongoing activity. Develop neural network models and validate relationships. This is an ongoing activity. Initiated closed-loop operation of available combustion parameters. Regularly issued SB status reports for maintenance purposes. Prepared and presented a report outlining project status and key observations.
This months completed activities: Data analysis and 1st stage neural network modeling using parametric test and operational data. Extensive work related to developing processing logic to support 1st stage neural network model. Preliminary 1st stage model installation at site. Advisory mode testing using preliminary 1st stage model. Support issues related to closed-loop operation of the combustion optimization parameters. Continued review and research of 2nd stage processing techniques. Collaborate with project partners to resolve outstanding data communications issues. Making progress with ACM software implementation tasks, 199 tag approval request sent to TECO Prepared a detailed report and presented status at project review meeting (Sept 25th) at plant site. Completed training session with plant operators and engineers on use of the Pegasus optimization system. Software development activities continue to progress. Prepared and provided supporting material for joint TECO and Pegasus PowerGen 2003 Paper.
Requested Upcoming Assistance, detail of any Obstacles: Completion of necessary work to be done by Clyde Bergemann (CB). Understand a unit outage is required. This
is a critical path item for parametric testing pertaining to furnace area cleaning. Pegasus is barred from progress in this area until critical path is cleared.
8

Tampa Electric, Neural Network Sootblowing Project UpdateJuly 31, 2003
This information is being provided to you pursuant to the reporting requirements of Contract #BBX-09-02-02109 between Tampa Electric Company (TECO) and Pegasus Technologies, Inc. (Pegasus). If you have any questions on the information please contact: Neel Parikh (440) 358-7397 Jim Donegan (610) 430-3525 TECO Sootblowing - job #132 This months completed activities: Data preparation and analysis for 1st stage neural network model. Examine parameter relationships and develop preliminary neural network models for the 1st stage. Initiate closed-loop operation of the combustion optimization parameters. Support closed-loop testing at site. Make progress with ACM software implementation tasks. Software development activities in progress. Send an email regularly, indicating SB availability status.
Requested Upcoming Assistance, detail of any Obstacles: Completion of necessary work to be done by Clyde Bergemann (CB). Understand a unit outage is required. This
is a critical path item for parametric testing pertaining to furnace area cleaning. A reliable data communication scheme between Solvera and CB systems is necessary. Pegasus requests
TECO’s assistance in resolving this issue. Pegasus suggests implementing a direct datalink with CB system to ensure reliable data communications with a key component of the closed-loop ISB system.
“BAD” values were noticed for Boiler cleanliness calculations facilitated by EtaPRO software over a significant portion of time in July. This is likely due to the modified calculation approach EtaPRO is using. Need TECO’s support and lead role in resolving this issue. This is a critical path item.
Sootblower maintenance and availability has gotten better. Reliability is still an issue. Unless resolved, it will affect test duration, repeatability and potentially results.
Pegasus request’s assistance for unit availability for some parametric and closed-loop testing during August and September.
Pegasus needs agreed upon baseline data in electronic format for analysis and reporting. Planned activities for next month: Data analysis and 1st stage neural network modeling using parametric test and operational data. Closed loop testing with available combustion parameters. Develop processing logic to support 1st stage neural network model. Parametric testing at site after issues with Water Cannon system are resolved. Will include testing of combustion
parameters and furnace area cleaning. Collaborate with project partners to resolve outstanding data communications issues. Review, research and document 2nd stage processing techniques. Software development activities to support the project. Continue with ACM implementation tasks. Collect relevant data. Obtain selected baseline data in electronic format from TECO.
Completed Progress and Activity to date:
P.O. issued, Kickoff meeting for the project held at site. Obtained Sootblowing related Checklist information from customer. Obtained revised I/O list from customer. Review information and seek clarifications. Data communications and networking layout and requirements reviewed and agreed upon with customer. Sun system and relevant peripherals acquired, installed and delivered to plant site. Development and testing of datalink to Solvera system. Interfaced with Solvera and Clyde Bergemann to resolve data communications and system setup issues. Reviewed boiler cleanliness information requirements with customer. EtaPRO information received. NeuSIGHT® workstation configured and installed at site. Input datalink communications to WDPF, PI and Solvera systems is functional. Output datalink verified using temporary tags.
9 Technical review, evaluation, analysis and research related to 2nd stage processing and AI techniques. In progress. Software development activities pertaining to 2nd stage processing techniques are in progress. Literature review and patent search to ensure uniqueness and differentiation of the proposed technology.

Tampa Electric, Neural Network Sootblowing Project UpdateJune 30, 2003
This information is being provided to you pursuant to the reporting requirements of Contract #BBX-09-02-02109 between Tampa Electric Company (TECO) and Pegasus Technologies, Inc. (Pegasus). If you have any questions on the information please contact: Neel Parikh (440) 358-7397 Jim Donegan (610) 430-3525 TECO Sootblowing - job #132 This months completed activities: Conducted parametric testing at site around unit availability and maintenance activities. Unit availability for testing
was extremely limited due to maintenance and weather related unit loading issues. Analyze data and parametric test conditions/observations and generate reports identifying key observations and
opportunities. Work on data preparation and analysis for 1st stage neural network model. Develop preliminary neural network models and validate relationships. Analyze data and identify problems with data values from EtaPRO system. Pursue resolution of relevant issues
with General Physics with support from TECO. Interface with TECO personnel to facilitate (a) VPN capability, (b) email capability for monitoring system operation
and events. Software development activities in progress. Send an email daily, indicating SB availability status.
Requested Upcoming Assistance, detail of any Obstacles: Completion of necessary work to be done by Clyde Bergemann. Understand a unit outage is required. This is a
critical path item for parametric testing pertaining to furnace area cleaning. Sootblower maintenance and availability has gotten better. Reliability is still an issue. Unless resolved, it will affect
test duration, repeatability and potentially results. Pegasus request’s assistance for unit availability for parametric testing during July and August. Need to agree on and select appropriate baseline data. Pegasus needs agreed upon baseline data in electronic
format for analysis and reporting. Planned activities for next month: Parametric testing at site after issues with Water Cannon system are resolved. Will include testing of combustion
parameters and furnace area cleaning. Data analysis and 1st stage neural network modeling using parametric test and operational data. Daily email indicating SB availability status. Provide periodic reports showing key observations and analysis of the parametric test setups. Software development activities to support the project. Finalize list of tags for data validation using ACM. Continue with ACM implementation tasks. Collect relevant data. Obtain selected baseline data in electronic format from TECO.
Completed Progress and Activity to date:
P.O. issued, Kickoff meeting for the project held at site. Obtained Sootblowing related Checklist information from customer. Obtained revised I/O list from customer. Review information and seek clarifications. Data communications and networking layout and requirements reviewed and agreed upon with customer. Sun system and relevant peripherals acquired, installed and delivered to plant site. Development and testing of datalink to Solvera system. Some issues pending resolution by Solvera. Interfaced with Solvera and Clyde Bergemann to resolve data communications and system setup issues. Reviewed boiler cleanliness information requirements with customer. EtaPRO information received. Correct Information
relevant to Clyde Bergemann system is pending. NeuSIGHT® workstation configured and installed at site. Bi-directional data communications verified using temporary WDPF, PI and Solvera tags.
10 Technical review, evaluation, analysis and research related to 2nd stage processing and AI techniques. In progress. Software development activities pertaining to 2nd stage processing techniques initiated. Literature review and patent search to ensure uniqueness and differentiation of the proposed technology.

Tampa Electric, Neural Network Sootblowing Project UpdateMay 31, 2003
This information is being provided to you pursuant to the reporting requirements of Contract #BBX-09-02-02109 between Tampa Electric Company (TECO) and Pegasus Technologies, Inc. (Pegasus). If you have any questions on the information please contact: Neel Parikh (440) 358-7397 Jim Donegan (610) 430-3525 TECO Sootblowing - job #132 This months completed activities: Data tags that became available at the end of April were added to the NeuSIGHT I/O list and checked for validity. Analyze data and identify problems with data values from Solvera, Clyde Bergemann and EtaPRO systems.
Pursue resolution of relevant issues with the respective vendors with support from TECO. 2 weeks of parametric testing at site. Interface with TECO personnel and resolve operational issues. Analyze data and parametric test conditions/observations and generate a report identifying key observations and
opportunities. Review with TECO personnel. Support meetings at plant site to discuss testing and operational issues as well as ACM implementation. Basic installation of ACM data validation software at site. PCS working to resolve data communications issues. Software development activities in progress.
Requested Upcoming Assistance, detail of any Obstacles: Completion of necessary work to be done by Clyde Bergemann. Understand a unit outage is required. This is a
critical path item for parametric testing pertaining to furnace area cleaning. Sootblower maintenance and availability is an issue. Unless resolved, it will affect test duration, repeatability and
potentially results. Pegasus request’s assistance for unit availability for parametric testing during June and July. Need to agree on a baseline criteria and select appropriate data. Pegasus needs agreed upon baseline data in
electronic format for analysis and reporting. Planned activities for next month: Parametric testing at site. Will include testing of available sootblowers and combustion parameters. Data analysis and preliminary modeling using parametric test and operational data. Daily email indicating SB availability status. Provide periodic reports showing key observations and analysis of the parametric test setups. Software development activities to support the project. Review and agree upon list of tags for data validation using ACM. Discuss and agree upon baseline criteria and select appropriate data. Obtain relevant data from TECO.
Completed Progress and Activity to date:
P.O. issued, Kickoff meeting for the project held at site. Obtained Sootblowing related Checklist information from customer. Obtained revised I/O list from customer. Review information and seek clarifications. Data communications and networking layout and requirements reviewed and agreed upon with customer. Sun system and relevant peripherals acquired, installed and delivered to plant site. Development and testing of datalink to Solvera system. Some issues pending resolution by Solvera. Interfaced with Solvera and Clyde Bergemann to resolve data communications and system setup issues. Reviewed boiler cleanliness information requirements with customer. EtaPRO information received. Correct Information
relevant to Clyde Bergemann system is pending. NeuSIGHT® workstation configured and installed at site. Bi-directional data communications verified using temporary WDPF, PI and Solvera tags. Technical review, evaluation, analysis and research related to 2nd stage processing and AI techniques. In progress. Software development activities pertaining to 2nd stage processing techniques initiated. Literature review and patent search to ensure uniqueness and differentiation of the proposed technology. Finalized a sub-contract with PCS to implement ACM software.
11
Participate in project meetings at site. Provide relevant information and updates. Prepared and presented a joint paper at the Electric Power 2003 conference. Initiated parametric testing at site. Data analysis and visualization. This is an ongoing activity.

Tampa Electric, Neural Network Sootblowing Project UpdateApril 30, 2003
This information is being provided to you pursuant to the reporting requirements of Contract #BBX-09-02-02109 between Tampa Electric Company (TECO) and Pegasus Technologies, Inc. (Pegasus). If you have any questions on the information please contact: Neel Parikh (440) 358-7397 Jim Donegan (610) 430-3525 TECO Sootblowing - job #132 This months completed activities: Configure NeuSIGHT system with available tags and initiate collection. Several tags are expected to become
available in April and will be added at that time. Verify data values for available tags. Identify problem areas. Support resolution of data communications issues involving Solvera and Clyde Bergemann. Support Pegasus-Solvera data communications test setup at Pegasus offices in Mentor, OH. Obtained detailed unit operations information from customer. Generated parametric test plan. Reviewed with TECO and made adjustments per customer feedback. Parametric
testing scheduled to start in early May. Support meeting at site to discuss ISB approach and test plans. Documentation and further definition of the new AI and processing techniques. Preliminary software development activities in progress.
Requested Upcoming Assistance, detail of any Obstacles: Completion of necessary work to be done by Clyde Bergemann and Solvera. This is a critical path item. Unit availability for parametric testing beginning the week of April 28, 2003. Pegasus will provide a revised test
plan. Unit and various sub-systems availability for verification of data tags configured on the Pegasus system. NOx analyzer operational and providing correct indication when in calibration mode. Need approval to proceed with PCS sub-contract.
Planned activities for next month: Parametric testing at site. Documentation and further definition of the new AI and processing techniques. Software development activities to support the project. Finalization of the sub-contract for PCS. Awaiting approval from customer.
Completed Progress and Activity to date:
P.O. issued, Kickoff meeting for the project held at site. Obtained Sootblowing related Checklist information from customer. Obtained revised I/O list from customer. Review information and seek clarifications. Details on Solvera and Clyde Bergemann
system tags are pending. Data communications and networking layout and requirements reviewed and agreed upon with customer. Sun system and relevant peripherals acquired, installed and delivered to plant site. Development and testing of datalink to Solvera system. Some issues pending resolution of system setup at site. Interfaced with Solvera and Clyde Bergemann to resolve data communications and system setup issues. Reviewed boiler cleanliness information requirements with customer. EtaPRO information received. Specific Information
relevant to Solvera and Clyde Bergemann systems is pending. NeuSIGHT® workstation configured and installed at site. Bi-directional data communications verified using temporary WDPF, PI and Solvera tags. Technical review, evaluation, analysis and research related to 2nd stage processing and AI techniques. In progress. Software development activities pertaining to 2nd stage processing techniques initiated. Literature review and patent search to ensure uniqueness and differentiation of the proposed technology. Sent a sub-contract document for PCS for customer review prior to sub-contract award. Pending feedback. Participate in project meetings at site. Provide relevant information and updates.
12
Prepared and presented a joint paper at the Electric Power 2003 conference.

Tampa Electric, Neural Network Sootblowing Project UpdateMarch 31, 2003
This information is being provided to you pursuant to the reporting requirements of Contract #BBX-09-02-02109 between Tampa Electric Company (TECO) and Pegasus Technologies, Inc. (Pegasus). If you have any questions on the information please contact: Neel Parikh (440) 358-7397 Jim Donegan (610) 430-3525 TECO Sootblowing - job #132 This months completed activities: Configure NeuSIGHT system with available tags and initiate collection. Several tags are expected to become
available in April and will be added at that time. Verify data values for available tags. Identify problem areas. Support resolution of data communications issues involving Solvera and Clyde Bergemann. Support Pegasus-Solvera data communications test setup at Pegasus offices in Mentor, OH. Obtained some more unit operations information from customer. Generated a preliminary version of the parametric test plan. Review with TECO scheduled for April. Documentation and further definition of the new AI and processing techniques. Preliminary software development activities in progress. Update software to facilitate bi-directional data communications between NeuSIGHT and PCS-ACM packages. Site visit during week of March 31st to obtain unit operational information, verify I/O and review plans. Attend and present a joint paper at the Electric Power 2003 conference. Prepare and submit an abstract for the PowerGen 2003 conference.
Requested Upcoming Assistance, detail of any Obstacles: Completion of necessary work to be done by Clyde Bergemann and Solvera. This is a critical path item. Unit availability for parametric testing beginning the week of April 28, 2003. Pegasus will provide a revised test
plan. Unit and various sub-systems availability for verification of data tags configured on the Pegasus system. NOx analyzer operational and providing correct indication when in calibration mode. Need approval to proceed with PCS sub-contract.
Planned activities for next month: Configure NeuSIGHT system with all required tags and setup data collection. Verify all relevant data values and communications. Support debugging and resolution of data communications issues involving Solvera and Clyde Bergemann. Obtain detailed unit operations information from TECO. Meetings planned at site in April to review information and
discuss plans. Work on generating a revised parametric test plan incorporating customer feedback. Documentation and further definition of the new AI and processing techniques. Software development activities to support the project. Finalization of the sub-contract for PCS. Awaiting approval from customer.
Completed Progress and Activity to date:
P.O. issued, Kickoff meeting for the project held at site. Obtained Sootblowing related Checklist information from customer. Obtained revised I/O list from customer. Review information and seek clarifications. Details on Solvera and Clyde Bergemann
system tags are pending. Data communications and networking layout and requirements reviewed and agreed upon with customer. Sun system and relevant peripherals acquired, installed and delivered to plant site. Development and testing of datalink to Solvera system. Some issues pending resolution of system setup at site. Interfaced with Solvera and Clyde Bergemann to resolve data communications and system setup issues. Reviewed boiler cleanliness information requirements with customer. EtaPRO information received. Specific Information
relevant to Solvera and Clyde Bergemann systems is pending. NeuSIGHT® workstation configured and installed at site.
13 Bi-directional data communications verified using temporary WDPF, PI and Solvera tags. Technical review, evaluation, analysis and research related to 2nd stage processing and AI techniques. In progress. Software development activities pertaining to 2nd stage processing techniques initiated.

Tampa Electric, Neural Network Sootblowing Project UpdateFebruary 28, 2003
This information is being provided to you pursuant to the reporting requirements of Contract #BBX-09-02-02109 between Tampa Electric Company (TECO) and Pegasus Technologies, Inc. (Pegasus). If you have any questions on the information please contact: Neel Parikh (440) 358-7397 Jim Donegan (610) 430-3525 TECO Sootblowing - job #132 Completed Progress and Activity to date:
P.O. issued, Kickoff meeting for the project held at site. Requested Sootblowing related Checklist information from customer. Partial information received. Obtained revised I/O list from customer. Review information and seek clarifications. Details on Solvera and Clyde
Bergemann system tags are pending. Data communications and networking layout and requirements reviewed and agreed upon with customer. Sun system and relevant peripherals acquired, installed and delivered to plant site. Development and testing of datalink to Solvera system. Some issues pending resolution of system setup at site. Interfaced with Solvera to resolve data communications and system setup issues. Reviewed boiler cleanliness information requirements with customer. EtaPRO information received. Specific
Information relevant to Solvera and Clyde Bergemann systems is pending. NeuSIGHT® workstation configured and installed at site. Bi-directional data communications verified using temporary WDPF, PI and Solvera tags. Unit was offline. Technical review, evaluation, analysis and research related to 2nd stage processing and AI techniques. In progress. Software development activities pertaining to 2nd stage processing techniques initiated. Literature review and patent search to ensure uniqueness and differentiation of the proposed technology. Sent a sub-contract document for PCS for customer review prior to sub-contract award. Pending feedback. Participate in project meetings at site. Provide relevant information and updates. Prepare a joint paper presentation for the Electric Power 2003 conference.
This months completed activities: NeuSIGHT workstation delivered, configured and installed at site. Establish data communications capability with WDPF, PI and Solvera systems. Basic data communications verified using temporary WDPF, PI and Solvera tags. Obtain and review revised I/O lists. Clarifications obtained from customer. Interfaced with customer on several items pertaining to unit operation and system configuration. Support resolution of data communications issues involving Solvera and Clyde. Participate in project meeting at site. Provide relevant information and updates. Literature review and patent search to ensure uniqueness and differentiation of the proposed technology.
Requested Upcoming Assistance, detail of any Obstacles: Detailed information on current Sootblowing system setup and practices requested from customer.
Pending feedback. Completion of necessary work to be done by Clyde Bergemann and Solvera. This is a critical path item. Data communications issues need finalization and Pegasus needs information on relevant tags so as to
configure and verify NeuSIGHT® system accordingly. This is a critical path item. Unit availability for parametric testing beginning the week of April 14, 2003. Pegasus will provide a test
plan for review and approval. Unit and various sub-systems availability for verification of data tags configured on the Pegasus system.
Planned activities for next month: Configure NeuSIGHT system with relevant tags and initiate collection. Verify data values and communications. Obtain unit operations information from customer. Work on generating a preliminary version of the parametric test plan. Documentation and further definition of the new AI and processing techniques.
14 Preliminary software development activities. Finalization of the sub-contract for PCS. Awaiting approval from customer.

15

16informed that rating dampers should be excluded from the existing list of controllable parameters. The existing system configuration is to be kept as is, so as to facilitate inclusion of rating dampers as controllable parameters at a later date when
Tampa Electric, Neural Network Sootblowing Project UpdateDecember 31, 2004
This information is being provided to you pursuant to the reporting requirements of Contract #BBX-09-02-02109 between Tampa Electric Company (TECO) and Pegasus Technologies, Inc. (Pegasus). If you have any questions on the information please contact: Neel Parikh (440) 358-7397 Dave Wroblewski (440) 358-7039 Peter Reck (440) 357-7794 TECO Sootblowing - job #132 Completed Progress and Activity to date:
P.O. issued, Kickoff meeting for the project held at site. Obtained Sootblowing related Checklist information from customer. Obtained revised I/O list from customer. Review information and seek clarifications. I/O list finalized. Data communications and networking layout and requirements reviewed and agreed upon with customer. Sun system and relevant peripherals acquired, installed and delivered to plant site. Developed and tested datalink to Solvera system. Interfaced with Solvera and Clyde Bergemann to resolve data communications and system setup issues. Reviewed boiler cleanliness information requirements with customer. NeuSIGHT® workstation configured and installed at site. Input datalink communications to WDPF, PI and Solvera systems is functional. Output datalink verified. Technical review, evaluation, analysis, research and software development related to 2nd stage processing and AI techniques.
In progress. Literature review and patent search to ensure uniqueness and differentiation of the proposed technology. Finalized a sub-contract with PCS to implement ACM software. ACM software implementation is in progress. I/O list for monitoring approved by TECO. Participated in project meetings at site. Provided relevant information and updates. Prepared and presented a joint paper at the Electric Power 2003 conference and the PowerGen 2003 conference. Parametric testing at site based on unit availability and maintenance activities. In progress. (eg.water cannons, sub groups) Data analysis and visualization. This is an ongoing activity. Develop neural network models and validate relationships. This is an ongoing activity. Initiated closed-loop operation of available combustion parameters. Regularly issued SB status reports for maintenance purposes. Prepared and presented reports outlining project status and key observations. Completed training session with plant operators and engineers on use of the Pegasus optimization system. Obtained selected baseline data in electronic format from TECO. Pegasus identified and reported problems with cleanliness factor calcs generated by EtaPRO. As configured currently the
calcs are of limited value to ISB implementation. As of December 1, 2003 General Physics data was not usable and hence as notified to TECO earlier, Pegasus has moved on to using an alternate set of boiler and calculated parameters to support modeling and system operation over the entire load range.
Implemented and verified automated parametric test methods to support efficient testing and project execution. Completed on-site training for ACM sensor validation software. Prepared and provided ACM maintenance manual to TECO. Completed parametric testing with two element pairs of sootblowers. Architected and drafted 2nd stage processing code. Implemented, tested and verified data communications ‘WATCHDOG’ capability with Solvera sootblowing control system. Provided on-site support for water cannon related testing per TECO’s request. Pegasus reviewed water cannon testing related graphs and provided recommendations/comments for TECO’s further
consideration. Updated neural network model and software configuration on ISB computer to support combustion optimization application. Rating damper testing was planned and discussed with TECO. Pegasus personnel visited the site to perform scheduled
testing. Due to TECO mandated operational constraints and plant equipment/control system conditions, Pegasus were

Tampa Electric, Neural Network Sootblowing Project UpdateOctober 31, 2004
This information is being provided to you pursuant to the reporting requirements of Contract #BBX-09-02-02109 between Tampa Electric Company (TECO) and Pegasus Technologies, Inc. (Pegasus). If you have any questions on the information please contact: Neel Parikh (440) 358-7397 Dave Wroblewski (440) 358-7039 Peter Reck (440) 357-7794 TECO Sootblowing - job #132 Completed Progress and Activity to date:
P.O. issued, Kickoff meeting for the project held at site. Obtained Sootblowing related Checklist information from customer. Obtained revised I/O list from customer. Review information and seek clarifications. I/O list finalized. Data communications and networking layout and requirements reviewed and agreed upon with customer. Sun system and relevant peripherals acquired, installed and delivered to plant site. Developed and tested datalink to Solvera system. Interfaced with Solvera and Clyde Bergemann to resolve data communications and system setup issues. Reviewed boiler cleanliness information requirements with customer. NeuSIGHT® workstation configured and installed at site. Input datalink communications to WDPF, PI and Solvera systems is functional. Output datalink verified. Technical review, evaluation, analysis, research and software development related to 2nd stage processing and AI techniques.
In progress. Literature review and patent search to ensure uniqueness and differentiation of the proposed technology. Finalized a sub-contract with PCS to implement ACM software. ACM software implementation is in progress. I/O list for monitoring approved by TECO. Participated in project meetings at site. Provided relevant information and updates. Prepared and presented a joint paper at the Electric Power 2003 conference and the PowerGen 2003 conference. Parametric testing at site based on unit availability and maintenance activities. In progress. (eg.water cannons, sub groups) Data analysis and visualization. This is an ongoing activity. Develop neural network models and validate relationships. This is an ongoing activity. Initiated closed-loop operation of available combustion parameters. Regularly issued SB status reports for maintenance purposes. Prepared and presented reports outlining project status and key observations. Completed training session with plant operators and engineers on use of the Pegasus optimization system. Obtained selected baseline data in electronic format from TECO. Pegasus identified and reported problems with cleanliness factor calcs generated by EtaPRO. As configured currently the
calcs are of limited value to ISB implementation. As of December 1, 2003 General Physics data was not usable and hence as notified to TECO earlier, Pegasus has moved on to using an alternate set of boiler and calculated parameters to support modeling and system operation over the entire load range.
Implemented and verified automated parametric test methods to support efficient testing and project execution. Completed on-site training for ACM sensor validation software. Prepared and provided ACM maintenance manual to TECO. Completed parametric testing with two element pairs of sootblowers. Architected and drafted 2nd stage processing code. Implemented, tested and verified data communications ‘WATCHDOG’ capability with Solvera sootblowing control system. Provided on-site support for water cannon related testing per TECO’s request. Pegasus reviewed water cannon testing related graphs and provided recommendations/comments for TECO’s further
consideration. Updated neural network model and software configuration on ISB computer to support combustion optimization application. Rating damper testing was planned and discussed with TECO. Pegasus personnel visited the site to perform scheduled
testing. Due to TECO mandated operational constraints and plant equipment/control system conditions, Pegasus were
17informed that rating dampers should be excluded from the existing list of controllable parameters. The existing system configuration is to be kept as is, so as to facilitate inclusion of rating dampers as controllable parameters at a later date when

Tampa Electric, Neural Network Sootblowing Project UpdateSeptember 30, 2004
This information is being provided to you pursuant to the reporting requirements of Contract #BBX-09-02-02109 between Tampa Electric Company (TECO) and Pegasus Technologies, Inc. (Pegasus). If you have any questions on the information please contact: Neel Parikh (440) 358-7397 Dave Wroblewski (440) 358-7039 Mark Coffin (865) 310-3858 TECO Sootblowing - job #132 Completed Progress and Activity to date:
P.O. issued, Kickoff meeting for the project held at site. Obtained Sootblowing related Checklist information from customer. Obtained revised I/O list from customer. Review information and seek clarifications. I/O list finalized. Data communications and networking layout and requirements reviewed and agreed upon with customer. Sun system and relevant peripherals acquired, installed and delivered to plant site. Developed and tested datalink to Solvera system. Interfaced with Solvera and Clyde Bergemann to resolve data communications and system setup issues. Reviewed boiler cleanliness information requirements with customer. NeuSIGHT® workstation configured and installed at site. Input datalink communications to WDPF, PI and Solvera systems is functional. Output datalink verified. Technical review, evaluation, analysis, research and software development related to 2nd stage processing and AI techniques.
In progress. Literature review and patent search to ensure uniqueness and differentiation of the proposed technology. Finalized a sub-contract with PCS to implement ACM software. ACM software implementation is in progress. I/O list for monitoring approved by TECO. Participated in project meetings at site. Provided relevant information and updates. Prepared and presented a joint paper at the Electric Power 2003 conference and the PowerGen 2003 conference. Parametric testing at site based on unit availability and maintenance activities. In progress. (eg.water cannons, sub groups) Data analysis and visualization. This is an ongoing activity. Develop neural network models and validate relationships. This is an ongoing activity. Initiated closed-loop operation of available combustion parameters. Regularly issued SB status reports for maintenance purposes. Prepared and presented reports outlining project status and key observations. Completed training session with plant operators and engineers on use of the Pegasus optimization system. Obtained selected baseline data in electronic format from TECO. Pegasus identified and reported problems with cleanliness factor calcs generated by EtaPRO. As configured currently the
calcs are of limited value to ISB implementation. As of December 1, 2003 General Physics data was not usable and hence as notified to TECO earlier, Pegasus has moved on to using an alternate set of boiler and calculated parameters to support modeling and system operation over the entire load range.
Implemented and verified automated parametric test methods to support efficient testing and project execution. Completed on-site training for ACM sensor validation software. Prepared and provided ACM maintenance manual to TECO. Completed parametric testing with two element pairs of sootblowers. Architected and drafted 2nd stage processing code. Implemented, tested and verified data communications ‘WATCHDOG’ capability with Solvera sootblowing control system. Provided on-site support for water cannon related testing per TECO’s request. Pegasus reviewed water cannon testing related graphs and provided recommendations/comments for TECO’s further
consideration. Updated neural network model and software configuration on ISB computer to support combustion optimization application. Rating damper testing was planned and discussed with TECO. Pegasus personnel visited the site to perform scheduled
testing. Due to TECO mandated operational constraints and plant equipment/control system conditions, Pegasus were
18informed that rating dampers should be excluded from the existing list of controllable parameters. The existing system configuration is to be kept as is, so as to facilitate inclusion of rating dampers as controllable parameters at a later date when

Tampa Electric, Neural Network Sootblowing Project UpdateAugust 31, 2004
This information is being provided to you pursuant to the reporting requirements of Contract #BBX-09-02-02109 between Tampa Electric Company (TECO) and Pegasus Technologies, Inc. (Pegasus). If you have any questions on the information please contact: Neel Parikh (440) 358-7397 Dave Wroblewski (440) 358-7039 Mark Coffin (865) 310-3858 TECO Sootblowing - job #132 Completed Progress and Activity to date:
P.O. issued, Kickoff meeting for the project held at site. Obtained Sootblowing related Checklist information from customer. Obtained revised I/O list from customer. Review information and seek clarifications. I/O list finalized. Data communications and networking layout and requirements reviewed and agreed upon with customer. Sun system and relevant peripherals acquired, installed and delivered to plant site. Developed and tested datalink to Solvera system. Interfaced with Solvera and Clyde Bergemann to resolve data communications and system setup issues. Reviewed boiler cleanliness information requirements with customer. NeuSIGHT® workstation configured and installed at site. Input datalink communications to WDPF, PI and Solvera systems is functional. Output datalink verified. Technical review, evaluation, analysis, research and software development related to 2nd stage processing and AI techniques.
In progress. Literature review and patent search to ensure uniqueness and differentiation of the proposed technology. Finalized a sub-contract with PCS to implement ACM software. ACM software implementation is in progress. I/O list for monitoring approved by TECO. Participated in project meetings at site. Provided relevant information and updates. Prepared and presented a joint paper at the Electric Power 2003 conference and the PowerGen 2003 conference. Parametric testing at site based on unit availability and maintenance activities. In progress. (eg.water cannons, sub groups) Data analysis and visualization. This is an ongoing activity. Develop neural network models and validate relationships. This is an ongoing activity. Initiated closed-loop operation of available combustion parameters. Regularly issued SB status reports for maintenance purposes. Prepared and presented reports outlining project status and key observations. Completed training session with plant operators and engineers on use of the Pegasus optimization system. Obtained selected baseline data in electronic format from TECO. Pegasus identified and reported problems with cleanliness factor calcs generated by EtaPRO. As configured currently the
calcs are of limited value to ISB implementation. As of December 1, 2003 General Physics data was not usable and hence as notified to TECO earlier, Pegasus has moved on to using an alternate set of boiler and calculated parameters to support modeling and system operation over the entire load range.
Implemented and verified automated parametric test methods to support efficient testing and project execution. Completed on-site training for ACM sensor validation software. Prepared and provided ACM maintenance manual to TECO. Completed parametric testing with two element pairs of sootblowers. Architected and drafted 2nd stage processing code. Implemented, tested and verified data communications ‘WATCHDOG’ capability with Solvera sootblowing control system. Provided on-site support for water cannon related testing per TECO’s request. Updated neural network model on ISB computer to support combustion optimization application. Rating damper testing was planned and discussed with TECO. Pegasus personnel visited the site to perform scheduled
testing. Due to TECO mandated operational constraints and plant equipment/control system conditions, Pegasus were informed that rating dampers should be excluded from the existing list of controllable parameters. The existing system configuration is to be kept as is, so as to facilitate inclusion of rating dampers as controllable parameters at a later date when
19
unit operating conditions permit and at TECO’s discretion. TECO agreed Pegasus has met its obligations pertaining to this task.

Tampa Electric, Neural Network Sootblowing Project UpdateJuly 31, 2004
This information is being provided to you pursuant to the reporting requirements of Contract #BBX-09-02-02109 between Tampa Electric Company (TECO) and Pegasus Technologies, Inc. (Pegasus). If you have any questions on the information please contact: Neel Parikh (440) 358-7397 Dave Wroblewski (440) 358-7039 Mark Coffin (865) 310-3858 TECO Sootblowing - job #132 Completed Progress and Activity to date:
P.O. issued, Kickoff meeting for the project held at site. Obtained Sootblowing related Checklist information from customer. Obtained revised I/O list from customer. Review information and seek clarifications. I/O list finalized. Data communications and networking layout and requirements reviewed and agreed upon with customer. Sun system and relevant peripherals acquired, installed and delivered to plant site. Developed and tested datalink to Solvera system. Interfaced with Solvera and Clyde Bergemann to resolve data communications and system setup issues. Reviewed boiler cleanliness information requirements with customer. NeuSIGHT® workstation configured and installed at site. Input datalink communications to WDPF, PI and Solvera systems is functional. Output datalink verified. Technical review, evaluation, analysis, research and software development related to 2nd stage processing and AI techniques.
In progress. Literature review and patent search to ensure uniqueness and differentiation of the proposed technology. Finalized a sub-contract with PCS to implement ACM software. ACM software implementation is in progress. I/O list for monitoring approved by TECO. Participated in project meetings at site. Provided relevant information and updates. Prepared and presented a joint paper at the Electric Power 2003 conference and the PowerGen 2003 conference. Parametric testing at site based on unit availability and maintenance activities. In progress. (eg.water cannons, sub groups) Data analysis and visualization. This is an ongoing activity. Develop neural network models and validate relationships. This is an ongoing activity. Initiated closed-loop operation of available combustion parameters. Regularly issued SB status reports for maintenance purposes. Prepared and presented reports outlining project status and key observations. Completed training session with plant operators and engineers on use of the Pegasus optimization system. Obtained selected baseline data in electronic format from TECO. Pegasus identified and reported problems with cleanliness factor calcs generated by EtaPRO. As configured currently the
calcs are of limited value to ISB implementation. As of December 1, 2003 General Physics data was not usable and hence as notified to TECO earlier, Pegasus has moved on to using an alternate set of boiler and calculated parameters to support modeling and system operation over the entire load range.
Implemented and verified automated parametric test methods to support efficient testing and project execution. Completed on-site training for ACM sensor validation software. Prepared and provided ACM maintenance manual to TECO. Completed parametric testing with two element pairs of sootblowers. Architected and drafted 2nd stage processing code. Implemented, tested and verified data communications ‘WATCHDOG’ capability with Solvera sootblowing control system.
This months completed activities: Rating damper testing was pre-planned and discussed with TECO. Pegasus personnel visited the site to perform
scheduled testing. Due to TECO mandated operational constraints and plant equipment/control system conditions, Pegasus were informed that rating dampers should be excluded from the existing list of controllable parameters. The existing system configuration is to be kept as is, so as to facilitate inclusion of rating dampers as
20
controllable parameters at a later date when unit operating conditions permit and at TECO’s discretion. TECO agreed Pegasus has met its obligations pertaining to this task.

Tampa Electric, Neural Network Sootblowing Project UpdateJune 30, 2004
This information is being provided to you pursuant to the reporting requirements of Contract #BBX-09-02-02109 between Tampa Electric Company (TECO) and Pegasus Technologies, Inc. (Pegasus). If you have any questions on the information please contact: Neel Parikh (440) 358-7397 Dave Wroblewski (440) 358-7039 Mark Coffin (865) 310-3858 TECO Sootblowing - job #132 Completed Progress and Activity to date:
P.O. issued, Kickoff meeting for the project held at site. Obtained Sootblowing related Checklist information from customer. Obtained revised I/O list from customer. Review information and seek clarifications. I/O list finalized. Data communications and networking layout and requirements reviewed and agreed upon with customer. Sun system and relevant peripherals acquired, installed and delivered to plant site. Developed and tested datalink to Solvera system. Interfaced with Solvera and Clyde Bergemann to resolve data communications and system setup issues. Reviewed boiler cleanliness information requirements with customer. NeuSIGHT® workstation configured and installed at site. Input datalink communications to WDPF, PI and Solvera systems is functional. Output datalink verified. Technical review, evaluation, analysis, research and software development related to 2nd stage processing and AI techniques.
In progress. Literature review and patent search to ensure uniqueness and differentiation of the proposed technology. Finalized a sub-contract with PCS to implement ACM software. ACM software implementation is in progress. I/O list for monitoring approved by TECO. Participated in project meetings at site. Provided relevant information and updates. Prepared and presented a joint paper at the Electric Power 2003 conference and the PowerGen 2003 conference. Parametric testing at site based on unit availability and maintenance activities. In progress. (eg.water cannons, sub groups) Data analysis and visualization. This is an ongoing activity. Develop neural network models and validate relationships. This is an ongoing activity. Initiated closed-loop operation of available combustion parameters. Regularly issued SB status reports for maintenance purposes. Prepared and presented reports outlining project status and key observations. Completed training session with plant operators and engineers on use of the Pegasus optimization system. Obtained selected baseline data in electronic format from TECO. Pegasus identified and reported problems with cleanliness factor calcs generated by EtaPRO. As configured currently the
calcs are of limited value to ISB implementation. As of December 1, 2003 General Physics data was not usable and hence as notified to TECO earlier, Pegasus has moved on to using an alternate set of boiler and calculated parameters to support modeling and system operation over the entire load range.
Implemented and verified automated parametric test methods to support efficient testing and project execution. Completed on-site training for ACM sensor validation software. Prepared and provided ACM maintenance manual to TECO. Completed parametric testing with two element pairs of sootblowers. Architected and drafted 2nd stage processing code.
This months completed activities: Updated Pegasus system to write timeout value to Solvera system. This helps monitor health of the relevant
datalink and prevents inadvertent switch over to Pegasus/Manual mode of sootblower control. Tuned Pegasus system to operate under different unit conditions. Generated, reviewed and obtained approval for test plan and coordinated scheduling of rating dampers testing. Monitored runtime (for verification and validation) with 2nd stage processing software using real-time plant
21
operating data. Reviewed data and implemented refinements as necessary. Monitored Pegasus system operation and data interfaces. NOTE: Pegasus was ON HOLD for part of Jun 2004, awaiting Unit availability for further testing.

Tampa Electric, Neural Network Sootblowing Project UpdateMay 31, 2004
This information is being provided to you pursuant to the reporting requirements of Contract #BBX-09-02-02109 between Tampa Electric Company (TECO) and Pegasus Technologies, Inc. (Pegasus). If you have any questions on the information please contact: Neel Parikh (440) 358-7397 Dave Wroblewski (440) 358-7039 Mark Coffin (865) 310-3858 TECO Sootblowing - job #132 Completed Progress and Activity to date:
P.O. issued, Kickoff meeting for the project held at site. Obtained Sootblowing related Checklist information from customer. Obtained revised I/O list from customer. Review information and seek clarifications. I/O list finalized. Data communications and networking layout and requirements reviewed and agreed upon with customer. Sun system and relevant peripherals acquired, installed and delivered to plant site. Developed and tested datalink to Solvera system. Interfaced with Solvera and Clyde Bergemann to resolve data communications and system setup issues. Reviewed boiler cleanliness information requirements with customer. NeuSIGHT® workstation configured and installed at site. Input datalink communications to WDPF, PI and Solvera systems is functional. Output datalink verified. Technical review, evaluation, analysis, research and software development related to 2nd stage processing and AI techniques.
In progress. Literature review and patent search to ensure uniqueness and differentiation of the proposed technology. Finalized a sub-contract with PCS to implement ACM software. ACM software implementation is in progress. I/O list for monitoring approved by TECO. Participated in project meetings at site. Provided relevant information and updates. Prepared and presented a joint paper at the Electric Power 2003 conference and the PowerGen 2003 conference. Parametric testing at site based on unit availability and maintenance activities. In progress. (eg.water cannons, sub groups) Data analysis and visualization. This is an ongoing activity. Develop neural network models and validate relationships. This is an ongoing activity. Initiated closed-loop operation of available combustion parameters. Regularly issued SB status reports for maintenance purposes. Prepared and presented reports outlining project status and key observations. Completed training session with plant operators and engineers on use of the Pegasus optimization system. Obtained selected baseline data in electronic format from TECO. Pegasus identified and reported problems with cleanliness factor calcs generated by EtaPRO. As configured currently the
calcs are of limited value to ISB implementation. As of December 1, 2003 General Physics data was not usable and hence as notified to TECO earlier, Pegasus has moved on to using an alternate set of boiler and calculated parameters to support modeling and system operation over the entire load range.
Implemented and verified automated parametric test methods to support efficient testing and project execution. Completed on-site training for ACM sensor validation software. Prepared and provided ACM maintenance manual to TECO. Completed parametric testing with two element pairs of sootblowers. Architected and drafted 2nd stage processing code.
This months completed activities: Provided necessary support related to Solvera software configuration updates. Relevant activities were
coordinated with TECO and Solvera. Coordinated with TECO and Clyde Bergemann regarding water cannon test procedures. Monitored Pegasus system operation and data interfaces. NOTE: Pegasus was ON HOLD for most of May 2004, awaiting sootblower control system and Unit availability for
22
further testing. Requested Upcoming Assistance, detail of any Obstacles:

Tampa Electric, Neural Network Sootblowing Project UpdateApril 30, 2004
This information is being provided to you pursuant to the reporting requirements of Contract #BBX-09-02-02109 between Tampa Electric Company (TECO) and Pegasus Technologies, Inc. (Pegasus). If you have any questions on the information please contact: Neel Parikh (440) 358-7397 Dave Wroblewski (440) 358-7039 Mark Coffin (865) 310-3858 TECO Sootblowing - job #132 Completed Progress and Activity to date:
P.O. issued, Kickoff meeting for the project held at site. Obtained Sootblowing related Checklist information from customer. Obtained revised I/O list from customer. Review information and seek clarifications. I/O list finalized. Data communications and networking layout and requirements reviewed and agreed upon with customer. Sun system and relevant peripherals acquired, installed and delivered to plant site. Developed and tested datalink to Solvera system. Interfaced with Solvera and Clyde Bergemann to resolve data communications and system setup issues. Reviewed boiler cleanliness information requirements with customer. NeuSIGHT® workstation configured and installed at site. Input datalink communications to WDPF, PI and Solvera systems is functional. Output datalink verified. Technical review, evaluation, analysis, research and software development related to 2nd stage processing and AI techniques.
In progress. Literature review and patent search to ensure uniqueness and differentiation of the proposed technology. Finalized a sub-contract with PCS to implement ACM software. ACM software implementation is in progress. I/O list for monitoring approved by TECO. Participated in project meetings at site. Provided relevant information and updates. Prepared and presented a joint paper at the Electric Power 2003 conference and the PowerGen 2003 conference. Parametric testing at site based on unit availability and maintenance activities. In progress. (eg.water cannons, sub groups) Data analysis and visualization. This is an ongoing activity. Develop neural network models and validate relationships. This is an ongoing activity. Initiated closed-loop operation of available combustion parameters. Regularly issued SB status reports for maintenance purposes. Prepared and presented reports outlining project status and key observations. Completed training session with plant operators and engineers on use of the Pegasus optimization system. Obtained selected baseline data in electronic format from TECO. Pegasus identified and reported problems with cleanliness factor calcs generated by EtaPRO. As configured currently the
calcs are of limited value to ISB implementation. As of December 1, 2003 General Physics data was not usable and hence as notified to TECO earlier, Pegasus has moved on to using an alternate set of boiler and calculated parameters to support modeling and system operation over the entire load range.
Implemented and verified automated parametric test methods to support efficient testing and project execution. Completed on-site training for ACM sensor validation software. Prepared and provided ACM maintenance manual to TECO. Completed parametric testing with two element pairs of sootblowers. Architected and drafted 2nd stage processing code.
This months completed activities: Checked-out and tuned pre, post, PdbCALCS logic and trigger conditions for supporting closed-loop operation
with 2 element pairs of sootblowers. Conducted first evaluation (verification and validation) of 2nd stage processing software using real-time plant
operating data. Made software updates based on preliminary evaluation.
23
Conducted preliminary closed-loop testing using recommendations from optimizer and 2nd stage processing. Run-time experience in closed-loop mode revealed the need to update Solvera software configuration.
Accordingly, relevant activities were coordinated with TECO and Solvera.

Tampa Electric, Neural Network Sootblowing Project UpdateMarch 31, 2004
This information is being provided to you pursuant to the reporting requirements of Contract #BBX-09-02-02109 between Tampa Electric Company (TECO) and Pegasus Technologies, Inc. (Pegasus). If you have any questions on the information please contact: Neel Parikh (440) 358-7397 Dave Wroblewski (440) 358-7039 Mark Coffin (865) 310-3858 TECO Sootblowing - job #132 Completed Progress and Activity to date:
P.O. issued, Kickoff meeting for the project held at site. Obtained Sootblowing related Checklist information from customer. Obtained revised I/O list from customer. Review information and seek clarifications. I/O list finalized. Data communications and networking layout and requirements reviewed and agreed upon with customer. Sun system and relevant peripherals acquired, installed and delivered to plant site. Developed and tested datalink to Solvera system. Interfaced with Solvera and Clyde Bergemann to resolve data communications and system setup issues. Reviewed boiler cleanliness information requirements with customer. NeuSIGHT® workstation configured and installed at site. Input datalink communications to WDPF, PI and Solvera systems is functional. Output datalink verified. Technical review, evaluation, analysis, research and software development related to 2nd stage processing and AI techniques.
In progress. Literature review and patent search to ensure uniqueness and differentiation of the proposed technology. Finalized a sub-contract with PCS to implement ACM software. ACM software implementation is in progress. I/O list for monitoring approved by TECO. Participated in project meetings at site. Provided relevant information and updates. Prepared and presented a joint paper at the Electric Power 2003 conference and the PowerGen 2003 conference. Parametric testing at site based on unit availability and maintenance activities. In progress. (eg.water cannons, sub groups) Data analysis and visualization. This is an ongoing activity. Develop neural network models and validate relationships. This is an ongoing activity. Initiated closed-loop operation of available combustion parameters. Regularly issued SB status reports for maintenance purposes. Prepared and presented reports outlining project status and key observations. Completed training session with plant operators and engineers on use of the Pegasus optimization system. Obtained selected baseline data in electronic format from TECO. Pegasus identified and reported problems with cleanliness factor calcs generated by EtaPRO. As configured currently the
calcs are of limited value to ISB implementation. As of December 1, 2003 General Physics data was not usable and hence as notified to TECO earlier, Pegasus has moved on to using an alternate set of boiler and calculated parameters to support modeling and system operation over the entire load range.
Implemented and verified automated parametric test methods to support efficient testing and project execution. Completed on-site training for ACM sensor validation software. Prepared and provided ACM maintenance manual to TECO. Completed parametric testing with two element pairs of sootblowers. Architected and drafted 2nd stage processing code.
This months completed activities: Conducted remaining parametric testing with two element pairs of sootblowers and varying deadtimes between
blower operations. Per agreement with TECO, this is intended to free up the top down association of blower rules. Analyzed parametric test data. Created and installed a revised neural network model incorporating parameters
representing two element pairs of sootblowers. Modified PdbCALCS, pre, post logic and trigger conditions to support neural network model and optimization with
24
two element pairs of sootblowers. Upon receiving email confirmation from TECO, Pegasus revised the processing logic to support activation of APH
sootblower from Pegasus system.

APPENDIX II
CLYDE BERGEMANN WATER CANNON TEST RESULTS
25

CLYDE BERGEMANN WATER CANNON TESTING JULY 8, 2004
The following graphs depict actual testing data from a mutual test conducted between TECO and Clyde Bergemann on the Big Bend Unit 2 water cannon system supplied as part of this project. The test conditions were that the unit was operationally stable at approximately 370MW with all parameters held constant. The water cannons were operated at maximum output during the duration of the test to determine what impacts, if any, were realized. Sixteen heat flux zones were continuously monitored to detect thermal impact upon the target walls. As can be seen, the vast majority of the effort had no to little impact relative to wall cleanliness.
Heat Flux 1 (7/08/04)
405060708090
100110120
11:0
0:00
1:00
:00
3:00
:00
5:00
:00
Time
Hea
t Flu
x
Maximum Delta recorded for the day 53F
Heat Flux 2 (7/08/04)
405060708090
100110120
11:0
0:00
1:00
:00
3:00
:00
5:00
:00
T ime
Hea
t Flu
x

Maximum recorded fro the day 172F
Heat Flux 3 (7/08/04)
40
90
140
190
240
290
11:0
0:00
1:00
:00
3:00
:00
5:00
:00
Time
Hea
t Flu
x
Maximum for the day 3F
Heat Flux 4 (7/08/04)
405060708090
100110120
11:0
0:00
1:00
:00
3:00
:00
5:00
:00
T ime
Hea
t Flu
x
Maximum for the day 1F

Heat Flux 5 (7/08/04)
405060708090
100110120
11:0
0:00
1:00
:00
3:00
:00
5:00
:00
Time
Hea
t Flu
x
Maximum for the day 2F
Heat Flux 6 (7/08/04)
0
20
40
60
80
100
120
11:0
0:00
1:00
:00
3:00
:00
5:00
:00
Time
Hea
t Flu
x
Maximum for the day 45F
Heat Flux 7 (7/08/04)
40
60
80
100
120
140
11:0
0:00
1:00
:00
3:00
:00
5:00
:00
Time
Hea
t Flu
x

Maximum for the day 152F
Heat Flux 8 (7/08/04)
40
60
80
100
120
140
11:0
0:00
1:00
:00
3:00
:00
5:00
:00
Time
Hea
t Flu
x
Maximum for the day 120F
Heat Flux 9 (7/08/04)
0
20
40
60
80
100
120
11:0
0:00
1:00
:00
3:00
:00
5:00
:00
Time
Hea
t Flu
x
Maximum for the day 3F

Heat Flux 10 (7/08/04)
405060708090
100110120
11:0
0:00
1:00
:00
3:00
:00
5:00
:00
Time
Hea
t Flu
x
Maximum for the day 17F
Heat Flux 11 (7/08/04)
405060708090
100110120
11:0
0:00
1:00
:00
3:00
:00
5:00
:00
Time
Hea
t Flu
x
Maximum for the day 37F
Heat Flux 12 (7/08/04)
0
20
40
60
80
100
120
11:0
0:00
1:00
:00
3:00
:00
5:00
:00
Time
Hea
t Flu
x

Maximum for the day 26F
Heat Flux 13 (7/08/04)
0
20
40
60
80
100
120
11:0
0:00
1:00
:00
3:00
:00
5:00
:00
Time
Hea
t Flu
x
maximum for the day 11F
Heat Flux 14 (7/08/04)
0
20
40
60
80
100
120
11:0
0:00
1:00
:00
3:00
:00
5:00
:00
Time
Hea
t Flu
x
Maximum for the day 1F

Heat Flux 15 (7/08/04)
0
20
40
60
80
100
120
11:0
0:00
1:00
:00
3:00
:00
5:00
:00
Time
Hea
t Flu
x
Maximum for the day 10F
Heat Flux 16 (7/08/04)
0
20
40
60
80
100
120
11:0
0:00
1:00
:00
3:00
:00
5:00
:00
Time
Hea
t Flu
x
Maximum for the day 31F
Unit Load (7/08/04)
300
320
340
360
380
400
11:0
0:00
1:00
:00
3:00
:00
5:00
:00
Time
MW

Water Cannon Test - 7/8/04 - 370MW
0.30
0.35
0.40
0.45
0.50
0.55
0.60
0.65
0.70
0.75
7/8/
04 1
0:00
AM
7/8/
04 1
1:00
AM
7/8/
04 1
2:00
PM
7/8/
04 1
:00
PM
7/8/
04 2
:00
PM
7/8/
04 3
:00
PM
7/8/
04 4
:00
PM
7/8/
04 5
:00
PM
7/8/
04 6
:00
PM
7/8/
04 7
:00
PM
7/8/
04 8
:00
PM
lbs/
mm
Btu
0.00
0.50
1.00
1.50
2.00
2.50
3.00
Maximum water cannon spray for 3 hour duration(1pm to 4pm)
Average 3 hour NOx prior to test 0.67lbs/mmBtu
Average 3 hour NOx post test 0.62lbs/mmBtu
Excess O2 reduced by 3%
Clyde Bergemann report 20040709T1.htm for the period 7/8/04 06:30 to 7/9/04 06:30 Generated at: 7/9/04 06:30 MIN MAX AVE Channel 1 Surface Max Deflect 0 53 38.42Channel 2 Surface Max Deflect 114 172 155.94Channel 3 Surface Max Deflect 2 3 2.29Channel 4 Surface Max Deflect 0 1 0.29Channel 5 Surface Max Deflect 0 2 1.59Channel 6 Surface Max Deflect 0 45 12.85Channel 7 Surface Max Deflect 40 152 117.14Channel 8 Surface Max Deflect 50 120 72.19Channel 9 Surface Max Deflect 3 3 3.00Channel 10 Surface Max Deflect 3 17 13.21Channel 11 Surface Max Deflect 22 37 32.21Channel 12 Surface Max Deflect 3 26 11.30Channel 13 Surface Max Deflect 1 11 4.31Channel 14 Surface Max Deflect 0 1 0.29Channel 15 Surface Max Deflect 10 10 10.00Channel 16 Surface Max Deflect 31 31 31.00

APPENDIX III
SOLVERA/STOCK REPORT ON THE SLAG SENSORS

FURNACE SLAG/HEAT ABSORPTION MEASUREMENT USING CORROSION SENSORS
Study Results – TECO Big Bend Station
Ralph Harris – Engineer, Stock Equipment Company
Final Revision 3/12/2004

1. INTRODUCTION....................................................................................................................................................2 1.1. PURPOSE .............................................................................................................................................................2 1.2. THEORY OF OPERATION.........................................................................................................................................2 2. DEVELOPMENT PHASES ....................................................................................................................................5 2.1. INITIAL BETA RELEASE – SINGLE SENSOR................................................................................................................5 2.2. DATA COLLECTION AND ANALYSIS...........................................................................................................................5 2.3. ALGORITHM IMPLEMENTATION AND REFINEMENT ......................................................................................................5 2.4. FINAL RELEASE – 16 SENSORS AND NN-ISB INTEGRATION.......................................................................................5 3. DATA ANALYSIS ..................................................................................................................................................6 3.1. ANALYSIS METHODS..............................................................................................................................................6 3.2. ANALYSIS RESULTS...............................................................................................................................................6 4. CONCLUSIONS.....................................................................................................................................................7

2
INTRODUCTION 1.1 Purpose
This paper serves to document the results of implementation and testing of the Solvera Slag Sensor system at the TECO Big Bend Station in 2003-2004.
1.2 Theory of Operation
1.2.1 Overview The proposition is made that the rate of corrosion should be related to degree of slag build up in a boiler. It is further proposed that there should then be a relationship between corrosion rates or related corrosion measurement and other indicators of slagging such as heat flux.
1.2.2 Slag Measurement using the Slag Sensor The Slag Sensor system consists of multiple SmartCet corrosion sensor modules which communicate with an embedded PC which process and relays readings back to an OPC server. From here the data can be used by a sootblowing system to make choose about how and where to blow soot.
The SmartCet performs corrosion monitoring by looking at the response to a low power AC signal that is transmitted by the SmartCet. The SmartCet returns the following parameters that can be used to measure or analyze corrosion:
Potential Running Mean Second moment
Third moment
Fourth moment
Current Running Mean
1st Harmonic
2nd Harmonic
3rd Harmonic
Conductivity Voltage
Conductivity Current
1.2.3 System View Slag build up data is used as permissives for the SBC soot blowing system. The SBC will only activate a blower when the corresponding Slag Sensor reports enough build up. Slag Sensor data is also passed to the Intelligent Sootblowing system, which will use the % Slag value as input to its Smart Soot Blowing Algorithm. In some systems this function will be performed by other modeling software such as the Pegasus system, so the %Slag value will be forwarded on to these systems for processing.

Fig.1
S BC S la g
S e n sor
3
C IS C O S YS T EM S
A ccuT em p
1
P eg as usS un
W o rk s ta tion
ISB
In te llig e n t S o o tb lo w in gD a ta flo w D ia g ra m
A cc uT e m p
2
R u n B low e r #
S la gInd ica tio n
9 Z o ne T e m psP erm iss ive
Inp u t:S lag P res en t in Z o ne
1 8 Z o ne T e m ps
O u tp u t:C lea n Z on e #
Inp u t:S lag P res en t in Z o ne
18 Z o ne T em p sC le an lin ess F ac to r
O u tp u t:C lea n Z on e #
O u tp u t:C lea n Z on e #
C lea n lin es s F a c to r
Fig.2
Modbus over Ethernet
SBC
CISCOSYSTEMS SlagSensor
AccuTemp2
PegasusSun
Work station
SolveraClient
ISB
RS-232
Intelligent SootblowingNetwork Diagram
ProposedDirect
EthernetConnection
RS-232Terminal
AccuTemp1
RS-232Terminal

Fig. 3
Slag Sensor
EthernetPort
RS-485
Configuration/Calibration
Dumb Terminal
Modbus Ethernet toISB, SBC
InternalPorts
Local PCKeyboard
Port
VGAVideoPort?
Slag SensorHardware
Functional Layout
RS-485
Smart Set 1(3rd Party)
SlagSensor
Smart Set 2(3rd Party)
SlagSensor
Smart Set n(3rd Party)
SlagSensor
1.2.4 Data Flow Diagram
Fig. 4
RS-485 fromSmart Set
ApplySlag Lim itsSet Alarm
SensorPolling
ModbusEthernetHandler
Update Variables/Modbus Map
SerialModbusHandler
Term inalDisplay/Telnet
AlarmOutputs
Slag Set Pointand Alarm s
Term inal/Telnet
CommunicationConfiguration
Term inal/Telnet
Slag SensorSlag Sensor Module
Software Flow
DigitalI/O
LEDS
4

5
2 Development phases 2.1 Initial Beta Release – Single Sensor A Beta release Slag Sensor system was made in September of 2003 supporting communications with the SmartCet modules and the OPC server. This allowed raw corrosion related parameters to be monitored and logged from the SmartCet modules by trending software connected to the OPC server.
Results: The Slag Sensor system communicated with the single installed SmartCet and successfully updated the OPC server with readings.
2.2 Data Collection and Analysis The data collection phase consisted of taking readings from a SmartCet module using the Slag Sensor system and taking readings from a nearby Heat Flux sensor. These values were then analyzed to try to find a relationship between the output of the SmartCet and changes in heat flux readings. Results: Analysis of several weeks of sensor data failed to find a sustained relationship between Heat Flux and any of the corrosion parameters reported by the SmartCet module to the Slag Sensor system. A more detailed description of the findings is found in the DATA ANALYSIS section.
2.3 Algorithm Implementation and Refinement If a relationship between the SmartCet output and heat flux was found, then in this phase the algorithms for relating heat flux and corrosion would be developed and implemented into the Slag Sensor device. Additional user interface features and alarming would also be developed.
Results: Since no relationship with heat flux was found, no further development was scheduled.
2.4 Final Release – 16 Sensors and NN-ISB Integration The final released system would be installed and configured for the full 16 sensor installation. The Pegasus system would start to integrate the Slag Sensor output into their sootblowing model. Results: Since no relationship with heat flux was found, no further development was scheduled and the remaining sensor were not installed.

3 Data Analysis 3.1 Analysis Methods The raw sensor data was first examined to remove bad readings, most likely the result of either communications errors or failure of the SmartCet to process a sample. Correcting these problems was planned for the final develop stage. Since the log data existed in an Excel readable format, the data was imported to Excel for analysis. Using existing formulas that relate harmonic response to corrosion current, the corrosion current was determined for the data set and analyzed versus the heat flux readings as well.
6
3.2 Analysis Results Initial analysis of a single set of daily readings seemed to show some amount of correlation between Heat Flux and harmonic response. Further analysis over a number of days showed no significant correlation between Heat Flux and corrosion current or any other parameter.
Fig 5
0.00E+00
1.00E-06
2.00E-06
3.00E-06
4.00E-06
5.00E-06
6.00E-06
7.00E-06
8.00E-06
9.00E-06
1.00E-05
Icorr HD HF 100 per. Mov. Avg. (Icorr HD)
The graph in Figure 5 shows no good correlation between rising heat flux values and Icorr (Harmonic Distortion Current in amps). The Icorr measure is related to corrosion The readings were taken from several days of data between Dec 2003 and March 2004. Taking the same data and performing an automatic curve fit, the best fit results in an R2 value of only 0.045.
This result is consistent with results seen at two other plants where tests were being performed concurrently with the NN-ISB project. Tests by Breen Energy Solutions and our own tests at Tolk had failed to find a correlation. For Tolk, however, it was proposed that the chemistry of the fuel type might have obscured the discovery of any relationship between corrosion and heat flux.

7
4 Conclusions Although the concept of there being a relationship between slagging and corrosion on the whole is sound, the use of corrosion measurement as a proxy for Heat Flux measurements doesn’t appear to be practical in this implementation. Variations in boiler chemistry, sensor placement, load considerations, and slagging events (slag shearing etc.), complicate finding any relationship between heat flux, corrosion and slagging. One possible use of the underlying technology, however, is to provide an easy and cost effective way to integrate corrosion measurements with a plant DCS. This is the primary application of the SmartCets and it has been used in a number of different industries, including boiler corrosion monitoring.