tamil nadu infrastructurepre fund … · final report april 2018 internal ... as the client) is an...
TRANSCRIPT

TAMIL NADU INFRASTRUCTURE FUND
MANAGEMENT CORPORATION PRE-FEASIBILITY STUDY FOR TAMIL NADU COMMERCE HUB Located on Anna Salai, Chennai
,
FINAL REPORT
APRIL 2018
Internal Ref: 2018_MAR_ADV_CHE_27

1
The Tamil Nadu Infrastructure Fund Management Corporation Ltd [TNIFMC], (hereinafter referred to
as the client) is an asset management company formed under the Tamil Nadu Infrastructure
Development Board (TNIDB).
Under the vision 2023 of GoTN and decongestion of residential areas in Chennai city - An iconic,
modern commercial office space development christened ‘Tamil Nadu Commerce Hub’ (hereinafter
referred to as the subject development) has been envisaged to accommodate public and private sector
entities.
The same is proposed to be developed on two land parcels along Anna Salai:
Land Parcel 1 (Subject Property 1) – Comprises for 2 non-contiguous land parcels located on either
side of Anna Salai, Nandanam admeasuring approx. 9.65 acres
Land Parcel 2 (Subject Property 2) – Comprises for 1 contagious parcel located of Anna Salai,
Teynampet admeasuring approx. 1.4 acres
In this context, the Client has appointed CBRE to advice on the ‘Pre-Feasibility Study’ for the envisaged
development with a view to opine on the optimal product mix, potential demand of commercial
development and devise development strategies for the same.
A. PROJECT INTRODUCTION
2
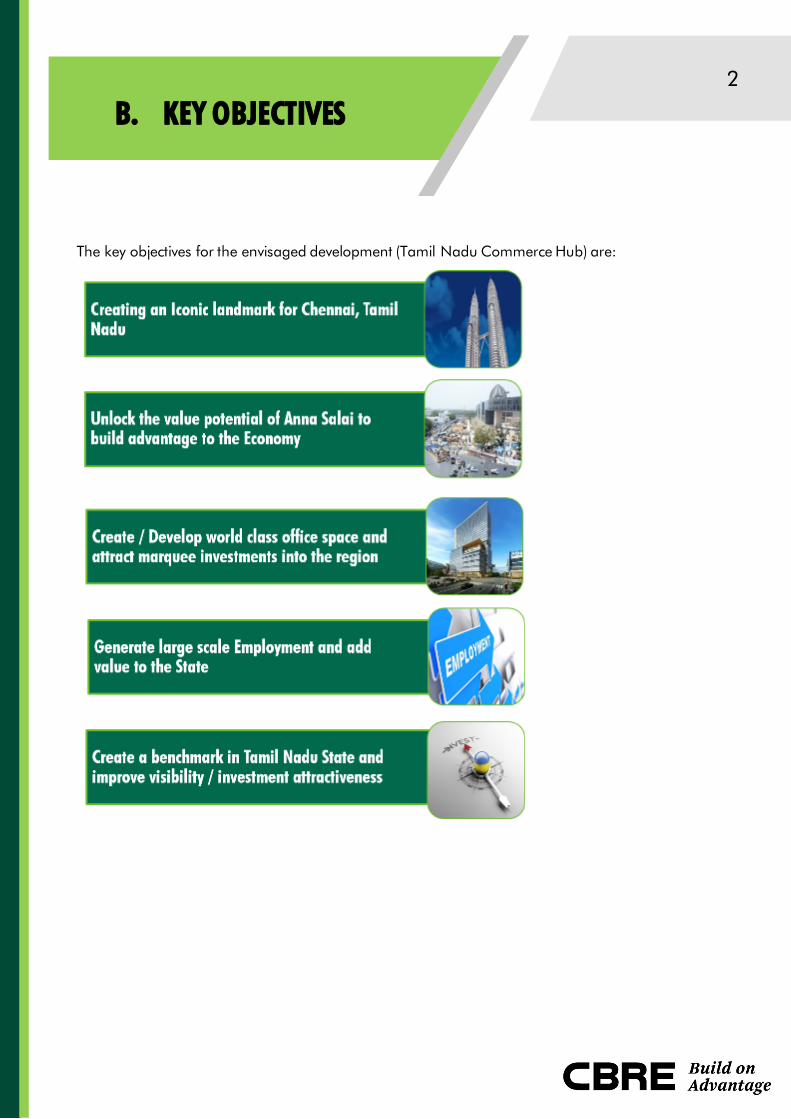
The key objectives for the envisaged development (Tamil Nadu Commerce Hub) are:
B. KEY OBJECTIVES
FINAL REPORT – PRE-FEASIBILITY FOR TAMIL NADU COMMERCE HUB | 3
Contents
A. PROJECT INTRODUCTION ....................................................................................................1
B. KEY OBJECTIVES ...................................................................................................................2
Module 1: Chennai Overview..........................................................4
Module 2: Region and Site Assessment ............................................10
Module 3: Commercial Office Market Assessment ..............................23
Module 4: Case Studies – Iconic Commercial Office Developments ........46
Module 5: Opportunity Assessment – CBD and Off CBD zones ..............51
Module 6: Demand Assessment .....................................................53
Module 7: Product Mix Recommendations ........................................57
Module 8: Development Option Formats..........................................64
Module 9: SWOT & Conclusion .....................................................65

FINAL REPORT – PRE-FEASIBILITY FOR TAMIL NADU COMMERCE HUB | 4
Module 1: Chennai Overview
A. Brief overview of Chennai City
Chennai, the capital of the state of Tamil Nadu is located along the eastern sea coast in the south of
India. As per census 2011, Chennai houses a population of 8.65 million and is the fourth largest urban
agglomeration in the country in terms of population.
The Chennai Metropolitan area spans 8,989 sq.km covering the districts of Chennai, Kancheepuram,
Thiruvallur and parts of Vellore district. The development in the Chennai Metropolitan area is regulated
by the Chennai Metropolitan Development Authority (CMDA).
Location of Chennai with context to India
Source: CBRE Research
As per the budget of 2018 – 2019, the state has witnessed moderate growth and the GSDP growth rate
at constant prices in 2017 – 2018 is estimated to be 8.03%. I t is also anticipated that the economy will
grow faster and thereby enabling the State to reach 9% growth rate in 2018-2019.
Chennai, in the year 2016 – 2017 was a key contributor to the nation’s GDP, contributing approx. USD
66 billion. The economic base of the city is primarily constituted by Automobile Manufacturing, IT/ITeS
enabled services and Banking & Finance sectors.
The city boasts of a designated IT/ITeS corridor called the Rajiv Gandhi Salai, which is a 25-km long
corridor located in the south of the city which was an initiative by the Government of Tamil Nadu to attract
large scale IT investments in to the city and also create an eco-system for the sector. The city is home to
approx. 1million IT/ITeS Professionals professionals, working in over 4,200 companies.1
1 Estimated by CBRE Research as an extrapolation of commercial office space activity in the market
Figure 1
FINAL REPORT – PRE-FEASIBILITY FOR TAMIL NADU COMMERCE HUB | 5
The city is also known as ‘Detroit of India’ owing to the presence of a robust automobile sector. The city
also witnesses the presence of prominent automobile companies such as Nissan, Hyundai, Ashok
Leyland, TVS, Royal Enfield etc.
Chennai has a strong workforce across the cross section of industries which is a reflection of the robust
education infrastructure present in the city coupled by the prevailing industry eco-system. As per census
2011, the literacy rate of the city is 90.18%, which is the second highest in the country. The city witnesses
the presence of more than 170 engineering colleges with an annual intake of approx. 53,000 students.
A few reputed colleges in the city are Indian Institute of Madras, College of Engineering, Madras Institute
of Technology, SRM University.
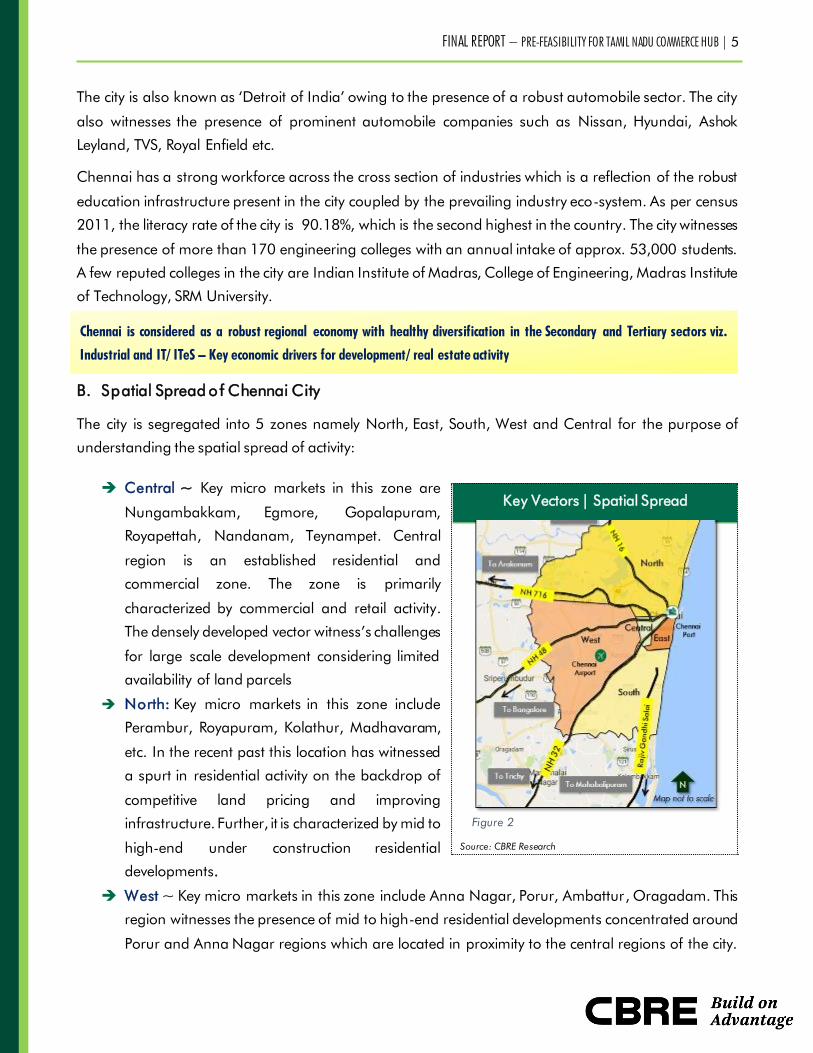
B. Spatial Spread o f Chennai City
The city is segregated into 5 zones namely North, East, South, West and Central for the purpose of
understanding the spatial spread of activity:
Central ~ Key micro markets in this zone are
Nungambakkam, Egmore, Gopalapuram,
Royapettah, Nandanam, Teynampet. Central
region is an established residential and
commercial zone. The zone is primarily
characterized by commercial and retail activity.
The densely developed vector witness’s challenges
for large scale development considering limited
availability of land parcels
North: Key micro markets in this zone include
Perambur, Royapuram, Kolathur, Madhavaram,
etc. In the recent past this location has witnessed
a spurt in residential activity on the backdrop of
competitive land pricing and improving
infrastructure. Further, it is characterized by mid to
high-end under construction residential
developments.
West ~ Key micro markets in this zone include Anna Nagar, Porur, Ambattur, Oragadam. This
region witnesses the presence of mid to high-end residential developments concentrated around
Porur and Anna Nagar regions which are located in proximity to the central regions of the city.
Key Vectors | Spatial Spread
Source: CBRE Research
Chennai is considered as a robust regional economy with healthy diversification in the Secondary and Tertiary sectors viz.
Industrial and IT/ ITeS – Key economic drivers for development/ real estate activity
Figure 2
FINAL REPORT – PRE-FEASIBILITY FOR TAMIL NADU COMMERCE HUB | 6
Regions located further away like Oragadam, Sriperumbudur, etc. are key industrial/logistics hub
of the city primarily catering to the automobile and manufacturing industries.
East ~ Key micro markets in this zone include Alwarpet, Santhome, MRC Nagar, etc. Considering
the premium-ness of the location owing to the proximity to sea and the CBD areas, the region
has evolved into a luxury/ high end residential vector; Additionally, the region witnesses fair
amount of commercial and support retail activity
South ~ Key micro markets in this zone are Adyar, Velachery, Taramani, Shollingnallur,
Semmancheri. Both Rajiv Gandhi Salai (designated IT/ITeS corridor) and the Grand Southern
Trunk (GST) Road, have been key vectors and contribute to majority share of supply and
absorption from a residential and commercial front. Peripheral markets in this region is further
characterized by the availability of large land parcels.
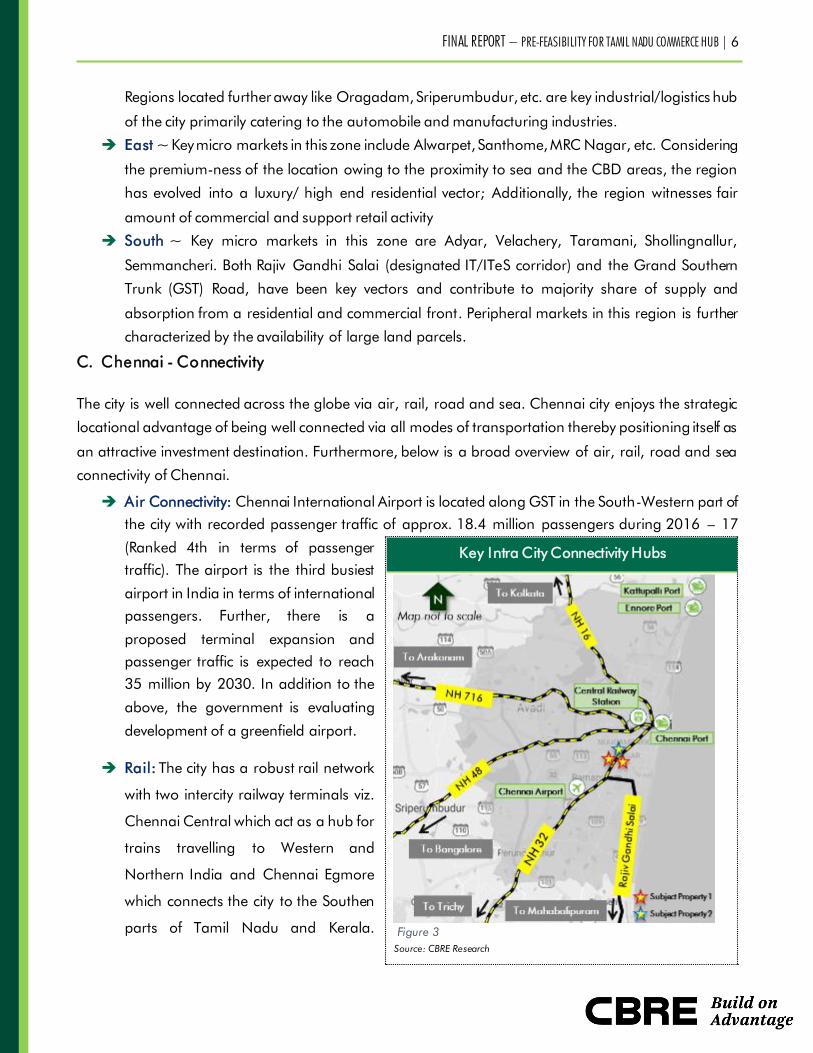
C. Chennai - Connectivity
The city is well connected across the globe via air, rail, road and sea. Chennai city enjoys the strategic
locational advantage of being well connected via all modes of transportation thereby positioning itself as
an attractive investment destination. Furthermore, below is a broad overview of air, rail, road and sea
connectivity of Chennai.
Air Connectivity: Chennai International Airport is located along GST in the South-Western part of
the city with recorded passenger traffic of approx. 18.4 million passengers during 2016 – 17
(Ranked 4th in terms of passenger
traffic). The airport is the third busiest
airport in India in terms of international
passengers. Further, there is a
proposed terminal expansion and
passenger traffic is expected to reach
35 million by 2030. In addition to the
above, the government is evaluating
development of a greenfield airport.
Rail: The city has a robust rail network
with two intercity railway terminals viz.
Chennai Central which act as a hub for
trains travelling to Western and
Northern India and Chennai Egmore
which connects the city to the Southen
parts of Tamil Nadu and Kerala.
Key Intra City Connectivity Hubs
Source: CBRE Research
Figure 3

FINAL REPORT – PRE-FEASIBILITY FOR TAMIL NADU COMMERCE HUB | 7
Approx. 550,000 passengers use these terminals on a daily basis.
Road: Four major national highways traverse through Chennai, connecting it with other major
cities both within and outside Tamil Nadu.
o NH 716 – connects Chennai with Kadappa in Andhra Pradesh. Traverses through
Tiruvallu, Tiruttani in Tamil Nadu and Renigunta in Andhra Pradesh
o NH 16 – forms a part of the golden quadrilateral and connects the city to Kolkata.
Traverses through 4 states viz. Tamil Nadu, Andhra Pradesh, Odisha and West Bengal
o NH 48 – connects Chennai with Bengaluru ~ a prominent economic destination in
South India.
o NH 32 – also called as GST road runs along the spine of the state, connecting
prominent cities of the state viz. Tindivanam, Trichy, Madurai etc.
Sea: Chennai is well connected to south east Asia, countries in Africa and middle-east via sea.
Chennai houses 3 ports namely Chennai Port, Kamarajar Port and Adani Kattupalli Port.
D. Intra-City Connectivity / Key Physical Infrastructure Initiatives
Strong road and rail network have ensured excellent connectivity to key activity hubs in the city. Rail
network comprising of MRTS and Suburban rail ensure seamless connectivity from major residential
pockets to economic hubs. Development activity in Chennai is mostly radial although it is a coastal city.
Therefore, infrastructure initiatives like the inner ring road, outer ring road and the peripheral ring road
along multiple circumference layers of the city provide good connectivity to various nodes. Below is a
broad level outline of the existing and proposed infrastructure initiatives in the city:
Suburban Rail: Three lines each traversing through the north, south and west of the city have
ensured smooth connectivity across key economic hubs in the city, connecting micro-markets in
the CBD such as Egmore, Nungambakkam, Saidapet to peripheral markets of Tambaram,
Villivakkam, Avadi etc. The suburban rail plys over 550 services on a daily basis and more than
1.46 million people use the suburban rail network. Thus, the existing suburban rail network shall
ensure good connectivity of the subject properties to peripheral locations of the city where there
is presence of significant residential activity
FINAL REPORT – PRE-FEASIBILITY FOR TAMIL NADU COMMERCE HUB | 8
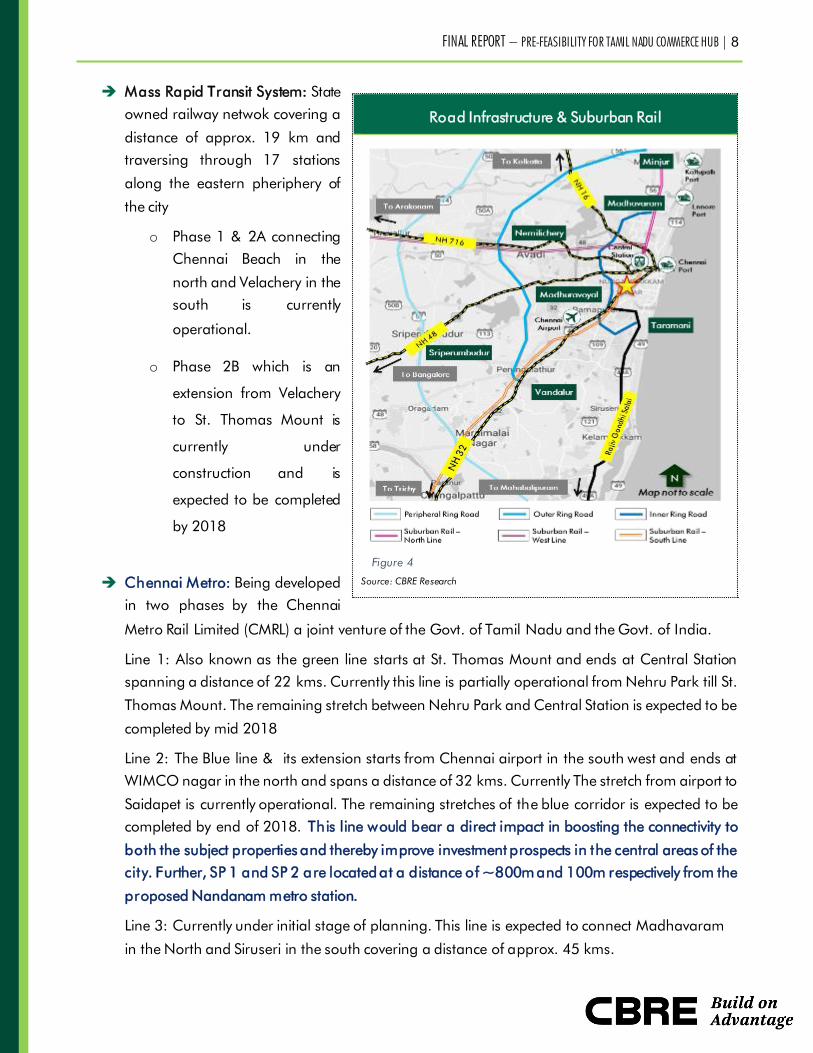
Mass Rapid Transit System: State
owned railway netwok covering a
distance of approx. 19 km and
traversing through 17 stations
along the eastern pheriphery of
the city
o Phase 1 & 2A connecting
Chennai Beach in the
north and Velachery in the
south is currently
operational.
o Phase 2B which is an
extension from Velachery
to St. Thomas Mount is
currently under
construction and is
expected to be completed
by 2018
Chennai Metro: Being developed
in two phases by the Chennai
Metro Rail Limited (CMRL) a joint venture of the Govt. of Tamil Nadu and the Govt. of India.
Line 1: Also known as the green line starts at St. Thomas Mount and ends at Central Station
spanning a distance of 22 kms. Currently this line is partially operational from Nehru Park till St.
Thomas Mount. The remaining stretch between Nehru Park and Central Station is expected to be
completed by mid 2018
Line 2: The Blue line & its extension starts from Chennai airport in the south west and ends at
WIMCO nagar in the north and spans a distance of 32 kms. Currently The stretch from airport to
Saidapet is currently operational. The remaining stretches of the blue corridor is expected to be
completed by end of 2018. This line would bear a direct impact in boosting the connectivity to
both the subject properties and thereby improve investment prospects in the central areas of the
city. Further, SP 1 and SP 2 are located at a distance of ~800m and 100m respectively from the
proposed Nandanam metro station.
Line 3: Currently under initial stage of planning. This line is expected to connect Madhavaram
in the North and Siruseri in the south covering a distance of approx. 45 kms.
Road Infrastructure & Suburban Rail
Source: CBRE Research
Figure 4
FINAL REPORT – PRE-FEASIBILITY FOR TAMIL NADU COMMERCE HUB | 9
Line 4: Currently under initial stage of planning. The line spanning a distance of approx. 17
kms is expected to connect Koyambedu in the west and Lighhouse in the east bisecting the city
horizontally.
Line 5: Currently under initial stages of planning. This line is expected to run along the eastern
pheriphery of the city from Madhavaram in the north till Shollinganallur in the south covering a
distance of approx. 44 kms
Inner Ring Road: This key transport corridor located within the city, acts as a decongester of traffic
along a 25 km stretch which includes key micro-markets such as Thiruvanmiyur, Velachery,
Guindy, Koyambedu, Anna Nagar, Padi and Madhavaram
Outer Ring Road: A 62.3 km stretch running along the external parts of the city. Phase 1 connects
Vandalur micro market on NH 32 till Nemilichery via Nazarethpettai and running along micro-
markets of Perungalathur, Thirumazhaisai, Pattabhiram etc. Phase 2 connects Nemilichery with
Nallur on NH 716. Currently Phase 1 is fully completed and operationnal, Phase 2 is partially
operational and is expected to be completed by 2018 end
Peripheral Ring Road: A proposed radial road covering 162 kms connecting Poonjeri in the South
with Kaatupalli in the North. The road is designed to cut across the National Highway in the
pheriphery of the city.
With robust connectivity via all modes of transportation and excellent intra city physical infrastructure availability, Chennai is
considered to offer one of the best infrastructure quality in South India;
Further, both the subject properties are extremely well positioned to benefit from the mega infrastructure initiative of metro
connectivity, suburban rail and road accessibility.
FINAL REPORT – PRE-FEASIBILITY FOR TAMIL NADU COMMERCE HUB | 10
Module 2: Region and Site Assessment
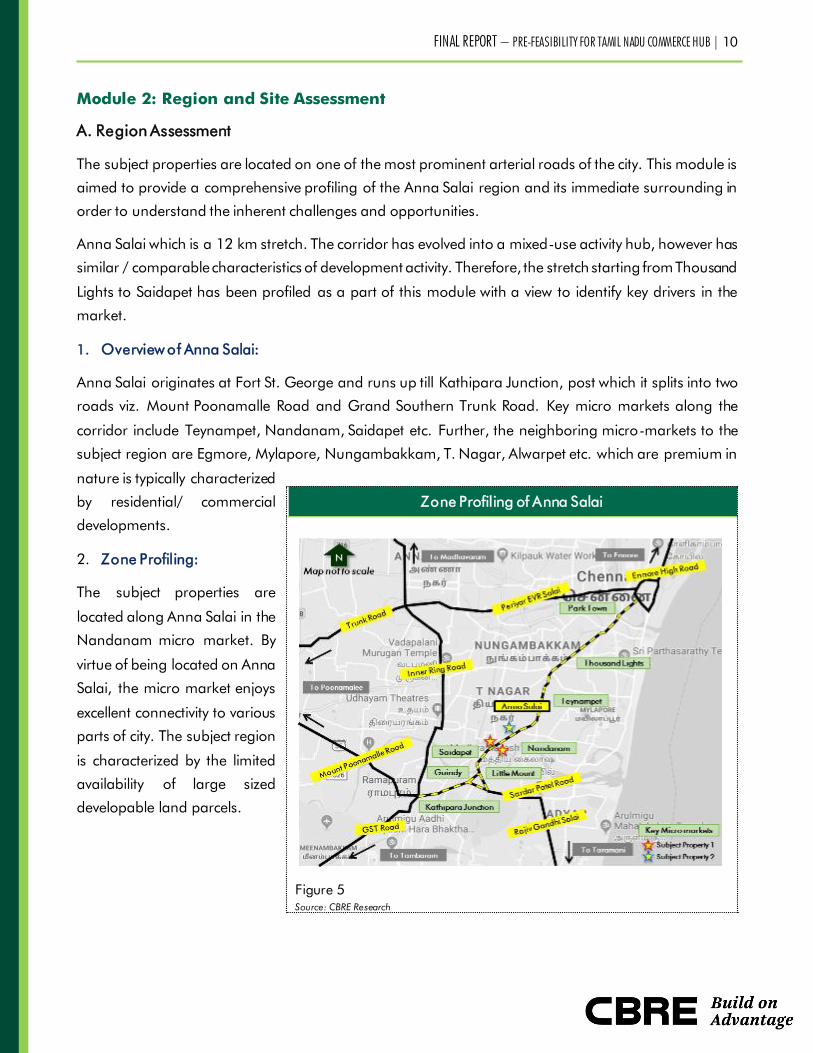
A. Region Assessment
The subject properties are located on one of the most prominent arterial roads of the city. This module is
aimed to provide a comprehensive profiling of the Anna Salai region and its immediate surrounding in
order to understand the inherent challenges and opportunities.
Anna Salai which is a 12 km stretch. The corridor has evolved into a mixed-use activity hub, however has
similar / comparable characteristics of development activity. Therefore, the stretch starting from Thousand
Lights to Saidapet has been profiled as a part of this module with a view to identify key drivers in the
market.
1. Overview of Anna Salai:
Anna Salai originates at Fort St. George and runs up till Kathipara Junction, post which it splits into two
roads viz. Mount Poonamalle Road and Grand Southern Trunk Road. Key micro markets along the
corridor include Teynampet, Nandanam, Saidapet etc. Further, the neighboring micro-markets to the
subject region are Egmore, Mylapore, Nungambakkam, T. Nagar, Alwarpet etc. which are premium in
nature is typically characterized
by residential/ commercial
developments.
2. Zone Profiling:
The subject properties are
located along Anna Salai in the
Nandanam micro market. By
virtue of being located on Anna
Salai, the micro market enjoys
excellent connectivity to various
parts of city. The subject region
is characterized by the limited
availability of large sized
developable land parcels.
Zone Profiling of Anna Salai
Figure 5
Source: CBRE Research

FINAL REPORT – PRE-FEASIBILITY FOR TAMIL NADU COMMERCE HUB | 11
3. Mapping of key developments: Development activity in the corridor has been classified under the heads of commercial office spaces, retail mall
developments, hospitality developments and independent office building by corporates/ business houses.
Mapping of Key Developments in the Zone
Source: CBRE Research
Figure 6
FINAL REPORT – PRE-FEASIBILITY FOR TAMIL NADU COMMERCE HUB | 12
The subject corridor viz. Anna Salai owing to its location attributes of being in the city of the city with
excellent connectivity and accessibility has evolved into one of the coveted and busy real estate corridors
in the city witnessing commercial and retail activity.
Commercial office space activity – Majority of development activity in the corridor is characterized by
commercial office space developments. A fair share of developments in the region are old, and hence are
categorized as Grade B developments. However, new supply additions in the market are typically Grade A
developments. A few investment grade developments in the vicinity of the subject property are Prestige
Palladium, Prestige Polygon, etc. A premium image is associated with the micro market considering
visibility, connectivity and accessibility of the region.
Additionally, the region also witnesses the presence of a few individual campuses/office developments of
large corporates viz. MRF, TVS, Balmer & Lawrie, Sundaram Group, etc.
Retail office space activity - Spencer plaza on Anna Salai marked the development of organized retail mall
activity in the city in early 2000s; Currently the location witness’s presence of another retail mall
development viz. Express Avenue Mall. Additionally, the lower floors of commercial office developments
are used as a h street retail area catering to banks, auto showrooms, food and beverage, etc.
Hospitality activity - Anna Salai contributes to to approx. 20% of hospitality in the city catering to both
business and leisure segment travelers. Anna Salai is home to national and international hotel brands in
the city viz. viz. ITC Grand Chola, Park Hyatt, Hyatt Regency etc.
Residential real estate activity - The region is densely populated and is mostly characterized by independent
dwelling units located in the central part of the city. Further, there is also a considerable supply of
unorganized residential apartments in the region. A few under construction residential developments in the
region are Olympia Goodwood Residences, Casa Grande Monte Carlo, etc.
Over time, this region has established into a self-sustained economic hub with presence of evolved real
estate activities across segments.
FINAL REPORT – PRE-FEASIBILITY FOR TAMIL NADU COMMERCE HUB | 13
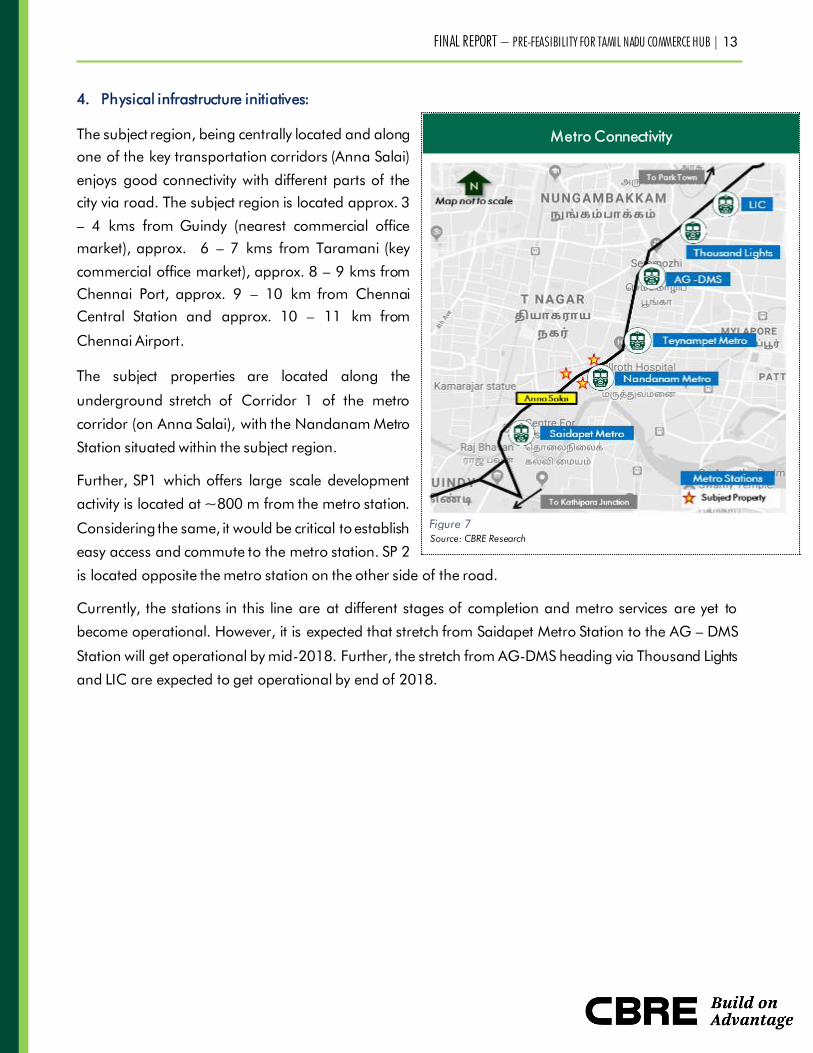
4. Physical infrastructure initiatives:
The subject region, being centrally located and along
one of the key transportation corridors (Anna Salai)
enjoys good connectivity with different parts of the
city via road. The subject region is located approx. 3
– 4 kms from Guindy (nearest commercial office
market), approx. 6 – 7 kms from Taramani (key
commercial office market), approx. 8 – 9 kms from
Chennai Port, approx. 9 – 10 km from Chennai
Central Station and approx. 10 – 11 km from
Chennai Airport.
The subject properties are located along the
underground stretch of Corridor 1 of the metro
corridor (on Anna Salai), with the Nandanam Metro
Station situated within the subject region.
Further, SP1 which offers large scale development
activity is located at ~800 m from the metro station.
Considering the same, it would be critical to establish
easy access and commute to the metro station. SP 2
is located opposite the metro station on the other side of the road.
Currently, the stations in this line are at different stages of completion and metro services are yet to
become operational. However, it is expected that stretch from Saidapet Metro Station to the AG – DMS
Station will get operational by mid-2018. Further, the stretch from AG-DMS heading via Thousand Lights
and LIC are expected to get operational by end of 2018.
Metro Connectivity
Source: CBRE Research
Figure 7

FINAL REPORT – PRE-FEASIBILITY FOR TAMIL NADU COMMERCE HUB | 14
B. Si te Assessment
This section provides a detailed understanding of the subject land parcels and the various attributes it
possesses that determine the development potential at the subject site. A detailed overview of the subject
land parcels has been enumerated below:
Land parcel 1 (9.65 acres):2
Parameter Detail CBRE Comments
Area
9.65 acres (North side parcel: 8.15 acres3, South side parcel:
1.50 acres)
Fairly large sized land
parcel located on Anna
Salai; There is limited
avalability of similar sized
developable land parcels in
the CBD region
Contiguity &
Shape
Two non-contiguous land parcels located on either sides of Anna
Salai
North side land parcel is irregular in shape and cut across by
multiple roads. However, based on client inputs, we understand
that certain adjustments to the exisiting roads will be made to
derive a large continuous developable area.
Additionally, the secondary access for the SP of the North side
land, further divides the land parcel into smaller chunk of <1acre
South side land parcel is fairly regular in shape
Non contiguous nature
would help us develop a
distingished product mix
where there would be an
opportunity to segregate /
zone / asset classes based
on proposed best use on
each of the sites, however
still function as a single unit
Current
Usage
The North side land parcel currently houses Periyar EVR building,
HIG apartments, TNHB staff quarters, TNHB land (with built up
structure for varied use). The South side land parcel currenty
houses the TNHB head office
We understand that
applicable compensations
will be made to existing
occupiers; However, we feel
that it is a great opportunity
to house key government
departments in the
proposed development
Access Roads
The primary access for the subject properties is via Anna Salai.
The North side land parcel enjoys a secondary access via Model
Hutment Road (situated off Anna Salai)
Excellent connectivity and
accessibility from one of the
key arterial roads of the city;
Additional roads provide
opportunity in ease of
2 Based on discussions with the client, we understand that the current land would be realigned and the new land
layout as provided has been used for this study
3 Inclusive of proposed roads

FINAL REPORT – PRE-FEASIBILITY FOR TAMIL NADU COMMERCE HUB | 15
Parameter Detail CBRE Comments
operations for a large scale
development
Frontage
North side land has a frontage of approx. 400 ft and for South
side land has a frontage of approx. 200 ft
Post the proposed
consolidation of the site, the
North side land parcel will
enjoy signigicant frontage
on three sides
The South side land parcel
enjoys considerable
frontage along Anna Salai
Metro
Connectivity
SP is located at a distance of ~800 m from the proposed
Nandanam Metro Station
Considering, the possible
large scale development on
the subject property, it
would be critical to provide
seamless connectivity to the
metro station so that the
proposed development can
directly benefit
Development
Potential4
S ite 1 - North
Particulars Scenario 1 Scenario 2 Scenario 3
Ground Coverage 30% 30 - 40% 40 - 50%
Total land area
(acres) 8.15 8.15 8.15
Proposed road 1
(acres) 1.66 1.66 1.66
Proposed road 2
(acres) 0.2 0.2 0.2
Balance net extent
(acres) 6.29 6.29 6.29
FSI applicable5 6
2.5 2.25 2
Built-up Area (sft)
(FSI x Balance net
ex tent)
684,981 616,483 547,985
Site 1 - South
Adequate road width and
frontage would aid in
accomplishment of
maximum permissible FSI at
a 30% ground coverage.
The land parcels would also
be eligible for a premium
FSI of 40% (if required)
4 As per Development control regulations illustrated in Second master plan for Chennai Metropolitan Area, 2026
and Client Inputs
5 A premium FSI of 40% of the current achievable FSI could also be purchased from CMDA to increase development
potential
6 If the subject property is developed as an IT/ITeS development, the site extent is not less than 2,000 sqm and
conforms to the other regulations, the FSI shall be allowed at 1.5 times the ordinarily permissible FSI
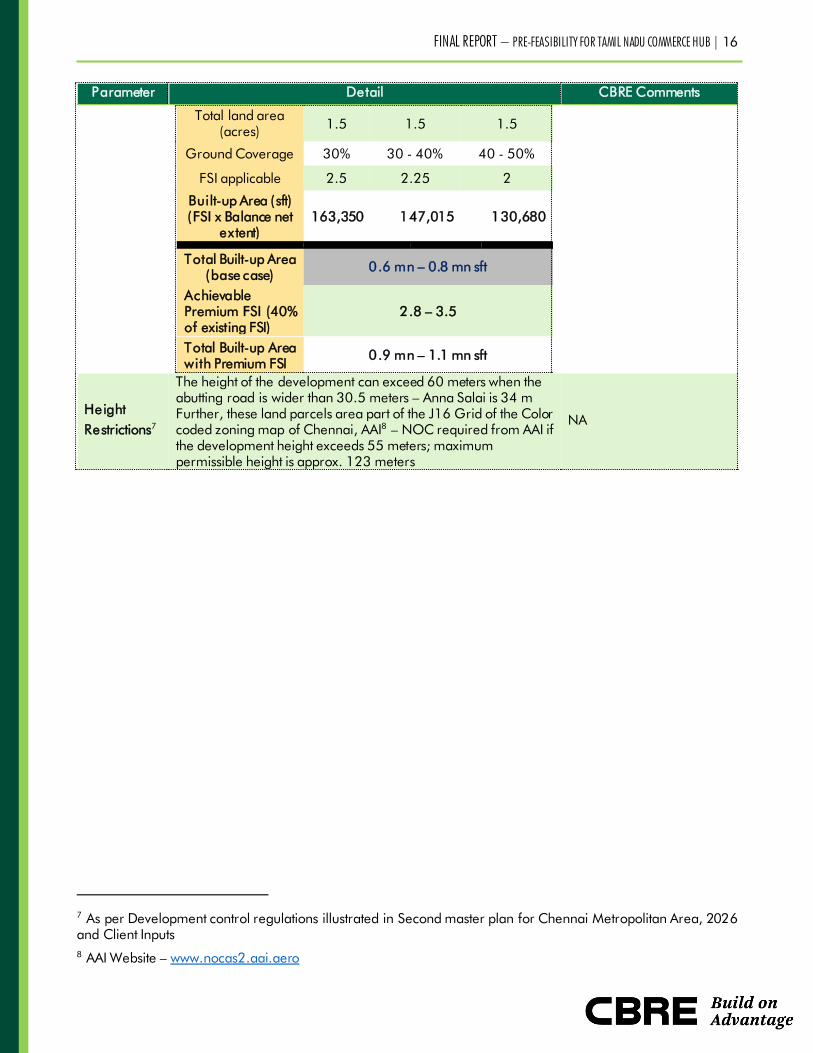
FINAL REPORT – PRE-FEASIBILITY FOR TAMIL NADU COMMERCE HUB | 16
Parameter Detail CBRE Comments
Total land area
(acres) 1.5 1.5 1.5
Ground Coverage 30% 30 - 40% 40 - 50%
FSI applicable 2.5 2.25 2
Built-up Area (sft)
(FSI x Balance net
ex tent)
163,350 147,015 130,680
Total Built-up Area
(base case) 0.6 mn – 0.8 mn sft
Achievable
Premium FSI (40%
of existing FSI)
2.8 – 3.5
Total Built-up Area
with Premium FSI 0.9 mn – 1.1 mn sft
Height
Restrictions7
The height of the development can exceed 60 meters when the
abutting road is wider than 30.5 meters – Anna Salai is 34 m
Further, these land parcels area part of the J16 Grid of the Color
coded zoning map of Chennai, AAI8 – NOC required from AAI if
the development height exceeds 55 meters; maximum
permissible height is approx. 123 meters
NA
7 As per Development control regulations illustrated in Second master plan for Chennai Metropolitan Area, 2026
and Client Inputs
8 AAI Website – www.nocas2.aai.aero

FINAL REPORT – PRE-FEASIBILITY FOR TAMIL NADU COMMERCE HUB | 17
Property Map:
Site 1 | 9.65 acres
Source: CBRE Research
Figure 8
Property Layout:
Existing land utilization Proposed land utilization
Source: The Client Source: The Client
Figure 10 Figure 9

FINAL REPORT – PRE-FEASIBILITY FOR TAMIL NADU COMMERCE HUB | 18
On-ground photographs of the property:
FINAL REPORT – PRE-FEASIBILITY FOR TAMIL NADU COMMERCE HUB | 19
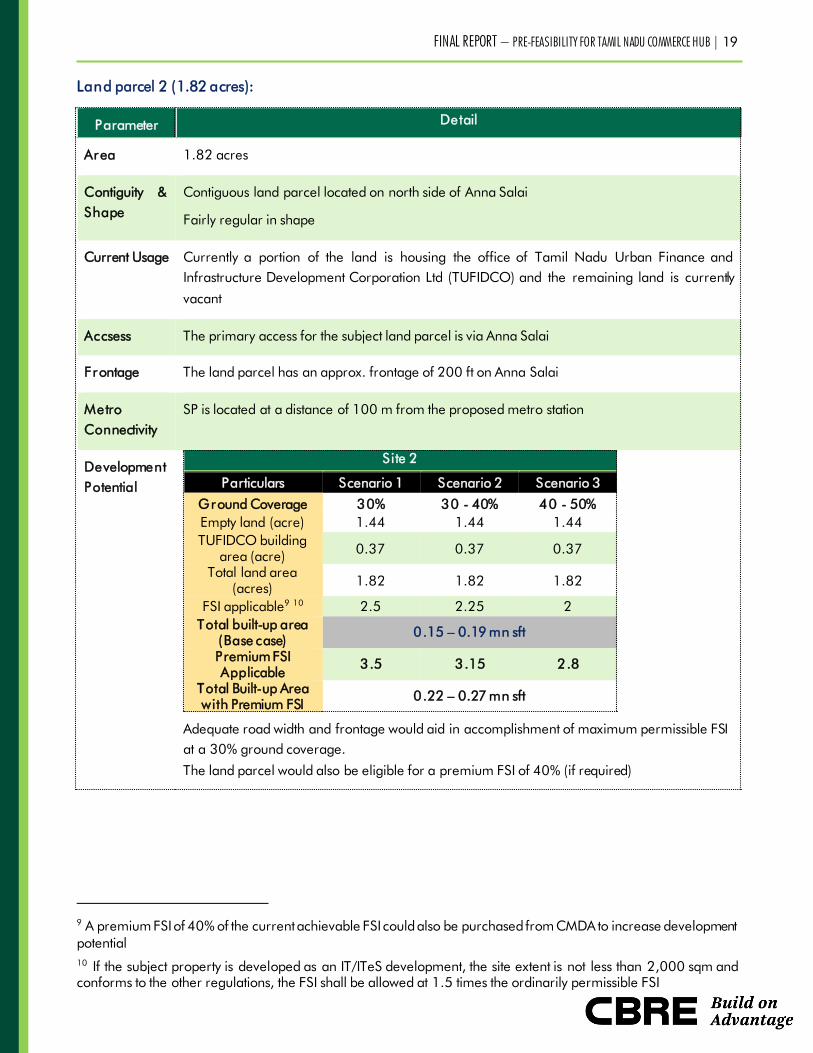
Land parcel 2 (1.82 acres):
Parameter Detail
Area 1.82 acres
Contiguity &
Shape
Contiguous land parcel located on north side of Anna Salai
Fairly regular in shape
Current Usage Currently a portion of the land is housing the office of Tamil Nadu Urban Finance and
Infrastructure Development Corporation Ltd (TUFIDCO) and the remaining land is currently
vacant
Accsess The primary access for the subject land parcel is via Anna Salai
Frontage The land parcel has an approx. frontage of 200 ft on Anna Salai
Metro
Connectivity
SP is located at a distance of 100 m from the proposed metro station
Development
Potential
S ite 2
Particulars Scenario 1 Scenario 2 Scenario 3
Ground Coverage 30% 30 - 40% 40 - 50%
Empty land (acre) 1.44 1.44 1.44
TUFIDCO building
area (acre) 0.37 0.37 0.37
Total land area
(acres) 1.82 1.82 1.82
FSI applicable9 10
2.5 2.25 2
Total built-up area
(Base case) 0.15 – 0.19 mn sft
Premium FSI
Applicable 3.5 3.15 2.8
Total Built-up Area
with Premium FSI 0.22 – 0.27 mn sft
Adequate road width and frontage would aid in accomplishment of maximum permissible FSI
at a 30% ground coverage.
The land parcel would also be eligible for a premium FSI of 40% (if required)
9 A premium FSI of 40% of the current achievable FSI could also be purchased from CMDA to increase development
potential
10 If the subject property is developed as an IT/ITeS development, the site extent is not less than 2,000 sqm and
conforms to the other regulations, the FSI shall be allowed at 1.5 times the ordinarily permissible FSI
FINAL REPORT – PRE-FEASIBILITY FOR TAMIL NADU COMMERCE HUB | 20
Height
Restrictions11
The height of the development can exceed 60 meters when the abutting road is wider than
30.5 meters – Anna Salai is 34 meters wide
Further, these land parcels area part of the J16 Grid of the Color coded zoning map of
Chennai, AAI12
– NOC required from AAI if the development height exceeds 55 meters;
maximum permissible height is approx. 129 meters
Similar observations to that of Subject Property 1 can be summarized for the above described land parcel
as well. Further, there would be an opputunity to distinguish and introduce diffrentiated product in the
market if both the land parcels are conceived as a single concept being introduced in the market.
Property Map:
Site 2
Source: CBRE Research
11 As per Development control regulations illustrated in Second master plan for Chennai Metropolitan Area, 2026
and Client Inputs
12 AAI Website – www.nocas2.aai.aero
Figure 11
FINAL REPORT – PRE-FEASIBILITY FOR TAMIL NADU COMMERCE HUB | 21
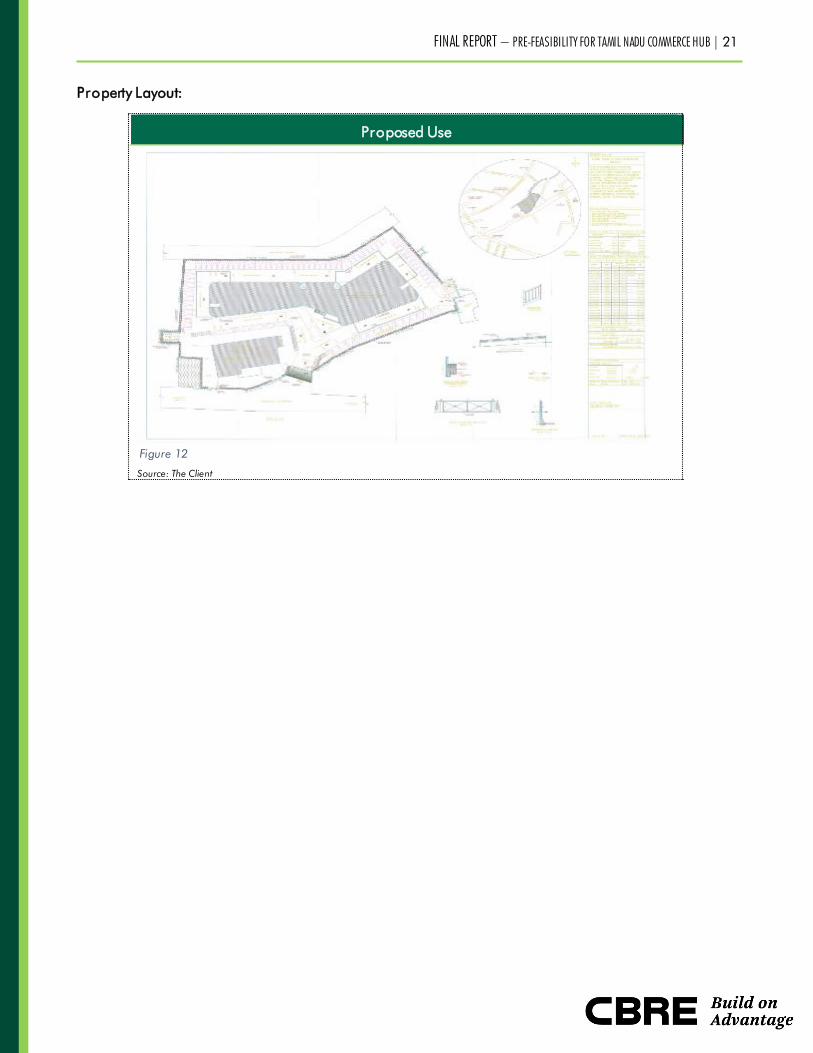
Property Layout:
Proposed Use
Source: The Client
Figure 12
FINAL REPORT – PRE-FEASIBILITY FOR TAMIL NADU COMMERCE HUB | 22
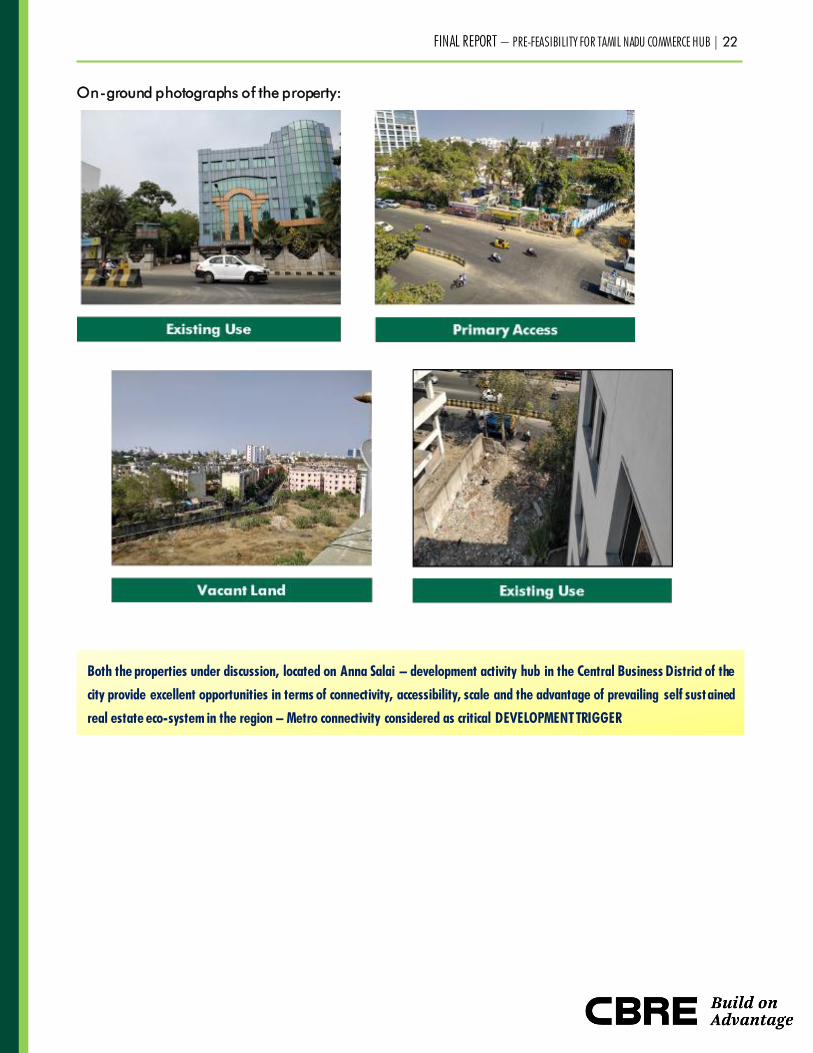
On-ground photographs of the property:
Both the properties under discussion, located on Anna Salai – development activity hub in the Central Business District of the
city provide excellent opportunities in terms of connectivity, accessibility, scale and the advantage of prevailing self sustained
real estate eco-system in the region – Metro connectivity considered as critical DEVELOPMENT TRIGGER
FINAL REPORT – PRE-FEASIBILITY FOR TAMIL NADU COMMERCE HUB | 23
Module 3: Commercial Office Market Assessment
A. India Commercial Office Market Overview
Commercial office space market continues to be the bright
spot for the real estate sector in the country. Steady lease
rentals, high absorption levels and global investor interest
continue to bring life into India’s commercial real estate
sector. The traditional demand driver – the IT/ ITeS sector
continues to maintain dominance across cities over the last
5 years followed by steady demand from Banking,
Financial Services and Insurance (BFSI) and Engineering &
Manufacturing, Research, consulting & analytics, Co-
Working / Business centers, etc. Space take up comprised
of both expansion and new lettings; driven by domestic and
US based occupiers, largely for their back-office operations.
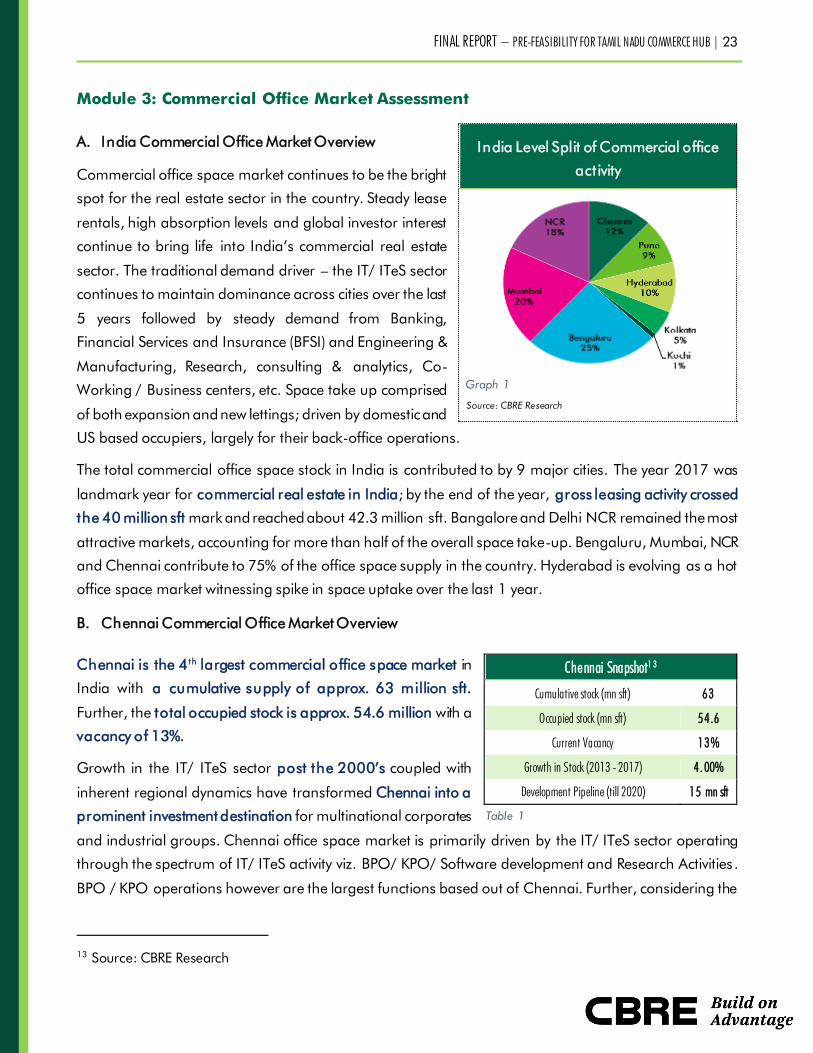
The total commercial office space stock in India is contributed to by 9 major cities. The year 2017 was
landmark year for commercial real estate in India; by the end of the year, gross leasing activity crossed
the 40 million sft mark and reached about 42.3 million sft. Bangalore and Delhi NCR remained the most
attractive markets, accounting for more than half of the overall space take-up. Bengaluru, Mumbai, NCR
and Chennai contribute to 75% of the office space supply in the country. Hyderabad is evolving as a hot
office space market witnessing spike in space uptake over the last 1 year.
B. Chennai Commercial Office Market Overview
Chennai is the 4th largest commercial office space market in
India with a cumulative supply of approx. 63 million sft.
Further, the total occupied stock is approx. 54.6 million with a
vacancy of 13%.
Growth in the IT/ ITeS sector post the 2000’s coupled with
inherent regional dynamics have transformed Chennai into a
prominent investment destination for multinational corporates
and industrial groups. Chennai office space market is primarily driven by the IT/ ITeS sector operating
through the spectrum of IT/ ITeS activity viz. BPO/ KPO/ Software development and Research Activities .
BPO / KPO operations however are the largest functions based out of Chennai. Further, considering the
13 Source: CBRE Research
India Level Split of Commercial office
act ivity
Source: CBRE Research
Chennai Snapshot1 3
Cumulative stock (mn sft) 63
Occupied stock (mn sft) 54.6
Current Vacancy 13%
Growth in Stock (2013 - 2017) 4. 00%
Development Pipeline (till 2020) 15 mn sft
Table 1
Graph 1
FINAL REPORT – PRE-FEASIBILITY FOR TAMIL NADU COMMERCE HUB | 24
diversified economic base of Chennai, key non-IT tenant sectors of BFSI, engineering & manufacturing,
research & consulting, etc. also have small to medium scale operations.
The evolution of organized office space activity in the city traditionally commenced in the CBD region in
the micro markets of Nungambakkam, RK Salai, etc. Office space buildings in the CBD region primarily
catered to non-IT tenants viz. front offices of industrial corporates, corporate offices of business houses
and BFSI segments.
Inauguration of TIDEL Park in the Pre 2000’s and establishment of Rajiv Gandhi Salai (OMR) as the
designated IT corridor of the city marked the onset of IT/ ITeS activity in the city. Onset of large scale
commercial office space activity commenced with the development of OMR which was planned as IT
investment destination around the same time where India was emerging as a global outsourcing
destination. Several large-scale IT Parks, Software Tech Parks, SEZ etc. got developed in the OMR and
other markets in the Secondary Business District during 2000 – 2010. Chennai emerged as one of the
key office space markets in India. Chennai after Bangalore was considered as a preferred office space
destination in South India for Global outsourcing companies. Key developments that were completed
during these years include Ascendas IT Park, RMZ Millenia, Mahindra World City SEZ, DLF Tech Park,
etc. Further, during this phase, pro-active measures were taken by the Tamil Nadu government by
development of IT Parks/ SEZs (land allotments to TCS, CTS, Wipro, Syntel, Polaris, etc.) along with policy
level benefits offering additional FSI for development of IT/ ITeS buildings.
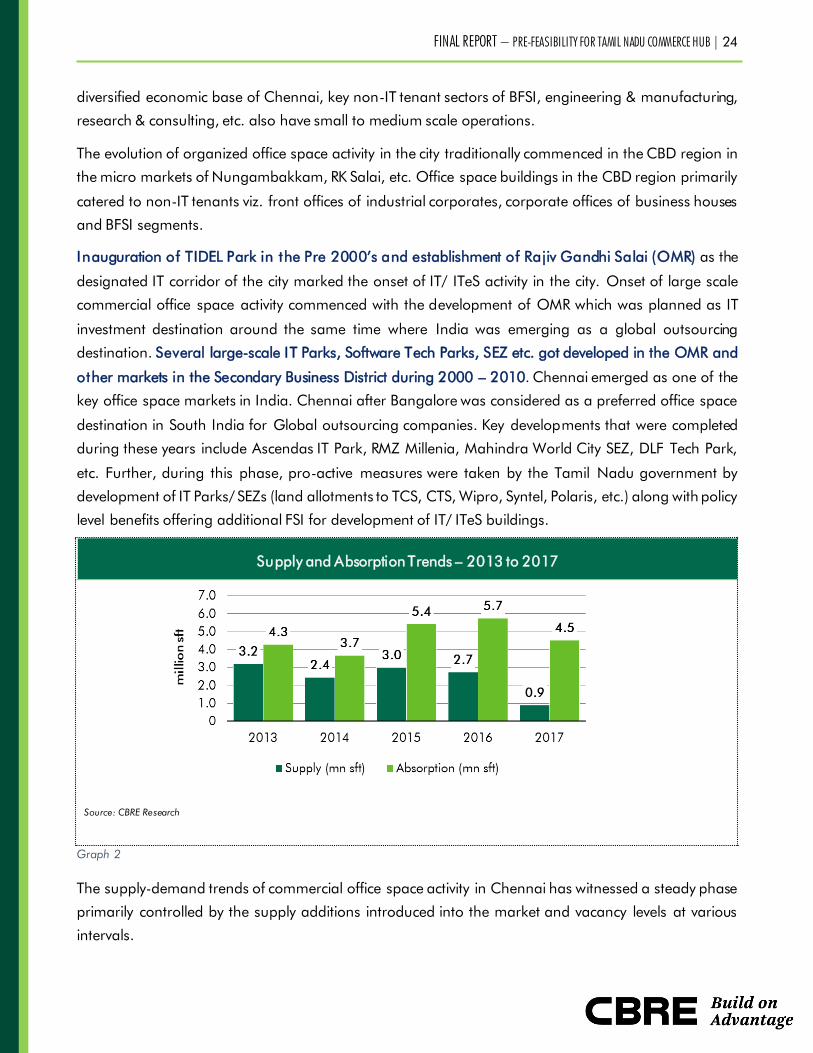
Supply and Absorption Trends – 2013 to 2017
Source: CBRE Research
Graph 2
The supply-demand trends of commercial office space activity in Chennai has witnessed a steady phase
primarily controlled by the supply additions introduced into the market and vacancy levels at various
intervals.
FINAL REPORT – PRE-FEASIBILITY FOR TAMIL NADU COMMERCE HUB | 25
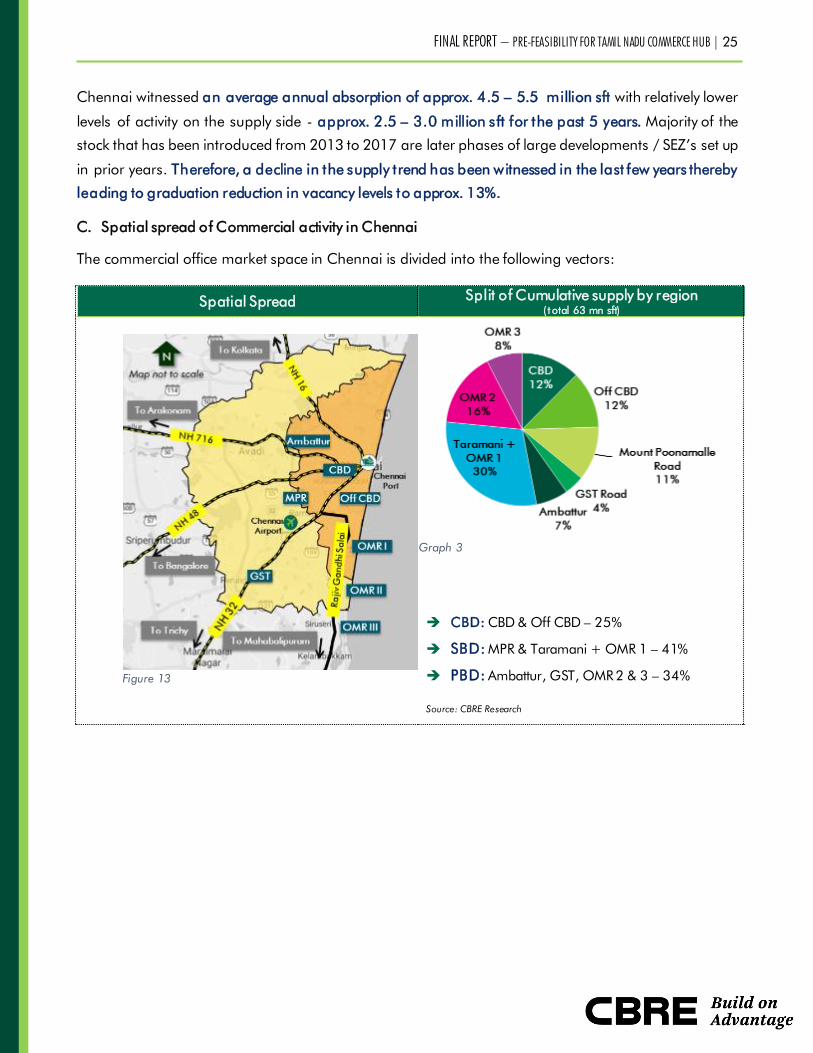
Chennai witnessed an average annual absorption of approx. 4.5 – 5.5 million sft with relatively lower
levels of activity on the supply side - approx. 2.5 – 3.0 million sft for the past 5 years. Majority of the
stock that has been introduced from 2013 to 2017 are later phases of large developments / SEZ’s set up
in prior years. Therefore, a decline in the supply trend has been witnessed in the last few years thereby
leading to graduation reduction in vacancy levels to approx. 13%.
C. Spatial spread of Commercial activity in Chennai
The commercial office market space in Chennai is divided into the following vectors:
Spatial Spread Split of Cumulative supply by region
( t otal 63 mn sft)
CBD: CBD & Off CBD – 25%
SBD: MPR & Taramani + OMR 1 – 41%
PBD: Ambattur, GST, OMR 2 & 3 – 34%
Source: CBRE Research
Figure 13
Graph 3
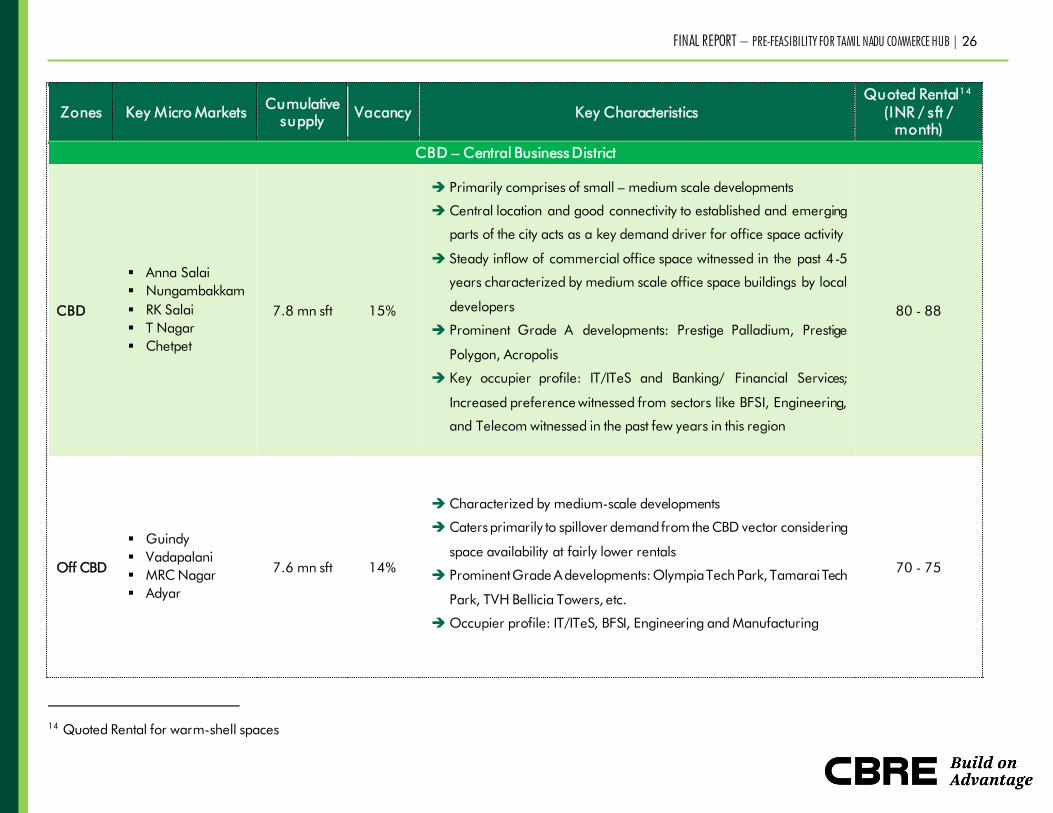
FINAL REPORT – PRE-FEASIBILITY FOR TAMIL NADU COMMERCE HUB | 26
Zones Key Micro Markets Cumulative
supply Vacancy Key Characteristics
Quoted Rental1 4
(INR / sft /
month)
CBD – Central Business District
CBD
▪ Anna Salai
▪ Nungambakkam
▪ RK Salai
▪ T Nagar
▪ Chetpet
7.8 mn sft 15%
Primarily comprises of small – medium scale developments
Central location and good connectivity to established and emerging
parts of the city acts as a key demand driver for office space activity
Steady inflow of commercial office space witnessed in the past 4-5
years characterized by medium scale office space buildings by local
developers
Prominent Grade A developments: Prestige Palladium, Prestige
Polygon, Acropolis
Key occupier profile: IT/ITeS and Banking/ Financial Services;
Increased preference witnessed from sectors like BFSI, Engineering,
and Telecom witnessed in the past few years in this region
80 - 88
Off CBD
▪ Guindy
▪ Vadapalani
▪ MRC Nagar
▪ Adyar
7.6 mn sft 14%
Characterized by medium-scale developments
Caters primarily to spillover demand from the CBD vector considering
space availability at fairly lower rentals
Prominent Grade A developments: Olympia Tech Park, Tamarai Tech
Park, TVH Bellicia Towers, etc.
Occupier profile: IT/ITeS, BFSI, Engineering and Manufacturing
70 - 75
14 Quoted Rental for warm-shell spaces
FINAL REPORT – PRE-FEASIBILITY FOR TAMIL NADU COMMERCE HUB | 27
Zones Key Micro Markets Cumulative
supply Vacancy Key Characteristics
Quoted Rental1 4
(INR / sft /
month)
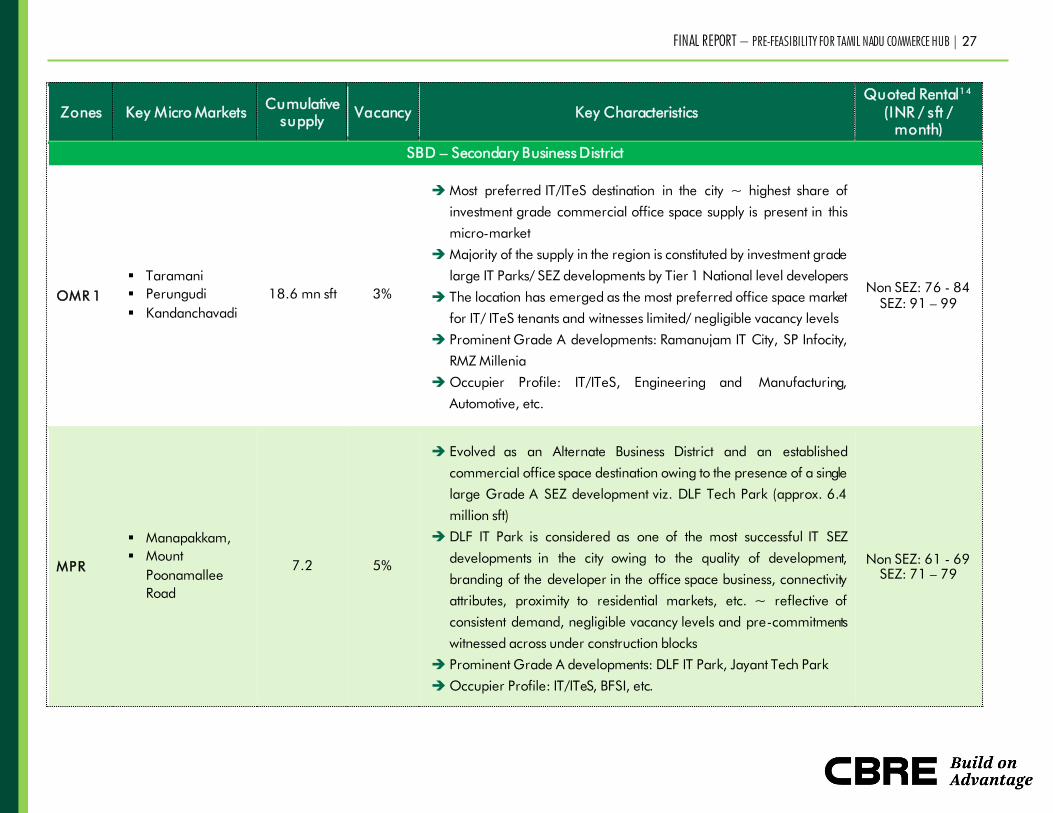
SBD – Secondary Business District
OMR 1
▪ Taramani
▪ Perungudi
▪ Kandanchavadi
18.6 mn sft 3%
Most preferred IT/ITeS destination in the city ~ highest share of
investment grade commercial office space supply is present in this
micro-market
Majority of the supply in the region is constituted by investment grade
large IT Parks/ SEZ developments by Tier 1 National level developers
The location has emerged as the most preferred office space market
for IT/ ITeS tenants and witnesses limited/ negligible vacancy levels
Prominent Grade A developments: Ramanujam IT City, SP Infocity,
RMZ Millenia
Occupier Profile: IT/ITeS, Engineering and Manufacturing,
Automotive, etc.
Non SEZ: 76 - 84
SEZ: 91 – 99
MPR
▪ Manapakkam,
▪ Mount
Poonamallee
Road
7.2 5%
Evolved as an Alternate Business District and an established
commercial office space destination owing to the presence of a single
large Grade A SEZ development viz. DLF Tech Park (approx. 6.4
million sft)
DLF IT Park is considered as one of the most successful IT SEZ
developments in the city owing to the quality of development,
branding of the developer in the office space business, connectivity
attributes, proximity to residential markets, etc. ~ reflective of
consistent demand, negligible vacancy levels and pre-commitments
witnessed across under construction blocks
Prominent Grade A developments: DLF IT Park, Jayant Tech Park
Occupier Profile: IT/ITeS, BFSI, etc.
Non SEZ: 61 - 69
SEZ: 71 – 79
FINAL REPORT – PRE-FEASIBILITY FOR TAMIL NADU COMMERCE HUB | 28
Zones Key Micro Markets Cumulative
supply Vacancy Key Characteristics
Quoted Rental1 4
(INR / sft /
month)
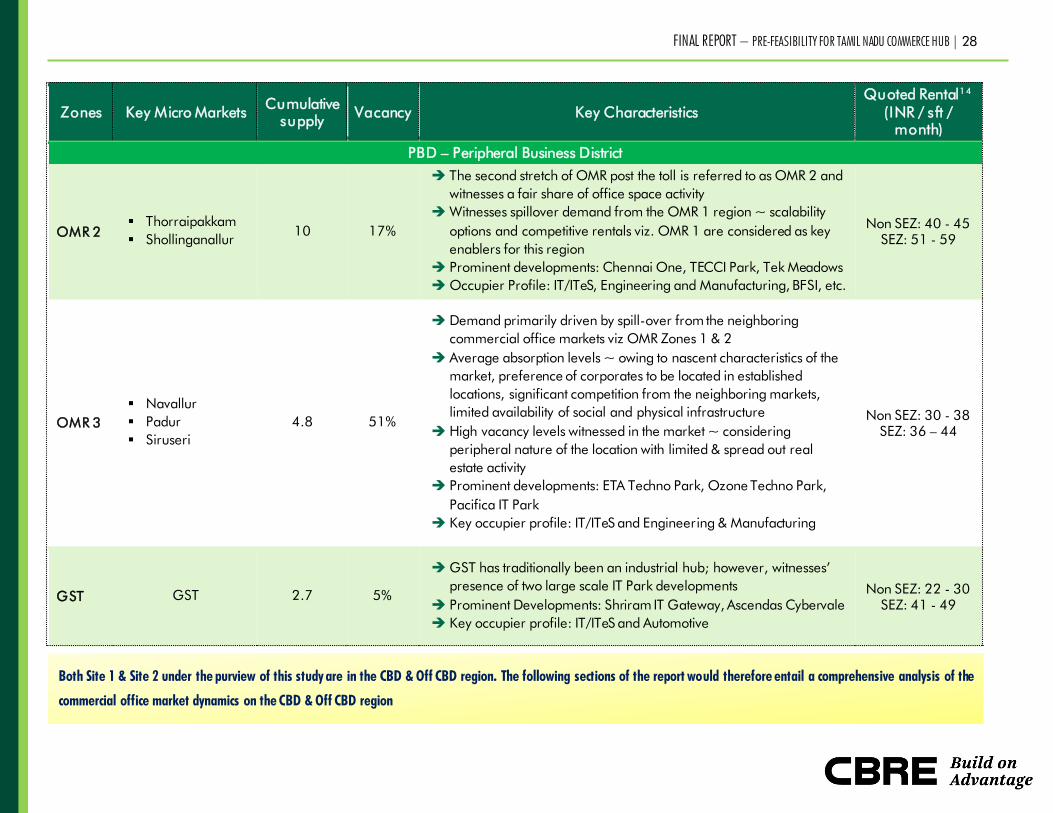
PBD – Peripheral Business District
OMR 2
▪ Thorraipakkam
▪ Shollinganallur 10 17%
The second stretch of OMR post the toll is referred to as OMR 2 and
witnesses a fair share of office space activity
Witnesses spillover demand from the OMR 1 region ~ scalability
options and competitive rentals viz. OMR 1 are considered as key
enablers for this region
Prominent developments: Chennai One, TECCI Park, Tek Meadows
Occupier Profile: IT/ITeS, Engineering and Manufacturing, BFSI, etc.
Non SEZ: 40 - 45
SEZ: 51 - 59
OMR 3
▪ Navallur
▪ Padur
▪ Siruseri
4.8 51%
Demand primarily driven by spill-over from the neighboring
commercial office markets viz OMR Zones 1 & 2
Average absorption levels ~ owing to nascent characteristics of the
market, preference of corporates to be located in established
locations, significant competition from the neighboring markets,
limited availability of social and physical infrastructure
High vacancy levels witnessed in the market ~ considering
peripheral nature of the location with limited & spread out real
estate activity
Prominent developments: ETA Techno Park, Ozone Techno Park,
Pacifica IT Park
Key occupier profile: IT/ITeS and Engineering & Manufacturing
Non SEZ: 30 - 38
SEZ: 36 – 44
GST GST 2.7 5%
GST has traditionally been an industrial hub; however, witnesses’
presence of two large scale IT Park developments
Prominent Developments: Shriram IT Gateway, Ascendas Cybervale
Key occupier profile: IT/ITeS and Automotive
Non SEZ: 22 - 30
SEZ: 41 - 49
Both Site 1 & Site 2 under the purview of this study are in the CBD & Off CBD region. The following sections of the report would therefore entail a comprehensive analysis of the
commercial office market dynamics on the CBD & Off CBD region
FINAL REPORT – PRE-FEASIBILITY FOR TAMIL NADU COMMERCE HUB | 29
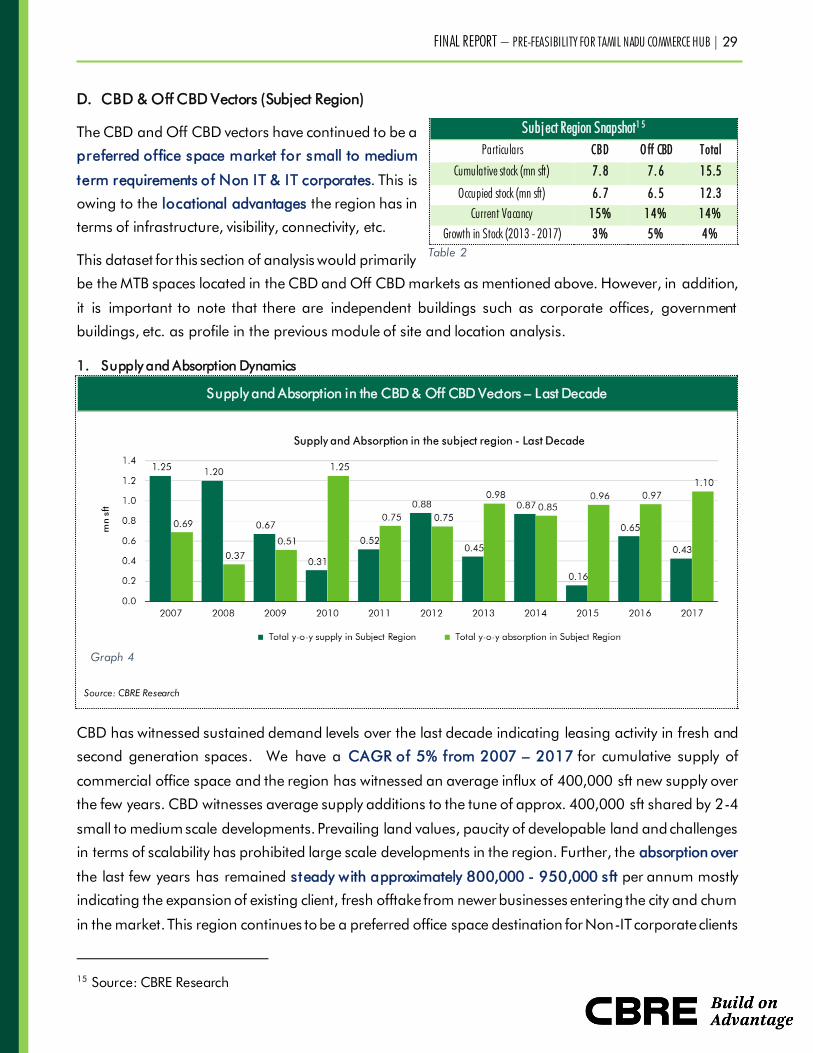
D. CBD & Off CBD Vectors (Subject Region)
The CBD and Off CBD vectors have continued to be a
preferred office space market for small to medium
term requirements of Non IT & IT corporates. This is
owing to the locational advantages the region has in
terms of infrastructure, visibility, connectivity, etc.
This dataset for this section of analysis would primarily
be the MTB spaces located in the CBD and Off CBD markets as mentioned above. However, in addition,
it is important to note that there are independent buildings such as corporate offices, government
buildings, etc. as profile in the previous module of site and location analysis.
1. Supply and Absorption Dynamics
Supply and Absorption in the CBD & Off CBD Vectors – Last Decade
Source: CBRE Research
CBD has witnessed sustained demand levels over the last decade indicating leasing activity in fresh and
second generation spaces. We have a CAGR of 5% from 2007 – 2017 for cumulative supply of
commercial office space and the region has witnessed an average influx of 400,000 sft new supply over
the few years. CBD witnesses average supply additions to the tune of approx. 400,000 sft shared by 2-4
small to medium scale developments. Prevailing land values, paucity of developable land and challenges
in terms of scalability has prohibited large scale developments in the region. Further, the absorption over
the last few years has remained steady with approximately 800,000 - 950,000 sft per annum mostly
indicating the expansion of existing client, fresh offtake from newer businesses entering the city and churn
in the market. This region continues to be a preferred office space destination for Non-IT corporate clients
15 Source: CBRE Research
Subj ect Region Snapshot1 5
Particulars CBD O ff CBD Total
Cumulative stock (mn sft) 7. 8 7. 6 15.5
Occupied stock (mn sft) 6. 7 6. 5 12.3
Current Vacancy 15% 14% 14%
Growth in Stock (2013 - 2017) 3% 5% 4%
Table 2
Graph 4
FINAL REPORT – PRE-FEASIBILITY FOR TAMIL NADU COMMERCE HUB | 30
and front offices of large IT Corporates. Also, the current vacancy is at approx. 14% which is comparable
to the overall vacancy levels in the city. Majority of the vacancy in the market is reflective of newer
development completions (40% of developments that are completed over the last 3 years) and vacancy
in older buildings that are not attractive for clients. Further, based on the current trend of absorption and
considering the new supply which would enter the market in the next two years, we understand that there
would is a supply overhang of ~1.5 - 2 years for marketable spaces in the region.
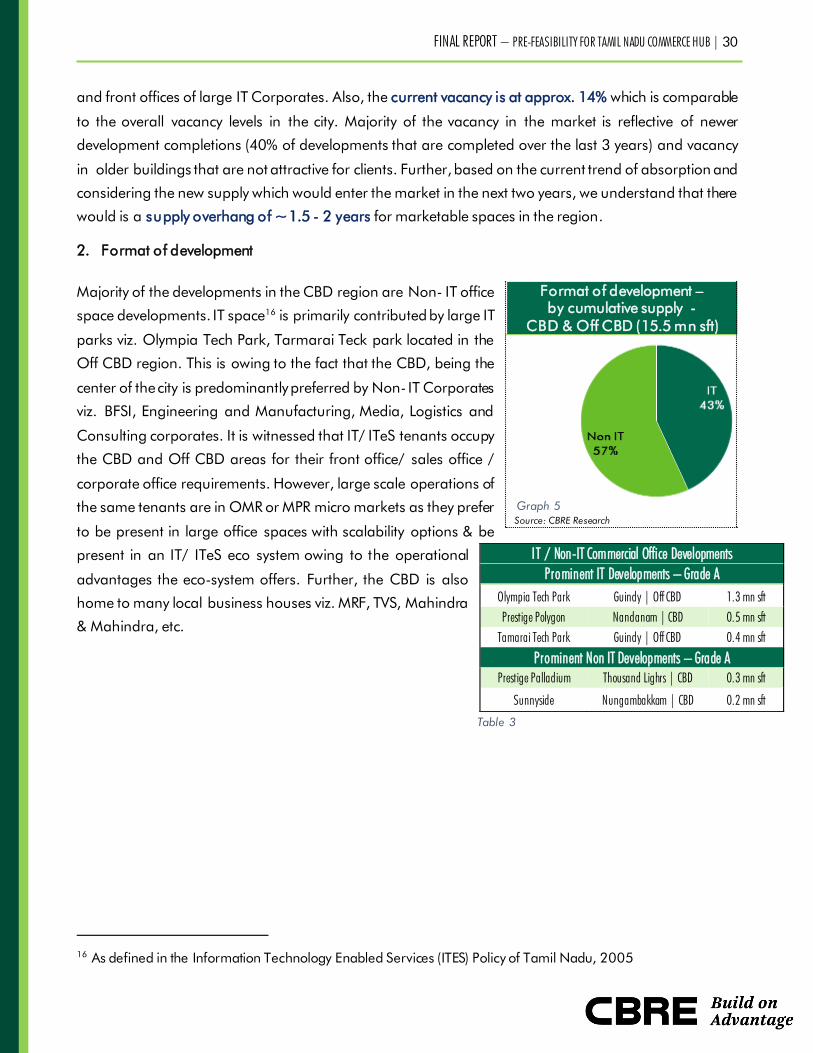
2. Format of development
Majority of the developments in the CBD region are Non- IT office
space developments. IT space16
is primarily contributed by large IT
parks viz. Olympia Tech Park, Tarmarai Teck park located in the
Off CBD region. This is owing to the fact that the CBD, being the
center of the city is predominantly preferred by Non- IT Corporates
viz. BFSI, Engineering and Manufacturing, Media, Logistics and
Consulting corporates. It is witnessed that IT/ ITeS tenants occupy
the CBD and Off CBD areas for their front office/ sales office /
corporate office requirements. However, large scale operations of
the same tenants are in OMR or MPR micro markets as they prefer
to be present in large office spaces with scalability options & be
present in an IT/ ITeS eco system owing to the operational
advantages the eco-system offers. Further, the CBD is also
home to many local business houses viz. MRF, TVS, Mahindra
& Mahindra, etc.
16 As defined in the Information Technology Enabled Services (ITES) Policy of Tamil Nadu, 2005
Format of development –
by cumulative supply -
CBD & Off CBD (15.5 mn sft)
Source: CBRE Research
IT / Non-IT Commercial Office Developments
Prominent IT Developments – Grade A
Olympia Tech Park Guindy | Off CBD 1.3 mn sft
Prestige Polygon Nandanam | CBD 0.5 mn sft
Tamarai Tech Park Guindy | Off CBD 0.4 mn sft
Prominent Non IT Developments – Grade A
Prestige Palladium Thousand Lighrs | CBD 0.3 mn sft
Sunnyside Nungambakkam | CBD 0.2 mn sft
Table 3
Graph 5

FINAL REPORT – PRE-FEASIBILITY FOR TAMIL NADU COMMERCE HUB | 31
3. Grade of Commercial Office Space Developments
Further, the grade of office space development from a
CBD and Off CBD context have played a major role as
they are one of the areas to offer organized office
spaces. Considering the same viz. the age of the
building and the specifications offered, a significant
share of the supply in the CBD & Off CBD region are
today classified as Grade B & C developments.
However, large scale IT Parks in the off CBD region are
predominantly Grade A quality.17
IT commercial office space developments contribute to
approx. 43% of the cumulative supply ~ majority of
which are located in the Off CBD region. Further, we
understand that rentals for developments typically take
the Grade of development as an important parameter
~ the lack of amenities / specifications provided in
Grade B & C developments act as a deterrent for demand & achieving rentals
4. Scale of development
Considering the location, availability of land, prevailing land values and development potential, small to
medium scale buildings are predominant in the CBD & Off CBD regions.
Scale of Developments - By number of developments & size in sft
Source: CBRE Research
17 Grade of development is typically reflective of the specifications and amenities offered, age of the building, parking,
professional building and facilities management, maintenance and upkeep, etc.
Format of development – by cumulative
supply in the CBD & Off CBD (15.5 mn sft)
Source: CBRE Research
Graph 7
Graph 8
Graph 6

FINAL REPORT – PRE-FEASIBILITY FOR TAMIL NADU COMMERCE HUB | 32
Majority of the developments in the subject region are typically less than 150,000 sft in scale (~75%).
Olympia Tech Park and Tamarai Tech Park in Guindy (Off CBD region) are the largest campus style
developments upwards of 300,000 sft. SBD and PBD areas in the city offer large scale IT Parks and SEZ
developments over 1 mn sft.
5. Analysis of Occupiers
5.1. Typical Occupier Profile
The exhibit below represents the occupier profile of tenants located in the commercial off space
developments in the CBD and Off CBD region. The exhibit below is an illustration of the office space
uptake by specific sectors in the region:
Current Occupier Profile in Subject
Region
Occupier profile split in CBD & Off CBD
Source: CBRE Research
Majority of occupiers in the region are (~36%) are IT / BPO /
KPO Corporates; however, it is observed that approx. 65% of
these are located in the Off CBD region, particularly
contributed by the presence of large scale IT developments viz.
Olympia Tech Park & Tamarai Tech park in the region ~
IT/ITeS prefer large spaces and larger floor plates which are
not prevalent in the CBD region.
Further, the Non IT tenant categories driving demand for office
space include BFSI, Engineering and Manufacturing, Research
& Consulting, Media and logistics. We also understand, that
these occupiers typically are present in the CBD Region viz.
the Off CBD region.
Prominent occupiers by segments
IT / ITeS
Verizon TCS Oracle
HP Wipro HCL
BFSI
BNP Paribas HDFC Citibank
ABN AMRO RBS ICICI Bank
Engineering and Manufacturing
Ansaldo Siemens Exide industries ltd
Philips Future Metals St. Gobain
Others
RR Donelley Hewitt Regus
HTC Mascon global Samsung
Table 4
Graph 9
Graph 10

FINAL REPORT – PRE-FEASIBILITY FOR TAMIL NADU COMMERCE HUB | 33
5.2. Scale of transactions (in sft)
In this section, we have analyzed the scale / size of transactions (in sf) that have been witnessed in CBD
and off CBD regions in the last three years.
The CBD and off CBD region witnesses majority of
t ransactions in the 5,000 – 15,000 sft range per transaction
~ approx. 55%
< 5,000 sft: Key absorption witnessed in Media, Logistics,
Research & consulting occupier segments
5,000 – 10,000 sft: Majority of these transactions comprise
of tenants in the IT/ITeS, BFSI & Engineering segments
10,000 – 15,000 sft: Approx. 50% of occupiers in this size
segment are IT/ITeS occupiers; further, majority of them are located in the off CBD owing to availability of
IT developments, large floor plates, etc. are present in the off CBD region
The IT/ITeS sector followed by BFSI, Engineering and Manufacturing, Research & Consulting are the key
occupier segments in this region. Further, average space per transaction offtake is highest in IT
Commercial developments & in developments located in the off CBD zone.
Majority of the leases in the CBD and off CBD region are witnessed to be warm shell spaces with
typically lease terms of 3+ 3+ 3 years with 15% escalations built in every three years
Typical scale of transaction
Source: CBRE Research
Development Name Company Name Area transacted (sft) Rentals (psft / month)
CBD
Prestige Palladium Pfizer 16,000 sft INR 75
Prestige Polygon Gigamon 17,000 sft INR 82
Arihant Nitco Park Benteler 7,700 sft INR 60
Prestige Polygon Toray Industries 5,500 sft INR 75
Lebera Towers BAF 4,500 sft INR 65
Off CBD
Kochar Bliss Apex Knowledge
Solutions 9,000 sft INR 63
TVH Beliciaa towers CAMS 29,000 sft INR 60
Table 5
Graph 11
FINAL REPORT – PRE-FEASIBILITY FOR TAMIL NADU COMMERCE HUB | 34
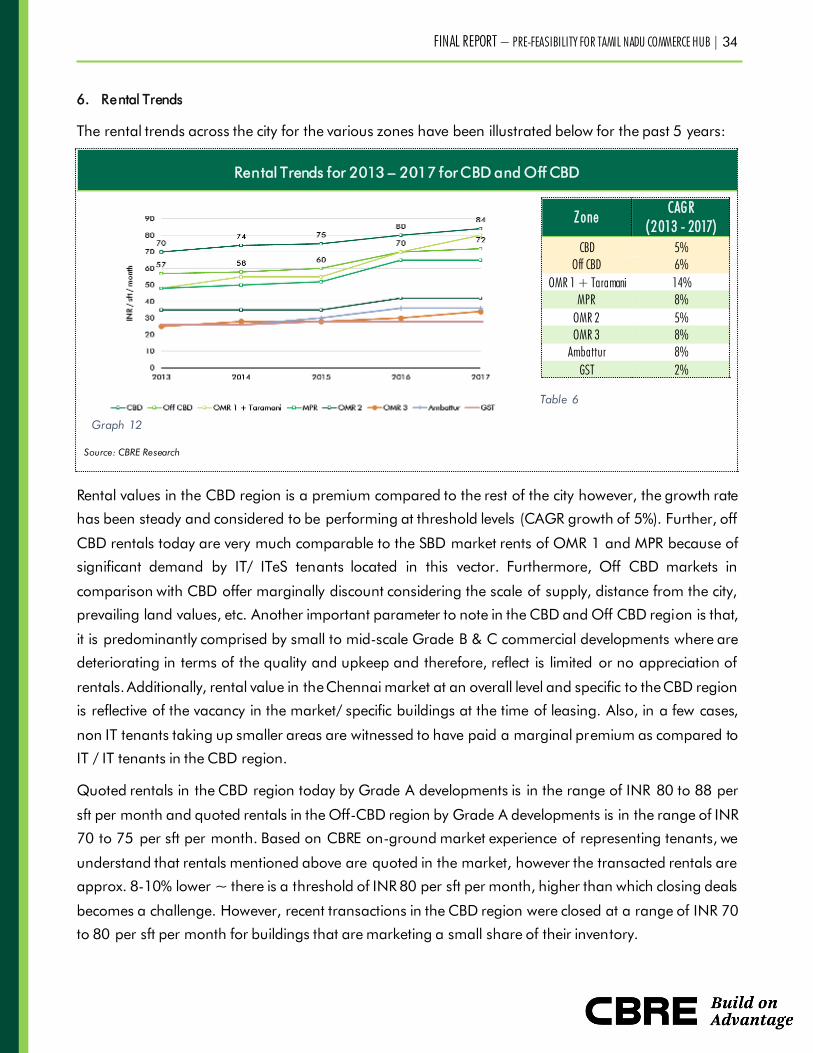
6. Rental Trends
The rental trends across the city for the various zones have been illustrated below for the past 5 years:
Rental Trends for 2013 – 2017 for CBD and Off CBD
Table 6
Source: CBRE Research
Zone CAGR
(2013 - 2017)
CBD 5%
Off CBD 6%
OMR 1 + Taramani 14%
MPR 8%
OMR 2 5%
OMR 3 8%
Ambattur 8%
GST 2%
Rental values in the CBD region is a premium compared to the rest of the city however, the growth rate
has been steady and considered to be performing at threshold levels (CAGR growth of 5%). Further, off
CBD rentals today are very much comparable to the SBD market rents of OMR 1 and MPR because of
significant demand by IT/ ITeS tenants located in this vector. Furthermore, Off CBD markets in
comparison with CBD offer marginally discount considering the scale of supply, distance from the city,
prevailing land values, etc. Another important parameter to note in the CBD and Off CBD region is that,
it is predominantly comprised by small to mid-scale Grade B & C commercial developments where are
deteriorating in terms of the quality and upkeep and therefore, reflect is limited or no appreciation of
rentals. Additionally, rental value in the Chennai market at an overall level and specific to the CBD region
is reflective of the vacancy in the market/ specific buildings at the time of leasing. Also, in a few cases,
non IT tenants taking up smaller areas are witnessed to have paid a marginal premium as compared to
IT / IT tenants in the CBD region.
Quoted rentals in the CBD region today by Grade A developments is in the range of INR 80 to 88 per
sft per month and quoted rentals in the Off-CBD region by Grade A developments is in the range of INR
70 to 75 per sft per month. Based on CBRE on-ground market experience of representing tenants, we
understand that rentals mentioned above are quoted in the market, however the transacted rentals are
approx. 8-10% lower ~ there is a threshold of INR 80 per sft per month, higher than which closing deals
becomes a challenge. However, recent transactions in the CBD region were closed at a range of INR 70
to 80 per sft per month for buildings that are marketing a small share of their inventory.
Graph 12
FINAL REPORT – PRE-FEASIBILITY FOR TAMIL NADU COMMERCE HUB | 35
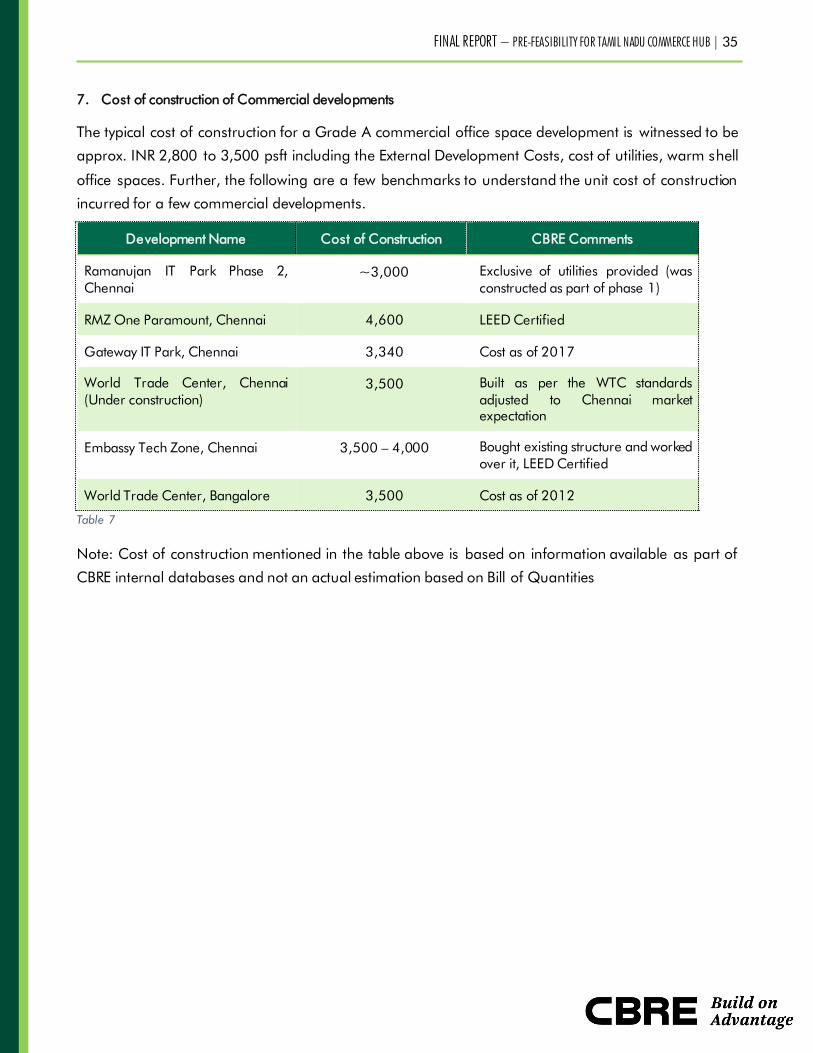
7. Cost of construction of Commercial developments
The typical cost of construction for a Grade A commercial office space development is witnessed to be
approx. INR 2,800 to 3,500 psft including the External Development Costs, cost of utilities, warm shell
office spaces. Further, the following are a few benchmarks to understand the unit cost of construction
incurred for a few commercial developments.
Development Name Cost of Construction CBRE Comments
Ramanujan IT Park Phase 2,
Chennai
~3,000 Exclusive of utilities provided (was
constructed as part of phase 1)
RMZ One Paramount, Chennai 4,600 LEED Certified
Gateway IT Park, Chennai 3,340 Cost as of 2017
World Trade Center, Chennai
(Under construction)
3,500 Built as per the WTC standards
adjusted to Chennai market
expectation
Embassy Tech Zone, Chennai 3,500 – 4,000 Bought existing structure and worked
over it, LEED Certified
World Trade Center, Bangalore 3,500 Cost as of 2012
Table 7
Note: Cost of construction mentioned in the table above is based on information available as part of
CBRE internal databases and not an actual estimation based on Bill of Quantities
FINAL REPORT – PRE-FEASIBILITY FOR TAMIL NADU COMMERCE HUB | 36
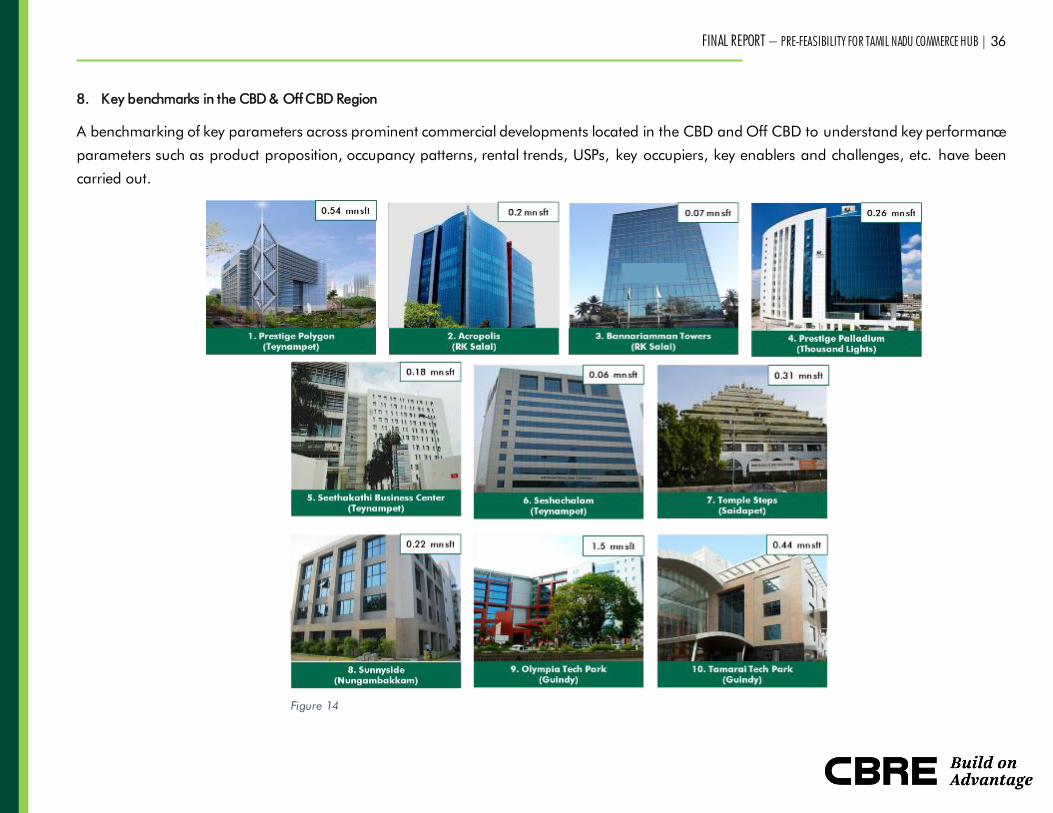
8. Key benchmarks in the CBD & Off CBD Region
A benchmarking of key parameters across prominent commercial developments located in the CBD and Off CBD to understand key performance
parameters such as product proposition, occupancy patterns, rental trends, USPs, key occupiers, key enablers and challenges, etc. have been
carried out.
Figure 14
FINAL REPORT – PRE-FEASIBILITY FOR TAMIL NADU COMMERCE HUB | 37
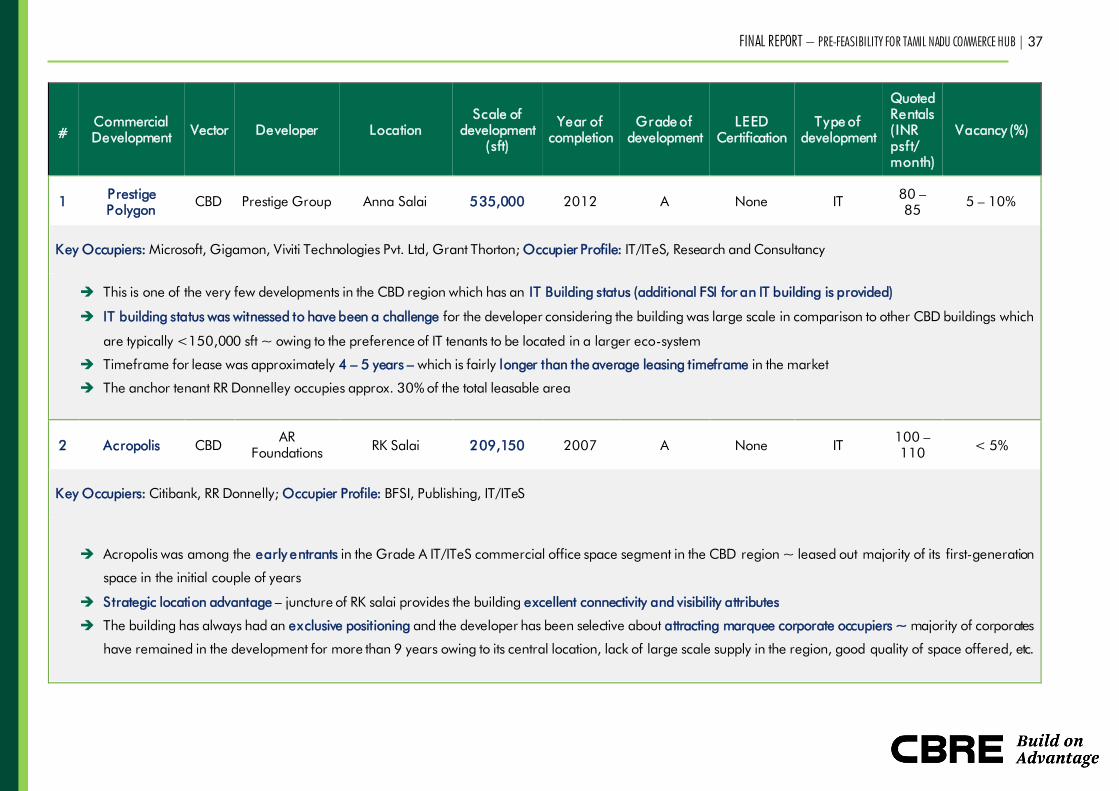
#
Commercial
Development Vector Developer Location
Scale of
development
(sft)
Year of
completion
Grade of
development
LEED
Certification
Type of
development
Quoted
Rentals
( INR
psft/
month)
Vacancy (%)
1 Prestige
Polygon CBD Prestige Group Anna Salai 535,000 2012 A None IT
80 –
85 5 – 10%
Key Occupiers: Microsoft, Gigamon, Viviti Technologies Pvt. Ltd, Grant Thorton; Occupier Profile: IT/ITeS, Research and Consultancy
This is one of the very few developments in the CBD region which has an IT Building status (additional FSI for an IT building is provided)
IT building status was witnessed to have been a challenge for the developer considering the building was large scale in comparison to other CBD buildings which
are typically <150,000 sft ~ owing to the preference of IT tenants to be located in a larger eco-system
Timeframe for lease was approximately 4 – 5 years – which is fairly longer than the average leasing timeframe in the market
The anchor tenant RR Donnelley occupies approx. 30% of the total leasable area
2 Acropolis CBD AR
Foundations RK Salai 209,150 2007 A None IT
100 –
110 < 5%
Key Occupiers: Citibank, RR Donnelly; Occupier Profile: BFSI, Publishing, IT/ITeS
Acropolis was among the early entrants in the Grade A IT/ITeS commercial office space segment in the CBD region ~ leased out majority of its first-generation
space in the initial couple of years
Strategic location advantage – juncture of RK salai provides the building excellent connectivity and visibility attributes
The building has always had an exclusive positioning and the developer has been selective about attracting marquee corporate occupiers ~ majority of corporates
have remained in the development for more than 9 years owing to its central location, lack of large scale supply in the region, good quality of space offered, etc.

FINAL REPORT – PRE-FEASIBILITY FOR TAMIL NADU COMMERCE HUB | 38
#
Commercial
Development Vector Developer Location
Scale of
development
(sft)
Year of
completion
Grade of
development
LEED
Certification
Type of
development
Quoted
Rentals
( INR
psft/
month)
Vacancy (%)
3 Bannariamman
Towers CBD Bannariamman RK Salai 67,000 2010 A None Non IT
75 –
80 5 - 10%
Key Occupiers: Mitsubishi, Zynergy Solar, Schneider Electric, French Consulate, Korean Trade Center; Occupier Profile: Automobile, Electronics, Foreign Bodies
Bannariamman towers been judicious while leasing space to occupiers in order to maintain the positioning for the development - houses a consulate, foreign
trade bodies, FMCG & Automobile giants
This development has occupiers across various non IT tenant categories and would be one of the very few developments which does not house a single IT/ ITeS
tenant (no significant need to have an anchor tenant considering the scale of development)
4 Prestige
Palladium CBD Prestige Greams Road 260,000 2011 A None Non IT 80 < 5%
Key Occupiers: Saipem, PWC, Mitsubishi, HP, Hospira; Occupier Profile: Engineering & Manufacturing, IT/ITeS, Professional Services
Prestige Palladium majorly houses Non IT occupiers across various tenant categories
The key USPs of this development would be its central location, developer branding, rational rental for a grade A space offered, etc.
5
Seethakathi
Business
Center
CBD ETA Star Teynampet 182,000 2014 A Gold Rated Non IT 80 55-60%
Key Occupiers: Siemens, Cresent School of Business; Occupier Profile: Engineering & Manufacturing
One of the drawbacks that the development has faced is that it has been strata sold. Multiple owner developments are typically less preferred by occupiers

FINAL REPORT – PRE-FEASIBILITY FOR TAMIL NADU COMMERCE HUB | 39
#
Commercial
Development Vector Developer Location
Scale of
development
(sft)
Year of
completion
Grade of
development
LEED
Certification
Type of
development
Quoted
Rentals
( INR
psft/
month)
Vacancy (%)
6 Seshachalam
Center CBD Ceebros Anna Salai 64,000 2008 B None Non IT 75 15-20%
Key Occupiers: Bank of Tokyo, JETRO, Butterfly, Hero Motocorp; Occupier Profile: BFSI, Engineering & Manufacturing
A unique factor witnessed in this development is the predominant presence of Japanese corporates which has enabled a specific positioning for the building
7 Temple Steps CBD Individual Anna Salai 307,000 2005 B None Non IT 60 <5%
Key Occupiers: Citigroup, DHL, Zifo Group, Stayzilla, Agility Logistics; Occupier Profile: IT/ ITeS, Logistics, Media
Temple steps was one of the first commercial office spaces constructed in the city; Further, the development has been strata sold and has multiple ownership
It is an old development ~ provides for a significant discount from the market
8 Sunnyside CBD Sabari Group Nungambakkam 220,000 2012 A None Non IT 75 <5%
Key Occupiers: Bosch, Deutsche Bank, PPP Power Generation Company, Pfizer, Apollo Hospitals; Occupier Profile: Engineering & Manufacturing, Banks, Healthcare
9 Olympia Tech
Park
Off
CBD Olympia Guindy 1,453,000 2006 A Green IT 85 5-10%
Key Occupiers: HP, Verizon, RBS, Visteon, Dell; Occupier Profile: IT/ITeS
One and only IT Park development offering the benefits of being in a large campus style development with amenities such as food court, good car parking, etc.
in the CBD region. This development had a f irst mover advantage when it was constructed in Guindy in 2006
FINAL REPORT – PRE-FEASIBILITY FOR TAMIL NADU COMMERCE HUB | 40
#
Commercial
Development Vector Developer Location
Scale of
development
(sft)
Year of
completion
Grade of
development
LEED
Certification
Type of
development
Quoted
Rentals
( INR
psft/
month)
Vacancy (%)
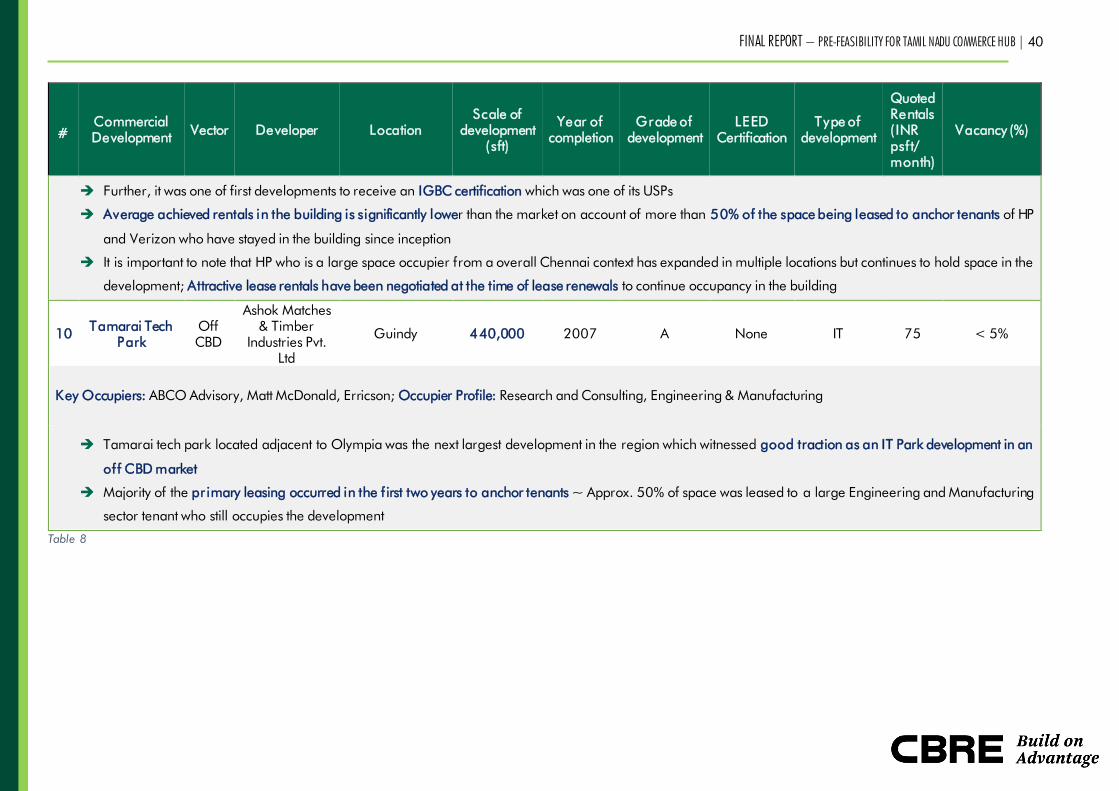
Further, it was one of first developments to receive an IGBC certification which was one of its USPs
Average achieved rentals in the building is significantly lower than the market on account of more than 50% of the space being leased to anchor tenants of HP
and Verizon who have stayed in the building since inception
It is important to note that HP who is a large space occupier from a overall Chennai context has expanded in multiple locations but continues to hold space in the
development; Attractive lease rentals have been negotiated at the time of lease renewals to continue occupancy in the building
10 Tamarai Tech
Park
Off
CBD
Ashok Matches
& Timber
Industries Pvt.
Ltd
Guindy 440,000 2007 A None IT 75 < 5%
Key Occupiers: ABCO Advisory, Matt McDonald, Erricson; Occupier Profile: Research and Consulting, Engineering & Manufacturing
Tamarai tech park located adjacent to Olympia was the next largest development in the region which witnessed good traction as an IT Park development in an
off CBD market
Majority of the pr imary leasing occurred in the f irst two years to anchor tenants ~ Approx. 50% of space was leased to a large Engineering and Manufacturing
sector tenant who still occupies the development
Table 8
FINAL REPORT – PRE-FEASIBILITY FOR TAMIL NADU COMMERCE HUB | 41
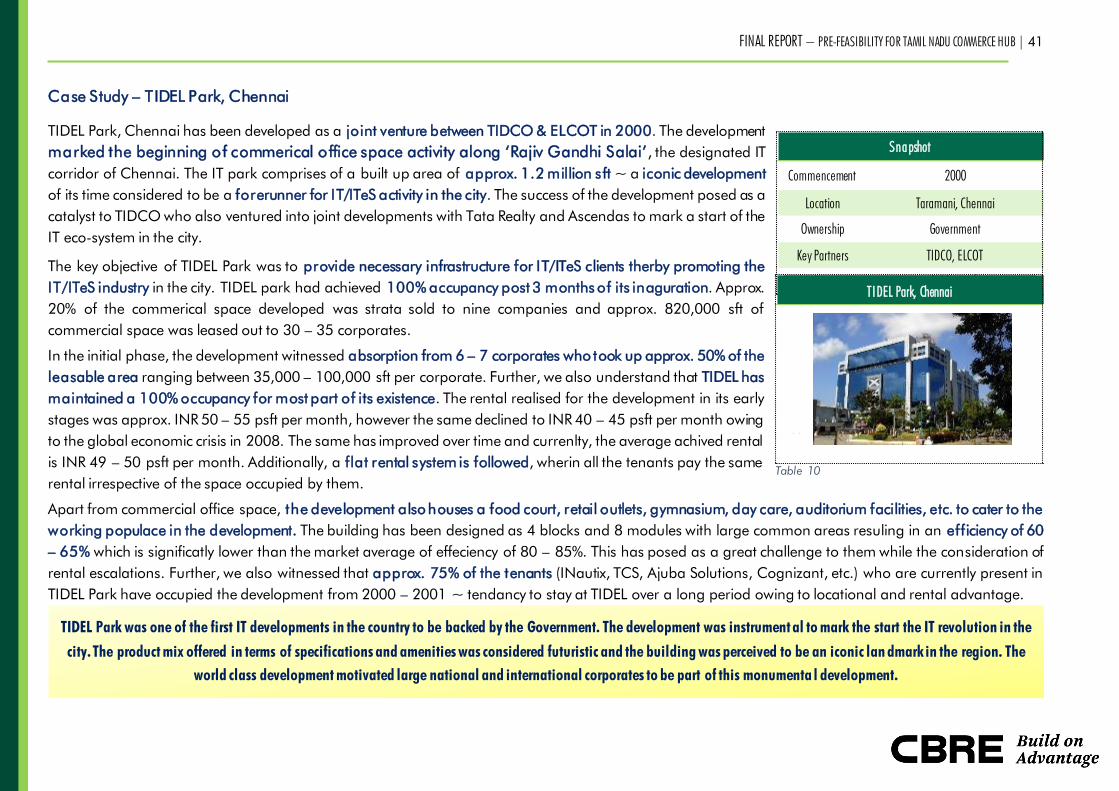
Case Study – TIDEL Park, Chennai
TIDEL Park, Chennai has been developed as a joint venture between TIDCO & ELCOT in 2000. The development
marked the beginning of commerical office space activity along ‘Rajiv Gandhi Salai’, the designated IT
corridor of Chennai. The IT park comprises of a built up area of approx. 1.2 million sft ~ a iconic development
of its time considered to be a forerunner for IT/ITeS activity in the city. The success of the development posed as a
catalyst to TIDCO who also ventured into joint developments with Tata Realty and Ascendas to mark a start of the
IT eco-system in the city.
The key objective of TIDEL Park was to provide necessary infrastructure for IT/ITeS clients therby promoting the
IT/ITeS industry in the city. TIDEL park had achieved 100% accupancy post 3 months of its inaguration. Approx.
20% of the commerical space developed was strata sold to nine companies and approx. 820,000 sft of
commercial space was leased out to 30 – 35 corporates.
In the initial phase, the development witnessed absorption from 6 – 7 corporates who took up approx. 50% of the
leasable area ranging between 35,000 – 100,000 sft per corporate. Further, we also understand that TIDEL has
maintained a 100% occupancy for most part of its existence. The rental realised for the development in its early
stages was approx. INR 50 – 55 psft per month, however the same declined to INR 40 – 45 psft per month owing
to the global economic crisis in 2008. The same has improved over time and currenlty, the average achived rental
is INR 49 – 50 psft per month. Additionally, a flat rental system is followed, wherin all the tenants pay the same
rental irrespective of the space occupied by them.
Apart from commercial office space, the development also houses a food court, retail outlets, gymnasium, day care, auditorium facilities, etc. to cater to the
working populace in the development. The building has been designed as 4 blocks and 8 modules with large common areas resuling in an efficiency of 60
– 65% which is significatly lower than the market average of effeciency of 80 – 85%. This has posed as a great challenge to them while the consideration of
rental escalations. Further, we also witnessed that approx. 75% of the tenants (INautix, TCS, Ajuba Solutions, Cognizant, etc.) who are currently present in
TIDEL Park have occupied the development from 2000 – 2001 ~ tendancy to stay at TIDEL over a long period owing to locational and rental advantage.
Snapshot
Commencement 2000
Location Taramani, Chennai
Ownership Government
Key Partners TIDCO, ELCOT
Area 1.28 mn sft
TIDEL Park, Chennai
Table 9
Table 10
TIDEL Park was one of the first IT developments in the country to be backed by the Government. The development was instrument al to mark the start the IT revolution in the
city. The product mix offered in terms of specifications and amenities was considered futuristic and the building was perceived to be an iconic lan dmark in the region. The
world class development motivated large national and international corporates to be part of this monumenta l development.
FINAL REPORT – PRE-FEASIBILITY FOR TAMIL NADU COMMERCE HUB | 42
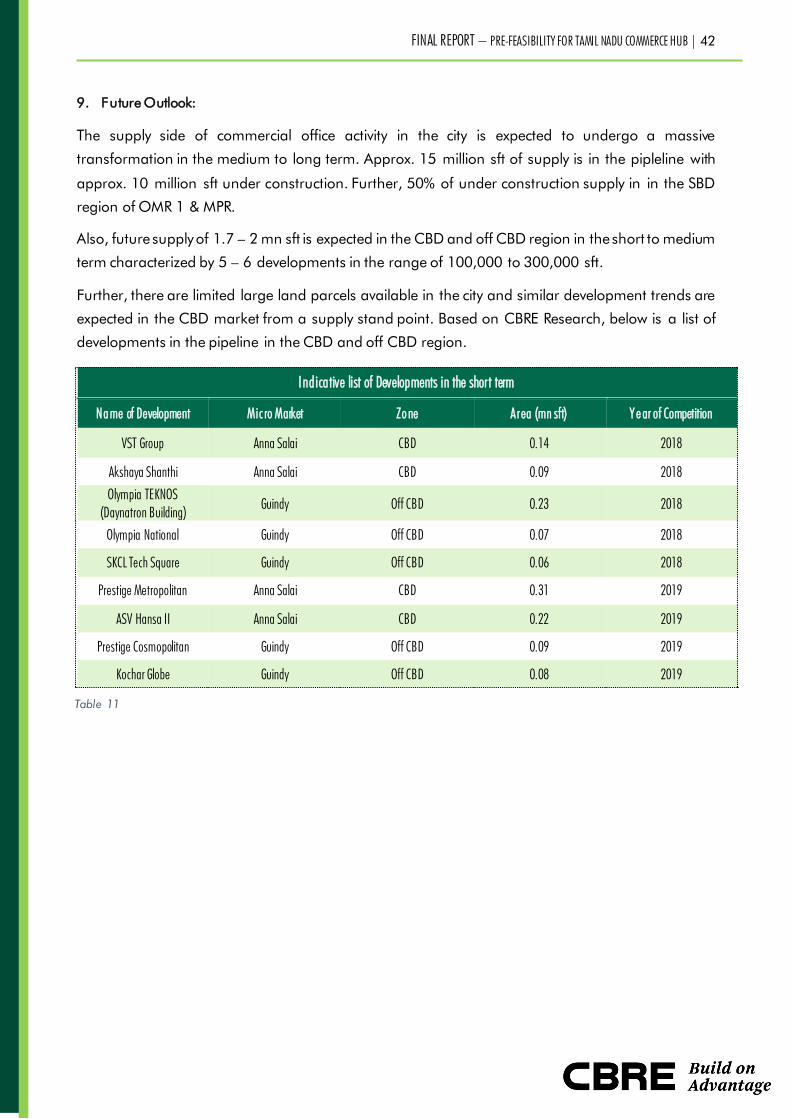
9. Future Outlook:
The supply side of commercial office activity in the city is expected to undergo a massive
transformation in the medium to long term. Approx. 15 million sft of supply is in the pipleline with
approx. 10 million sft under construction. Further, 50% of under construction supply in in the SBD
region of OMR 1 & MPR.
Also, future supply of 1.7 – 2 mn sft is expected in the CBD and off CBD region in the short to medium
term characterized by 5 – 6 developments in the range of 100,000 to 300,000 sft.
Further, there are limited large land parcels available in the city and similar development trends are
expected in the CBD market from a supply stand point. Based on CBRE Research, below is a list of
developments in the pipeline in the CBD and off CBD region.
Indicative list of Developments in the short term
Name of Development Mic ro Market Zone Area (mn sft) Y e ar of Competition
VST Group Anna Salai CBD 0.14 2018
Akshaya Shanthi Anna Salai CBD 0.09 2018
Olympia TEKNOS
(Daynatron Building) Guindy Off CBD 0.23 2018
Olympia National Guindy Off CBD 0.07 2018
SKCL Tech Square Guindy Off CBD 0.06 2018
Prestige Metropolitan Anna Salai CBD 0.31 2019
ASV Hansa II Anna Salai CBD 0.22 2019
Prestige Cosmopolitan Guindy Off CBD 0.09 2019
Kochar Globe Guindy Off CBD 0.08 2019
Table 11
FINAL REPORT – PRE-FEASIBILITY FOR TAMIL NADU COMMERCE HUB | 43
10. Emerging trends in commercial office space
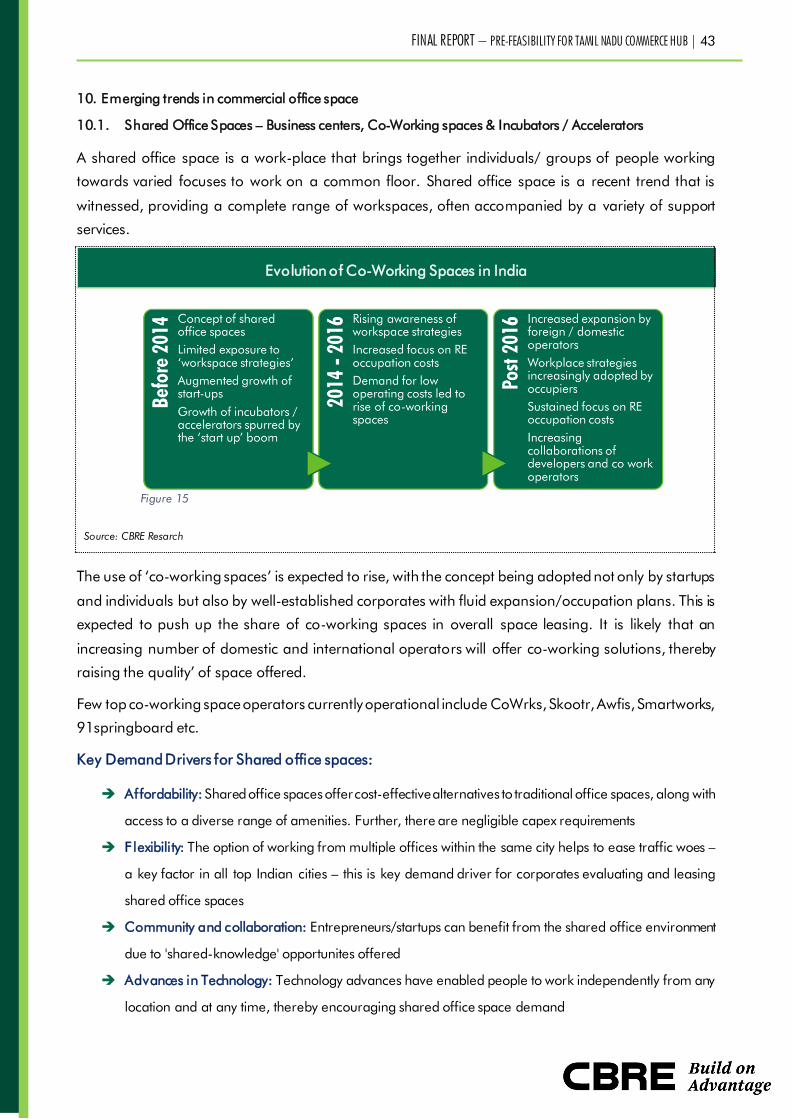
10.1. Shared Office Spaces – Business centers, Co-Working spaces & Incubators / Accelerators
A shared office space is a work-place that brings together individuals/ groups of people working
towards varied focuses to work on a common floor. Shared office space is a recent trend that is
witnessed, providing a complete range of workspaces, often accompanied by a variety of support
services.
Evolution of Co-Working Spaces in India
Source: CBRE Resarch
The use of ‘co-working spaces’ is expected to rise, with the concept being adopted not only by startups
and individuals but also by well-established corporates with fluid expansion/occupation plans. This is
expected to push up the share of co-working spaces in overall space leasing. It is likely that an
increasing number of domestic and international operators will offer co-working solutions, thereby
raising the quality’ of space offered.
Few top co-working space operators currently operational include CoWrks, Skootr, Awfis, Smartworks,
91springboard etc.
Key Demand Drivers for Shared office spaces:
Affordability: Shared office spaces offer cost-effective alternatives to traditional office spaces, along with
access to a diverse range of amenities. Further, there are negligible capex requirements
Flexibility: The option of working from multiple offices within the same city helps to ease traffic woes –
a key factor in all top Indian cities – this is key demand driver for corporates evaluating and leasing
shared office spaces
Community and collaboration: Entrepreneurs/startups can benefit from the shared office environment
due to 'shared-knowledge' opportunites offered
Advances in Technology: Technology advances have enabled people to work independently from any
location and at any time, thereby encouraging shared office space demand
Figure 15
FINAL REPORT – PRE-FEASIBILITY FOR TAMIL NADU COMMERCE HUB | 44
The Startup Boom: Startups are among the major users of shared office spaces, with India estimated to
have 11,500 startups18
by 2020
Forign entrant corporates: Co-working spaces are an ideal option for corporates testing Indian waters
due to their cost-effective and flexible leasing term
Shared office spaces in Chennai:
The shared office space market in Chennai is in its nacent
stages and currently the city has 20 – 25 organized
shared office spaces. Further, we understand that approx.
60 - 65% of these spaces are located in the CBD and Off
CBD region. Major operators in the Chennai context are
Regus, Workafella, MLS, Doxa, TEC, Coworks, etc.
Further, based on interactions with we understand that
majority of the Shared spaces in the CBD & Off CBD
regions witness an average occupancy of 70 – 80%19
.
Apart from start-up’s and small businesses, we have also
witnessed an interest in shared spaces by large
corporates.
Accelerators / Incubators in Chennai:
Another key trend which is upcoming in the Commercial office ecosystem is accelerators / incubators.
These are spaces which offer entreperuers / start ups a office space coupled with the guidance of
industry experts / investors. In Chennai, these services are offered by a company viz. ‘The Start Up
Center’ which is located in Thiruvanmiyur. It acts as a startup hub for budding entrepreneurs looking
for the right guidance and working environment based at Chennai; an ecosystem which is vibrant in
terms of entrepreneurial, technical and design talent. The Centre was designed in a way to leverage
an open floor by learning from each other and being able to pivot and build quickly. The mentors of
The Startup Centre will be available to interact with on a regular basis to render guidance to the
teams. They provide furnished office space, high-speed wireless internet, plenty of power outlets, and
a fully stocked pantry for the duration of the program. Members also have access to a library of books
which is perfect for aspiring entrepreneurs and young startups. Similar programs have been initatied
in other cities viz. Hyderabad, Mumbai, Delhi, etc.
The shared office space concept is its nascent stages in Chennai, however, the market continues to
witness demand from flexible workspaces occupier perspective. With the highest density of centers,
and mix of operators, the CBD & Off CBD regions are a leader in terms of supply and demand at a
city level.
18 Source: Indian Startup Ecosystem Maturing - 2016" report by Nasscom-ZINNOV
19 For the past 6 months
Prominent Shared Spaces in the CBD & Off CBD region
Spaces 35,000 Express Avenue
Regus 10,300 KRM Plaza
iShareSpaces 8,300 Ispahani Center
India Business
Center 9,000 Kochar Bliss
Re cent lease transactions in Shared spaces
Paytm Workefella Prestige
Palladium 50 seats
International
Flavors Regus
Shyamala
Towers 40 seats
Table 12
FINAL REPORT – PRE-FEASIBILITY FOR TAMIL NADU COMMERCE HUB | 45
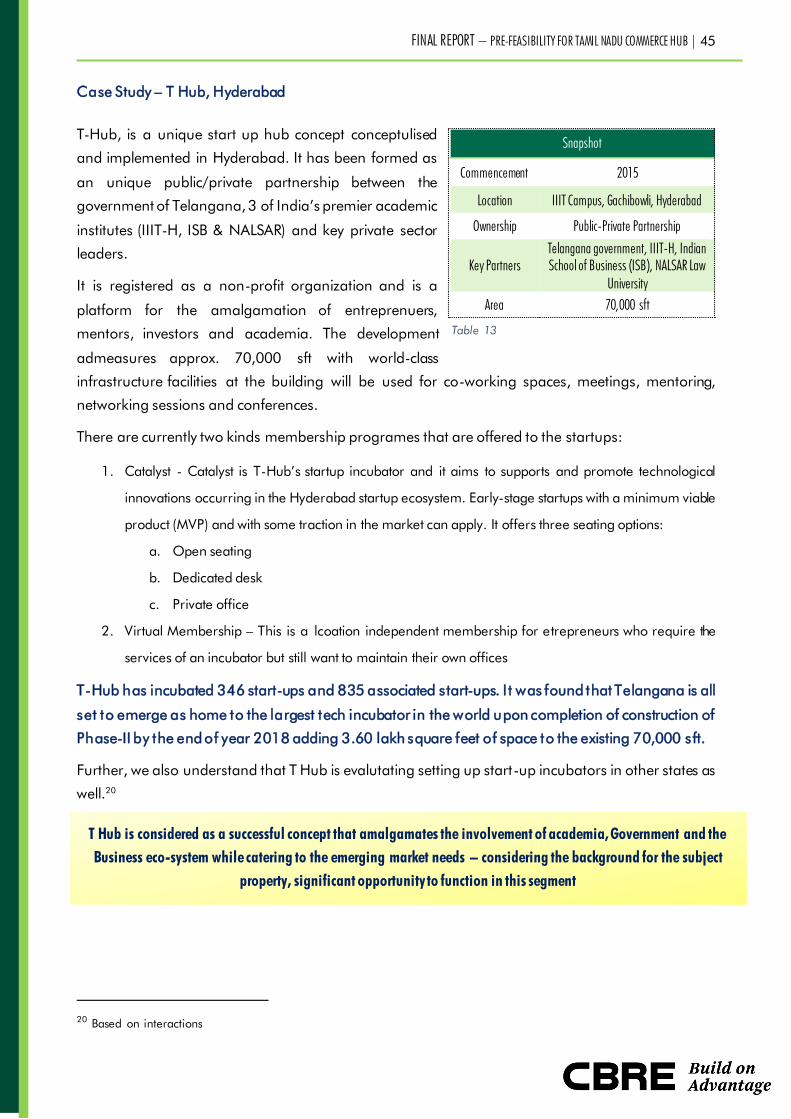
Case Study – T Hub, Hyderabad
T-Hub, is a unique start up hub concept conceptulised
and implemented in Hyderabad. It has been formed as
an unique public/private partnership between the
government of Telangana, 3 of India’s premier academic
institutes (IIIT-H, ISB & NALSAR) and key private sector
leaders.
It is registered as a non-profit organization and is a
platform for the amalgamation of entreprenuers,
mentors, investors and academia. The development
admeasures approx. 70,000 sft with world-class
infrastructure facilities at the building will be used for co-working spaces, meetings, mentoring,
networking sessions and conferences.
There are currently two kinds membership programes that are offered to the startups:
1. Catalyst - Catalyst is T-Hub’s startup incubator and it aims to supports and promote technological
innovations occurring in the Hyderabad startup ecosystem. Early-stage startups with a minimum viable
product (MVP) and with some traction in the market can apply. It offers three seating options:
a. Open seating
b. Dedicated desk
c. Private office
2. Virtual Membership – This is a lcoation independent membership for etrepreneurs who require the
services of an incubator but still want to maintain their own offices
T-Hub has incubated 346 start-ups and 835 associated start-ups. I t was found that Telangana is all
set to emerge as home to the largest tech incubator in the world upon completion of construction of
Phase-II by the end of year 2018 adding 3.60 lakh square feet of space to the existing 70,000 sft.
Further, we also understand that T Hub is evalutating setting up start-up incubators in other states as
well.20
20 Based on interactions
Snapshot
Commencement 2015
Location IIIT Campus, Gachibowli, Hyderabad
Ownership Public-Private Partnership
Key Partners
Telangana government, IIIT-H, Indian
School of Business (ISB), NALSAR Law
University
Area 70,000 sft
Table 13
T Hub is considered as a successful concept that amalgamates the involvement of academia, Government and the
Business eco-system while catering to the emerging market needs – considering the background for the subject
property, significant opportunity to function in this segment
FINAL REPORT – PRE-FEASIBILITY FOR TAMIL NADU COMMERCE HUB | 46
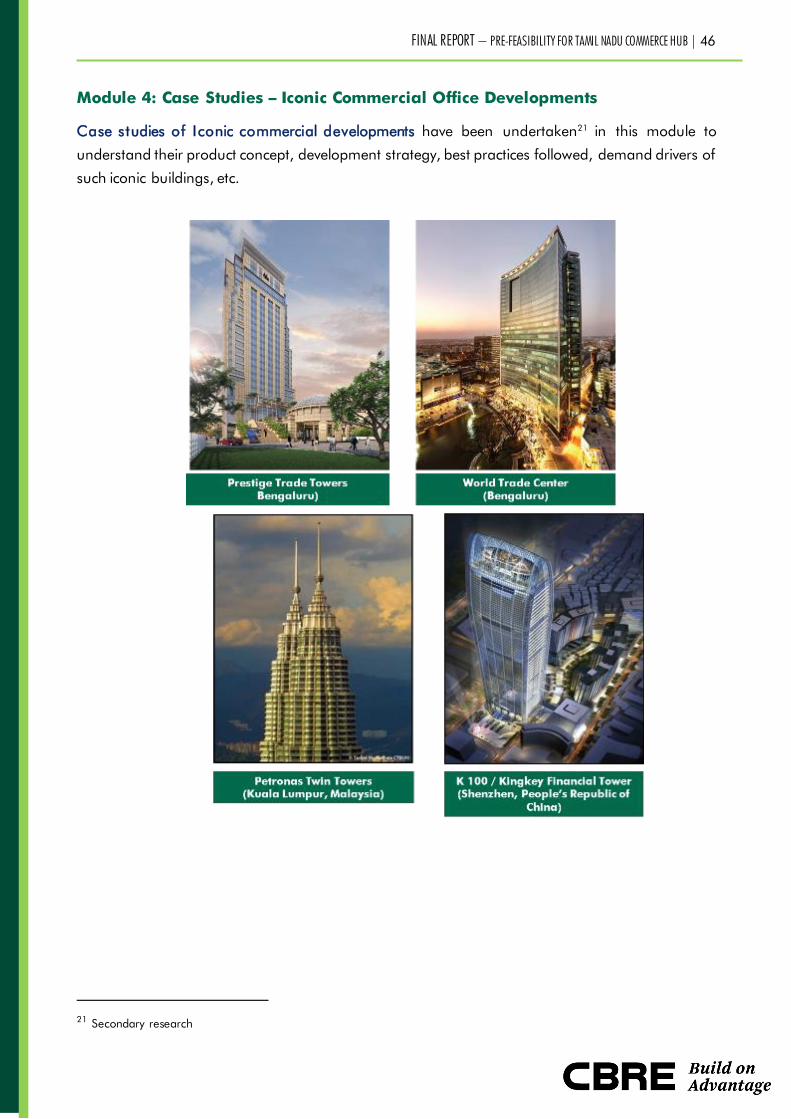
Module 4: Case Studies – Iconic Commercial Office Developments
Case studies of Iconic commercial developments have been undertaken21
in this module to
understand their product concept, development strategy, best practices followed, demand drivers of
such iconic buildings, etc.
21 Secondary research
FINAL REPORT – PRE-FEASIBILITY FOR TAMIL NADU COMMERCE HUB | 47
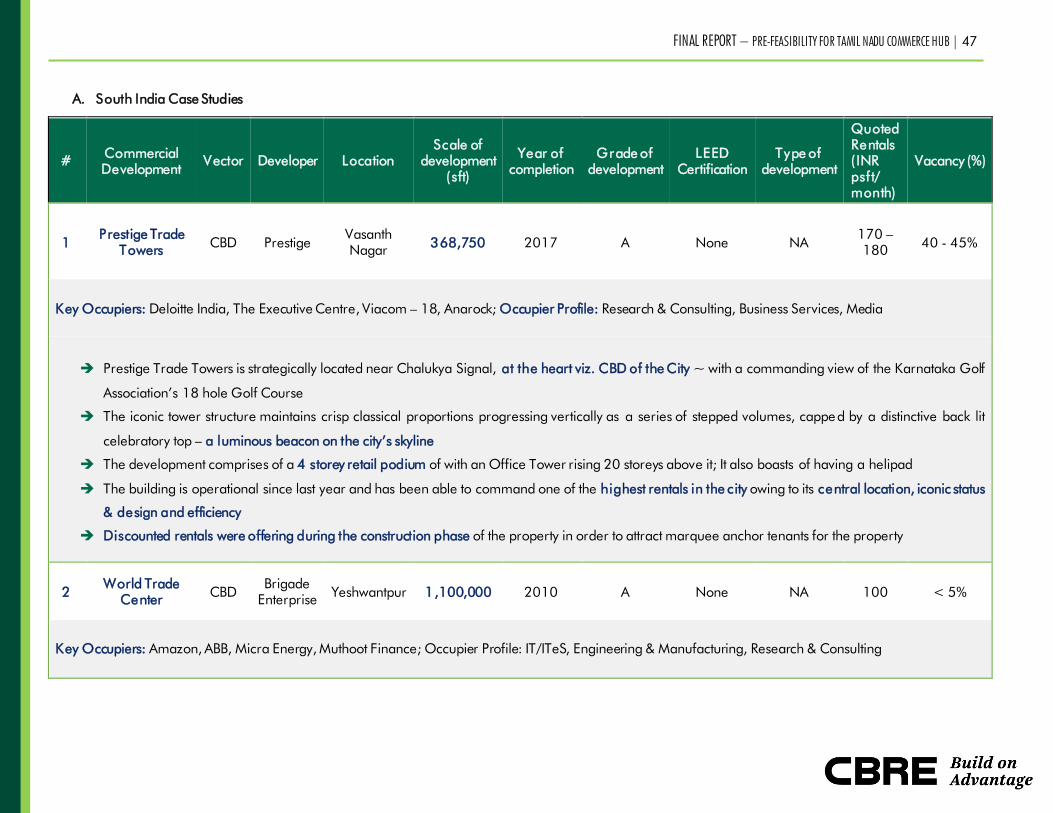
A. South India Case Studies
# Commercial
Development Vector Developer Location
Scale of
development
(sft)
Year of
completion
Grade of
development
LEED
Certification
Type of
development
Quoted
Rentals
( INR
psft/
month)
Vacancy (%)
1 Prestige Trade
Towers CBD Prestige
Vasanth
Nagar 368,750 2017 A None NA
170 –
180 40 - 45%
Key Occupiers: Deloitte India, The Executive Centre, Viacom – 18, Anarock; Occupier Profile: Research & Consulting, Business Services, Media
Prestige Trade Towers is strategically located near Chalukya Signal, at the heart viz. CBD of the City ~ with a commanding view of the Karnataka Golf
Association’s 18 hole Golf Course
The iconic tower structure maintains crisp classical proportions progressing vertically as a series of stepped volumes, capped by a distinctive back lit
celebratory top – a luminous beacon on the city’s skyline
The development comprises of a 4 storey retail podium of with an Office Tower rising 20 storeys above it; It also boasts of having a helipad
The building is operational since last year and has been able to command one of the highest rentals in the city owing to its central location, iconic status
& design and efficiency
Discounted rentals were offering during the construction phase of the property in order to attract marquee anchor tenants for the property
2 World Trade
Center CBD
Brigade
Enterprise Yeshwantpur 1,100,000 2010 A None NA 100 < 5%
Key Occupiers: Amazon, ABB, Micra Energy, Muthoot Finance; Occupier Profile: IT/ITeS, Engineering & Manufacturing, Research & Consulting
FINAL REPORT – PRE-FEASIBILITY FOR TAMIL NADU COMMERCE HUB | 48
The World Trade Center in Bengaluru is set in a 40 acre integrated campus with a premium positioning and encompasses the WTC building, Orion
shopping mall, the Sheraton Hotel, Colombia Asia-multi-specialty hospital, a large residential apartment complex, a school and Galaxy club with social,
recreational and fitness facilities ~ the integrated township & presence of the WTC branding has made this an iconic commercial development in the city
World Trade Center (WTC) Bengaluru, a licensed member of the World Trade Centers Association (WTCA), headquartered in New York, comprising a
network of 330 Centers in over 100 countries ~ TCs globally form a vital part of a dynamic, global economy and play a pivotal role in helping businesses
grow beyond their local boundaries
The structure comprises of 31 floors and is home to headquarters of Amazon India, ABB and several other Multi-National Corporations
WTC, initially conceptualized as a corporate office tower faced challenges for leasing in the initially years as it was a new office space vector with residential
activity predominantly. Further, as a part of the strategy, Amazon was targeted as an anchor tenant at a discounted rental to occupy almost 50% of the
overall space
WTC today is one of the preferred office spaces in the city by IT and non IT tenants owing to the following reasons:
o Product offering – integrated development with focused positioning; Synergizes with almost all asset classes in the campus viz. residential, retail,
hospitality and other support components
o Alternate Business District/ Off CBD location
o Quality of office space – best in terms of specifications and facility management
o Accessibility benefits – majority of the key office space markets in the city faces traffic bottlenecks viz. Whitefield, Sarjapur Road, etc.
o Infrastructure availability – while infrastructure in almost all office space markets in the city are in planning and implementation stages, subject
micro-market offers excellent connectivity via Metro rail
o Iconic structure – stands out in terms of preference by tenants vis-à-vis other normal developments (however, do not really command a premium
on rental values)
o Developer branding – Brigade Group is a prominent brand name in the Bangalore and South India market with prior executional capabilities
o WTC branding – networking opportunities in the trade platform
Table 14
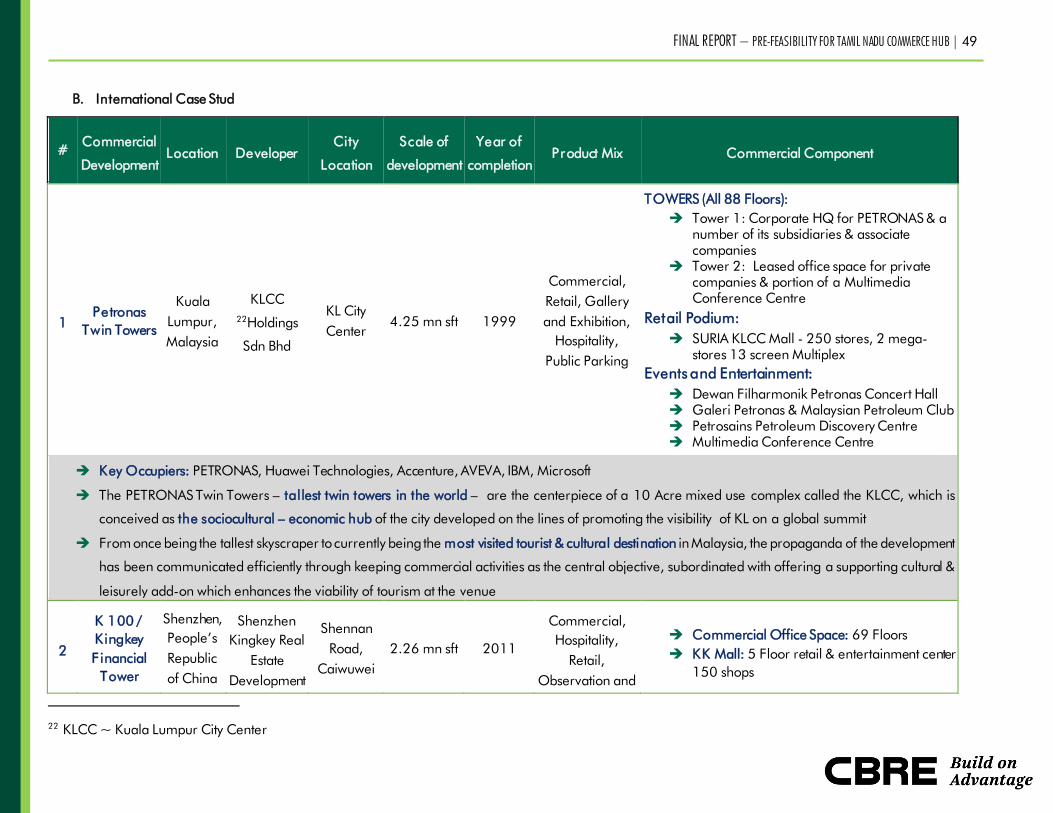
FINAL REPORT – PRE-FEASIBILITY FOR TAMIL NADU COMMERCE HUB | 49
B. International Case Stud
# Commercial
Development
Location Developer
City
Location
Scale of
development
Year of
completion
Product Mix Commercial Component
1
Petronas
Twin Towers
Kuala
Lumpur,
Malaysia
KLCC
22Holdings
Sdn Bhd
KL City
Center
4.25 mn sft 1999
Commercial,
Retail, Gallery
and Exhibition,
Hospitality,
Public Parking
TOWERS (All 88 Floors):
Tower 1: Corporate HQ for PETRONAS & a
number of its subsidiaries & associate
companies
Tower 2: Leased office space for private
companies & portion of a Multimedia
Conference Centre
Retail Podium:
SURIA KLCC Mall - 250 stores, 2 mega-
stores 13 screen Multiplex
Events and Entertainment:
Dewan Filharmonik Petronas Concert Hall
Galeri Petronas & Malaysian Petroleum Club
Petrosains Petroleum Discovery Centre
Multimedia Conference Centre
Key Occupiers: PETRONAS, Huawei Technologies, Accenture, AVEVA, IBM, Microsoft
The PETRONAS Twin Towers – tallest twin towers in the world – are the centerpiece of a 10 Acre mixed use complex called the KLCC, which is
conceived as the sociocultural – economic hub of the city developed on the lines of promoting the visibility of KL on a global summit
From once being the tallest skyscraper to currently being the most visited tourist & cultural destination in Malaysia, the propaganda of the development
has been communicated efficiently through keeping commercial activities as the central objective, subordinated with offering a supporting cultural &
leisurely add-on which enhances the viability of tourism at the venue
2
K 100 /
Kingkey
F inancial
Tower
Shenzhen,
People’s
Republic
of China
Shenzhen
Kingkey Real
Estate
Development
Shennan
Road,
Caiwuwei
2.26 mn sft 2011
Commercial,
Hospitality,
Retail,
Observation and
Commercial Office Space: 69 Floors
KK Mall: 5 Floor retail & entertainment center
150 shops
22 KLCC ~ Kuala Lumpur City Center
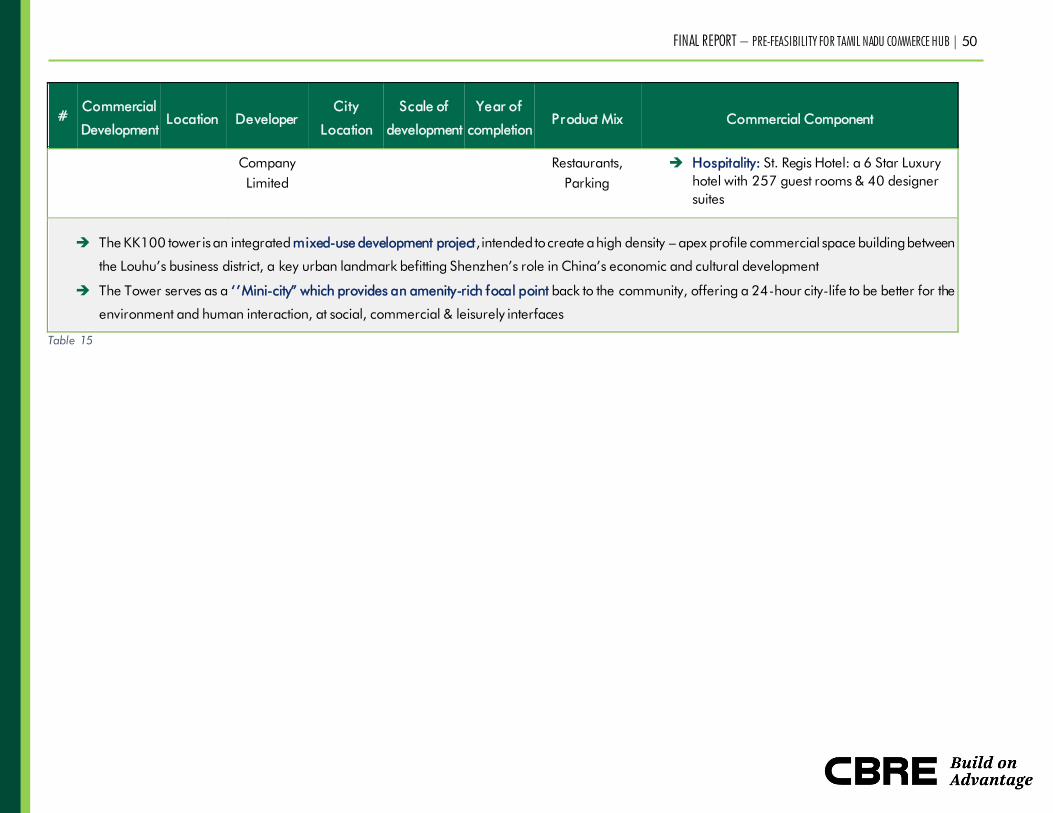
FINAL REPORT – PRE-FEASIBILITY FOR TAMIL NADU COMMERCE HUB | 50
#
Commercial
Development
Location Developer
City
Location
Scale of
development
Year of
completion
Product Mix Commercial Component
Company
Limited
Restaurants,
Parking
Hospitality: St. Regis Hotel: a 6 Star Luxury
hotel with 257 guest rooms & 40 designer
suites
The KK100 tower is an integrated mixed-use development project, intended to create a high density – apex profile commercial space building between
the Louhu’s business district, a key urban landmark befitting Shenzhen’s role in China’s economic and cultural development
The Tower serves as a ‘’Mini-city” which provides an amenity-rich focal point back to the community, offering a 24-hour city-life to be better for the
environment and human interaction, at social, commercial & leisurely interfaces
Table 15

FINAL REPORT – PRE-FEASIBILITY FOR TAMIL NADU COMMERCE HUB | 51
Module 5: Opportunity Assessment – CBD and Off CBD zones
Parameter Summary
Supply
Currently the CBD and off CBD region comprise of 25% of the city’s cumulative supply ~ 15.5 million sft
This region has witnessed an average supply influx of approximately 400,000 – 500,000 sft over the last three
years across approx. 12 – 15 commercial developments;
Majority of developments are small to medium scale developments ~ majority of developments range between
the sizes of 70,000 to 80,000 sft
Underlying land values in the CBD region, paucity of large developable land parcels has prohibited large scale
developments in the region
Supply in this region is constituted with an almost equal split of Grade A and B developments; however, the
specifications provided in the large-scale IT parks in the peripheral regions viz. Ramanujam IT City, DLF Tech
Park, SP Infocity are far superior than the Grade A developments in the CBD & Off CDB zones
Future development of approx. 1.7 – 2 million sft is expected in the CBD and off CBD region in the short to
medium term
Absorption
The CBD and Off CBD regions have witnessed steady absorption levels of approx. 800,000 – 950,000 sft
annually holding approximately 20% market share of the total annual absorption the city witnesses
The same is accounted to by absorption in both first and second-generation spaces ~ reflects the preference of
corporates to be in the same region
The current vacancy levels are at approx. 14% ~ attributed to threshold demand levels CBD & off CBD markets
operate on owing to factors viz. limited scalability options, space offtake by Non IT tenants typically approx.
5,000 to 15,000 sft, preference for IT occupiers to be present in IT eco-system, etc.
Further, based on the current absorption levels & upcoming supply, we understand the current supply overhang
is 2 – 3 years
Occupier Profile Currently, the major occupiers in the region comprise of IT/ITeS Corporates and Non-IT tenants from BFSI,
Engineering and Manufacturing, Research and consulting, etc.
FINAL REPORT – PRE-FEASIBILITY FOR TAMIL NADU COMMERCE HUB | 52
Further, the CBD region also witnesses a presence of offices of local business houses viz. TVS, Sundaram Group,
IOB, etc.
Emerging trends
Shared working spaces (co-working spaces & incubators) are a new trend in the commercial office space market
which has maximum presence in the CBD and off CBD region
Benchmarking – City Level
Successful benchmarks typically are selective about their tenant profiles – this ensures the development to
maintain positioning of the development
Branding and marketing strategies adopted play a key role in determining the marketing timeframe of the
developments
Case Studies – Other cities
Case studies of iconic developments in other regions show us that the design and concept of the development
are major draw factors towards it
Also, for the commercial development to be successful, there should be other components viz. hospitality, retail,
etc. present in the development as value addition
Based on the aforementioned modules, we understand that there is an opportunity to introduce large scale Grade A supply in the CBD region as
the location witnesses latent demand for large scale developments. An integrated development with the presence of hospitality, small scale retail is
a concept that has not been witnessed in the CBD, synergies exhibited by the components of integrated development would add significant value
to the envisaged development.
Further, considering the supply overhang in the market, future supply expected and absorption levels ~ there is opportunity to create a commercial
office space development diffracted in terms of scale, specifications, grade of development, positioning, etc.
The demand assessment for the commercial component and the recommended product mix are illustrated in the forthcoming modules .
FINAL REPORT – PRE-FEASIBILITY FOR TAMIL NADU COMMERCE HUB | 53
Module 6: Demand Assessment
Demand assessment for the Pre-feasibility exercise has been undertaken based on prevailing market
trends and future outlook for the office space market in Chennai. Below is a step by step illustration of
the broad level methodology adopted to assess the demand potential for the proposed development:
Demand Assessment
Review of the overall supply,
demand, churn and vacancy
trends witnessed in the
organized office space market
in Chennai over the decade
YoY top line supply trends in the market is witnessed to be in the range of 4 –
5 million sft annually with a declining trend in the last five years with limited
supply additions;
YoY top line absorption trends in the market is witnessed to be in the range of
4.5 – 5.0 million sft annually; Vacancy levels are witnessed to have narrowed
down
An analysis of second generation space uptake in the market was assessed to
be in the range of 30-50%
Zone wise composition of supply and demand in the market were assessed –
CBD and Off-CBD together have constituted approx. 20% share of the overall
market in the last 5 years – market share of the region is considered to be
subdued and the same has been controlled by the supply side activity (limited
quality large scale supply has been introduced in the market)
Review of the CBD/ Off CBD
level supply, demand, churn
and vacancy trends witnessed
in the organized office space
market
YoY top line supply trends in the market is witnessed to be in the range of 0.4
– 0.5 million sft with introduction of 2-5 building completions annually
YoY top line absorption trends in the market is witnessed to be in the range of
0.8 – 0.9 million sf t annually split across fresh leasing in new building
completions and secondary generation space uptake in the market
An analysis of churn/ secondary generation space uptake in the market was
assessed to have a<40% share in the market owing to small and medium scale
development completions – Absorption in the market has typically been
reflective of the supply introduced and secondary leasing in the market because
of tenants moving out of the region
Identification of key demand
dr ivers for the CBD/ Off CBD
market
Key demand drivers for the subject property is listed below:
▪ City center location – CBD micro market which is a self-sustained
economic hub with presence of commercial, retail, hospitality and
FINAL REPORT – PRE-FEASIBILITY FOR TAMIL NADU COMMERCE HUB | 54
Demand Assessment
residential developments; Easy accessibility to key urban nodes in the
city and transportation infrastructure – Naturally is the first choice for
commercial office space tenants
▪ Existing and proposed infrastructure – Located on the key spine /
arterial corridor of the city; Subject micro-market will be one of the only
office space markets to have metro connectivity in the near future;
Expected to boost demand for the region significantly
▪ Steady demand from IT and Non-IT tenants in the market – Past trends
are reflective of the preference of tenants to be located in the CBD
region
▪ Rental values comparable to that of SBD markets in the city – the rental
parity between CBD and SBD markets initially was approximately 20%
prior to 5 years; However, the current market conditions have
rationalized the same and the rental parity between a CBD and off CBD
market is almost negligible making the subject property very attractive
for tenants
▪ Limited vacancy levels in the subject region
▪ Limited competition in the market for similar nature of activity; Majority
of the planned developments in the subject region are small and
medium scale and do not have the locational advantages the subject
property offers;
To summarize, three key considerations from a tenant stand point would
be the location, scale and connectivity – SP is well positioned and can
be classified at a premium compared to any competing developments
in the city on the above parameters
Assessment of future supply
and expected absorption levels
Approx. 15 million sft of supply is currently under construction and planning at
a city level which is expected to hit the market by 2020; Additionally, another 4
million sft is expected to add to the supply by 2021
Further, of the total supply expected to come by 2020, approximately 12% -
13% is contributed by the CBD region constituted by about 10-12 small scale
to medium scale developments by tier 1 and 2 developers.
FINAL REPORT – PRE-FEASIBILITY FOR TAMIL NADU COMMERCE HUB | 55
Demand Assessment
Further, a layering of multiple approaches has been undertaken with
sensitivities to project the demand for subject property:
▪ NASSCOM projects growth of Indian IT Exports at 7-8% during 2017-
18 and 8-9% during the medium term; Further, Tamil Nadu holds a
share of ~11-13% as a share of exports and majority share ~90% is
contributed to by Chennai city; Share of TN and Chennai is expected
to remain steady considering the market side dynamics and other
support from the Government
▪ Tamil Nadu State’s economy has picked up moderate growth and the
GSDP growth rate at constant prices in 2017-18 is estimated to be
8.03%; Further, it is anticipated that the growth rate is expected to be
9% in the short term
▪ CAGR growth rate in absorption during 2010 – 2017 was recorded to
be 10% and 7% for the city and CBD/ Off CBD markets respectively
Further, a split up of the absorption constitution every year can be summarized
as below:
▪ Approx. 1.5 million sft of leasing activity every year is RFP driven (~2.5
mn sft of RFP’s looking for office space in Chennai market is currently
active)
▪ Pre-commitments to the tune of 1 million sft is witnessed in under
construction buildings2 3
* - is expected to emerge as a preferred market
trend for large tenants in the industry
▪ Secondary leasing activity trends in the market of approx. 1.5 – 2.0
million sft
▪ Additionally, it has been witnessed that a significant share of the
development completion gets absorbed on the year of development
completion
23 Pre-commitments have not been a commonly prevalent practice in the Chennai market; However, considering
the supply crunch witnessed in the past few years and significant share of supply expected to hit the market in the
next 3-4 years, tenants are evaluating pre-committing to spaces to ensure lower rental values also keeping long
term business expansions in mind

FINAL REPORT – PRE-FEASIBILITY FOR TAMIL NADU COMMERCE HUB | 56
Demand Assessment
Therefore, considering the above and based on CBRE in-house information on
the enquiries in the market, absorption in 2018 is expected to remain as per
the past years trends <5 million sft; However, the market is expected to
graduate to a 6.5 – 7.0 million sft market by 2021/ 22 considering the above-
mentioned factors and attractiveness of Chennai with regards to other south
India cities.
As mentioned above, the market share of demand catered by CBD and Off
CBD markets is approx. 20% share of the overall market in the last 5 years –
market share of the region is considered to be subdued and the same has been
controlled by the supply side activity (limited quality large scale supply has been
introduced in the market) – Considering the Introduction of SP to the market
which addresses majority of the lacuna that the current supply in the CBD poses
viz. Scale and quality of development, CBRE is of the opinion that CBD can
garner a higher market share to the tune of 20 - 25%.
Further, there is limited clarity on planned supply in CBD region beyond 3 years.
Therefore, a fair share of approx. 20% market share for the subject property
has been assumed and expected to lease out 250,000 sft – 350,000 sft
annually.
Additionally, accelerated marketing can be achieved by looking at marketing
the development as an Iconic building with premium positioning built to the
best of International standards aided with the Government branding to attract
tenants and thereby reduce the marketing timeframe.
Note: Demand estimation has been undertaken based on a combination of qualitative and quantitative
techniques at a high level as a part of this Pre-feasibility study; Detailed demand estimation projections
will be provided as a part of the Detailed Feasibility Report
Further, based on our discussions with the TNIFMC team, we understand that there is an alternative plan
to accommodate the existing tenants of the TUFICO, TNHB & Periyar EVR developments in a separate
building and would not be covered under the purview of the proposed developments under study.
Therefore, the same has not be included for demand estimation.
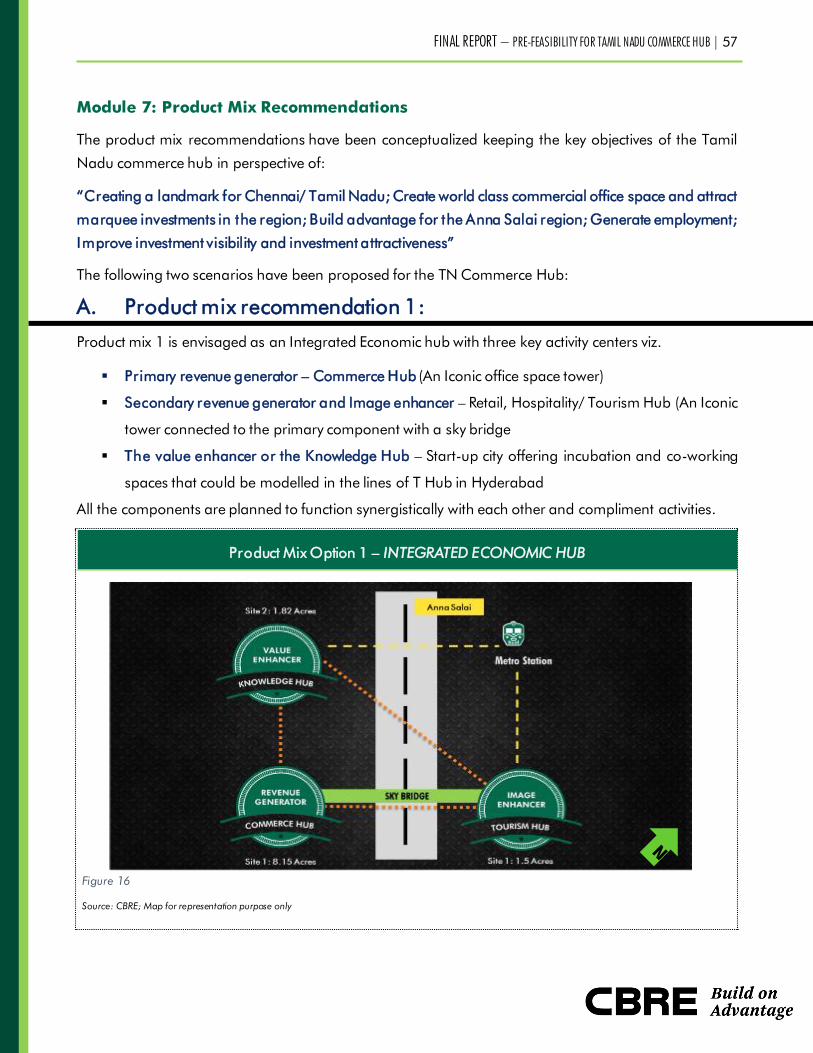
FINAL REPORT – PRE-FEASIBILITY FOR TAMIL NADU COMMERCE HUB | 57
Module 7: Product Mix Recommendations
The product mix recommendations have been conceptualized keeping the key objectives of the Tamil
Nadu commerce hub in perspective of:
“Creating a landmark for Chennai/ Tamil Nadu; Create world class commercial office space and attract
marquee investments in the region; Build advantage for the Anna Salai region; Generate employment;
Improve investment visibility and investment attractiveness”
The following two scenarios have been proposed for the TN Commerce Hub:
A. Product mix recommendation 1:
Product mix 1 is envisaged as an Integrated Economic hub with three key activity centers viz.
▪ Primary revenue generator – Commerce Hub (An Iconic office space tower)
▪ Secondary revenue generator and Image enhancer – Retail, Hospitality/ Tourism Hub (An Iconic
tower connected to the primary component with a sky bridge
▪ The value enhancer or the Knowledge Hub – Start-up city offering incubation and co-working
spaces that could be modelled in the lines of T Hub in Hyderabad
All the components are planned to function synergistically with each other and compliment activities.
Product Mix Option 1 – INTEGRATED ECONOMIC HUB
Figure 16
Source: CBRE; Map for representation purpose only

FINAL REPORT – PRE-FEASIBILITY FOR TAMIL NADU COMMERCE HUB | 58
The recommended product mix option has three elements:
SITE 1
1. Commerce Hub: The commerce hub would the economic center of this concept. Envisaged
to comprise of Grade A/ A+ commercial office spaces which should be positioned to target both
National and International MNCs. This is proposed to be an iconic twin tower development and
is expected to be designed by an International Architect offering world class infrastructure. The
large scale office space tower in this location is expected to have enhanced visibility on Anna
Salai.
Scale of development:
Base case: Maximum potential of approx. 0.68 mn sft – Subject Site I (North) which admeasures
approx. 8.15 acres.
Components: Commercial office space24
, Support services viz. Food court, gym, salon,
convenience stores, day care facility, etc.
Development strategy & pricing:
▪ Prominent developer branding expected to bring in goodwill for leasing the building
▪ Pricing strategy: Quoted rentals in the CBD region today by Grade A developments is in
the range of INR 80 to 88 per sft per month and quoted rentals in the Off-CBD region by
Grade A developments is in the range of INR 70 to 75 per sft per month. Based on CBRE
on-ground market experience of representing tenants, we understand that rentals
mentioned above are quoted in the market, however the transacted rentals are approx.
8-10% lower ~ there is a threshold of INR 80 per sft per month, higher than which closing
deals becomes a challenge. However, recent transactions in the CBD region were closed
at a range of INR 70 to 80 per sft per month. Therefore, considering the scale of
development, it is opined that ~ INR 70 – 75 per sft per month can be achieved for the
subject property – in line with the overall market after pre-leasing for anchor tenants;
Further appreciation can be witnessed, post leasing atleast 75% of the overall space
▪ CBD market has witnessed minimal rental appreciation over the past 5 years; Rental
opinion above refers to current date. Approximately 10-12% appreciation by the time of
leasing i.e by 2021 can be witnessed
24 Large floor plates which can be divisible into smaller segments without reducing the efficiency of the development

FINAL REPORT – PRE-FEASIBILITY FOR TAMIL NADU COMMERCE HUB | 59
▪ ~20% of the development should be pre-leased to a large occupier (IT/ ITeS/ Non-IT) at
about 15-20% discounted rental in order to reduce risk of marketing a large development
in the CBD and secure branding for the development
▪ Marketing Timeframe: 2.0 – 3.0 years
Tenant Profile: IT/ ITeS tenants to anchor the development along with Marquee non IT tenants
2. Tourism Hub2 5
: Would comprise of real estate components which would act as value add to
the main commercial hub. Hospitality, convention space/ auditorium and retail are key
components that would add value add to the commercial office space development. The
additional components envisaged add tourism value to the development and would also be
considered as a differentiated product offering. Typically, many iconic developments across the
world have been successful owing to the ‘Tourism Value added’ by means of providing hospitality,
retail & entertainment and leisure components of the development. Being located on Anna Salai,
the site has immense potential to support an exemplary iconic structure standing tall that would
cater to the captive commerce hub and the region at large.
The hospitality development is envisaged is a small – mid scale business class hotel (100 – 120
keys) and the demand for the same can be attracted at multiple levels:
▪ Inherent office space demand (Hospitality component as a part of integrated office spaces
is established as a successful concept)
▪ Demand from the proposed convention center with Tourism positioning
▪ Demand for a 3 star category business hotel on account of being centrally located with
good connectivity to various urban nodes
Scale of development:
Base case: Maximum potential of approx. 0.16 mn sft - Subject Site I (South) which admeasures
approx. 1.5 acres
Components: Hospitality (approx. 130 keys), Convention Center/ auditorium (~1,000 capacity),
Restaurants & bar, Rooftop specialty restaurant, etc.
Development strategy & pricing:
Hotel/ convention center component to be developed in consortium with a 3/ 4 star category
hospitality partner. Key demand drivers for this component would be inherently generated and
25 The concept of tourism hub has been arrived at based on benchmarking and CBRE expertise in the field.
Components of hospitality and convention center will be studied in detail as a part of the Detailed Feasibility Exercise
FINAL REPORT – PRE-FEASIBILITY FOR TAMIL NADU COMMERCE HUB | 60
also supplemented by the economic activity in the region. Achievable ARR’s for the proposed hotel
would be in the range of INR 3,750 – 4,750 with stabilized occupancies of ~65-70%
SITE 2
1. Knowledge Hub: The knowledge hub would be positioned at the bottom most portion of the
triad’s value chain adding the Knowledge Factor to the concept. Further, this would comprise of
an incubator / accelerator space which could be one of the kind in the State of Tamil Nadu. This
knowledge hub would bring the synergies of the government, educational institutions and the
corporates together and lead the way into future innovations and technologies. Knowledge Hub
to be modelled on the lines of T Hub in Hyderabad; Metro rail connectivity across the road would
act as a major booster for the success of this development.
Scale of development: The initial phase of this start up hub ~ 50,000 – 75,000 sft, with options
of scalability in the future - Subject Site II which admeasures approx. 1.8 acres
Components: Incubator / accelerator space, co-working / shared working spaces, meeting
rooms, open spaces, etc.
Development strategy & pricing:
▪ The educational infrastructure present in the city / subject region would act as a major
driver for this value hub
▪ Incubators typically charge a fee for using the real estate space and the support provided;
Further, a percentage share on their business operations revenue is also taken. The same
could differ from one start-up hub to another
Sky Bridge: The sky bridge would connect both the iconic towers at a concourse level retail that could be
planned with a ‘Food Hub’ concept in the lines of Cyber Hub in Gurgaon. It would also add as a design
differentiator and help position the development as iconic owing to the concept and design of
development. Further, the cost associated with the sky bridge has been considered

FINAL REPORT – PRE-FEASIBILITY FOR TAMIL NADU COMMERCE HUB | 61
B. Product mix recommendation 2:
Based on the analysis undertaken in the previous modules of the study, we understand that there is
significant and steady for commercial office spaces in the subject region. Further, we understand that the
format of spaces range from IT office spaces to corporate offices/ sales offices/ co-working spaces, etc.
Therefore, considering the same and the inherent benefits/ inhibitors for the subject site, an Iconic, large
commercial office space towers are envisaged on Site 1 – segregated as corporate office space with
smaller floor plates (north side property) and regular office space tower that can be leased out to IT/ non
IT companies. Further, the start up hub concept has been proposed in Site 2.
Product Mix Option 2
Source: CBRE; Map for representation purpose only.
In the second product mix option, we have recommended that the concept has two different components:
SITE 1
1. Commercial Office Space: The commercial office space would comprise of two office
towers on either side of Anna Salai.
a. The commercial tower on the large land parcel (8.15 acres) has a maximum development
potential of approx. 0.68 mn sft. The same could be positioned as world class commercial
office tower which could house an array of corporates across various categories. An
Figure 17
FINAL REPORT – PRE-FEASIBILITY FOR TAMIL NADU COMMERCE HUB | 62
opportunity to construct a large scale commercial development would help the iconic
development attract IT/ITeS clients, BFSI corporates and other Non IT occupiers who prefer
to be located in the CBD but are currently located in the Off CBD or SBD locations owing
to lack of scalable options in the CBD.
b. The smaller land parcel (1.5 acres) which has a maximum development potential approx.
0.16 mn sft could be positioned as a corporate office tower which would target occupiers
who require smaller office spaces ~ corporate offices of local business houses, offices of
professions viz. legal practices, chartered accountancy practices, etc., sales offices of
national & multinational corporates, front offices of educational institutions, industrial
parks, manufacturing facilities, etc.
Scale of development:
Base case - Maximum potential of approx. 0.84 mn sft
Components:
Commercial office space, Support services viz. Food court, gym, salon, convenience stores, creche
Corporate office space with small scale support amenities and business center facilities
Development strategy & pricing:
▪ Prominent developer branding expected to bring in goodwill for leasing the building
▪ Pricing strategy: Quoted rentals in the CBD region today by Grade A developments is in
the range of INR 80 to 88 per sft per month and quoted rentals in the Off-CBD region by
Grade A developments is in the range of INR 70 to 75 per sft per month. Based on CBRE
on-ground market experience of representing tenants, we understand that rentals
mentioned above are quoted in the market, however the transacted rentals are approx.
8-10% lower ~ there is a threshold of INR 80 per sft per month, higher than which closing
deals becomes a challenge. However, recent transactions in the CBD region were closed
at a range of INR 70 to 80 per sft per month. Therefore, considering the scale of
development, it is opined that ~ INR 70 – 75 per sft per month can be achieved for the
subject property – in line with the overall market after pre-leasing for anchor tenants;
Further appreciation can be witnessed, post leasing atleast 75% of the overall space
▪ CBD market has witnessed minimal rental appreciation over the past 5 years; Rental
opinion above refers to current date. Approximately 10-12% appreciation by the time of
leasing i.e by 2021 can be witnessed
FINAL REPORT – PRE-FEASIBILITY FOR TAMIL NADU COMMERCE HUB | 63
▪ ~20% of the development should be pre-leased to a large occupier (IT/ ITeS/ Non-IT) at
about 15-20% discounted rental in order to reduce risk of marketing a large development
in the CBD and secure branding for the development
▪ Marketing Timeframe considering towers are being marketed at the same time: 2.5 – 4.0
years
SITE 2
2. Start Up Hub:2 6
The start-up hub would comprise of an incubator / accelerator space which
could be one of the kind in the State of Tamil Nadu. This should bring the synergies of the
government, educational institutions and the corporates together and lead the way into future
innovations and technologies.
Scale of development: The initial phase of this start up hub ~ 50,000 – 75,000 sft, with options
of scalability in the future - Subject Site II which admeasures approx. 1.8 acres.
Components: Incubator / accelerator space, co-working / shared working spaces, meeting
rooms, open spaces, etc.
Development strategy & pricing:
▪ The educational infrastructure present in the city / subject region would act as a major
driver for this value hub
▪ Incubators typically charge a fee for using the real estate space and the support provided;
Further, a percentage share on their business operations revenue is also taken. The same
could differ from one start-up hub to another
26 Similar to recommended Option 1
FINAL REPORT – PRE-FEASIBILITY FOR TAMIL NADU COMMERCE HUB | 64
Module 8: Development Option Formats
Market practices prevalent are illustrated below:
Joint Development
In this model of development, the land owner brings in the land as his equity and the developer bring in
the cost of construction as his equity. Further, development rights of the property will be given to the
Developer. The proceeds from the development are split between the land owner and the developer as
per pre-agreed terms based on the valuation of the land and income from the asset.
Joint Venture
In this model, a Special Purpose Vehicle is formed where the landlord and developer will be equity
partners. A percentage split on the rights of the SPV is determined on the percentage of contribution of
the partners towards the total project cost (land value + cost of construction). The revenue generated out
of the SPV will be shared by the partners based on the rights held by them.
Developer Manager Model
In this model of development, the land owner holds entire risk of development and the role of the
developer is more like a contractor. The developer would work as a vendor and develop, lease and
operate the property for which he would be compensated as a percentage share of top line revenues –
manager fee.
Self-Development Model
The land owner will bring in and EDC (Engineer Design and Construct) company to do the development.
The rights to the development and revenue will solely be enjoyed by the land-owning department. The
EDC company would be compensated for his services either based on a percentage on the top line
numbers or as a lump sum amount for the services rendered. The raising of funds must be done by the
land-owning department. In this method of development, the leasing risk remains with the land owner.
FINAL REPORT – PRE-FEASIBILITY FOR TAMIL NADU COMMERCE HUB | 65
Module 9: SWOT & Conclusion
1. SWOT Analysis
A project level SWOT analysis has been conducted to get a full circle perspective of the envisaged
development.
Strengths:
Site:
Site 1:
✓ Scale advantage: Size is approx. 9.65 acres ~ opportunity to introduce a large scale
development
✓ Contiguity: Non-contiguous land parcel ~ allows for development of two distinguished
components which will synergize with each other
✓ Frontage and accessibility ~ boosts the visibility of the site
o North Site: Enjoys frontage and accessibility along Anna Salai & two other proposed 60
feet roads
o South Site: Enjoys frontage and accessibility along Anna Salai
✓ Presence of metro ~ at approx. 800m; major advantage
Site 2:
✓ Shape: The site is fairly rectangular ~ allows for efficiency in space utilization
✓ Contiguity: Site is contiguous in nature
Location:
✓ Located on Anna Salai which is an established mix use hub comprising of commercial, retail
and hospitality – ecosystem for commercial office space is currently existent
✓ Anna Salai is one of the key arterial roads of the city ~ good connectivity; further, the proposed
metro would boost accessibility to the sites
Commercial market:
✓ Currently garners a 20 – 25% share in city’s commercial office space total supply and absorption
✓ Low vacancy levels in the CBD & Off region ~ 14 – 15%
Product mix – Option 1:
✓ Would act as an integrated economic hub ~ commerce hub, tourism hub & knowledge hub
complementing each other
Product mix – Option 2:
✓ Keeping the product mix strictly commercial would aid in positioning the development as a
commerce hub
FINAL REPORT – PRE-FEASIBILITY FOR TAMIL NADU COMMERCE HUB | 66
Others:
✓ Keeping in perspective the government involvement in the project, we understand that the
approval process would be streamlined / faster
✓ Further, government support would result in investment attractiveness and reach across various
large corporates – reduced marketing timeframe
Weaknesses:
Site 1:
✓ Shape: Irregular shape of the North side land parcel ~ could hamper development potential
✓ Cost involved in site development ~ owing to presence of current structures
✓ Requirement to acquire the private property, expansion /development of proposed roads ~
might result in delay of development, increased cost, etc.
✓ The Anna Salai corridor has metro connectivity, however, the nearest metro station to the site
would be approx. 800 meters away – same can be mitigated by providing a walkway from the
station to the site (this would have a cost implication)
Site 2:
✓ Cost involved in site development ~ owing to presence of current structures
✓ Profile of surroundings: Presence of slum developments on one side of the site
Product mix – Option 1:
✓ With the presence of start-up hub, commercial and hospitality components ~ risk of engaging
with various operators for each of the components
Product mix – Option 2:
✓ Longer marketing timeframe for the commercial and corporate office tower vis-à-vis product
mix 1
Opportunities:
✓ Tourism hub would act as a key enabler in increasing recall value ~ helping the development
reach an iconic status
✓ The start-up hub would be a great way to re-emphasize government branding and impetus on
the IT/ITeS industry
✓ Large land parcel size provides an opportunity to introduce large scale commercial office supply
in the market ~ currently not prevalent in the CBD and off CBD zones
Threats:
✓ Competition from SBD market as it is increasingly being favored by the IT/ITeS companies
✓ Traffic congestion during peak hours would act as a dampener for the development
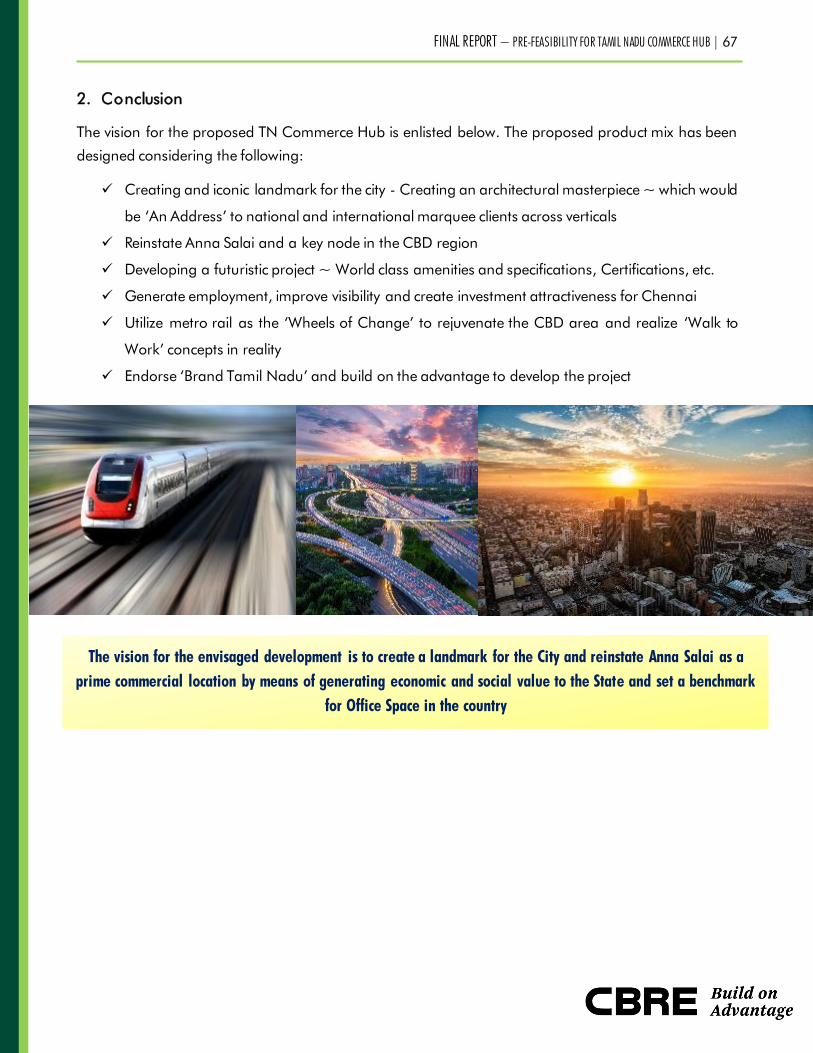
FINAL REPORT – PRE-FEASIBILITY FOR TAMIL NADU COMMERCE HUB | 67
2. Conclusion
The vision for the proposed TN Commerce Hub is enlisted below. The proposed product mix has been
designed considering the following:
✓ Creating and iconic landmark for the city - Creating an architectural masterpiece ~ which would
be ‘An Address’ to national and international marquee clients across verticals
✓ Reinstate Anna Salai and a key node in the CBD region
✓ Developing a futuristic project ~ World class amenities and specifications, Certifications, etc.
✓ Generate employment, improve visibility and create investment attractiveness for Chennai
✓ Utilize metro rail as the ‘Wheels of Change’ to rejuvenate the CBD area and realize ‘Walk to
Work’ concepts in reality
✓ Endorse ‘Brand Tamil Nadu’ and build on the advantage to develop the project
The vision for the envisaged development is to create a landmark for the City and reinstate Anna Salai as a
prime commercial location by means of generating economic and social value to the State and set a benchmark
for Office Space in the country
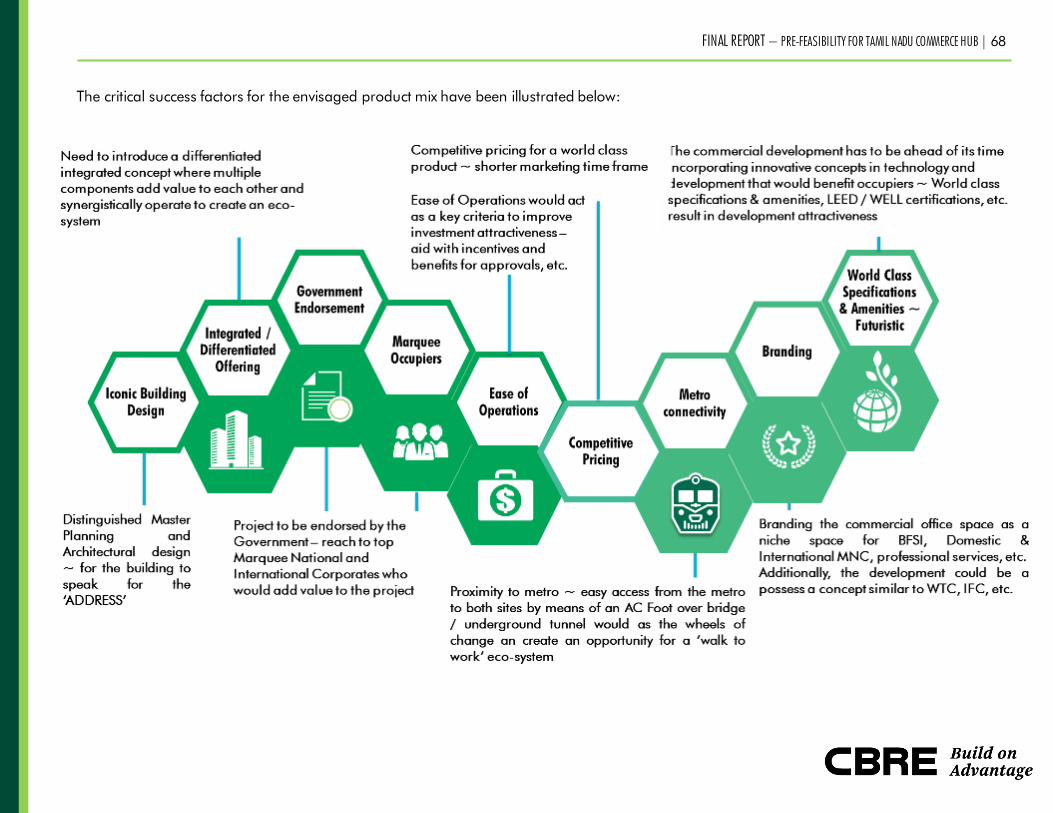
FINAL REPORT – PRE-FEASIBILITY FOR TAMIL NADU COMMERCE HUB | 68
The critical success factors for the envisaged product mix have been illustrated below:

FINAL REPORT – PRE-FEASIBILITY FOR TAMIL NADU COMMERCE HUB | 69
ABBREVIATIONS
BPO Business Process Outsourcing
BFSI Banking, Financial Services and Insurance
CAGR Compounded Annual Growth Rate
CBD Central Business District
CMDA Chennai Metropolitan Development Authority
CMRL Chennai Metro Rail Ltd
GDP Gross Domestic Product
GoTN Government of Tamil Nadu
GST Road Grand Southern Trunk Road
FMCG Fast Moving Consumer Goods
FSI Floor Space Index
HIG High Income Group
IGBC Indian Green Building Council
IT Information Technology
ITeS Information Technology enabled Services
KPO Knowledge Process Outsourcing
mn Million
MPR Mount Poonamalle Road
MRTS Mass Rapid Transit System
MVP Minimum Viable Product
NCR National Capital Region
NH National Highway
OMR Old Mahabalipuram Road
PBD Peripheral Business District
SBD Secondary Business District
SEZ Special Economic Zone
SIPCOT State Industries Promotion Corporation of Tamil Nadu Ltd
Sft Square Feet
TNHB Tamil Nadu Housing Board
TNIFMC Tamil Nadu Infrastructure Fund Management Corporation Ltd
TNIDB Tamil Nadu Infrastructure Development Board
TNSCB Tamil Nadu Slum Clearance Board
TUFIDCO Tamil Nadu Urban Finance and Infrastructure Development Corporation Ltd
USP Unique Selling Proposition
WTC World Trade Center
WTCA World Trade Center’s Association