tall buildings and the urban microclimate in the city of · pdf filetall buildings and the...
TRANSCRIPT
Tall Buildings and the Urban Microclimate in the City of London
Sujal V. Pandya, B. Arch., M. Sc, COA Luisa Brotas, Arch, PhD, ARB, RIBA Low Energy Architecture Research Unit Low Energy Architecture Research Unit, Sir John Cass, London Metropolitan University, United Kingdom Faculty of Art, Architecture and Design,
London Metropolitan University, United Kingdom [email protected]
ABSTRACT
The design of tall buildings can be quite complex not only in architectural, structural or façade system terms but also in their interrelations with the environment. Recent design developments have shown a growing consideration for this micro-climate interface as a part of a sustainable design strategy for tall buildings towards bioclimatic urban fabrics. Architects and urban planners recognize that the importance of activities at street level is a constant reality. Many efforts are made to develop sustainable skyscrapers where the co-relation with the surrounding environment influences the architecture, land use pattern, public realm and street activities. The aim of this study is to understand the environmental or bioclimatic factors, which take part in the creation of microclimate relations between tall buildings and the urban city fabric. The research includes a brief understanding of bioclimatic design of tall building focusing in its relation to surrounding neighbourhoods. The impact of environmental factors namely wind flow patterns around buildings, daylight availability and overshadowing, air temperature and humidity, as well as the urban heat island phenomena, landscape and albedo of materials, vehicular & pedestrian movements and activity patterns at street levels in tall building clusters is addressed. A series of environmental variables measured during summer and simulated results of Canary Wharf and Liverpool Street clusters are compared to understand how the urban microclimates are affected within two different urban fabric typologies in London. Outcomes of literature review and these two case studies give useful guidelines to be utilized in the process of Sustainable urban design.
INTRODUCTION
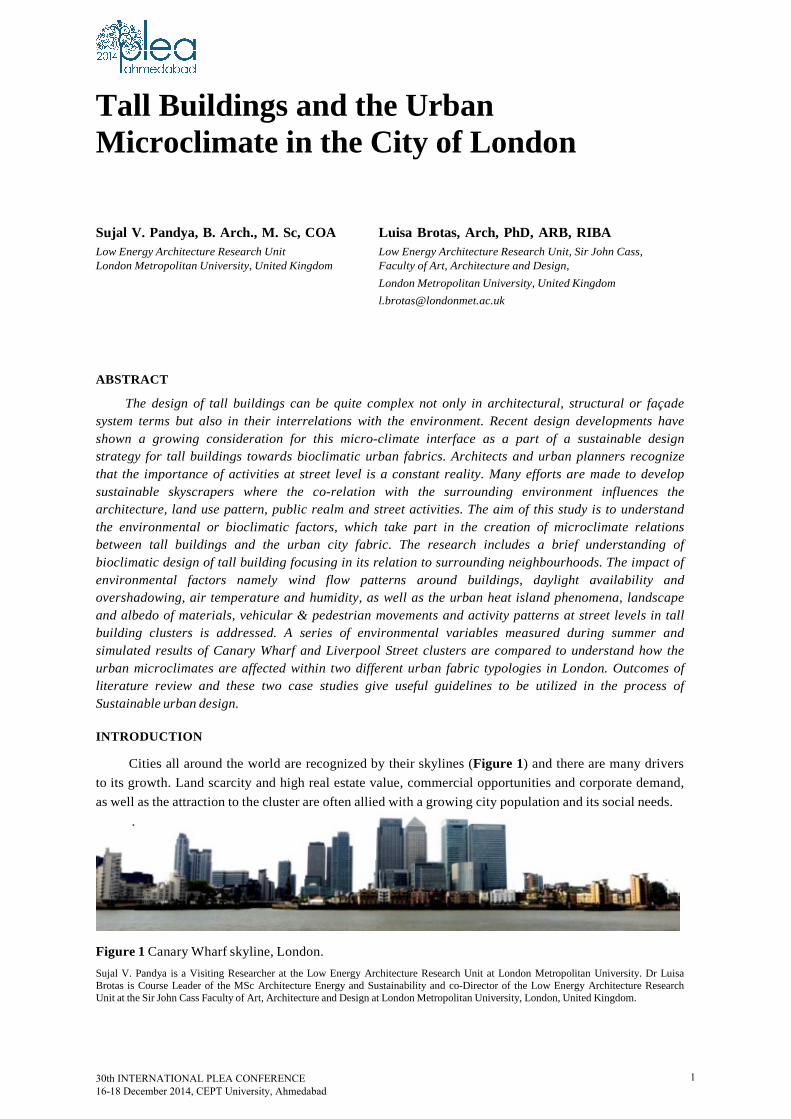
Cities all around the world are recognized by their skylines (Figure 1) and there are many drivers to its growth. Land scarcity and high real estate value, commercial opportunities and corporate demand, as well as the attraction to the cluster are often allied with a growing city population and its social needs.
.
Figure 1 Canary Wharf skyline, London. Sujal V. Pandya is a Visiting Researcher at the Low Energy Architecture Research Unit at London Metropolitan University. Dr Luisa Brotas is Course Leader of the MSc Architecture Energy and Sustainability and co-Director of the Low Energy Architecture Research Unit at the Sir John Cass Faculty of Art, Architecture and Design at London Metropolitan University, London, United Kingdom.
30th INTERNATIONAL PLEA CONFERENCE16-18 December 2014, CEPT University, Ahmedabad
1

The City of London is a world financial centre and needs to project an image of power and efficiency. The scarcity of land within the neighbourhood is further restricted by a surrounding mesh of residential buildings, on average with less than 3 floors (London has around 52% dwelling of the type terraced, semi detached and detached). High rise buildings being structures with 12 floors minimum contrast significantly with the low height London residential stock. According to the England housing survey, London only has 20% of dwellings that are 3 or more storeys in height. (EHS, 2012) This contrast with high-rise clusters developed within the city and in particular in the city of London neighbourhood (Canary Wharf Tower is 235m height). Tall buildings in a cluster are a growing tendency as a solution to the need of office space within the limited land available. The Greater London Authority promotes this concept as an efficient way to build offices that need to be energy efficient and with good public transport access and capacity, in line with sustainable cities and the Agenda 21. (GLA, 2014)
This creates an opportunity for sustainable development in a holistic approach that goes beyond the architecture, structural or façade system to include the interface between the street environment and the building. Recent design developments have shown major consideration over this microclimate interface as a part of a sustainable design strategy for tall buildings in the direction of making bioclimatic urban fabrics.
Likewise local climate variations influence the urban boundary and should be given much thought. The amount of solar radiation can be significantly reduced in urban areas as a result of overshadowing, air pollutants and wind flow patterns adding to the greenhouse effect. The Urban Heat Island phenomenon can be aggravated by high-density materials, surfaces with low albedo, reduced green spaces (evapotranspiration) and anthropogenic heat. This impacts the surface and air temperatures near the ground. Conversely high-rise buildings require special attention to the effect of strong winds at high levels. At street level wind may be much reduced overall (though it may increase locally due to a ‘wind tunnel’ effect) and buildings casting shadows may create dark and cold spots for pedestrians. The character of the urban cluster / fabric play a big role in such microclimates. (Littlefair, 2000; Erell, 2011)
BIOCLIMATIC DESIGN CONSIDERATIONS FOR URBAN FABRICS WITH TALL BUILDINGS
The effect of climate on the activities of occupants and its health is the base of Bioclimatology. The
bioclimatic design approach is not limited to the building but extends beyond and involves external environmental conditions, site location, geography, surrounding buildings and their aesthetic expressions, land use pattern, the neighbourhood cluster, public accessibility and activities. (Clair, 2010) The major bioclimatic design considerations for high-rise clusters are:
a. Urban geometry (Figure 2): variation in heights and in-between distances of buildings (street canyon);
b. Local climate: external air temperature, relative humidity and prevailing wind direction and speed;
c. Orientation and overshadowing (Figure 3): position of tall buildings with respect to south (northern hemisphere) and its exposure to solar radiation and overshadowing over low-rise buildings within the cluster;
d. Solar access, solar radiation and albedo (Figure 4);
e. Urban canyons (Figure 5).
Figure 2 Urban Geometry. Figure 3 Orientation and Overshadowing.
30th INTERNATIONAL PLEA CONFERENCE 16-18 December 2014, CEPT University, Ahmedabad
2
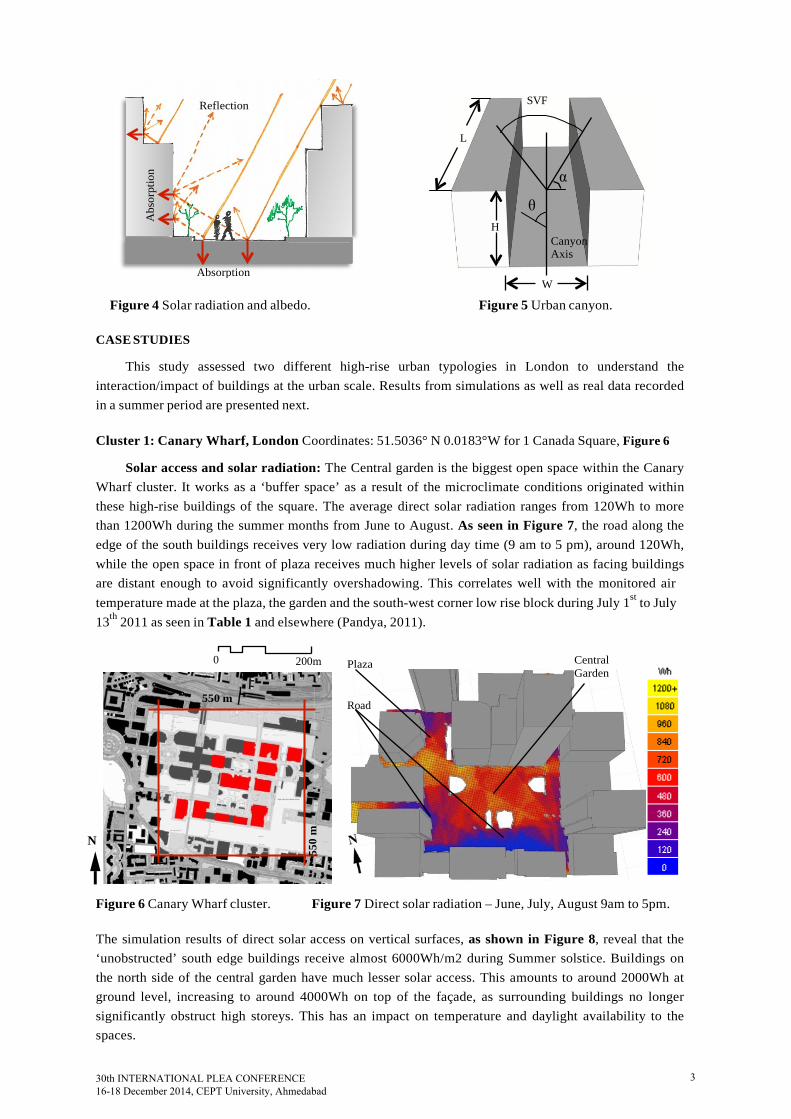
Figure 4 Solar radiation and albedo. Figure 5 Urban canyon.
CASE STUDIES
This study assessed two different high-rise urban typologies in London to understand the
interaction/impact of buildings at the urban scale. Results from simulations as well as real data recorded in a summer period are presented next.
Cluster 1: Canary Wharf, London Coordinates: 51.5036° N 0.0183°W for 1 Canada Square, Figure 6
Solar access and solar radiation: The Central garden is the biggest open space within the Canary Wharf cluster. It works as a ‘buffer space’ as a result of the microclimate conditions originated within these high-rise buildings of the square. The average direct solar radiation ranges from 120Wh to more than 1200Wh during the summer months from June to August. As seen in Figure 7, the road along the edge of the south buildings receives very low radiation during day time (9 am to 5 pm), around 120Wh, while the open space in front of plaza receives much higher levels of solar radiation as facing buildings are distant enough to avoid significantly overshadowing. This correlates well with the monitored air temperature made at the plaza, the garden and the south-west corner low rise block during July 1st to July 13th 2011 as seen in Table 1 and elsewhere (Pandya, 2011).
Figure 6 Canary Wharf cluster. Figure 7 Direct solar radiation – June, July, August 9am to 5pm.
The simulation results of direct solar access on vertical surfaces, as shown in Figure 8, reveal that the ‘unobstructed’ south edge buildings receive almost 6000Wh/m2 during Summer solstice. Buildings on the north side of the central garden have much lesser solar access. This amounts to around 2000Wh at ground level, increasing to around 4000Wh on top of the façade, as surrounding buildings no longer significantly obstruct high storeys. This has an impact on temperature and daylight availability to the spaces.
SVF
L
α
θ H
Canyon Axis
W
Reflection
Absorption
0 200m Plaza Central Garden
550 m Road
N
Abs
orpt
ion
550
m
30th INTERNATIONAL PLEA CONFERENCE 16-18 December 2014, CEPT University, Ahmedabad
3
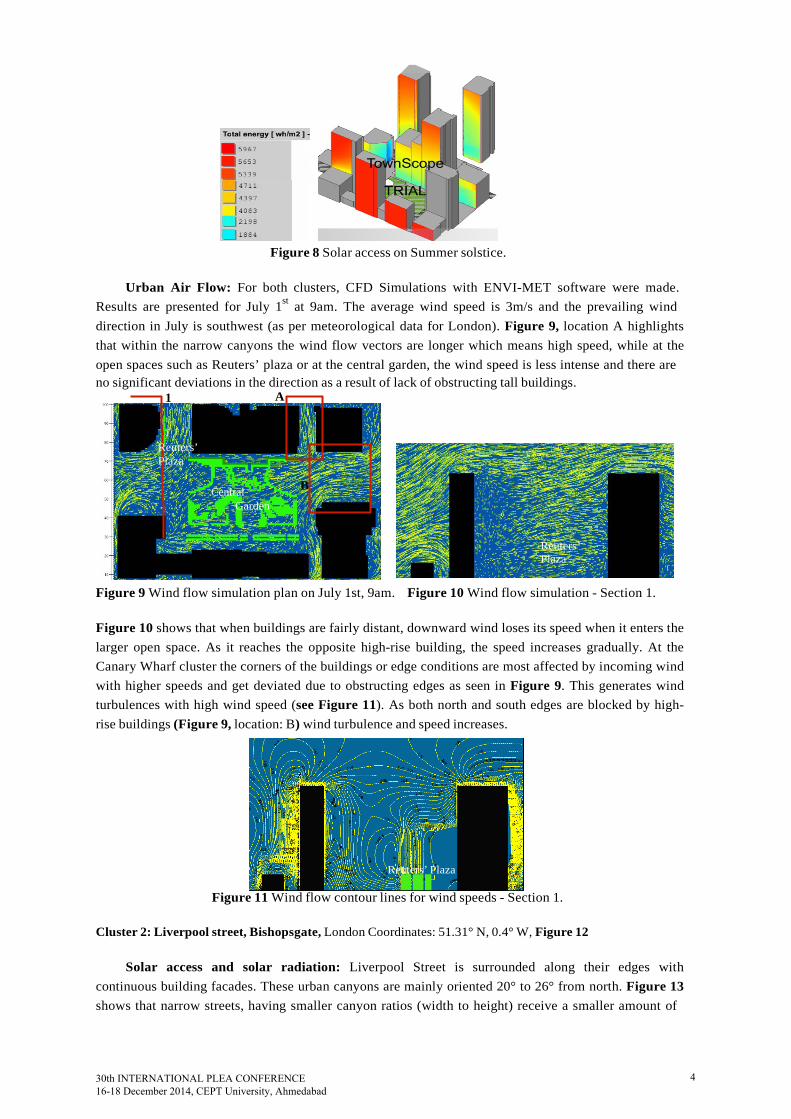
Figure 8 Solar access on Summer solstice.
Urban Air Flow: For both clusters, CFD Simulations with ENVI-MET software were made.
Results are presented for July 1st at 9am. The average wind speed is 3m/s and the prevailing wind direction in July is southwest (as per meteorological data for London). Figure 9, location A highlights that within the narrow canyons the wind flow vectors are longer which means high speed, while at the open spaces such as Reuters’ plaza or at the central garden, the wind speed is less intense and there are no significant deviations in the direction as a result of lack of obstructing tall buildings.
1 A
Reuters’ Plaza
Central B Garden
Figure 9 Wind flow simulation plan on July 1st, 9am. Figure 10 Wind flow simulation - Section 1.
Figure 10 shows that when buildings are fairly distant, downward wind loses its speed when it enters the larger open space. As it reaches the opposite high-rise building, the speed increases gradually. At the Canary Wharf cluster the corners of the buildings or edge conditions are most affected by incoming wind with higher speeds and get deviated due to obstructing edges as seen in Figure 9. This generates wind turbulences with high wind speed (see Figure 11). As both north and south edges are blocked by high- rise buildings (Figure 9, location: B) wind turbulence and speed increases.
Reuters’ Plaza
Figure 11 Wind flow contour lines for wind speeds - Section 1.
Cluster 2: Liverpool street, Bishopsgate, London Coordinates: 51.31° N, 0.4° W, Figure 12
Solar access and solar radiation: Liverpool Street is surrounded along their edges with continuous building facades. These urban canyons are mainly oriented 20° to 26° from north. Figure 13 shows that narrow streets, having smaller canyon ratios (width to height) receive a smaller amount of
Reuters’ Plaza
30th INTERNATIONAL PLEA CONFERENCE 16-18 December 2014, CEPT University, Ahmedabad
4

direct solar radiation (street in front of Tower 42). The plaza, an important public space in the neighbourhood, receives more than 2500Wh.
Garden Swiss Re
Tower 42
Plaza
Figure 12 Liverpool street, Bishopsgate cluster Figure 13 Direct solar radiation - June, July, August. 9am to 5 pm
Figure 14 Solar Access on Summer solstice
In case of the Swiss Re building, the rear open space is used as a café and restaurant esplanade during summer, as it benefits form direct sun from southeast and south. This is not the situation at the front entrance as it is blocked by continuous buildings, and solar radiation is reduced to 500Wh. Figure 14 shows that the orientation of canyons/streets and buildings heights along the edge of them, can significantly affect the solar access at ground level, from 400 to 1500Wh/m2. Solar access on the façade at higher floors can reach 7500Wh/m2. At this cluster most of the high-rise buildings are fully glazed with anti-reflective glass, other surfaces also have reduced albedo. This prevents a high amount of solar radiation to be reflected towards the surrounding cluster. Conversely it may minimize problems of reflected glare. However, it is likely to increase the cooling loads of the spaces as well as aggravate thermal stress at the façade.
Urban Air Flow: The irregular urban geometry of the Liverpool street cluster, with varying
canyon orientations and monotonous flat building fabrics, shows dramatic changes in wind flows. Figure 15, Location A – Bishopsgate road is a narrow canyon with building heights around 25 to 40m. The length of the canyon is about 65m and its orientation is southwest to northeast. This geometry permits the southwest wind with high speed entering the canyon. Figure 16, Section 1 shows airflow vectors going in the negative direction, upward, as a result of the close vertical surfaces on both sides of the in-between space. As the aspect ratio (H/W) is quite high, the incoming wind speed is higher than the one flowing above the roof of the building.
0 200m
N
30th INTERNATIONAL PLEA CONFERENCE 16-18 December 2014, CEPT University, Ahmedabad
5
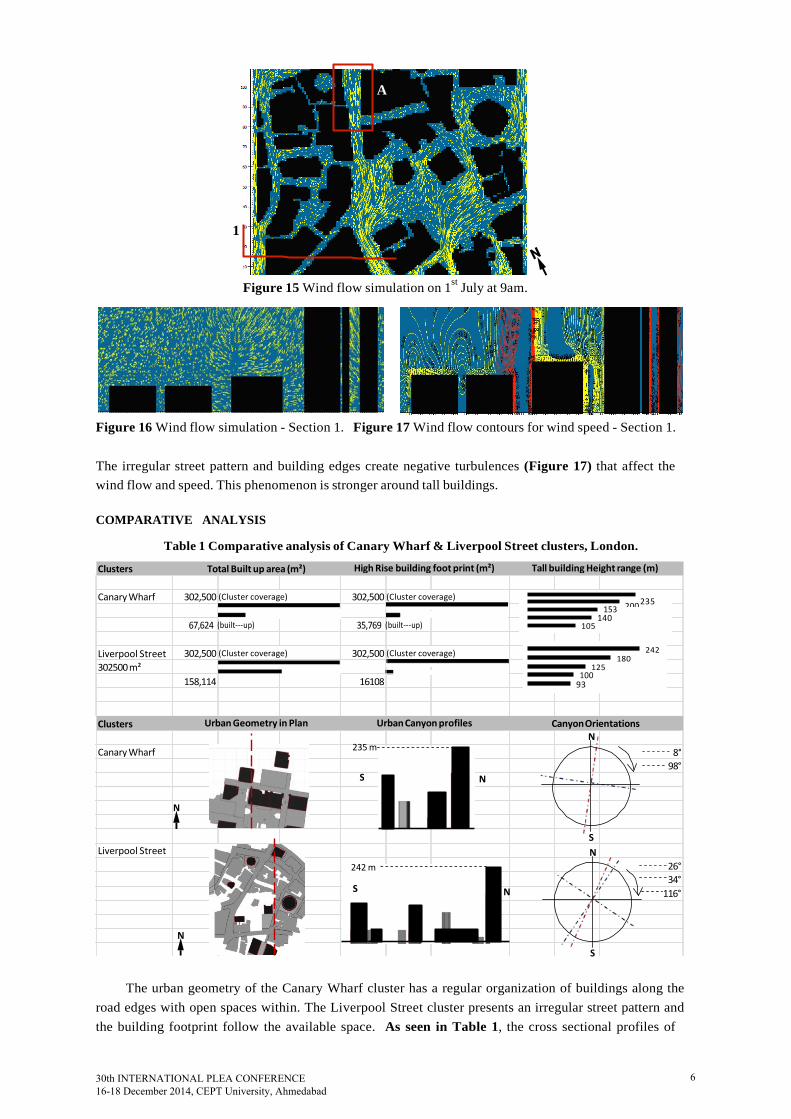
Figure 15 Wind flow simulation on 1st July at 9am.
Figure 16 Wind flow simulation - Section 1. Figure 17 Wind flow contours for wind speed - Section 1.
The irregular street pattern and building edges create negative turbulences (Figure 17) that affect the wind flow and speed. This phenomenon is stronger around tall buildings.
COMPARATIVE ANALYSIS
Table 1 Comparative analysis of Canary Wharf & Liverpool Street clusters, London.
The urban geometry of the Canary Wharf cluster has a regular organization of buildings along the road edges with open spaces within. The Liverpool Street cluster presents an irregular street pattern and the building footprint follow the available space. As seen in Table 1, the cross sectional profiles of
Clusters Total Built up area (m²) High Rise building foot print (m²) Tall building Height range (m)
Canary Wharf 302,500 (Cluster coverage) 302,500 (Cluster coverage) 200 235
153 140
67,624 (built---up) 35,769 (built---up) 105
Liverpool Street 302500 m²
302,500 (Cluster coverage) 302,500 (Cluster coverage) 242 180
125
158,114 16108 100
93
Clusters Urban Geometry in Plan Urban Canyon profiles Canyon Orientations N
Canary Wharf 235 m 8° 98°
S N
N
Liverpool Street S N
242 m S N
26° 34°
116°
N
S
A
1
30th INTERNATIONAL PLEA CONFERENCE 16-18 December 2014, CEPT University, Ahmedabad
6
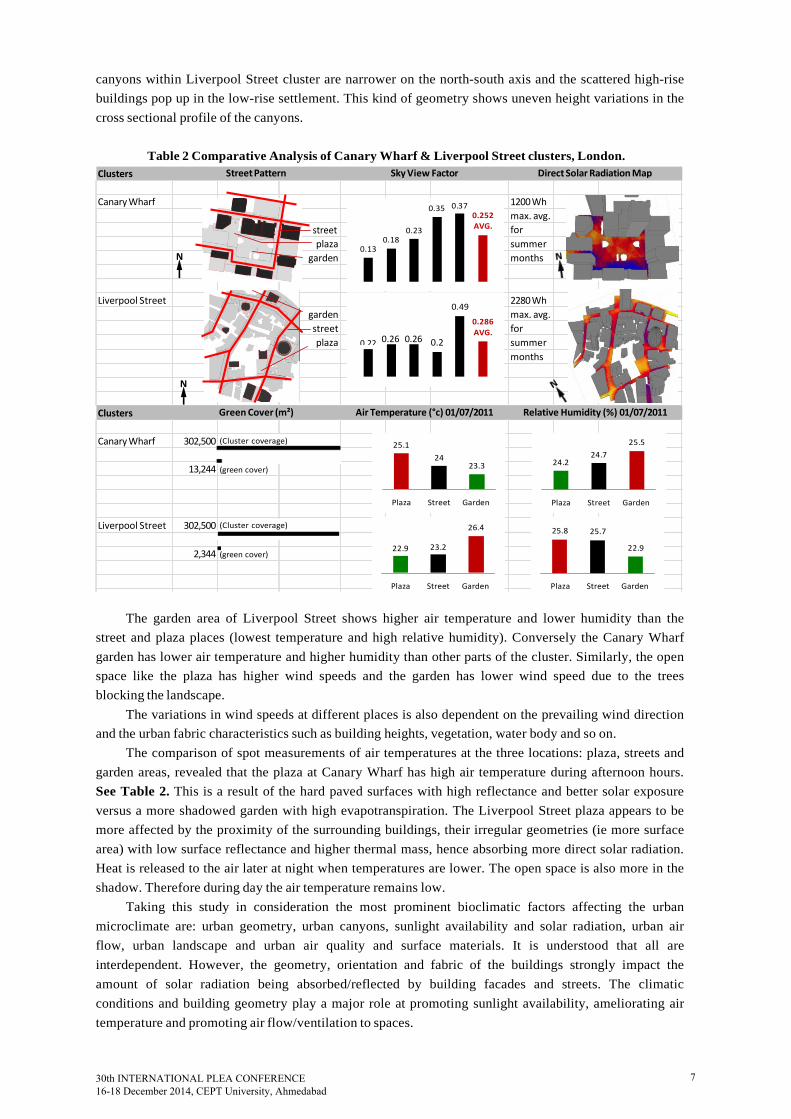
canyons within Liverpool Street cluster are narrower on the north-south axis and the scattered high-rise buildings pop up in the low-rise settlement. This kind of geometry shows uneven height variations in the cross sectional profile of the canyons.
Table 2 Comparative Analysis of Canary Wharf & Liverpool Street clusters, London.
The garden area of Liverpool Street shows higher air temperature and lower humidity than the street and plaza places (lowest temperature and high relative humidity). Conversely the Canary Wharf garden has lower air temperature and higher humidity than other parts of the cluster. Similarly, the open space like the plaza has higher wind speeds and the garden has lower wind speed due to the trees blocking the landscape.
The variations in wind speeds at different places is also dependent on the prevailing wind direction and the urban fabric characteristics such as building heights, vegetation, water body and so on.
The comparison of spot measurements of air temperatures at the three locations: plaza, streets and garden areas, revealed that the plaza at Canary Wharf has high air temperature during afternoon hours. See Table 2. This is a result of the hard paved surfaces with high reflectance and better solar exposure versus a more shadowed garden with high evapotranspiration. The Liverpool Street plaza appears to be more affected by the proximity of the surrounding buildings, their irregular geometries (ie more surface area) with low surface reflectance and higher thermal mass, hence absorbing more direct solar radiation. Heat is released to the air later at night when temperatures are lower. The open space is also more in the shadow. Therefore during day the air temperature remains low.
Taking this study in consideration the most prominent bioclimatic factors affecting the urban microclimate are: urban geometry, urban canyons, sunlight availability and solar radiation, urban air flow, urban landscape and urban air quality and surface materials. It is understood that all are interdependent. However, the geometry, orientation and fabric of the buildings strongly impact the amount of solar radiation being absorbed/reflected by building facades and streets. The climatic conditions and building geometry play a major role at promoting sunlight availability, ameliorating air temperature and promoting air flow/ventilation to spaces.
Canary Wharf 1200 Wh max. avg. for
plaza summer N garden months
Liverpool Street 2280 Wh garden max. avg. street for plaza summer
months
N
Canary Wharf 302,500 (Cluster coverage)
13,244 (green cover)
Liverpool Street 302,500 (Cluster coverage)
2,344 (green cover)
Clusters Street Pattern Sky View Factor Direct Solar Radiation Map
0.35 0.37
street 0.23
0.252 AVG.
0.18 0.13
0.49
0.22 0.26 0.26
0.286 AVG.
0.2
Clusters Green Cover (m²) Air Temperature (°c) 01/07/2011 Relative Humidity (%) 01/07/2011
25.1 25.5
24 24.7 23.3 24.2
Plaza Street Garden Plaza Street Garden
26.4 25.8 25.7
22.9 23.2 22.9
Plaza Street Garden Plaza Street Garden
30th INTERNATIONAL PLEA CONFERENCE 16-18 December 2014, CEPT University, Ahmedabad
7
CONCLUSIONS
Environmental factors such as air temperature and humidity, wind speed and direction, solar radiation and daylight conditions, noise and air pollution at ground level can make open areas in cities an appealing and comfortable place for pedestrians. Results presented above discuss the influence of these factors within two high-rise clusters in London. Furthermore, they strongly impact the energy performance of surrounding buildings and its comfort conditions and should be given much thought towards sustainable urbanism within existing and future cities.
Canary Wharf has a rich landscape planning in terms of public realm, environmental sustainability, ecology and usage. The central garden permits solar access, a pleasant airflow and acts as a sound barrier from busy roads nearby. Road includes coniferous trees, which helps disperse the pollution particles within the canopy layer. Deciduous trees at the street side provide protection from direct sun and wind turbulence whilst still allows air movement between the trees and the adjacent buildings for ventilation.
Liverpool Street has a compact and dense urban fabric with reduced open spaces, which can be used for urban landscape. Trees in internal courtyards of buildings may be beneficial to the building and its users but not at the urban scale. In hot periods, when the temperature rises above comfort level, direct and the reflected solar radiation from building surfaces increase the Heat Island effect. To minimize this, soft paved surfaces such as sand gravels or green patches of lawn and tree cover are necessary. Climate resilience and demands for sustainable living are not limited to environmental friendly building design, but requires much more attention to bioclimatic factors affecting the urban fabric and its microclimate. Bioclimatic factors can be man made or organic but ultimately affect human living conditions and the environment. It is a necessity to tackle at both building and urban scale.
ACKNOWLEDGMENTS
The first author acknowledges the following individuals and institutions: his parents and family
members, CEPT University in Ahmedabad, India; Dr Luisa Brotas, Course Leader of MSc Architecture Energy & Sustainability at London Metropolitan University, Dr Axel Jacobs and Professor Fergus Nicol from London Metropolitan University as well as London Metropolitan University for the Scholarship Award that made this study possible; The Architectural Association, School of Architecture in London, the London underground and Bus transport; and last but not least ‘The Almighty God’ for giving directions and courage to overcome all the obstacles and paths to success.
NOMENCLATURE
θ = the line running north-south and angle between canyon axis which determines the
orientation of urban canyon W = width of street H = average height of buildings on both sides L = length of canyon α = angle between building top edge and street plane SVF = sky view factor
REFERENCES
Clair, P.S, 2010. The Climate of Tall buildings- An investigation of building height and bio-climatic
design. Available at: http://www.peterstclair.com/pdf/The-Climate-of-Tall-Buildings-Science- Review_LR.pdf [accessed: May 17, 2011]
EHS, 2012. English Housing Survey: Homes report 2010, Department for Communities and Local Government, National Statistics, Crown copyright
Erell, E. et. al, 2011. Urban Microclimate: Designing the spaces between buildings. London: Earthscan. GLA, 2014. Great London Authority. https://www.london.gov.uk/ [accessed: September 10, 2014] Littlefair, P.J, et. al, 2000. Environmental site layout and planning, London: BRE Publications Pandya S., 2011. Tall Buildings and Urban Microclimate: A Bioclimatic study of urban fabric, MSc
Thesis, London Metropolitan University
30th INTERNATIONAL PLEA CONFERENCE 16-18 December 2014, CEPT University, Ahmedabad
8