talker background and individual differences in the speech intelligibility … rabideau...
TRANSCRIPT

TALKER BACKGROUND AND INDIVIDUAL
DIFFERENCES IN THE SPEECH
INTELLIGIBILITY BENEFIT
by
Amanda Rabideau
A thesis submitted to the faculty of
The University of Utah
in partial fulfillment of the requirements for the degree of
Master of Arts
Department of Linguistics
The University of Utah
August 2014

Copyright © Amanda Rabideau 2014
All Rights Reserved

T h e U n i v e r s i t y o f U t a h G r a d u a t e S c h o o l
STATEMENT OF THESIS APPROVAL
The thesis of Amanda Rabideau
has been approved by the following supervisory committee members:
Rachel Hayes-Harb , Chair 06/09/2014
Date Approved
Shannon Barrios , Member 06/09/2014
Date Approved
Sarah Hargus Ferguson , Member 06/09/2014
Date Approved
and by Edward Rubin , Chair/Dean of
the Department/College/School of Linguistics
and by David B. Kieda, Dean of The Graduate School.
ABSTRACT
One way talkers can increase intelligibility is by producing clear speech. Though
clear speech, as opposed to conversational speech (ConvS), generally increases
intelligibility (known as the clear speech intelligibility benefit), not all talkers exhibit the
same degree of benefit. Ferguson showed that while intelligibility increased across
talkers for clear speech, when looking at individual talkers, the benefit ranged from -12.1
–33.3%. While most talkers were more intelligible during clear speech, some talkers
actually became less intelligible. To explain individual differences like these, most
researchers have explored acoustic, temporal, and syntactic factors. The current study
probes three additional factors, ones relating to talker background: talker experience
communicating with nonnative (L2) speakers, talkers’ attitudes toward nonnatives, and
talker experience as an L2 speaker.
Twenty L2 English listeners transcribed sentences from 20 L1 English speakers as
they were produced in ConvS and nonnative directed speech (NNDS; a type of clear
speech). Intelligibility scores for ConvS and NNDS were compared to measure
individual differences in intelligibility and to calculate the clear speech benefit for each
talker. Scores were compared with the talkers’ answers on a questionnaire to determine
whether the variables affected the talkers’ intelligibility.
Results of the transcription task showed greater overall intelligibility for NNDS
than ConvS; however, this was not the case for all talkers. Additionally, talkers varied

iv
widely in the benefit they provided the L2 listeners. When comparing results to the
questionnaire, only talker experience as an L2 speaker was shown to affect intelligibility
for L2 listeners.

TABLE OF CONTENTS
ABSTRACT ....................................................................................................................... iii
LIST OF FIGURES .......................................................................................................... vii
LIST OF TABLES ........................................................................................................... viii
Chapters
1. INTRODUCTION .........................................................................................................1
2. LITERATURE REVIEW/BACKGROUND .................................................................2
2.1 Individual differences in speech production ............................................................2
2.2 Properties of conversational speech .........................................................................5
2.3 Properties of clear speech ........................................................................................5
2.4 Clear speech benefits ...............................................................................................7
2.5 Talker differences in intelligibility ........................................................................10
2.6 Explanations for individual differences in intelligibility .......................................15
2.7 Measuring talker background ................................................................................21
2.8 Research questions .................................................................................................23
3. METHODS ..................................................................................................................24
3.1 Introduction ............................................................................................................24
3.2 Subjects ..................................................................................................................25
3.3 Materials and procedures .......................................................................................26
4. RESULTS ....................................................................................................................34
4.1 Posttest keyword familiarity ..................................................................................34
4.2 Talker and speaking style.......................................................................................35
4.3 Talkers and background questionnaire ..................................................................41
4.4 Intelligibility scores and questionnaire results .......................................................45
5. DISCUSSION ................................................................................................................49
5.1 Talker intelligibility ...............................................................................................49

vi
5.2 Talker questionnaire...............................................................................................52
6. CONCLUSION ..............................................................................................................56
6.1 Results recap ..........................................................................................................56
6.2 Limitations .............................................................................................................57
6.3 Implications............................................................................................................60
APPENDICES
A. STIMULI SENTENCES .........................................................................................62
B. ELICITATION SCRIPT .........................................................................................63
C. TALKER QUESTIONNAIRE ................................................................................64
REFERENCES ..................................................................................................................67

LIST OF FIGURES
1. Main effect of speaking style in RAUs, averaged across all talkers
for ConvS and NNDS ..................................................................................................38
2. Main effect of talker in RAUs, average across all listeners and both
speaking styles .............................................................................................................39
3. Overall intelligibility in RAUs for NNDS and ConvS. Talkers organized
by ascending order of ConvS scores ............................................................................40
4. Intelligibility scores in RAUs for each talker and speaking style ................................40
5. Intelligibility scores in RAUs for each experience group and speaking
style for EXP. WITH ......................................................................................................46
6. Mean attitude scores given for each speaking style and each talker as
percent correct ..............................................................................................................47
7. Intelligibility scores in RAUs for each experience group and speaking
style for EXP. AS ..........................................................................................................48

LIST OF TABLES
1. Comparison of the conversational and clear speech literature .......................................8
2. Mean percent correct intelligibility scores given for each talker in
conversational speech (CONVS), nonnative directed speech (NNDS),
the difference between them (DIFF) .............................................................................36
3. List of responses from Part 1 of survey .......................................................................41
4. Speakers’ attitude scores given across both scales and the Agree/Disagree
and the Emotional Response scales independently ......................................................44
5. List of responses from Part 3 of survey .......................................................................45
6. Results from previous research comparing them to the present study.........................50
7. Pairs of subjects who exhibited identical benefits (BNFT) ...........................................54
CHAPTER 1
INTRODUCTION
Intelligibility, the ability to be understood by a listener, has been shown to vary
widely among talkers. One way talkers can improve their intelligibility for a variety of
audiences is by producing clear speech (e.g., Bradlow & Bent, 2002; Bradlow, Kraus, &
Hayes, 2003; Picheny, Durlach & Braida, 1985). Research over the last several years has
revealed that talkers are not equal in their ability to produce clear speech (e.g. Bradlow et
al., 2003; Ivanova, 2011); that is, some talkers may be inherently better at it than others
(Schierloh & Hayes-Harb, 2008). Researchers have investigated aspects about the speech
signal itself to determine what factors affect intelligibility; however, little research has
investigated what factors about a talker’s background might also contribute to a talker’s
intelligibility. The purpose of the present study is to investigate talker background in
order to determine its effects on intelligibility for nonnative speakers of English.
CHAPTER 2
LITERATURE REVIEW/BACKGROUND
This section will be organized as follows: 2.1 will provide information about how
speech varies among speakers. Sections 2.2 and 2.3 will discuss the properties of
conversational and clear speech, respectively. This will be followed by a description of
the clear speech benefit and what features affect intelligibility in section 2.4. Section 2.5
will examine individual differences in intelligibility when producing clear speech, while
2.6 and 2.7 will provide explanations for individual differences based on previous
literature and how to measure these differences. The research questions will be presented
in 2.8.
2.1 Individual differences in speech production
The lack of invariance is the phenomenon where the acoustics of linguistic
segments differ based on many factors, including (but not limited to) phonetic context,
speech rate, and physical differences in the vocal tracts of individual talkers (Pisoni,
1981). Previous studies have shown several specific features of a speech signal that
differ from one talker to another. For instance, speakers vary in the amounts of voice-
onset-time they produce (Allen, Miller, & DeSteno, 2002), articulatory patterns (e.g., the
location of the jaw and tongue within the vocal tract) and speech rate during vowel

3
production (Johnson, Ladefoged, & Lindau, 1993), formant values of vowels (Bradlow et
al., 2003; Bradlow, Torretta, & Pisoni, 1996), and duration of voicing during consonant
closures (Bradlow et al., 1996).
Features of speech also differ systematically depending on factors such as age,
gender, and geographic area (Jacewicz, Fox, & Wei, 2010). When investigating the
speech of 192 English speakers from Wisconsin and North Carolina (whose ages ranged
between 8–91 years old), Jacewicz et al. found that speech rate differed significantly
between the two groups, with Wisconsin speakers speaking at a faster rate. They also
found that speaking rate was fastest for adults in their forties, as compared to other age
groups. Additionally, males spoke significantly more quickly than females during
spontaneous speech tasks.
Due to the complex nature of the speech signal and the lack of invariance, it is
unsurprising that talkers also vary in their intelligibility, the ability to be understood by a
listener. In recent years, many studies have been conducted to investigate which features
of the speech signal affect intelligibility.
2.1.1 Features affecting intelligibility
Bradlow et al. (1996) used the Indiana Multi-Talker Sentence Database to
compare the speech of 10 male and 10 female talkers of General American English.
They found that when the 20 speakers were instructed to read 100 sentences in a ‘normal
speaking voice’ (Karl & Pisoni, 1994, p. 155), differences in production between the 20
talkers affected overall intelligibility for 200 native English-speaking listeners. Results
showed that a widely dispersed vowel space, especially along the first formant (F1)

4
dimension, translated to higher overall intelligibility scores. Those who used less
phonetic reduction and more precision during articulation also had higher scores, while
those who showed less articulatory precision were more often misunderstood. Additional
findings of the study showed that females were generally more intelligible than males.
Furthermore, a wider range in fundamental frequency was associated with higher overall
intelligibility.
Like Bradlow et al. (1996), Ferguson and Kewley-Port (2007) observed that
talkers who had the largest clear speech intelligibility benefit (discussed in section 2.4)
generally expanded their vowel spaces more and had a larger range along the F1
dimension than talkers who had no clear speech intelligibility benefit. In addition, they
showed a larger shift in the second formant (F2) for front vowels than talkers who had a
smaller benefit. Intelligibility seemed to be unaffected by “dynamic” formant frequency
factors (Ferguson & Kewley-Port, 2007, p. 1244) such as the spectral change and the
spectral angle (for more information on dynamic factors, see Ferguson & Kewley-Port,
2007, pp. 1244–1245).
When examining the issue of intelligibility, two types of speech have been studied
at length: conversational speech and clear speech (of which there are several
subcategories).

5
2.2 Properties of conversational speech
Conversational speech (ConvS) is described as the speech used between normal-
hearing, adult speakers communicating in their native language (L1).1 It is generally
considered the “control” style of speech used in speech studies and is characterized by the
speaker’s desire to reduce articulatory effort (Kohler, 2001). Traits of ConvS include
reduction of phonemes (Picheny et al., 1985, 1986), neutralization of vowels (Picheny et
al., 1986), and, in the case of English, a speech rate of approximately 160–200 words per
minute when excluding hesitations and breath pauses (Picheny et al., 1986). Using the
Kiel Corpus of Spontaneous Speech, Kohler (2001) showed that in German spontaneous
speech, schwa deletion and reduction of plosives were common in specific situations.
For instance, unstressed function words show greater reduction than content words. This
result was supported cross-linguistically by Picheny et al. (1986), who found that in
English, half of function words used in ConvS contained modified vowels—vowels that
became schwa-like or merged with following sonorants. One-half to two-thirds of the
modified vowels resulted from vowel reduction.
2.3 Properties of clear speech
As opposed to ConvS, clear speech is used in situations where listeners need help
understanding the speech signal. Clear speech has been shown to increase intelligibility
for children, the hearing-impaired, and nonnative speakers (NNSs) conversing in a
language other than their L1 (Bradlow & Bent, 2002; Bradlow et al., 2003; Picheny et al.,
1985).
1 This is also referred to as adult directed speech or native directed speech (Biersack et
al., 2005; Fernald and Simon, 1984; Scarborough et al., 2007)

6
A series of studies on clear speech for the hearing-impaired were conducted by
Picheny, Durlach, and Braida (1985, 1986, 1989). In these studies (which all utilized the
talkers from the 1985 study), talkers were told to speak as clearly as possible, as if talking
in a noisy environment or with an impaired listener. Talkers were instructed to enunciate
carefully. Results showed the speaking rate decreased during careful (clear) speech
compared to ConvS. Speech rate fell from approximately 160–200 wpm during ConvS to
90–100 wpm during clear speech. This was accomplished by increasing word and
syllable durations as well as pauses between words. Speakers exhibited a wider range of
f0, which had a “slight bias towards higher f0” (p. 436). They also found that vowel
reduction occurred approximately half as often as in ConvS. Furthermore, stop bursts
were always released as were nearly all voiced and voiceless word-final consonants.
These results are similar to those found by Biersack et al. (2005) in their study of child-
directed speech (CDS). Like hearing-impaired directed speech (HIDS), CDS also
exhibited an increased pitch range with the same bias for higher f0 than in ConvS (like
Picheny et al., 1986, the bias failed to reach significance). Speech rate was also slowed
by lengthening phonetic segments. In the same study, the researchers showed that for
nonnative directed speech (NNDS), pitch range was narrower, and speech rate was
slowed more dramatically than the speech rate for CDS (speech rate results are
corroborated in Scarborough et al., 2007, and Bradlow et al., 2003). In addition to many
of the findings listed above, Bradlow et al. (2003) observed that during clear speech,
talkers expand their vowel space as well as increase their overall consonant-to-vowel
intensity ratio.
While comparing four speech types, ConvS and three types of clear speech

7
(differentiated by instructions the subjects received), Lam, Tjaden, and Wilding (2012)
found a greater F1 range for conditions that elicited clear speech. This pattern held for 11
of the 12 talkers. In addition, vowel space expanded for the clear speech conditions;
vowels became more distinct with more space between individual vowel categories. As
was found in the aforementioned studies, speech time measures (e.g., longer segment
durations, greater number of pauses, etc.) were also greater during clear speech.
Because a complete review of work on different speaking styles is beyond the
scope of the current work, Table 1 presents a partial review of the clear and
conversational speech literature, providing summarized descriptions of the different
speaking styles, including additional references. Summaries also include nonacoustic
characteristics of clear speech as well as details of clear speech for subjects with language
(but not hearing) disorders.
2.4 Clear speech benefits
As was established in the aforementioned studies, it has been consistently shown
that talkers adjust their speech in order for listeners who may need an enhanced signal to
more easily comprehend speech. As a result, many studies have been conducted to
determine the extent to which clear speech provides an increase in intelligibility for these
groups of listeners.
Bradlow and Bent (2002) investigated how effective clear speech strategies are at
increasing intelligibility, specifically for nonnative listeners with relatively little
experience with the target language (in this case, English). They recorded two native
speakers of American English talking in conversational and clear speech. For clear

8
Table 1. Comparison of the conversational and clear speech literature. Clear speech is
separated into nonnative directed speech, child-directed speech, hearing-impaired
directed speech, and speech towards mixed audiences. According to Chaudron (1988),
the features of TT are not sufficiently distinct from NNDS to be assigned its own domain.
It is, therefore, classified as a subcategory of NNDS.
TYPES OF SPEECH DESCRIPTION REFERENCES
1. Conversational
Speech (ConvS)
(also known as
Adult Directed
[ADS] or Native
Directed speech
[NDS])
Speech between normal hearing talkers communicating in their
L1. Characterized by reduction of phonemes, articulatory effort,
and lenition. Control speech for speech studies.
Kohler, 2001;
Picheny et al.,
1985, 1986;
Shockey, 2003
2. Clear Speech
A. Nonnative
Directed Speech
(NNDS)
Speech rate slowed due to strong tendency to lengthen pauses
(slower than ADS and CDS). Slightly narrower pitch range
compared to ADS. Expanded vowel space and longer stressed
vowels.
Biersack et al.,
2005;
Scarborough
et al., 2007
i. Teacher Talk (TT) Slowed speaking rate for beginning level L2 listeners, compared
to intermediate and advanced L2s and L1s. More pauses at
constituent boundaries. More “accurate standard pronunciation”
(Henzl, 1979). Less reduction of consonant clusters and vowel
length. Higher pitch. Speech louder when addressing groups of
students. Simpler lexicon. Vocabulary more structurally simple
(e.g., less compound words or idiomatic phrases). Declaratives
more frequent than questions.
Chaudron,
1982, 1988;
Dahl, 1981;
Henzl, 1973,
1979
B. Child Directed
Speech (CDS)
Increase in pitch range and f0. Speech rate slowed by
lengthening phonetic segments. Shorter utterances.
Biersack et al.,
2005
C. Hearing Impaired
Directed speech
(HIDS)
Decreased speaking rate (from approximately 180 to 95 wpm).
Speech slowed by increasing word and syllable durations and
duration of pauses. Wider range for f0, biased towards higher f0.
Vowel reduction occurs half as often as in ConvS. Stop bursts
and word-final consonants more consistently released.
Expanded vowel space, larger F2 vowel shift for front vowels as
compared to back vowels. Greater F1 range.
Ferguson &
Kewley-Port,
2007; Picheny
et al., 1985,
1986, 1989
3. Other (Mixed
audience)
A. Clear speech for
hearing impaired
or foreign listeners
Increase in sentence duration by increasing number of pauses in
speech. Reduction in amount of flapping for consonants and
increase in releasing word final consonants. Increase in intensity
for consonant-to-vowel ratio.
Bradlow et al.,
2003
B. Children with
normal hearing
and language
disorders (excludes
hearing disorders)
Looking specifically at speech rate in syllables per second (sps),
as sps decreases, comprehension increases. 2.5 sps is optimal
for normal hearing and language-disordered listeners. Normal
hearing listeners capable of comprehension between 2.5–4.2
sps, while language disordered listeners capable between 2.5–
3.4 sps.
Blosser,
Weidner, &
Dinero, 1976
9
speech, they were instructed to read as if speaking to someone with hearing loss or to
someone from a different language background. The researchers obtained intelligibility
scores for both native listeners (NLs) and nonnative listeners (NNLs) on sentences in a
sentence-in-noise keyword transcription task.
The stimuli used in the study were revised Bamford-Kowal-Bench (BKB)
sentences. The original sentences were designed to be used with British children (Bench
& Bamford, 1979), but were revised by the Cochlear Corporation to make them more
suitable for American children. BKB sentences are comprised of 21 lists, each one
consisting of 16 simple English sentences. All sentences contain three to four keywords,
totaling 50 keywords per list. Four of these revised lists (lists 7–10) were used and
“slightly modified” (p. 274) by the researchers.
Results showed that even though NNLs did not perform as well or benefit as
much from clear speech as the NL control group on the transcription task, the benefit for
both listener groups during clear speech, as compared to ConvS, was significant. This is
supported by Smiljanić and Bradlow (2011), whose results also suggest that (proficient)
nonnative listeners are able to take advantage of clear speech benefits. Another result
found in Bradlow and Bent (2002) was that for native listeners, the female talker’s clear
speech was significantly more intelligible than the male talker’s, and the difference
approached significance for the nonnative listeners. This demonstrates that talkers vary in
the degree to which they produce clear speech.
10
2.5 Talker differences in intelligibility
Cox, Alexander, and Gilmore (1987) explored differences in intelligibility of
ConvS for numerous listening environments. Environment (A) represented face-to-face
interactions in a typical living area, (B) represented speech directed towards an audience,
as in a classroom or church, (C1) represented face-to-face conversations during a social
event where several people would be present and the acoustics would be dampened by
the surroundings (e.g. upholstery in a private residence), while (C2), like (C1),
represented face-to-face conversations where several other talkers would be in the
vicinity, but the acoustics would not dampened by the surroundings (e.g., a restaurant or
church event).
Two conditions were created for each environment: a typical listening condition
and a reduced intelligibility condition where the signal was degraded. Results of a
speech pattern contrast (SPAC) test showed an overall trend: highly intelligible talkers in
one environment were highly intelligible in others, while talkers with low intelligibility in
one environment usually had low intelligibility in others. There were few occasions
where this was not the case.
When looking at phonetic features of the individual stimuli (e.g., vowel height,
final consonant voicing, etc.), results showed that not all phonetic features impacted
intelligibility to the same degree. The intelligibility of features, by and large, patterned
similarly regardless of listening environment and was consistent across talkers. For
instance, all six talkers were highly intelligible for vowel height, yet for final consonant
place, they were somewhat unintelligible. Some features varied according to talker;
although one talker received relatively low intelligibility scores for most of the features,

11
her scores for final consonant continuance (see Cox et al., 1987, p. 1604) were some of
the highest. Results showed that though performance of individual talkers tended to
pattern the same across conditions (typical listening condition versus the degraded
listening condition) and across environments, individual differences began to emerge
when examining specific phonetic features.
In a more recent study, Ferguson (2004) investigated talker differences in vowel
intelligibility for normal-hearing listeners in HIDS. The target vowels were set in a /bVd/
context and were recorded in meaningful carrier sentences by 41 native English talkers
“from the South Midland region of the United States” (p. 2366). Talkers were instructed
to read 188 sentences (including fillers) in ConvS and again in clear speech. Participants
were given written and verbal instructions for each speaking style. For ConvS, talkers
were instructed that it was important to speak as they do in everyday conversation. For
clear speech, talkers were advised that they needed to speak clearly so that a hearing-
impaired person could understand them. Talkers were given 16 practice sentences, and
feedback was given on the practice ConvS sentences. After recording all the stimuli, the
talkers were questioned on their experience communicating with hearing-impaired
listeners. If they had experience, the subjects were asked to describe (1) their relationship
with the hearing-impaired, (2) their frequency of communication with them, and (3) how
long they had been communicating with them.
Seven normal-hearing native English listeners participated at test and 12-talker
babble was added to prevent ceiling effects. Intelligibility was measured by correct
vowel identification for /bVd/ words presented in isolation for both clear and ConvS.
Results showed significant main effects of speaking style and talker as well as an

12
interaction between them. When examining the talkers together, clear speech was
significantly more intelligible than ConvS. However, when looking at the talkers
individually, the range of intelligibility scores varied widely. Scores were calculated by
averaging percent correct scores for each of the test words. Vowel intelligibility ranged
between 25 and 83% for ConvS and 29 and 94% for clear speech. The within-talker
intelligibility benefit also varied widely.
Though the mean clear speech vowel intelligibility benefit (calculated by percent
point difference between clear and conversational speech) was 8.5%, one speaker’s
intelligibility benefit was as high as 33.3%, while another’s was as low as -12.1%
(meaning this talker had much higher vowel intelligibility during ConvS). Another result
of the study found that talkers with greater clear speech vowel intelligibility generally
had a larger intelligibility benefit.
When exploring how talker experience communicating with hearing-impaired
listeners affected the clear speech benefit, results showed no connection. There was no
significant effect of experience regardless of whether talkers had frequent interactions
(defined as having contact with one or more hearing-impaired persons on a weekly basis)
or no interactions with the hearing-impaired.
Gagné, Masterson, Munhall, Bilida, and Querengesser (1994) probed talker
variability using three presentation modalities (auditory, visual, and audiovisual) for
conversational and clear speech with monosyllabic and bisyllabic words produced in
isolation. The researchers measured the clear speech benefit for 10 adult female talkers
from the Faculty of Applied Health Sciences at the University of Western Ontario. The
talkers represented three groups: students (n = 2), secretarial staff (n = 7), and faculty (n

13
= 1). During their first reading of the stimuli, talkers were not given specific instructions
regarding the way to produce the stimuli (which resulted in speech that was presumed to
be conversational). To produce clear speech, talkers were told to articulate each word
clearly as if the hearer had difficulty understanding. No additional instructions, feedback,
or practice were given on how to produce clear speech. Auditory stimuli were degraded
to avoid ceiling effects.
Positive clear speech effects were seen in all of the presentation modalities for
both monosyllabic and bisyllabic words. Results showed that the degree to which clear
speech benefits existed differed significantly across talkers. While results were generally
consistent, with intelligibility for clear speech being slightly higher than for ConvS (the
difference failed to reach significance for monosyllabic words presented in the strictly
visual sensory modality), one talker showed the opposite pattern under the degraded
audio-visual condition. Another talker produced a significant positive effect in all three
modalities, while several produced no significant positive effect in any modality. Effects
differed depending on number of syllables per word.
Although Gagné et al. focused on intelligibility of words in isolation and utilized
several modalities for testing conversational and clear speech intelligibility, the study
provides evidence that talkers vary with respect to their ability to produce clear speech.
While the researchers provided speech from talkers in three groups (faculty, secretarial
staff, and students), they failed to analyze their data in light of these groups. Based on
their analyses, it is unknown whether the scores of the listeners varied as a function of the
background of the talkers, giving rise to the current research questions discussed below.
Ivanova (2011) investigated the use of teacher talk, the modified speech used by

14
second language teachers to aid the comprehension of L2 learners, to uncover how
phonological modifications by teachers from ConvS to teacher talk affected listener
comprehension in an L2 setting. The four talkers were L1 English speakers with similar
backgrounds. All were English as a Second Language (ESL) teachers with
approximately the same education (all four instructors had an MA in either TESOL or
Applied Linguistics). The participants were 51 L2 English listeners from various native
language backgrounds who varied in degree of experience living in English-speaking
environments. Participants were tested on a sentence-final keyword transcription task
where the sentence-final word had either high or low predictability. Results showed that
while intelligibility increased for all teachers when using teacher talk, the talkers differed
(often significantly) in their intelligibility benefit. While Talker 2 (T2) was the most
intelligible talker in ConvS, T2 and T4 were the most intelligible talkers during teacher
talk. Which speaker was more intelligible also depended on high- versus low-
predictability contexts and level of learner. Although T1 had the largest difference in
means between the two styles of speech, this did not result in T1 having the greatest
overall intelligibility. Such evidence suggests that there are individual aspects of speech
that may enhance intelligibility, making one teacher more intelligible than others.
Bradlow et al. (2003) studied clear speech for 99 children with and without
learning disabilities. The two talkers were instructed to speak as if talking to someone
with hearing loss or to someone from a different language background. Even though the
talkers were equally intelligible during ConvS, they provided very different benefits for
their audience. Thus, even though some people may be equally intelligible during one
style of speech, not everyone increases their intelligibility to the same degree when

15
transitioning to clear speech.
Another study that explored individual intelligibility differences is Schierloh and
Hayes-Harb (2008). The research investigated two variables that might affect L2
comprehension in a classroom setting: talker familiarity (defined by whether or not the
talker was the teacher of the class to which the speech was presented) and talker
intelligibility. When four German classes were played the speech of four German talkers
(both NSs and NNSs of German), the same talker had the highest intelligibility for all
four classes. This suggests that idiosyncratic features of a person’s speech may have
been a stronger factor in determining intelligibility than talker familiarity. This, again,
provides evidence that intelligibility is speaker-dependent; some people may be
inherently more intelligible than others.
2.6 Explanations for individual differences in intelligibility
While many acoustic, temporal, and syntactic factors have been shown to
influence intelligibility (cf. section 2.1.1 and Table 1), generally little research has been
conducted to determine what characteristics of the speaker’s background may influence
their intelligibility. One aspect of a talker’s background that has been explored is an
individuals’ experience communicating with nonnative listeners (NNLs). Dahl (1981)
investigated speech modifications of experienced ESL teachers and nonteachers to
determine the effects of these modifications and to see whether they facilitated better
understanding of the message. During Experiment 1, several nonphonetic variables were
considered that the researcher believed might contribute to intelligibility (e.g., length of
message, number of definitions of words, explicitness of requests, etc.). In Experiment 2,

16
16 ESL listeners rated the intelligibility of the talkers’ speech and were asked how the
speaker could have improved their intelligibility. Results showed no differences between
the variables under investigation in Experiment 1, with the exception that nonteachers
were significantly more explicit in requests than teachers. However, teachers were
consistently rated as more understandable than nonteachers in Experiment 2.
In a study on HIDS that used a subset of the talkers from Ferguson (2004),
Ferguson and Kewley-Port (2007) found that when talkers were told to produce speech as
if speaking to a listener with hearing loss, one speaker had a large clear speech benefit,
even though properties of her acoustic features conflicted with the features of other
talkers who had exhibited a similar benefit (e.g., during clear speech production she had
smaller vowel space and her F2 values for front vowels were not raised). The researchers
looked at the talker’s background to explain the atypical results. Although Ferguson
(2004) did not find experience to affect clear speech intelligibility, the researchers
speculated that this particular speaker’s results were due to the talker being extremely
experienced in communicating with hearing-impaired listeners as two of her siblings had
hearing impairments. Such experience may have allowed her to “develop clear speech
strategies that are particularly effective for these listeners” (p. 1249).
Ferguson (2012) explored the benefits of clear speech for older, hearing-impaired
listeners and compared them to the results found in Ferguson (2004). The same talkers
and methods were used in both studies. Procedures were nearly identical, except that test
items for elderly, hearing-impaired listeners were presented at -3 dB signal-to-noise ratio
(SNR), as opposed to -10 dB SNR used in Ferguson (2004) for normal-hearing listeners.
Like before, results were compared to talker background to determine the effects of
17
background on intelligibility. One major difference between the studies was that the
2012 study analyzed the data using mixed-effect models (Ferguson also reanalyzed the
results from the 2004 study so they could be more easily compared). For hearing-
impaired listeners, results showed a significant interaction between speaking style
(conversational vs. HIDS) and talker experience communicating with the hearing-
impaired.
The effect occurred for all experience levels, but was significantly larger for the
“little” experience group when compared to the other three. The “no,” “occasional,” and
“frequent” groups did not differ significantly from one another. After reanalyzing the
data for normal-hearing listeners from Ferguson (2004), results showed a significant
effect of experience for all groups of talkers, again, with the largest clear speech effect
for the “little” experience group compared to the other three. In addition, the effect was
significantly greater for the “frequent” group when compared to talkers with “no” and
“occasional” experience. The “no” and “occasional” groups did not differ significantly
from one another.
To explain the results, Ferguson (2012) posited that as talkers encounter hearing-
impaired listeners, they “use a wide array of clear speech articulatory strategies” (p. 789).
As they gain more experience with this audience, they discontinue using some of these
strategies, perhaps to reduce articulatory effort or in response to their own “auditory
feedback” (p. 789). With more experience, talkers may employ strategies that make their
speech sound to clear to themselves and get rid of ones that do not. However, since they
are do not know how speech sounds to the hearing-impaired, they may discard strategies
that actually contribute an increase in intelligibility for these listeners. While the present

18
study is focused on NNDS rather than HIDS, it is possible that a similar process may
occur with NNDS intelligibility. Thus, for the current study, a talker’s experience in
communicating with nonnative speakers will be an area of interest.
Another possible factor underlying individual differences in intelligibility is
speaker attitude. In a study on phonetic accommodation, Yu, Abrego-Collier, Baglini,
Grano, and Martinović (2011) demonstrated that speaker attitude about sexual orientation
can affect phonetic imitation. In a production task, subjects read two word lists where the
target words consisted of /p, t, k/-initial consonants. Between the two lists, subjects heard
a narrative from a male talker describing a date that had taken place the night before. For
each target word that appeared in the narrative, the duration of voice-onset-time (VOT)
was doubled artificially. The researchers created two versions of the narrative, one
version where the date was a female (straight condition) and the other where the date was
a male (gay condition). After the subjects finished the experiment they completed a
survey that included questions about the subject’s background and their attitude about the
narrator’s behavior (assessed on a 7-point Likert scale; 1 = very positive; 7 = very
negative). Pre- and postnarrative productions of the word lists were compared to
determine the effects of the narration on VOT for the target words during the reading
task. Results were analyzed using regression models.
The researchers found significantly longer VOTs in the target words in the
postnarrative blocks, which suggest that subjects’ speech changed in the direction of the
speech of the narrator. In addition, they found a significant interaction between block
and attitude; greater VOT differences were seen when the subjects had more negative
attitudes toward the narrator. What is important for the present study is that the
19
researchers found that attitude towards an interlocutor can affect production. While the
researchers of this study investigated a single phonetic feature, attitude has also been
investigated during communicative tasks.
Lindemann (2002) explored the role that attitude played in the communication
between native English speakers and Korean speakers of English. Attitudes were
measured using a modified matched-guise task (see Lindemann, 2000, for a detailed
description of the task). Subjects rated the speech of native Korean speakers and native
English speakers using 7-point Likert scales that assessed qualities such as intelligence,
successfulness, education, friendliness, etc. Participants then completed a map task
where each partner had a different version of nearly identical maps. The Korean
partner’s map was considered correct, and he/she was instructed to describe the route on
his/her map in order for the English participant to recreate it on theirs. Participants were
told to talk as much as needed, but they could not look at each other’s maps or make
gestures. After the map task, subjects were asked to rate how successful the interaction
was by using a 7-point Likert scale (1 = not at all successful, 7 = very successful).
Participants with negative-attitudes toward Koreans judged the interactions to be
problematic. All English L1s with negative attitudes gave scores between 3 and 4 on the
7-point scale; each of these participants reported that the interactions during the map task
were unsuccessful, even if that was not actually the case (as indicated by the accuracy of
the route drawn).
Four out of six of the negative-attitude participants employed strategies that
hindered communication by either avoiding telling their Korean partner that they did not
understand (which caused them to be less successful at the task) or problematizing the

20
speaker’s contributions (i.e., making it seem that the partner’s speech was problematic
and needed to be adjusted). It is important to note the strategies found by Lindemann
(2002) were those that emerged from the data, rather than being strategies she created a
priori.
One participant, in particular, refused to accept her partner’s directions unless the
partner used specific vocabulary that the participant wanted. During the map task the
Korean partner gave precise directions (i.e., told the participant to look “northeast”);
however, the participant refused to move forward in the task until the partner
acknowledged the word “diagonal” (a word that, in fact, made the directions less
explicit). Though the participant used the same vocabulary when working with another
native English speaker, she refused to adjust her speech in order to accommodate her
nonnative partner, even though it was clear the partner did not understand the term.
While this did not prevent overall success at the task, interactions of this nature did cause
the task to take longer. Because transcriptions of the interactions between positive-
attitude participants and their Korean partners were not given, it is unknown whether
those participants adjusted their vocabulary in order to be more easily understood by their
Korean counterpart. What is important is that attitudes toward nonnative speakers “are
clearly relevant to interactions with them” (p. 437).
While Yu et al. (2011) and Lindemann (2002) investigated the effects of talker
attitude in specific situations, the evidence shows, crucially, that attitude of the speaker
can affect production. In light of the fact that modifications in production can facilitate
or hinder intelligibility, it is reasonable to probe the topic of speaker attitude further, and
examine its effects on a speech intelligibility task.

21
A final variable that could underlie individual differences is a talker’s experience
being a nonnative speaker him/herself. Extensive probing revealed no literature on the
topic. The present study included this variable in hopes that the results may provide a
basis for future research.
2.7 Measuring talker background
Based on the above studies, it is likely that background factors such as speaker
attitude, talker experience communicating with nonnative speakers (EXP. WITH), and
talker experience as a nonnative speaker (EXP. AS) could contribute to differences
intelligibility. In order to operationalize talker background, many studies have utilized
questionnaires and submitted the results for analyses. The types of analyses used have
varied widely. Lindemann (2000) asked talkers to answer free response questions
regarding their previous experience with nonnative speakers and their experience
speaking other languages and to assess personality traits of L2 speakers via a Likert scale.
For instance, subjects were asked to assess whether a talker was educated based on their
speech alone. “Standard scores [on the perception task] were calculated by subtracting
each listener’s score from the average score for that task, and then dividing by the
standard deviation for the task” (pp. 40–41). Lindemann examined the correlation
between attitude and performance by comparing listeners’ attitude scores to how many
standard deviations they fell from the mean. This was done rather than submitting the
scores for statistical analyses. For a more detailed description of the task and analyses,
see Chapter 3 of the original work.
In contrast, Gooskens (2006), who investigated the interlanguage intelligibility of
22
three Nordic languages (Danish, Norwegian, and Swedish), probed subjects’ attitudes
towards neighboring languages (for example, she asked Norwegians their thoughts on
Swedish and Danish). She asked two questions: how beautiful the subjects thought each
of the neighboring languages was and if the subjects would like to live in each of the
neighboring countries. Answers to both questions were obtained utilizing a 5-point
Likert scale (where 0 indicated the least favorable response possible and 4 indicated the
most favorable response). Attitude scores were compared statistically (using Pearson’s r)
with scores on an intelligibility test to determine the correlation between the two
variables. Measures resulting in significant correlations were then submitted to a linear
regression analysis to determine the association between the variables.
In another study (mentioned above), Ferguson (2004) asked subjects to describe
their experience with hearing impaired listeners and to describe frequency of
communication. Like Lindemann (2000), many questions required free-response
answers. Based on the answers given, the researcher divided subjects into one of four
groups. Clear-versus-ConvS difference scores were submitted to a one-way analysis of
variance (ANOVA) to determine whether the talkers in each group differed significantly
from those in other groups.
The current study follows methodologically from these studies. For Parts 1 and 3
of the questionnaire, talkers assigned themselves into categories, organized similarly to
the ones found in Ferguson (2004). Many of the categories in Parts 1 and 3 were
designed using information from Lindemann (2000). Attitude judgments were gathered
via Likert scales, similar to Gooskens (2006). After completion of the questionnaire,
analysis of variance were performed to determine whether the groups performed in
23
significantly distinct ways.
2.8 Research questions
The goal of the present study was to investigate individual differences in
intelligibility when talkers are asked to produce different styles of speech and then
determine the relevance of talker background to these differences. Unlike many of the
aforementioned studies, which investigated talker differences while using relatively few
talkers (Bradlow & Bent, 2002; Ivanova, 2011, Schierloh & Hayes-Harb, 2008) or talkers
from controlled backgrounds (e.g., controlling L1 language; Smiljanić &Bradlow, 2011;
or only ESL teachers; Ivanova, 2011), this study investigated many talkers from a variety
of backgrounds to get a fuller picture of how talkers, who are not necessarily language
teachers, vary in their intelligibility when they produce NNDS. The questions this study
intended to answer are
1) How do individual talkers differ in their intelligibility for ConvS and NNDS?
2) How do individual talkers differ in their NNDS benefit, defined here as the
difference in intelligibility between ConvS and NNDS?
3) How does a talker’s background relate to his/her intelligibility when producing
NNDS?

CHAPTER 3
METHODS
3.1 Introduction
The previous studies have shown that talkers provide different degrees of
intelligibility benefit (the difference in intelligibility between clear speech and ConvS) to
their target audiences. The focus of the current study was on native English talkers’
intelligibility when producing conversational and clear speech for a nonnative English
speaking audience. Of interest was how widely intelligibility varied from speaker to
speaker and how widely it varied within each talker for the two styles of speech. The
talkers were recorded reading many sentences in both ConvS and NNDS and the
recordings were presented to the nonnative listeners in a keyword transcription task.
Percent-correct keyword transcription scores were calculated and converted to
rationalized arcsine units. The scores were then examined with reference to each talker’s
background (based on answers from the questionnaire) to determine if there was any
connection between an individual’s background and their intelligibility.

25
3.2 Subjects
3.2.1 Talkers
The talkers were 20 native English speakers (12 female, 8 male) who reported no
speech or hearing problems. Talkers were recruited via the Linguistics and Psychology
study pools at the University of Utah and represented a variety of majors:
Communication Sciences and Disorders, Business, Human Development and Family
studies, English, Spanish, Linguistics, and Psychology. Talkers were offered course
credit for participation. Talker background was not explicitly controlled for; for instance,
no talker was disqualified for having or for not having lived abroad. This was done to
recruit a wide range of talkers to see what patterns would emerge from the answers on the
talker questionnaire. The ages of the talkers ranged from 19–37, with a mean age of 26.
Four additional talkers were discarded from the study due to the following reasons:
failing to follow directions (n = 2), misreading the same keyword in both repetitions of a
sentence for a single style of speech (n = 1), and technical difficulties (n = 1).
3.2.2 Listeners
The listeners were 20 nonnative English speakers with no speech or hearing
disorders by self-report, recruited via flyers or Linguistics and ESL courses at the
University of Utah. Subjects were offered monetary compensation or course credit for
participation. Neither native background nor English proficiency level were controlled
for. The listeners are not representative of all L2 learners as the subjects are living in a
foreign country. Being that the listeners are living in a foreign country and are in a
university setting, they will likely be more accustomed to listening to native English

26
speakers than L2 speakers living in their native country. In general, an L2 learner living
in their home country would be less likely to listen to and communicate in the L2 on a
regular basis.
3.3 Materials and procedures
3.3.1 Stimuli and stimuli creation
The sentences used in the study were a subset of the BKB sentences used in
Bradlow and Bent (2002); they are listed in Appendix A. The talkers were instructed to
read each of the 40 sentences two times in ConvS, then two times in clear speech as they
were being recorded on a Marantz PMD661 digital recorder in a sound-attenuated booth.
According to Bradlow and Bent (2002), these sentences are “appropriate for use with a
variety of listener populations, including nonnative listeners and children (both of whom
are likely to have limited receptive and productive vocabularies)” (p. 275). The fact that
these sentences are appropriate for a wide range of listeners is important as there was no
control for English proficiency among the L2 listeners.
Three of the BKB sentences were adjusted to equalize the number of keywords
appearing per sentence. For sentences 12, 21, and 37, in order to reduce the number of
keywords to three, the pronoun “they” was changed from a keyword to a nonkeyword.
All other sentences appeared in their original form from Bradlow and Bent (2002).
Though there was concern that listeners in Bradlow and Bent (2002) used contextual
information to facilitate sentence transcription, Bradlow and Alexander (2007) concluded
that nonnative listeners received a significant clear speech benefit from the acoustic-
phonetic properties of speech “independently of their reduced ability to take advantage of
27
higher-level semantic-context information provided in a sentence” (p. 20). Additionally,
Mattys, White, and Melhorn (2005) found that under sufficiently degraded conditions,
listeners utilize acoustic-phonetic features rather than semantic-contextual features to
decode the signal. Thus, in the present study the same sentences were used and noise was
added to degrade the signal.
Using the Praat digital software program (Boersma, 2001), individual sentences
were isolated and saved as separate WAV files. The second repetition of each sentence
in each speech style condition was used to create a majority of the stimuli. Sentences
from repetition 1 were used when repetition 2 contained errors. Errors, which occurred in
11% of sentences from repetition 2, included mispronunciations of keywords (e.g., talker
said “brought” instead of the keyword “bought”), extraneous noise or interference in the
recording (e.g., yawning, volume changes within a single sentence, microphone picking
up extra noises), and the subject restarting the sentence, stuttering, or reading the
sentence with question intonation.
The spliced files were then scaled to an RMS intensity of 70 dB SPL to control
for volume. To prevent a ceiling effect and to simulate “real-world communicative
situations” (Bradlow & Bent, 2002, p. 276), talker babble was added to the sentences.
The 6-talker babble from Van Engen and Bradlow (2007) was mixed with the sentences
at -4 dB signal-to-noise ratio (SNR) using a Praat script (McCloy, 2013). Babble began
500 milliseconds before the start of each sentence and stopped 500 milliseconds after the
sentence ended.

28
3.3.2 Procedures
3.3.2.1 Talkers
The talkers had two tasks. First, they read the sentences as they were being
recorded (as described above), first in ConvS, then again in NNDS (Bradlow &
Alexander, 2007; Bradlow & Bent, 2002; Dahl, 1981; Gagné et al., 1994). According to
Lam et al. (2012), the details of the instructions that talkers receive can influence
production. In their study, to elicit ConvS, Lam et al. instructed subjects to just read
some sentences. For clear speech, talkers were given three sets of instructions. They
were told to “speak clearly,” to “overenunciate,” and to “talk to someone with a hearing
impairment” (p. 1809). All talkers read a number of sentences after receiving each set of
instructions. Instructions to overenunciate showed the greatest changes in speech timing
(e.g., pause durations) and vowel production (e.g., changes in vowel space for tense and
lax vowels, p. 1812) when compared to ConvS. Vocal intensity (measured by changes in
decibel levels in SPL, p. 1818) underwent the greatest adjustment when talkers were
asked to speak as if talking to a hearing impaired audience. Instructions to “speak
clearly” resulted in the “smallest acoustic adjustments relative to the habitual [ConvS]
condition” (p. 1817).
While it is evident that the aforementioned instructions affect clear speech
production, it is unclear how similar instructions would affect speech aimed at a
nonnative English-speaking audience (as opposed to hearing-impaired listener). Thus,
the present study avoided explicit instructions that specified how talkers should adjust
their speech (e.g., they did not receive instructions to “overenunciate”). Instead, the
methods for eliciting speech followed Dahl (1981). Dahl played prerecorded tapes of

29
four speakers (three Kuwaiti Arabic speakers and one English speaker), reading the same
short English passage to 12 native English-speaking subjects. Her subjects listened to
one of the tapes and then were told to describe a picture as if speaking to the person in the
recording. According to a pilot study, “the task was shown to be an easy and natural one
for the subjects, and resembled something that they might do in everyday life” (p. 81).
The current study followed a similar design. To elicit speech, talkers were seated
in a sound-attenuated booth and wore a head-mounted microphone. Before beginning the
experiment, subjects were told they would hear a person reading a passage and that they
would read some sentences as if speaking directly to the person they just heard in the
recording. Once the experiment began, the subject heard, over loud speakers, a
prerecorded sound file of a native English speaker (L1 elicitation talker) reading a
passage in English. The script for the passage was taken from the Speech Accent
Archive (Weinberger, 2014; see Appendix B), while the actual recording of the L1
elicitation talker was taken from the Speech Database created in the Speech Acquisition
Lab at the University of Utah.
Once the subjects finished listening to the passage, they received visual
instructions to read some sentences as if they were speaking directly to the person in the
recording, which presumably resulted in ConvS. A sentence appeared on the computer
screen in front of them; the subjects had 6 seconds to read the sentence before the next
sentence appeared on-screen. The sentences were presented in a different, randomized
order for each subject and each repetition. After reading the 40 BKB sentences, the task
was repeated with the subjects listening to the same elicitation talker and rereading the
same 40 sentences in a different randomized order.

30
After the second repetition, the subjects then heard a native Uyghur speaker (L2
elicitation talker) reading the same English passage. Procedure for the L2 elicitation
talker was the same. Subjects heard the Uyghur speaker and were then told to read the
sentences as if speaking directly to the person in the recording, which presumably
resulted in NNDS. After the subjects read all 40 sentences, the task was repeated a
second time. Unlike the L1 elicitation talker, the Uyghur speaker’s recording was taken
directly from the Speech Accent Archive (Weinberger, 2014).
One benefit of this type of elicitation procedure was that it allowed the researcher
to control who the talkers were directing their NNDS productions to. In previous studies
that instructed speakers to imagine a listener, talkers could have imagined very different
audiences. For instance, one talker might think of a nonnative English speaking
neighbor, while another may think of a nonnative English speaking parent. The method
of elicitation in the present study allowed the researcher to force all of the subjects to
think about the same, unknown listener.
The second task required the talkers to complete a questionnaire that collected
background information (see Appendix C). Basic information was gathered such as age,
whether the subject had any speech or hearing disorders, and major at the university. The
questionnaire was then separated into three major parts in light of the three variables of
interest.
Part 1 of the survey gathered much of the same information as the questionnaire
from Lindemann (2000), though in a different format. Information was gathered such as
relationships with L2 English speakers (whether they were acquaintances, coworkers,
family members, etc.) and frequency of communication (reported in number of hours per

31
week). Talkers were also asked under what circumstances they speak with L2 English
speakers (for instance, whether they interact in passing at grocery stores or whether they
have in-depth conversations). Unlike Lindemann (2000), who used open-ended questions
to obtain answers, subjects in the present study were asked to choose one of four possible
categories that they felt was most appropriate, based on their prior experiences. This was
done to facilitate later data analysis. Categories were similar to those created in Ferguson
(2004) and were organized as follows: no prior/very little, occasional, moderate, and
frequent (see Appendix C for full category descriptions). Even though subjects’
experiences with foreign-accented English would most likely fall on a continuum, they
were instructed to choose a category. Talkers were also encouraged to add any
comments they think might be helpful to the researcher (though, few took advantage of
this).
Part 2 of the survey focused on talkers’ attitudes about L2 speakers. Questions
for this section were created using the questions in Mehrabian and Russell (1974) and
Phinney (1992) as templates. The first set of questions used in Part 2 asked the talker to
rate the degree to which they (dis)agreed with a statement (e.g., “I like meeting and
getting to know people who speak languages different from my own,” 1 = highly
disagree, 9 = highly agree). For the second set of questions talkers were given a situation
and asked to rate their emotional response to it (e.g., “You call your cell phone company
to pay a bill. A recording answers and asks you to press ‘1’ for English and ‘2’ for ‘other
language options,’” 1 = very negative feelings, 9 = very positive feelings). All answers
from Part 2 of the survey we obtained using 9-point Likert scales.
The questions in Part 3 of the survey probed talkers’ experiences as speakers of a

32
second or foreign language. As in Part 1, subjects were told to choose one of four
categories that best described their experience. The categories were labeled the same as
Part 1, from no prior/very little to frequent experience (again, see Appendix C for full
details). Categories and category boundaries were created by the researcher with
examples that would be considered relevant to most participants. Examples given in Part
3 included if or when the talkers learned a second language (e.g., in junior high versus
college), whether they have traveled abroad and for how long, and how often they spoke
the second/foreign language. As in Part 1, even though subjects’ experiences would most
likely fall along a continuum, subjects were instructed to choose a category and thus were
given the option to clarify their answer (again, very few subjects did).
3.3.2.2 Listeners
Listeners were invited to the lab individually and were seated in front of a
computer. The stimuli were presented using DMDX software (developed at the
University of Arizona by K. I. Forster and J. C. Forster; Forster & Forster, 2003). The
recordings were played over headphones with the sound set at a comfortable level by the
researcher before the start of the experiment. The listeners were instructed that they
would hear many English sentences presented in noise, and their task was to write each
sentence on a premade packet designed for the task. Each sentence was played only
once, though the listener had control over when the next sentence would start. To begin
the next trial, the listener pressed a button on the keyboard.
Over the course of the task, each listener heard all 20 talkers and all 40 sentences.
2 additional BKB sentences were used as practice sentences to get the listeners
33
accustomed to the signal-to-noise ratio and to the task. The talker from the practice
sentences was not used at test. At test, the listener heard each talker read one sentence in
ConvS and a different sentence in NNDS. Each sentence was only played once per
listener, regardless of speaking condition, to prevent the subjects from being able to
transcribe any of the sentences based on memory (e.g., Sentence 10 was only played one
time per listener regardless of who read it). The sentences were presented in a different
random order for each listener, and the sentence that was read by a given talker in each
speaking style condition was also assigned randomly. The order of the talkers also
changed by listener. For example, listener 1 heard talker 813’s reading of sentence 21 in
NNDS, and it was presented as the tenth item at test. Listener 4 heard the same sentence
read by talker 810 in ConvS; it appeared as the thirty-second item at test.
As in Smiljanić and Bradlow (2011), listeners heard the clear speech stimuli first,
then ConvS. This was done to mitigate potential practice effects. If NNDS sentences
were presented second, the researcher would not know if scores increased due to
increased intelligibility of a particular talker or because the subjects simply became more
accustomed to the task.
After completing the transcription task, listeners completed an online vocabulary
survey (Qualtrics, n.d.), which presented the listener with all of the keywords they heard
during the transcription task. Subjects were asked to indicate which words were
unknown to them by rating the word on a 7-point Likert scale (1 = I don’t know this
word, 4 = I recognize this as an English word but I don’t know its meaning, and 7 = I
know this word; Bent & Bradlow, 2003, p. 1605).

CHAPTER 4
RESULTS
All sentences had three keywords which were used to determine a talker’s
intelligibility score. Percent-correct keyword transcription was calculated for each
sentence. As in Bradlow and Bent (2002), obvious spelling errors were considered
“correct” (e.g., “dirty” transcribed as “drity”), while errors with missing or extra
morphemes or errors that changed the meaning of the word (e.g., “bag” transcribed as
“back”) were considered “incorrect.” Unlike the previous study, in situations where it
was unknown whether an error was a simple spelling error or if the subject did not
understand the word during the transcription task, the researcher pointed to the word and
asked the subject to define it (e.g., listener spelled “bough” instead of the keyword
“bought” in the sentence “The family bought a house.”). If the researcher was unable to
read the handwriting, outside raters were consulted; this occurred for approximately 5–10
keywords across all of the listeners.
4.1 Posttest keyword familiarity
Because proficiency of the listeners was not controlled for, it was necessary to
determine whether the results of the transcription task were directly related to
intelligibility of the talkers or if the scores were a result from a lack of familiarity with

35
the keywords. It was expected that the listeners would be familiar with the keywords,
such that the results would not be adversely affected from any lack of familiarity (cf.
Bent & Bradlow, 2003).
Overall, listeners were highly familiar with the keywords in the transcription task.
The average across all keywords and listeners was 6.92 (on a scale from 1–7, where 7 = I
know this word). Scores for individual keywords ranged from 5.25 (for the keyword
“bouncing”) to 7 (as was the case for 79 of the 101 keywords).2 Scores for individual
listeners ranged from 6.52 (listener 910) to 7 (as was the case of 11 of the 20 listeners).
Due to the listeners’ high degree of familiarity with the keywords and the similar survey
results in Bent and Bradlow (2003), it was determined that the results on the transcription
task were not adversely affected by the listeners’ familiarity with the vocabulary; hence,
no keywords were discarded for any of the listeners.
4.2 Talker and speaking style
Intelligibility scores were calculated by percent-correct transcription of the three
keywords per sentence during testing. Each talker’s mean intelligibility scores were
calculated separately for the different speaking style conditions, as was the percentage
point differences in intelligibility between the two conditions. This was calculated by
subtracting ConvS scores from the NNDS scores for each talker. Scores were then
converted to rationalized arcsine units (RAUs, discussed below). Percent-correct scores
2 There were 120 keywords presented to each listener; however, there were 101 different
keywords. 16 of the keywords were presented 3 or 4 times (e.g., “very” appeared as a
keyword 3 times). All of the keywords that appeared multiple times had a mean score of
7.00 on the vocabulary familiarity survey.

36
for both types of speech (averaged across all listeners), and the difference in scores
between the two conditions (labeled ‘benefit’) are presented in Table 2.
Though listeners were given practice sentences at the beginning of the
experiment, because sentences were always presented in NNDS before ConvS, it was
possible that subjects were still adapting to the task during the NNDS test sentences.
Thus, an order analysis was performed. Intelligibility scores for the first and the second
halves of the stimuli were compared for each speaking style. Scores were submitted to a
univariate analysis. Results showed a significant effect of order for NNDS [F(1,52) =
Table 2. Mean percent correct intelligibility scores given for each talker in conversational
speech (CONVS), nonnative directed speech (NNDS), the difference between them (DIFF).
Values calculated across all listeners. Mean scores were calculated across all talkers.
TALKER CONVS NNDS DIFF
801 38.27 34.57 -3.70
802 40.74 51.85 11.11
804 74.07 71.60 -2.47
805 64.20 75.31 11.11
806 61.73 56.79 -4.94
807 55.56 71.60 16.05
808 64.20 60.49 -3.70
809 69.14 71.60 2.47
810 33.33 51.85 18.52
811 58.02 74.07 16.05
813 37.04 62.96 25.93
814 48.15 53.09 4.94
815 54.32 58.02 3.70
817 59.26 59.26 0.00
818 64.20 49.38 -14.81
820 45.68 53.09 7.41
821 53.09 59.26 6.17
822 44.44 69.14 24.69
823 60.49 48.15 -12.35
824 34.57 60.49 25.93
MEAN 53.02 59.63 6.60

37
5.694, p = .021, 𝜂𝑝2 = .099]; listeners’ scores were significantly lower in the first half of
NNDS sentences than the second half. For ConvS, the effect of order was not significant
[F(1,52) = 1.174, p = .284, 𝜂𝑝2 = .022]. The effect of order for NNDS indicates that
listeners were still adapting to the task when testing began but that adaptation was
complete by the time the ConvS stimuli were presented.
To eliminate the potential that order effects might confound the results, the
researcher attempted to only include the last 20 stimuli in each speaking style condition
for the rest of the analyses. However, because the assignment of sentence to talker as
well as the order of talkers and sentences varied by listener, using only the second 20
stimuli from each speaking style for each listener resulted in missing data. For instance,
listener 928 heard talker 824 produce both NNDS and ConvS in the second halves of
their respective sections. For listener 903, talker 824’s NNDS sentence was in the first
half of the NNDS section, while the ConvS sentence was in the second half of the
conversational section. The missing data made ordered analyses inappropriate for the
present study. Thus, the analyses based on the results from sentences 1–40 were kept
with the understanding that the overall NNDS speech scores were lower than they would
have been had the first halves of the sentences in each condition been excluded.
Before being submitted to ANOVAs and correlation analyses, percent scores were
converted to rationalized arcsine units (RAUs; Studebaker, 1985). This was done to
“linearize” the data, normalizing the variance (thus making it more appropriate to submit
to statistical tests) while also giving values resembling percentages (for scores falling
between the 10–90% range; Studebaker, 1985). A two-way mixed ANOVA was
performed. Talker was a between-subject variable (20 levels: each of the 20 talkers) and

38
speaking style (2 levels: ConvS and NNDS) was the within-subjects variables; the
transformed RAU scores for each talker were the dependent variable. With an alpha
level set at 0.05, there was a significant effect of speaking style [F(1,520) = 9.495, p =
.002, 𝜂𝑝2 = .018]. As is seen in Figure 1, when scores were averaged across all talkers,
sentences in NNDS were significantly more intelligible than those in ConvS. The main
effect of talker was also significant [F(19,520) = 3.994, p < .001, 𝜂𝑝2 = .127], indicating
that when averaged across speaking styles, intelligibility varied widely by talker. The
mean score for intelligibility was 56.33% with a range of 36.42% (talker 801) to 72.84%
(talker 804), a difference of 36.42%. The effect of talker is represented in Figure 2.
The interaction between speaking style and talker was also significant [F(19,520)
= 1.858, p = .015, 𝜂𝑝2 = .064], indicating that the difference in intelligibility for NNDS
and ConvS differed by talker. For instance, even though two talkers might have the same
ConvS scores, their NNDS scores may vary widely (compare talkers 805 and 818 in
Figure 1. Main effect of speaking style in RAUs, averaged across all talkers for ConvS
and NNDS. Error bars represent the standard deviations.
0
20
40
60
80
100
120
ConvS NNDS
Inte
lligi
bili
ty, R
AU
s
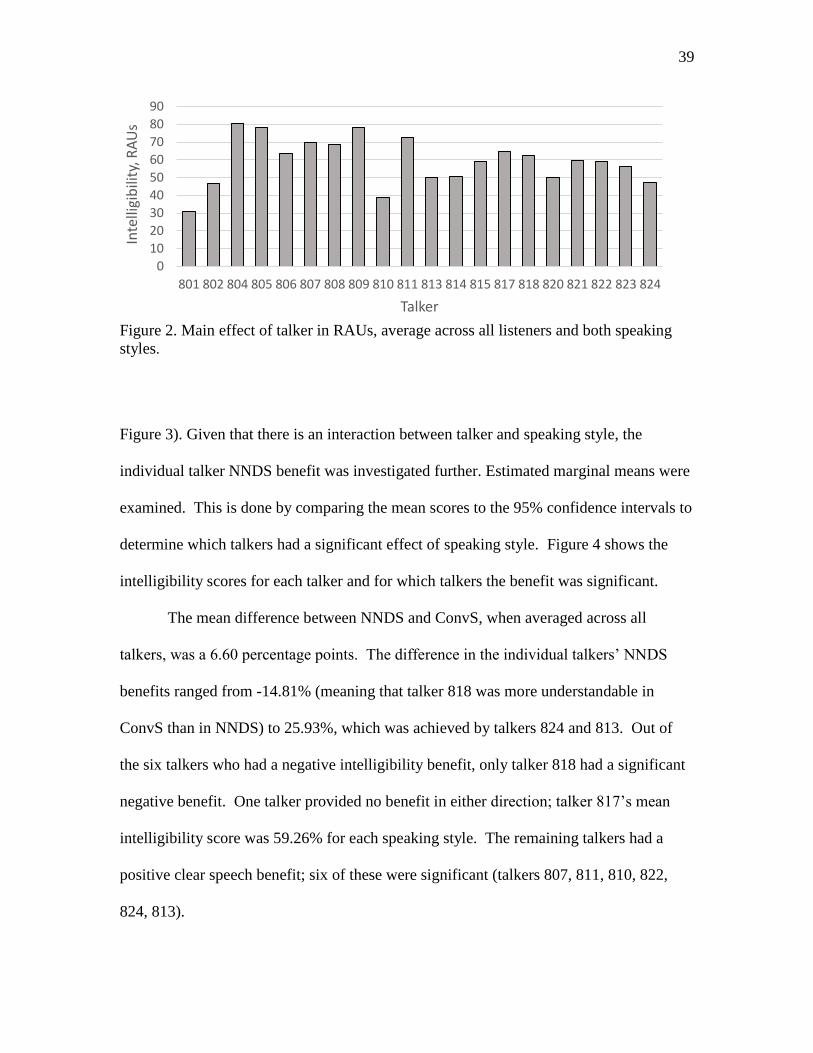
39
Figure 2. Main effect of talker in RAUs, average across all listeners and both speaking
styles.
Figure 3). Given that there is an interaction between talker and speaking style, the
individual talker NNDS benefit was investigated further. Estimated marginal means were
examined. This is done by comparing the mean scores to the 95% confidence intervals to
determine which talkers had a significant effect of speaking style. Figure 4 shows the
intelligibility scores for each talker and for which talkers the benefit was significant.
The mean difference between NNDS and ConvS, when averaged across all
talkers, was a 6.60 percentage points. The difference in the individual talkers’ NNDS
benefits ranged from -14.81% (meaning that talker 818 was more understandable in
ConvS than in NNDS) to 25.93%, which was achieved by talkers 824 and 813. Out of
the six talkers who had a negative intelligibility benefit, only talker 818 had a significant
negative benefit. One talker provided no benefit in either direction; talker 817’s mean
intelligibility score was 59.26% for each speaking style. The remaining talkers had a
positive clear speech benefit; six of these were significant (talkers 807, 811, 810, 822,
824, 813).
0
10
20
30
40
50
60
70
80
90
801 802 804 805 806 807 808 809 810 811 813 814 815 817 818 820 821 822 823 824
Inte
lligi
bili
ty, R
AU
s
Talker

40
Figure 3. Overall intelligibility in RAUs for NNDS and ConvS. Talkers organized by
ascending order of ConvS scores.
Figure 4. Intelligibility scores in RAUs for each talker and speaking style. * indicates
significant differences in intelligibility between the speaking styles for a given talker.
0
10
20
30
40
50
60
70
80
90
810 824 813 801 802 822 820 814 815 821 807 811 823 817 806 808 805 818 809 804
Inte
lligi
bili
ty, R
AU
s
Talker
ConvS NNDS
0
10
20
30
40
50
60
70
80
90
801 802 804 805 806 807 808 809 810 811 813 814 815 817 818 820 821 822 823 824
Inte
lligi
bili
ty, R
AU
s
Talker
Conv NNDS
*
*
*
*
**
*

41
4.3 Talkers and background questionnaire
4.3.1 Experience with nonnative English speakers
In Part 1 of the talker questionnaire, subjects assigned themselves to one of four
possible categories based on the amount of experience they had with foreign accented
English (EXP. WITH). The categories were divided into: no prior/very little, occasional,
moderate, and frequent experience. Table 3 illustrates the subjects’ self-assignment into
the categories provided. The distribution of subjects into the four categories followed a
generally normal curve. A majority of the talkers fell in a midexperience range, while
relatively few subjects fell along the upper and lower edges.
Due to the rigid nature of the categories (i.e., talkers’ backgrounds are complex
and they may not fit perfectly into any given category), talkers were given the chance to
clarify their answer. Though subjects had this opportunity, only four took advantage of
it. Two talkers (823 & 824), who had occasional experience with foreign-accented
English, wrote that they had more experience with nonnatives in the past than presently.
The other two talkers described themselves as having moderate experience. Talker 806
Table 3. List of responses from Part 1 of survey. Number of subjects (NO. OF
SUBJECTS) and Talker IDs given for each experience category (EXP. WITH; no prior/
very little = N-VL, occasional = Occ., Moderate = Mod., Frequent = Freq.). Also
provided for each experience group are the mean RAU scores for ConvS, NNDS,
the mean across both speaking styles (MEAN), and the NNDS benefit (DIFF).
EXP. WITH
NO. OF
SUBJECTS TALKER IDS CONVS NNDS MEAN DIFF
N-VL 3 807, 808, 813 54.36 71.51 62.94 17.15
Occ. 8
802, 804, 809, 817,
818, 820, 823, 824 59.50 62.14 60.82 2.64
Mod. 7
801, 805, 806, 810,
811, 821, 822 51.23 63.81 57.52 12.58
Freq. 2 814, 815 52.59 57.16 54.88 4.57
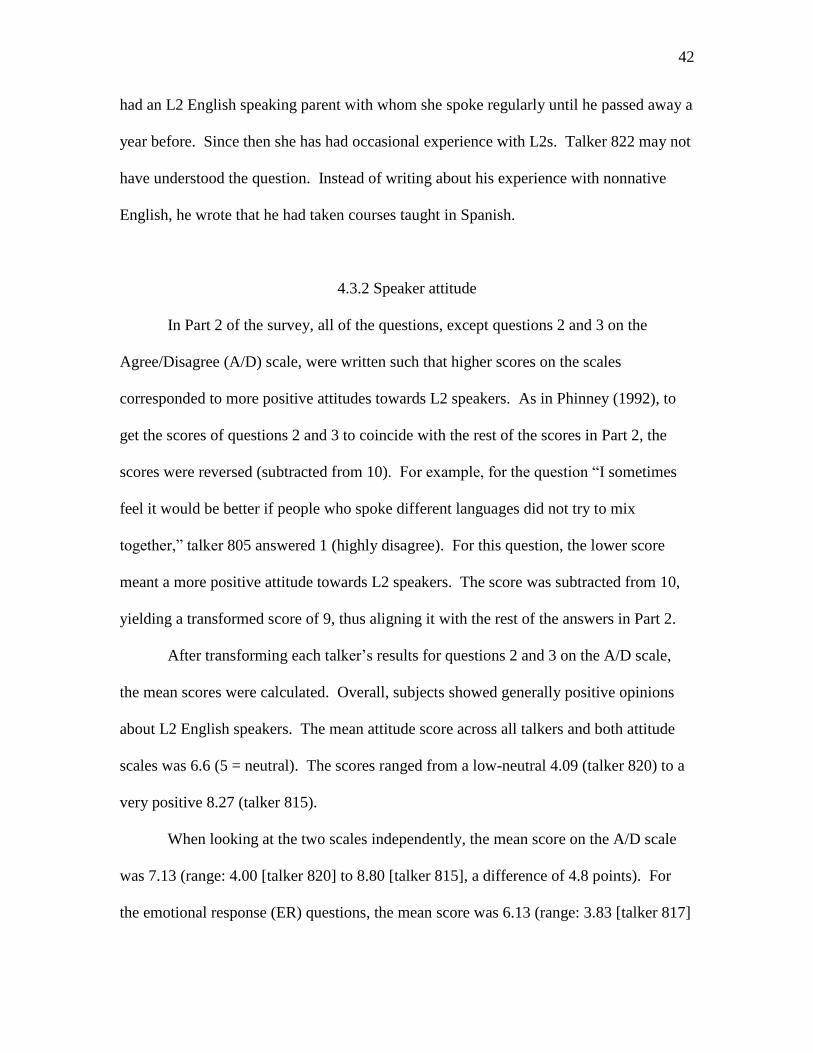
42
had an L2 English speaking parent with whom she spoke regularly until he passed away a
year before. Since then she has had occasional experience with L2s. Talker 822 may not
have understood the question. Instead of writing about his experience with nonnative
English, he wrote that he had taken courses taught in Spanish.
4.3.2 Speaker attitude
In Part 2 of the survey, all of the questions, except questions 2 and 3 on the
Agree/Disagree (A/D) scale, were written such that higher scores on the scales
corresponded to more positive attitudes towards L2 speakers. As in Phinney (1992), to
get the scores of questions 2 and 3 to coincide with the rest of the scores in Part 2, the
scores were reversed (subtracted from 10). For example, for the question “I sometimes
feel it would be better if people who spoke different languages did not try to mix
together,” talker 805 answered 1 (highly disagree). For this question, the lower score
meant a more positive attitude towards L2 speakers. The score was subtracted from 10,
yielding a transformed score of 9, thus aligning it with the rest of the answers in Part 2.
After transforming each talker’s results for questions 2 and 3 on the A/D scale,
the mean scores were calculated. Overall, subjects showed generally positive opinions
about L2 English speakers. The mean attitude score across all talkers and both attitude
scales was 6.6 (5 = neutral). The scores ranged from a low-neutral 4.09 (talker 820) to a
very positive 8.27 (talker 815).
When looking at the two scales independently, the mean score on the A/D scale
was 7.13 (range: 4.00 [talker 820] to 8.80 [talker 815], a difference of 4.8 points). For
the emotional response (ER) questions, the mean score was 6.13 (range: 3.83 [talker 817]
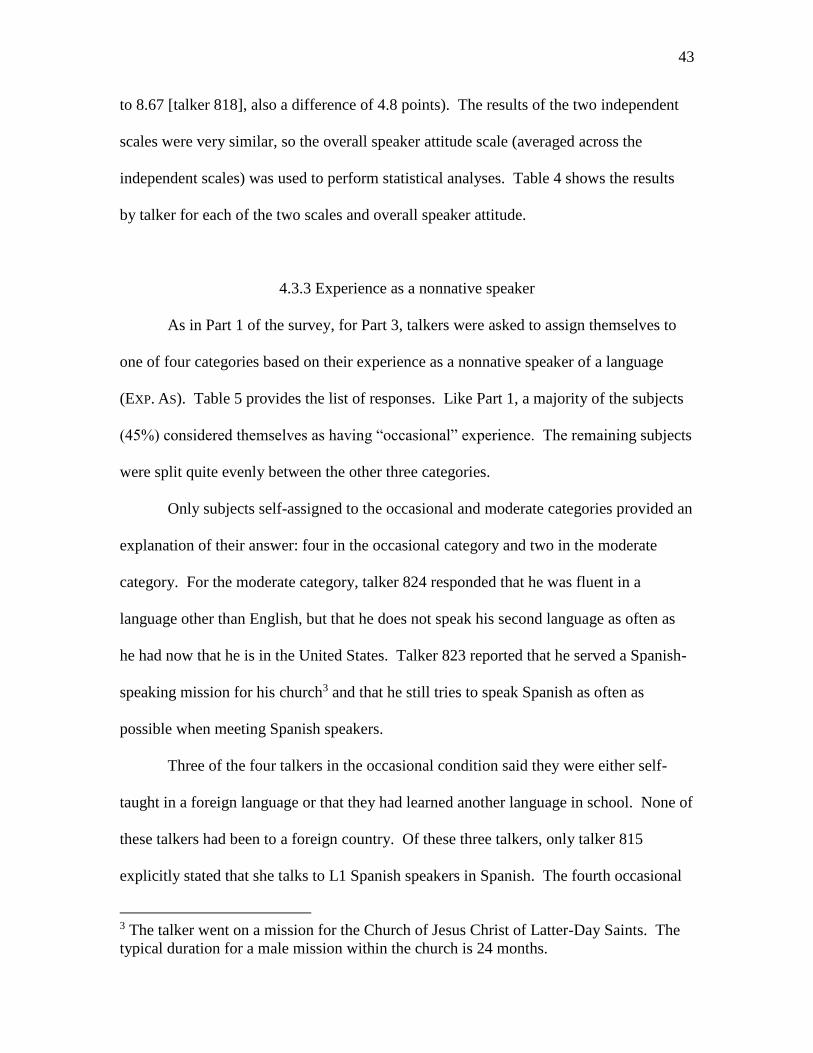
43
to 8.67 [talker 818], also a difference of 4.8 points). The results of the two independent
scales were very similar, so the overall speaker attitude scale (averaged across the
independent scales) was used to perform statistical analyses. Table 4 shows the results
by talker for each of the two scales and overall speaker attitude.
4.3.3 Experience as a nonnative speaker
As in Part 1 of the survey, for Part 3, talkers were asked to assign themselves to
one of four categories based on their experience as a nonnative speaker of a language
(EXP. AS). Table 5 provides the list of responses. Like Part 1, a majority of the subjects
(45%) considered themselves as having “occasional” experience. The remaining subjects
were split quite evenly between the other three categories.
Only subjects self-assigned to the occasional and moderate categories provided an
explanation of their answer: four in the occasional category and two in the moderate
category. For the moderate category, talker 824 responded that he was fluent in a
language other than English, but that he does not speak his second language as often as
he had now that he is in the United States. Talker 823 reported that he served a Spanish-
speaking mission for his church3 and that he still tries to speak Spanish as often as
possible when meeting Spanish speakers.
Three of the four talkers in the occasional condition said they were either self-
taught in a foreign language or that they had learned another language in school. None of
these talkers had been to a foreign country. Of these three talkers, only talker 815
explicitly stated that she talks to L1 Spanish speakers in Spanish. The fourth occasional
3 The talker went on a mission for the Church of Jesus Christ of Latter-Day Saints. The
typical duration for a male mission within the church is 24 months.
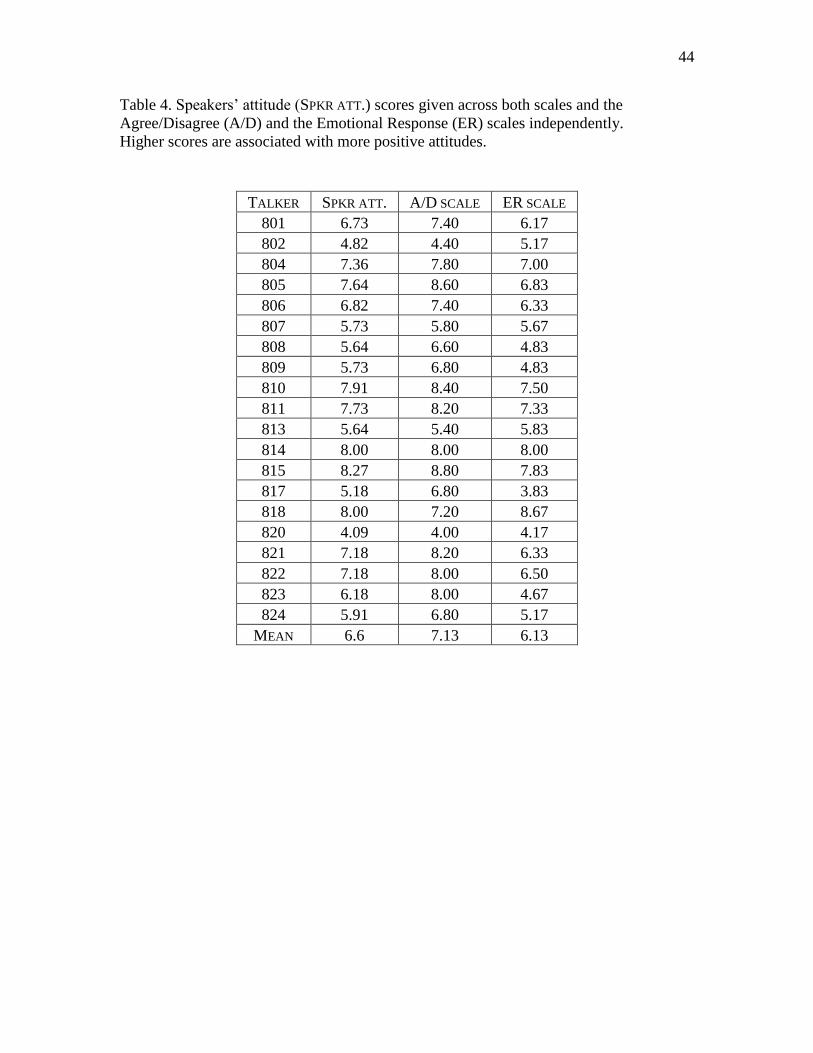
44
Table 4. Speakers’ attitude (SPKR ATT.) scores given across both scales and the
Agree/Disagree (A/D) and the Emotional Response (ER) scales independently.
Higher scores are associated with more positive attitudes.
TALKER SPKR ATT. A/D SCALE ER SCALE
801 6.73 7.40 6.17
802 4.82 4.40 5.17
804 7.36 7.80 7.00
805 7.64 8.60 6.83
806 6.82 7.40 6.33
807 5.73 5.80 5.67
808 5.64 6.60 4.83
809 5.73 6.80 4.83
810 7.91 8.40 7.50
811 7.73 8.20 7.33
813 5.64 5.40 5.83
814 8.00 8.00 8.00
815 8.27 8.80 7.83
817 5.18 6.80 3.83
818 8.00 7.20 8.67
820 4.09 4.00 4.17
821 7.18 8.20 6.33
822 7.18 8.00 6.50
823 6.18 8.00 4.67
824 5.91 6.80 5.17
MEAN 6.6 7.13 6.13
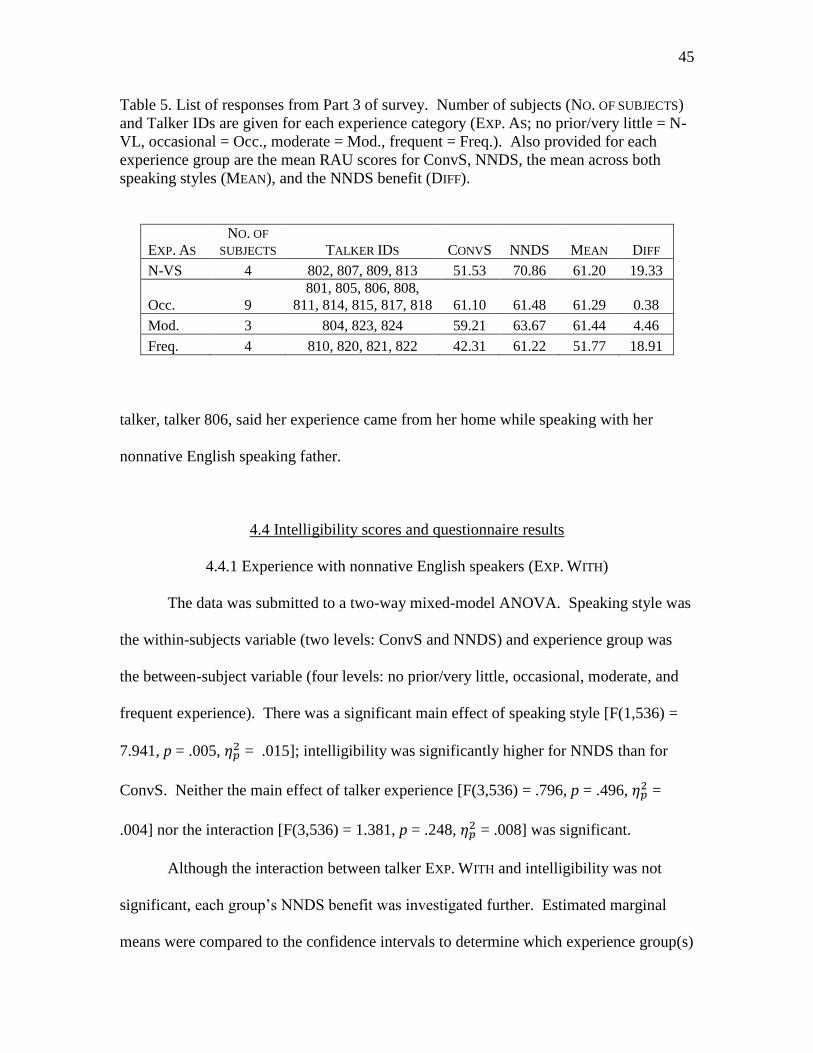
45
Table 5. List of responses from Part 3 of survey. Number of subjects (NO. OF SUBJECTS)
and Talker IDs are given for each experience category (EXP. AS; no prior/very little = N-
VL, occasional = Occ., moderate = Mod., frequent = Freq.). Also provided for each
experience group are the mean RAU scores for ConvS, NNDS, the mean across both
speaking styles (MEAN), and the NNDS benefit (DIFF).
EXP. AS
NO. OF
SUBJECTS TALKER IDS CONVS NNDS MEAN DIFF
N-VS 4 802, 807, 809, 813 51.53 70.86 61.20 19.33
Occ. 9
801, 805, 806, 808,
811, 814, 815, 817, 818 61.10 61.48 61.29 0.38
Mod. 3 804, 823, 824 59.21 63.67 61.44 4.46
Freq. 4 810, 820, 821, 822 42.31 61.22 51.77 18.91
talker, talker 806, said her experience came from her home while speaking with her
nonnative English speaking father.
4.4 Intelligibility scores and questionnaire results
4.4.1 Experience with nonnative English speakers (EXP. WITH)
The data was submitted to a two-way mixed-model ANOVA. Speaking style was
the within-subjects variable (two levels: ConvS and NNDS) and experience group was
the between-subject variable (four levels: no prior/very little, occasional, moderate, and
frequent experience). There was a significant main effect of speaking style [F(1,536) =
7.941, p = .005, 𝜂𝑝2 = .015]; intelligibility was significantly higher for NNDS than for
ConvS. Neither the main effect of talker experience [F(3,536) = .796, p = .496, 𝜂𝑝2 =
.004] nor the interaction [F(3,536) = 1.381, p = .248, 𝜂𝑝2 = .008] was significant.
Although the interaction between talker EXP. WITH and intelligibility was not
significant, each group’s NNDS benefit was investigated further. Estimated marginal
means were compared to the confidence intervals to determine which experience group(s)

46
had a significant effect of speaking style. Results are shown in Figure 5. The no
prior/very little and moderate experience groups exhibited a significant effect of speaking
style, while the occasional and frequent groups did not. To examine the effects of EXP.
WITH on talkers’ NNDS speech, a one-way ANOVA was performed. The effect was not
significant [F(3,536) = 1.129, p = .337], indicating that NNDS scores were not affected
by talker experience.
4.4.2 Speaker attitude
To calculate the correlation between intelligibility scores on the transcription task
and speaker attitude, the data were submitted to Pearson’s r. There was no significant
correlation between speaker attitude and intelligibility scores for ConvS [r = .143, n = 20,
p = .547], for NNDS [r = .044, n = 20, p = .854], or for the NNDS benefit [r = -.110, n =
20, p = .645]. The relationship between the attitude scores and intelligibility for the two
Figure 5. Intelligibility scores in RAUs for each experience group and speaking style for
EXP. WITH. * indicates significant differences in intelligibility between the speaking
styles for a given group. Error bars represent 95% confidence intervals.
0
10
20
30
40
50
60
70
80
90
N-VL Occ. Mod. Freq.
Inte
lligi
bili
ty, R
AU
s
Experience Group
ConvS NNDS
**

47
speaking styles is shown in Figure 6.
4.4.3 Experience as a nonnative speaker (EXP. AS)
As in section 4.4.1, the data were submitted to a two-way mixed-model ANOVA.
Speaking style was the within-subjects variable (two levels: ConvS and NNDS) and
experience group was the between-subject variable (four levels: no prior/very little,
occasional, moderate, and frequent experience). As in all prior analyses, the main effect
of speaking style was significant [F(1,536) = 12.730, p = .000, 𝜂𝑝2 = .023]. The main
effect of talker experience as an L2 speaker was not significant [F(3,536) = 1.956, p =
.120, 𝜂𝑝2 = .011], but the interaction between speaking style and EXP. AS was [F(3,536) =
3.335, p = .019, 𝜂𝑝2 = .018].
Figure 6. Mean attitude scores given for each speaking style and each talker as percent
correct. Percent correct scores are represented on the X-axis. The Y-axis represents
attitude scores from Part 2 of the survey. 9 = most positive attitudes toward L2 speakers
of English. Each speaking styles shows a lack of correlation.
0
1
2
3
4
5
6
7
8
9
0 20 40 60 80
Att
itu
de
sco
res
Percent Correct
Conv NNDS

48
Given the significant interaction between talker EXP. AS and intelligibility, each
group’s NNDS benefit was investigated further. Estimated marginal means and 95%
confidence intervals were compared to determine which experience group had a
significant effect of speaking style. Results are shown in Figure 7. The no prior/very
little and frequent experience groups exhibited a significant effect of speaking style while
the occasional and moderate groups did not. To examine the effects of EXP. AS on
talkers’ NNDS intelligibility, a one-way ANOVA was performed. The effect was not
significant [F(3,536) = 1.074, p = .359]. As was the case for 4.4.1, NNDS scores were
not affected by talker experience.
Figure 7. Intelligibility scores in RAUs for each experience group and speaking style for
EXP. AS. * indicates significant differences in intelligibility between the speaking styles
for a given group. Error bars represent 95% confidence intervals
0
10
20
30
40
50
60
70
80
90
N-VL Occ. Mod. Freq.
Inte
lligi
bili
ty, R
AU
s
Experience Group
ConvS NNDS
**

CHAPTER 5
DISCUSSION
5.1 Talker intelligibility
The focus of the current study was three-fold: first, to explore the individual
differences in intelligibility across talkers and speech conditions (in other words, we
investigated the intelligibility scores for both speaking styles and for the individual
talkers); second, to investigate the NNDS benefit that each talker provides; and third, to
uncover whether certain aspects of a talker’s background may contribute to intelligibility
of NNDS.
Results revealed that across talkers, overall intelligibility for NNDS was
significantly greater than for ConvS, a pattern well-attested in the clear speech literature
(e.g., Bradlow & Bent, 2002; Bradlow, Kraus, & Hayes, 2003; Ferguson, 2004, Picheny
et al., 1985; Smiljanić & Bradlow, 2011). This pattern emerged despite the fact that
subjects were still adapting to the task when they began listening to the NNDS sentences.
Additionally, talkers differed widely in their intelligibility scores for each of the speaking
styles.
When comparing the current results to previous research, difficulties arise due to
variations between the studies in the procedures and methods used. Bradlow and Bent
(2002) used the same materials (BKB sentences) at similar SNRs with an L2 audience;

50
however, scores on their transcription task were quite different. In the present study the
mean RAU score across talkers and speaking styles was 59.39 RAU. Mean scores for
ConvS was 55.14 and NNDS was 63.63, a mean difference between the two speaking
styles of 8.49 RAU. For Bradlow and Bent, when looking at the results from the -4 dB
SNR condition only, the mean intelligibility score across talkers and speaking styles was
38.75 RAU. Mean scores for ConvS was 36 and NNDS was 41.5, a mean difference
between the two speaking styles of 5.5 RAUs (see Table 6 for a list of results as well as
results from Smiljanić & Bradlow, 2011).
It is surprising that the clear speech benefit in the present study is larger than that
found in Bradlow and Bent (2002), considering that learning was taking place during the
first half of NNDS sentences. Because of the learning, one would expect the
transcription scores for the NNDS to be lower, thus decreasing the overall benefit.
Another observation (one that cannot be attributed to the effects of NNDS learning) is the
difference in ConvS scores between the two studies. Although the studies have similar
designs and methods, the difference in the scores for ConvS was 19.14 RAU.
Table 6. Results from previous research comparing them to the present study. The
information provided are: the SNRs (SNR LEVEL), the types of stimuli used
(SENTENCE TYPE), the mean scores for the speaking styles (ConvS and CLEAR/NNDS),
and the mean clear speech benefit (DIFF). All scores are given in RAUs.
RESEARCH ON CLEAR
SPEECH/NNDS
SNR
LEVEL
SENTENCE
TYPE CONVS
CLEAR/
NNDS DIFF
Bradlow & Bent
(2002)
-4 dB BKB
36 41.5 5.5
Smiljanić & Bradlow
(2011)
+5 dB Semantically
anomalous 54.06 70.16 16.09
Current study -4 dB BKB 55.14 63.63 8.49
51
Additionally, the difference in NNDS scores was even larger, 22.13 RAU, despite the
NNDS learning. The large differences in intelligibility between the two studies most
likely arise since Bradlow and Bent (2002) used recordings from only two talkers. The
fact that the researchers only used two talkers makes it difficult to generalize the results
and compare them to other studies.
The same issue applies for Smiljanić and Bradlow (2011). The Croatian listeners
completed a transcription task for semantically anomalous English sentences. The mean
score across talkers and speaking style was 62.11 RAU. The mean score for ConvS was
54.06 RAU, and clear speech was 70.16 RAU, a difference of 16.09 RAU. Three
differences between this study and Smiljanić and Bradlow (2011) emerge making it hard
to compare the studies directly. First, in their study, each listener heard sentences
produced by only one talker. Like Bradlow and Bent (2002), this makes the results
harder to generalize. Second, the signal-to-noise ratio for Smiljanić and Bradlow was +5
dB SNR; therefore, the noise added to each sentence was set at an easier level compared
to the current study. Third, the stimuli used in the previous study were semantically
anomalous sentences, which are shown to be much more difficult stimuli compared to
semantically normal sentences (Van Engen, Chandrasekaran, & Smiljanić, 2012). It is
uncertain what it means for listeners to have the same ConvS scores when they heard
speech from only one talker, the recordings were at an easier signal-to-noise ratio, and the
stimuli were much more difficult to understand.

52
5.2 Talker questionnaire
Based on previous research, expectations concerning the results of the talker
questionnaire were as follows:
1) Initially, it was believed that talkers with more experience with L2 speakers
would be more adept at producing clear speech for L2 listeners. They would have
higher overall clear speech scores than those with less experience.
On the one hand, as was seen in Dahl (1981), experienced ESL teachers were
more intelligible to L2 listeners than non-ESL teachers (where experience was measured
by whether a talker was an ESL teacher4 or not). Due to this, one might expect talkers
with the most experience to have the highest NNDS intelligibility. On the other hand,
results found in Ferguson (2012), including the reanalyzed data from Ferguson (2004),
showed the greatest effect of talker background on intelligibility for those who had little
experience communicating with hearing-impaired listeners. According to this, one might
then expect talkers with little experience with the target audience to provide the greatest
benefit. However, one difference between Ferguson (2004, 2012) and the current study
are the audiences used. Bradlow and Bent (2002) showed that less-proficient L2 listeners
benefit less from clear speech. Because the present study used a variety of listener levels,
including those who were less proficient in English, this made it unclear what effect EXP.
WITH would have on intelligibility for nonnative listeners.
2) If a correlation existed between speaker attitude and scores on the transcription
4 Dahl did not ask if the talkers had other experiences with L2 listeners. For example, she
did not ask if the talkers had immediate family members who were nonnative speakers of
English. It is possible that a non-ESL teacher had more experience, but because this
information was not brought to light, it must be assumed that ESL teachers had more
experience than non-ESL teachers.
53
task, it would be expected that talkers with more negative attitudes would have a
smaller clear speech benefit (and potentially a negative benefit) compared to
talkers who have more positive attitudes towards L2 speakers. No claim was
made for overall intelligibility scores since a talker with a negative attitude could
have very intelligible ConvS and neither a positive nor negative speech benefit,
while another negative attitude talker may have lower ConvS intelligibility and
also have a negative benefit.
3) Due to lack of research on the topic, there was no principled reason to expect that
subjects who speak languages nonnatively would be any more or less intelligible
than those who are not L2 speakers. It was, however, intuitive to posit that people
who are L2 speakers themselves may be inherently better at producing more
intelligible speech for other L2 listeners. If this was the case, we would have
expected to see higher overall NNDS scores, but we made no claims about the
relationship between the two styles of speech. In other words, no claims were
made about the potential clear speech benefit that the talkers would provide.
Unfortunately, with the current study design, only talker experience as an L2
speaker was shown to affect intelligibility. It was the expectation that talkers with the
most experience as an L2 speaker would have the greatest NNDS scores. Results from
the one-way ANOVA showed this not to be the case. In fact, the opposite was true.
Talkers in the frequent group had the lowest mean scores, while talkers in the no
prior/very little experience group had the highest.
There was no expectation concerning the clear speech benefit, yet when we
investigated each experience group independently, there was a significant effect of

54
speaking style. Talkers with no prior/very little and frequent experience exhibited a
significant effect of speaking style while those in the occasional and moderate groups did
not.
While the inferential statistics showed no other correlations between intelligibility
scores and answers on the questionnaire, it was interesting to explore how talkers who
displayed similar clear speech benefits responded to the questionnaire. Four pairs of
talkers had similar benefits; their answers are presented in Table 7.
When looking at talkers who shared similar NNDS benefits, there was very little
overlap in answers. For instance, where talker 802 had occasional experience with L2
Table 7. Pairs of subjects who exhibited identical benefits (BNFT). Answers are given
for a subject’s experience with L2 speakers (EXP. WITH), speaker attitude (SPKR ATT.),
and subject’s experience as an L2 speaker (EXP. AS). “n.c.” means that no comment
was given.
BNFT TLKR EXP. WITH
SPKR
ATT. EXP. AS
-3.7 801 Moderate (n.c.) 6.73 Occasional (“I have taught
myself other language and have
friends that speak other
languages, but haven't been to
those countries”)
808 No prior/very little (n.c.) 5.64 Occasional (“Took classes in
high school and am taking
classes now. But have never
been to a foreign country”)
11.11 802 Occasional (n.c.) 4.82 No prior/very little (n.c.)
805 Moderate (n.c.) 7.64 Occasional (n.c.)
16.05 807 No prior/very little (n.c.) 5.73 No prior/very little (n.c.)
811 Moderate (n.c.) 7.73 Occasional (n.c.)
25.93 824 Occasional (“Had more
experience with nonnative
speakers in the past but not
as much now”)
5.91 Moderate (“I am fluent but I
don't use it as much now that I
am back in the United States”)
813 No prior/very little (n.c.) 5.64 No prior/very little (n.c.)

55
speakers, 805 had moderate experience. Where 805 had occasional experience as an L2
speaker, 802 had no prior/very little experience. In addition, these talkers had the largest
difference in their attitude scores (a difference of 2.82 points) compared to any of the
other pairs.
Like talkers 802 and 805, talkers 824 and 813 had identical benefits (the
difference in their NNDS and ConvS scores was 25.93 percentage points) and very
different answers on the questionnaire (though the difference in their attitude scores was
only.3 points). Unlike talkers 802 and 805, their ConvS and NNDS scores were almost
identical (see Table 2). For talkers 813 and 807, they had identical answers for the
different parts of the survey (the difference in attitude scores was only .09 points), yet the
difference in the benefit that each talker provided was 14.82 percentage points. It was the
hope of the researcher to also compare comments left by the talkers. However, since only
three of these talkers left any comments, detailed comparisons were unable to be made.
Additional investigations of the questionnaire were to determine if a pattern
existed between speakers who provided a significant NNDS benefit (whether positive or
negative) and those who did not. Results were inconclusive and looked similar to those
in Table 7. For example, NNDS for talker 824 was significantly more intelligible that her
ConvS. Additionally, she indicated that she had occasional experience on Part 1 of the
survey, moderate experience in Part 3, and had an overall attitude score of 5.91. Talker
823 responded identically on Parts 1 and 3 of the survey, and his attitude score was 6.18;
however, he did not provide a significant clear speech benefit. In fact, his benefit trended
in the opposite (negative) direction.

CHAPTER 6
CONCLUSION
6.1 Results recap
The goal of the study was to give a better understanding about what affects
intelligibility of speech directed at nonnative English speaking audiences. Before the
present study, intelligibility research concentrated on acoustic-phonetic features (e.g.,
whether the vowel space was expanded), syntactic properties (e.g., whether a talker used
simple declarative sentences versus sentences with embedded clauses), and temporal
factors (e.g., did the talker slow his/her speech? In what manner was it slowed?). The
current study assessed three new factors that could contribute to intelligibility: speaker
attitude, talker experience with L2 speakers, and talker experience as an L2 speaker.
With the present study design and current data, it was found that only talker experience as
an L2 speaker had an effect on intelligibility for nonnative English listeners during the
transcription task.
One contribution of the present study was that it replicated the results found in the
existing literature. Overall, clear speech, in this case NNDS, was more intelligible than
ConvS for L2 listeners. In addition, talkers varied widely in their ability to produce more
intelligible speech during NNDS. Several talkers were successful at producing NNDS
that was significantly more intelligible than ConvS, while others produced no significant

57
benefit, and a single talker was significantly more intelligible during ConvS than clear
speech. The average benefit was similar to those found in previous studies, which was
slightly unexpected due to the transcription task (see Table 6).
6.2 Limitations
One limitation of the study was the procedure for the transcription task. Too few
practice items were provided for the listeners, forcing them to adapt to the task during the
first half of the NNDS sentences. To account for NNDS learning, order analyses were
conducted using only the results from the sentences appearing in the second halves of
each speaking style (NNDS sentences: #11–20 and ConvS sentences: #31–40).
Unfortunately, because the second-halves-only analysis would result in missing data,
analyses were performed using all data. Consequently, overall scores for NNDS were
lowered, possibly causing the intelligibility benefit to be smaller than it might have
otherwise been. To manage this issue in future work, one could re-collect data while
providing new listeners with a sufficient number of practice items. During the study, a
handful of listeners stated they were unsure of the task (even though they received written
and verbal instructions describing the transcription task) and that they had an extremely
difficult time understanding the talkers until approximately the fifth or sixth test sentence.
In light of these comments, to make certain that this audience is adjusted to the task and
to the SNR, 10 practice items would be sufficient to prevent learning at test.
Additionally, one could familiarize talkers on stimuli with increasing degrees of
background noise to help them transition to listening in a noisy environment. Another
alternative solution could be to analyze the second-half results using mixed-effects
models (MEMs), as they are more appropriate for handling missing data (Quené & van

58
den Bergh, 2004).
Another advantage to using MEMs is that it yields higher statistical power (Quené
& van den Bergh, 2004). This is beneficial as the current study lacked power when
investigating the relationship between talker background and scores on the transcription
task. Ideally, one would try to recruit large and equal numbers of participants in each
group. Unfortunately, because talker background was not controlled for, it was impossible
to determine how many subjects would be assigned to each category on Parts 1 and 3 on the
talker survey. This left a possibility that there would be too few subjects in each group to
perform reliable analyses. In Part 1, only two subjects out of twenty assigned themselves to
the frequent experience group and only three subjects claimed to have no prior/very little
experience. The remaining fifteen subjects were almost equally divided into the occasional
and moderate categories. In Part 3, there were 3 to 4 talkers in each group, except for the
occasional category, which contained 9 talkers. Although it was found that the clear speech
effect was significant for the no prior/very little and frequent experience categories, the
results were based on groups that had very small numbers (n = 4). Because of the small
number of subjects in these groups and the fact that ANOVAs were used, it is nearly
impossible to make generalizations to the population as a whole.
An alternative way to increase power in subsequent studies would be to increase the
number of participants. This would increase the chance of more subjects being assigned to
the no prior/very little and frequent experience categories (and the moderate category for Part
3). However, it is still possible that not enough talkers would be assigned to each of the
groups.
A third limitation of the study was the organization of Parts 1 and 3 of the survey,
as the talker experience categories were subjectively created (e.g., the researcher decided

59
how many hours per week were considered moderate experience). It is conceivable that
shifting group boundaries or decreasing the number of categories (i.e., organizing them
according to low and high experience) would have produced significant results. Decreasing
the number of categories would have increased the number of participants in each one by
redistributing the subjects. For instance, listeners in Part 1 of the survey were distributed in
the four groups in the following ways: no prior/very little [n = 3], occasional [n = 8],
moderate [n = 7] and frequent [n = 2]. If there were only two groupings, 11 subjects would
have been considered low experience and nine would have been high experience.5 This
would have provided more power for statistical analyses without having to recruit more
listeners.
Another limitation arose from Part 2 of the talker survey. In an attempt to
diversify the population from which the sample was drawn, subjects were recruited from
the Linguistics and Psychology study pools. Despite the fact that subjects represented
seven majors across campus, the answers on Part 2 of the questionnaire revealed that
talkers had quite similar attitudes towards nonnative speakers of English, ranging from
neutral to positive (4.09–8.27, respectively). On one hand, this could suggest that
although talkers were taken from different majors, they might represent a fairly
homogeneous population. On the other hand, talkers might have provided only neutral
and positive responses since they knew their attitudes were being tested (e.g., subjects
read “I enjoy being around people whose native language is not English” and had to
respond to it). Because some of the questions tested their attitudes directly, it is likely
that participants answered favorably to protect their image (Potter & Wetherell, 1987).
5 It was outside the scope of the current study to adjust the experience categories and
reanalyze the data. Future research will investigate the effects of adjusting the categories
and category boundaries.

60
6.3 Implications
One contribution of the study is that provides more evidence in support of the
clear speech benefit for nonnative listeners. In addition, it shows that the methods used
for elicitation, though uncommon, are effective at eliciting different types of speech.
This is accomplished without the researcher telling participants how they should speak.6
With the current design of the study, the implications concerning the variables
themselves are unknown, as it is impossible to interpret the null results (and it is
uncertain what it means to have significant results for Part 3 of the survey, when the
group categories were highly uneven). More research is needed to determine whether
talker experiences and speaker attitude are, in fact, related to intelligibility. What has
been discovered is that the method of assessment could have failed to find more
significant results for several reasons: (1) it is possible that the survey failed to find
significant results because the variables in question have no actual effect on
intelligibility, (2) there were not enough subjects in each experience group to perform
reliable analyses, and (3) the questionnaire was inadequately designed (i.e., it was not
sensitive enough for patterns to emerge).
Another discovery was that it was difficult to get the right subjects from a college
setting. In general, it is ideal to sample from a broad population in order to make
generalizations about the results. However, it is not always feasible to do so and many
researchers are able to sufficiently answer their research questions by utilizing only
college students as participants (e.g., Bradlow & Bent, 2002; Lam et al., 2012;
6 Acoustic analyses of the speech were not performed; thus, we are unable to determine,
at this time, whether the current method of elicitation is more or less effective at
producing ConvS and NNDS compared to other methods generally used.

61
Lindemann, 2000; Picheny, 1985; Smiljanić & Bradlow, 2011). It is possible, as
mentioned above, that for this study university students formed too homogeneous a
population. One would need to sample from a broader population to answer the research
questions.
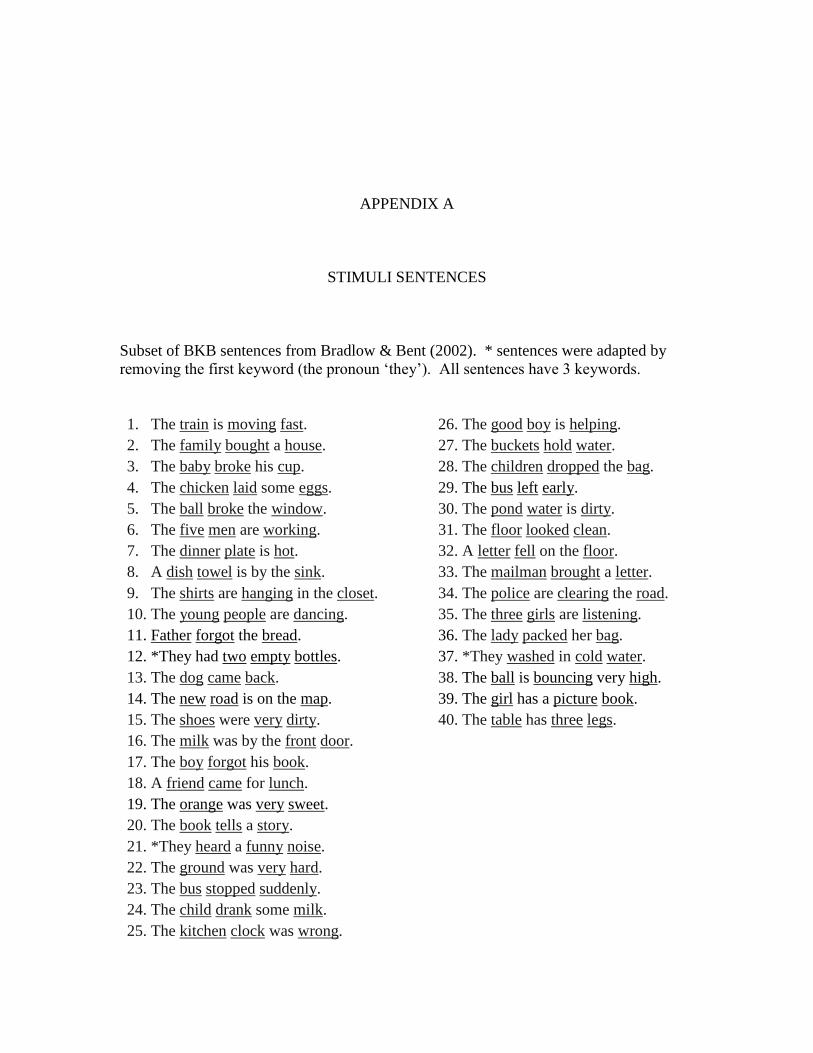
APPENDIX A
STIMULI SENTENCES
Subset of BKB sentences from Bradlow & Bent (2002). * sentences were adapted by
removing the first keyword (the pronoun ‘they’). All sentences have 3 keywords.
1. The train is moving fast. 26. The good boy is helping.
2. The family bought a house. 27. The buckets hold water.
3. The baby broke his cup. 28. The children dropped the bag.
4. The chicken laid some eggs. 29. The bus left early.
5. The ball broke the window. 30. The pond water is dirty.
6. The five men are working. 31. The floor looked clean.
7. The dinner plate is hot. 32. A letter fell on the floor.
8. A dish towel is by the sink. 33. The mailman brought a letter.
9. The shirts are hanging in the closet. 34. The police are clearing the road.
10. The young people are dancing. 35. The three girls are listening.
11. Father forgot the bread. 36. The lady packed her bag.
12. *They had two empty bottles. 37. *They washed in cold water.
13. The dog came back. 38. The ball is bouncing very high.
14. The new road is on the map. 39. The girl has a picture book.
15. The shoes were very dirty. 40. The table has three legs.
16. The milk was by the front door.
17. The boy forgot his book.
18. A friend came for lunch.
19. The orange was very sweet.
20. The book tells a story.
21. *They heard a funny noise.
22. The ground was very hard.
23. The bus stopped suddenly.
24. The child drank some milk.
25. The kitchen clock was wrong.

APPENDIX B
ELICITATION SCRIPT
Passage script used for talker elicitations, taken from Speech Accent Archive.
“Please call Stella. Ask her to bring these things with her from the store:
Six spoons of fresh snow peas, five thick slabs of blue cheese, and maybe
a snack for her brother Bob. We also need a small plastic snake and a big
toy frog for the kids. She can scoop these things into three red bags, and
we will go meet her Wednesday at the train station.”

APPENDIX C
TALKER QUESTIONNAIRE
1. Age
2. Gender
3. Speech, language, hearing, or neurological disorders? If yes, please describe
4. Are you taking any medications that may affect your motor skills? If yes, please
describe
5. What do you consider to be your native language?
6. What language do you speak with your parents?
7. What is your major?
PART 1 (experience with foreign accented English)
Indicate your experiences with foreign accented English by circling the number which
best describes your situation:
1. No prior/very little experience. < an hour/week
Examples: I have/have had no family members, coworkers, or friends who
are non-native speakers of English. I generally only encounter people with
foreign accents for short periods of time in places such as grocery stores,
restaurants, etc.
2. Occasional: 1-3 hrs/week
Examples: I have/have had acquaintances, coworkers, or teachers/professors,
who are non-native speakers of English. I do not speak to these people on a
regular basis (e.g. more than once or twice a week)
3. Moderate: 3-5 hrs/week
Examples: I have/have had some friends or extended family members who are
non-native speakers of English. I may not talk to them more than once or
twice a week, but the conversations tend to be long and in depth.
4. Frequent: > 5 hrs/week
Examples: I have/have had (at least) immediate family members, close
friends, and/or professional acquaintances (e.g. students, boss, etc.) who are
non-native speakers of English. I communicate with at least one non-native
speaker of English several times a week.

65
5. Please add comments if you wish to clarify you answer or if there is other
information you think might be relevant having to do with (a) how often and (b)
in what contexts you speak with non-native speakers of English.
PART 2 (talker attitudes)
Instructions: Read the following statements. On the scale, rate to what extent you agree
or disagree with the statements. (1 = highly disagree, 5 = neutral, 9 = highly agree)
1. I like meeting and getting to know people who speak languages different from my
own.
2. I sometimes feel it would be better if people who spoke different languages did
not try to mix together.
3. I do not try to become friends with people who speak languages other than
English.
4. I am involved in activities with people who are native speakers of languages
besides English.
5. I enjoy being around people whose native language is not English.
Instructions: Read each situation very carefully and then try to imagine yourself in it.
Take about two minutes to really get into the mood of the situation. Think: How would
this make me feel if I were in the situation (for example, happy/unhappy,
annoyed/pleased, etc.)? Then rate your feeling on the scale (1 = very negative feelings, 5
= neutral feelings, 9 = very positive feelings).
1. You are standing in line by yourself waiting to order lunch. Two people behind
you are having a conversation in another language.
2. You are at school and a fellow student does not understand the teacher’s
directions in English. The teacher happens to speak the student’s native language
and explains the instructions again in the student’s native language.
3. You call your bank. It is obvious from their accent that the person who answers
the phone is not from the United States.
4. You call your cell phone company to pay a bill. A recording answers and asks
you to press “1” for English and “2” for “other language options.”
5. You go to the doctor and the forms you need to fill out are written in both English
and another language.
6. You are visiting another country. You ask some locals for directions, but they do
not speak English so they respond in their local language.
PART 3 (being a nonnative speaker of another language)
Circle the number which best describes your experience as a second language learner:
1. No prior/very little experience:
Examples: I have never learned a foreign language or I learned a foreign

66
language in junior high/high school and have not spoken it since. I spoke the
language rarely and only with classmates and the language teacher.
2. Occasional:
Examples: I am taking/have taken foreign language classes in college. I have
a basic understanding of the language. I have been to a foreign country and
have had some interactions with the local population in the language of the
country (e.g. ordering food at a restaurant or asking for directions). When not
speaking to the locals or my professor, I spoke in English.
3. Moderate:
Examples: I am taking/have taken foreign language classes in college and
have lived in a non-English speaking country for an extended amount of time
(e.g. a summer or semester length study abroad). My experience in a non-
English speaking country may have been several years ago. While in the
foreign country, I spoke the language at least half of the time. I was able to
use the language to carry out a range of tasks with native speakers of the
language.
4. Frequent:
Example. I am fluent or nearly fluent in another language and I speak it
regularly. I practiced the language with native speakers of that language for at
least a year and it was my primary language for daily interactions. I have had
regular communication in the language within the last two years.
5. Please add comments if you wish to clarify your answer.

REFERENCES
Allen, J. S., Miller, J.L., & DeSteno, D. (2002). Individual talker differences in voice-
onset-time. Journal of the Acoustical Society of America, 113(1), 544–552.
Bench, J. & Bamford, J. (Eds.). (1979). Speech-hearing tests and the spoken language of
hearing-impaired children. London: Academic Press.
Bent, T. & Bradlow, A. R. (2003). The interlanguage speech intelligibility benefit.
Journal of the Acoustical Society of America, 114(3), 1600–1610.
Biersack, S., Kempe, V., & Knapton, L. (2005). Fine-tuning speech registers: a
comparison of the prosodic features of child-directed and foreigner-directed
speech, Proceedings of the 9th European Conference on Speech Communication
and Technology, Lisbon, 2401–2404.
Blosser, J. L., Weidner, W. E., & Dinero, T. (1976). The effect of Rate-Controlled
Speech on the auditory Receptive Scores of children with normal and disordered
language abilities. The Journal of Special Education, 10, 291–298.
Boersma, P. (2001). Praat, a system for doing phonetics by computer. Glot International,
5, 341–345.
Bradlow, A. R., & Alexander, J. A. (2007). Semantic and phonetic enhancements for
speech-in-noise recognition by native and non-native listeners. Journal of the
Acoustical Society of America, 121(4), 2339–2349.
Bradlow, A. R., & Bent, T. (2002). The clear speech effect for non-native listeners.
Journal of the Acoustical Society of America, 112(1). 272–284.
Bradlow, A. R., Kraus, N., & Hayes, E. (2003). Speaking clearly for children with
learning disabilities: Sentence perception in noise. Journal of Speech, Language,
and Hearing Research, 46, 80–97.
Bradlow, A., Torretta, G., & Pisoni, D. (1996). Intelligibility of normal speech I: Global
and fine-grained acoustic-phonetic talker characteristics. Speech Communication,
20, 255–272.
Chaudron, C. (1982). Vocabulary elaboration in teachers’ speech to L2 learners. Studies
68
in Second Language Acquisition, 4, 170–180.
Chaudron, C. (1988). Second language classrooms: Research on teaching and learning.
New York, NY: Cambridge University Press.
Cox, R. M., Alexander, G. C., & Gilmore, C. (1987). Intelligibility of average talkers in
typical listening environments. Journal of the Acoustical Society of America,
81(5), 1598–1608.
Dahl, D. (1981). The role of experience in speech modifications for second language
learners. Minnesota Papers in Linguistics and Philosophy of Language, 7, 78–93.
Ferguson, S. H. (2004). Talker differences in clear and conversational speech: Vowel
intelligibility for normal hearing listeners. Journal of the Acoustical Society of
America, 116(4), 2365–2373.
Ferguson, S. H., & Kewley-Port, D. (2007). Talker differences in clear and
conversational speech: Acoustic characteristics of vowels. Journal of Speech,
Language, and Hearing Research, 50, 1241–1255.
Ferguson, S.H. (2012). Talker differences in clear and conversational speech: Vowel
intelligibility for older adults with hearing loss. Journal of Speech, Language, and
Hearing Research, 55, 779–790.
Fernald, A., & Simon, T. (1984). Expanded intonation contours in mothers’ speech to
newborns. Developmental Psychology, 20(1), 104–113.
Forster, K. I., & Forster, J. C. (2003). DMDX: A windows display program with
millisecond accuracy. Behavior Research Methods, Instruments, & Computers,
35(1), 116–124.
Gagné, J.-P., Masterson, V., Munhall, K. G., Bilida, N., & Querengesser, C. (1994).
Across talker variability in auditory, visual, and audiovisual speech intelligibility
for conversational and clear speech. Journal of the Academy of Rehabilitative
Audiology, 27, 135–158.
Gooskens, C. (2006). Linguistic and extra-linguistic predictors of inter-Scandinavian
intelligibility. Linguistics in the Netherlands, 23(1), 101–113.
Henzl, V. M. (1973). The linguistic register of foreign language instruction. Language
Learning. 23, 207–222.
Henzl, V. M. (1979). Foreign talk in the classroom. International Review of Applied
Linguistics, 17, 159–167.
Ivanova, J. (2011). The effects of teacher talk on L2 learners’ comprehension

69
(Unpublished master’s thesis). University of Utah, Salt Lake City, UT.
Jacewicz, E., Fox, R. A., & Wei, L. (2010). Between-speaker and within-speaker
variation in speech tempo of American English. Journal of the Acoustical Society
of America, 128(2), 839–850.
Johnson, K., Ladefoged, P., & Lindau, M. (1993). Individual differences in vowel
production. Journal of the Acoustical Society of America, 94(2), 701–714.
Karl, J., & Pisoni, D. (1994), Effects of stimulus variability on recall of spoken sentences:
A first report (Progress Report No. 19). Bloomington, IN: Indiana University.
Kohler, K. (2001). Articulatory dynamics of vowels and consonants in speech
communication. Journal of the International Phonetic Association, 31, 1–16.
Lam, J., Tjaden, K., & Wilding, G. (2012). Acoustics of clear speech: Effect of
Instruction. Journal of Speech, Language, and Hearing Research, 55, 1807–1821.
Lindemann, S. (2000). Non-native speaker “incompetence” as a construction of the native
listener: Attitudes and their relationship to perception and comprehension of
Korean-accented English (Ph.D. dissertation). University of Michigan, Ann
Arbor, MI.
Lindemann, S. (2002). Listening with an attitude: A model of native-speaker
comprehension of non-native speakers in the United States. Language in Society,
31, 419–441.
Mattys, S. L., White, L., & Melhorn, J. F. (2005). Integration of multiple speech
segmentation cues: A hierarchical framework. Journal of Experimental
Psychology, 134(4), 477–500.
McCloy, D. (2013). Mix Speech With Noise. Retrieved from http://github.com
Mehrabian, A., & Russell, J. A. (1974). An approach to environmental psychology.
Cambridge, MA: The MIT Press
Phinney, J. S. (1992). The multigroup ethnic identity measure: A new scale for use with
diverse groups. Journal of Adolescent Research, 7(2), 156–176.
Picheny, M. A., Durlach, N. I., & Braida, L. D. (1985). Speaking clearly for the hard of
hearing I: Intelligibility differences between clear and conversational speech.
Journal of Speech and Hearing Research, 28, 96–103.
Picheny, M. A., Durlach, N. I., & Braida, L. D. (1986). Speaking clearly for the hard of
hearing II: Acoustic characteristics of clear and conversational speech. Journal of
Speech and Hearing Research, 29, 434–446.

70
Picheny, M. A., Durlach, N. I., & Braida, L. D. (1989). Speaking clearly for the hard of
hearing III: An attempt to determine the contribution of speaking rate to
differences in intelligibility between clear and conversational speech. Journal of
Speech and Hearing Research, 32, 600–603.
Pisoni, D. (1981). Some current theoretical issues in speech perception. Cognition, 10,
249–259.
Potter, J., & Wetherell, M. (1987). Discourse and social psychology: Beyond attitudes
and behaviour. London: Sage Publications.
Qualtrics. (n.d.). Qualtrics Research Suite (Version 2013, Release 2005). Retrieved from
http://www.qualtrics.com
Quené, H., & van den Bergh, H. (2004). On multi-level modeling of data from repeated
measures designs: a tutorial. Speech Communication, 43, 103–121.
Scarborough, R., Brenier, J., Zhao, Y., Hall-Lew, L., & Dmitrieva, O. (2007). An
acoustic study of real and imagined foreigner-directed speech. Proceedings of the
International Congress of Phonetic Sciences, 6-10, 2165–2168.
Schierloh, M., & Hayes-Harb, R. (2008). Research on listening comprehension: The
contributions of talker familiarity and individual talker characteristics. Die
Unterrichtspraxis/Teaching German, 41(2), 171–185.
Shockey, L. (2003). Sound patterns of spoken English. Malden, MA: Blackwell
Publishing.
Smiljanić, R., & Bradlow, A. R. (2011). Bidirectional clear speech perception benefit for
native and high-proficiency non-native talkers and listeners: Intelligibility and
accentedness. Journal of the Acoustical Society of America, 130(6), 4020–4031.
Studebaker, G. A. (1985). A “rationalized” arcsine transform. Journal of Speech and
Hearing Research, 28, 455–462.
Van Engen, K. J., & Bradlow, A. R. (2007). Sentence recognition in native- and foreign-
language multi-talker background noise. Journal of the Acoustical Society of
America, 121(1), 519–526.
Van Engen, K. J., Chandrasekaran, B., & Smiljanić, R. (2012). Effects of speech clarity
on recognition memory for spoken sentences. PLoS One, 7(9), e43753. doi:
10.1371/journal.pone.0043753
Weinberger, S. (2014). Speech Accent Archive. George Mason University. Retrieved
from http://accent.gmu.edu.

71
Yu, A., Abrego-Collier, C., Baglini, R., Grano, T., & Martinović, M. (2011). Speaker
attitude and sexual orientation affect phonetic imitation. University of
Pennsylvania Working Papers in Linguistics, 17(1), 235–242.