talent management - masiecontent.s3.amazonaws.commasiecontent.s3.amazonaws.com/content/l12/650tm in...
TRANSCRIPT

1
Talent Management
In the Trenches

2
About Kevin Oakes
Background
Founder, CEO of i4cp
Former Chairman, Jambok
Former Chairman, ASTD Board
Founder, President, SumTotal
Systems
Former CEO, Chair of Click2learn
Founder, CEO Oakes Interactive
The Executive Guide to Integrated
Talent Management

3
Who we are:
i4cp focuses on the people
practices that make
high-performance
organizations unique.
4
High-performance organizations consistently outperform most of their competitors for extended periods of time.
These companies performed better over the past five years, based on these four indicators:
1. Revenue growth
2. Market share
3. Profitability
4. Customer satisfaction
Defining High Performance

5
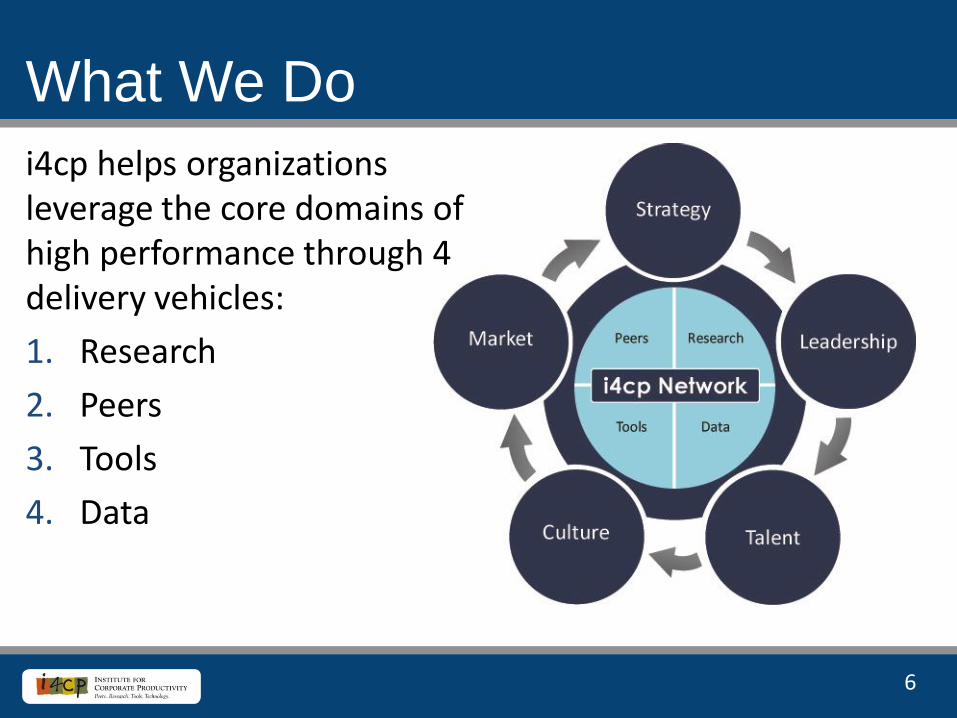
i4cp research has shown that high-performance companies excel in five core areas:
1. Strategy
2. Leadership
3. Talent
4. Culture
5. Market (customer focus)
The 5 Domains of High Performance
6
i4cp helps organizations leverage the core domains of high performance through 4 delivery vehicles:
1. Research
2. Peers
3. Tools
4. Data
What We Do

7
Grounded in High Performance

8
The Future of HR: Moving to
Performance Advisor
Leadership Competencies:
Readying for the Future
Critical Human Capital Issues of
2012
Effective Internal
Communications
The State of Employee
Healthcare Benefits
Recent Reports
Measuring Time-to-full-
productivity
Measuring Quality of
Movement
Talent Management in the
Trenches
Tying Pay to Performance
Innovate or Perish: Building
a Culture of Innovation

9
i4cp Network
2007 2008 2009 2010 2011
2011 - 2012
10
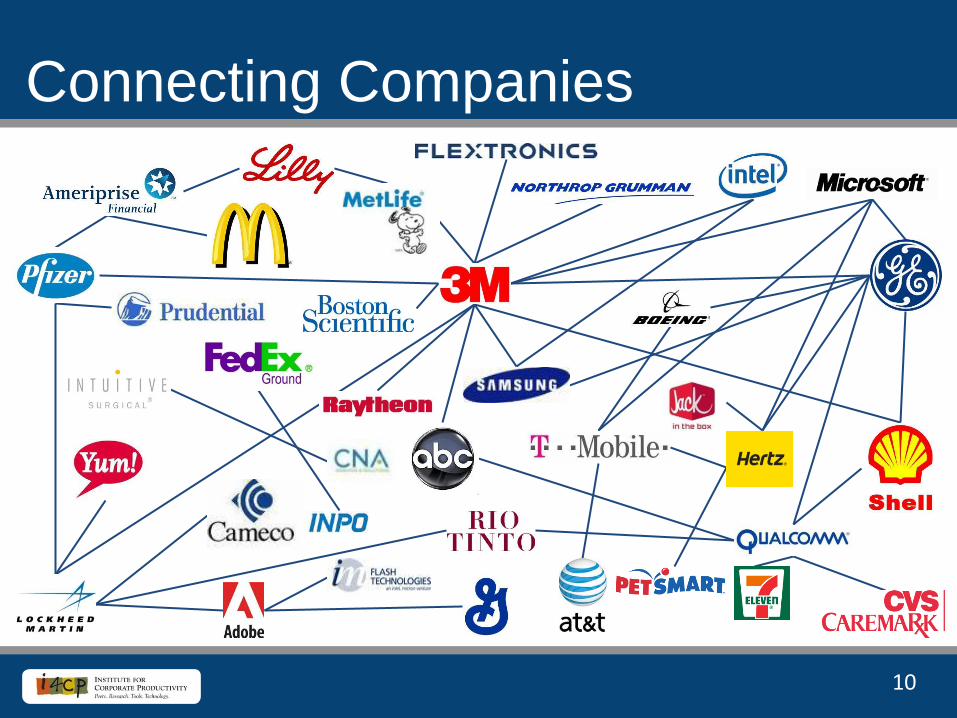
Connecting Companies

11
“You have to be efficient and at
the same time, more effective in
transactions, in relationships, and
as leaders of the business. That’s
a real change for HR – from the
early industrial relations experts
of yesterday to the growth leaders
of tomorrow.”
The Growth Leaders of Tomorrow
John Lynch
CHRO

12
Add Value &
Maximize Upside
Limit Liability
& Protect
Downside
Imp
act/
Co
ntr
ibu
tio
n t
o t
he
Bu
sin
ess
Strategic
HR Planning
Organizational
Design
Compensation
Compliance
Labor/Union
Relations
Employee
Relations Performance
Management
Survey Action
Planning
HR Information
Systems (HRIS)
A Century of Evolution in the Function
Labor Employee Personnel Human Organizational Relations Relations Resources Effectiveness
HR Continues to Evolve
HR as
Business
Partner
Benefits
Safety &
Workers’
Compensation
Staffing
Training &
Development
Culture
& Image
EEO/AA
Talent
Management

14
Uniting the silos

15
Higher-performing organizations (HPO) are
more effective at managing talent
Overall, to what extent is your organization
managing talent effectively?

16
What do HPOs include in talent management?

17
“It’s the manager’s responsibility
to manage the relationship with
each one of his or her employees.
HR is there to help managers be
the best managers of people they
can be.”
HR Must Help Managers Be Better
Karla Gehlen
EVP of HR

18
271 participants took the entire survey
175 were from organizations with 1,000 or more employees
Note: The data presented in this deck only represents this population; responses from companies below 1,000 employees were filtered out
145 were from Global or Multinational organizations
About the Survey

19
MPI: the extent to which various TM
practices and activities correlate (influence) market performance (market share, profitability, revenue growth, customer satisfaction)
Description of Correlations
Integration: the extent to which line managers’ involvement correlates
with the Design, Development and Execution of TM practices and activities
• Design and Develop: Correlation with line managers’ involvement
with only the Design and Development of TM activities
• Execution: Correlation with line managers’ involvement with only the
Execution of TM activities
20
Core Findings

21
High-performing companies are more than twice as likely to say that frontline managers are involved as partners in the design, development and execution of TM processes and services.
Line Manager Involvement in TM

22
Line Manager involvement in the Design, Development and
Execution of TM is highly correlated with Market Performance
0
10
20
30
40
50
60
Execution
Design & Development
22% 22%
52%
44%
Low Market Performers High Market Performers

23
Integration is the key
0 10 20 30 40 50 60 70
Our TM functions are plannedand executed as part of a single
overall TM strategy
Our TM strategies are createdto be an integral component of
enterprise-level businessstrategies
44%
52%
48%
65%
High Market Performers Low Market Performers

24
Unclear expectations
Not enough bandwidth
Lack of training
Lack of support from HR
Lack of accountability/metrics
Lack of incentives/rewards
Common Barriers to Involvement

25
Positioning Talent Management
010
20
30
40
50
60
70
80
Our TM strategy is abusiness issue, not just
an HR issue.Our TM strategy
ensures that we willhave the right people inplace to execute future
business strategy.
57%
36%
72%
58%
Low Market Performers High Market Performers
26
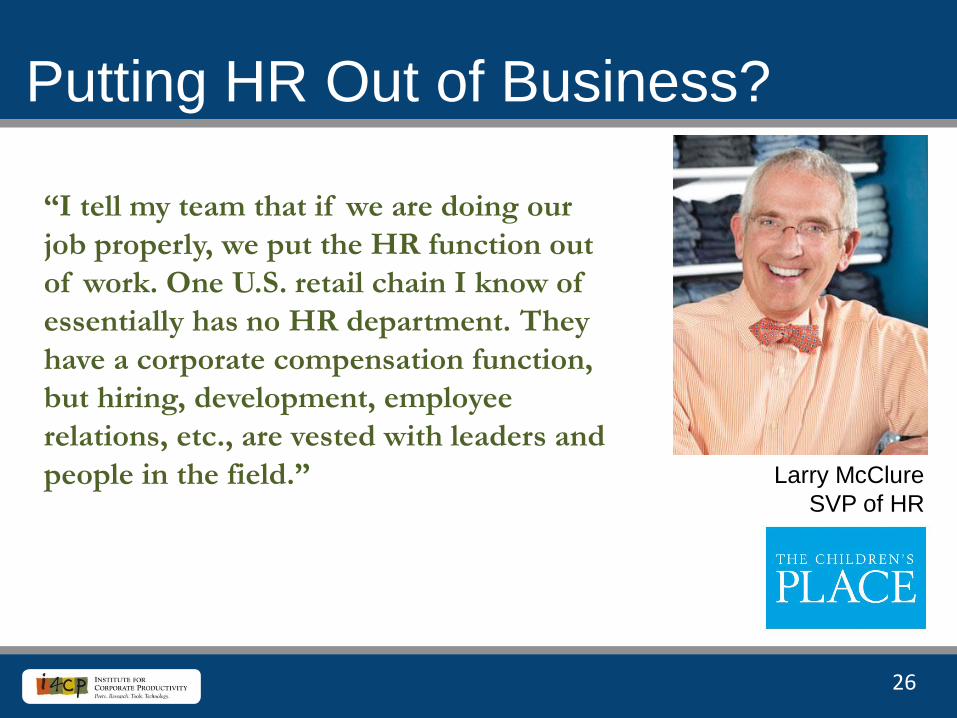
“I tell my team that if we are doing our
job properly, we put the HR function out
of work. One U.S. retail chain I know of
essentially has no HR department. They
have a corporate compensation function,
but hiring, development, employee
relations, etc., are vested with leaders and
people in the field.”
Putting HR Out of Business?
Larry McClure
SVP of HR

27
How Important is Mgr. Involvement?
57
62 62
81 81
73
82 82
87
91
50
60
70
80
90
Learning andtraining
High-potentialemployee
development
Leadershipdevelopment
Employeeengagement
Performancemanagement
Low Market Performers High Market Performers

28
There is a high correlation with market performance
when line managers are involved in 5 TM practices…
29
43
14 14 14
40
49
27
42
27
0
10
20
30
40
50
60
Learning andtraining
Employeeengagement
High-potentialemployee
development
Leadershipdevelopment
Career/employeedevelopment
Low Market Performers High Market Performers
1. Learning and training
2. Employee
engagement
3. High-potential
employee
development
4. Leadership
development
5. Career/employee
development

29
…but not these two
0
10
20
30
40
50
60
70
80
Compensation &Rewards Recruitment &
Selection
33
71
27
60
Low Market Performers High Market Performers
30
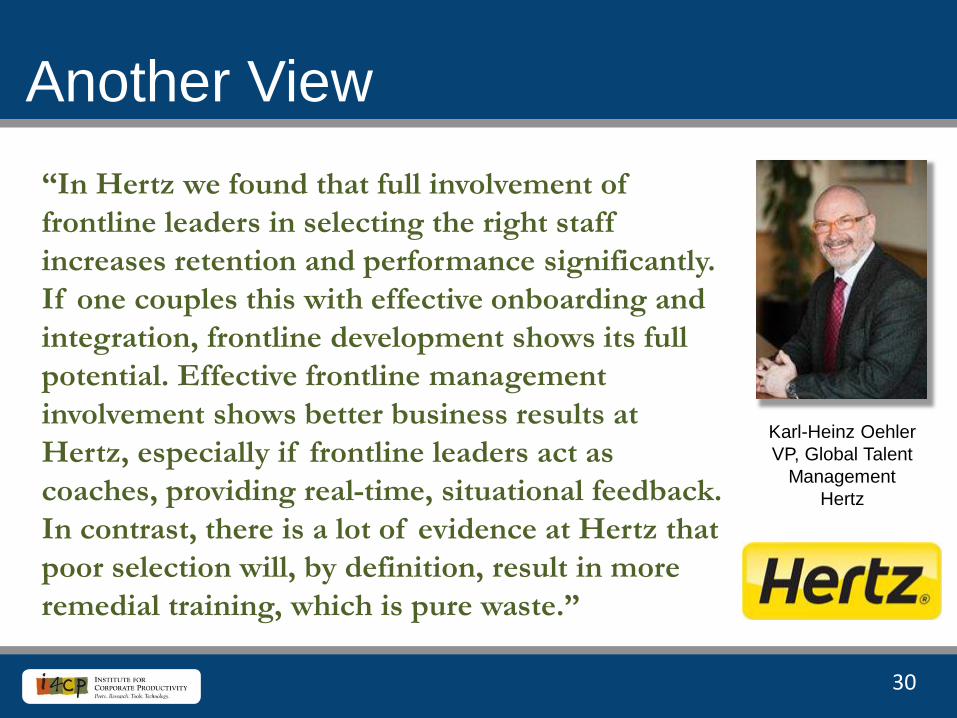
Another View
“In Hertz we found that full involvement of
frontline leaders in selecting the right staff
increases retention and performance significantly.
If one couples this with effective onboarding and
integration, frontline development shows its full
potential. Effective frontline management
involvement shows better business results at
Hertz, especially if frontline leaders act as
coaches, providing real-time, situational feedback.
In contrast, there is a lot of evidence at Hertz that
poor selection will, by definition, result in more
remedial training, which is pure waste.”
Karl-Heinz Oehler
VP, Global Talent
Management
Hertz

31
1. Conducting review of current talent utilization
2. Indentifying short and long term needs based on an understanding of the business strategy
3. Working with HR to manage and identify resource needs
4. Indentify future leaders within their part of the organization
5. Arrange for one-on-one coaching or mentoring 6. Maintaining data that can be used to inform staffing decisions
for key roles 7. Indentify critical succession issues or needs 8. Accept or release employees for development assignments
Specific areas of mgr. involvement that are correlated
with high performance organizations

32
“A raised bar for future business
partners will mean that those
professionals understand they must
engage managers differently,
asking such questions as, “can we
talk about what your business will
look like five years from now, what
effect will that have on the talent
you need and the skills they’ll
need? Let’s have a conversation
about where you’re going.”
Strategic Workforce Planning
EVP of HR
Financial Industry

33
Workforce Planning
0
5
10
15
20
25
30
35
40
45
50
Our workforce planning isdriven primarily by long-term business strategy,
not by short-termdemands for talent.
There is sufficientdialogue between HR/TM
and business leadersduring our strategicplanning process.
We have adequateability/resources withinour HR/TM organization
to link workforce planningwith business strategy.
14% 21%
21%
44%
42% 50%
Low Market Performers High Market Performers

35
“When we think of talent management
responsibilities for our frontline
managers, we primarily think of
employee engagement, retention,
attraction, reducing turnover, and
trying to provide a better work
environment.”
Case Study
Paul Humphries
EVP of HR

36
Global electronics manufacturer
More than 200,000 employees worldwide
Majority of employees are hourly manufacturing employees, such as operators, technicians, materials handlers
Frontline Manager Challenge: Engage and Retain Workers
Case Study

37
The Capability Acceleration Program:
Identified ten critical jobs in the organization and the necessary skills and competencies
Frontline managers determine the best ways to develop those skills – whether through online learning, classroom learning, or projects and assignments
Humphries says, “… through training, the cream does rise to the top”
Case Study

38
Counseling and services for frontline workers: Majority of Flextronics employees are hourly workers in lower-cost
regions (China, Brazil, Malaysia, Mexico, and Eastern Europe)
Reside in company-managed dormitories away from their families, and face a degree of monotony in their work
Related social, financial & quality-of-life issues affect performance
Supervisors are involved in developing counseling programs and providing related services to help reduce turnover and improve recruitment
These support services include online learning, self-improvement classes, Internet cafes, psychological counseling, talent shows and intramural sports
Case Study
39
Process Improvement Efforts: Hourly employees are involved in many Lean Sigma and Six Sigma
process-improvement efforts designed to reduce lead time, improve quality, and reduce non-value activities
Frontline supervisors are trained to manage in a more collaborative way through effective one-on-one conversations, group discussions, and problem-solving
Says Humphries, “We’ve been missing an opportunity to get the involvement of the direct employees. It’s a huge population, and it can create a real differentiator. If our employees can find ways to each save just one dollar a day, we can save around $60 to $70 million a year.”
Case Study

40
“If you look at every other
function that sits at the
executive table – whether it’s
sales, finance, marketing,
operations, etc. – they’ve done
a great job at using data
analysis to help run their
functions and justify their
approaches.”
The Importance of Data Analysis
Charles Piscitello
SVP and Chief People Officer

41
Next Practice?
0
5
10
15
20
25
We measure the impact ofinvestments in TM
services on businessmeasures
17% 25%
Low Market Performers High Market Performers

42
Highest Correlation in Study (.37)
0
10
20
30
40
50
60
We track key performanceindicators, as well as results, for all
of our TM processes.
14%
50%
Low Market Performers High Market Performers
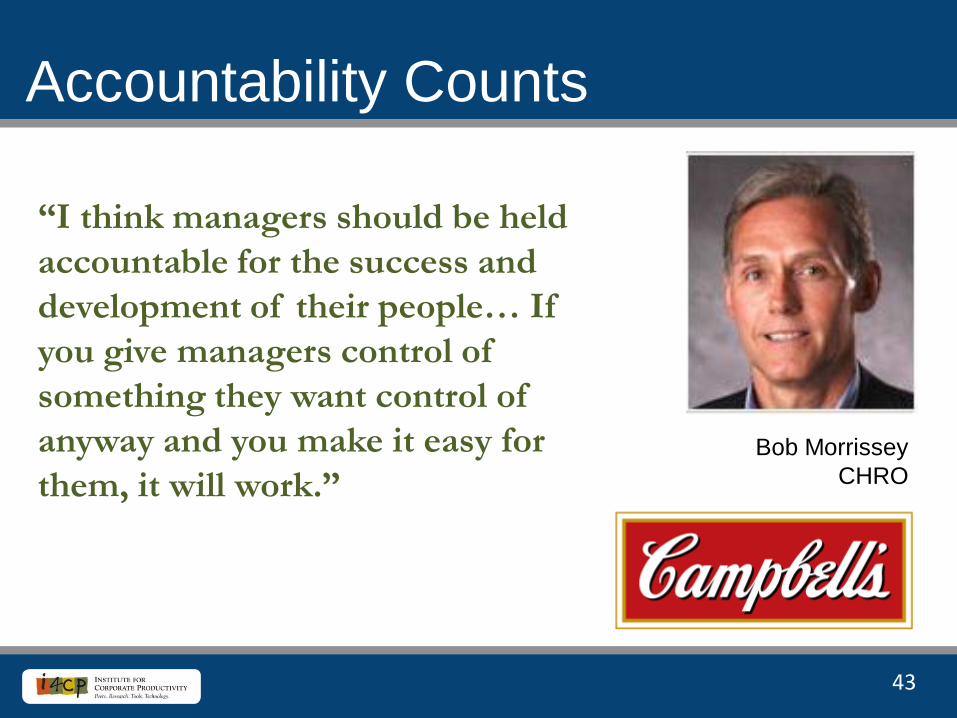
43
“I think managers should be held
accountable for the success and
development of their people… If
you give managers control of
something they want control of
anyway and you make it easy for
them, it will work.”
Accountability Counts
Bob Morrissey
CHRO

44
Measurement Matters
010
2030
4050
60
We integrate both human capital metrics with businessmetrics to demonstrate the effective alignment between
TM functions and the strategies of the enterprise.
TM metrics are used for strategic business planningpurposes.
We employ human capital analytics to help answerspecific business-related questions.
Senior levels of management regularly review TMmetrics.
7%
14%
14%
29%
36%
36%
39%
56%
High Market Performers Low Market Performers

46
“The HR function provides a lot
of data but not information.
You’ve got to be able to provide
data, but also to tell people how
to use it to make educated
decisions. That’s information.
Business leaders want
information – they don’t want
more data.”
Lot of Data. Not Much Information.
Skip Spriggs
CHRO

47
Today vs. 5 Years From Now
Effectiveness Metrics: When HR translates data
into meaning, business results emerge
Currently
effective at doing
Expected effectiveness
in 5 years
Connecting human capital practices to organizational
performance 24% 55%
Identifying where talent has the greatest potential for strategic
impact 27% 60%
Supporting organizational change efforts 35% 66%
Contributing to decisions about business strategy and human
capital management 32% 61%
Using advanced data analysis and statistics 22% 56%
Providing high-quality (complete, timely, accessible) talent
measurements 27% 59%

48
“The ability to look at data and
determine what it reveals is an
amazing skill. It makes work
more interesting and creates
greater impact when you can
tell an effective story. Taking
complexity and making sense
of it is such a value.”
Storytelling is Critical
SVP of HR
Entertainment Industry

49
Lower-performers are often more likely to measure
tactical recruiting metrics than higher-performers
56%
50%
56%
82%
68%
45%
46%
57%
66%
59%
0% 10% 20% 30% 40% 50% 60% 70% 80% 90%
Percent of offers accepted
Acceptance rate of first offers
Cost to fill
Hiring cycle time
Number of recruiter requests
High Market Performers
Low Market Performers

50
Higher-performers are more likely to measure quality
of recruiting efforts than lower-performers
15%
19%
39%
43%
26%
61%
0% 10% 20% 30% 40% 50% 60% 70%
Employee referral rates by specific
segment
Cycle time to competency or full
productivity
Employee referral rates
High Market Performers
Low Market Performers
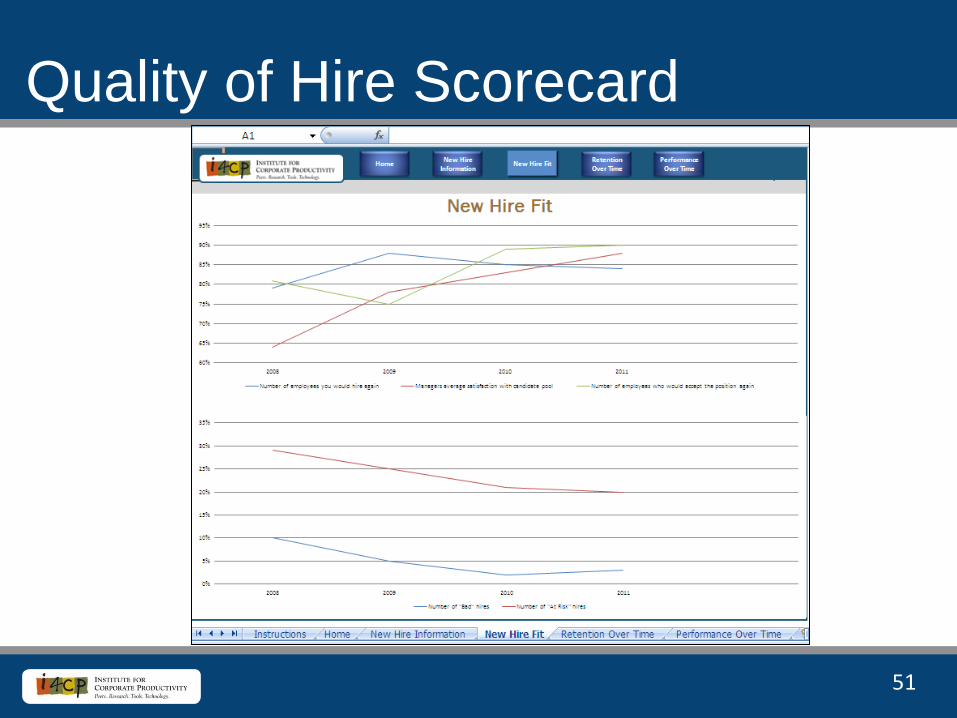
51
Quality of Hire Scorecard

52
53
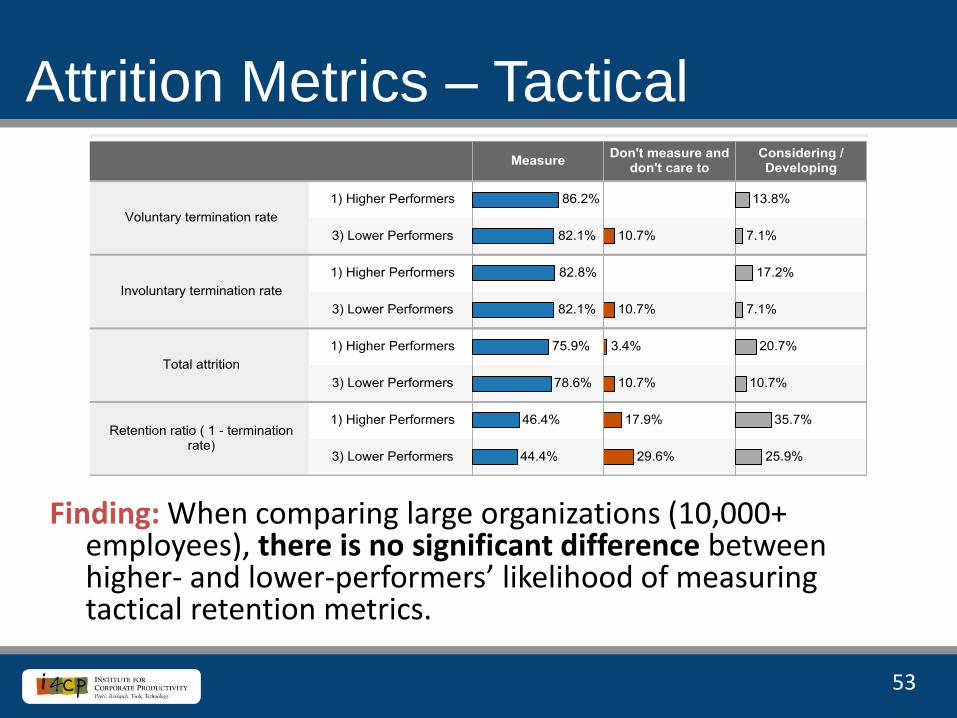
Attrition Metrics – Tactical
Finding: When comparing large organizations (10,000+ employees), there is no significant difference between higher- and lower-performers’ likelihood of measuring tactical retention metrics.

54
Attrition Metrics – Strategic
Finding: When comparing large organizations (10,000+ employees) higher-performers are more likely to measure who is leaving the organization than lower performers.

55
Quality of Attrition Scorecard

56
Quality of Attrition Scorecard

58
Promotion Rate
Promotion Rate is defined as a change in job code and an increase in salary in the HRIS system of record including progression promotions, internal hires, development assignments

59
Internal Placement Rate
Internal Hire is defined as a current employee is selected for a role that was posted on an external job board

60
Quality of Movement Scorecard

61
How does our organization’s partnership between the business and the talent management function compare to the data in the survey?
How are we holding managers at all levels accountable for their roles in TM?
How are managers rewarded for these roles?
What metrics clearly show the impact of talent management on the business?
What’s in the way of engaging line managers in key talent management processes and activities?
Questions to get started…

62

63
411 First Avenue South , Suite 403
Seattle, WA, U.S.A. 98104
866-375-i4cp (4427)
For More Information: [email protected]
206.357.7667
© 2012 Institute for Corporate Productivity, Inc. Member companies may reproduce and distribute this file on an unlimited basis
to their employees for internal management purposes only. Nonemployees (including outside consultants) may not be given
copies of or access to i4cp’s reports, online services or conference materials.

64
Appendix:
Data Tables
65
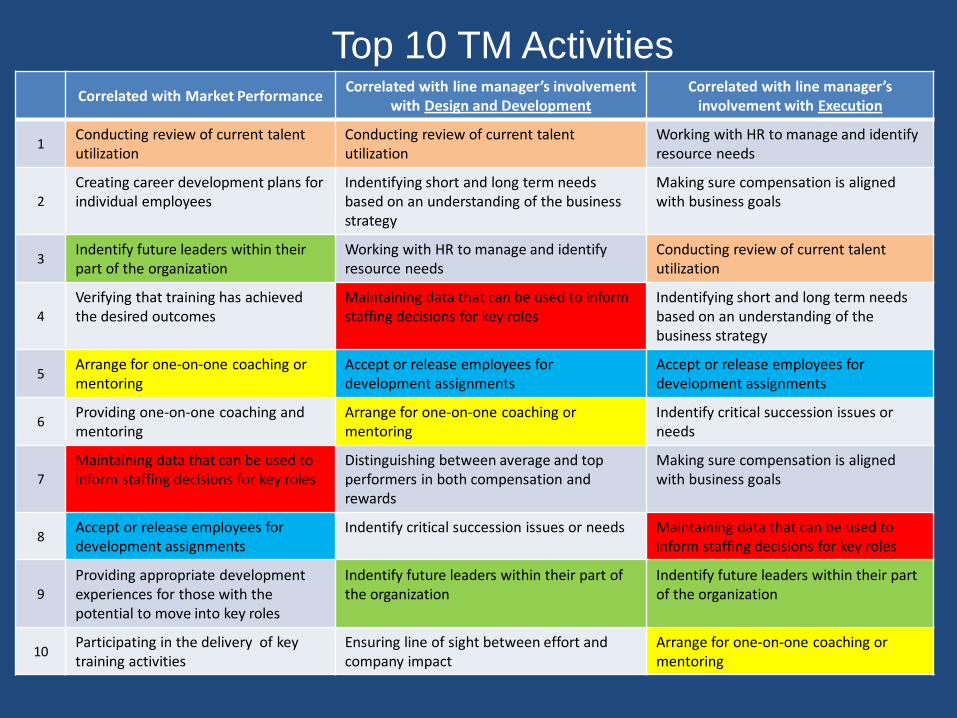
Correlated with Market Performance Correlated with line manager’s involvement
with Design and Development Correlated with line manager’s
involvement with Execution
1 Conducting review of current talent utilization
Conducting review of current talent utilization
Working with HR to manage and identify resource needs
2
Creating career development plans for individual employees
Indentifying short and long term needs based on an understanding of the business strategy
Making sure compensation is aligned with business goals
3 Indentify future leaders within their part of the organization
Working with HR to manage and identify resource needs
Conducting review of current talent utilization
4
Verifying that training has achieved the desired outcomes
Maintaining data that can be used to inform staffing decisions for key roles
Indentifying short and long term needs based on an understanding of the business strategy
5 Arrange for one-on-one coaching or mentoring
Accept or release employees for development assignments
Accept or release employees for development assignments
6 Providing one-on-one coaching and mentoring
Arrange for one-on-one coaching or mentoring
Indentify critical succession issues or needs
7
Maintaining data that can be used to inform staffing decisions for key roles
Distinguishing between average and top performers in both compensation and rewards
Making sure compensation is aligned with business goals
8 Accept or release employees for development assignments
Indentify critical succession issues or needs Maintaining data that can be used to inform staffing decisions for key roles
9
Providing appropriate development experiences for those with the potential to move into key roles
Indentify future leaders within their part of the organization
Indentify future leaders within their part of the organization
10 Participating in the delivery of key training activities
Ensuring line of sight between effort and company impact
Arrange for one-on-one coaching or mentoring
Top 10 TM Activities

66
Involvement of line managers in various workforce planning
activities: Does and Should
80.0
13.3
84.6
38.5
0.0 20.0 40.0 60.0 80.0 100.0
Should
Does
High Market Performers Low Market Performers
Working with HR to manage and identify
resource needs
Corr. With MPI
Corr. With Integration
Corr. With Design and
Develop
Corr. With Execution
.15 .45 .37 .47
HR Professionals Non-HR Professionals
87.0
34.8
0.0 20.0 40.0 60.0 80.0 100.0
Should
Does
72.7
18.2
0.0 20.0 40.0 60.0 80.0
Should
Does

67
Involvement of line managers in various workforce planning
activities: Does and Should
73.3
6.7
89.7
28.2
0.0 20.0 40.0 60.0 80.0 100.0
Should
Does
High Market Performers Low Market Performers
Conducting review of current talent
utilization
Corr. With MPI
Corr. With Integration
Corr. With Design and
Develop
Corr. With Execution
.24 .45 .45 .39
80.0
21.7
0.0 20.0 40.0 60.0 80.0 100.0
Should
Does
81.8
22.7
0.0 20.0 40.0 60.0 80.0 100.0
Should
Does
HR Professionals Non-HR Professionals

68
Involvement of line managers in various workforce planning
activities: Does and Should
60.0
13.3
82.1
25.6
0.0 20.0 40.0 60.0 80.0 100.0
Should
Does
High Market Performers Low Market Performers
Indentifying short and long term needs based on an understanding of the business strategy
Corr. With MPI
Corr. With Integration
Corr. With Design and
Develop
Corr. With Execution
.11 .41 .39 .38
HR Professionals Non-HR Professionals
73.9
21.7
0.0 20.0 40.0 60.0 80.0
Should
Does
77.7
36.4
0.0 20.0 40.0 60.0 80.0 100.0
Should
Does
69
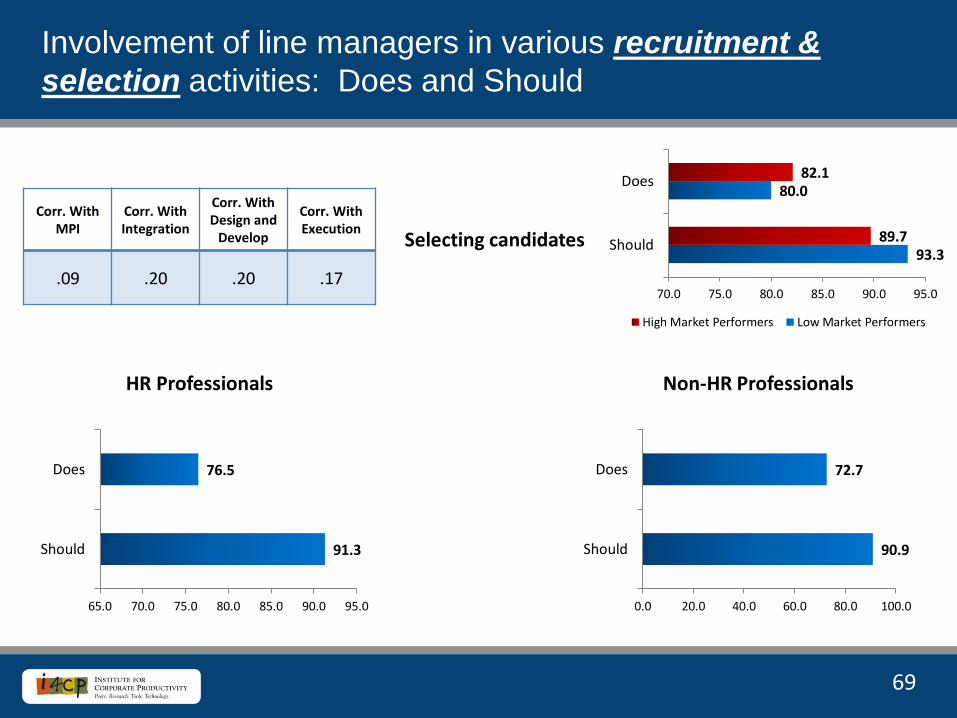
Involvement of line managers in various recruitment &
selection activities: Does and Should
93.3
80.0
89.7
82.1
70.0 75.0 80.0 85.0 90.0 95.0
Should
Does
High Market Performers Low Market Performers
Selecting candidates
Corr. With MPI
Corr. With Integration
Corr. With Design and
Develop
Corr. With Execution
.09 .20 .20 .17
HR Professionals Non-HR Professionals
91.3
76.5
65.0 70.0 75.0 80.0 85.0 90.0 95.0
Should
Does
90.9
72.7
0.0 20.0 40.0 60.0 80.0 100.0
Should
Does
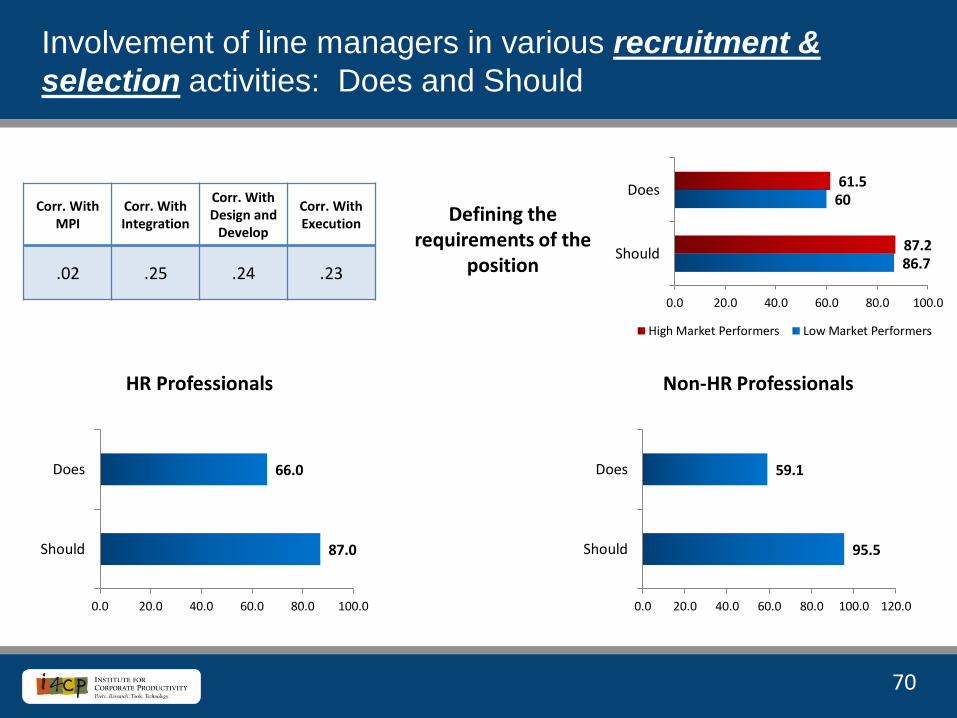
70
Involvement of line managers in various recruitment &
selection activities: Does and Should
86.7
60
87.2
61.5
0.0 20.0 40.0 60.0 80.0 100.0
Should
Does
High Market Performers Low Market Performers
Defining the requirements of the
position
Corr. With MPI
Corr. With Integration
Corr. With Design and
Develop
Corr. With Execution
.02 .25 .24 .23
HR Professionals
87.0
66.0
0.0 20.0 40.0 60.0 80.0 100.0
Should
Does
95.5
59.1
0.0 20.0 40.0 60.0 80.0 100.0 120.0
Should
Does
Non-HR Professionals

71
Involvement of line managers in various recruitment &
selection activities: Does and Should
40.0
13.3
35.9
17.9
0.0 10.0 20.0 30.0 40.0 50.0
Should
Does
High Market Performers Low Market Performers
Sourcing candidates
Corr. With MPI
Corr. With Integration
Corr. With Design and
Develop
Corr. With Execution
.09 .20 .20 .17
HR Professionals Non-HR Professionals
33.0
10.4
0.0 10.0 20.0 30.0 40.0
Should
Does
50.0
40.9
0.0 10.0 20.0 30.0 40.0 50.0 60.0
Should
Does

72
Involvement of line managers in various performance
management activities: Does and Should
66.7
26.7
89.7
53.8
0.0 20.0 40.0 60.0 80.0 100.0
Should
Does
High Market Performers Low Market Performers
Collecting data for performance evaluations
Corr. With MPI
Corr. With Integration
Corr. With Design and
Develop
Corr. With Execution
.17 .24 .22 .24
HR Professionals Non-HR Professionals
88.7
52.2
0.0 20.0 40.0 60.0 80.0 100.0
Should
Does
77.3
63.6
0.0 20.0 40.0 60.0 80.0 100.0
Should
Does
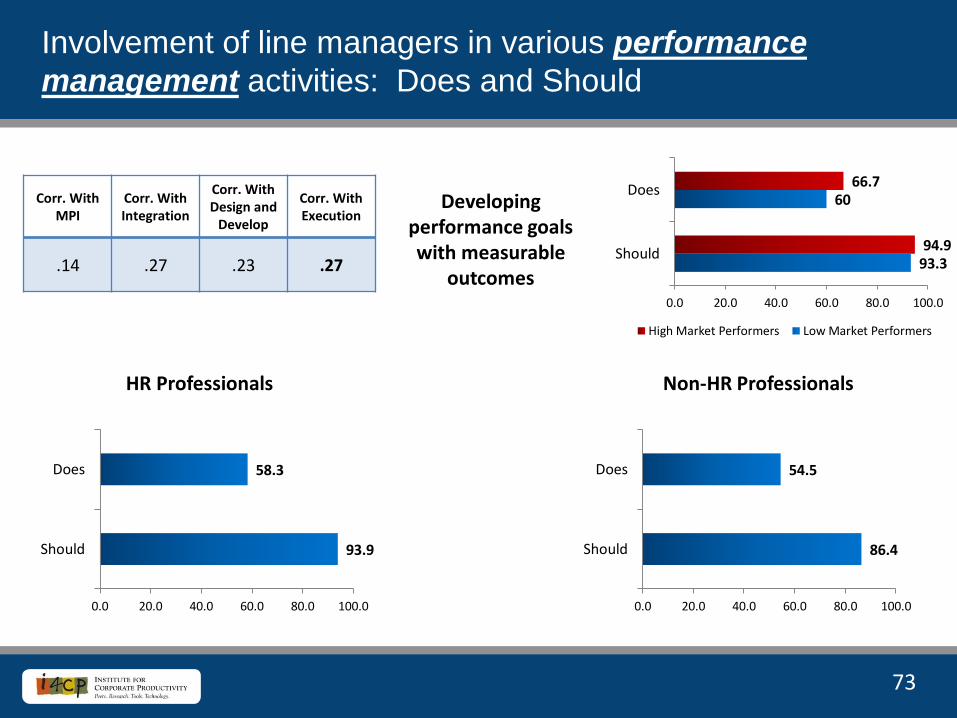
73
Involvement of line managers in various performance
management activities: Does and Should
93.3
60
94.9
66.7
0.0 20.0 40.0 60.0 80.0 100.0
Should
Does
High Market Performers Low Market Performers
Developing performance goals with measurable
outcomes
Corr. With MPI
Corr. With Integration
Corr. With Design and
Develop
Corr. With Execution
.14 .27 .23 .27
HR Professionals Non-HR Professionals
93.9
58.3
0.0 20.0 40.0 60.0 80.0 100.0
Should
Does
86.4
54.5
0.0 20.0 40.0 60.0 80.0 100.0
Should
Does

74
Involvement of line managers in various performance
management activities: Does and Should
93.3
66.7
100.0
82.1
0.0 20.0 40.0 60.0 80.0 100.0 120.0
Should
Does
High Market Performers Low Market Performers
Conducting performance reviews
Corr. With MPI
Corr. With Integration
Corr. With Design and
Develop
Corr. With Execution
.06 .15 .08 .20
HR Professionals Non-HR Professionals
98.3
82.6
70.0 75.0 80.0 85.0 90.0 95.0 100.0
Should
Does
86.4
81.8
78.0 80.0 82.0 84.0 86.0 88.0
Should
Does
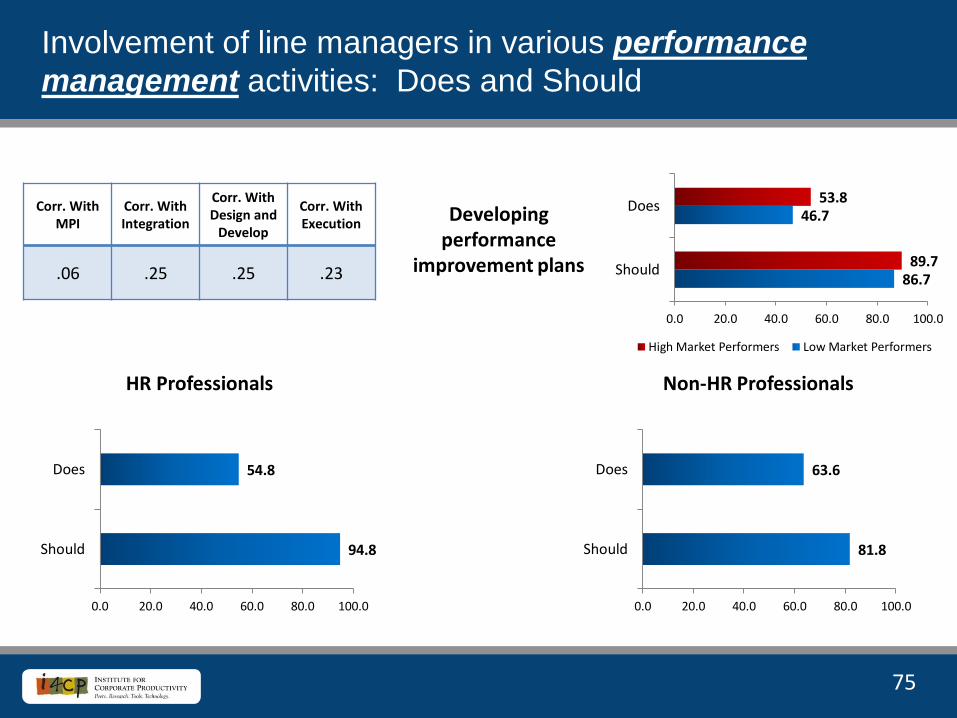
75
Involvement of line managers in various performance
management activities: Does and Should
86.7
46.7
89.7
53.8
0.0 20.0 40.0 60.0 80.0 100.0
Should
Does
High Market Performers Low Market Performers
Developing performance
improvement plans
Corr. With MPI
Corr. With Integration
Corr. With Design and
Develop
Corr. With Execution
.06 .25 .25 .23
HR Professionals Non-HR Professionals
94.8
54.8
0.0 20.0 40.0 60.0 80.0 100.0
Should
Does
81.8
63.6
0.0 20.0 40.0 60.0 80.0 100.0
Should
Does

76
Involvement of line managers in various career/employee
development activities: Does and Should
57.1
21.4
75.7
27
0.0 20.0 40.0 60.0 80.0
Should
Does
High Market Performers Low Market Performers
Creating career development plans for individual employees
Corr. With MPI
Corr. With Integration
Corr. With Design and
Develop
Corr. With Execution
.24 .28 .30 .23
HR Professionals Non-HR Professionals
69.7
17.4
0.0 20.0 40.0 60.0 80.0
Should
Does
55.0
25
0.0 10.0 20.0 30.0 40.0 50.0 60.0
Should
Does

77
Involvement of line managers in various career/employee
development activities: Does and Should
85.7
21.4
94.6
37.8
0.0 20.0 40.0 60.0 80.0 100.0
Should
Does
High Market Performers Low Market Performers
Providing one-on-one coaching and
mentoring
Corr. With MPI
Corr. With Integration
Corr. With Design and
Develop
Corr. With Execution
.21 .29 .30 .24
HR Professionals Non-HR Professionals
91.7
19.3
0.0 20.0 40.0 60.0 80.0 100.0
Should
Does
88.0
55
0.0 20.0 40.0 60.0 80.0 100.0
Should
Does

78
Involvement of line managers in various career/employee
development activities: Does and Should
78.6
21.4
89.2
29.7
0.0 20.0 40.0 60.0 80.0 100.0
Should
Does
High Market Performers Low Market Performers
Monitoring progress of individual development plans (more than once
or twice a years at performance appraisals)
Corr. With MPI
Corr. With Integration
Corr. With Design and
Develop
Corr. With Execution
.16 .27 .30 .22
HR Professionals Non-HR Professionals
89.0
16.5
0.0 20.0 40.0 60.0 80.0 100.0
Should
Does
80.0
45.0
0.0 20.0 40.0 60.0 80.0 100.0
Should
Does
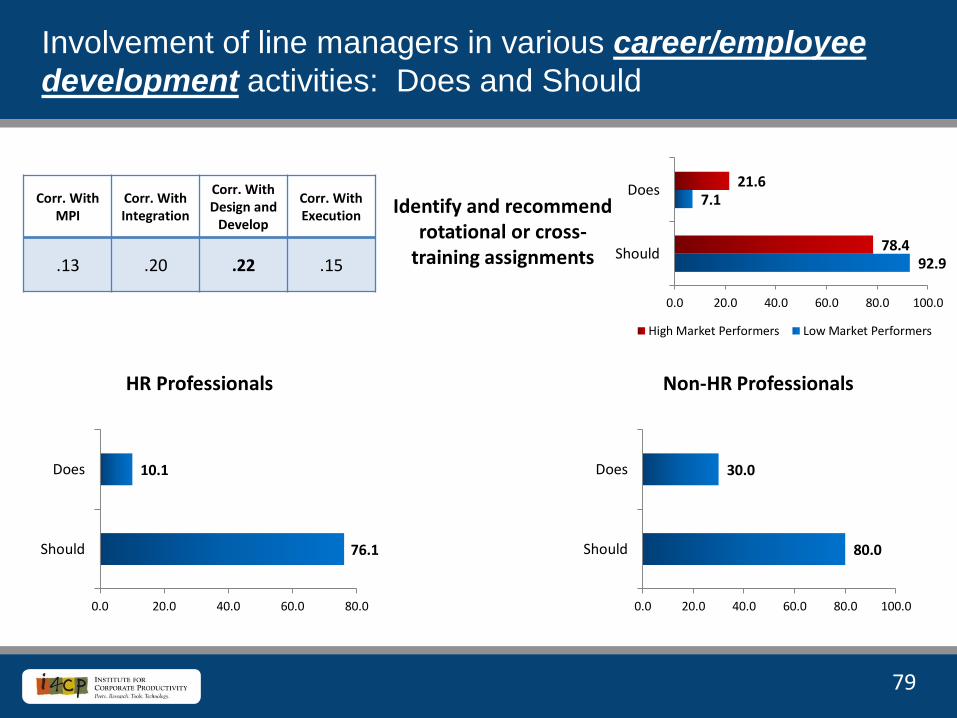
79
Involvement of line managers in various career/employee
development activities: Does and Should
92.9
7.1
78.4
21.6
0.0 20.0 40.0 60.0 80.0 100.0
Should
Does
High Market Performers Low Market Performers
Identify and recommend rotational or cross-
training assignments
Corr. With MPI
Corr. With Integration
Corr. With Design and
Develop
Corr. With Execution
.13 .20 .22 .15
HR Professionals Non-HR Professionals
76.1
10.1
0.0 20.0 40.0 60.0 80.0
Should
Does
80.0
30.0
0.0 20.0 40.0 60.0 80.0 100.0
Should
Does

80
Involvement of line managers in various succession planning
activities: Does and Should
92.9
21.4
91.9
32.4
0.0 20.0 40.0 60.0 80.0 100.0
Should
Does
High Market Performers Low Market Performers
Providing appropriate development
experiences for those with the potential to move into key roles
Corr. With MPI
Corr. With Integration
Corr. With Design and
Develop
Corr. With Execution
.19 .33 .30 .31
HR Professionals Non-HR Professionals
82.6
17.4
0.0 20.0 40.0 60.0 80.0 100.0
Should
Does
75.0
40.0
0.0 20.0 40.0 60.0 80.0
Should
Does
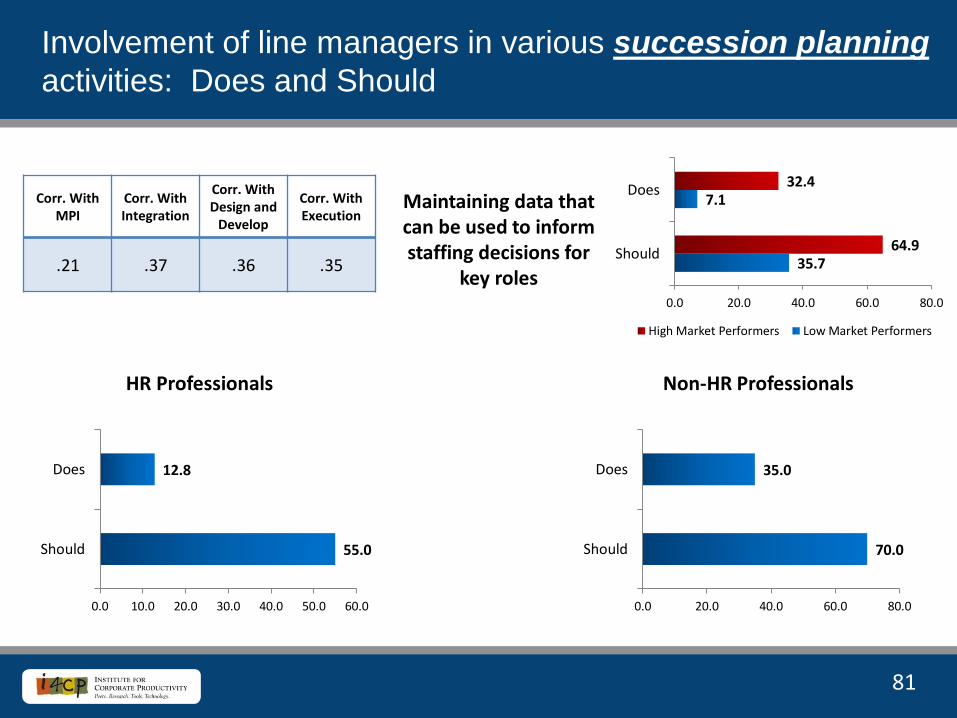
81
Involvement of line managers in various succession planning
activities: Does and Should
35.7
7.1
64.9
32.4
0.0 20.0 40.0 60.0 80.0
Should
Does
High Market Performers Low Market Performers
Maintaining data that can be used to inform staffing decisions for
key roles
Corr. With MPI
Corr. With Integration
Corr. With Design and
Develop
Corr. With Execution
.21 .37 .36 .35
HR Professionals Non-HR Professionals
55.0
12.8
0.0 10.0 20.0 30.0 40.0 50.0 60.0
Should
Does
70.0
35.0
0.0 20.0 40.0 60.0 80.0
Should
Does
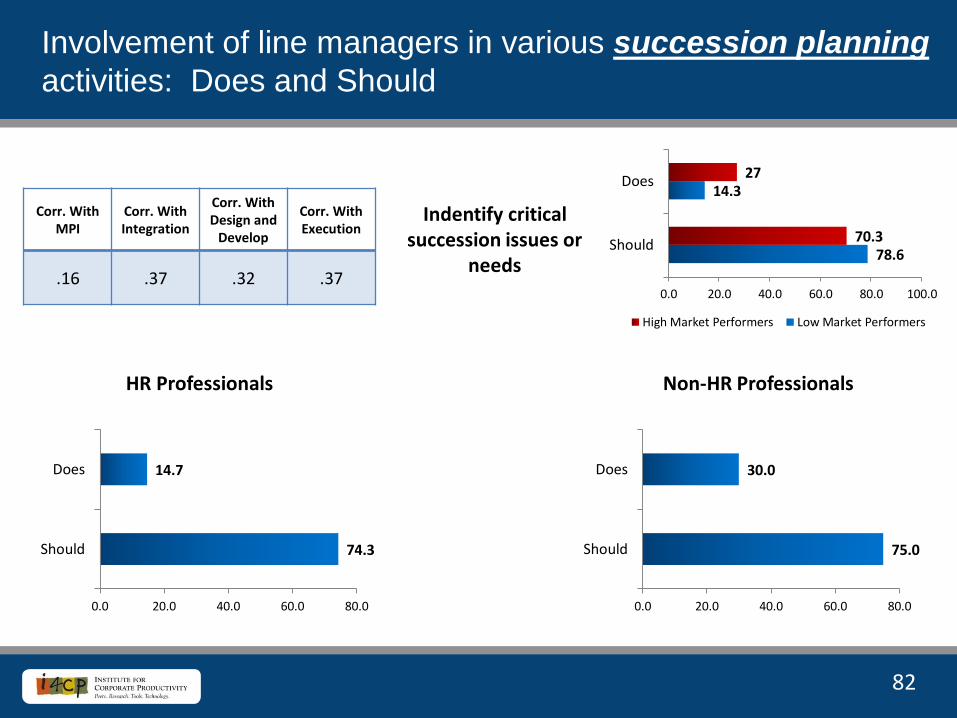
82
Involvement of line managers in various succession planning
activities: Does and Should
78.6
14.3
70.3
27
0.0 20.0 40.0 60.0 80.0 100.0
Should
Does
High Market Performers Low Market Performers
Indentify critical succession issues or
needs
Corr. With MPI
Corr. With Integration
Corr. With Design and
Develop
Corr. With Execution
.16 .37 .32 .37
HR Professionals Non-HR Professionals
74.3
14.7
0.0 20.0 40.0 60.0 80.0
Should
Does
75.0
30.0
0.0 20.0 40.0 60.0 80.0
Should
Does
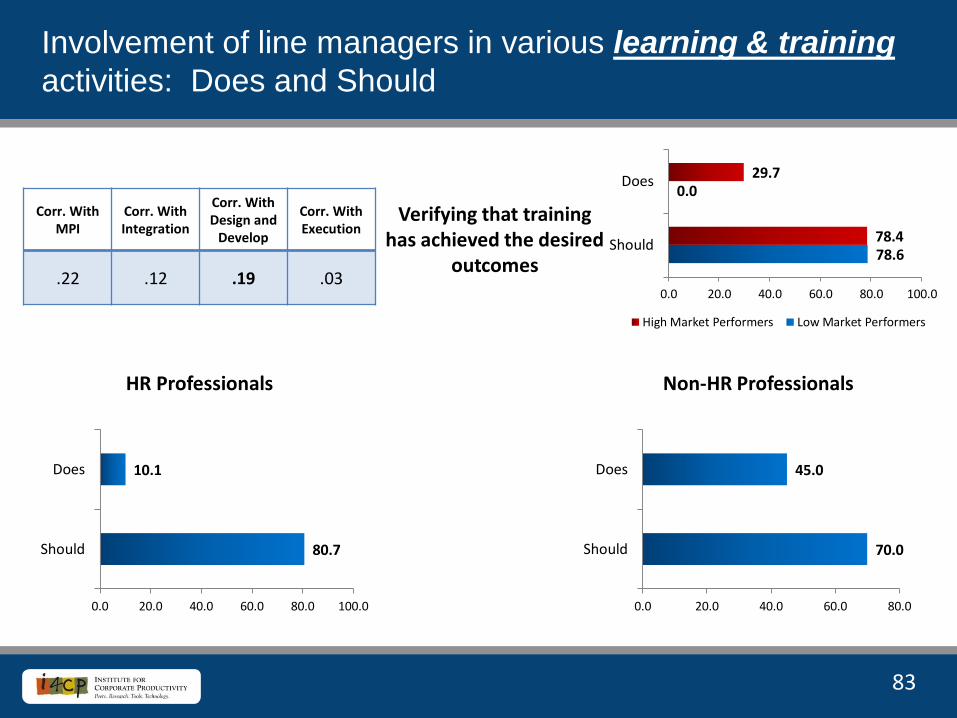
83
Involvement of line managers in various learning & training
activities: Does and Should
78.6
0.0
78.4
29.7
0.0 20.0 40.0 60.0 80.0 100.0
Should
Does
High Market Performers Low Market Performers
Verifying that training has achieved the desired
outcomes
Corr. With MPI
Corr. With Integration
Corr. With Design and
Develop
Corr. With Execution
.22 .12 .19 .03
HR Professionals Non-HR Professionals
80.7
10.1
0.0 20.0 40.0 60.0 80.0 100.0
Should
Does
70.0
45.0
0.0 20.0 40.0 60.0 80.0
Should
Does
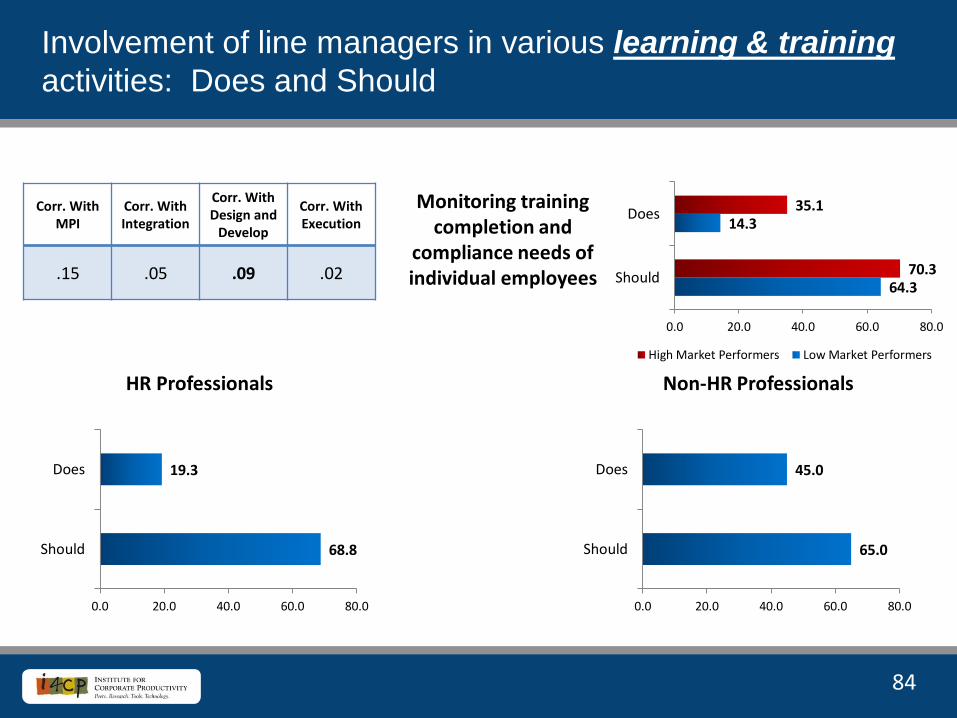
84
Involvement of line managers in various learning & training
activities: Does and Should
64.3
14.3
70.3
35.1
0.0 20.0 40.0 60.0 80.0
Should
Does
High Market Performers Low Market Performers
Monitoring training completion and
compliance needs of individual employees
Corr. With MPI
Corr. With Integration
Corr. With Design and
Develop
Corr. With Execution
.15 .05 .09 .02
HR Professionals Non-HR Professionals
68.8
19.3
0.0 20.0 40.0 60.0 80.0
Should
Does
65.0
45.0
0.0 20.0 40.0 60.0 80.0
Should
Does
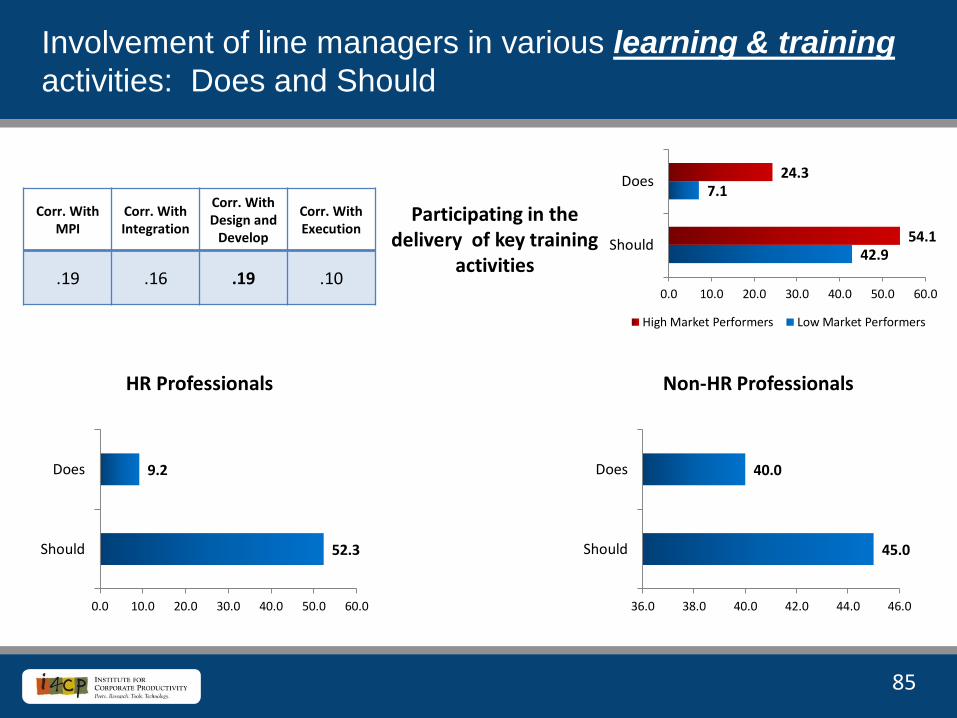
85
Involvement of line managers in various learning & training
activities: Does and Should
42.9
7.1
54.1
24.3
0.0 10.0 20.0 30.0 40.0 50.0 60.0
Should
Does
High Market Performers Low Market Performers
Participating in the delivery of key training
activities
Corr. With MPI
Corr. With Integration
Corr. With Design and
Develop
Corr. With Execution
.19 .16 .19 .10
HR Professionals Non-HR Professionals
52.3
9.2
0.0 10.0 20.0 30.0 40.0 50.0 60.0
Should
Does
45.0
40.0
36.0 38.0 40.0 42.0 44.0 46.0
Should
Does

86
Involvement of line managers in various learning & training
activities: Does and Should
92.9
21.4
75.7
40.5
0.0 20.0 40.0 60.0 80.0 100.0
Should
Does
High Market Performers Low Market Performers
Providing input into training needs
Corr. With MPI
Corr. With Integration
Corr. With Design and
Develop
Corr. With Execution
.12 .02 .02 .02
HR Professionals Non-HR Professionals
80.7
25.7
0.0 20.0 40.0 60.0 80.0 100.0
Should
Does
85.0
40.0
0.0 20.0 40.0 60.0 80.0 100.0
Should
Does

87
Involvement of line managers in various leadership & high-
potential development activities: Does and Should
78.6
28.6
75.7
37.8
0.0 20.0 40.0 60.0 80.0 100.0
Should
Does
High Market Performers Low Market Performers
Accept or release employees for development assignments
Corr. With MPI
Corr. With Integration
Corr. With Design and
Develop
Corr. With Execution
.20 .38 .36 .37
HR Professionals Non-HR Professionals
74.1
27.8
0.0 20.0 40.0 60.0 80.0
Should
Does
90.0
40.0
0.0 20.0 40.0 60.0 80.0 100.0
Should
Does

88
Involvement of line managers in various leadership & high-
potential development activities: Does and Should
71.4
7.1
83.8
35.1
0.0 20.0 40.0 60.0 80.0 100.0
Should
Does
High Market Performers Low Market Performers
Indentify future leaders within their
part of the organization
Corr. With MPI
Corr. With Integration
Corr. With Design and
Develop
Corr. With Execution
.23 .34 .31 .32
HR Professionals Non-HR Professionals
75.0
25.0
0.0 20.0 40.0 60.0 80.0
Should
Does
70.0
30.0
0.0 20.0 40.0 60.0 80.0
Should
Does
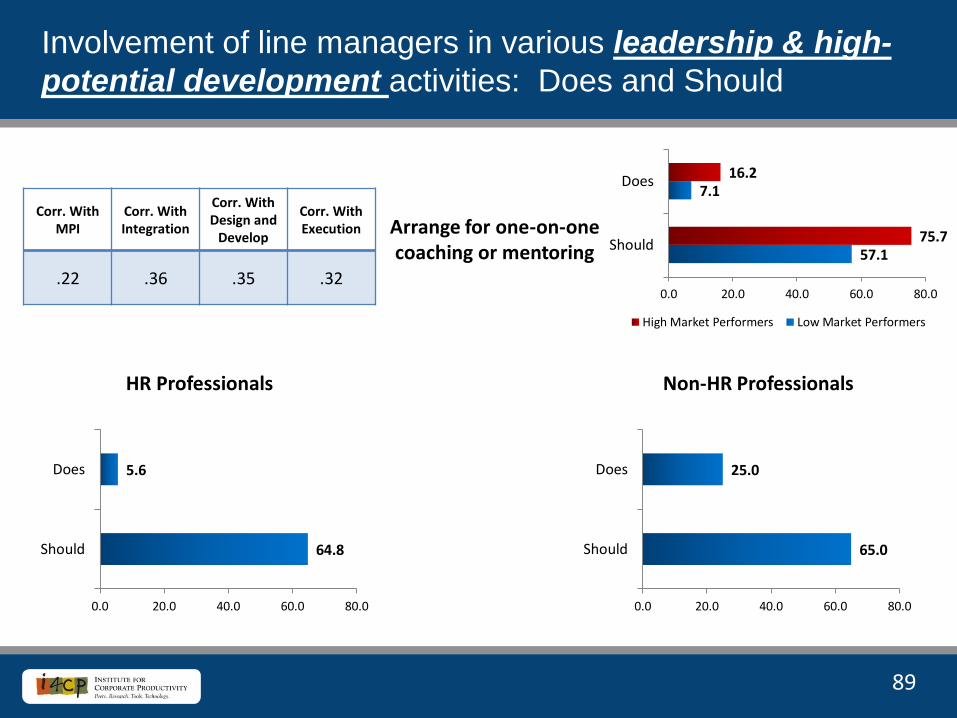
89
Involvement of line managers in various leadership & high-
potential development activities: Does and Should
57.1
7.1
75.7
16.2
0.0 20.0 40.0 60.0 80.0
Should
Does
High Market Performers Low Market Performers
Arrange for one-on-one coaching or mentoring
Corr. With MPI
Corr. With Integration
Corr. With Design and
Develop
Corr. With Execution
.22 .36 .35 .32
HR Professionals Non-HR Professionals
64.8
5.6
0.0 20.0 40.0 60.0 80.0
Should
Does
65.0
25.0
0.0 20.0 40.0 60.0 80.0
Should
Does
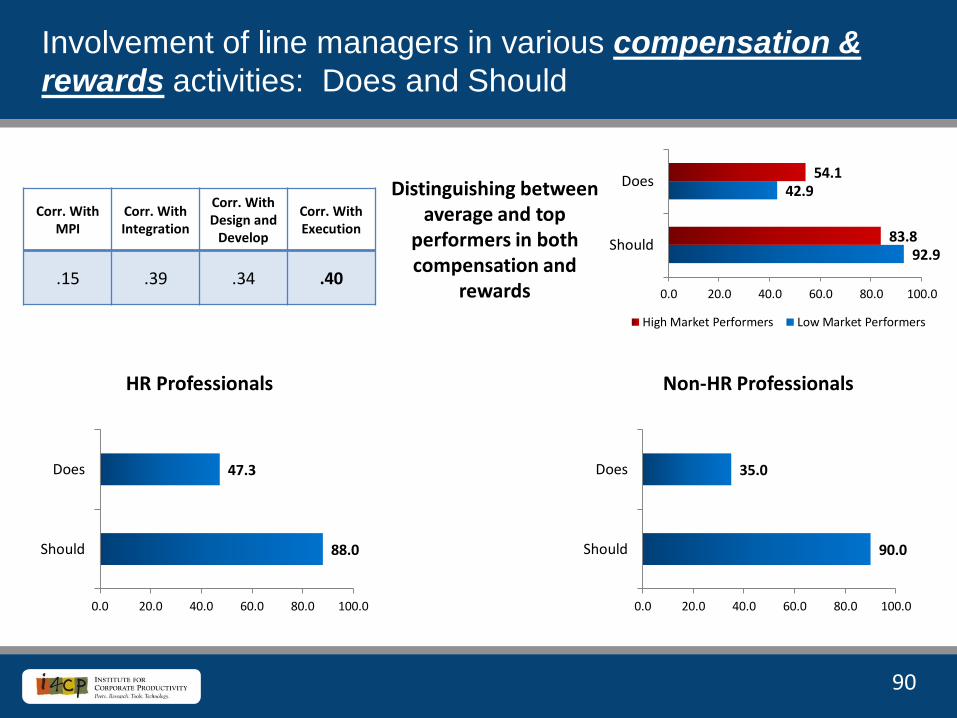
90
Involvement of line managers in various compensation &
rewards activities: Does and Should
92.9
42.9
83.8
54.1
0.0 20.0 40.0 60.0 80.0 100.0
Should
Does
High Market Performers Low Market Performers
Distinguishing between average and top
performers in both compensation and
rewards
Corr. With MPI
Corr. With Integration
Corr. With Design and
Develop
Corr. With Execution
.15 .39 .34 .40
HR Professionals Non-HR Professionals
88.0
47.3
0.0 20.0 40.0 60.0 80.0 100.0
Should
Does
90.0
35.0
0.0 20.0 40.0 60.0 80.0 100.0
Should
Does

91
Involvement of line managers in various compensation &
rewards activities: Does and Should
64.3
21.4
59.5
21.6
0.0 20.0 40.0 60.0 80.0
Should
Does
High Market Performers Low Market Performers
Making sure compensation is aligned
with business goals
Corr. With MPI
Corr. With Integration
Corr. With Design and
Develop
Corr. With Execution
.04 .32 .25 .36
HR Professionals Non-HR Professionals
62.0
18.5
0.0 20.0 40.0 60.0 80.0
Should
Does
80.0
20.0
0.0 20.0 40.0 60.0 80.0 100.0
Should
Does

92
Involvement of line managers in various compensation &
rewards activities: Does and Should
92.9
50
89.2
51.4
0.0 20.0 40.0 60.0 80.0 100.0
Should
Does
High Market Performers Low Market Performers
Providing recognition for good performance
Corr. With MPI
Corr. With Integration
Corr. With Design and
Develop
Corr. With Execution
.03 .29 .22 .32
HR Professionals Non-HR Professionals
92.6
44.4
0.0 20.0 40.0 60.0 80.0 100.0
Should
Does
95.0
45.0
0.0 20.0 40.0 60.0 80.0 100.0
Should
Does

93
Involvement of line managers in various engagement
activities: Does and Should
100.0
35.7
89.2
43.2
0.0 20.0 40.0 60.0 80.0 100.0 120.0
Should
Does
High Market Performers Low Market Performers
Ensuring line of sight between effort and
company impact
Corr. With MPI
Corr. With Integration
Corr. With Design and
Develop
Corr. With Execution
.13 .31 .31 .28
HR Professionals Non-HR Professionals
88.9
30.6
0.0 20.0 40.0 60.0 80.0 100.0
Should
Does
85.0
35.0
0.0 20.0 40.0 60.0 80.0 100.0
Should
Does
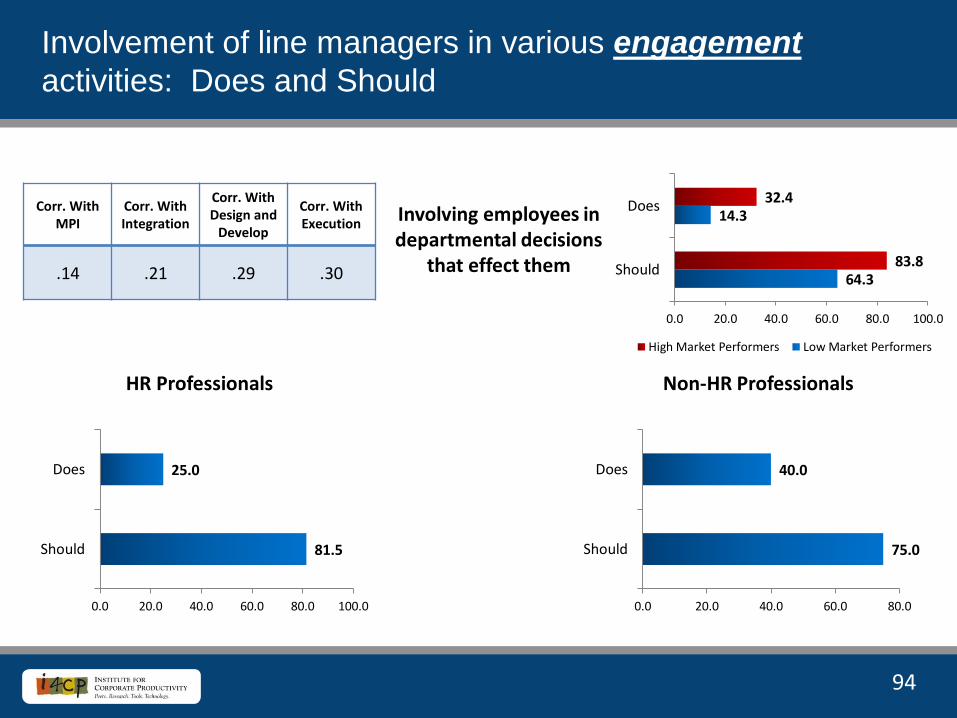
94
Involvement of line managers in various engagement
activities: Does and Should
64.3
14.3
83.8
32.4
0.0 20.0 40.0 60.0 80.0 100.0
Should
Does
High Market Performers Low Market Performers
Involving employees in departmental decisions
that effect them
Corr. With MPI
Corr. With Integration
Corr. With Design and
Develop
Corr. With Execution
.14 .21 .29 .30
HR Professionals Non-HR Professionals
81.5
25.0
0.0 20.0 40.0 60.0 80.0 100.0
Should
Does
75.0
40.0
0.0 20.0 40.0 60.0 80.0
Should
Does
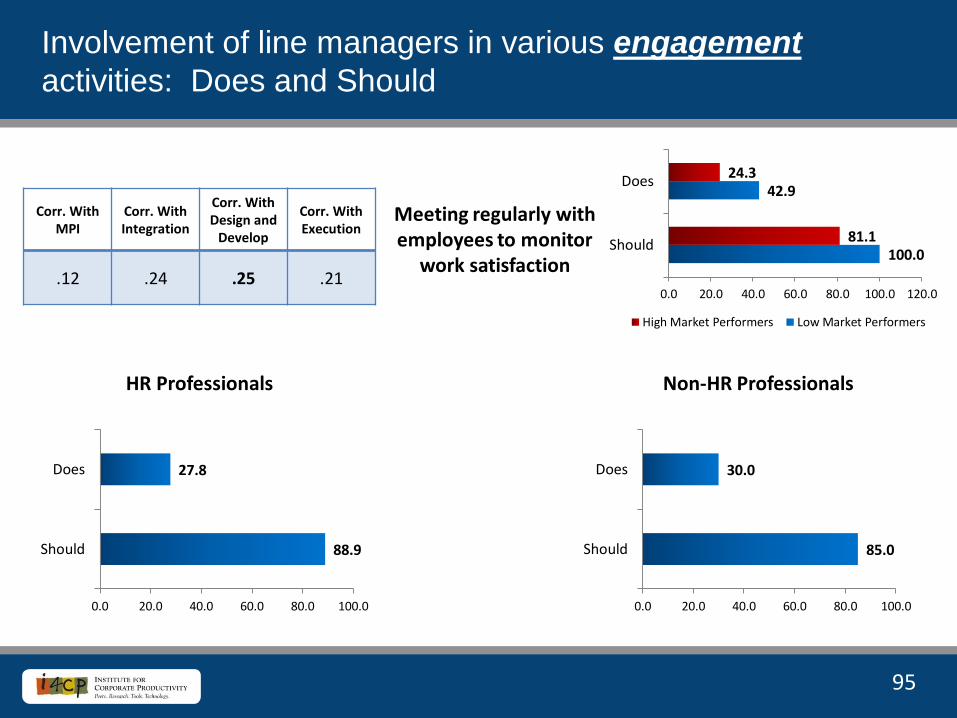
95
Involvement of line managers in various engagement
activities: Does and Should
100.0
42.9
81.1
24.3
0.0 20.0 40.0 60.0 80.0 100.0 120.0
Should
Does
High Market Performers Low Market Performers
Meeting regularly with employees to monitor
work satisfaction
Corr. With MPI
Corr. With Integration
Corr. With Design and
Develop
Corr. With Execution
.12 .24 .25 .21
HR Professionals Non-HR Professionals
88.9
27.8
0.0 20.0 40.0 60.0 80.0 100.0
Should
Does
85.0
30.0
0.0 20.0 40.0 60.0 80.0 100.0
Should
Does

96
Involvement of line managers in various engagement
activities: Does and Should
92.9
21.4
81.1
27
0.0 20.0 40.0 60.0 80.0 100.0
Should
Does
High Market Performers Low Market Performers
Linking the employees interest with work
assignments
Corr. With MPI
Corr. With Integration
Corr. With Design and
Develop
Corr. With Execution
.04 .17 .18 .13
HR Professionals Non-HR Professionals
83.3
24.1
0.0 20.0 40.0 60.0 80.0 100.0
Should
Does
75.0
35.0
0.0 20.0 40.0 60.0 80.0
Should
Does

97
Corporate
411 First Avenue South • Suite 403 • Seattle, WA, U.S.A. 98104
Telephone 866-375-i4cp (4427) • Fax 206-624-6951
Research
8950 Ninth Street North• Suite 115 • St. Petersburg, FL, U.S.A. 33702
Telephone 727-345-2226 • Fax 727-345-1254
www.i4cp.com
For More Information: [email protected]
© 2012 Institute for Corporate Productivity, Inc. Member companies may reproduce and distribute this file on an unlimited basis
to their employees for internal management purposes only. Nonemployees (including outside consultants) may not be given
copies of or access to i4cp’s reports, online services or conference materials.