taking england seriously: the new english...
TRANSCRIPT

1
Taking England Seriously:
The New English Politics
The Future of England Survey 2014
Charlie Jeffery, Richard Wyn Jones,
Ailsa Henderson, Roger Scully and Guy Lodge

2
Taking England Seriously: The New English Politics
The Future of England Survey 2014
Charlie Jeffery, Richard Wyn Jones, Ailsa Henderson, Roger Scully and Guy Lodge1
Contents
1. Introduction . . . . . . . . 3
2. Future of England Survey 2014 . . . . . . 5
3. Englishness and Britishness in England . . . . . 8
4. The Four Pillars of the new English Politics . . . . 11
A. Devo-anxiety and the Scottish Referendum . . . 11
B. England’s Distinctive Euro-scepticism . . . . 14
C. English Attitudes to Immigration . . . . . 16
D. Governing England . . . . . . 17
5. Party Politics in England: UKIP and English Nationalism . . . 26
A. Views of Party Supporters on the Four Pillars . . . 26
B. UKIP as a Party of English Nationalism . . . . 28
6. Conclusion . . . . . . . . . 33
1 Jeffery and Henderson are members of the Centre on Constitutional Change at the University of Edinburgh, Wyn Jones and Scully of the Wales Governance Centre at Cardiff University, and Lodge is Associate Director at the Institute for Public Policy Research in London. All are grateful to Robert Lineira for his support in preparing this report.

3
1. Introduction
Scotland’s big question was resolved on 18 September 2014. Early the next morning David
Cameron opened up the English question, announcing:
I have long believed that a crucial part missing from this national discussion is
England. We have heard the voice of Scotland – and now the millions of voices of
England must also be heard. The question of English votes for English laws – the so-
called West Lothian question – requires a decisive answer.
So, just as the Scottish No vote was to lead to rapid progress to additional devolution for
Scotland, so it also opened up in the Prime Minister’s analysis a pressing need to give people
in England a distinctive voice in how they are governed.
As this report shows the Prime Minister, though he may have been pursuing a tactical line to
isolate Labour on the English issue, has a point. It presents the findings of the third Future of
England Survey carried out in April 2014 following earlier surveys in the summer of 2011
and autumn 2012. The 2014 survey presents further evidence that England has a distinctive
politics that combines a politicisation of English national identity with an increasingly clear
political prospectus, and an increasingly vocal advocate for that prospectus.
The rallying point is an English desire for self-government. Some of that desire is defined by
a continuing sense that Scotland has privileges that are unjustly denied to England. Some
also has to do with a perceived loss of political control due to European integration, which
in policy and practical terms is related to a perceived loss of control over immigration.
But people in England are not just reacting against their ‘others’ in Scotland and the EU.
They are also searching more positively for an institutional recognition of England that can
express their concerns better than the current political system, which submerges the
representation of England within the wider UK’s institutions in Westminster and Whitehall.
From the various alternatives, the most preferred one is English votes on English laws in the
House of Commons.
People in England are also searching for advocates to press their case. They do not readily
see such advocates in the major parties in the House of Commons, even though some
backbenchers, mainly but not exclusively Conservative, do appear to recognise specifically
English concerns. More by default than by design the United Kingdom Independence Party
appears to have become a vessel for those concerns. UKIP’s prominence in 2014 – its victory
in the European Parliament elections in May, the apparent omnipresence of Nigel Farage’s
continuingly cheery and Teflon-coated visage, and the Carswell and Reckless defections
from the Conservative party – has drawn heavily on prevailing sentiment in England.

4
The opportunity is there (despite the ‘UK’ in its title) for UKIP to nurture the English and
their desire for self-government. The big question is whether the other parties will cede that
ground to them, or whether they will, at last, come to take England, the English, and the
way they are governed seriously.

5
2. The Future of England Survey in 2014
The Future of England Survey (FoES) was funded under the Future of the UK and Scotland
programme of the Economic and Social Research Council. Fieldwork was conducted by
YouGov between 11-22 April 2014. The online survey included a sample of 3705 adults (age
18+) in England. For the first time we added samples of 1014 Scottish and 1027 Welsh
respondents to allow us to identity whether views in England were similar to those held by
Scottish and Welsh residents.
Our questions were designed to build on, and explore further, key findings of our earlier
surveys in 2011 and 2012.2 Among the consistent findings in our earlier surveys were:
Deep dissatisfaction among people in England with the way England is governed
through UK-wide institutions in Westminster and Whitehall. No matter how we
asked the question – and we tried varying question formats – the status quo attracted
support from no more than a quarter of respondents. There was less clarity on
alternatives: none of the widely-cited options command clear majority support. But
institutional alternatives with an England-wide reach (English votes for English laws
in the House of Commons, or an English Parliament) were far more popular than
alternatives of strengthening regional or local government within England
Strong ‘devo-anxiety’: a perception that devolution has conferred advantages on
Scotland (also but to a lesser extent on Wales, less so still on Northern Ireland) that
were unfair to England, notably around the West Lothian Question and levels of
public spending.
A strong Euroscepticism that appeared, relative to findings from other surveys, to be
stronger in England than in Scotland and Wales. We also had some, though limited,
evidence that concern about immigration was especially strong in England.
As outlined in our 2013 report, dissatisfactions with both of England’s unions – the
UK and the EU – were strongly related to one another, and were felt most strongly
by those people in England who claimed an English rather than a British identity. Black
and minority ethnic people in England were among those least likely to hold these
dissatisfactions.
2 These findings were reported and analysed in two reports. See Richard Wyn Jones, Guy Lodge,
Ailsa Henderson and Daniel Wincott, The dog that finally barked: England as an emerging political
community (Institute for Public Policy Research, 2012) and Richard Wyn Jones, Guy Lodge, Charlie
Jeffery, Glen Gottfried, Roger Scully, Ailsa Henderson and Daniel Wincott, England and its two unions:
The anatomy of a nation and its discontents (Institute for Public Policy Research, 2013). The reports are
available at http://www.ippr.org/publications/the-dog-that-finally-barked-england-as-an-emerging-
political-community and http://www.ippr.org/publications/england-and-its-two-unions-the-anatomy-
of-a-nation-and-its-discontents.

6
These dissatisfactions did not vary significantly by region within England. These
were clearly England-wide sentiments.
Finally, there was an emergent party-political dimension to England’s
dissatisfactions. UKIP was identified as the best advocate for English interests (the
best of a bad bunch, it has to be said), while UKIP supporters generally exceeded
even Conservatives as the most dissatisfied with how England is governed, and the
most devo-anxious, as well as being the most Eurosceptic.
Reflecting further on our earlier findings when designing the 2014 survey, we developed the
idea that a political ‘project’ was forming in England around the question ‘who governs us?’
Put simply, people in England see a democratic deficit in the way they are governed and are
looking for a remedy in the form of self-government. We believe there are four ‘pillars’
which underpin this self-government project. The first three are about different dimensions
of the democratic deficit. They are the main inspirations behind the growing demand for
self-government. They have to do with: Scotland, compared to which people in England feel
disadvantaged and under-represented; the EU, over which there is a sense of lack of control
in England; and immigration where we also find that sense of lack of control.
The fourth pillar of England’s self-government project concerns the institutional arrangements
through which the democratic deficit should be remedied.
We used these four pillars to frame the questions posed in the 2014 survey. We were able to
explore the perception of England’s disadvantage relative to Scotland in the light of
Scotland’s independence debate, as well as through issues addressed in our earlier surveys.
On Europe and immigration (which we explored in greater detail in 2014 than in earlier
surveys) we introduced a comparative element. We did so in the light of debate about
whether attitudes in England towards European integration and immigration are actually
different from those in other parts of the UK. So we flanked our main 2014 survey in
England with parallel, simultaneous surveys in Scotland and Wales. Comparison across the
three nations enables us to be clear how far Euroscepticism, and concerns about
immigration, are distinctively or disproportionately English phenomena.
The fourth pillar of England’s self-government project concerns the institutional
arrangements through which perceived deficits might be addressed. In the 2014 survey we
sought to explore further the evidence of demand for all-of-England, as compared to
alternative regional or local, solutions to England’s democratic deficit. Is there a genuine
demand for English votes for English laws or some other England-wide institutional
solution?
As we discuss these four pillars of the English self-government project we explore the
relationship of each to national identity in England. In our earlier research we found that

7
dissatisfaction and Englishness were strongly and positively associated with one another.
We take this further in the 2014 survey: exploring how far English national identity suffuses
the self-government project or, to put it another way, how far this project is a nationalist
project which expresses the politicisation of the national identity of Englishness within
England.
We also take forward our analysis of party politics in England by exploring how the party
affiliations of our respondents map onto political attitudes. We explore the varying extents
to which supporters of particular parties identify with the different pillars of the English
self-government project. We aim to develop a sense, through considering the views of those
supporters, of which parties appear best-placed to be the advocates in addressing English
concerns over how they are governed. Put simply, is there a political party ready and able to
take up a nationalist project in England?
As will become clear, we think UKIP has the potential to be an English nationalist party. In
the final section of the report we return to this question by exploring in more depth the
social and attitudinal bases of UKIP’s support, and with that the scope for UKIP to establish
itself as an enduring feature of an English party system.
We develop these thoughts below, exploring in turn the four pillars of the English self-
government project, and the party politics of English nationalism. First, though, we provide
initial data on national identity, which runs through our analysis of the four pillars.

8
3. Englishness and Britishness in England
In our previous reports (Wyn Jones et al 2012, 2013) we sought to identify the relative
strength of English compared with British national identity among people in England. Here
we up-date those previous findings with data from 2014.
One standard measure asks respondents which one out of a list of national identities ‘best
describes the way you think of yourself’. Responses to this ‘forced choice’ measure in
England are dominated by ‘English’ and ‘British’.3 Figure 1 below displays responses to the
three FoES surveys. In 2011, we found English identity to be slightly more prominent than
British identity. Our 2012 survey saw the relative strengths of the two identities flip. In our
new survey, Englishness and Britishness are exactly equal, with 43% of respondents
choosing each.
Figure 1: Exclusive National Identity, England 1992-2014
Source: 1992, 1997 British Election Study, 2011-2014 Future of England Survey, all other years British
Social Attitudes Survey
If we examine these trends over time, we see a gradual reduction in the proportion of people
describing themselves as British. The increase in support for English identity appears to
occur in waves, rising to heights in 1999 – just as the devolved legislatures held their first
elections – then 2006, and again in 2011, when the Future of England Survey was first
3 Other options, including Scottish, Welsh and Irish, were available to respondents, but chosen by
very few.
0%
10%
20%
30%
40%
50%
60%
70%
English
British

9
conducted. We do not see a marked decrease in Britishness and matched increase in
Englishness. English and British identity both appear strong in England. This distinguishes
identity in England from identity in Scotland and Wales, where there are similar proportions
as in England prioritizing a sub-state identity but significantly lower proportions of people
using ‘British’ as the best way to describe themselves
There are, however, different ways to ask about identity and a more pronounced message
seems to come from another common measure, the long-standing ‘Linz/Moreno’ measure,
which asks respondents to locate themselves on one of five points on a single spectrum
ranging from exclusively English to exclusively British. When we look at trends over time
within England (as in Figure 2 below), the data for the Linz/Moreno measure also shows
flux. But across the period, and by a significant amount, the ‘more English’ categories have
come to outweigh the ‘more British’ categories. In 1997, for example, the proportion of
people describing themselves as English only, or more English than British, was similar to
the proportion prioritising their sense of Britishness. Since then a sizeable gap has opened
between the two, with almost twice as many people in England choosing to prioritise their
English identity over a British one.
Figure 2: Linz/Moreno National Identity in England 1997-2014
SOURCE: 1997-2009, British Social Attitudes Survey, 2011-2014 Future of England Survey
Finally, we deployed a new measure of national identity for the first time in the 2014 FoES.
Respondents were asked ‘to describe to what extent you think of yourself as English’ (where
0 meant ‘not at all English’, and 10 meant ‘very strongly English’). They were also asked to
make an assessment of their Britishness on a similar 0-10 scale. We put the equivalent
24
31 3230
3633
3033
40
35
31
45
3734
42
31 31
41
33 34
3941
2325 26
2023
26
18
23
16 17 18
1997 1998 1999 2000 2001 2002 2003 2004 2005 2006 2007 2008 2009 2010 2011 2012 2013 2014
English/More English Equal E & B British / More Brit

10
questions to respondents in our parallel Scottish and Welsh surveys. The results are set out
in Table 1. Unsurprisingly, British identity is weakest in Scotland and strongest in England.
But English identity in England is almost as strong as Scottish identity in Scotland, and
significantly stronger than Welsh identity in Wales. Within England, both Englishness and
Britishness are strong with a slightly higher average score for Britishness.
Using these two separate scales allows for the possibility that people may feel a strong – or
weak – sense of identification with both England and Britain simultaneously. And, indeed,
in England, two scales correlate positively, that is many feel strongly English and strongly
British. In Wales and Scotland, by contrast, the correlation is both weaker and negative.
That is, the more Welsh or Scottish someone feels, the less British they are likely to feel.
Despite the fact that a sizeable portion of the electorate in Scotland and Wales feels an
overlapping identity with both Britain and Scotland/Wales, for a significant number of
people the relationship has come to feel more of a zero-sum game: one is either more
Scottish/Welsh or more British. England has not, for most people, reached that point. Many
people in England still feel both strongly English and British.
Table 1: 0-10 Scale National Identities
England Scotland Wales
British:
0-10 average
% giving score of 0
% giving score of 10
8.35
2
46
6.49
9
27
7.65
4
41
English/Scottish/Welsh:
0-10 average
% giving score of 0
% giving score of 10
8.12
4
49
8.28
6
55
6.63
16
39
Our overall conclusion is that the two national identities, English and British, are about
equally strong in England. The question that follows is whether differences in national
identity are associated with differences in political attitudes. As we discuss the four pillars of
the English self-government project below we will at each stage examine whether identity
differentiates attitudes, using the evenly balanced forced choice measure (43% English, 43%
British from Figure 1). As will become clear, while many people in England do feel both
British and English, those who emphasise Englishness differ in some distinct, interesting
and politically important ways.

11
4. The Four Pillars of the New English Politics
A. Devo-Anxiety and the Scottish Referendum
A common theme in our series of FoES surveys has been that people in England do not feel
they get a good deal in the post-devolution era. That theme persists in 2014, although as
with national identity it is in some respects slightly less potent than in our earlier surveys.
For example Table 2 shows perceptions in England of whether England and Scotland get a
fair share of UK public spending. As in earlier surveys, many more respondents think
England gets less than its fair share than think it gets more; the opposite is the case for
Scotland. But in each case there has been a drift into the ‘Don’t Know’ column which has at
least limited the starkness of the perception of unfairness. Perhaps debate around the
Scottish referendum confused rather than clarified the issue.
Table 2: Fair Shares of Public Spending?
2011 2012 2014
England
Gets fair share 26 27 25
Gets more than fair
share
7 8 8
Gets less than fair
share
40 40 31`
Don’t know 27 24 36
Scotland
Gets fair share 21 18 20
Gets more than fair
share
45 52 38
Gets less than fair
share
4 4 4
Don’t know 31 26 38
But national identity continues to be a striking differentiator of responses to these questions
(Table 3). On the two strongest indicators of a sense of injustice for England (England gets
less than its fair share, and Scotland gets more) the assessment polarises. English identifiers
clearly perceive more injustice than do British ones.
Table 3: Fair Shares by National Identity
2014 Total English British
England
Gets less than
fair share
31 38 20
Scotland
Gets more
than fair share
38 45 31
12
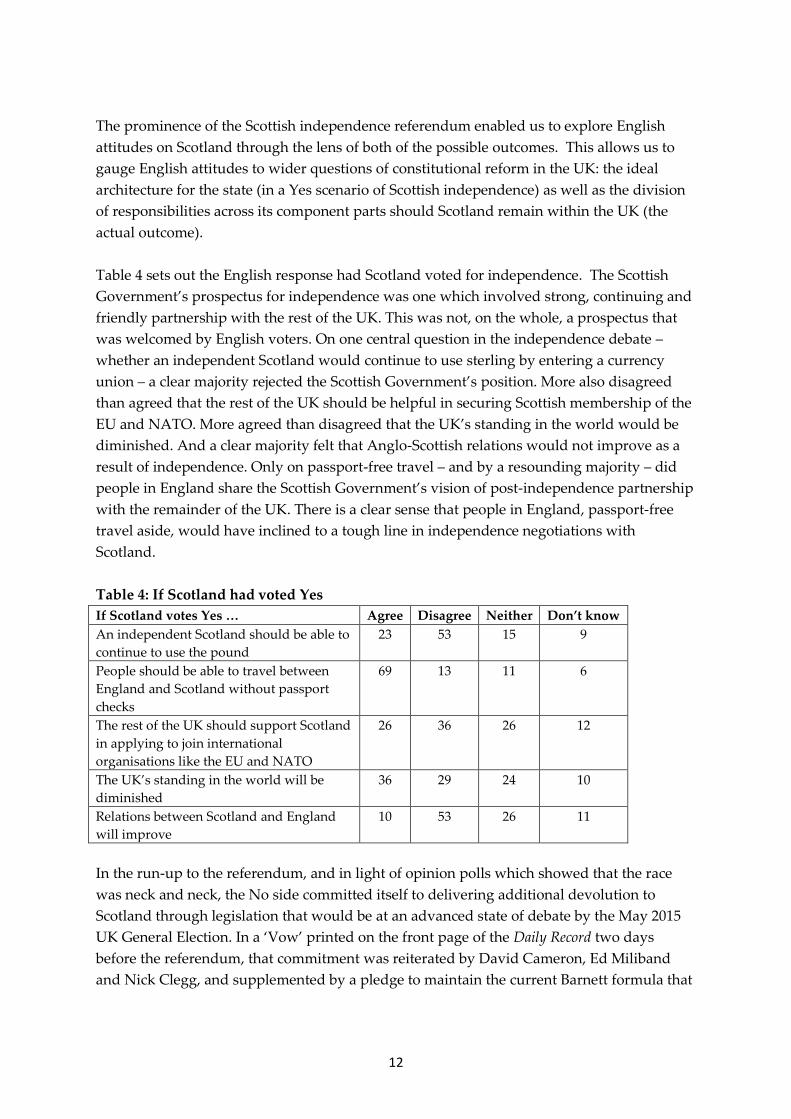
The prominence of the Scottish independence referendum enabled us to explore English
attitudes on Scotland through the lens of both of the possible outcomes. This allows us to
gauge English attitudes to wider questions of constitutional reform in the UK: the ideal
architecture for the state (in a Yes scenario of Scottish independence) as well as the division
of responsibilities across its component parts should Scotland remain within the UK (the
actual outcome).
Table 4 sets out the English response had Scotland voted for independence. The Scottish
Government’s prospectus for independence was one which involved strong, continuing and
friendly partnership with the rest of the UK. This was not, on the whole, a prospectus that
was welcomed by English voters. On one central question in the independence debate –
whether an independent Scotland would continue to use sterling by entering a currency
union – a clear majority rejected the Scottish Government’s position. More also disagreed
than agreed that the rest of the UK should be helpful in securing Scottish membership of the
EU and NATO. More agreed than disagreed that the UK’s standing in the world would be
diminished. And a clear majority felt that Anglo-Scottish relations would not improve as a
result of independence. Only on passport-free travel – and by a resounding majority – did
people in England share the Scottish Government’s vision of post-independence partnership
with the remainder of the UK. There is a clear sense that people in England, passport-free
travel aside, would have inclined to a tough line in independence negotiations with
Scotland.
Table 4: If Scotland had voted Yes
If Scotland votes Yes … Agree Disagree Neither Don’t know
An independent Scotland should be able to
continue to use the pound
23 53 15 9
People should be able to travel between
England and Scotland without passport
checks
69 13 11 6
The rest of the UK should support Scotland
in applying to join international
organisations like the EU and NATO
26 36 26 12
The UK’s standing in the world will be
diminished
36 29 24 10
Relations between Scotland and England
will improve
10 53 26 11
In the run-up to the referendum, and in light of opinion polls which showed that the race
was neck and neck, the No side committed itself to delivering additional devolution to
Scotland through legislation that would be at an advanced state of debate by the May 2015
UK General Election. In a ‘Vow’ printed on the front page of the Daily Record two days
before the referendum, that commitment was reiterated by David Cameron, Ed Miliband
and Nick Clegg, and supplemented by a pledge to maintain the current Barnett formula that

13
determines the funding received by the Scottish Parliament (a formula which delivers
significantly more public spending per head in Scotland than England gets).
Immediately after the referendum the Prime Minister underlined all this again, but also
added and linked a new commitment to work quickly to deliver English votes on English
laws in the House of Commons – or, to put it the other way round, to establish
arrangements in the House of Commons in which MPs from Scotland (and, presumably,
Wales and Northern Ireland) would not be involved in determining legislation on England.
Our No scenario questions give clear insight into English attitudes on these issues. (See
Table 5). The first two questions – on tax devolution and welfare devolution – are at the
heart of the discussions in the current cross-party commission led by Lord Smith of Kelvin.
These discussions are intended to set the parameters for a new draft Scotland Bill to be
introduced in the House of Commons by January 2015. It is clear that the balance of opinion
in England lies firmly in support of tax and welfare devolution in Scotland. But there is a
very strong sense that such additional devolution needs to be accompanied by some form of
English votes on English laws; five times as many agree that Scots MPs should not vote on
English laws as disagree. This suggests that in broad terms the Prime Minister’s post-
referendum commitment to link further devolution to Scotland with giving England greater
recognition at Westminster has strong support. However the pre-referendum ‘vow’ on the
Barnett formula is not supported by public opinion in England. A clear majority in England
wishes to see per capita public spending levels in Scotland reduced to the UK average – a
move, if undertaken, that would imply substantial public spending cuts north of the border.
Table 5: Attitudes to the Scottish No
If Scotland votes No … Agree Disagree Neither Don’t know
The Scottish Parliament should be given
control over the majority of taxes raised in
Scotland
42 25 21 12
The Scottish Parliament should be given
the power to decide its own policies on
welfare benefits
40 26 22 11
Scottish MPs should be prevented from
voting on laws that apply only to England
62 12 15 10
Levels of public spending in Scotland
should be reduced to the levels in the rest
of the UK
56 9 21 13
England and Scotland will continue to drift
apart
37 21 29 13
These findings may appear on the surface to be inconsistent, but there is a sense – conveyed
in the last question in Table 5 – that they reveal two sides of the same coin. On the one hand
Scotland should have more power over its own affairs, and be more financially self-reliant in
doing so. On the other, the way England is governed should also become more distinct and
beyond the influence of Scottish MPs. There is a desire for a clearer demarcation of the way

14
Scotland is governed from the way England is governed. Thus, the higher level of agreement
than disagreement with the proposition in the last question – that England and Scotland will
continue to drift apart – could be seen as a message not of regret but of endorsement.
That certainly appears to be the case for English identifiers in England. Table 6 explores
attitudes to the Scottish No by national identity. The first point to note is that additional
devolution for Scotland is a consensus issue barely differentiated by identity. The striking
differences emerge around questions of funding and English laws. English identifiers are
more strongly in favour of removing Scottish MPs from discussion of English laws and of
eliminating Scotland’s advantage in public spending per head. Nonetheless, while British
identifiers in England are under the average on these issues, at least half are in favour of
English votes on English laws and addressing the perceived advantages Scotland has from
the Barnett formula.
Table 6: The Scottish No by National Identity
If Scotland votes No … Total English British
The Scottish Parliament should be given control over the
majority of taxes raised in Scotland
42 41 43
The Scottish Parliament should be given the power to decide
its own policies on welfare benefits
40 39 41
Scottish MPs should be prevented from voting on laws that
apply only to England
62 71 58
Levels of public spending in Scotland should be reduced to the
levels in the rest of the UK
56 65 53
England and Scotland will continue to drift apart 37 42 33
B. England’s Distinctive Euro-Scepticism
The EU is not popular in England. That said it has actually become a little less unpopular
than in our last survey in 2012. While in 2012 some 43% of FoES respondents in England
agreed that the UK’s membership of the EU was a ‘bad thing’, and only 28% believed it to be
a ‘good thing’, in 2014 the figures were evenly balanced, with 34% selecting each option.
Likewise, when asked about voting intention if there was a referendum on the UK’s EU
membership, 50% said they would vote to leave in 2012 and only 33% vote to stay. In 2014
the leave option was still ahead, but rather more narrowly at 40% to 37%.
Beyond these fluctuating headline figures we are interested in two things: how views in
England compare with views in Scotland and Wales; and how far national identity
differentiates views in England. Our parallel surveys in Scotland and Wales enable us to
give a very clear answer to the first question. The findings in Table 7 show Wales to be a
little less sceptical than England about the value of EU membership, and a little more
inclined to vote to remain in the EU. Scotland is actually quite positive about EU
membership, and inclined to vote to remain by a ratio of three to two. So while views in
Wales are not much different from those in England, Scotland is clearly distinct.

15
Table 7: EU Membership, England, Scotland and Wales
EU Membership: Good/Bad Thing EU Referendum Vote
Good
Thing
Bad
Thing
Neither Don’t
Know
Remain Leave Not
Vote
Don’t
Know
England 34 34 19 13 37 40 5 17
Wales 35 32 20 13 39 35 6 20
Scotland 43 27 17 13 48 32 2 18
In earlier FoES surveys we have also used a third EU-related measure, where we ask which
of several different levels of government has ‘most influence over how England is run’. In
2011 we found that 27% of FoES respondents felt the EU had ‘most influence’, in 2012 it was
30%, and in 2014 it was 26%. This same question was used in a wider, comparative study of
fourteen other sub-state jurisdictions in western Europe, where the highest score for the EU
as having the ‘most influence’ in any region was 9%. We therefore remarked in the report on
our 2012 survey that ‘England appears truly to be an outlier in its attitudes to Europe’.4
Our parallel 2014 surveys in Scotland and Wales allow us to test for that outlier status in the
UK context. Strikingly, we find that only 6% of respondents in Wales, and only 4% in
Scotland, felt that the EU had most influence (Table 8). So within the UK as well, England
really does stand out. There is a methodological proviso: the choice of relevant institutions is
different for Wales and Scotland, given the existence of devolved governments. But perhaps
that is precisely the point: having such institutions of national self-government may bring a
perception of influence on (or insulation against) EU-level institutions that is unavailable to
the English.
Table 8: Which has the most influence?
England Wales Scotland
Local Councils 4 4 3
Devolved Government -- 35 40
UK Government 58 43 41
European Union 26 6 4
Other/Don’t Know 12 11 13
Table 9 explores these issues by national identity. It shows that English identifiers are
generally hostile to the EU, would vote to leave it, and see it as intrusive in their lives;
British identifiers are more favourable in their attitudes, would tend to vote to stay in the
EU, and perceive it to be less intrusive. Feeling English in England appears to harden
attitudes towards England’s two ‘others’: Scotland, and its perceived advantages within the
UK; and the EU. We turn next to a third ‘other’: immigration.
4 Richard Wyn Jones, Guy Lodge, Charlie Jeffery, Glen Gottfried, Roger Scully, Ailsa Henderson and
Daniel Wincott, England and its two unions: The anatomy of a nation and its discontents (Institute for
Public Policy Research, 2013), p. 18, at http://www.ippr.org/publications/england-and-its-two-unions-
the-anatomy-of-a-nation-and-its-discontents.

16
Table 9: EU attitudes by national identity
Nat. Identity
Total English British
Good Thing 34 23 42
Bad Thing 34 45 26
Remain 37 26 45
Leave 40 52 32
EU Most Influence 26 34 19
C. English Attitudes to Immigration
If Europe distinguishes England from Scotland (and to a lesser extent Wales) and divides
opinion between both English and British identifiers, does the same apply to what we
suspect is a third pillar of the English self-government project – namely, immigration? This
is a theme we are examining in depth for the first time in the 2014 FoES; we therefore have
no previous data to identify trends. However, with data from our parallel surveys in
Scotland and Wales we can explore how distinct English views are on immigration.
Overall, there are fewer distinctions by nation on this issue. In general, Wales has very
similar attitudes and concerns about immigration as England; in Scotland concerns are
consistently less pronounced, but still held by a clear majority of Scots. This becomes clear
when we examine the salience of immigration. We asked respondents in all three nations to
select up to three ‘most important issues facing the country at this time’ from a common list.
In each case ‘the economy’ was the top choice: chosen by 64% of respondents in both
England and Scotland, and 61% in Wales. ‘Immigration and Asylum’ was the second most
frequently chosen issue in both England (54%) and Wales (51%); it was third in Scotland at a
significantly lower, but still high, level (38%). ‘Scottish Independence’ was second in
Scotland (49%), perhaps displacing what might otherwise have been a higher score for
immigration.
Scotland shows other differences. Table 10 outlines responses, on a 0-10 scale, to a question
asking people whether or not they supported ‘restricting immigration into the UK’, where 0
denoted being ‘strongly against’ restricting immigration, and 10 ‘strongly for’. There are
clear majorities in all three nations for restrictions, but support is at a notably lower level in
Scotland than either England or Wales.
Table 10: 0-10 scale on ‘Restricting immigration into the UK’
England Scotland Wales
% 10/10 (Strongly in favour) 44 35 46
% 7-10/10 78 55 71
Average /10 7.55 6.47 7.73

17
Much recent debate about immigration in the UK has been about migration within the EU,
prompted by the end of the transition period limiting free movement for Bulgarian and
Romanian citizens. Table 11 shows responses by nation to the statement that ‘the EU has
made migration between European countries too easy’. A full two-thirds of English and
Welsh respondents agree, with Scots only a little less in agreement at 59%.
Table 11: ‘The EU has made migration between European countries too easy’
England Scotland Wales
Agree/agree strongly 67 59 67
Neither 14 16 13
Disagree/disagree strongly 12 19 11
Don’t Know 7 6 8
When looking at responses to these questions in England through the lens of national
identity, we see a now familiar pattern. Table 12 shows how identity differentiates views on
restricting immigration. Here we show results only for point 10 on our 10-point scale, that is
‘strongly in favour’ of restricting immigration. We also show results on the EU and
immigration question set out in Table 11. We again see clear differentiation by national
identity, with English identifiers in England significantly more opposed to immigration, and
the EU’s perceived role in immigration flows, than British identifiers. So while immigration
is a concern widely shared across England, Wales and (somewhat less so) Scotland, it does
appear to have a specifically English dimension in terms of national identity.
Table 12: Immigration Attitudes by National Identity
Nat ID
Total English British
Strongly in favour of restricting immigration 44 57 37
Agree EU makes migration too easy 67 77 64
Disagree EU makes migration too easy 12 6 14
D. Governing England
Our previous discussion has shown that the European Union looms large in public
perceptions in England, with fully 26% of our English respondents regarding the EU as
having most influence over the way England is run. This question is paired with one that
asks respondents which level of government should have the most influence. When offered
the same response options as those set out in Table 9 (namely the EU, the UK Government,
Local Councils or Other) almost three-quarters (72%) opt for ‘the UK Government’ option.
When, however, respondents were invited to consider a future in which ‘there were
different types of institutions in England’ a very different picture emerged. It is a picture
that speaks not only to a deep dissatisfaction with the current arrangements by which
England is governed, but also to a desire to see England (qua England as a whole) receiving
institutional recognition.

18
Given that an English Parliament has never been part of the election manifesto of any
mainstream political party, it is striking that this option, rather than the ‘UK Government’
one, wins (if only narrowly) plurality support (Table 13). Indeed, support for an English
Parliament is double that for ‘stronger local councils’ (an option often suggested as a
solution to English needs) and three times greater than support for regional assemblies. Also
striking is that support for an English Parliament is almost twice as high among those
respondents who identify themselves as English (42%) when compared to those who
identify themselves as British.
Table 13: Should have most influence over the way England is run by National Identity
(2014)
All English British
English Parliament 31 42 23
UK Government 29 25 35
Stronger Local Councils 16 15 18
Elected Regional Assemblies 10 8 11
EU 1 0 1
Other 0 0 0
Don’t Know 12 9 12
A key feature of the Future of England Survey is the way in which different question
wordings are utilised to explore constitutional preferences. Methodologically, this helps to
minimize so-called ‘question wording effects’ – which are potentially very influential in the
context of issues where political debate has been limited. Analytically, it allows us to ensure
that attitudes to a range of various ‘solutions’ are covered. This is particularly relevant for
‘English Votes for English Laws’ (EVEL): an option put forward in every Conservative party
general election manifesto from 2001 on and which is currently under consideration by the
UK government.5 This option has never featured in the British Social Attitudes survey that,
until the establishment of the Future of England Survey, offered the most detailed
information on constitutional attitudes in England.
In our 2014 survey, three sets of institutional options for the future governance of England
that included EVEL were canvassed. The responses are collected together in Table 14. These
data confirm findings from previous Future of England Surveys:
5 It is, however, important to note that the term ‘English Votes for English Laws’ covers a wide spectrum of possible institutional arrangements, from the relatively more modest proposals of the McKay Commission (established by the Coalition) which suggested a number of procedural measures by which MPs from England could express their collective view on English legislation, to the proposals for a full blown English Parliament at Westminster advocated by the likes of John Redwood MP. The McKay report is at http://webarchive.nationalarchives.gov.uk/20130403030652/http:/tmc.independent.gov.uk/. Charlie Jeffery, one of our co-authors, was a member of the Commission.

19
That support for status quo is relatively low – in these questions at no more than 25%;
That support for regionalism is very low; and,
That there is very significant support for the constitutional recognition of England as a
whole as a political unit.
More tentatively, the 2014 data also suggests that EVEL is emerging at the preferred
option for the future governance of England.
Table 14: Constitutional Preferences, England 2014 (%)
Option 1 Option 2 Option 3
All English British All English British All English British
Status Quo 18 17 21 25 21 32 22 17 27
EVEL 40 43 41 31 37 27 36 44 35
Regions 9 7 9 -- -- -- -- -- --
English Parliament 16 19 13 13 14 12 25 29 21
Independence -- -- -- 15 17 12 -- -- --
Don’t Know 17 13 17 16 10 18 17 16 10
In the light of David Cameron’s endorsement of EVEL in the aftermath of Scotland’s
independence referendum, this final point is worth further exploration. Given that we know
there is strong opposition among the English electorate to non-English MPs voting on laws
that apply only in England (see Table 6 above), it is perhaps unsurprising that this option
receives substantial support. It is also noteworthy, however, that there are at least some
indications that support for EVEL is growing. On the Option 1 wording, support for EVEL
was 34% in 2011 whilst it stood at 40% in 2014. On the Option 3 wording, support for EVEL
has grown from 30% in 2012 to 36% in 2014. Complicating any simple narrative, though, is
the fact that on the Option 2 wording, current support for EVEL (at 31%) is slightly down on
the 2012 figure (of 33%).6 Throughout, support for EVEL is particularly pronounced among
those who emphasise their English identity.
6 Option 1 wording “With all the changes going on in the way different parts of the United Kingdom are
run, which of the following do you think would be best for England?” a) For England to be governed as it
is now with laws made by all MPs in the UK Parliament, b) For England to be governed with laws made by
English MPs in the UK Parliament, c) For each region of England to have its own assembly, d) For England
as a whole to have its own new English Parliament with law-making powers, e) Don’t know. Option 2
wording: “Thinking about how England should be governed, which ONE of the following statements
comes closest to your view?” a) England should be governed as it is now with laws made by all MPs in the
UK Parliament, b) England should be governed with laws made solely by English MPs in the UK
Parliament, c) England should have its own new English Parliament with law-making powers, d) England
should be an independent state inside the European Union, e) England should be an independent state
outside the European Union, Don’t know. Option 3 wording: “Thinking about possible arrangements for
making laws for England two options are often mentioned. If you had to choose which ONE would you
prefer?” a) For England to be governed with laws made solely by English MPs in the UK Parliament, b) For
England to have its own Parliament with law-making powers, c) Keep things as they are at present, d)
Don’t’ know

20
The 2014 Survey also explored attitudes towards two additional options that have
occasionally been touted as ways of addressing the English question. These are a Secretary
of State for England with a seat in the UK cabinet, and the appointment of a UK Government
Minister for each English region (as was rather half-heartedly implemented by the previous
Labour Government). As these options are not (at least logically) mutually exclusive, either
with regards each other or to other options such as EVEL or an English parliament (Scotland
currently has both a Secretary of State and a Parliament), it did not make sense to force
respondents to choose between them. We have rather explored the extent to which the
electorate agree or disagree with each idea, including alongside them longer established
alternatives. The results are reported in Table 15.
Given the exploratory nature of these options, and the lack of public debate around some of
them, care is required in interpreting these results. Three points are nonetheless worth
making. First, it is clear that EVEL is the option that wins the most and strongest support
(though of course it is not clear which variant of EVEL respondents have in mind here: more
modest versions proposed by the McKay Commission or the Conservative Party’s
Democracy Taskforce under Ken Clarke, or more radical models which would require a
separate English executive).
Second, all options for change garner majority support, underlining the extent of disaffection
with the status quo and the appetite for change that challenges the current operation of
Westminster/Whitehall in England. Any change, it seems, will do.
Finally, with the exception of government ministers for the regions, support for the various
options for change is always substantially stronger among English identifiers. So, for
example, 78% of English identifiers strongly agreed with the proposition that only English
MPs should vote on laws applying only in England compared to 65% of British identifiers.
Table 15: Ideas for how England is governed, Agree/Disagree (%)
Total Agree
(Strongly Agree)
Total Disagree
Sec of State for England in Cabinet 53 (22) 11
UK Government Minister for each English Region 51 (18) 16
English Parliament 54 (26) 15
EVEL 69 (40) 8

21
Our data demonstrate clear dissatisfaction with the current territorial constitution in
England. It does not necessarily follow, however, that the issue is accorded great priority by
the electorate. It is, after all, an issue that the established political parties have found easy
enough to ignore in the past.
In the previous Future of England Survey we sought to explore the relative salience of
different constitutional issues by asking respondents to identify up to 3 issues they thought
required ‘urgent action or change’. This question was repeated in our most recent survey
and the results from both 2012 and 2014 are listed in Table 16.
Table16: Which three, if any, do you think require urgent action or change?
2012 2014
The UK’s relationship with the EU 59 56
How England is governed now that Scotland has a
Parliament and Wales an Assembly
42 30
Scotland’s future relationship with the UK 25 30
A more proportional system of electing MPs 29 29
Strengthening local government 27 28
Reforming the Lords 26 24
Future of Northern Ireland 5 5
None of these 4 5
Don’t know 11 13
Several points are noteworthy. First, in 2012, the governance of England was very clearly in
second place as the most salient constitutional issue. By 2014, however, the English question
was less prominent. It was rather one of several issues of similar salience – all standing well
behind the UK’s relationship with the EU. Secondly, although the proportion identifying
‘Scotland’s future relationship with the UK’ as a key issue had grown somewhat since 2012,
even in referendum year this issue ranked no higher than PR and the English question (both
often derided as ‘niche’ issues), and far below than ‘Europe’. In April 2014, at least, the
English remained remarkably sanguine about the territorial integrity of their state.
One possible criticism of this question is that by asking respondents to choose three issues
from among a relatively short list of options, the survey design had (inadvertently) boosted
the numbers citing the English question as a priority. Rather than a reflection of salience, our
2012 data might simply indicate that the governance of England is an easy third choice for
people who don’t care much about constitutional issues. To explore this possibility, half of
our 2014 sample were instead asked to choose up to two (rather than three) issues requiring
‘urgent action or change’ (Table 17). Yet even when choice is squeezed in this way, English
governance retains its status as part of a second rank group of issues with broadly similar

22
levels of salience, while ‘strengthening local government’ suffers most. It should come as no
surprise by this stage in our analysis that English identifiers are more likely to cite the EU
and the English question as priority issues than those who emphasise their Britishness.
Table 17: Which two, if any, do you think require urgent action or change?
2014 All English British
The UK’s relationship with the EU 48 56 45
A more proportional system of
electing MPs 24 20 28
How England is governed now that
Scotland has a Parliament and Wales
an Assembly
22 27 18
Scotland’s future relationship with the
UK 21 19 23
Reforming the Lords 17 18 15
Strengthening local government 15 14 16
Future of Northern Ireland 2 1 3
None of these 8 6 9
Don’t know 10 10 11
N=1878
The relatively low priority accorded to ‘strengthening local government’ is worth exploring
further. The main UK political parties are united, rhetorically at least, in support for
‘localism’. All three main parties – and UKIP – claim to favour granting more power and
autonomy to more local government within England, be that to city regions, elected mayors,
or more traditional local councils. All three main parties suggest localism in England as a
possible component of reforms to ‘rebalance’ the territorial constitution of the UK after
devolution. Indeed for Labour and the Liberal Democrats, it can appear that localism is
viewed as the preferred or even the only way of dealing with the English question.7 The
implication is that the recognition of England as a whole as a political unit within the UK is
unnecessary if powers are devolved internally within England.
Some of our 2014 data may appear to buttress this line of argument. So, for example, 39% of
our sample agreed that local councils in England should have more powers, as compared to
12% who thought that powers should be reduced (see also Table 20 below). Given, however,
that another 29% thought that things should be left as they are, there is less than
7 Somewhat idiosyncratically, the Liberal Democrats seem to regard ‘localism’ and ‘federalism’ as – in
essence – synonymous. See the recent policy statement Power to the People: Policies for Constitutional and
Political Reform. Policy Paper 117 (Liberal Democrats, Spring 2014)
http://d3n8a8pro7vhmx.cloudfront.net/libdems/pages/4138/attachments/original/1392840156/117_-
_Power_to_the_People.pdf.

23
overwhelming support for change. Even more pertinently, perhaps, only 15% of our
respondents chose strengthened local government as their preferred institutional option for
the future governance of England (see Table 13 above).
Moreover the attitudes of the English electorate seem to provide a striking example of what
we have termed (in other work) the ‘devolution paradox’. Whilst in the abstract somewhat
supportive of enhanced local control and autonomy, voters display a distinct and
paradoxical aversion to the logical corollary, namely policy outcomes that differ from place
to place. This becomes clear from Table 18 which reports respondents’ views as to whether
policy should be uniform across England or should be a matter for each local council to
decide.
The policy areas probed here are ones in which there are long-standing traditions of local
policy differentiation. Yet only in the cases of planning approval, and refuse collection and
recycling, do we find majority support for local decision making. Even in these cases, a
substantial minority of respondents favour uniformity across England. In the areas of
primary and secondary education – policy areas that, until recently, were characterised by
significant local differentiation – support for uniformity climbs to three in four respondents.
It should be noted that there were no significant differences here in views between English
and British identifiers.
Table 18: Policy uniformity or difference across England, 2014 (%)
Nurseries
and child
care
Primary
school
education
Secondary
school
education
Planning
approvals
Public
transport
Refuse
Collection
and
recycling
Housing Social
Services
Should
be
uniform
across
England
64 74 76 39 50 39 48 69
Local
council
to
decide
28 19 17 53 43 54 44 24
Don’t
know 8 7 7 7 7 7 8 7
There may well be good functional arguments for strengthening local government, or the
development of more powerful city- or county-regions within England. Our data suggest,
however, that there is a strong public presumption across England for policy uniformity.

24
Table 19 throws an alternative light onto this point. It disaggregates attitudes on several
measures discussed in the earlier sections of this report by region within England. There is a
small proviso around sample sizes. Though our full sample of around 3,700 respondents in
England gives us good-sized regional samples in most cases, the North East in particular has
too small a sample size to offer statistical robustness. Having said that, the overall picture –
from which the North East does not stand out – is remarkably uniform.
On most items there is limited variation around the England-wide figure. Identification as
English or British does not vary significantly by region. Nor do our indices of concern about
Scotland, or concern about immigration, or attitudes on English institutional reform. There is
a little more variation around the EU questions, but this is not especially significant given
our sample sizes. With one exception there is no distinctive pattern of regional political
attitudes in England. That exception aside, north-easterners appear to view political
questions in much the same way as south-westerners and as people in the East of England
and the West Midlands. There is an England-wide climate of opinion – except in London.
Londoners do appear to have different views. They are markedly less likely to claim an
English identity than people in the rest of England. They are markedly less sceptical than the
average English view on the European Union. And they are markedly less strongly opposed
(though still clearly opposed) to immigration. They appear a little less robust in their views
about a post-No Scotland than others in England. All this suggests a statement of the
obvious: London is a more cosmopolitan place more accustomed to social diversity than
other parts of England. It also suggests that with this partial exception political attitudes in
England are essentially English, and not regionalist or localist. If institutional reform is
needed to give expression to English views, then that reform needs to be about England as a
whole, not parts of it.

25
Table 19: Variation in Attitudes by Region, 2014 (%)
England North
East
North
West
Yorkshire and the
Humber
East
Midlands
West
Midlands
East of
England
London South
East
South
West
Identity (Figure 1)
English 43 43 45 41 47 45 45 34 46 43
British 43 45 42 46 42 45 45 41 42 43
Devo-Anxiety (Tables 1,5)
England less than fair share 31 32 33 33 31 34 30 28 32 25
Scotland more than fair share 38 39 37 37 38 42 36 35 40 41
Agree reduce public spending in
Scotland to UK average
56 57 59 60 57 61 56 49 56 55
Agree Scots MPs not to vote on
English laws
62 62 62 61 65 62 65 59 63 62
Euro-scepticism (Tables 7,8)
EU a bad thing 34 26 36 36 32 40 36 28 35 31
Vote to leave the EU 40 34 43 38 39 47 43 33 42 38
EU has most influence over how
England is rune
26 26 27 21 25 29 29 18 28 27
Immigration (Tables 10,11)
10/10 in favour of restricting
immigration
44 46 50 46 41 47 46 31 46 45
EU has made migration too easy 67 68 72 65 72 69 71 57 67 64
English institutions (Tables 16, 15, 13)
Urgent action on how England is
governed
30 34 36 27 35 27 24 25 31 29
English votes on English laws 69 69 70 65 70 70 74 61 70 71
Elected regional assemblies should
have most influence
10 10 7 10 14 8 10 11 8 10
More powers for local councils 39 40 44 38 42 37 37 37 36 37
Number of respondents 3705 187 477 397 346 368 446 468 600 416

26
5. Party Politics in England: UKIP and English Nationalism
We have set out above four pillars of an English political project focused on addressing a
democratic deficit in England. That deficit is defined by Scotland’s perceived advantages
within the UK union; the sense that the EU is overly intrusive in the way England is
governed; and a belief that immigration flows need to be restricted. The remedy – the fourth
pillar – is the institutional recognition of England as a whole in the UK political system. We
have shown that concerns about these issues are associated much more with those people in
England who define their identity as English, and less with people who define themselves as
British.
We turn now to the party-political dimensions to the English project. Our aim in this section
is to explore how party affiliation differentiates attitudes on the four pillars of the English
self-government project. Through this we aim to develop a sense of which parties appear
best (or less well) placed to be the advocates in addressing English concerns over how they
are governed.
A. Views of Party Supporters on the Four Pillars
Table 20 sets out descriptive information, taken from FoES 2014, about party support in
England . We have two measures of party support: voting intentions for the next UK general
election, and voting intentions for the 2014 European Parliament (EP) election (which
followed a month or so after the survey was conducted). The differences between the two
measures show a variation in voting intention typical of so-called second-order elections
(like those to the European Parliament) when ‘outsider’ parties like UKIP often do better
than in elections which produce national governments. (Our survey actually estimated
UKIP’s final EP election vote share in England, of 29.1%, almost perfectly).
Table 20: General and EP Election Voting Intentions, 2014 (%)
Voting intention Labour Conservative UKIP Lib Dem Other
UK Election 37 34 14 11 4
EP Election 30 22 29 11 8
Support in the context of a general election lacks this ‘second-order’ element, and is a more
robust indicator of underlying political support. So we use this measure in the analysis that
follows. Significantly, answers on this question still give us a substantial sub-sample of
UKIP supporters (415 in total), which enables us to use the UKIP sub-sample (alongside the
slightly smaller Liberal Democrat one, and the much bigger ones for Labour and
Conservative supporters) as a reliable indicator of the attitudes of party supporters to the
four pillars we discuss above.
In Table 21 we set out the views of these groups of supporters against the same measures
used in Table 19 above to explore variation in attitudes by region. The results show a

27
consistent pattern: that UKIP supporters are consistently most likely to feel most strongly on
the various measures, typically with Conservatives supporters the next most agitated, and
Labour and Liberal Democrat supporters the least concerned.
So, for example, on whether England and Scotland get their fair share of public spending,
UKIP and Conservative supporters clearly feel a stronger sense of injustice about patterns of
public spending – and the perception of England’s disadvantage relative to Scotland – than
Labour and Liberal Democrat supporters. They are also more likely to take a hard line on
reducing public spending in Scotland and on Scots MPs voting on English laws. The latter is
the first of a number of issues where four-fifths or more of UKIP supporters are clearly
dissatisfied with the status quo. But 50% or more of the supporters of all four parties take a
hard line on spending and Scots MPs. So while some form of English votes for English laws
has the clear backing of citizens across the political spectrum (and especially of Conservative
and UKIP supporters), the high profile vow on maintaining the Barnett formula made by the
three party leaders is not endorsed by supporters of any of those parties (and least of all by
UKIP supporters). It may be harder to square the circle of more powers but unchanged
funding arrangements in Scotland than the party leaders imagined.
On Europe, Liberal Democrat supporters are very pro-European and the same is generally
true for Labour supporters. Conservatives, by contrast, are opposed to the EU, while UKIP
supporters are almost off the scale in their hostility to the EU. England is in general a Euro-
sceptical nation, but opinions polarise starkly around party affiliation.
On immigration we also see wide variations by party. Around nine out of ten UKIP
supporters have strong concerns about immigration, with Conservative, Labour and Liberal
Democrat supporters progressively less strongly concerned. Liberal Democrat and Labour
supporters are the least opposed to immigration, but around half of Liberal Democrats and
60% of Labour supporters in England associate concern about immigration with the EU.
On institutional options for England, there is a more diverse pattern. UKIP and
Conservative supporters are most concerned that something should be done urgently about
how England is governed. Nine out of ten UKIP supporters favour English votes on English
laws, far more than supporters of all other parties. Nonetheless at least 60% of supporters of
all parties are in favour of English votes on English laws. The maximum level of support for
English regionalisation among any of the supporter groups is 18% among Liberal Democrat
supporters. There is no significant reservoir of support for regionalisation in any party. But
there is substantial support – a majority among Labour supporters, 40%-plus among UKIP
and Liberal Democrat supporters – for strengthened local government. There is some
suggestion here that a ‘both-and’ solution, combining some form of England-specific
legislative process in the House of Commons and local decentralisation, may be attractive to
most voters.

28
Table 21: Attitudes by Party Support, 2014 (%)
England Labour LibDem Cons UKIP
Concern about Scotland
England less than fair share 31 23 28 42 50
Scotland more than fair share 38 30 43 52 53
Agree reduce public spending in Scotland
to UK average
56 50 54 69 70
Agree Scots MPs not to vote on
English laws
62 52 67 73 81
Euro-scepticism
EU a bad thing 34 23 13 39 81
Vote to leave the EU 40 28 17 49 88
EU has most influence over how
England is rune
26 14 12 30 63
Immigration
10/10 in favour of restricting
immigration 44 32 21 53 85
EU has made migration too easy 67 60 49 80 94
English institutions
Urgent action on how England is
governed
30 20 35 41 42
English votes on English laws 69 61 71 79 90
Elected regional assemblies should
have most influence
10 12 18 5 11
More powers for local councils 39 51 43 26 40
Number of respondents 3705 934 385 969 415
B. UKIP as the Party of English Nationalism
In previous FoES surveys we have asked which party ‘best stands up for the interests of
England’. In our initial survey in May 2011 ‘none of the above’ was the top choice, as it was
again in our second survey in November 2012. YouGov kindly asked the question for us as
part of one of its omnibus surveys in April 2013. By then UKIP had become the number one
choice, a position it maintained in the latest FoES carried out in April 2014 (Figure 2). The
second most popular choice in April 2014 was ‘none of the above, with Labour and the
Conservatives limping in in third and fourth places on a declining trajectory. The Liberal
Democrats barely figure.
Much the same pattern was revealed when we asked which political leaders best stands up
for English interests. Nigel Farage was the top choice at 22%, just edging out ‘none of the
above’ at 21%. David Cameron scored 15% and Ed Miliband 13%. So measured both by
party and party leader, the ‘establishment’ parties are easily outweighed by the mix of UKIP
and the generalised disdain of ‘none of the above’.
Figure 3: Which party best stands up for the interests of England? 2011-2014

29
UKIP appears to be seen as the best of a bad bunch in defending England’s interests. But
who in England is attracted to the UKIP banner? What are the characteristics of UKIP
supporters, beyond their concerns about Scotland, the EU, immigration and the institutional
recognition of England? One starting point is to look at identity. We have shown above that
English identifiers hold these concerns more strongly than British identifiers in England. So
is UKIP a rallying point for those with an English identity? Table 22 suggests this is indeed
the case. Identification as British does not significantly differentiate the supporters of the
three establishment parties, while UKIP supporters are significantly less British than the
population of England as a whole. But identification as English does produce wide
differentiation. Liberal Democrat supporters are the least English by national identity, and
Labour supporters also below the England-wide average. Conservative supporters are
above-averagely English, and UKIP supporters significantly more English still: around twice
as many UKIP supporters see themselves as English as those who see themselves as British.
Conservative supporters are much more evenly divided. UKIP appears to be a party that
mobilises English identifiers more effectively than any other.
Table 22: Parties and Identity in England, 2014 (%)
Total Labour Lib-Dem Conservative UKIP
English 43 37 29 50 60
British 43 48 47 44 33
There are a number of other distinctive features of UKIP supporters, as reported in Table 23.
Very much in line with the findings of Ford and Goodwin,8 we find that UKIP support is
strongest – and stronger than any of the other parties – among the middle-aged and those
8 Robert Ford and Matthew Goodwin, Revolt on the Right: Explaining Support for the Radical Right in
Britain (London: Routledge, 2014)
0
5
10
15
20
25
UKIP
Labour
Conservative
None of above
Lib-Dem

30
approaching retirement. A full half of UKIP support is in the age range 45-64. Another
quarter is 65 or more, an age range in which the Conservatives and the Liberal Democrats
also have significant strength. UKIP is notably weaker among younger voters. UKIP
supporters are more or less evenly split (as are those of Labour and the Liberal Democrats)
between the social grades ABC1 and C2DE. Here Conservative supporters – predictably
enough – stand out as significantly more likely to be ABC1 than C2DE.
Table 23: The Social Bases of Party Support in England, 2014 (%)
Labour Lib-Dem Conservative UKIP
18-34 32 24 23 16
35-44 17 10 17 10
45-54 16 13 13 19
55-64 21 27 23 31
65+ 14 27 23 25
ABC1 50 63 67 53
C2DE 50 47 33 47
Table 24 shows where UKIP has drawn support from other parties, using the recalled vote at
the last UK election in 2010 of FoES respondents intending to vote UKIP at the next UK
election. By some way the biggest group is former Conservative voters, who make up 42% of
UKIP’s support. The Liberal Democrats are the next biggest group at 19%, perhaps
suggesting that UKIP is picking up some of the protest vote the Liberal Democrats used to
attract before becoming a party of government. Former Labour supporters provide just 14%
of UKIP support.
Table 24: UKIP Support by Recalled Vote in 2010
Conservative Lib- Dem Labour Didn’t vote UKIP BNP Other
42 19 14 9 8 3 5
The defection of Conservative voters to UKIP draws attention to the distinctions between
Conservative and UKIP support. UKIP supporters are more middle aged and less affluent
than Conservative supporters. They also have different values. Table 25 sets out attitudes by
party supporters across a range of social issues. On each of the issues in Table 25 UKIP
supporters are the most conservative, with a spectrum of decreasing conservatism among
Conservative, then Labour, then Liberal Democrat supporters.
Table 25: Social Conservatism and Party Support

31
All Labour Lib-Dem Cons UKIP
Strongly in favour (10 on 0-10 scale) of:
restricting immigration 44 32 21 53 85
tougher sentences for young offenders 26 24 14 28 44
legalising gay marriage 28 34 37 19 13
Total agree that
young people don’t respect traditional British
values
66 58 52 78 84
censorship of films/magazines necessary to
uphold moral values
48 43 41 53 59
homosexual relations are always wrong 13 11 11 17 24
claims that human activities are changing
the climate are exaggerated
33 24 24 44 53
But there is a different rank ordering on economic issues (Table 26). UKIP supporters are the
most likely to agree that public services and industries should be in state ownership, edging
out Labour supporters on that issue. And in their scepticism about private enterprise and
belief that governments are responsible for providing jobs UKIP supporters are second
behind Labour supporters. Conservative supporters are the most pro-market on all of these
issues.
Table 26: Economic Interventionism and Party Support
All Labour Lib-Dem Cons UKIP
Total agree that
major public services and industries ought to
be in state ownership
50 61 51 36 63
private enterprise is the best way to solve
Britain’s economic problems
38 22 48 64 42
it is the government’s responsibility to
provide a job for everybody that wants one
36 50 28 22 39
These findings echo those of Ford and Goodwin’s detailed analysis of the social bases of
UKIP support, which also found that UKIP supporters, while classically right wing on social
issues looked distinctly ‘old Labour’ on economic issues, often favouring an active role for
the state. As with other new parties of the right in Europe, UKIP appears to be mobilising
the ‘left-behinds’, ill at ease with social change and economically insecure. There may also be
an echo here of discussion in earlier decades about ‘working class conservatives’ whose
support for the Conservatives appeared contrary to what were assumed to be their class
interests. Arguably the Conservative Party was most successful in the Thatcher era in
mobilising working class conservatives, attracting support from those who had bought their
own council homes and who increasingly worked, and consumed, in the private sector. The
bases of UKIP’s support – ex-Conservative, and more working class and more economically
interventionist than remaining Conservative supporters – may suggest that working class
conservatives in an economically more precarious era are now switching to UKIP.

32
If that is indeed the case then UKIP has an opportunity to establish itself as an enduring
force in English politics. It has, in essence, an English nationalist appeal: among English
identifiers worried about Scotland, Europe and immigration, looking for the institutional
recognition of England and for effective advocates of English interests. Its supporters also
show a distinct set of social characteristics and values. It has an opportunity to bind that
social base to the party by articulating the message those supporters want to hear. It is
certainly doing this, but in part by default, as voters appear to feel that the established
parties are failing to articulate that message, but swithering between UKIP and withdrawal
from the political process (the ‘none of the above’ faction) as alternatives. If it can hone its
message – and recognise that it is England’s nationalist party, despite its ‘UK’ moniker – and
boost its profile by defections from the Conservatives like Douglas Carswell and Mark
Reckless it could be here to stay.
33
6. Conclusion
The findings of the Future of England Survey 2014 suggest, yet again, that the people of
England are dissatisfied with the constitutional arrangements through which their country is
governed. As any reader of the tabloid press will already be well aware, this dissatisfaction
focuses on the European Union, with concern about immigration serving as a lightning rod
for popular concern. But it also focuses on concern about the position of England within the
post-devolution UK and a perception that the Union’s largest nation is being unfairly
treated. Dissatisfaction across all these issues is especially pronounced among those who
emphasise their English national identity. Within England, those who regard themselves as
English are more concerned about the position of England within the UK, are more hostile to
the EU, and are more strongly in favour of restricting immigration, than those who
emphasise their British identity. English identifiers are also more likely to favour the
institutional recognition of England within the UK.
But even if it is English identifiers who feel most strongly that England qua England
requires distinctive treatment, this sentiment is shared (even if less strongly) by many of
those who, when forced to choose, emphasise their British identity. The most popular option
for granting such recognition is clearly English Votes on English Laws (EVEL). How to
implement this is less clear. The main recommendations of the McKay Commission report
focus on parliamentary procedure. But it seems unlikely that the desire to recognise England
within the UK’s political system will be satisfied by (often arcane) procedural changes alone.
Legislation is the culmination of a much broader process of policy development. The
embrace of EVEL apparently presaged in David Cameron’s post-referendum remarks will
require consideration of how the other parts of that policy process might be adjusted in
order to recognise England as a distinctive political space. Political parties might develop
policy programmes explicitly labelled as policies for England against which they could be
held to account by the English electorate. Whitehall could more clearly distinguish its
England-only from its all-UK functions. And, of course, legislation could be designed and
drafted in a territorially demarcated way so that what was English legislation was clear.
William Hague has perhaps a much broader agenda to consider than the Prime Minister
imagined when he made his announcement on EVEL on 19 September.
Politicians and political parties will be crucial. Unlike Scotland and Wales, it is not clear that
any of the main political parties in England has yet fully recognised the potential
opportunities that that could arise from positioning themselves as advocates of an English
territorial interest; or, indeed, the potential pitfalls that could arise from surrendering
‘England’ to their rivals. It will, however, be clear from the preceding analysis that UKIP and
the Conservatives are currently best placed to capitalise. Indeed, there are now signs that the
rivalry between both parties in England is encouraging them to emphasise their English
credentials. All of which leaves Labour and the Liberal Democrats in what appears to be an
increasingly uncomfortable position.

34
In the concluding remarks to our reports detailing the findings of previous Future of
England Surveys, we have warned of the dangers to the centre-left of abandoning England
and Englishness to the centre- or indeed populist right. We have also pointed out that the
centre-left has plenty of resources to draw upon should it choose to take England seriously.
It appears, however, that both Labour and the Liberal Democrats are so concerned at the
prospect of losing the voting power of their Scottish and Welsh MPs at Westminster that
they would prefer to ignore the English question entirely. Either that or, at best, they pursue
a narrow agenda of localism/city regions as a solution to England’s democratic deficit. By
doing so they are in grave danger of ceding to their rivals the new politics of England that is
emerging ever more clearly into view.. As the Conservatives and UKIP move in to stake
their claims as advocates of the English territorial interest within the UK, opportunities on
the left inevitably narrow. It is surely time for the left to start to take England seriously.