tailoring a sustainable future - wpc.32bf.edgecastcdn.netwpc.32bf.edgecastcdn.net/0032bf/... · 04...
TRANSCRIPT

Tailoring a Sustainable FutureS u s t a i n a b i l i t y R e p o r t 2 0 1 3 - 2 0 1 4

CHAPTER 01: REPORT OVERVIEW
02
Table of Contents
1. Report OverviewAbout This Report
Message from our Chief Executive Officer
Message from our President and Chief Technology Officer
Sustainability Strategy
Achievements & Highlights of 2013-2014
2. About TALOur Locations
Our Governance
Our Vision and Strategy
Stakeholder Engagement
3. Business PerformanceOur Business in Figures
Our Supply Chain
ConnecTAL
Challenges
Major Business Changes
04
05
06
07
09
1 1
12
13
14
18
19
20
22
23
25
26
31
32
33
36
37
38
39
40
41
42
43
44
46
48
50
4. Social PerformanceOur Workforce in Figures
Self-Monitoring
External Audits
Foreign Workers in Malaysia
Handling Grievances
Freedom of Association
Community Involvement
People Management
Transition to Standard Factory Structure
Employee Engagement
Functional Skilled Knowledge
Managerial Leadership Competencies
Health & Safety
Health & Safety Performance
Risk Assessment
Fire Safety
Factory Health & Safety Structure
Health & Safety Awareness
Supply Chain Sustainability
Suppliers and Subcontractors
5. Environmental PerformanceOur Environmental Performance in Figures
Environmental Management System
Environmental Aspect Impact Assessment
Greenhouse Gas Emission Program Performance
Water Footprint Program Performance
Energy and Water Audits
Greenhouse Gas Reduction Initiatives
Water Reduction Initiatives
LEED in Hong Kong Headquarters
Chemical Management
Recycled Cotton
6. Industry CollaborationSustainable Apparel Coalition
Talking to the Future
7. AppendicesGlobal Reporting Initiative Index
TAL Workforce Demographics
52
53
55
57
59
6 1
63
65
68
69
70
74
76
78
80

CHAPTER 01: REPORT OVERVIEW
03
Report Overview

CHAPTER 01: REPORT OVERVIEW
04
This is TAL Apparel Ltd.’s third biannual sustainability report. This report provides updates to our last report (2011/2012) as well as introduces new
initiatives undertaken in 2013 and 2014. This report was prepared following the GRI (Global Reporting Initiative) G4 guidelines and includes all
required General Standard Disclosures and other material sustainability topics as identified by the recommended methodology of the GRI. This report
exemplifies the core values of TAL which are honesty, integrity and commitment to stakeholders.
Should you have any comments, questions and/or concerns please contact us via email: [email protected].
About This Report

CHAPTER 01: REPORT OVERVIEW
05
Message from our Chief Executive Officer
Our industry has been receiving increasing focus on sustainability, especially due to the tragic
incidents that occurred in Bangladesh in 2013. However, the way factories manufacture products has
been the same for decades and it seems that nothing relating to the way they produce garments has
recently made them more unsafe. It was unfortunate that it needed a tragic incident in Bangladesh
to send a wake-up call to the entire garment industry, particularly to the brands and the retailers.
So what has changed in the last decade that has contributed to more unsafe factory environments?
This could be related to the continuous pressure from the brands and the retailers chasing the
lowest cost of production to gain the largest “initial” margin, i.e. the price the factory sells the
product to the brand versus the “ticket” price the item is sold for.
Over the past 10 years, US brands in particular have trained consumers to only buy when the
product is on sale because the brands chase volume growth to satisfy their shareholders. Consumers
have been paying a cheaper price for their garment and brands, in turn, have put considerable
pressure on garment manufacturers to drastically lower their pricing, while toughening their social,
environmental and health & safety standards.
At TAL we have been focusing on sustainability for over 20 years. The cost to build and maintain such facilities has continued to increase over time but we have chosen not to lower our sustainability standards to simply sell cheaper, grow faster or make greater profits. We are directly responsible for nearly 25,000 workers who, in turn, provide a living for their families so any of our decisions may impact up to 100,000 people. We take this responsibility very seriously and would never intentionally
compromise their safety, their well-being or the environment we all live in.
There is no doubt we need to be financially sustainable to continue to run a long term business. So while we continue to stick to our principles, we are also trying to engage more with our customers to discuss the existing disconnect between the price they try to constantly lower and the responsibility we have towards our employees to maintain safe, socially and environmentally
responsible factories.
Our intent with this report is to transparently share our sustainability practices and progress. We
also hope to contribute to raising the sustainability bar in the garment industry.
“We are directly responsible for nearly
25,000 workers... We take this responsibility
very seriously and would never intentionally
compromise their safety, their well-being
or the environment we all live in.”
Mr. Roger Lee, CEO

CHAPTER 01: REPORT OVERVIEW
06
Message from our President and Chief Technology Officer
It has been another 2 years since our last Sustainability Report. It has been a busy 2 years indeed. I am
glad to see that TAL has managed to beat the Three Year Plan environmental targets in greenhouse
gas (GHG) emission and water footprint intensity. On the social sustainability side, we conducted
trainings on how to audit ourselves across different facilities within TAL. We report the results and the
improvement plans transparently. We are well on down the road of self-ownership, changing from a
mindset of being audited by external parties and being defensive to a mindset of ownership and self-
improvement.
In the short 2 years, we have seen the Sustainable Apparel Coalition (SAC) grown to cover more than
one third of the worldwide apparel business. All of our facilities have implemented SAC’s Higg Index
as a self-assessment tool. It has given us a universal “language” to talk about sustainability. In fact,
it will be an essential part of our sustainability strategy and one of the Key Performance Indicators of
our next Three Year Plan.
A highlight of our achievements in environmental sustainability is a recycled cotton product on the
market. Producing garments in our facilities with sustainable practices is one thing, but to also take
on the challenge of creating innovative products that sell is another. Being able to collect the cotton
remnants from our own facilities, then working with our customers, to eventually having a product on
the market is a satisfying journey. A journey which touches on many facets of the supply chain, from
waste management in our facilities, our partners in recycling the remnants, our merchandising teams,
the product design team of our customers and finally consumers. It is the last leg of the journey
which sees us “close the loop” of sustainable garments made in sustainable facilities being sold to and
accepted by consumers in the market.
We continue to pursue the ideals of self-ownership and transparency in managing sustainability. Once
the low hanging fruits of sustainability are reaped and once we have put in management systems in
TAL, we will fully embrace the next challenge of innovations in sustainable products and practices that
will contribute and make real the concept of a circular economy.
“I am glad to see that TAL has managed
to beat the Three Year Plan of
environmental targets in greenhouse
gas (GHG) emission and water
footprint intensity.”
Dr. Delman Lee, President & CTO

CHAPTER 01: REPORT OVERVIEW
07
TAL strives to do business while limiting environmental and social impacts by following the triple
bottom line approach. In order to execute the sustainability strategy in the most integrated way
possible, we have defined sustainability as one of the 8 value drivers we use to run our company.
Just as every other value driver, the Sustainability Implementation Plan is described in our detailed
Three Year Plan which defines our social and environmental priorities.
We have placed the Higg Index at the heart of the strategy and our next Three Year Plan targets will
reflect this profound change. The Higg Index is an industry accepted comprehensive measurement
tool used to assess social and environmental sustainability and will hopefully assist the garment
industry by developing it into an industry standard. It is our expectation that the Higg Index will
also bridge TAL’s sustainability agenda as a manufacturer with our stakeholders’ agendas.
Our sustainability strategy addresses major social and environmental impacts associated with our
operations and also addresses the needs of our major stakeholders, i.e. our employees and clients.
Until we gain more progress in the challenges we are currently trying to address, our underlying
focus and priority will continue to be our own operations as we want to build solid foundations and
prepare for a long journey to a sustainable future. Moving forward, we aim to extend our efforts to
our suppliers and to the communities in which we operate in. We consider them as very important
stakeholders and we look forward to being able to work more closely with them.
Our 6-person sustainability team is relatively small compared to our operations. Over the past
3 years, we have focused on pushing and implementing our sustainability agenda down to our
factories. Credit goes to the commitment and the leadership of our manufacturing operations’
upper management who have successfully integrated sustainability into the day to day operations
of our factories. Our greatest satisfaction comes from the realization of the partnership between
operations and sustainability.
Sustainability Strategy

BUSINESS ETHICS & INTEGRITY
MANAGEMENT SYSTEMS & TRANSPARENCY
STAKEHOLDERS
INNOVATION
SO
CIA
L
EN
VIR
ON
ME
NT
AL
BU
SIN
ES
S
SUSTAINABILITY
P R O D U C T
Chemicals
Supply Chain
Waste
Climate Change& Energy
Air Emission
WaterOccupationalHealth & Safety
Labor
Human Rights
Community
CHAPTER 01: REPORT OVERVIEW
0808
It has been and will continue to be challenging for us to satisfy our commitment to sustainability and business priorities while still meeting our clients’
diverse expectations. We are confident in our ability to diligently follow our sustainability roadmap; we will strive to explain the rationale behind our
priorities to business partners who we trust will appreciate our commitment and proactive approach to sustainability.
TAL also commits to working tirelessly to link our customers’ sourcing and sustainability approaches. We believe that the cost of our products should
reflect our efforts and our commitment to sustainability.

BUSINESS SOCIAL ENVIRONMENTAL
CHAPTER 01: REPORT OVERVIEW
09
In 2014 we transitioned into and implemented
the Standard Factory Structure. The new
structure enables each factory to be more
efficient in their operations. The structure
addresses issues in relation to analyzing job
profiles, identifying gaps and overlaps in our
work and benchmarking against the market.
In 2014 we closed one of our factories in
Thailand. We have begun investing in a
second factory in Vietnam which is estimated
to be completed by the end of 2015.
In 2014, we introduced Key Performance
Indicators (“KPIs”) for monthly reporting to
TAL top management.
KPIs put greater emphasis on each factory’s
accountability and ownership of their key
social programs such as self-monitoring,
health & safety initiatives, fire drills and
subcontractor management.
By the end of 2014, we reduced our GHG
(“greenhouse gas”) emissions by 25.97%
which exceeded our targeted reduction of
21% set against our 2009 baseline.
By the end of 2014, we reduced our water
footprint intensity by 29.43% which exceeded
our targeted reduction of 15% set against our
2011 baseline.
Achievements & Highlights of 2013-2014
About TAL
CHAPTER 02: ABOUT TAL
11
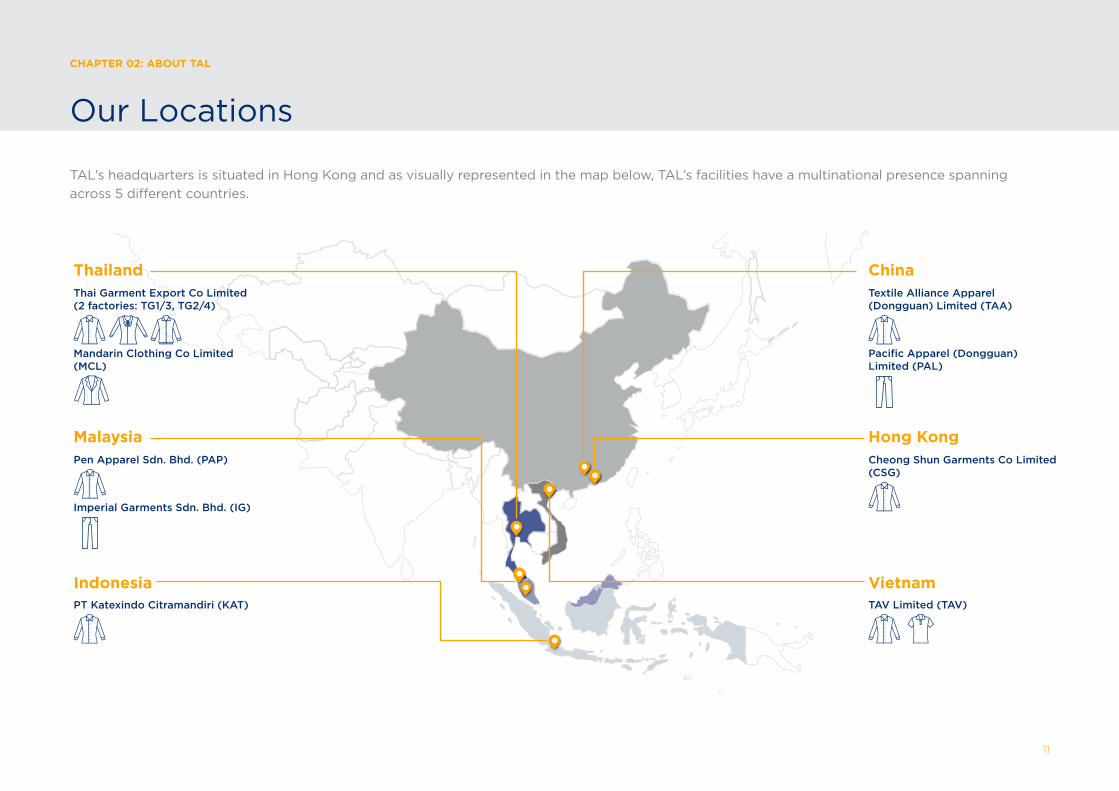
Our Locations
TAL’s headquarters is situated in Hong Kong and as visually represented in the map below, TAL’s facilities have a multinational presence spanning
across 5 different countries.
ChinaThailandThai Garment Export Co Limited (2 factories: TG1/3, TG2/4)
Textile Alliance Apparel (Dongguan) Limited (TAA)
PT Katexindo Citramandiri (KAT)
Indonesia
Pen Apparel Sdn. Bhd. (PAP)
MalaysiaCheong Shun Garments Co Limited (CSG)
Hong Kong
TAV Limited (TAV)
Vietnam
Pacific Apparel (Dongguan) Limited (PAL)
Mandarin Clothing Co Limited (MCL)
Imperial Garments Sdn. Bhd. (IG)

Board of Directors
Audit Committee Executive Committee
CEO, President & CTO,Senior Vice Presidents
Chairman HonoraryChairman
ViceChairman
CEONon-ExecutiveIndependent
DirectorNon-ExecutiveIndependent
Director
Corporate Functions *
Factories
*Corporate Functions include Product Innovation, Sales, Merchandising & Marketing, Manufacturing, Supply Chain Management, Finance, Information Technology, Human Capital Management,Internal Audit, Sustainability, Business Strategy, Analysis & Planning.
CHAPTER 02: ABOUT TAL
12
Our Governance
Quality Production
Innovation
People
Replenishment
SolutionOn-time
Delivery
Lead
Time
Sustainability
Our Value Drivers
Profit
CHAPTER 02: ABOUT TAL
13
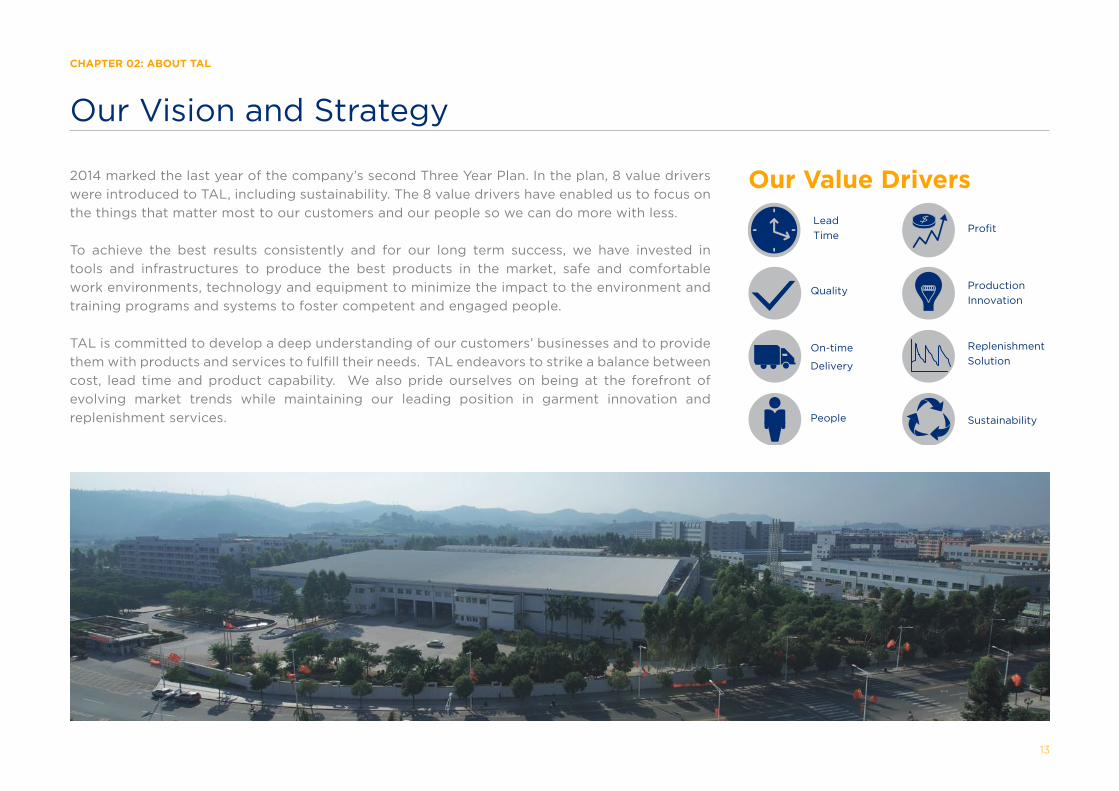
2014 marked the last year of the company’s second Three Year Plan. In the plan, 8 value drivers
were introduced to TAL, including sustainability. The 8 value drivers have enabled us to focus on
the things that matter most to our customers and our people so we can do more with less.
To achieve the best results consistently and for our long term success, we have invested in
tools and infrastructures to produce the best products in the market, safe and comfortable
work environments, technology and equipment to minimize the impact to the environment and
training programs and systems to foster competent and engaged people.
TAL is committed to develop a deep understanding of our customers’ businesses and to provide
them with products and services to fulfill their needs. TAL endeavors to strike a balance between
cost, lead time and product capability. We also pride ourselves on being at the forefront of
evolving market trends while maintaining our leading position in garment innovation and
replenishment services.
Our Vision and Strategy

CHAPTER 02: ABOUT TAL
14
Stakeholder Engagement
Being transparent in our reporting allows us to fulfill the commitments we have made to sustainability. At the same time it also enables us to minimize
risks and to improve our sustainability performance.
We have defined material aspects and indicators to be reported based on the GRI G4 guidelines. Each aspect is scored in 2 categories:
• the degree to which an aspect reflects our significant economic, environmental and social impacts; and
• whether it can substantively influence the decisions of our stakeholders.
To determine our economic, environmental and social impact, we have scored each aspect based on 5 criteria on the scale from Least Material (1 point),
Quite Material (3 points) and Very Material (5 points).
Key Question
Frequency Severity Responsibility Preparedness Advantage
Least Material
Quite Material
Very Material
How likely does this aspect
arise in our daily operations?
Will efforts in this aspect
differentiate us from
competitors?
Do we have control and are
we liable?
Do we have the resources,
expertise and capacity to
manage this aspect now?
How severe will this aspect
affect our stakeholders and our
commercial performance?
Rare or not very often For continuous improvement;
causes no critical impact on
workers or customers
No control
(e.g. designs and materials
assigned by customers)
No structure or systems in
place yet
Minimum requirement for
operations
Beneficial but not urgentSome structure and systems
implemented
Liability shared with
stakeholders and dialogue
can be initiated to address
potential issues
Immediate action needed;
causes some negative impact
but can be resolved timely
Regular intervals
Brings us a competitive
advantage
Systems and dedicated
resources already in place
Independent decisions can
be made by TAL
Zero tolerance; infringes
on human rights, leads to
fatal incidents or causes
irreversible damage
Every day or continuously
Materiality Score Criteria Based on Significant Economic, Environmental and Social Impact

CHAPTER 02: ABOUT TAL
15
We also considered the point of view of 5 key stakeholder groups: customers, employees, company management, community and supply chain partners.
For example, for customers, we reviewed the sustainability concerns they raised through compliance audits and their sustainability commitments in
their public reports. We again weighted each aspect based on materiality. We also adjusted and increased the weighting for customers, employees
and company management because these 3 groups impact our operations the most.
This group thinks that TAL:
• has a small impact and TAL’s performance
on this aspect will unlikely affect them;
• will not be expected to be transparent
on this aspect; or
• will not be held accountable to future
improvements and corrective actions.
This group thinks that TAL:
• has some impact and TAL’s performance
will only somewhat affect them;
• will be expected to be somewhat
transparent on this aspect; or
• will be held somewhat accountable to
future improvements and corrective
actions, should it become necessary.
This group thinks that TAL:
• has high impact and TAL’s performance
will significantly affect them;
• will be expected to be transparent
on this aspect; or
• will be held accountable to future
improvements and corrective actions.
Least Material
Quite Material
Customers(double weighting)
Supply Chain Partners
Community
Employees(double weighting)
Company Management(double weighting)
Materiality Score Criteria Based on Impact on Stakeholders
Very Material
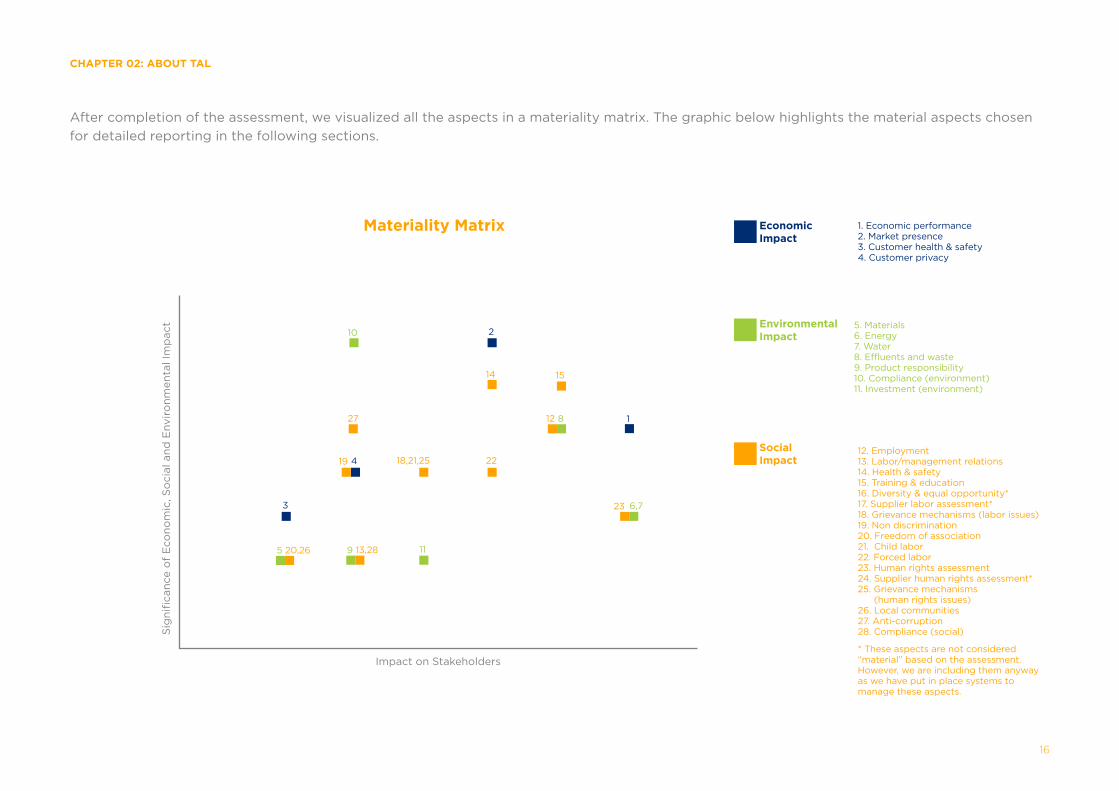
1. Economic performance2. Market presence3. Customer health & safety4. Customer privacy
5. Materials6. Energy7. Water8. Effluents and waste9. Product responsibility10. Compliance (environment)11. Investment (environment)
12. Employment13. Labor/management relations14. Health & safety15. Training & education16. Diversity & equal opportunity*17. Supplier labor assessment*18. Grievance mechanisms (labor issues)19. Non discrimination20. Freedom of association21. Child labor22. Forced labor23. Human rights assessment24. Supplier human rights assessment*25. Grievance mechanisms (human rights issues)26. Local communities27. Anti-corruption28. Compliance (social)
* These aspects are not considered “material” based on the assessment. However, we are including them anyway as we have put in place systems to manage these aspects.
CHAPTER 02: ABOUT TAL
16
After completion of the assessment, we visualized all the aspects in a materiality matrix. The graphic below highlights the material aspects chosen
for detailed reporting in the following sections.
2
1
6,7
8
23
12
1514
2219
27
13,2820,26
18,21,25
10
1195
3
4
Sig
nifi
can
ce o
f E
co
no
mic
, S
ocia
l an
d E
nvir
on
men
tal Im
pact
Impact on Stakeholders
Materiality Matrix EconomicImpact
EnvironmentalImpact
SocialImpact

Business Performance

18
Average % Growth
in Business: over
2011-20147%
46.7m
2013 2014
50.1mNorth America
2013: 81%2014: 77%
Europe
2013: 9%2014: 9%
Asia
2013: 10%2014: 14%
Sales by Region Total Garments Sold
Total Turnover
Our Business in Figures
CHAPTER 03: BUSINESS PERFORMANCE

CHAPTER 03: BUSINESS PERFORMANCE
19
Our Supply Chain
Producing garments requires different materials, such as fabrics, buttons, sewing threads, laces,
labels, zippers, etc. Therefore, supply chain management is needed to streamline the supply chain
process and operation through cross functional collaborations. Collaboration begins with our
partners from materials suppliers all the way to our customers. Thorough planning to turn different
materials into high quality garments at just the right time and just the right cost involves taking
full advantage of our production capacity in our 10 factories located across 5 different countries.
Supply chain management is comprised of 4 departments: Material Sourcing (MS), Material Quality
and Services (MQ&S), Production Planning and Control (PPC) and Replenishment Solutions (RS).
The purpose of all 4 departments is to realize the full potential of the entire supply chain by
making it more effective and efficient.
TAL actively engages with over 800 suppliers to support our garment production. The majority of
our suppliers are based in China. To complete our customers’ orders, in 2013 and 2014, TAL spent
over US$300 million per year on purchasing fabrics and trims.
Managing Our Supply Chain
TAL manages the supply chain from end to end to ensure quality. Customer satisfaction drives and
requires us to source high quality and hazard-free materials. Replenishment solutions is one of the
value added services that we offer to our customers to optimize their inventory and service levels
in their supply chain. By doing so, we help our customers to lower the total cost of doing business
with TAL instead of simply lowering the garment’s ex-factory price only. We also engage our top
fabric suppliers by sharing with them our sourcing strategies and recognize top performers for
their quality of work and commitment to service.
62%78%
12%
16%
7%
16%
7%
15%
10%
China
Others
Malaysia
Rest of Asia
Japan
Outer ring refers to fabricInner ring refers to trims
Trims and Fabric Supplier Distribution
10%

CHAPTER 03: BUSINESS PERFORMANCE
20
Recent Initiatives
TAL monitors suppliers’ performance via monthly key performance indicator (KPI) reports
to help with evaluating and formulating plans in supplier selection and to provide each supplier
with constructive feedback on their performance. To provide greater support to both our internal
and external customers, we are restructuring our material sourcing team to create specialized
dedicated teams in key categories: woven, yarn dyed, woven piece dyed, knit and trims.
Furthermore, we have started the Sales and Operations Planning (S&OP) project in 2013 to better
utilize and to increase efficiency of our resources in order to lower the cost of operations and to
remain competitive in the market. For our fabric suppliers, we plan to extend the Vendor-Managed
Inventory (VMI) concept and let our suppliers manage fabric stock and anticipate orders for us.
In this way we share with our suppliers the same value we offer to customers in this increasingly
volatile business. These initiatives will introduce new systems for TAL to manage suppliers and
strengthen partnerships with them.
ConnecTAL
TAL implemented ConnecTAL on cloud technology in 2014 with the vision to foster a more
collaborative and productive company culture. ConnecTAL is comprised of Microsoft Office 365
as well as an enterprise social platform on Salesforce.
ConnecTAL is at our fingertips regardless of locations or devices as long as internet connection is
available. Secured connection to emails or instant messages can be accessed via laptops, tablets
or mobile phones while at home, at the airport or on the road. With ConnecTAL being in the cloud,
we are no longer bound to the physical limitations that we once faced because our operations are
spread out across several countries.
Group projects between members of various functions and geographic locations are now brought
together by ConnecTAL. Audio and video calls and instant messages are enabled on Lync. Focused

23 Advanced Chatter
Group pages
784Chatter groups
3,300GBMailbox storage
760Mobile devices
provisioned
2,500Users
...
0110,00Average daily messages
CHAPTER 03: BUSINESS PERFORMANCE
21
discussion on project topics can be tracked using hash tags in Salesforce. Messages can be directed to designated group members on Salesforce for
quick follow-up. Project statuses can be shared anytime and anywhere.
Factory teams are invited into Advanced Chatter Groups (ACG) to post and share their best practices. Questions and ideas can now be bounced
around transparently without redundant emails.
Furthermore, ACG enables the creation of department pages for the purpose of sharing and educating everyone about the different functions within
TAL. Articles about our customers, key performance indicators (KPIs), new technologies and general TAL news are shared company-wide.
We expect the ConnecTAL platform to continue to bring our company closer while boosting our productivity and business into the next level.

CHAPTER 03: BUSINESS PERFORMANCE
22
GE
NE
RA
L
WA
GE
S
WA
GE
S
WA
GE
S
WA
GE
S
WA
GE
S
WA
GE
S
Expected Annual Cost Increase
Thailand
7% 4% 12% 7% 7% 3% 10% 6% 13% 6%
China Malaysia Indonesia Vietnam
GE
NE
RA
L
GE
NE
RA
L
GE
NE
RA
L
GE
NE
RA
L
Challenges
Sluggish macro environment in key markets during 2013-2014 affected retail performance in the US and China.
The US economy has since shown signs of recovery, such as declining unemployment rates and the end of quantitative easing. However, US consumers’
confidence have remained low and below pre-recession levels. Household income and consumption have also been slow, causing retail sales to be
mainly discount driven.
The Chinese economy has seen its lowest economic growth in the last quarter century. The economic growth in 2014 was only at 7.4%.
Weakness and uncertainty in the overall global economy can be seen in the performance of our customers. Despite the state of the global economy,
TAL has still managed to record mid to high single digit sales growth. However, price pressure and rising costs continue to hit our profit margin.
Labor cost has been on a rise in all regions. At the same time, there is labor shortage in some of the regions TAL operates. In China, the younger
workforce favors jobs in the service sector (such as retail and hospitality) despite earning a lower wage. Retention of foreign workers in Malaysia and
Thailand has been an ongoing challenge as well because workers’ home countries have seen their economies rapidly develop and wages increase at
a significantly higher rate.
CHAPTER 03: BUSINESS PERFORMANCE
23
Major Business Changes
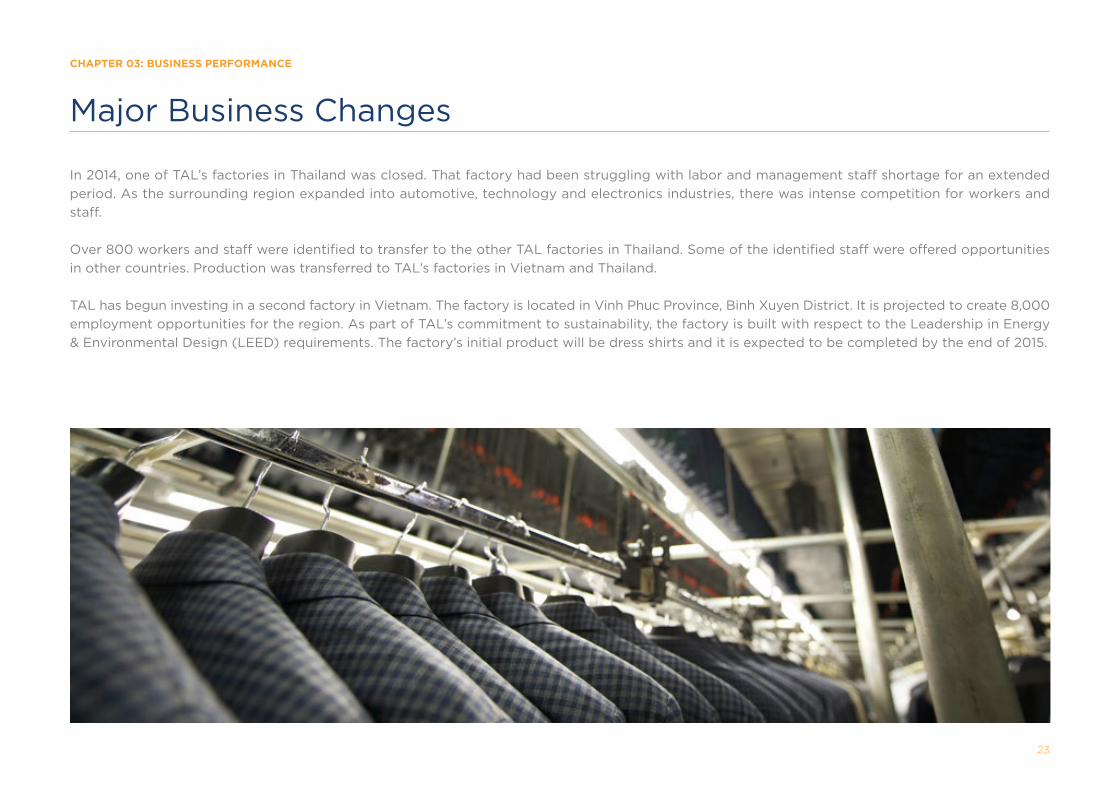
In 2014, one of TAL’s factories in Thailand was closed. That factory had been struggling with labor and management staff shortage for an extended
period. As the surrounding region expanded into automotive, technology and electronics industries, there was intense competition for workers and
staff.
Over 800 workers and staff were identified to transfer to the other TAL factories in Thailand. Some of the identified staff were offered opportunities
in other countries. Production was transferred to TAL’s factories in Vietnam and Thailand.
TAL has begun investing in a second factory in Vietnam. The factory is located in Vinh Phuc Province, Binh Xuyen District. It is projected to create 8,000
employment opportunities for the region. As part of TAL’s commitment to sustainability, the factory is built with respect to the Leadership in Energy
& Environmental Design (LEED) requirements. The factory’s initial product will be dress shirts and it is expected to be completed by the end of 2015.

Social Performance

CHAPTER 04: SOCIAL PERFORMANCE
25
Our Workforce in Figures
Workforce Diversity
Total Workforce by the End of 2014:
VS
VS
76%Female
Local
24%Male
Foreign
Workforce by Region
China 28% Thailand 23% Malaysia 22%
Vietnam 18% Indonesia 8% Hong Kong 1%
81% 19%
30
51%
30
50
-
46%
50
3%
23,736

CHAPTER 04: SOCIAL PERFORMANCE
26
Self-Monitoring
Ownership is core to TAL’s commitment to sustainability. As part of the sustainability strategy, we proactively employ self-monitoring to ensure that our
factories monitor and improve their social performance. Self-monitoring is where factory compliance teams audit themselves, identify non-compliance
in labor and health & safety issues, investigate the root causes of their findings and take actions necessary to rectify issues in a sustainable manner.
In 2012, we began educating all factories on self-monitoring. In 2014, we took a further step and introduced Key Performance Indicators (KPIs)
to track the quantity and quality of self-monitoring audits conducted. KPIs are reported every month to TAL’s top management to keep factories
accountable. The goal is not only for factories to be compliant with local and international compliance standards but to also nurture a proper mindset
for sustainability, develop auditing skills and put in place systems to tackle social compliance issues.
Self-Monitoring Quality KPI, 2014
Quality Score Target (90%) Quality Score by Factory
0%
10%
20%
30%
40%
50%
60%
70%
80%
90%
100%
81% 64% 78% 73% 91% 62% 80% 79% 94%
TAA PAL
China Thailand Malaysia Indonesia Vietnam
TG1/3 TG2/4 MCL PAP IG KAT TAV

CHAPTER 04: SOCIAL PERFORMANCE
27
Self-monitoring occurs once a month. Factories are required to conduct at least one audit per month and the focus of the audit must alternate between
labor and health & safety. Factories with sister factories in their country need to audit each other once every quarter on both labor and health & safety.
Factories are evaluated based on how non-compliances are identified, investigated and pursued. The assessment of the quality KPI is a two-fold
process: (1) how each factory identifies findings, conducts root cause analyses and plans for corrective actions and (2) how each factory follows
through on findings from previous months. By following this method we reinforce that a good self-monitoring system is about proactively identifying
opportunities to improve social performance as well as finding solutions and taking preventive measures.
To implement the KPIs, we created a self-monitoring checklist and provided guidance based on TAL’s internal labor and health & safety standards. TAL
factories audit themselves against all the items on the checklist. The factory team then reports their identified issues in a specific format. Each finding
and its corrective action plan is rated on a scale of 1 to 3 points.
ManagementSystem
Plan
Act
Do
Check
• Management accountability• Applicable laws and
regulations collection• Policies and procedures
• Corrective and preventive actions
• Periodical management review to identify priorities and improvement opportunities
• Policy and procedure implementation
• Related trainings• Performance measurement • Record maintenance
• Self-monitoning audits• Extemal audits• Assessment of employees’
understanding and feedback mechanisins
• Reporting of non-compliances
CHAPTER 04: SOCIAL PERFORMANCE
28
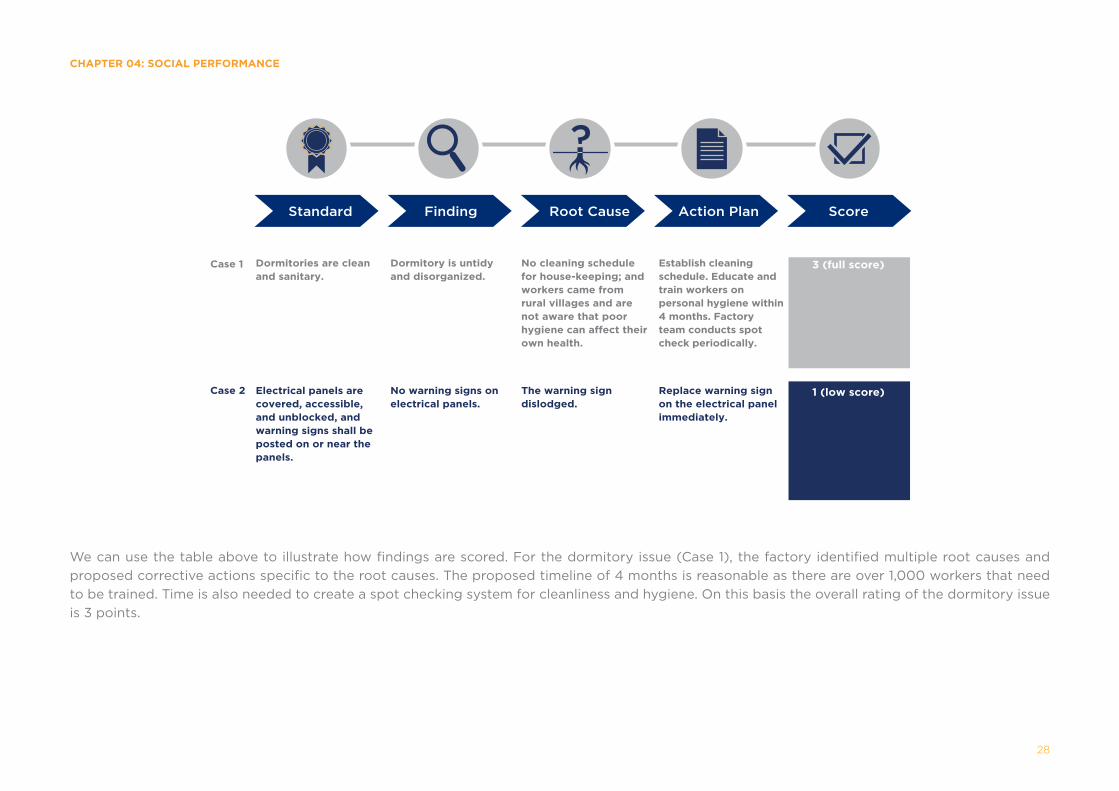
We can use the table above to illustrate how findings are scored. For the dormitory issue (Case 1), the factory identified multiple root causes and
proposed corrective actions specific to the root causes. The proposed timeline of 4 months is reasonable as there are over 1,000 workers that need
to be trained. Time is also needed to create a spot checking system for cleanliness and hygiene. On this basis the overall rating of the dormitory issue
is 3 points.
?
Standard Finding Root Cause Action Plan Score
Electrical panels are covered, accessible, and unblocked, and warning signs shall be posted on or near the panels.
No warning signs on electrical panels.
Replace warning sign on the electrical panel immediately.
The warning sign dislodged.
3 (full score)
1 (low score)
Case 1
Case 2
No cleaning schedule for house-keeping; and workers came from rural villages and are not aware that poor hygiene can affect their own health.
Establish cleaning schedule. Educate and train workers on personal hygiene within 4 months. Factory team conducts spot check periodically.
Dormitories are clean and sanitary.
Dormitory is untidy and disorganized.

CHAPTER 04: SOCIAL PERFORMANCE
29
Conversely, in the issue regarding electrical panels (Case 2), the root cause analysis was not thorough. A deep investigation should focus
on the “why”; for example, why the sign fell off and why no one noticed that the sign was missing. The proposed solution to immediately
replace the sign does not address the issue for the long term. The warning sign will likely be dislodged again in a few months and the team
will once again discover electrical panels without warning signs. The rating is 1 point because the factory did not put in place a proper system
to assign specific individuals to proactively check and replace the warning signs and did not propose ways to make the sign stick longer.
If a previous issue is reoccurring then factory teams will be asked to review previous corrective action plans and to re-do the root cause analysis. They
will also be required to determine a new plan to more effectively prevent the issue.
Factories also report monthly on the corrective actions taken together with evidence that can validate the improvements made. The evidence is
assessed and those findings will be considered closed. The goal in 2014 was to reach a score of 90%.
Implementing self-monitoring has helped us to learn that factory compliance teams are not always equipped with the right mindset and skillset. There
are times where factory teams try to overlook findings in order to “improve” their KPI figure. We also find that some factory teams are not thorough
in their self-audit. Others may be unable to link their root cause analyses with sustainable corrective actions. To overcome these hurdles, we must
continue to provide training. We also consistently communicate and coach factory teams to think about self-monitoring in a holistic manner and strive
to set up measurement systems that reward transparency.
Self-Monitoring Training
The foundation of a robust self-monitoring program is a proper mindset together with competent auditing skills. However, our factory compliance
teams are made up of human resources personnel and health & safety personnel and not everyone comes with strong audit skills. The issue is further
complicated by staff turnover.
In 2013 and 2014, TAL’s Sustainability Team visited each factory to provide training. The training sessions were designed to help those with zero
compliance knowledge and ready them to perform compliance work in their factory. A total of 10 one and a half day training sessions were conducted
and 45 people were successfully trained.

CHAPTER 04: SOCIAL PERFORMANCE
30
Each training session covered:
1. compliance standards on labor and health & safety;
2. role and responsibility of the compliance team;
3. components of the self-monitoring program; and
4. how a typical audit process should be.
The training sessions included practicing how to conduct factory tours, interview workers and review documents.
The trained personnel are then responsible for the self-monitoring of their factory. Every month they receive feedback on their self-monitoring reports
to provide them with continued coaching and specific advice for improvement.
In August 2014, our staff in 5 factories across Thailand and Vietnam also received self-monitoring training from one of our customers in addition to
TAL’s internal training.
We will continue to work with all factory teams and identify training needs for the bettering of the self-monitoring system.

CHAPTER 04: SOCIAL PERFORMANCE
31
In addition to self-monitoring, TAL factories are subject to customer compliance audits each year.
Sometimes the audits are accompanied by a security audit (or C-TPAT audit for US customers) and
a product quality assessment.
In 2013 and 2014, we had 58 and 47 external audits respectively. Our factories in Vietnam and
China received the most audits. The diversity of customers at the factory and their customers’
compliance mindset are factors contributing to how many times a factory is audited. Only a few
customers will accept and review existing audit reports of other brands in lieu of conducting their
own additional audit, or encourage suppliers like TAL to have a proactive approach and to develop
their own sustainability programs.
Overall, 1 in 3 issues identified by external audits were related to labor while the remaining two
thirds were related to occupational health & safety.
The top 3 labor issues were related to working hours (34%), wages and benefits (24%) and grievances
(7%). To control working hours, TAL has introduced an internal standard to limit working hours to
a rolling average of 60 hours per week over a 6 month period. This standard allows factories to
maintain some flexibility to plan production across peak and non-peak seasons. Factories need to
strictly adhere to this standard and report their compliance monthly as a KPI.
Compliance on wages & benefits are tackled by maintaining updated local labor laws and
conducting regular self-audits. Please refer to page 26 for further information about our self-
monitoring program. As for grievance mechanisms, please see further details at page 33.
The top 3 health & safety issues were related to fire safety (37%), chemical safety (13%) and
machine safety (13%). The largest concern of many customers in relation to fire safety is the width
of evacuation aisles. To address this issue, TAL has developed a group aisle standard (please see
page 45) to ensure safe evacuation.
To address chemical safety, we are in the process to set up a more comprehensive chemical
management system. Furthermore, workers are taught to use proper personal protective
equipment (PPE) and machine guards to prevent injuries.
Number of External Audits per Year by Region
0
2
4
6
8
10
12
7 4 4 10
80% 79%
4
China Thailand Malaysia IndonesiaVietnam
GrievanceWorking Hours
Wages & Benefits Other
37%
13%
37%
13%
Health & Safety Findings from External Audits
34%
24%7%
35%
Labor Findings from External Audits
Machine SafetyFire Safety
Chemical Other
External Audits
CHAPTER 04: SOCIAL PERFORMANCE
32
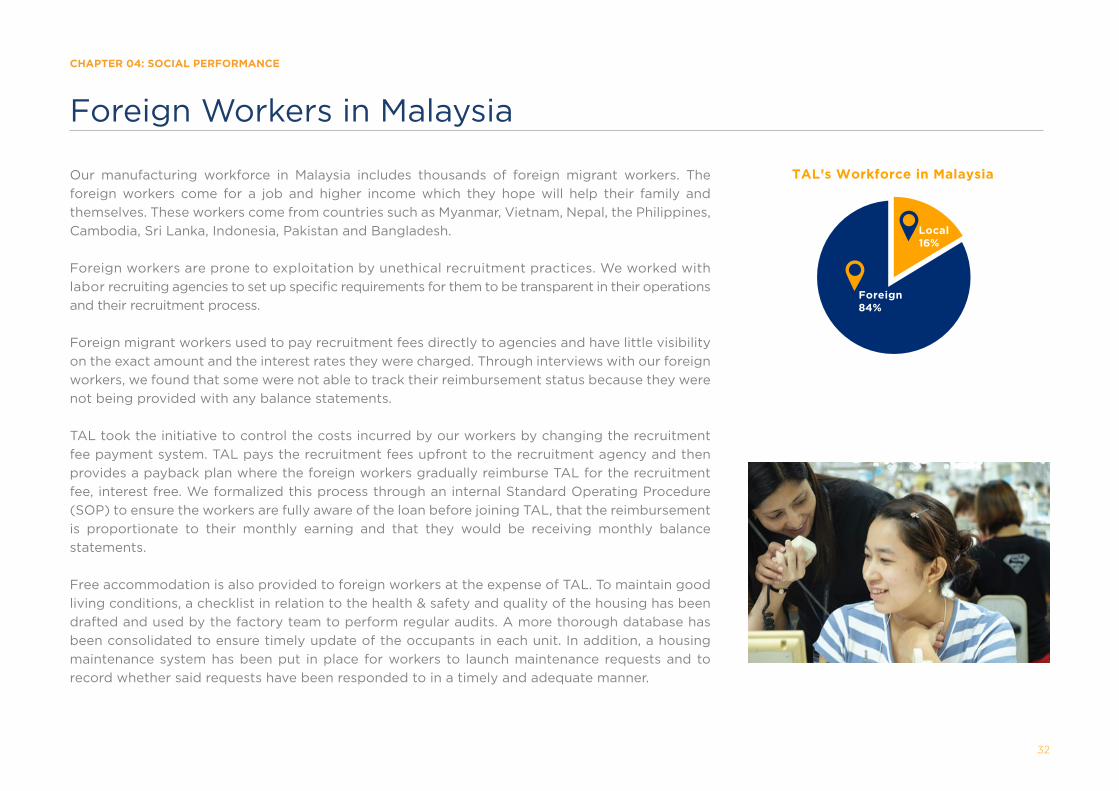
Our manufacturing workforce in Malaysia includes thousands of foreign migrant workers. The
foreign workers come for a job and higher income which they hope will help their family and
themselves. These workers come from countries such as Myanmar, Vietnam, Nepal, the Philippines,
Cambodia, Sri Lanka, Indonesia, Pakistan and Bangladesh.
Foreign workers are prone to exploitation by unethical recruitment practices. We worked with
labor recruiting agencies to set up specific requirements for them to be transparent in their operations
and their recruitment process.
Foreign migrant workers used to pay recruitment fees directly to agencies and have little visibility
on the exact amount and the interest rates they were charged. Through interviews with our foreign
workers, we found that some were not able to track their reimbursement status because they were
not being provided with any balance statements.
TAL took the initiative to control the costs incurred by our workers by changing the recruitment
fee payment system. TAL pays the recruitment fees upfront to the recruitment agency and then
provides a payback plan where the foreign workers gradually reimburse TAL for the recruitment
fee, interest free. We formalized this process through an internal Standard Operating Procedure
(SOP) to ensure the workers are fully aware of the loan before joining TAL, that the reimbursement
is proportionate to their monthly earning and that they would be receiving monthly balance
statements.
Free accommodation is also provided to foreign workers at the expense of TAL. To maintain good
living conditions, a checklist in relation to the health & safety and quality of the housing has been
drafted and used by the factory team to perform regular audits. A more thorough database has
been consolidated to ensure timely update of the occupants in each unit. In addition, a housing
maintenance system has been put in place for workers to launch maintenance requests and to
record whether said requests have been responded to in a timely and adequate manner.
TAL’s Workforce in Malaysia
Foreign84%
Local16%
Foreign Workers in Malaysia

CHAPTER 04: SOCIAL PERFORMANCE
33
To provide better support, we created 2 different Human Capital Management teams in our
Standard Factory Structure in 2014 (learn more in page 38). One of the teams is dedicated to
providing counseling and follow up on worker requests, grievances, etc.
Since most foreign workers in Malaysia do not speak English or Malay, we identified that translators
are necessary. We have not yet recruited translators for all nationalities but it is our intention to do
so in the near future. To offer an additional channel for communication to our employees, we also
appointed a “house leader” per dormitory and hostel.
We realize that there are opportunities for improvement to taking better care of our foreign
workers. Therefore, TAL will be dedicated in the coming years to implement the standards we
have identified so far.
Handling Grievances
As a company operating in multiple regions and with a diverse workforce, TAL needs to create
grievance mechanisms to handle employees’ complaints and concerns.
Ethics Hotline
In the past, employees could bring their grievances to the attention of management through:
• sending an email to senior management, such as the CEO and/or the President & CTO; or
• raising issues directly to their immediate supervisor, and where issues could not be resolved
then they could be raised to the Human Capital Management (HCM) team.
The more serious allegations and concerns were taken to the relevant senior management members
to follow up.
Grievance Channels for TAL Employees
Email to
senior
management
Ethics
Hotline
Internal
Audit team
TAL Board
Senior
management
Staff /
Worker
Immediate
supervisor
HCM team

CHAPTER 04: SOCIAL PERFORMANCE
34
Since September 2014, we have rolled out a TAL Ethics Hotline (the Hotline) across all TAL sites
in addition to existing channels. It is an alternative channel for employees to report any issues or
concerns about unethical and improper business practices.
The reporter may choose from the following methods to make the report:
• TAL Ethics Hotline email account – All emails are diverted to the Internal Audit team made up
of the President & CTO and Internal Audit Director; or
• TAL Ethics Hotline numbers – Dedicated phone numbers are set up for each location. All calls
are automatically transferred to a voice mail recorder.
Reports can be made anonymously or with name and contact information for follow up.
Once the Internal Audit team receives a report they will review the nature of the complaint to
determine how to approach it. If the complaint is related to unethical conduct, or violates normal
business practices, the Internal Audit team will conduct an investigation to validate the facts
provided. The results of the complaints investigated by the Internal Audit team will be communicated
to the whistleblower.
The Hotline received some reports during the first 3 months of being active. The reports covered
topics such as labor management relations, procurement practices and other operations matters.
As the Hotline is up and running, more focus will be put into handling the grievances. In our next
report we will share our challenges, if any, in the implementation.
Big Sister Program and Handshake Hotline in China
Our production workers tend to have fewer options and resources to protect themselves when
suffering from unfair treatment. For them, we have to create specific grievance channels in addition
to the ones for office staff. These mechanisms include anonymous suggestion boxes, dedicated
human resources personnel and third party hotlines.
Take our factories in China as an example. In 2008 we established a team of labor relations specialists
called Big Sister to communicate with our workers. Over time the Big Sister program has matured
Some incidents will be independently investigated, with results and follow up actions
Incidents will be reported to the business unit’s senior management for attention and / or follow up
Senior Management
Internal Audit Team
Whistleblower
Investigation
Internal Audit team reviews the reported incidents and seeks the whistleblower for further information
Internal Auditteam will updatethe whistlebloweron the results
Ethics Hotline Workflow
Whistleblower contacts the Ethics Hotline (via email or voice mail)
The TAL Boardreviews the incidents
TAL Board

CHAPTER 04: SOCIAL PERFORMANCE
35
into a vigorous program with daily, monthly and yearly activities for workers. Big Sisters help new
workers get settled into the factory and local community, listen to worker concerns in person and
through social media (QQ and WeChat), resolve day-to-day problems and relay worker feedback
to management. To the workers the Big Sisters are their counsellors, listeners and guides in the
factory as well as a bridge between workers and production managers. From this program, we are
not only able to enhance a sense of belonging but also collect valuable feedback to improve the
way we support our workers.
In 2014, we also began partnering with a non-profit organization called Inno Community
Development Organization to set up a third party hotline called Handshake. Workers can reach
professionally trained counsellors via phone or QQ to share their concerns anonymously. At the end
of each month, Inno summarizes and provides each case’s details for our reference.
Both our factories in China received approximately 90 submissions of feedback through Handshake
in 2014. Most of the time, workers sought specific advice and information to help with their work-
related or life issues.
The challenge with the third party hotline is their limited capacity to serve all our workers. Through
Handshake, we collected 90 inquiries which is much lower than the almost 700 submissions Big
Sisters internally gather each year. In China, the turnover rates are particularly high and continue
to climb, so internal engagement mechanisms will continue to be critical for gauging the pulse of
our workforce.
Moving forward, we will continue to refine our internal procedures for handling grievances and
source competent third parties to service workers in all our factories.
Life SkillsPersonal
Social Insurance Other
86%
2%12%
Workplace ComplaintsInformation & Advice
Psychological Counseling
Types of Issues Raised through Handshake
20%
19%
13%
48%
Topics Raised through Handshake
CHAPTER 04: SOCIAL PERFORMANCE
36
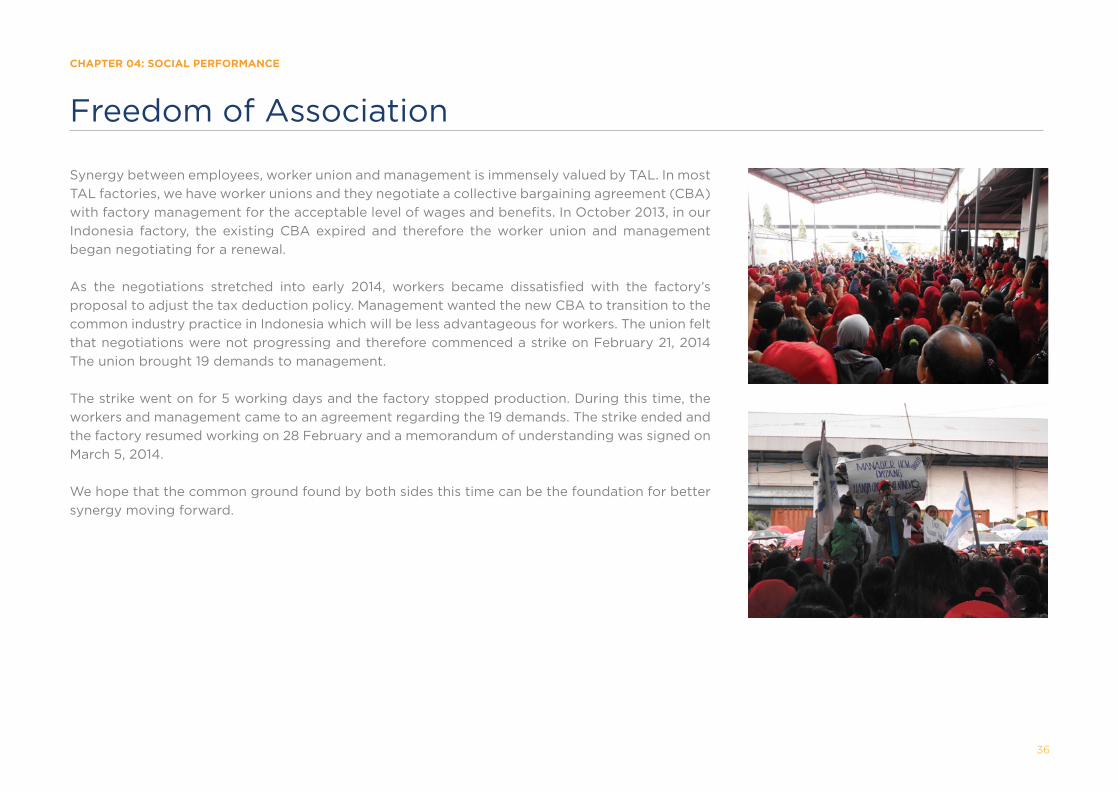
Synergy between employees, worker union and management is immensely valued by TAL. In most
TAL factories, we have worker unions and they negotiate a collective bargaining agreement (CBA)
with factory management for the acceptable level of wages and benefits. In October 2013, in our
Indonesia factory, the existing CBA expired and therefore the worker union and management
began negotiating for a renewal.
As the negotiations stretched into early 2014, workers became dissatisfied with the factory’s
proposal to adjust the tax deduction policy. Management wanted the new CBA to transition to the
common industry practice in Indonesia which will be less advantageous for workers. The union felt
that negotiations were not progressing and therefore commenced a strike on February 21, 2014
The union brought 19 demands to management.
The strike went on for 5 working days and the factory stopped production. During this time, the
workers and management came to an agreement regarding the 19 demands. The strike ended and
the factory resumed working on 28 February and a memorandum of understanding was signed on
March 5, 2014.
We hope that the common ground found by both sides this time can be the foundation for better
synergy moving forward.
Freedom of Association

CHAPTER 04: SOCIAL PERFORMANCE
37
TAL continues to donate to causes in regions where we operate. In 2013 and 2014, TAL and its
associated family foundation (Lees Charitable Foundation) contributed around US$2 million each
year. The majority of this donation went to educational causes. Other causes donated to include
children’s welfare, health care and community development. In support of nurturing talents for the
textiles and apparel field, we also funded scholarships and sponsored industry forums at various
levels of education.
Social Responsibility Committee in Hong Kong
In late 2013, the Social Responsibility Committee (SRC) was relaunched in TAL’s Hong Kong
headquarters. The SRC is responsible for raising awareness for a sustainable community among
TAL’s Hong Kong staff.
SRC worked with the Ronald McDonald’s House of Charities (RCMH) and the Produce Green
Foundation (PGF) in 2014. TAL has provided RMCH with volunteers for events as well as funded
and organized an event bringing 18 families to a local attraction, Noah’s Ark. To support PGF, TAL
had rice transplanting and reaping activities to appreciate the process and to promote the idea
of valuing food and reducing waste.
SRC independently organized other activities as well, such as bartering between colleagues and
donating any remaining usable items and collecting recyclables like red packets and spectacles.
Monthly emails were also issued to further raise sustainability awareness.
Community Involvement
HealthEducation
Community Industry Development
81%
80%
17%
2%1%
3%8%
8%
TAL Group Donations
2014
2013

CHAPTER 04: SOCIAL PERFORMANCE
38
Transition to Standard Factory Structure
In 2014, we rolled out a standardized organization structure across all of our factories for the first time in our company’s history. This marks a very important milestone because having the standard structure allows us to be more efficient and ensures that there are no gaps or overlaps in our operations. The structure also nurtures the understanding and trust needed for our teams to function more effectively.
The transition to the Standard Factory Structure (SFS) has been a long and demanding process starting back in 2011. A lot of colleagues were involved in re-visiting the existing structures in the factories. It was found that the structure differed greatly from factory to factory. A lot of effort was then put into realigning and reorganizing the factories’ departments and creating role-specific adjustments in the departments to ensure that all roles work efficiently together.
A total of 249 factory roles were defined and documented in the form of Role Profiles. With the efforts of over 30 colleagues across the factories and the Hong Kong headquarters, all 249 roles were evaluated using the Aon Hewitt JobLinkTM Point Factor Evaluation Methodology. This methodology yielded role grades which we then confidently used to benchmark compensation and benefits in the market.
In order to prepare for a smooth transition to the SFS, a stringent process along with supporting materials and relevant documents were designed to give clarity and focus when reassigning employees in the new structure. The process also helped in communicating and implementing the structure in the factories. An appeal process was created to allow employees to voice out concerns regarding their reassignments to ensure fairness of the SFS transition for each and every employee.
The transition to SFS began in July 2014 and by September 2014 all of our factories were operating under the new structure. Roughly 4,400 employees were given new assignments and/or new grades as a result of the SFS transition. There were no known cases of employee resignations attributed to the SFS transition. 8 cases of appeals to new assignments were raised, all of which were successfully resolved.
The next big push on standard structures will be focusing on the Hong Kong functions (and their extensions at the factories). Approximately another 200 roles in the structure will have to be reviewed and redesigned. We will work hard to ensure a successful transition in the coming months.

CHAPTER 04: SOCIAL PERFORMANCE
39
Employee engagement continues to be a core subject of human capital management at TAL. Since
our first 2 Employee Engagement Surveys in 2009 and 2011, we partnered with Aon Hewitt again
for surveys in 2013 and 2014. The 2014 survey revealed that TAL’s overall engagement increased
by 4% points from 2011. The overall improvement was 11% points compared to the 2009 baseline.
Many initiatives were carried out in 2013 and 2014 to enhance the engagement levels, for example:
• In China, the surveys revealed that workers and staff wanted more transparency in the
promotion process, more feedback on their job performance, and more diversity in work tasks
and future opportunities. Such feedback showed that engagement is closely linked with people
development at the factories. As a result, the factory team introduced a career ladder to show
how new workers can progress within production and non-production roles.
• In one of our Thailand factories, the management team conducted meetings with each and
every single staff member and worker. The Factory Managing Director personally sat in all
the sessions to make sure that all voices were heard. This proactive approach was incredibly
successful. Engagement score increased dramatically by 25% points between 2011 and 2014,
followed by outstanding business results.
The next step is to keep the momentum going and sustain engagement initiatives which we
expect to be even more challenging. We will be required to move from analyzing data and
planning actions to implementing changes, measuring outcomes and communicating results to
all our employees. Each TAL site has set up an Engagement Committee to lead the way and face
the upcoming challenges.
Example of a New Sewer’s Career Path in China
GarmentTechnician
SewingManager
Multi-SkillSewer
Employee Engagement
NewSewer
CHAPTER 04: SOCIAL PERFORMANCE
40
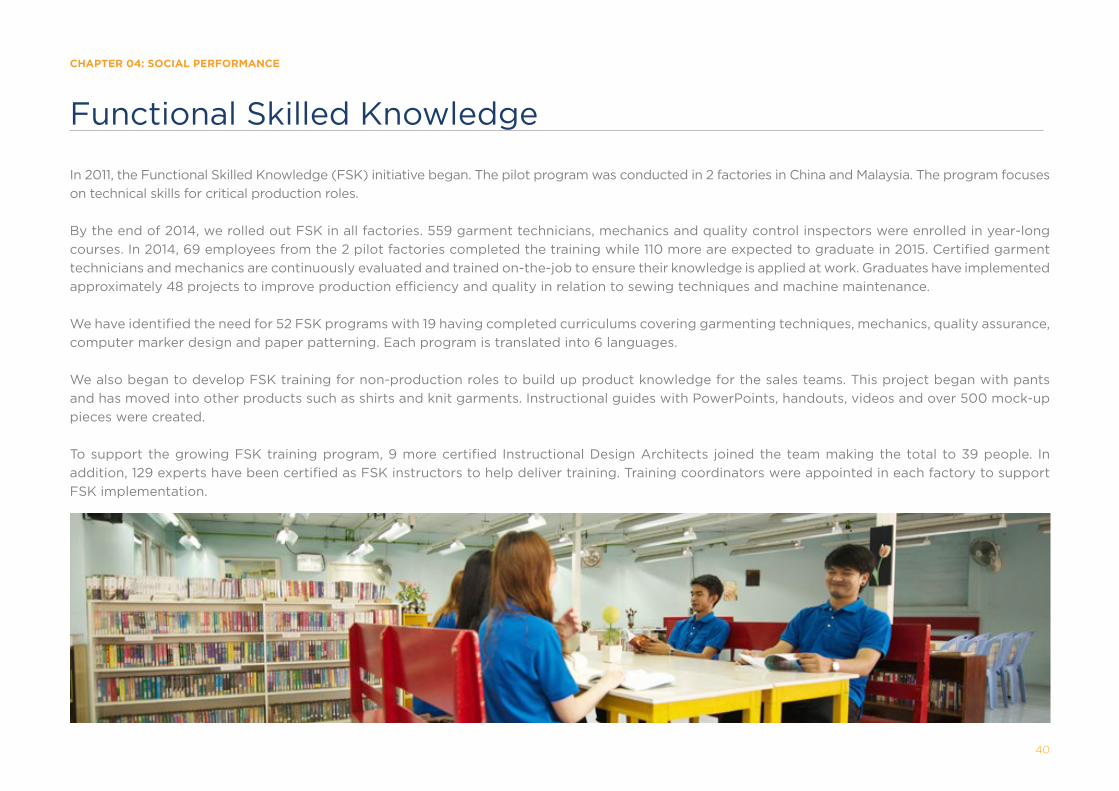
In 2011, the Functional Skilled Knowledge (FSK) initiative began. The pilot program was conducted in 2 factories in China and Malaysia. The program focuses
on technical skills for critical production roles.
By the end of 2014, we rolled out FSK in all factories. 559 garment technicians, mechanics and quality control inspectors were enrolled in year-long
courses. In 2014, 69 employees from the 2 pilot factories completed the training while 110 more are expected to graduate in 2015. Certified garment
technicians and mechanics are continuously evaluated and trained on-the-job to ensure their knowledge is applied at work. Graduates have implemented
approximately 48 projects to improve production efficiency and quality in relation to sewing techniques and machine maintenance.
We have identified the need for 52 FSK programs with 19 having completed curriculums covering garmenting techniques, mechanics, quality assurance,
computer marker design and paper patterning. Each program is translated into 6 languages.
We also began to develop FSK training for non-production roles to build up product knowledge for the sales teams. This project began with pants
and has moved into other products such as shirts and knit garments. Instructional guides with PowerPoints, handouts, videos and over 500 mock-up
pieces were created.
To support the growing FSK training program, 9 more certified Instructional Design Architects joined the team making the total to 39 people. In
addition, 129 experts have been certified as FSK instructors to help deliver training. Training coordinators were appointed in each factory to support
FSK implementation.
Functional Skilled Knowledge

CHAPTER 04: SOCIAL PERFORMANCE
41
In 2010, TAL introduced 9 Managerial Leadership Competencies (MLCs) critical to the success of TAL and its employees. In our last report, we shared
how tools were developed to integrate MLCs into human capital management systems.
In the past 2 years, to educate our colleagues on MLCs, we had to move from raising awareness to getting employees to apply the concepts at work.
To achieve this, aside from classroom training, we arranged reinforcement activities (such as a writing competition and an experience sharing session)
outside of the training rooms. Train-the-trainer activities were conducted to create MLCs Advocates who then drive the learning climate for MLCs in
different TAL sites. There are currently 40 MLCs Advocates.
Our next step is to integrate MLCs with the training and development plans of specific roles. We engaged an external consultant to analyze the MLCs.
The analysis revealed that one of the MLCs known as “Digging Deeper for More” is key for the role of Factory Managing Director to be successful as
they need to systematically seek out information and ask probing questions to identify root cause and create deep insight into a wide range of issues.
Having a competent workforce is critical to the success of TAL. We will continuously promote MLCs to create a competitive edge through our people.
Managerial Leadership Competencies

CHAPTER 04: SOCIAL PERFORMANCE
42
In 2014, we introduced Key Performance Indicators (KPI) to measure safety performance in a more
standardized and comparable way. The indicators chosen were injury rate and working day lost
rate. These metrics, by no means, cover all aspects of health & safety but may reflect how a factory
propagates safety awareness and manages workplace hazards.
Each month, factories report on their injury cases. The incidents collected would include all kinds
of work-related injuries regardless of severity. If the workers had to rest due to the injury then the
factory would record lost time.
Based on OSHA standard, injury and working days lost rates are calculated per 100 full-time
workers (working 40 hours per week, 50 weeks per year). The figures can then be compared
across factories.
The purpose of collecting this data is to set a baseline in each factory and set a target to improve
upon. However, it has been challenging to standardize data collection methods across all factories.
Factories may report a low injury rate because they underreport their cases or because they do
not dedicate resources to measure and analyze injuries. Some factories may account for cases
resolved on the factory floor but others may not. Factories in different regions may also have
different definitions of “work-related injury” because of different laws. We have a long road ahead
to standardize data collection and we have already planned for the development of Standard
Operating Procedures (SOP) concerning ‘Incident Reporting and Investigation’ as well as ‘Incident
Reporting and Statistical Techniques’. Setting the KPI was just the beginning.
Health & Safety Performance
TAA
1.23
0.51
1.47
8.04
5.65
2.67
1.45
2.22
TAVPAL KATIG PAPMCLTG1/3 TG2/4
0.85
2014 Injury Rate
2014 Working Days Lost Rate
10
20
30
40
50
60
70
33.7
24.9
4.8
23.2
15.3
46.3
65.1
15.4 14.8
1
2
3
4
5
6
7
8
9
TAA TAVPAL KATIG PAPMCLTG1/3 TG2/4
CHAPTER 04: SOCIAL PERFORMANCE
43
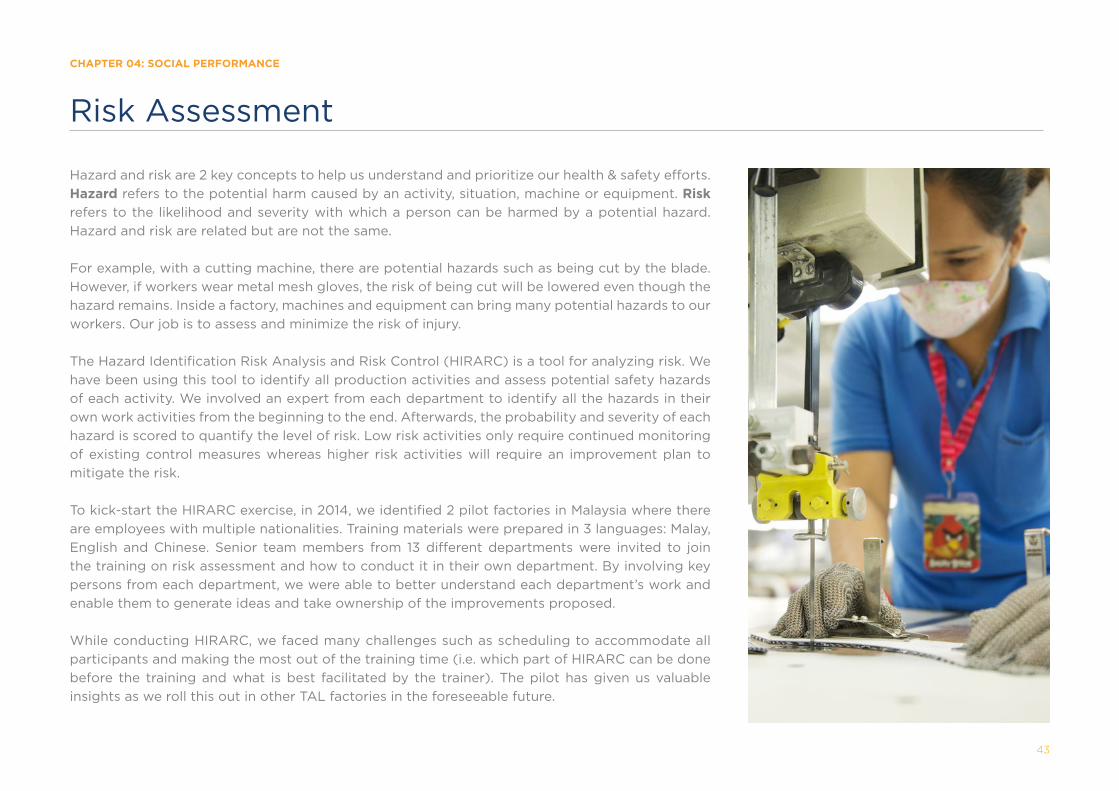
Hazard and risk are 2 key concepts to help us understand and prioritize our health & safety efforts.
Hazard refers to the potential harm caused by an activity, situation, machine or equipment. Risk
refers to the likelihood and severity with which a person can be harmed by a potential hazard.
Hazard and risk are related but are not the same.
For example, with a cutting machine, there are potential hazards such as being cut by the blade.
However, if workers wear metal mesh gloves, the risk of being cut will be lowered even though the
hazard remains. Inside a factory, machines and equipment can bring many potential hazards to our
workers. Our job is to assess and minimize the risk of injury.
The Hazard Identification Risk Analysis and Risk Control (HIRARC) is a tool for analyzing risk. We
have been using this tool to identify all production activities and assess potential safety hazards
of each activity. We involved an expert from each department to identify all the hazards in their
own work activities from the beginning to the end. Afterwards, the probability and severity of each
hazard is scored to quantify the level of risk. Low risk activities only require continued monitoring
of existing control measures whereas higher risk activities will require an improvement plan to
mitigate the risk.
To kick-start the HIRARC exercise, in 2014, we identified 2 pilot factories in Malaysia where there
are employees with multiple nationalities. Training materials were prepared in 3 languages: Malay,
English and Chinese. Senior team members from 13 different departments were invited to join
the training on risk assessment and how to conduct it in their own department. By involving key
persons from each department, we were able to better understand each department’s work and
enable them to generate ideas and take ownership of the improvements proposed.
While conducting HIRARC, we faced many challenges such as scheduling to accommodate all
participants and making the most out of the training time (i.e. which part of HIRARC can be done
before the training and what is best facilitated by the trainer). The pilot has given us valuable
insights as we roll this out in other TAL factories in the foreseeable future.
Risk Assessment

CHAPTER 04: SOCIAL PERFORMANCE
44
Our working environment consists of many fire hazards, such as fabrics that easily burn and
machines that may have short circuits. According to the U.S. National Fire Protection Association,
our industry is classified as high fire risk and we need to take all necessary precautions to reduce
such risk in our factories.
One way to manage fire hazards is to ensure that all fire prevention equipment is reliable and
accessible. We check this monthly through self-monitoring, where the factory health & safety team
ensures that fire extinguishers, hose reels, hydrants, fire alarm systems, sprinkler systems, etc. are
all in good condition.
Another way is to create procedures, provide training and set up Key Performance Indicators (KPIs).
TAL’s Sustainability Team partnered with TAL’s Facilities Team to set up a Standard Operating
Procedure (SOP) in 2013 covering fire prevention and emergency preparedness.
After creating the draft SOP, it was distributed to all factories for review. The factories compared
the SOP with their existing procedures and local law requirements and reverted with their feedback.
The SOP was then finalized as the standard across all TAL factories and it was also followed by 3
working instructions with detailed tasks to perform.
The first work instruction covers fire prevention. It provides guidance on how to identify highly
combustible materials and ensure that they are controlled with proper housekeeping. We also
asked factories to assign persons in charge to maintain high temperature equipment and machines.
Employees who work with these materials were trained on fire hazards and how to manage risk.
Each factory then submitted evidence of their implementation and their efforts were verified
through on site visits.
The second work instruction covers emergency preparedness. Even though we control fire risk,
we still need to best prepare our people to handle emergency situations. Each factory was asked
to appoint a Fire Response Team with 2 sub-teams. The Emergency Response Team ensures that
everyone evacuates from the factory and provides first aid when needed. The Firefighting Team
Fire Safety
CHAPTER 04: SOCIAL PERFORMANCE
45
puts out the fire with firefighting equipment. Both teams are trained regularly. Each factory was
again assessed on how the SOP was implemented.
The third working instruction provides guidance for conducting fire drills. Fire drills are important
exercises to prepare everyone to react accordingly when a real fire occurs. With more than a
thousand employees in each factory, running a fire drill is no simple task. Each employee needs to
understand what to do, who to follow, where to evacuate to and how to gather at the assembly
point. Specific persons are trained to make announcements, support evacuation, conduct roll call,
etc. Observers are appointed to identify bottlenecks, such as congestion at emergency doors and
uncooperative evacuation behaviors.
In order to ensure that all factories conduct fire drills regularly, in 2014, we also set up a KPI for
each factory to run one drill every 6 months.
Setting up SOP and KPI was our first step. Now our factories focus on maintaining such safety
awareness through training and refining procedures based on findings from self-monitoring and
fire drills.
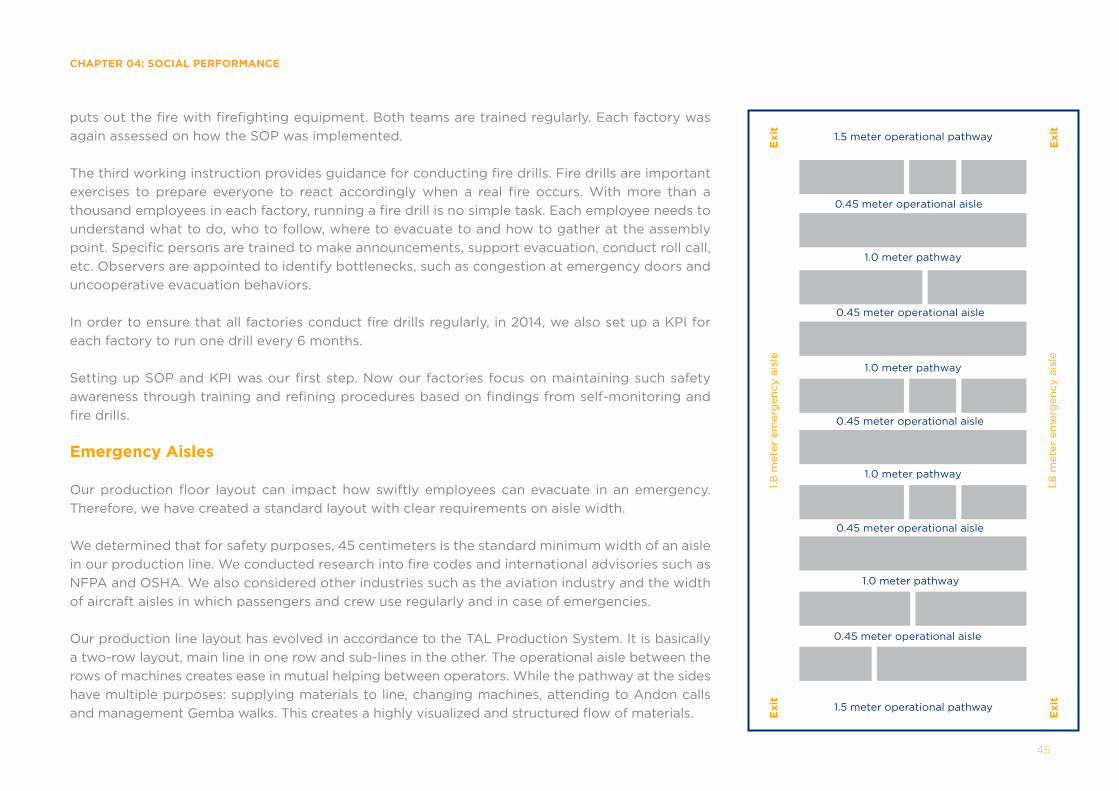
Emergency Aisles
Our production floor layout can impact how swiftly employees can evacuate in an emergency.
Therefore, we have created a standard layout with clear requirements on aisle width.
We determined that for safety purposes, 45 centimeters is the standard minimum width of an aisle
in our production line. We conducted research into fire codes and international advisories such as
NFPA and OSHA. We also considered other industries such as the aviation industry and the width
of aircraft aisles in which passengers and crew use regularly and in case of emergencies.
Our production line layout has evolved in accordance to the TAL Production System. It is basically
a two-row layout, main line in one row and sub-lines in the other. The operational aisle between the
rows of machines creates ease in mutual helping between operators. While the pathway at the sides
have multiple purposes: supplying materials to line, changing machines, attending to Andon calls
and management Gemba walks. This creates a highly visualized and structured flow of materials.
Exit
Exit
Exit
Exit
0.45 meter operational aisle
0.45 meter operational aisle
0.45 meter operational aisle
0.45 meter operational aisle
1.0 meter pathway
1.0 meter pathway
1.0 meter pathway
1.0 meter pathway
0.45 meter operational aisle
1.5 meter operational pathway
1.5 meter operational pathway
1.8
mete
r em
erg
en
cy a
isle
1.8
mete
r em
erg
en
cy a
isle
CHAPTER 04: SOCIAL PERFORMANCE
46
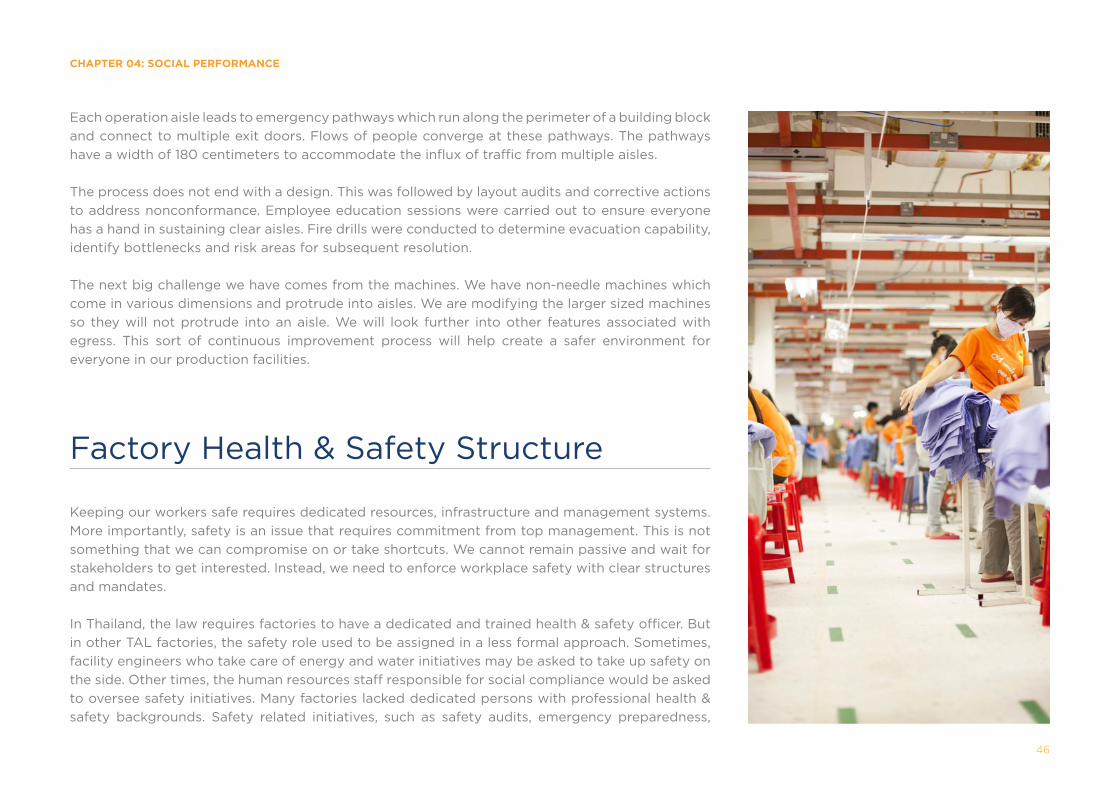
Each operation aisle leads to emergency pathways which run along the perimeter of a building block
and connect to multiple exit doors. Flows of people converge at these pathways. The pathways
have a width of 180 centimeters to accommodate the influx of traffic from multiple aisles.
The process does not end with a design. This was followed by layout audits and corrective actions
to address nonconformance. Employee education sessions were carried out to ensure everyone
has a hand in sustaining clear aisles. Fire drills were conducted to determine evacuation capability,
identify bottlenecks and risk areas for subsequent resolution.
The next big challenge we have comes from the machines. We have non-needle machines which
come in various dimensions and protrude into aisles. We are modifying the larger sized machines
so they will not protrude into an aisle. We will look further into other features associated with
egress. This sort of continuous improvement process will help create a safer environment for
everyone in our production facilities.
Factory Health & Safety Structure
Keeping our workers safe requires dedicated resources, infrastructure and management systems.
More importantly, safety is an issue that requires commitment from top management. This is not
something that we can compromise on or take shortcuts. We cannot remain passive and wait for
stakeholders to get interested. Instead, we need to enforce workplace safety with clear structures
and mandates.
In Thailand, the law requires factories to have a dedicated and trained health & safety officer. But
in other TAL factories, the safety role used to be assigned in a less formal approach. Sometimes,
facility engineers who take care of energy and water initiatives may be asked to take up safety on
the side. Other times, the human resources staff responsible for social compliance would be asked
to oversee safety initiatives. Many factories lacked dedicated persons with professional health &
safety backgrounds. Safety related initiatives, such as safety audits, emergency preparedness,

CHAPTER 04: SOCIAL PERFORMANCE
47
injury case investigation and safety awareness education, were handled in a fragmented way
without a clear strategy for continuous improvement.
In 2014, we took advantage of TAL’s new Standard Factory Structure (SFS) (learn more on page
38) and imposed formal safety roles inside each factory. We mapped out all the work processes
the safety team would be accountable for and assigned tasks to the specific roles based on the
complexity of the task. For example, preparing a 3 year safety strategy, establishing health &
safety management system and setting metrics to measure factory health & safety performance
are more complex tasks. Conducting safety audits, incident investigations and day-to-day safety
training are considered less complex tasks.
2 safety roles were created to handle all safety related work processes inside each factory, an
Environmental Health & Safety (EHS) Manager and a Safety Executive. They were evaluated by the
job evaluation methodology to determine their grade together with all other roles in the SFS. This
safety team will be under the Engineering & Maintenance team which includes mechanics, facilities
engineers and wastewater engineers. This larger team will be overseen by the Operations Director
who also manages production activities.
Since rolling out this new structure, all factories are taking steps to fill the safety positions. TAL will
audit the factories to see if the structure is being properly implemented.
At the same time, we are evaluating the efficacy of this new structure in our factories. Is the
safety team too many levels below the Factory Managing Director? Is the safety team prone to
compromise with production priorities in the current structure? How can we ensure that the safety
team is somewhat independent from production? How clearly should we define the academic
qualifications and experience needed for our EHS Managers?
At the corporate level, hiring a Health & Safety Director will be our next big step. This suggestion
was presented to TAL’s top management in December 2014 and was well received. This position
will be separate from the social and environmental positions in order to give safety more focus.
We are still exploring for the best safety structures and systems to implement. In the next report, we
shall look back at our experience with this new structure and identify opportunities for improvements.
Factory Heath & Safety Team Reporting Line
Factory
Managing
Director
Other
Directors
Production
Units
Facilities
Manager
Chief
Mechanic
Environmental
Health & Safety
Manager
Safety
Executive
Engineering &
Maintenance
Manager
Operations
Director

CHAPTER 04: SOCIAL PERFORMANCE
48
Employee participation is key to building a health & safety culture. Our factories had various
engagement mechanisms and activities to enhance safety knowledge and awareness.
Some factories set up a Health & Safety Committee to get employees more conscious of health &
safety. The committee meets on a monthly or quarterly basis and includes representatives from
management and workers. Each meeting discusses Health & Safety topics such as injury cases, new
safety regulations, progress of action plans, upcoming training and findings from self-monitoring
etc. Members can also bring up safety concerns directly to the management. In between meetings,
committee members would work with the health & safety team to communicate health & safety
standards to workers, engage them to implement health & safety programs, monitor program
implementation and participate in incident investigations and risk mitigation.
In several factories, we also found alternative and innovative ways besides classroom training to
raise health & safety awareness amongst all levels of employees.
Here are a few examples:
One China factory conducted safety competitions. In July 2014, 5 teams of 10 workers participated
in a quiz competition on stage. This competition engaged both the participants and the audience
while refreshing their safety knowledge.
The same factory also ran 4 safety kaizen competitions in 2014. Each team consisted of 4 to 5
people from different departments. They were assigned to one area, such as a production line,
to identify potential safety risk, design an improvement plan and implement the plan within a
specific period of time. The Factory Managing Director then judged the results and declared one
team as winner.
Health & Safety Awareness
Typical Health & Safety Committee Structure
Factory Managing Director
Committee Chair Secretary/Health &Safety Executive
ManagementRepresentatives
Employee Representatives
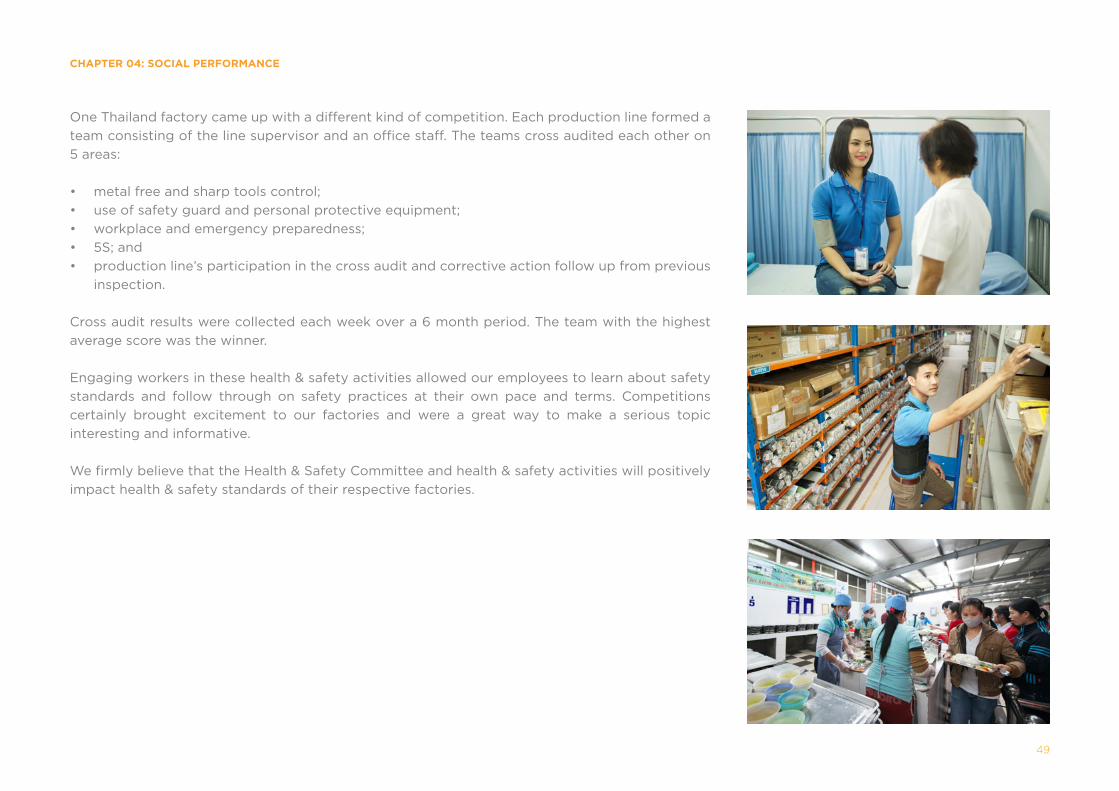
CHAPTER 04: SOCIAL PERFORMANCE
49
One Thailand factory came up with a different kind of competition. Each production line formed a
team consisting of the line supervisor and an office staff. The teams cross audited each other on
5 areas:
• metal free and sharp tools control;
• use of safety guard and personal protective equipment;
• workplace and emergency preparedness;
• 5S; and
• production line’s participation in the cross audit and corrective action follow up from previous
inspection.
Cross audit results were collected each week over a 6 month period. The team with the highest
average score was the winner.
Engaging workers in these health & safety activities allowed our employees to learn about safety
standards and follow through on safety practices at their own pace and terms. Competitions
certainly brought excitement to our factories and were a great way to make a serious topic
interesting and informative.
We firmly believe that the Health & Safety Committee and health & safety activities will positively
impact health & safety standards of their respective factories.

CHAPTER 04: SOCIAL PERFORMANCE
50
Our suppliers are an important stakeholder and since our aim is to be sustainable, it is vital that the rest of our supply chain partners are also sustainable.
TAL is in the middle of the garment supply chain. We partner with fabric and trims suppliers to prepare for production and may fulfill orders with
subcontractors that offer special expertise.
The table below outlines the main types of partners in our supply chain:
Developing a sustainable supply chain has been a challenging area for us since we have been focusing our efforts on ensuring that we have systems to
manage our own labor, health & safety and environmental impacts. Reaching out to the supply chain while still struggling to settle our own issues has
proven to be difficult. However, we have taken some steps to introduce sustainability to the supply chain, particularly with subcontractors that have
the most direct relationship with our production process and add value to our products.
In 2014, we worked with the Supply Chain Management team to integrate the TAL Ethical Business Practices into the Suppliers Welcome Kit. We
also started to set up systems to screen and approve subcontractors. Our factory’s compliance team will visit potential subcontractors and audit
them based on our internal labor, health & safety and environmental standards. If the candidate does not present any major violations then we ask
the candidate to share a recent audit report or relevant certifications to cross reference with our team’s findings. Where such audit reports are not
available, an external professional auditor will be arranged by TAL to audit the subcontractor. The candidate will only qualify upon passing these two
steps of screening.
Subcontractor monitoring is included as a monthly Key Performance Indicator for our factory compliance teams. Each month, factories report all subcontractors
that they are using or that are in the process of seeking approval. This provides a complete picture for prioritizing actions to manage subcontractors.
Our next step is to further refine the system based on the implementation gained from this past year and create standard procedures to guide
factories on how to manage compliance risks with subcontractors. It is also necessary to ensure that relevant departments (e.g. sales, production, and
compliance) communicate in an open and timely manner for the screening and approval process.
Suppliers and Subcontractors
Suppliers
Supply goods to TAL facilities such as fabric, buttons, interlining, carton
boxes, etc. in certain quantity for a specified period of time
Subcontractors
Supply production services such as embroidery, washing, etc. under certain
requested specifications and performed in the subcontractor’s premises

CHAPTER 05: ENVIRONMENTAL PERFORMANCE
51
Environmental Performance
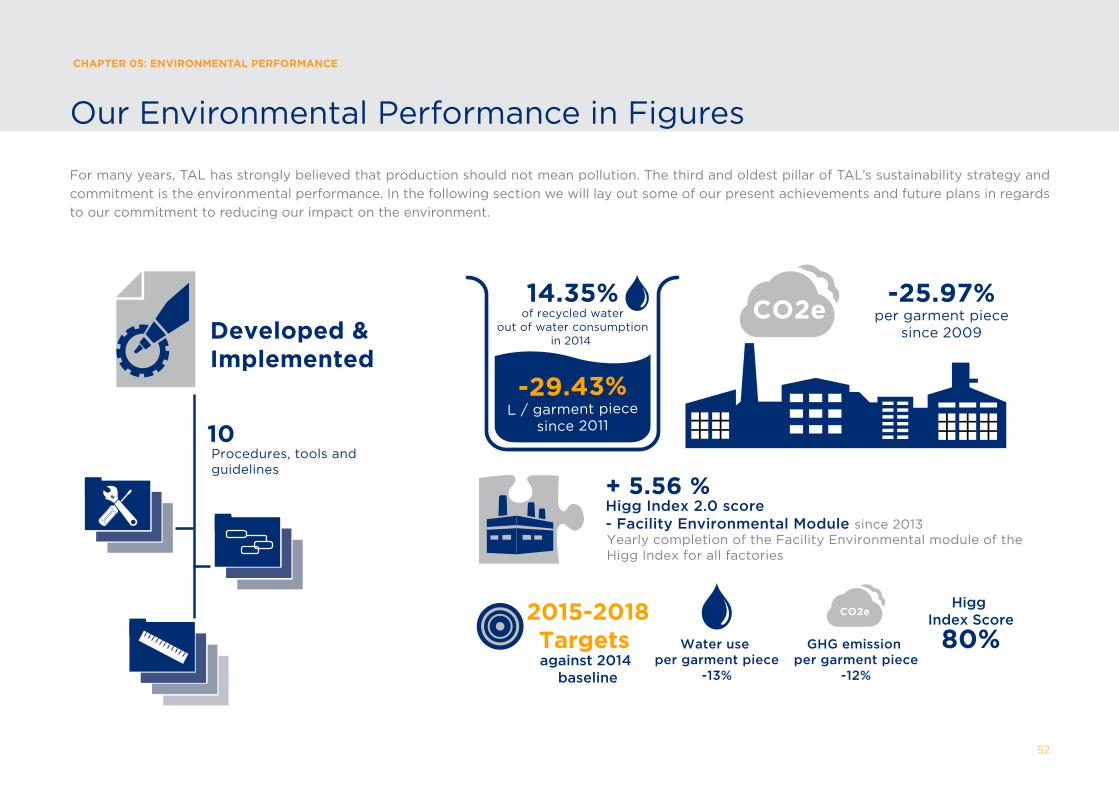
CHAPTER 05: ENVIRONMENTAL PERFORMANCE
52
For many years, TAL has strongly believed that production should not mean pollution. The third and oldest pillar of TAL’s sustainability strategy and
commitment is the environmental performance. In the following section we will lay out some of our present achievements and future plans in regards
to our commitment to reducing our impact on the environment.
Our Environmental Performance in Figures
Procedures, tools and guidelines
10
Developed &Implemented
-29.43%L / garment piece
since 2011
of recycled waterout of water consumption
in 2014
14.35%per garment piece
since 2009
-25.97%
GHG emission per garment piece
-12%
2015-2018 Targets
against 2014 baseline
CO2eHigg
Index Score
80%
Higg Index 2.0 score - Facility Environmental Module since 2013
+ 5.56 %
Yearly completion of the Facility Environmental module of the Higg Index for all factories
Water use per garment piece
-13%
CO2e

Since 2009 TAL has started to implement step-by-step a robust Environmental Management System. Same as every management system, the continuous
improvement work cycle is based on a “Plan, Do, Check, Act” approach.
Based on the environmental impact of our factories and on the hot topics of our major stakeholders, TAL has prioritized areas of improvement.
In the last 2 years TAL has focused on creating a new Standard Operating Procedure (SOP) on water use covering:
• wastewater treatment plant maintenance;
• wastewater treatment plant day-to-day operations;
• wastewater testing and reporting;
• reclaiming water from the wastewater treatment plant; and
• drinking water.
The new SOP developed was implemented across all factories. Each SOP contains a set of definitions, all necessary requirements to follow, an
implementation workflow and the Responsibility Assignment Matrix (RACI Matrix) clearly identifying the scope of work for everyone concerned ensures
that the procedures are fully embodied into the day to day work and process of every stakeholder.
Our strategy is to push forward one environmental aspect at a time. We strongly believe in quality and have focused our efforts to fully and consistently
cover one subject through a full cycle of a management system instead of dividing our resources and trying to tackle multiple subjects at once.
The implementation of a robust management system takes time and a lot of efforts for all the factory teams. It was often the same team involved in
the implementation of a new SOP and in maintaining and improving the existing ones. We could not implement too many topics at once because
implementing a new SOP covering another environmental aspect does not mean dropping the existing management system.
PLAN
DO
CHECKACT
Environmental Management System
CHAPTER 05: ENVIRONMENTAL PERFORMANCE
53

GHG emission calculation guidelines and reporting
Water consumption guidelines and reporting
Air emission testing guidelines and reporting
Wastewater management
Waste management (solid waste and hazardous waste)
Chemical management system
Environmental Aspect Impact Assessment
Supply chain management- Suppliers- Sub-contractors
Targets released to challenge performance
N/A
New round of targets released
N/A
SOP written
*
SOP implemented in every factory
KPI developed to follow up performance
N/A
* We believe that we need to lead by example and first reach a certain level of excellence before starting to engage our supply chain. In the next 4 years, we will focus on covering our major internal impacts and will develop a strategy on how to engage and empower our supply chain partner.
ImplementedTo be developedin the next 4 years
Ongoing
CHAPTER 05: ENVIRONMENTAL PERFORMANCE
54
For the last 2 years we have kept working on water footprint and GHG emissions and have implemented SOPs on wastewater. Here is a summary of what
has been done and will be done in the future:
TAL acknowledges that most of our factories do not have an environmental management system certification. Instead of pursuing external
certifications, TAL has taken ownership and has set up strict internal processes to audit ourselves against the SOPs drafted based on industry best
practices. We prefer to dedicate our factory teams to implement technical solutions that lead to improvement in environmental performance. At
the same time, TAL has collaborated with members of the Sustainable Apparel Coalition (SAC) to develop the Higg Index into an apparel industry
standard. Learn more in page 74.

CHAPTER 05: ENVIRONMENTAL PERFORMANCE
55
TAL has started to perform Environmental Aspect Impact Assessment (EAIA) to identify all the environmental impacts (negative or positive) at
every step necessary to manufacture our products. Environmental aspect refers to all the activities of our production that can impact the environment.
This analysis is a great tool to develop a robust action plan and to prioritize every action depending on their risks.
For example, we use steam for ironing which needs the combustion of fuel in a boiler. One environmental aspect of this activity
is the use of fuel and the related environmental impact is the exhaustion of fossil energy resources. Another aspect is the
emissions of NOx and its related impact is air pollution. A further aspect is the possible leakage of fuel and the related impact
is the contamination of ground and underground water.
With the EAIA methodology, we first have to look at all our production activities, such as cutting, sewing, ironing, washing, wet process, etc. Then
we engage the managers of all such activities to list the type of activities related to environmental aspects, such as transportation, energy, waste
production, air emissions, water use or discharge, noise and nuisance, land use, etc. Afterwards, we match the aspects with impacts on air, water,
ground and underground water and other natural resources.
Based on this analysis, we score the risks of the activities based on the probability of occurrence, gravity and scope of control.
Activities such as wastewater treatment, boiler fuel gas emission and hazardous waste management that need to comply with environmental
regulations are automatically recognized as having significant risk.
In some cases, the assessment also considers the corrective or preventive actions that are already in place or are soon be implemented to control
the risk.
Our 2 factories in Malaysia have started to pilot the assessment and begun mapping all the potential environmental aspects and impacts resulting
from manufacturing processes.
In the process, not only are we able to get a better picture of our environmental impacts, we have also brought together a lot of different stakeholders.
All parties involved have enhanced their awareness about the environmental impacts of their work and the process has enabled discussions about
effective and customized plans to reduce such impacts. We hope that by involving all relevant stakeholders at an early stage, we will be able to
more effectively implement actions on site.
Environmental Aspect Impact Assessment

CHAPTER 05: ENVIRONMENTAL PERFORMANCE
56
We look forward to completing the assessment for these 2 pilot factories as a test for the efficiency of our methodology and will apply it to all the
other factories in the near future.
Significance:"YES" if
under Legal requirement or Score ≥15
NO
YES
NO
NO
NO
NO
Significance:"YES" if
under Legal requirement or Score ≥15
1.25
3.75
2.5
Re
sid
ual
risk
0.25
0.25
0.25
Co
ntr
ol
leve
l
Activities / Control Measures
Cutting patterns designed onsoftware to minimize the waste
Dust filters maintained andchanged
Remnants of cut fabricsent for recycling
5
15
10
Raw
ris
k
5 1 1
5
5
4
2
0.75
1
Raw risk
Pro
bab
ilit
y o
fO
ccu
rre
nce
Sco
pe
of
co
ntr
ol
Se
ve
rity
of
Occu
rre
nce
EnvironmentalImpact
Effect tosurroundingcommunity
Depletion of naturl resources
Landcontamination
EnvironmentalAspects
Disposal ofresidual fabric
Use of fabric
Dust generationX
X
X
Bu
sin
ess
as
Usu
al
Situation
Accid
en
t
Area / Process Activities
Cut the fabric as samplewith scissors
FabricTesting
N
N
N
Legal(Y/N)
Example of Environment Aspect Impact Assessment Matrix

TAL GHG emissions (tCO2e)
Scope 1
Mobile fuel consumption
Stationary fuelconsumption
Purchased electricity
Paper consumption
Business air travel
Total GHG emission (tC02e)
Scope 2
Scope 3
2009
699 796
33,874
70,749
106,307
18
871
762
27,021
60,237
89,653
12
1,618
678
22,434
63,382
88,101
12
1,596
678
19,562
64,829
86,440
5
1,366
673
15,945
68,422
86,745
9
1,695
32,000
64,764
13
894
98,370
2010 2011 2012 2013 2014
our GHG emissions by
yearly absorption
“In we5 years have reduced
11,625 tCO2
= 1.8 million
GHG Intensity (kgCO2e/garment pc)
Target
2.152.72
2.01
2009Baseline
2014
- 21%
Target Reduction
- 25.97%
Actual Reduction
CHAPTER 05: ENVIRONMENTAL PERFORMANCE
57
GHG emission (kilograms of CO2e per garment
piece) is the indicator for evaluating our GHG
footprint and reduction performance across TAL.
In 2009, TAL committed to reducing GHG
emission by 21% by the end of 2014. Due to the
great and constant effort and commitment
of all factories, the reduction exceeded our
target by 6%.
As previously mentioned in our sustainability
report, TAL is following the Greenhouse Gas
Protocol for quantifying and reporting on the
GHG footprint.
Greenhouse Gas Emission Program Performance

CHAPTER 05: ENVIRONMENTAL PERFORMANCE
58
Based on our data collection, scope 2 emissions
is the major contributor to our GHG footprint.
Therefore, we are working on decreasing our
electricity consumption by responsible usage and
technical enhancement of machines.
Another angle can be to choose an energy provider
with a greener energy mix to lower the emission
factor of our purchased electricity. Unfortunately, in
the countries where our factories are located, there
are no such providers and the return on investment
of installing renewable energy production devices
on site is not compatible with economic efficiency.
The second largest contributor of our GHG emissions
is stationary fuel combustion equipment. Out of all
our equipment, boilers are the main contributor to
emissions. Heavy fuel oil (37.20% in 2014) was the
main source of emissions, followed by light fuel oil
(34.19%) and natural gas (22.82%).
In the last 2 years, we decreased our GHG emissions
through 2 methods: decrease the overall consumption
of energy and switched to greener energy.
TAL is increasing the proportion of light fuel oil and
natural gas because their emission factors are lower
whilst decreasing the use of heavy oil. The LPG is
mainly used for our wet process ovens and a small
part for our cooking stoves. Please refer to GHG
Reduction Initiatives on page 63.
*Our sources for the emissions factors used are DEFRA (Department for Environment Food & Rural Affairs of UK government) and HKCA (guidelines to account for and report on Greenhouse Gas Emissions).
Trends of GHG Intensity (tCO2e/ Output Piece)
Scope 1 Mobile Fuel Combustion
Scope 2 Purchased Electricity
Scope 3 Business Air Travel
Scope 1 Stationary Fuel Combustion
2011
2.5
2.0
1.5
1.0
0.5
-2012 2013 2014
GHG Intensity (tCO2e/garment piece) for Stationary Fuel Combustion
GeneratorBoiler
Dipping Oven
Cooking Stove
Water Heater
2011
0.2
0.4
0.6
0.02012 2013 2014
0%
20%
40%
60%
80%
100%
2011 2012 2013 2014
Ratio of Energy Type for Boiler(tCO2e/Garment Piece)
Natural GasLight Fuel Oil
Diesel Oil Heavy Fuel Oil
Diesel Oil
Biomass Wood Pellet Light Fuel Oil
Heavy Fuel Oil Natural Gas
LPG
GHG Intensity (tCO2e/garment piece)per Type of Energy for Stationary Equipment
0.6
0.5
0.4
0.3
0.2
0.1
0.02011 2012 2013 2014

CHAPTER 05: ENVIRONMENTAL PERFORMANCE
59
Water intensity (liters per garment piece)
is our indicator for evaluating our water
footprint and reduction performance across
TAL. In 2011, TAL committed to reducing water
intensity by 15% by the end of 2014.
Thanks to the efforts of all our factories, TAL
has exceeded the original objective of 15%
water intensity reduction. As a result of our 4
year action plan, water intensity was reduced
by 29.43% by the end of 2014 when compared
to water intensity in 2011.
The vast majority of water consumption
source is municipal water (up to 81%). In
the last 2 years TAL has made considerable
investments to implement processes that
allow us to reclaim and reuse water. In 2014
our water consumption consisted of up to
14.35% of reclaimed and reused water. See
more information on our water reduction
initiatives on page 65.
Water Footprint Program Performance
Target Reduction
- 15%
Actual Reduction
- 29.43 %
Target40.39
2011 2014
Water Intensity (L/garment pc)
33.53
47.52
our water consumption by
Olympic-size swimming pool
In we3 years reduced
336,194m3
= 134

CHAPTER 05: ENVIRONMENTAL PERFORMANCE
60
To get an accurate and more granular picture
of our water consumption we installed sub-
meters in all factories. We were therefore
able to detect leakages and to better manage
our consumption as well as to identify the
“thirstiest” process, equipment or area in
order to prioritize our effort and launch an
efficient action plan. We separated usage into
4 buckets:
1. domestic water,
2. industrial – wet process,
3. industrial – other process use, and
4. industrial – facility use.
We realize after months of reporting that
maintaining the accuracy of the sub-meter
measure is no easy task because of piping
design modifications. We will need to work
on this to allow us to collect and analyze data
more accurately.
Water Consumption by Source in 2013-2014 Water Withdrawal by Use in 2013-2014
Municipal Domestic Industrial
Water recycled and reused
Collected rainwater in on-site pond and tank
60%81%
6%
13%
40%

CHAPTER 05: ENVIRONMENTAL PERFORMANCE
61
Energy and Water Audits
At the end of 2013, TAL contracted a highly specialized consulting firm with different fields of
expertise to identify possible improvements in terms of energy and water efficiency. Energy and
water audits were conducted to help us design plans to reduce usage. The ultimate objective was
not only to have a clearer and more precise picture of our impact but also to find technical and
engineering solutions to reduce our impact.
Water and energy consumption data were collected and analyzed and the type and model of
equipment or machines used by each factory were also considered. A report that highlighted potential
improvements to the systems installed and a plan to achieve objectives and targets were issued for
each factory.
In each report, energy and water consumption was broken down by specific machines and
appliances. The report was so detailed that it could identify a specific group of pressing machines
for example. With this information we were able to better prioritize our actions and make efficient
reduction plans.
We were surprised that each factory’s usage differed. Some factories required focus on steam
production while others needed to start improving their HVAC system. There was also difference in
water data. Some factories had to start their work on dormitories and canteen usage while others
on the manufacturing process. Therefore, each factory required a tailored plan.
From this analysis, the auditors conducted detailed root cause analysis for inefficiencies and came
up with tailor-made technical action plans and reduction schemes.
Each factory was provided with a specific action plan divided into 3 top priorities based on the
3 most energy and water consuming equipment categories. Then each action was classified,
based on their Return on Investment (ROI), into 2 buckets: energy and water savings potential and
investment required. Every action proposed was based on the issues identified on site for specific
equipment and the root cause analysis undertaken.
61%
10%
8%
5%
5%4%
4%3%
Dormitory, CanteenSteam Production
AC System
Dipping & Washing
Production Machines Others
Lighting
Compressed Air
30%
12%
12%12%
9%
3%
16%
3%3%
Breakdown of Energy Consumptionby End-use
Dormitory, CanteenAC System
Dipping & Washing
Lighting
Compressed Air Others
Wastewater Treatment Plant
Vacuum Pumps
Breakdown of Electricity Consumptionby End-use

CHAPTER 05: ENVIRONMENTAL PERFORMANCE
62
This thorough and highly technical study was used in 2 major internal projects.
First, every factory used its own tailor-made report to implement an effective action plan to achieve
reduction targets. The audit provided each factory with technical advice and clear prioritization
driven by the ROI.
TAL then used the reduction scheme of the audits to customize GHG and water targets for the
next 4 years for each factory. The detailed analysis from the audit enabled us to take into account
factory specific constraints to tailor realistic but challenging targets for each factory. With the
analysis we can yield tangible and efficient results from each factory.
“In each report, energy and water
consumption was broken down by
specific machines and appliances. The
report was so detailed that it could
identify a specific group of pressing
machines for example. With this
information we were able to better
prioritize our actions and make efficient
reduction plans.”
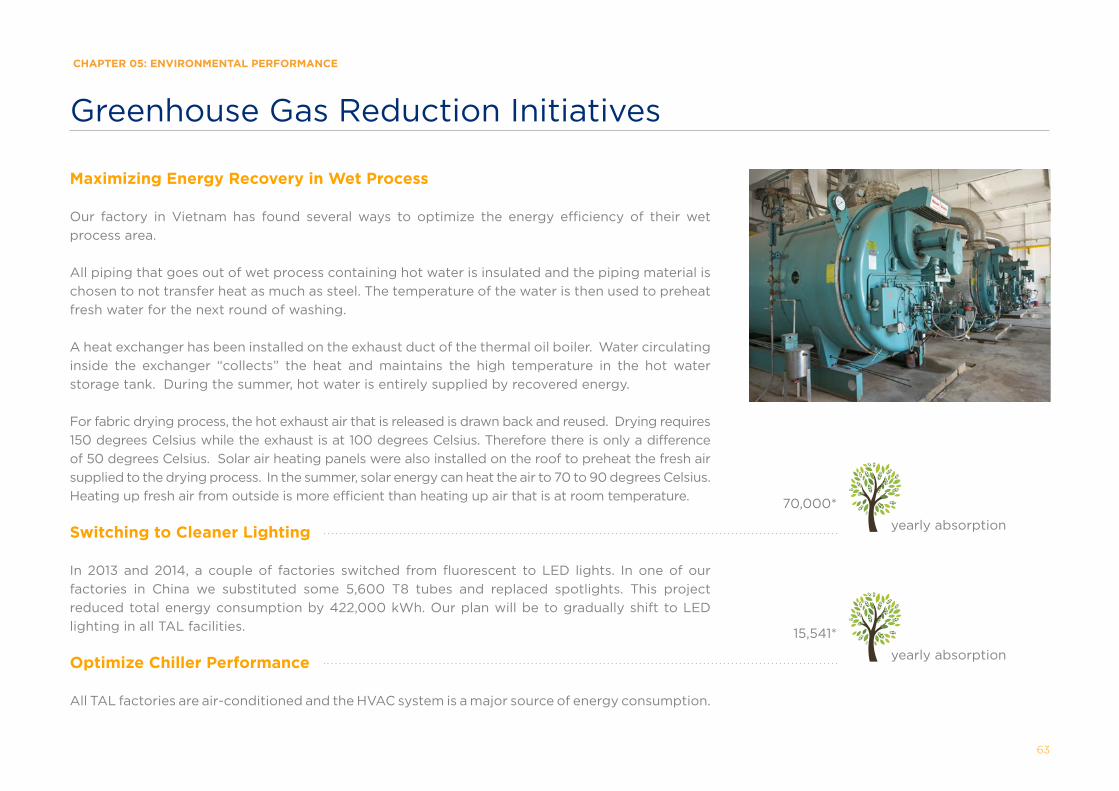
CHAPTER 05: ENVIRONMENTAL PERFORMANCE
63
Greenhouse Gas Reduction Initiatives
Maximizing Energy Recovery in Wet Process
Our factory in Vietnam has found several ways to optimize the energy efficiency of their wet
process area.
All piping that goes out of wet process containing hot water is insulated and the piping material is
chosen to not transfer heat as much as steel. The temperature of the water is then used to preheat
fresh water for the next round of washing.
A heat exchanger has been installed on the exhaust duct of the thermal oil boiler. Water circulating
inside the exchanger “collects” the heat and maintains the high temperature in the hot water
storage tank. During the summer, hot water is entirely supplied by recovered energy.
For fabric drying process, the hot exhaust air that is released is drawn back and reused. Drying requires
150 degrees Celsius while the exhaust is at 100 degrees Celsius. Therefore there is only a difference
of 50 degrees Celsius. Solar air heating panels were also installed on the roof to preheat the fresh air
supplied to the drying process. In the summer, solar energy can heat the air to 70 to 90 degrees Celsius.
Heating up fresh air from outside is more efficient than heating up air that is at room temperature.
Switching to Cleaner Lighting
In 2013 and 2014, a couple of factories switched from fluorescent to LED lights. In one of our
factories in China we substituted some 5,600 T8 tubes and replaced spotlights. This project
reduced total energy consumption by 422,000 kWh. Our plan will be to gradually shift to LED
lighting in all TAL facilities.
Optimize Chiller Performance
All TAL factories are air-conditioned and the HVAC system is a major source of energy consumption.
yearly absorption
yearly absorption
70,000*
15,541*

CHAPTER 05: ENVIRONMENTAL PERFORMANCE
64
In Vietnam, the factory has taken advantage of cooler winter temperatures to minimize the chiller’s
load. Whenever the outside temperature is low and the humidity is below 65%, they reduce the
return air volume by half and increase fresh air intake. This relatively small investment has saved
around 153,800 kWh over 2 years of implementation.
Secondary Insulation for High Temperature Machine
The fusing and pressing machines we use in production release heat into the surrounding
environment. This lowers HVAC system performance and creates safety risks for workers.
One China factory has designed insulation covers to reduce heat loss. The cover was made with
3 materials: polyethylene foam, glass fiber and rock wool. Each material was used based on the
machine’s temperature and was sewn in-house. Using this insulation method alone saved around
35,000 kWh.
Switching to Biomass Boiler
All our factories use boilers to generate steam for production and these boilers are propelled by
fuel combustion. One of our factories in China switched from diesel to natural gas in 2011 and then
to biomass in 2014. The biomass used is wood pellets made from furniture waste and crop straw
in a bordering province. In order to be really sustainable, it is important for us to not use wood
pellets made from direct forestry but to find wood pellets made from a by-product of other close
by industries. By switching from fossil fuels to biomass, the project reduced energy cost by 20%
and reduced carbon emissions by over 3,000 tons per year as the CO2 emission of wood pellets
is much lower than natural gas.
Introduce Smarter Energy Management
We have installed an online energy monitoring system in our China factory to track energy usage
in real time. The system can show if some machines are left idle and relevant people are alerted to
turn those machines off. It can also allow us to benchmark the performance of different equipment
and the energy usage of specific production areas and processes. This tool has allowed us to
quickly identify machines and systems that may be malfunctioning, inefficient or idle. On this basis,
the factory estimates energy savings of 5%.
yearly absorption
5,059
yearly absorption
470,000
*These figures show the amount of greenhouse gas emissions reduced by a project, equivalent to the amount of carbon dioxide absorbed by a certain number of trees per year.
yearly absorption
yearly absorption
5,059*
470,000*

CHAPTER 05: ENVIRONMENTAL PERFORMANCE
65
Water Reduction Initiatives
Reclaim Wastewater through Recycling Processes
Since 2011 and the first water reduction target plan, TAL has
been working on several technical solutions to reduce our
water consumption. The entire water conservation program
was expanded from reuse to recycling. Prior to 2013, the water
reuse program was vastly endorsed by harvesting the rainwater
or reusing the industrial water within the washing process, also
called cascade use in wet process.
In the reuse water program, the water is collected and consumed
without passing through any treatment system. We have worked
on this project since 2011.
Starting in 2013, 2 plants in China were chosen to upgrade their
wastewater treatment systems with the objective to treat the
water for reclaiming purposes. The systems were ready to operate
by January 2014. The reconstruction of the piping system and
installation of water tanks took more time than we expected.
Reclaiming water is more complex than reusing water because
it involves the recovery of wastewater to the desired standard
before it can be used again. The reclaimed water needs to meet
much more stringent quality parameters for it to be able to be
used again in the process.
A series of mechanisms were set up to measure the system’s
efficiency from a qualitative and quantitative perspective. The
monitoring parameters included water quality, reclaimed water
consumption and water intensity.
Reclaimedwater
deliveredto washing process
Waterconsumed in washing
process
City water replenishment
Reclaimedwater storage
tank
Wastewaterfrom washing
process
Wastewatersent for
biologicaltreatment
Water lost throughevaporation andgarment adsorption
Water lost throughevaporation &analysis
Purificationof treated
water
Reclaimedwater
qualitycontrol
ParameterParameters to be Tested before Recycling
RangepH 6-8
Free Chlorine < 0.1 ppm
Iron < 0.1 ppm
Total Hardness < 25 ppm
Silica < 3 ppm
Manganese < 0.01 ppm
Alkalinity (to Methyl Orange) < 64 ppm
TDS < 150 ppm
Color < 10 Hazen UnitFecal Coliform < 17% of Sample ND or
Max 25cfu/100mL

CHAPTER 05: ENVIRONMENTAL PERFORMANCE
66
To ensure that wastewater is good enough to be reclaimed, we
have identified a set of parameters to be tested before the water is
qualified for recycling. After the treatment process, the reclaimed
water sample is collected and tested before the water is sent to
the storage tank.
Reclaimed water consumption and water intensity are 2 related
indicators to gauge the overall efficiency of reclaimed water
in the wet process. Monitoring the volume of reclaimed water
consumption is a direct method to track our capacity to treat,
recycle and reintroduce water into production at the desired
quality. To measure this, water meters were installed at the main
reclaimed water distribution pipeline to measure the volume of
reclaimed water returning to the factory on a daily basis.
Furthermore, water intensity is established as a complementary
parameter because the amount of reclaimed water consumed
is dependent on the number of garments that go through the
washing process. Reclaimed water consumption may increase
during the peak season and decrease in the low season. Therefore,
water intensity is established to measure the amount of municipal
water used per garment piece. The more water that is reclaimed
and reused for wet process, the lower this measure will be as the
consumption of fresh water will decrease.
The percentage of reclaimed water usage increased from 2% in
2013 to 56% in 2014 for our 2 China factories.
When fully efficient and during the peak season, one of the plants
was able to reclaim 100% of wastewater back in the wet process. So
only 3-4% of city water was needed to compensate for evaporation
and lost water during the reclaiming process. This system allows
the factory to go from an average of 21 liters to 5 liters of city water
Volume (m3) of Water Reclaimed and Reused
1,842,680
2013 2014
14.35%12.29%
258,250
1,655,199
277,321
Water Reclaimed / Reused
Water Withdrawal

CHAPTER 05: ENVIRONMENTAL PERFORMANCE
67
consumed per garment piece in the wet process.
The other TAL factories have implemented the recycling program
too but are not yet able to reclaim the water back into the
production process. Instead, the reclaimed water is used for
gardening, flushing toilets, irrigation, etc.
Moving forward, TAL will expand the industrial water reclaiming
effort to other factories, such as Malaysia and Thailand.
Minimizing Water Usage in Wet Process
In our Vietnam factory, we introduced counter flow principles to
maximize water use efficiency in our wet process. Fabric enters
from one side and water flushes through from the opposite side.
After rinsing the fabric, the water and chemicals are collected
in a storage compartment for reuse. There, we also manage
water flow through a CPU (central processing unit) calibrated to
control water use (in liters) based on the weight (in kg) of fabric
washed. The CPU automatically varies the flow rate as the rate of
production or the weight of fabric being washed changes. In this
way, we optimize the water needed for washing our garments.

CHAPTER 05: ENVIRONMENTAL PERFORMANCE
68
LEED in Hong Kong Headquarters
In our last sustainability report, we reported
how we renovated and expanded our factory
in Vietnam in accordance to the LEED
(Leadership in Energy and Environmental
Design) Gold standard. We have continued our
green building efforts with the renovations of
our Hong Kong headquarters. We commenced
renovations in June 2014 using the LEED
Commercial Interiors (2009) standard. The
aim is to create a workplace that is not only
aesthetically appealing but also comfortable for
our people and beneficial to the environment.
Stay tuned for updates in our LEED projects in
the next sustainability report.
Energy
• LED light panels replaced fluorescent lights,
reducing lighting power by 35% and keeping
the indoor environment cooler and brighter;
• 90% of new equipment purchased are
ENERGY STAR labeled, ensuring high energy
performance of our appliances;
• Lighting systems have occupancy and
daylight sensors to optimize the use of natural
light; and
• Zoning control for HVAC is installed to keep
the office at comfortable temperature while
saving energy.
Water
• Low-flow faucets and toilets in bathrooms
and kitchens, reducing up to 45% of water
use.
Indoor Air Quality
• Fresh air vents and carbon dioxide monitors
to ensure that outside fresh air is pumped
indoors;
• Furniture, furnishings and finish materials
tested for low VOC levels to reduce indoor
contaminants; and
• Use of eco-friendly housekeeping products to
reduce chemical use.
Materials and Resources
• Furniture containing regional FSC certified
wood, recycled metal and recycled plastic
and manufactured within TAL’s region;
• Reuse existing materials for renovation, such
as plugs, doors, etc.; and
• Recycling paper, cardboard, metals, plastic
and glass during the construction phase and
on renovated floors.
LEED Features in Our Offices:

Chemicals are used in textiles and apparel production. Some of these are hazardous and can be harmful to the environment. In 2011 and 2012
Greenpeace issued the reports “Dirty Laundry” and “Toxic Threads: Putting Pollution on Parade” which shaped the formation of the Zero Discharge of
Hazardous Chemicals (ZDHC) initiative. A number of our key customers started to commit to zero discharge of hazardous chemicals throughout their
supply chains and products by year 2020.
There are 11 classes of priority chemicals:
TAL aims to eliminate the use of the above chemicals in our own wet process and is also setting up policies requiring our upstream suppliers not to
use any of the above chemicals in their manufacturing processes. 2 classes of priority chemicals above are particularly relevant to TAL manufacturing.
They are: APs & APEOs and PFCs.
In 2013, we completely substituted chemicals that contained APs & APEOs. By the end of 2014, we switched from C8 to C6 PFCs in our pants factory. We
aim to stop the use of C8 PFCs in all our factories by the end of 2015. We strive to phase out the use of all PFCs before 2020 in all our production facilities.
At TAL, we monitor the use of chemicals based on the Restricted Substance List (RSL) as set up by the American Apparel & Footwear Association
(AAFA). The RSL is to monitor and limit restricted substances found in the finished products. The RSL is updated regularly by AAFA and we keep a
close eye on it. In the ZDHC Joint Roadmap, a Manufacturing RSL (MRSL) was developed which addressed hazardous substances potentially used
and discharged into the environment during the manufacturing and related processes (not just those which could be present in finished products). In
2014, TAL responded by working with each of our chemical suppliers to ensure that purchased chemicals for our own production met the established
MRSL limits. Our wastewater has been tested twice a year since 2013 by a third party laboratory to confirm whether any relevant priority substances
(APs/APEOs and PFCs) exceed the stipulated limits.
In the coming years, we will continue to work on our chemical management system to make it more robust, to cover all of our factories and to go
beyond production areas such as laboratory, maintenance, dormitories and cleaning.
CHAPTER 05: ENVIRONMENTAL PERFORMANCE
69
• Alkylphenols (APs) & Alkylphenol Ethoxylates (APEOs)
• Azo Dyes
• Brominated and Chlorinated Flame Retardants
• Chlorinated solvents
• Chlorobenzenes
• Chlorophenols
• Organotin
• Phthalates
Chemical Management
• Short Chain Chlorinated Paraffins (SCCPs)
• Total heavy metals
• Perfluorinated Chemicals (PFCs)
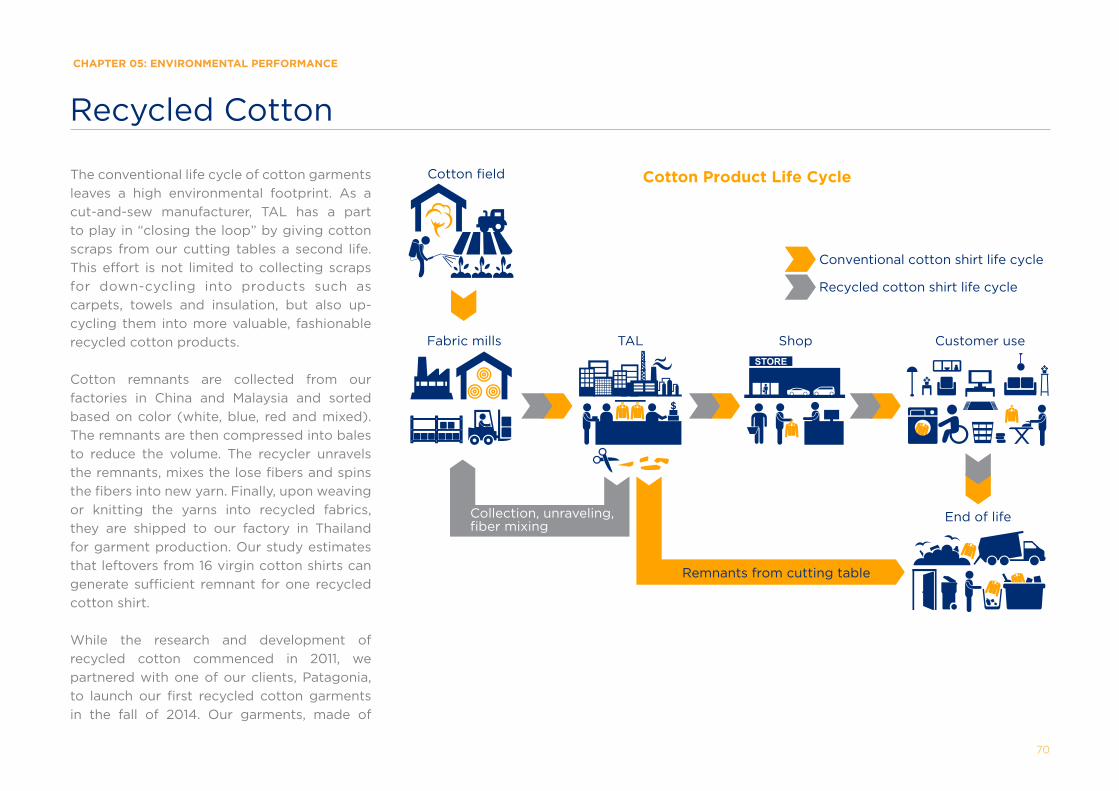
CHAPTER 05: ENVIRONMENTAL PERFORMANCE
70
Recycled Cotton
The conventional life cycle of cotton garments
leaves a high environmental footprint. As a
cut-and-sew manufacturer, TAL has a part
to play in “closing the loop” by giving cotton
scraps from our cutting tables a second life.
This effort is not limited to collecting scraps
for down-cycling into products such as
carpets, towels and insulation, but also up-
cycling them into more valuable, fashionable
recycled cotton products.
Cotton remnants are collected from our
factories in China and Malaysia and sorted
based on color (white, blue, red and mixed).
The remnants are then compressed into bales
to reduce the volume. The recycler unravels
the remnants, mixes the lose fibers and spins
the fibers into new yarn. Finally, upon weaving
or knitting the yarns into recycled fabrics,
they are shipped to our factory in Thailand
for garment production. Our study estimates
that leftovers from 16 virgin cotton shirts can
generate sufficient remnant for one recycled
cotton shirt.
While the research and development of
recycled cotton commenced in 2011, we
partnered with one of our clients, Patagonia,
to launch our first recycled cotton garments
in the fall of 2014. Our garments, made of
Recycled cotton shirt life cycle
Remnants from cutting table
Cotton field
Fabric mills TAL Shop Customer use
End of life
Cotton Product Life Cycle
Conventional cotton shirt life cycle
Collection, unraveling,fiber mixing

CHAPTER 05: ENVIRONMENTAL PERFORMANCE
71
blended reclaimed cotton with virgin organic
cotton, were included as part of Patagonia’s
Truth to Materials collection. The collection
featured garments made of undyed cashmere,
reclaimed wool and recycled cotton in order to
raise awareness of responsible products that
use less processing and fewer virgin resources.
Over 2013 and 2014, TAL collected close to
100 tons of cotton scraps and sold over 13,000
garments. This iconic, green and fashionable
collection was recognized by Vogue US in
October 2014.
Through launching this garment, we learned
at least 2 major challenges for scaling up
our recycled cotton project: quality and
economics.
Compared with virgin cotton yarns, recycled
ones are generally of lower quality because
the unraveling process shortens fiber length
and the new yarns blend fibers of different
qualities. Furthermore, recycled cotton yarns
seldom come in consistent colors. For example,
reds and blues come in many shades. Despite
white-colored remnants being separated from
dominant colors such as red, the recycling
process still gives the fibers a greyish “washed
out” color.
To ensure the quality of recycled cotton fabrics,
only high quality fabrics can be used (e.g. shirt
fabric instead of pants fabric) and employees
Remnantwastegeneration
Environmental Impact Reduction throughout the Recycled Cotton Product Life Cycle*
lead to
TAL factory
Cotton production
Land use
Fertilizer leachedinto water bodies
Fertilizer use
Water use
Dilution water for fertilizer leached
Irrigation
*Product Life Cycle Assessment & Carbon footprint test report - study performed in July 2010. The study is based on the World Resource Institute Greenhouse Gas Protocol Product Life Cycle Standard.
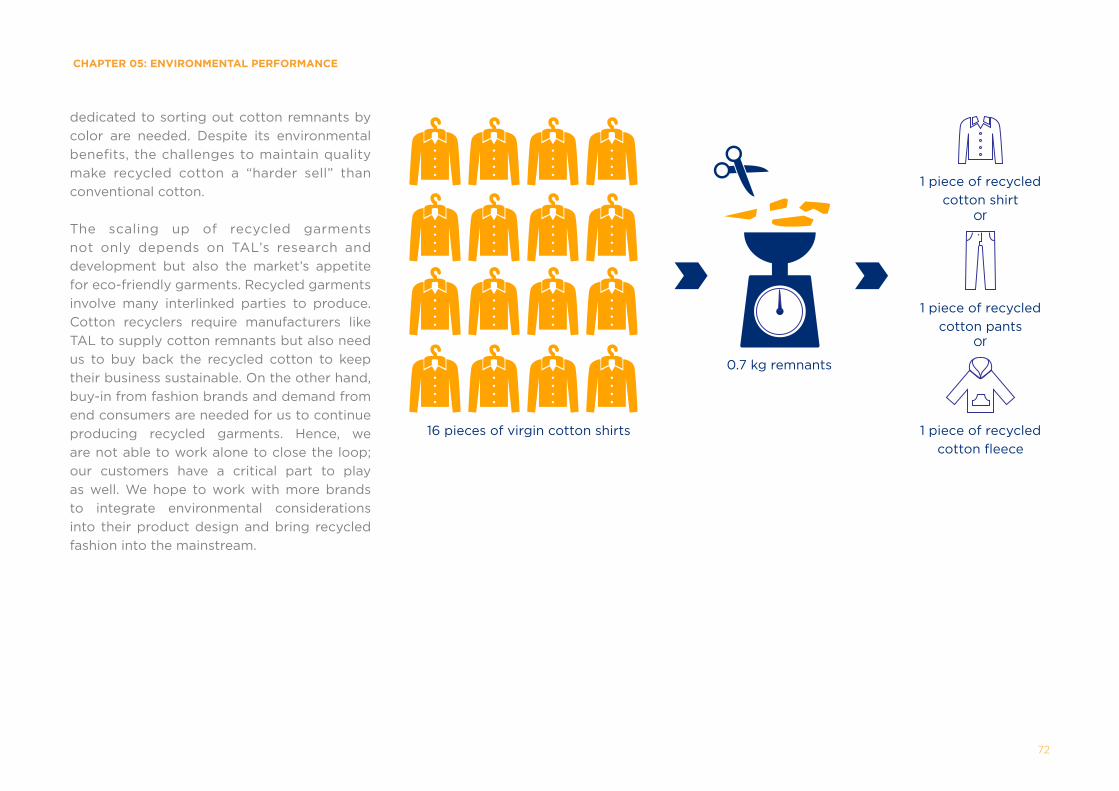
CHAPTER 05: ENVIRONMENTAL PERFORMANCE
72
dedicated to sorting out cotton remnants by
color are needed. Despite its environmental
benefits, the challenges to maintain quality
make recycled cotton a “harder sell” than
conventional cotton.
The scaling up of recycled garments
not only depends on TAL’s research and
development but also the market’s appetite
for eco-friendly garments. Recycled garments
involve many interlinked parties to produce.
Cotton recyclers require manufacturers like
TAL to supply cotton remnants but also need
us to buy back the recycled cotton to keep
their business sustainable. On the other hand,
buy-in from fashion brands and demand from
end consumers are needed for us to continue
producing recycled garments. Hence, we
are not able to work alone to close the loop;
our customers have a critical part to play
as well. We hope to work with more brands
to integrate environmental considerations
into their product design and bring recycled
fashion into the mainstream.
16 pieces of virgin cotton shirts
0.7 kg remnants
1 piece of recycled
cotton pants
1 piece of recycled
cotton fleece
1 piece of recycled
cotton shirt
73
CHAPTER 06: INDUSTRY COLLABORATION
Industry Collaboration
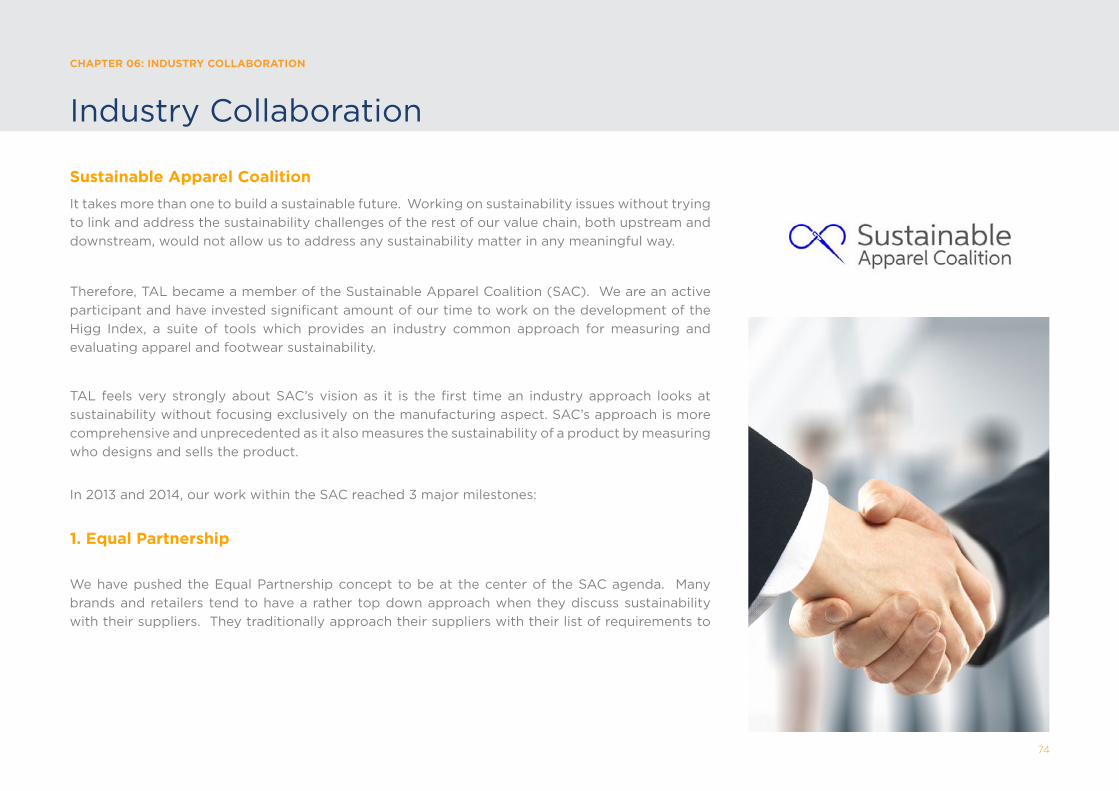
74
CHAPTER 06: INDUSTRY COLLABORATION
Industry Collaboration
Sustainable Apparel Coalition
It takes more than one to build a sustainable future. Working on sustainability issues without trying
to link and address the sustainability challenges of the rest of our value chain, both upstream and
downstream, would not allow us to address any sustainability matter in any meaningful way.
Therefore, TAL became a member of the Sustainable Apparel Coalition (SAC). We are an active
participant and have invested significant amount of our time to work on the development of the
Higg Index, a suite of tools which provides an industry common approach for measuring and
evaluating apparel and footwear sustainability.
TAL feels very strongly about SAC’s vision as it is the first time an industry approach looks at
sustainability without focusing exclusively on the manufacturing aspect. SAC’s approach is more
comprehensive and unprecedented as it also measures the sustainability of a product by measuring
who designs and sells the product.
In 2013 and 2014, our work within the SAC reached 3 major milestones:
1. Equal Partnership
We have pushed the Equal Partnership concept to be at the center of the SAC agenda. Many
brands and retailers tend to have a rather top down approach when they discuss sustainability
with their suppliers. They traditionally approach their suppliers with their list of requirements to

75
CHAPTER 06: INDUSTRY COLLABORATION
be complied with but do not consider whether their suppliers already have a sustainability strategy and roadmap. For suppliers to take ownership of
sustainability, their clients have to give up their “one size fits all’ methodology. Equal partnership requires trust, respect, listening and consideration
of the supplier’s existing sustainability agenda and acknowledgement that the unequal approach stifles innovation, ownership and problem solving.
2. Consumer Facing Label
For the past 20 years, the retail cost of garment has been constantly decreasing whereas the manufacturing cost has been steadily increasing.
Consumers have therefore been buying garment at an inaccurate and unsustainable price. TAL is delighted to contribute to the thought process of
a consumer facing label that would display sustainability performance of apparel and footwear products and educate consumers to change their
purchasing behavior.
3. Higg Index Verification
In 2014, we started working on the verification process of the Higg Index environmental facility module. Currently, the Higg Index has a self-assessment
component only. For the Higg Index to become a common approach for measuring and evaluating sustainability performance, validation is an absolute
necessity.
TAL is dedicating time and resources to the development of the Higg Index verification portion as we hope the Higg Index will become the industry
standard to measuring environmental and later, social sustainability. We have been suffering from numerous audits and complying with multiple
standards which are causing us a high degree of frustration and efforts redundancy. We hope our dedication in the verification task team will serve to
eliminate all these inefficiencies in the future.
What might the consumer facing label look like?
1. Provide information about product sustainability to influence consumers to make sustainable purchases;
2. Provide information to educate the consumer for a more sustainable use phase of the product; and
3. Collect data on buying habits, application and end of life information via smart devices. Currently we lack information regarding the way the
end consumers handle (wash times, wash temperature, iron, tumble dry, etc.) and dispose (reuse, recycle, dispose, etc.) of their garment. A smart
label can help collect this type of information and can also provide insight on how to create a more sustainable ‘next version’ of the product.

76
CHAPTER 06: INDUSTRY COLLABORATION
Talking to the Future
Every year in May, we welcome a group of merchandising students from The University of North Texas to talk about sustainability and also to
see one of our factories for them to learn about manufacturing.
This yearly encounter happens during their Hong Kong – Beijing Study Tour during which the students interact with business leaders and
industry insiders in the retail and merchandising industries. The students visit textile mills, apparel production factories and all points along
the apparel supply chain to enhance understanding of international business challenges and opportunities.
TAL feels very passionate about taking the opportunity to talk about sustainability to future merchandisers, retailers or tourism professionals. We
feel it is a blessing to talk about what sustainable manufacturing entails to people who will in the future, be able to make decisions that impact
the sustainability of the value chain. Conversations with these students often go beyond manufacturing and retail and turn into discussions on
purchasing habits as consumers and the different mechanisms which contribute to the outpacing of our planet’s natural resources.
We feel it is imperative that sustainability be part of the educational curriculum. We only make meaningful and lasting changes for a
sustainable future by prompting awareness in the next generation as they will be the one carrying it forward.

77
CHAPTER 07: APPENDICES
77
Appendices

78
CHAPTER 07: APPENDICES
78
Appendices
GRI Indicator
GRI Indicator
Page Page
G4-1
G4-3G4-4G4-5G4-6G4-7G4-8G4-9
G4-10
G4-11G4-12G4-13G4-14
G4-15G4-16
G4-17G4-18G4-19
G4-20G4-21G4-22G4-23
G4-24G4-25G4-26G4-27
G4-28G4-29G4-30G4-31G4-32G4-33
G4-34
G4-56
Message from Our Chief Executive OfficerMessage from Our President and Chief Technology Officer
About This ReportOur LocationsOur LocationsOur LocationsNote: TAL is a privately held business. Our Business in FiguresOur LocationsOur Business in FiguresNote: We have excluded our total revenues in this report. Instead, the average growth rate of our business is included.Our Workforce in FiguresOur Workforce in FiguresNote: For details, refer to Appendix 1 Appendix 1: Workforce DemographicsOur Supply ChainMajor ChangesNote: TAL top management holds regular meetings to make decisions on critical management matters, including precautionary policies for suspected risks that may be harmful to the company, environment and public. Sustainable Apparel CoalitionSustainable Apparel Coalition
Our LocationsStakeholder EngagementStakeholder EngagementGlobal Reporting Initiative IndexGlobal Reporting Initiative IndexGlobal Reporting Initiative IndexNote: No restatements from previous reports. Note: No significant changes in reporting scope and aspects.
Stakeholder EngagementStakeholder EngagementStakeholder EngagementStakeholder Engagement
About This ReportAbout This ReportAbout This ReportAbout This ReportGlobal Reporting Initiative IndexGlobal Reporting Initiative Index
Our Governance
Sustainability Strategy
041 11 11 1
N/A18 1 118
N/A
252580801923
N/A
7474
1 11414787878
N/AN/A
14141414
040404047878
12
07
0506
Article Article
STRATEGY AND ANALYSIS
ORGANIZATIONAL PROFILE
IDENTIFIED MATERIAL ASPECTS AND BOUNDARIES
STAKEHOLDER ENGAGEMENT
REPORT PROFILE
GOVERNANCE
ETHICS AND INTEGRITY
Global Reporting Initiative Index
General Disclosure StandardsThis report is aligned with the Global Reporting Initiative (GRI) G4 guidelines. Our disclosure level is “in accordance” – Core and our report is at the moment not externally assured. The below tables outline the indicators which we have reported against.
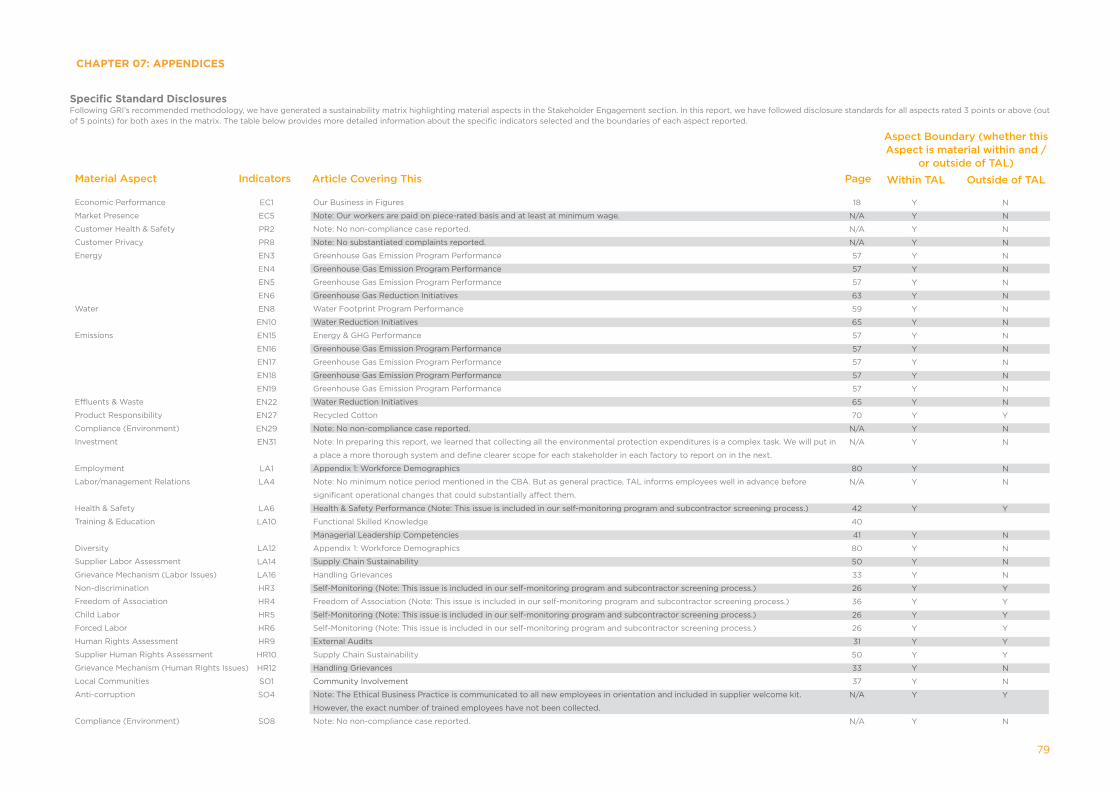
79
CHAPTER 07: APPENDICES
79
Material Aspect Page
Aspect Boundary (whether this Aspect is material within and /
or outside of TAL)
Within TAL Outside of TAL
Economic Performance
Market Presence
Customer Health & Safety
Customer Privacy
Energy
Water
Emissions
Effluents & Waste
Product Responsibility
Compliance (Environment)
Investment
Employment
Labor/management Relations
Health & Safety
Training & Education
Diversity
Supplier Labor Assessment
Grievance Mechanism (Labor Issues)
Non-discrimination
Freedom of Association
Child Labor
Forced Labor
Human Rights Assessment
Supplier Human Rights Assessment
Grievance Mechanism (Human Rights Issues)
Local Communities
Anti-corruption
Compliance (Environment)
Our Business in Figures
Note: Our workers are paid on piece-rated basis and at least at minimum wage.
Note: No non-compliance case reported.
Note: No substantiated complaints reported.
Greenhouse Gas Emission Program Performance
Greenhouse Gas Emission Program Performance
Greenhouse Gas Emission Program Performance
Greenhouse Gas Reduction Initiatives
Water Footprint Program Performance
Water Reduction Initiatives
Energy & GHG Performance
Greenhouse Gas Emission Program Performance
Greenhouse Gas Emission Program Performance
Greenhouse Gas Emission Program Performance
Greenhouse Gas Emission Program Performance
Water Reduction Initiatives
Recycled Cotton
Note: No non-compliance case reported.
Note: In preparing this report, we learned that collecting all the environmental protection expenditures is a complex task. We will put in
a place a more thorough system and define clearer scope for each stakeholder in each factory to report on in the next.
Appendix 1: Workforce Demographics
Note: No minimum notice period mentioned in the CBA. But as general practice, TAL informs employees well in advance before
significant operational changes that could substantially affect them.
Health & Safety Performance (Note: This issue is included in our self-monitoring program and subcontractor screening process.)
Functional Skilled Knowledge
Managerial Leadership Competencies
Appendix 1: Workforce Demographics
Supply Chain Sustainability
Handling Grievances
Self-Monitoring (Note: This issue is included in our self-monitoring program and subcontractor screening process.)
Freedom of Association (Note: This issue is included in our self-monitoring program and subcontractor screening process.)
Self-Monitoring (Note: This issue is included in our self-monitoring program and subcontractor screening process.)
Self-Monitoring (Note: This issue is included in our self-monitoring program and subcontractor screening process.)
External Audits
Supply Chain Sustainability
Handling Grievances
Community Involvement
Note: The Ethical Business Practice is communicated to all new employees in orientation and included in supplier welcome kit.
However, the exact number of trained employees have not been collected.
Note: No non-compliance case reported.
EC1
EC5
PR2
PR8
EN3
EN4
EN5
EN6
EN8
EN10
EN15
EN16
EN17
EN18
EN19
EN22
EN27
EN29
EN31
LA1
LA4
LA6
LA10
LA12
LA14
LA16
HR3
HR4
HR5
HR6
HR9
HR10
HR12
SO1
SO4
SO8
18
N/A
N/A
N/A
57
57
57
63
59
65
57
57
57
57
57
65
70
N/A
N/A
80
N/A
42
40
41
80
50
33
26
36
26
26
31
50
33
37
N/A
N/A
Y
Y
Y
Y
Y
Y
Y
Y
Y
Y
Y
Y
Y
Y
Y
Y
Y
Y
Y
Y
Y
Y
Y
Y
Y
Y
Y
Y
Y
Y
Y
Y
Y
Y
Y
Y
N
N
N
N
N
N
N
N
N
N
N
N
N
N
N
N
Y
N
N
N
N
Y
N
N
N
N
Y
Y
Y
Y
Y
Y
N
N
Y
N
Indicators Article Covering This
Specific Standard DisclosuresFollowing GRI’s recommended methodology, we have generated a sustainability matrix highlighting material aspects in the Stakeholder Engagement section. In this report, we have followed disclosure standards for all aspects rated 3 points or above (out of 5 points) for both axes in the matrix. The table below provides more detailed information about the specific indicators selected and the boundaries of each aspect reported.

80
CHAPTER 07: APPENDICES
80
Total number of employees
PermanentFixed Term/Temporary
FemaleMale
Full TimePart Time
ChinaThailandMalaysiaVietnamIndonesiaHong Kong
Total New Hires
<30 Years Old30-50 Years Old>50 Years Old
FemaleMale
ChinaThailandMalaysiaVietnamIndonesiaHong Kong
Total Turnover
<30 Years Old30-50 Years Old>50 Years Old
FemaleMale
ChinaThailandMalaysiaVietnamIndonesiaHong Kong
FemaleMale
<30 Years Old30-50 Years Old>50 Years Old
<30 Years Old30-50 Years Old>50 Years Old
LocalForeign
Total
China & Hong Kong SARThailandMalaysiaVietnamIndonesia
FemaleMale
Outsourced Employees
2013 201422492 23736
by number 2013 201411171 1184611321 11890
2013 201417315 179285177 5808
2013 201422490 237342 2
2013 20146312 65175194 53365073 52683634 43672002 1958277 290
2013 201413740 14160
2013 201410534 109253122 3136144 125
2013 20148456 83495284 5811
2013 20148230 83012097 21061777 19511416 1459108 17066 84
2013 201412134 12989
Overall2013 201452% 51%45% 46%3% 3%
Overall2013 201481% 81%19% 19%
2013 201445% 45%
2013 20140% 0%81% 81%12% 12%100% 100%81% 73%
Overall2013 201476% 75%24% 25%
Manager2013 20143% 2%82% 83%15% 15%
Manager2013 201489% 91%11% 9%
Manager2013 201446% 46%54% 54%
Professional2013 201423% 22%72% 72%5% 6%
Professional2013 201496% 97%4% 3%
Professional2013 201465% 66%35% 34%
General2013 201448% 47%46% 50%3% 4%
General2013 201496% 95%4% 5%
General2013 201467% 67%33% 33%
Worker2013 201455% 54%42% 43%3% 3%
Worker2013 201478% 77%22% 23%
Worker2013 201480% 78%20% 22%
2013 20149020 97983041 3109106 112
2013 20147678 80234456 4966
2013 20147229 80652265 2535896 10951508 1028144 15958 73
0%100%
033%67%
by number 2013 201430 161
by %2013 201450% 50%50% 50%
by %2013 201477% 76%23% 24%
by %2013 2014100% 100%0% 0%
by %2013 201428% 27%23% 22%23% 22%16% 18%9% 8%1% 1%
by %2013 20145% 5%
by % 2013 20148% 0%3% 2%2% 1%
by % 2013 20144% 4%9% 8%
by % 2013 201411% 11%3% 3%3% 3%3% 3%0% 1%2% 2%
by % 2013 20144% 5%
by %2013 20144% 5%3% 2%1% 1%
by %2013 20144% 4%7% 7%
by % 2013 201410% 10%4% 4%1% 2%3% 2%1% 1%2% 2%
Total workforce
Employees by employment contract
Employees by gender
Employees by employment type
Total workforce by region
New hires
New hires by age group (new hire rate is calculated on monthly basis)
New hires by gender
New hires by region
Total turnover (turnover rate is calculated on monthly basis)
Turnover by age group
Turnover by gender
Turnover by region
Board members by gender
Board members by age group
Age group by employee category
Nationality by employee category
Employees covered by collective bargaining agreement
Employees covered by collective bargaining agreement by region
Gender by employee category
Outsourced workers
Workforce Demographics
Note: This figure only includes workers who are hired through third party, and excludes other outsourced services onsite, e.g. cleaners, security service, contractors. We only use outsourced workers in one Malaysia factory.
Copyright © 2015 – TAL Apparel All rights reserved. http://www.talapparel.com