· tables listing the values of hydraulic geometry parameters are also included in each section....
TRANSCRIPT
������������ ��������������
����������� ����
����� ���
internal
report ���
������������������ �
�������������
���������������������
������������


Cross section and scour chain data in the Ngarradj catchment for 2002 and 2003
MJ Saynor1,2, WD Erskine3,4, BL Smith1, G Fox1 and KG Evans1
1 Hydrological & Ecological Processes Environmental Research Institute of the Supervising Scientist
GPO Box 461 Darwin NT 0801
2 Department of Geography
University of Western Australia Nedlands WA 6907
3 Office of the Supervising Scientist
GPO Box 461 Darwin NT 0801
4 Division of Geography
School of Geosciences University of Sydney Sydney NSW 2006
June 2004
Registry File SG2004/0054

iii
Contents
1 Introduction 1
2 Methods 1
2.1 Channel cross sections 1
2.2 Hydraulic geometry 3
2.3 Scour chains 4
2.4 Scour and fill calculations 5
3 Annual Cross section surveys – Results and discussion 8
3.1 Tributary North Cross sections 8
3.2 Tributary Central Cross sections 15
3.3 East Tributary Cross sections 21
3.4 Upper Swift Creek Cross sections 25
3.5 Swift Creek Cross sections 29
4 Scour Chain Results 33
4.1 Tributary North 33
4.2 Tributary Central 36
4.3 East Tributary scour chains 37
4.4 Upper Swift Creek scour chains 39
4.5 Swift Creek scour chains 42
5 Conclusions and recommendations 44
6 References 45
Appendix 1 47

iv

1
Cross section and scour chain data in the Ngarradj catchment for 2002 and 2003
MJ Saynor, WD Erskine, BL Smith, G Fox & KG Evans
1 Introduction Initial field inspections were conducted in the Ngarradj catchment during the dry season of 1998 as initial work on the Jabiluka mine had commenced. Erskine et al (2001) proposed that a sediment budget framework should be adopted by eriss to assess the physical impacts, if any, of the Jabiluka mine on the Ngarradj catchment (fig 1). During these field observations, various fluvial erosion processes were identified (Erskine et al 2001) with two of these being bank erosion and scour and fill of the sandy creek beds. To measure the amount of large-scale bank erosion permanently marked channel cross sections on the mine site tributaries (Tributaries North and Central) and at the three eriss gauging stations (Moliere et al 2002) (fig 1) were installed. Scour chains were used at some of the above cross sections to measure scour and fill (Saynor 2000, Erskine et al 2001, Saynor et al 2002b). Saynor et al (2001) outline the complete eriss field program in the Ngarradj catchment to assess the physical impacts of the Jabiluka mine.
The data for the annual cross sections surveys in the Ngarradj catchment between 1998 and 2001 are presented in Saynor et al (2002a) and the data for the scour and fill determined by scour chains between 1998 and 2001 are presented in Saynor et al (2002b). This report contains the data for cross sections and scour chains for 2002 and 2003.
2 Methods Fifty six permanently marked channel cross sections were installed along various reaches of Ngarradj. Multiple cross sections were installed at each eriss gauging station (upper Swift Creek, lower Swift Creek and East Tributary) as well as on the mine site tributaries, Tributary North and Tributary Central (fig 1). Site specific details are provided below. At some of these cross sections scour chains were also installed in the channel bed.
During each wet season, the various grain size fractions of the bed material of Ngarradj and its tributaries are reworked and transported downstream at various rates to a number of sediment storages. Although the bed-material fluxes have been measured during the wet season (Erskine et al 2001), it is also important to know the depth to which the bed is scoured and/or aggraded each wet season. Repeated surveys of permanently marked cross sections, as reported by Saynor et al (2002a), only measure the net change between successive wet seasons. The actual depths of scour and fill during the wet season are usually much greater. Furthermore, the channels will be one of the first temporary stores to receive sediment, if any is generated by mining activities (Erskine et al 2001). Therefore, scour chains were used at some of the above cross sections to determine scour and fill during each wet season.
2.1 Channel cross sections A series of permanently marked cross sections were installed during the 1998 dry season and have been surveyed annually each dry season. The data obtained and plots of every survey for the years 1998 to 2001 inclusive have been documented in a previous Internal Report (Saynor

2
et al 2002a). The background information and the complete methodology are contained in Saynor et al (2001) and Erskine et al (2001).
Figure 1 The Ngarradj catchment showing the Jabiluka Mineral Lease, eriss’s gauging stations and local creek names. SC refers to Swift Creek gauging station, TN Tributary North, ET East Tributary gauging station, TC Tributary Central, TS Tributary South, TW Tributary West and UM upper Swift
Creek gauging station.

3
The cross sections have been marked using a star picket driven into the ground with the top 0.3 m encased with a circular concrete collar (plinth) at each end of the cross section. A coach bolt has been set into the concrete (with a small drill hole in the top) to provide an accurate bench mark. At one end of the cross section a recovery star picket has been installed near the concrete plinth. These cross sections have been surveyed using a Topcon Total Station during each dry season between 1998 and 2003 to determine the net change in channel cross section during each intervening wet season. This approach follows the Vigil Network method of the US Geological Survey developed for the International Hydrological Decade (Leopold 1962, Emmett 1965, Leopold & Emmett 1965, Emmett & Hadley 19689). The cross section surveys have also been used to determine hydraulic geometry and changes in geometry during each wet season.
Table 1 Number of cross sections installed in the Ngarradj catchment
Location Number of sections
Tributary North 17
Tributary Central 15
East Tributary Gauge 8
Upper Swift Creek Gauge 8
Swift Creek Gauge 8
Total 56
A plot of every survey for 1998 to 2003 at each cross section is shown in Appendices A to E of Saynor et al (2004). The survey data for each survey (2002 & 2003) of each cross section on each channel outlined in table 1 are contained in appendix 1.
2.2 Hydraulic geometry The bankfull level (channel–floodplain junction) was initially determined at each cross section using Wolman’s (1955) objective method of the point corresponding to the minimum width-depth ratio. This was done for any section where the bankfull level was difficult to determine visually. As more experience was gained with local conditions, it was possible to determine the bankfull level from field knowledge (Williams 1978). The lowest inflection point of the bank profile was adopted as bankfull stage. This leads, in some cases, to the adopted bankfull stage being lower than the apparent top of the bank.
Mean flow velocity at bankfull stage was calculated by Manning’s equation:
u = n-1.R0.67.S0.5. (1)
where u is mean flow velocity (m/s), n is Manning’s roughness coefficient, R is bankfull hydraulic radius (m) and S is energy slope (m/m). Water surface slope or bed slope was substituted for energy slope. A reach-averaged Manning’s n value was determined by Cowan’s (1956) method and by comparison of channel conditions with those for which roughness coefficients have been determined (Barnes 1967, Arcement & Schneider 1984). Hydraulic radius is calculated from the cross sections as:
R = A / P (2)
4
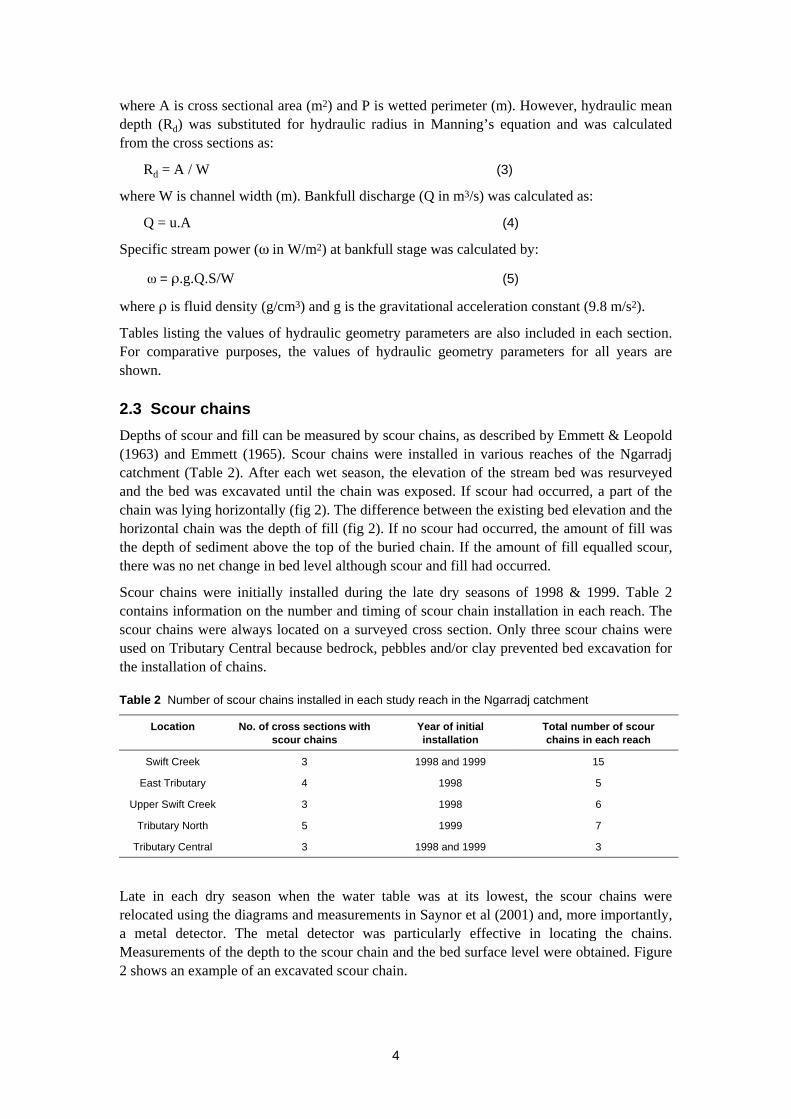
where A is cross sectional area (m2) and P is wetted perimeter (m). However, hydraulic mean depth (Rd) was substituted for hydraulic radius in Manning’s equation and was calculated from the cross sections as:
Rd = A / W (3)
where W is channel width (m). Bankfull discharge (Q in m3/s) was calculated as:
Q = u.A (4)
Specific stream power (ω in W/m2) at bankfull stage was calculated by:
ω = ρ.g.Q.S/W (5)
where ρ is fluid density (g/cm3) and g is the gravitational acceleration constant (9.8 m/s2).
Tables listing the values of hydraulic geometry parameters are also included in each section. For comparative purposes, the values of hydraulic geometry parameters for all years are shown.
2.3 Scour chains Depths of scour and fill can be measured by scour chains, as described by Emmett & Leopold (1963) and Emmett (1965). Scour chains were installed in various reaches of the Ngarradj catchment (Table 2). After each wet season, the elevation of the stream bed was resurveyed and the bed was excavated until the chain was exposed. If scour had occurred, a part of the chain was lying horizontally (fig 2). The difference between the existing bed elevation and the horizontal chain was the depth of fill (fig 2). If no scour had occurred, the amount of fill was the depth of sediment above the top of the buried chain. If the amount of fill equalled scour, there was no net change in bed level although scour and fill had occurred.
Scour chains were initially installed during the late dry seasons of 1998 & 1999. Table 2 contains information on the number and timing of scour chain installation in each reach. The scour chains were always located on a surveyed cross section. Only three scour chains were used on Tributary Central because bedrock, pebbles and/or clay prevented bed excavation for the installation of chains.
Table 2 Number of scour chains installed in each study reach in the Ngarradj catchment
Location No. of cross sections with scour chains
Year of initial installation
Total number of scour chains in each reach
Swift Creek 3 1998 and 1999 15
East Tributary 4 1998 5
Upper Swift Creek 3 1998 6
Tributary North 5 1999 7
Tributary Central 3 1998 and 1999 3
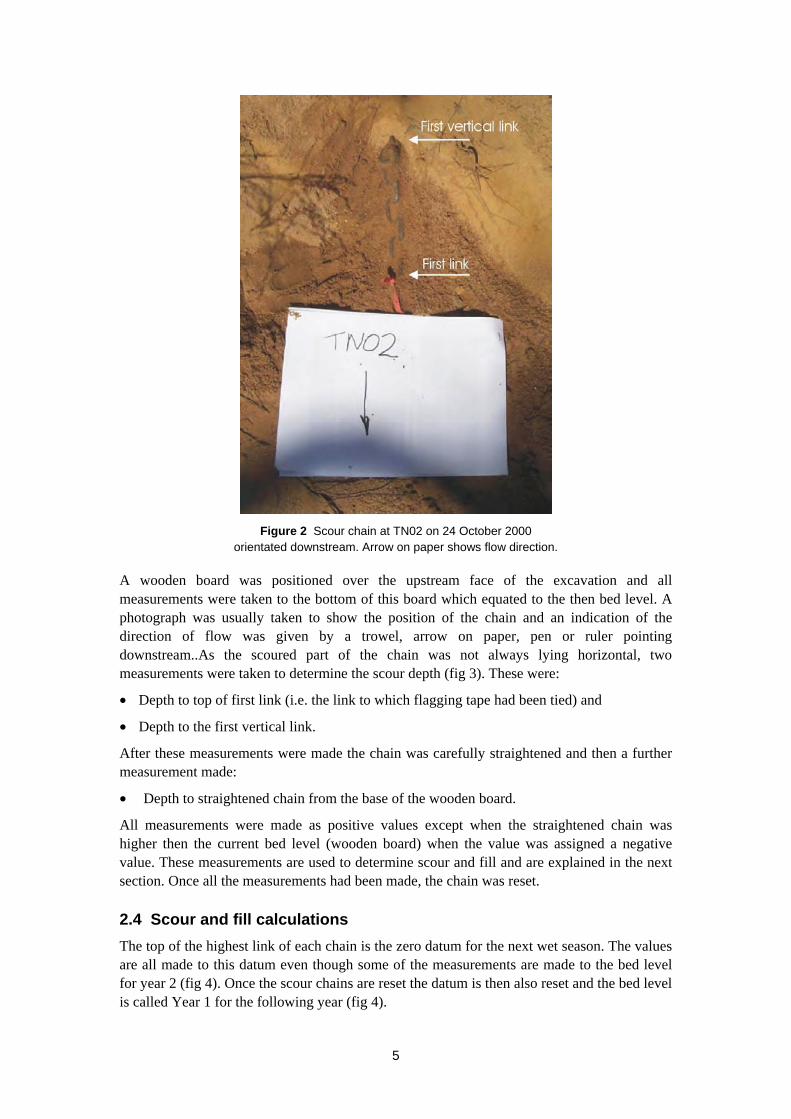
Late in each dry season when the water table was at its lowest, the scour chains were relocated using the diagrams and measurements in Saynor et al (2001) and, more importantly, a metal detector. The metal detector was particularly effective in locating the chains. Measurements of the depth to the scour chain and the bed surface level were obtained. Figure 2 shows an example of an excavated scour chain.
5
Figure 2 Scour chain at TN02 on 24 October 2000
orientated downstream. Arrow on paper shows flow direction.
A wooden board was positioned over the upstream face of the excavation and all measurements were taken to the bottom of this board which equated to the then bed level. A photograph was usually taken to show the position of the chain and an indication of the direction of flow was given by a trowel, arrow on paper, pen or ruler pointing downstream..As the scoured part of the chain was not always lying horizontal, two measurements were taken to determine the scour depth (fig 3). These were:
• Depth to top of first link (i.e. the link to which flagging tape had been tied) and
• Depth to the first vertical link.
After these measurements were made the chain was carefully straightened and then a further measurement made:
• Depth to straightened chain from the base of the wooden board.
All measurements were made as positive values except when the straightened chain was higher then the current bed level (wooden board) when the value was assigned a negative value. These measurements are used to determine scour and fill and are explained in the next section. Once all the measurements had been made, the chain was reset.
2.4 Scour and fill calculations The top of the highest link of each chain is the zero datum for the next wet season. The values are all made to this datum even though some of the measurements are made to the bed level for year 2 (fig 4). Once the scour chains are reset the datum is then also reset and the bed level is called Year 1 for the following year (fig 4).

6
The maximum amount of fill (FM) is the actual fill during the wet season. The depth to the straightened chain (DSC) is used in equation 6 to determine the maximum scour depth (SM) and it is essential to keep the mathematical signs as shown in figure 4.
SM = FM – DSC (Eq.6)
The net change in bed level (BLN) is determined by equation 7:
BLN = FM – SM (Eq.7)
A positive value indicates net fill from year 1 to year 2 and a negative value, net scour. This convention of positive values for fill and negative values for scour has been used by, among others, Emmett (1965), Leopold et al (1966), Roberts (1991), Fowler & Wilson (1995) and Locher (1997). Figure 3 shows the three possible situations, net fill, net scour and no net change.
Fill to new bed level
Depth to first vertical Depth to first link
Fill to new bed levelDepth to first link
Depth to first vertical
Fill to new bed level
Depth to first verticalDepth to first link
Previous bed level
Scour depth
Previous bed level
Scour depth
Previous bed level
Scour depth
Fill to new bed level
Previous bed level
Scour depth
Depth to first verticalDepth to first link
Figure 3 Diagrammatic representation of the full range of scour chain behaviour when there was net scour depicted by the middle option in figure 4. Net fill is shown by the top option in figure 4 and no
change, by the lower option in figure 4.

7
Year 1Bed Level
Scour
No Net Change
Year 2Bed Level
Fill
(-) Difference
Year 2Bed Level
Year 1Bed Level
FillScour
(+) Difference
Net Fill
Bed LevelYear 1
ScourFill
Year 2Bed Level
Net Scour
Figure 4 Three options of net channel bed change during the wet season detected by scour chains. Net fill occurs when the bed level for the 2nd year is higher than for the 1st (top). Net scour occurs when the bed level for the 2nd year is lower than for the 1st (middle). No net change occurs when the bed level for
the 1st and 2nd years is the same (bottom).
8
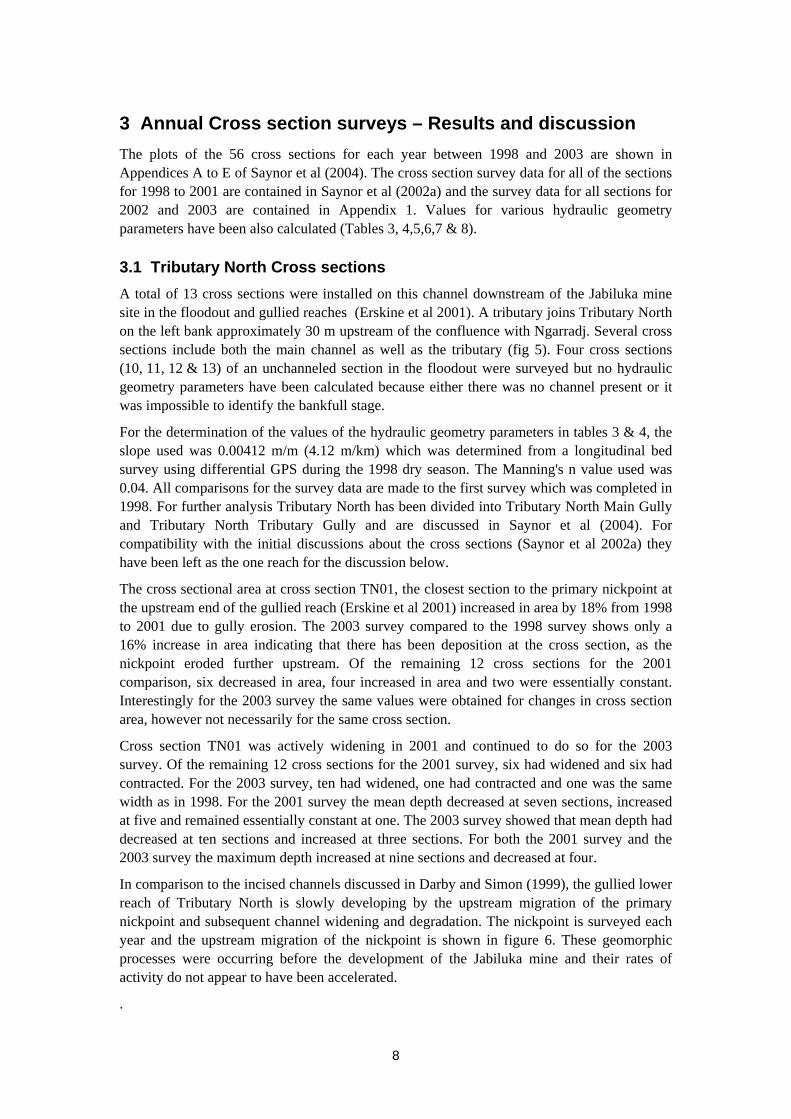
3 Annual Cross section surveys – Results and discussion The plots of the 56 cross sections for each year between 1998 and 2003 are shown in Appendices A to E of Saynor et al (2004). The cross section survey data for all of the sections for 1998 to 2001 are contained in Saynor et al (2002a) and the survey data for all sections for 2002 and 2003 are contained in Appendix 1. Values for various hydraulic geometry parameters have been also calculated (Tables 3, 4,5,6,7 & 8).
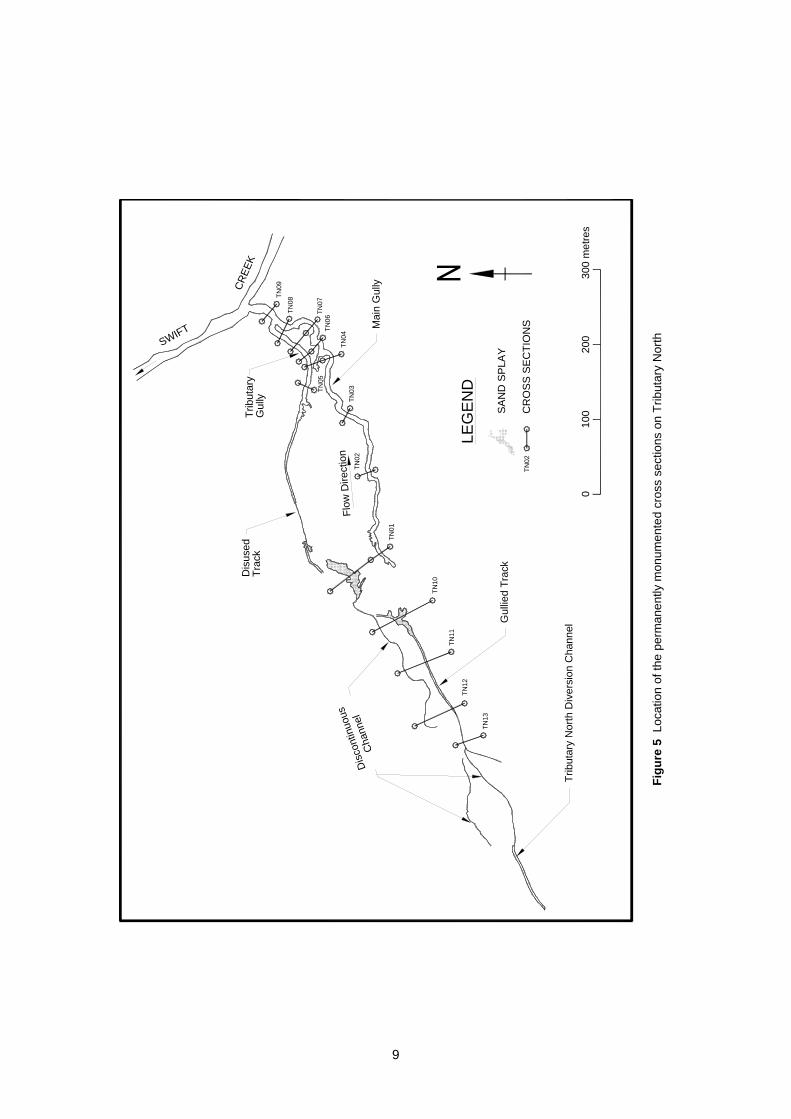
3.1 Tributary North Cross sections A total of 13 cross sections were installed on this channel downstream of the Jabiluka mine site in the floodout and gullied reaches (Erskine et al 2001). A tributary joins Tributary North on the left bank approximately 30 m upstream of the confluence with Ngarradj. Several cross sections include both the main channel as well as the tributary (fig 5). Four cross sections (10, 11, 12 & 13) of an unchanneled section in the floodout were surveyed but no hydraulic geometry parameters have been calculated because either there was no channel present or it was impossible to identify the bankfull stage.
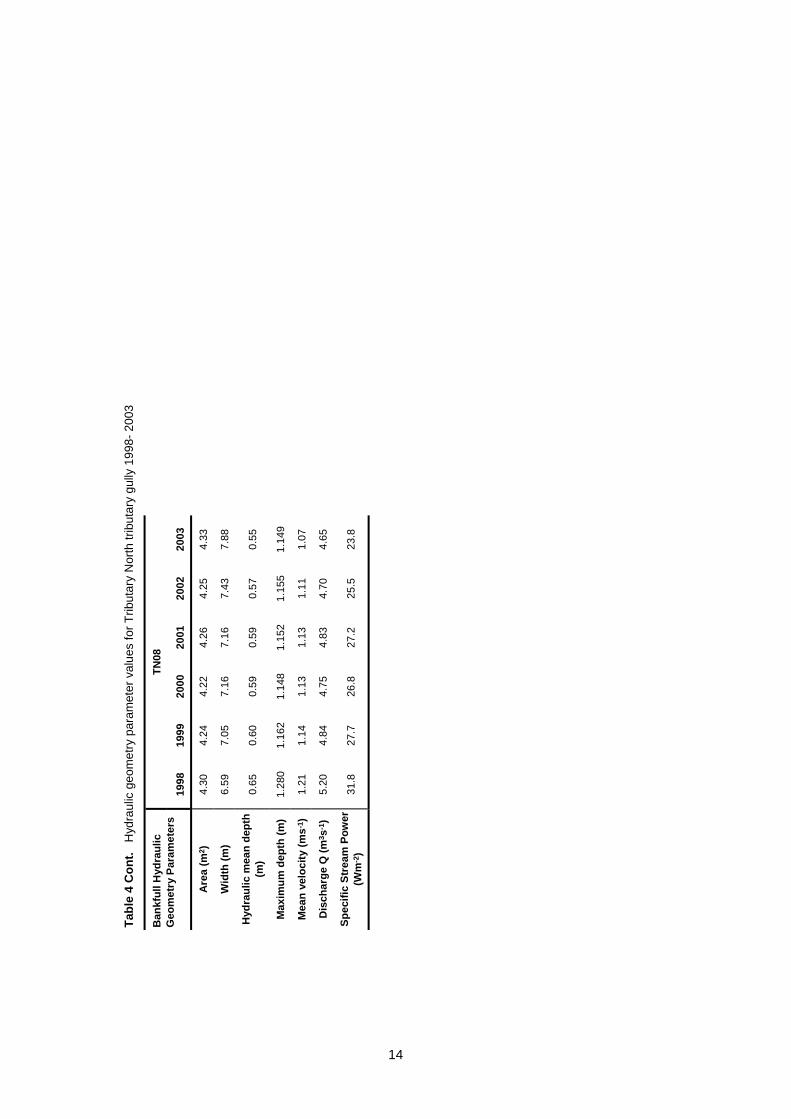
For the determination of the values of the hydraulic geometry parameters in tables 3 & 4, the slope used was 0.00412 m/m (4.12 m/km) which was determined from a longitudinal bed survey using differential GPS during the 1998 dry season. The Manning's n value used was 0.04. All comparisons for the survey data are made to the first survey which was completed in 1998. For further analysis Tributary North has been divided into Tributary North Main Gully and Tributary North Tributary Gully and are discussed in Saynor et al (2004). For compatibility with the initial discussions about the cross sections (Saynor et al 2002a) they have been left as the one reach for the discussion below.
The cross sectional area at cross section TN01, the closest section to the primary nickpoint at the upstream end of the gullied reach (Erskine et al 2001) increased in area by 18% from 1998 to 2001 due to gully erosion. The 2003 survey compared to the 1998 survey shows only a 16% increase in area indicating that there has been deposition at the cross section, as the nickpoint eroded further upstream. Of the remaining 12 cross sections for the 2001 comparison, six decreased in area, four increased in area and two were essentially constant. Interestingly for the 2003 survey the same values were obtained for changes in cross section area, however not necessarily for the same cross section.
Cross section TN01 was actively widening in 2001 and continued to do so for the 2003 survey. Of the remaining 12 cross sections for the 2001 survey, six had widened and six had contracted. For the 2003 survey, ten had widened, one had contracted and one was the same width as in 1998. For the 2001 survey the mean depth decreased at seven sections, increased at five and remained essentially constant at one. The 2003 survey showed that mean depth had decreased at ten sections and increased at three sections. For both the 2001 survey and the 2003 survey the maximum depth increased at nine sections and decreased at four.
In comparison to the incised channels discussed in Darby and Simon (1999), the gullied lower reach of Tributary North is slowly developing by the upstream migration of the primary nickpoint and subsequent channel widening and degradation. The nickpoint is surveyed each year and the upstream migration of the nickpoint is shown in figure 6. These geomorphic processes were occurring before the development of the Jabiluka mine and their rates of activity do not appear to have been accelerated.
.
TN09
TN08
TN07
TN06
TN04
TN05
TN03
TN02
TN01
TN10
TN11
TN12
TN13
Mai
n G
ully
SWIFT
CREE
KTr
ibut
ary
Dis
cont
inuo
us
Cha
nnel
Gul
lied
Trac
kSA
ND
SPL
AY
CR
OSS
SEC
TIO
NS
LEG
END
TN02
Trib
utar
y N
orth
Div
ersi
on C
hann
el0
100
200
300
met
res
Gul
lyD
isus
edTr
ack
Flow
Dire
ctio
n
Fi
gure
5 L
ocat
ion
of th
e pe
rman
ently
mon
umen
ted
cros
s se
ctio
ns o
n Tr
ibut
ary
Nor
th
9

10
Planform of Tributary North gully nickpoint
4970
4974
4978
4982
4986
4990
965 970 975 980 985 990 995 1000 1005 1010 1015
Distance (m)
Dist
ance
(m)
8 Oct 9811 Aug 9910 Nov 0013 Sep 0111 Jul 0214 Aug 03TN01
Cross Section TN01
Figure 6 Annual surveys of the primary nickpoint at the head of Erskine et al’s (2001) gullied reach on
Tributary North. This refers to the main gully.

Tabl
e 3
Hyd
raul
ic g
eom
etry
par
amet
er v
alue
s fo
r Trib
utar
y N
orth
mai
n gu
lly 1
998
- 200
3
TN01
TN02
Ban
kful
l Hyd
raul
ic
Geo
met
ry P
aram
eter
s 19
98
1999
20
00
2001
20
02
2003
19
88
1999
20
00
2001
20
02
2003
Area
(m2 )
2.
10
2.52
2.
48
2.48
2.
52
2.44
2.
99
2.99
2.
98
3.04
3.
03
2.91
Wid
th (m
) 3.
81
4.11
4.
45
4.41
4.
57
4.62
6.
54
6.48
6.
45
6.51
6.
53
6.58
Hyd
raul
ic m
ean
dept
h (m
) 0.
55
0.61
0.
56
0.56
0.
55
0.53
0.
46
0.46
0.
46
0.47
0.
46
0.44
Max
imum
dep
th (m
) 0.
913
1.02
1 0.
955
0.98
2 0.
961
0.97
7 1.
009
1.05
1 1.
116
1.15
4 1.
108
1.01
3
Mea
n ve
loci
ty (m
s-1 )
1.
08
1.16
1.
09
1.09
1.
08
1.05
0.
95
0.96
0.
96
0.96
0.
96
0.93
Dis
char
ge Q
(m3 s
-1)
2.26
2.
91
2.69
2.
71
2.71
2.
55
2.85
2.
87
2.86
2.
93
2.91
2.
70
Spec
ific
Stre
am P
ower
(W
m-2
) 23
.9
28.5
24
.4
24.8
23
.9
22.2
4 17
.5
17.8
17
.9
18.2
18
.0
16.6
TN03
TN04
B
ankf
ull H
ydra
ulic
G
eom
etry
Par
amet
ers
1998
19
99
2000
20
01
2002
20
03
1998
19
99
2000
20
01
2002
20
03
Area
(m2 )
3.
14
3.13
3.
01
3.20
3.
05
3.13
1.
25
1.39
1.
33
1.35
1.
43
1.43
Wid
th (m
) 5.
00
4.99
5.
05
5.11
5.
06
5.16
4.
01
3.64
3.
51
3.63
4.
26
4.47
Hyd
raul
ic m
ean
dept
h (m
) 0.
63
0.63
0.
60
0.63
0.
60
0.61
0.
31
0.38
0.
38
0.37
0.
34
0.32
Max
imum
dep
th (m
) 1.
095
1.21
6 1.
111
1.25
7 1.
190
1.20
2 0.
644
0.77
4 0.
723
0.75
0 0.
867
0.83
2
Mea
n ve
loci
ty (m
s-1 )
1.
18
1.18
1.
14
1.17
1.
14
1.15
0.
74
0.84
0.
84
0.83
0.
78
0.75
Dis
char
ge Q
(m3 s
-1)
3.70
3.
68
3.43
3.
76
3.49
3.
60
0.92
1.
17
1.12
1.
12
1.11
1.
07
Spec
ific
Stre
am P
ower
(W
m-2
) 29
.8
29.7
27
.4
29.7
27
.8
28.2
9.
2 13
.0
12.9
12
.4
10.6
9.
7
11

Tabl
e 3
Con
t. H
ydra
ulic
geo
met
ry p
aram
eter
val
ues
for T
ribut
ary
Nor
th m
ain
gully
199
8- 2
003
TN06
TN07
Ban
kful
l Hyd
raul
ic
Geo
met
ry P
aram
eter
s 19
98
1999
20
00
2001
20
02
2003
19
98
1999
20
00
2001
20
02
2003
Area
(m2 )
2.
10
2.29
2.
22
2.17
2.
20
2.23
2.
25
2.30
2.
27
2.26
2.
26
2.35
Wid
th (m
) 5.
32
5.43
5.
40
5.30
5.
34
5.32
5.
36
5.42
5.
35
5.18
5.
36
5.79
Hyd
raul
ic m
ean
dept
h (m
) 0.
39
0.42
0.
41
0.41
0.
41
0.42
0.
42
0.42
0.
42
0.44
0.
42
0.41
Max
imum
dep
th (m
) 0.
661
0.75
0 0.
761
0.72
9 0.
905
0.86
6 0.
776
0.79
8 0.
862
0.85
2 0.
872
0.82
9
Mea
n ve
loci
ty (m
s-1 )
0.
86
0.90
0.
88
0.88
0.
89
0.90
0.
90
0.91
0.
91
0.92
0.
90
0.88
Dis
char
ge Q
(m3 s
-1)
1.81
2.
07
1.96
1.
92
1.95
2.
00
2.03
2.
08
2.06
2.
08
2.04
2.
07
Spec
ific
Stre
am P
ower
(W
m-2
) 13
.7
15.4
14
.6
14.6
14
.7
15.2
15
.3
15.5
15
.5
16.2
15
.3
14.4
TN08
TN
09
B
ankf
ull H
ydra
ulic
G
eom
etry
Par
amet
ers
1998
19
99
2000
20
01
2002
20
03
1998
19
99
2000
20
01
2002
20
03
Area
(m2 )
5.
28
5.12
5.
10
4.98
5.
01
5.16
6.
98
7.04
6.
96
6.91
6.
96
6.92
Wid
th (m
) 9.
85
9.72
9.
80
9.74
9.
60
10.0
3 9.
86
9.78
9.
96
9.95
10
.00
9.91
Hyd
raul
ic m
ean
dept
h (m
) 0.
54
0.53
0.
52
0.51
0.
52
0.51
0.
71
0.72
0.
70
0.69
0.
70
0.70
Max
imum
dep
th (m
) 0.
965
1.05
3 1.
022
1.01
1 1.
020
0.99
8 1.
069
1.09
7 1.
097
1.09
5 1.
083
1.09
4
Mea
n ve
loci
ty (m
s-1 )
1.
06
1.05
1.
04
1.03
1.
04
1.03
1.
27
1.29
1.
26
1.26
1.
26
1.26
Dis
char
ge Q
(m3 s
-1)
5.59
5.
36
5.30
5.
10
5.20
5.
31
8.90
9.
06
8.80
8.
68
8.76
8.
73
Spec
ific
Stre
am P
ower
(W
m-2
) 22
.9
22.3
21
.8
21.1
21
.8
21.4
36
.4
37.4
35
.6
35.2
35
.3
35.5
12

Tabl
e 4.
H
ydra
ulic
geo
met
ry p
aram
eter
val
ues
for T
ribut
ary
Nor
th T
ribut
ary
Gul
ly 1
998-
200
3
TN05
TN04
Ban
kful
l Hyd
raul
ic
Geo
met
ry P
aram
eter
s 19
98
1999
20
00
2001
20
02
2003
19
98
1999
20
00
2001
20
02
2003
Area
(m2 )
3.
78
3.75
3.
74
3.76
3.
73
3.76
3.
80
3.74
3.
70
3.67
3.
68
3.67
Wid
th (m
) 6.
27
6.35
6.
46
6.68
6.
74
6.75
5.
33
5.31
5.
40
5.39
5.
53
5.47
Hyd
raul
ic m
ean
dept
h (m
) 0.
60
0.59
0.
58
0.56
0.
55
0.56
0.
71
0.70
0.
68
0.68
0.
66
0.67
Max
imum
dep
th (m
) 1.
026
1.03
4 1.
025
1.01
2 0.
986
0.97
3 1.
065
1.03
2 1.
019
1.04
5 1.
026
1.02
6
Mea
n ve
loci
ty (m
s-1 )
1.
14
1.13
1.
11
1.09
1.
08
1.09
1.
28
1.27
1.
25
1.24
1.
22
1.23
Dis
char
ge Q
(m3 s
-1)
4.33
4.
23
4.16
4.
12
4.04
4.
09
4.87
4.
74
4.61
4.
55
4.49
4.
51
Spec
ific
Stre
am P
ower
(W
m-2
) 27
.8
26.8
25
.9
24.9
24
.2
24.4
36
.8
36.0
34
.4
34.0
32
.7
33.2
TN06
TN
07
B
ankf
ull H
ydra
ulic
G
eom
etry
Par
amet
ers
1998
19
99
2000
20
01
2002
20
03
1998
19
99
2000
20
01
2002
20
03
Area
(m2 )
4.
26
4.19
4.
24
4.19
4.
22
4.05
4.
82
4.70
4.
76
4.76
4.
69
4.77
Wid
th (m
) 5.
39
5.35
5.
46
5.35
5.
48
5.24
7.
16
6.65
7.
22
7.37
7.
53
7.67
Hyd
raul
ic m
ean
dept
h (m
) 0.
79
0.78
0.
78
0.78
0.
77
0.77
0.
67
0.71
0.
66
0.65
0.
62
0.62
Max
imum
dep
th (m
) 1.
082
1.15
2 1.
152
1.13
2 1.
116
1.08
5 1.
228
1.03
9 1.
068
1.05
6 1.
027
1.10
7
Mea
n ve
loci
ty (m
s-1 )
1.
37
1.36
1.
36
1.36
1.
35
1.35
1.
23
1.27
1.
21
1.20
1.
17
1.17
Dis
char
ge Q
(m3 s
-1)
5.85
5.
72
5.74
5.
71
5.68
5.
47
5.94
5.
98
5.78
5.
70
5.50
5.
58
Spec
ific
Stre
am P
ower
(W
m-2
) 43
.8
43.2
42
.4
43.0
41
.8
42.1
33
.5
36.3
32
.3
31.2
29
.4
29.3
13
Tabl
e 4
Con
t. H
ydra
ulic
geo
met
ry p
aram
eter
val
ues
for T
ribut
ary
Nor
th tr
ibut
ary
gully
199
8- 2
003
TN08
B
ankf
ull H
ydra
ulic
G
eom
etry
Par
amet
ers
1998
19
99
2000
20
01
2002
20
03
Area
(m2 )
4.
30
4.24
4.
22
4.26
4.
25
4.33
Wid
th (m
) 6.
59
7.05
7.
16
7.16
7.
43
7.88
Hyd
raul
ic m
ean
dept
h (m
) 0.
65
0.60
0.
59
0.59
0.
57
0.55
Max
imum
dep
th (m
) 1.
280
1.16
2 1.
148
1.15
2 1.
155
1.14
9
Mea
n ve
loci
ty (m
s-1 )
1.
21
1.14
1.
13
1.13
1.
11
1.07
Dis
char
ge Q
(m3 s
-1)
5.20
4.
84
4.75
4.
83
4.70
4.
65
Spec
ific
Stre
am P
ower
(W
m-2
) 31
.8
27.7
26
.8
27.2
25
.5
23.8
14
15
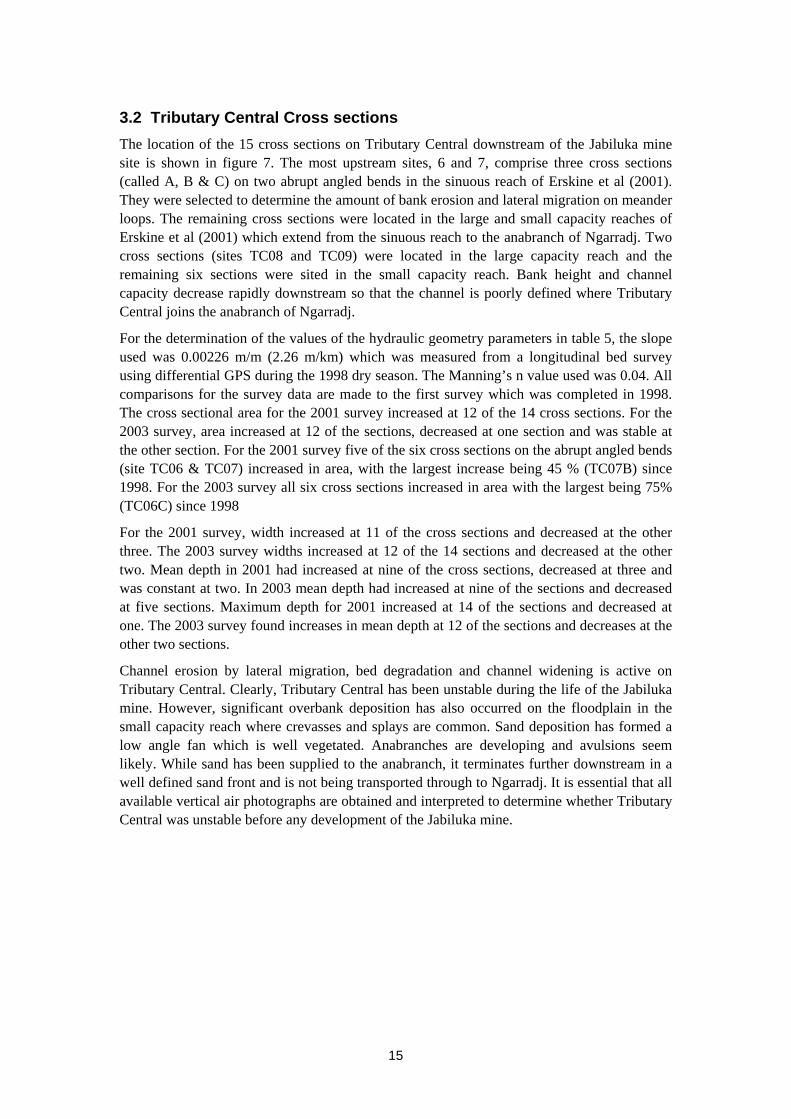
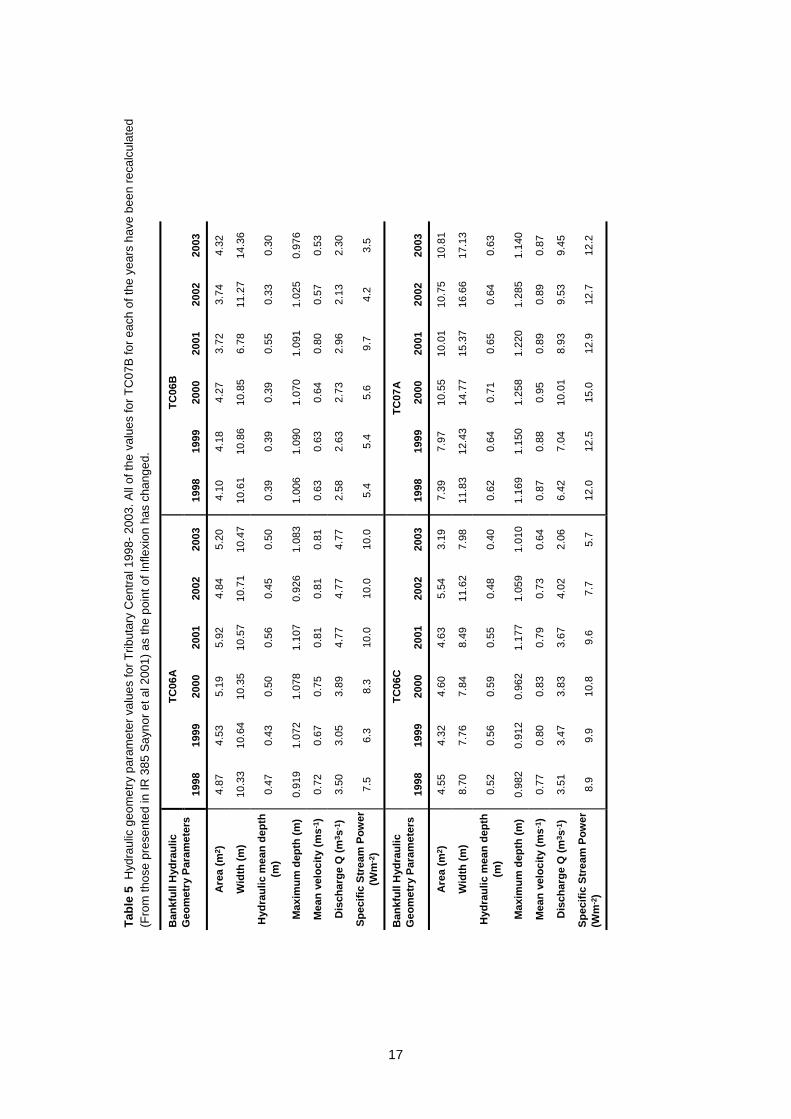
3.2 Tributary Central Cross sections The location of the 15 cross sections on Tributary Central downstream of the Jabiluka mine site is shown in figure 7. The most upstream sites, 6 and 7, comprise three cross sections (called A, B & C) on two abrupt angled bends in the sinuous reach of Erskine et al (2001). They were selected to determine the amount of bank erosion and lateral migration on meander loops. The remaining cross sections were located in the large and small capacity reaches of Erskine et al (2001) which extend from the sinuous reach to the anabranch of Ngarradj. Two cross sections (sites TC08 and TC09) were located in the large capacity reach and the remaining six sections were sited in the small capacity reach. Bank height and channel capacity decrease rapidly downstream so that the channel is poorly defined where Tributary Central joins the anabranch of Ngarradj.
For the determination of the values of the hydraulic geometry parameters in table 5, the slope used was 0.00226 m/m (2.26 m/km) which was measured from a longitudinal bed survey using differential GPS during the 1998 dry season. The Manning’s n value used was 0.04. All comparisons for the survey data are made to the first survey which was completed in 1998. The cross sectional area for the 2001 survey increased at 12 of the 14 cross sections. For the 2003 survey, area increased at 12 of the sections, decreased at one section and was stable at the other section. For the 2001 survey five of the six cross sections on the abrupt angled bends (site TC06 & TC07) increased in area, with the largest increase being 45 % (TC07B) since 1998. For the 2003 survey all six cross sections increased in area with the largest being 75% (TC06C) since 1998
For the 2001 survey, width increased at 11 of the cross sections and decreased at the other three. The 2003 survey widths increased at 12 of the 14 sections and decreased at the other two. Mean depth in 2001 had increased at nine of the cross sections, decreased at three and was constant at two. In 2003 mean depth had increased at nine of the sections and decreased at five sections. Maximum depth for 2001 increased at 14 of the sections and decreased at one. The 2003 survey found increases in mean depth at 12 of the sections and decreases at the other two sections.
Channel erosion by lateral migration, bed degradation and channel widening is active on Tributary Central. Clearly, Tributary Central has been unstable during the life of the Jabiluka mine. However, significant overbank deposition has also occurred on the floodplain in the small capacity reach where crevasses and splays are common. Sand deposition has formed a low angle fan which is well vegetated. Anabranches are developing and avulsions seem likely. While sand has been supplied to the anabranch, it terminates further downstream in a well defined sand front and is not being transported through to Ngarradj. It is essential that all available vertical air photographs are obtained and interpreted to determine whether Tributary Central was unstable before any development of the Jabiluka mine.

TC01
AB
TC06
TC05
TC11
TC04
TC10
TC09
TC08
CB
TC07
TC02
TC03
Entry
into
Sw
iftC
reek
ana
bran
ch
050
100
200
met
res
SCAL
E
CA
Flow D
irecti
on
N
Figu
re 7
Loc
atio
n of
the
perm
anen
tly m
onum
ente
d cr
oss
sect
ions
on
Trib
utar
y C
entra
l
16 16
Tabl
e 5
Hyd
raul
ic g
eom
etry
par
amet
er v
alue
s fo
r Trib
utar
y C
entra
l 199
8- 2
003.
All
of th
e va
lues
for T
C07
B fo
r eac
h of
the
year
s ha
ve b
een
reca
lcul
ated
(F
rom
thos
e pr
esen
ted
in IR
385
Say
nor e
t al 2
001)
as
the
poin
t of I
nfle
xion
has
cha
nged
.
TC06
A
TC06
B
B
ankf
ull H
ydra
ulic
G
eom
etry
Par
amet
ers
1998
19
99
2000
20
01
2002
20
03
1998
19
99
2000
20
01
2002
20
03
Area
(m2 )
4.
87
4.53
5.
19
5.92
4.
84
5.20
4.
10
4.18
4.
27
3.72
3.
74
4.32
Wid
th (m
) 10
.33
10.6
4 10
.35
10.5
7 10
.71
10.4
7 10
.61
10.8
6 10
.85
6.78
11
.27
14.3
6
Hyd
raul
ic m
ean
dept
h (m
) 0.
47
0.43
0.
50
0.56
0.
45
0.50
0.
39
0.39
0.
39
0.55
0.
33
0.30
Max
imum
dep
th (m
) 0.
919
1.07
2 1.
078
1.10
7 0.
926
1.08
3 1.
006
1.09
0 1.
070
1.09
1 1.
025
0.97
6
Mea
n ve
loci
ty (m
s-1 )
0.
72
0.67
0.
75
0.81
0.
81
0.81
0.
63
0.63
0.
64
0.80
0.
57
0.53
Dis
char
ge Q
(m3 s
-1)
3.50
3.
05
3.89
4.
77
4.77
4.
77
2.58
2.
63
2.73
2.
96
2.13
2.
30
Spec
ific
Stre
am P
ower
(W
m-2
) 7.
5 6.
3 8.
3 10
.0
10.0
10
.0
5.4
5.4
5.6
9.7
4.2
3.5
TC06
C
TC
07A
B
ankf
ull H
ydra
ulic
G
eom
etry
Par
amet
ers
1998
19
99
2000
20
01
2002
20
03
1998
19
99
2000
20
01
2002
20
03
Area
(m2 )
4.
55
4.32
4.
60
4.63
5.
54
3.19
7.
39
7.97
10
.55
10.0
1 10
.75
10.8
1
Wid
th (m
) 8.
70
7.76
7.
84
8.49
11
.62
7.98
11
.83
12.4
3 14
.77
15.3
7 16
.66
17.1
3
Hyd
raul
ic m
ean
dept
h (m
) 0.
52
0.56
0.
59
0.55
0.
48
0.40
0.
62
0.64
0.
71
0.65
0.
64
0.63
Max
imum
dep
th (m
) 0.
982
0.91
2 0.
962
1.17
7 1.
059
1.01
0 1.
169
1.15
0 1.
258
1.22
0 1.
285
1.14
0
Mea
n ve
loci
ty (m
s-1 )
0.
77
0.80
0.
83
0.79
0.
73
0.64
0.
87
0.88
0.
95
0.89
0.
89
0.87
Dis
char
ge Q
(m3 s
-1)
3.51
3.
47
3.83
3.
67
4.02
2.
06
6.42
7.
04
10.0
1 8.
93
9.53
9.
45
Spec
ific
Stre
am P
ower
(W
m-2
) 8.
9 9.
9 10
.8
9.6
7.7
5.7
12.0
12
.5
15.0
12
.9
12.7
12
.2
17

Tabl
e 5
Con
t. H
ydra
ulic
geo
met
ry p
aram
eter
val
ues
for T
ribut
ary
Cen
tral 1
998-
200
3
TC07
B
TC
07C
Ban
kful
l Hyd
raul
ic
Geo
met
ry P
aram
eter
s 19
98
1999
20
00
2003
20
02
2001
19
98
1999
20
00
2001
20
02
2003
Area
(m2 )
6.
09
7.82
8.
50
8.74
8.
82
8.83
4.
93
5.51
5.
59
5.70
5.
68
5.96
Wid
th (m
) 9.
99
11.4
9 12
.70
13.1
9 12
.93
13.0
7 7.
56
8.02
8.
13
8.18
8.
30
8.31
Hyd
raul
ic m
ean
dept
h (m
) 0.
61
0.68
0.
67
0.66
0.
68
0.68
0.
65
0.69
0.
69
0.70
0.
68
0.72
Max
imum
dep
th (m
) 1.
185
1.28
8 1.
314
1.34
1 1.
333
1.34
6 1.
221
1.29
1 1.
258
1.27
1 1.
440
1.54
9
Mea
n ve
loci
ty (m
s-1 )
0.
85
0.92
0.
91
0.90
0.
92
0.91
0.
89
0.93
0.
93
0.93
0.
92
0.95
Dis
char
ge Q
(m3 s
-1)
5.19
7.
18
7.72
7.
89
8.12
8.
07
4.40
5.
10
5.17
5.
32
5.24
5.
67
Spec
ific
Stre
am P
ower
(W
m-2
) 11
.5
13.8
13
.5
13.2
13
.9
13.7
12
.9
14.1
14
.1
14.4
14
.0
15.1
TC08
TC09
Ban
kful
l Hyd
raul
ic
Geo
met
ry P
aram
eter
s 19
98
1999
20
00
2001
20
02
2003
19
98
1999
20
00
2001
20
02
2003
Area
(m2 )
6.
76
7.47
7.
33
7.45
7.
52
7.46
6.
94
7.16
7.
31
7.84
8.
19
8.26
Wid
th (m
) 8.
38
8.37
8.
51
8.63
8.
83
8.88
7.
55
7.76
7.
70
9.21
9.
04
8.86
Hyd
raul
ic m
ean
dept
h (m
) 0.
81
0.89
0.
86
0.86
0.
85
0.84
0.
92
0.92
0.
95
0.85
0.
91
0.93
Max
imum
dep
th (m
) 1.
524
1.61
3 1.
632
1.64
4 1.
648
1.65
8 1.
421
1.39
3 1.
411
1.49
9 1.
474
1.47
8
Mea
n ve
loci
ty (m
s-1 )
1.
03
1.10
1.
07
1.08
1.
07
1.06
1.
12
1.13
1.
15
1.07
1.
11
1.13
Dis
char
ge Q
(m3 s
-1)
6.95
8.
22
7.88
8.
03
8.02
7.
89
7.80
8.
07
8.38
8.
37
9.11
9.
37
Spec
ific
Stre
am P
ower
(W
m-2
) 18
.4
21.7
20
.5
20.6
20
.1
19.7
22
.9
23.0
24
.1
20.1
22
.3
23.4
18

Tabl
e 5
Con
t. H
ydra
ulic
geo
met
ry p
aram
eter
val
ues
for T
ribut
ary
Cen
tral 1
998-
200
3
TC10
TC05
Ban
kful
l Hyd
raul
ic
Geo
met
ry P
aram
eter
s 19
98
1999
20
00
2001
20
02
2003
19
98
1999
20
00
2001
20
02
2003
Area
(m2 )
3.
87
3.87
3.
96
4.28
4.
31
4.19
4.
95
4.83
4.
86
4.81
4.
64
4.85
Wid
th (m
) 7.
79
7.66
7.
93
8.55
8.
52
8.90
5.
48
5.36
5.
52
5.61
5.
56
5.75
Hyd
raul
ic m
ean
dept
h (m
) 0.
50
0.50
0.
50
0.50
0.
51
0.47
0.
90
0.90
0.
88
0.86
0.
83
0.84
Max
imum
dep
th (m
) 0.
753
0.75
3 0.
789
0.83
3 0.
823
0.83
8 1.
141
1.13
0 1.
156
1.20
9 1.
155
1.18
8
Mea
n ve
loci
ty (m
s-1 )
0.
75
0.75
0.
75
0.75
0.
75
0.72
1.
11
1.11
1.
09
1.07
1.
05
1.06
Dis
char
ge Q
(m3 s
-1)
2.89
2.
91
2.96
3.
21
3.26
3.
01
5.50
5.
35
5.30
5.
15
4.89
5.
14
Spec
ific
Stre
am P
ower
(W
m-2
) 8.
2 8.
4 8.
3 8.
3 8.
5 7.
5 22
.2
22.1
21
.2
20.3
19
.5
19.8
TC11
TC04
Ban
kful
l Hyd
raul
ic
Geo
met
ry P
aram
eter
s 19
98
1999
20
00
2001
20
02
2003
19
98
1999
20
00
2001
20
02
2003
Area
(m2 )
3.
59
3.84
3.
97
4.07
4.
16
4.25
3.
33
3.48
3.
74
3.78
3.
95
3.95
Wid
th (m
) 6.
44
6.27
6.
60
7.31
7.
35
8.16
4.
88
4.79
4.
93
4.70
4.
78
4.92
Hyd
raul
ic m
ean
dept
h (m
) 0.
56
0.61
0.
60
0.56
0.
57
0.52
0.
68
0.72
0.
76
0.80
0.
83
0.80
Max
imum
dep
th (m
) 0.
777
0.89
0 0.
837
1.10
7 1.
112
1.07
5 1.
005
0.98
4 1.
177
1.18
6 1.
199
1.21
4
Mea
n ve
loci
ty (m
s-1 )
0.
80
0.86
0.
85
0.80
0.
81
0.77
0.
92
0.96
0.
99
1.03
1.
05
1.03
Dis
char
ge Q
(m3 s
-1)
2.89
3.
30
3.36
3.
28
3.38
3.
27
3.06
3.
33
3.69
3.
88
4.12
4.
05
Spec
ific
Stre
am P
ower
(W
m-2
) 9.
9 11
.6
11.3
9.
9 10
.2
8.9
13.9
15
.4
16.6
18
.3
19.1
18
.2
19

Tabl
e 5
Con
t. H
ydra
ulic
geo
met
ry p
aram
eter
val
ues
for T
ribut
ary
Cen
tral 1
998-
200
3
TC03
TC01
Ban
kful
l Hyd
raul
ic
Geo
met
ry P
aram
eter
s 19
98
1999
20
00
2001
20
02
2003
19
98
1999
20
00
2001
20
02
2003
Area
(m2 )
2.
10
2.28
2.
28
2.24
2.
25
2.10
1.
66
1.52
1.
74
1.81
1.
89
1.81
Wid
th (m
) 4.
84
5.15
5.
45
4.59
4.
60
4.36
3.
93
4.01
4.
29
4.47
5.
43
3.94
Hyd
raul
ic m
ean
dept
h (m
) 0.
44
0.44
0.
42
0.49
0.
49
0.48
0.
42
0.38
0.
40
0.41
0.
35
0.46
Max
imum
dep
th (m
) 0.
588
0.65
8 0.
707
0.70
3 0.
689
0.65
6 0.
620
0.60
6 0.
653
0.64
9 0.
640
0.59
5
Mea
n ve
loci
ty (m
s-1 )
0.
68
0.69
0.
66
0.74
0.
74
0.73
0.
67
0.62
0.
65
0.65
0.
59
0.71
Dis
char
ge Q
(m3 s
-1)
1.44
1.
58
1.51
1.
65
1.66
1.
54
1.11
0.
94
1.13
1.
18
1.11
1.
28
Spec
ific
Stre
am P
ower
(W
m-2
) 6.
6 6.
8 6.
1 7.
9 8.
0 7.
8 6.
3 5.
2 5.
8 5.
8 4.
5 7.
2
20
21
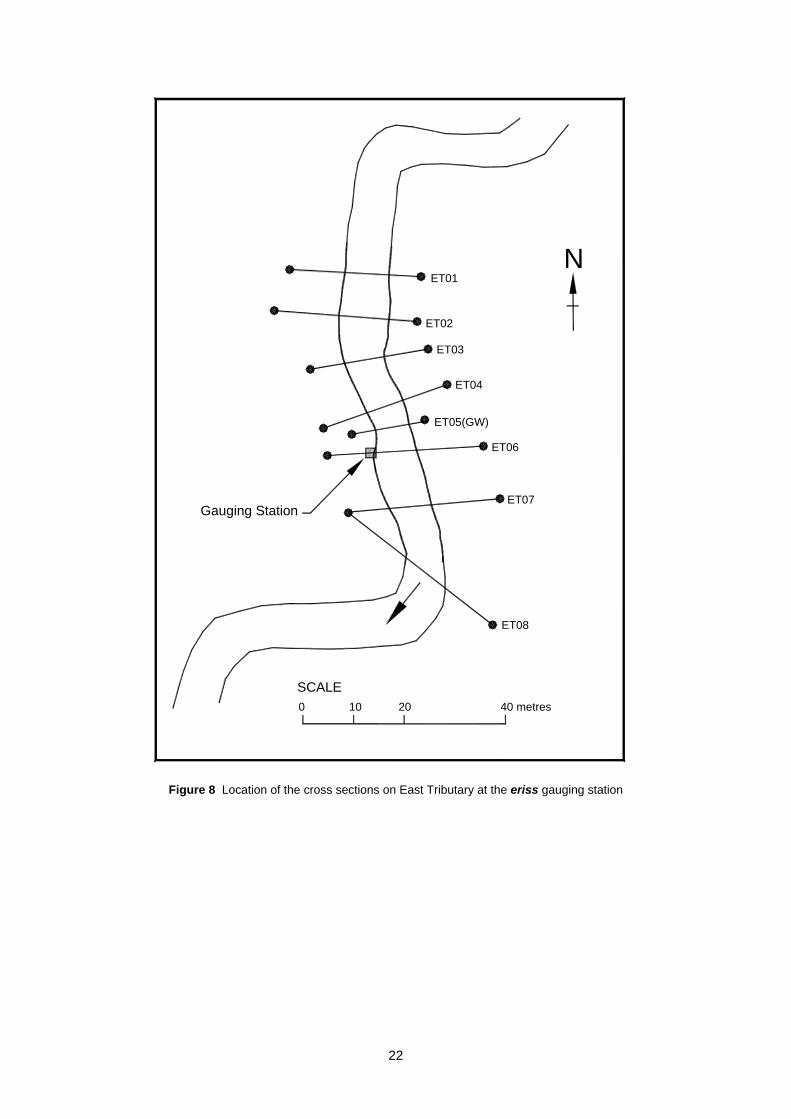
3.3 East Tributary Cross sections The gauging station is located in the forested meandering reach of Erskine et al (2001). Eight cross sections were installed near the gauge during the 1998 dry season They have been resurveyed during each subsequent dry season. The location of the cross sections is shown in figure 8. The values of the bankfull hydraulic geometry parameters for each survey at each cross section are listed in table 6.
A field surveyed flood (2000/2001 wet season) slope of 0.0015 m/m (1.5 m/km) was used to determine the values of the hydraulic geometry parameters in table 6. The Manning's n value used was 0.04. All comparisons for the survey data are made to the first survey which was completed in 1998.
There was an increase in cross sectional area at all cross sections between 1998 and 2001. However, the maximum percentage increase in cross sectional area since 1998 was only 8.6%. In 2003, the mean cross sectional area had increased at seven sections and decreased at one. The maximum percentage increase in cross sectional area for between 2003 and 1998 was 11.9%. For both 2001 and 2003 surveys compared to 1998, width had increased at seven of the eight sections with the other section decreasing (ET08 in both instances). Mean and maximum depth increased at all cross sections for 2001. In 2003, mean depth increased at six sections and decreased at two and maximum depth increased at seven sections and decreased at one.
East Tributary is not impacted by the Jabiluka mine and is flanked by a monsoonal vine forest at the gauging station (Erskine et al 2001). The forest stabilises the bank by a high density of tree trunks, roots and root mats.
22
SCALE0 2010 40 metres
Gauging Station
ET01
ET02
ET03
ET04
ET05(GW)
ET06
ET07
ET08
N
Figure 8 Location of the cross sections on East Tributary at the eriss gauging station

Tabl
e 6
Hyd
raul
ic g
eom
etry
par
amet
er v
alue
s fo
r Eas
t Trib
utar
y 19
98- 2
003.
ET01
ET02
Ban
kful
l Hyd
raul
ic
Geo
met
ry P
aram
eter
s 19
98
1999
20
00
2001
20
02
2003
19
98
1999
20
00
2001
20
02
2003
Area
(m2 )
8.
30
8.33
9.
14
8.83
8.
90
8.75
12
.93
13.5
3 13
.74
13.8
8 12
.87
12.6
1
Wid
th (m
) 8.
07
8.13
8.
17
8.29
8.
46
8.56
10
.01
9.88
9.
86
10.0
3 10
.08
10.2
0
Hyd
raul
ic m
ean
dept
h (m
) 1.
03
1.02
1.
12
1.07
1.
05
1.02
1.
29
1.37
1.
39
1.38
1.
28
1.24
Max
imum
dep
th (m
) 1.
510
1.45
9 1.
759
1.67
1 1.
749
1.55
2 2.
193
2.18
1 2.
328
2.25
1 2.
03
1.83
1
Mea
n ve
loci
ty (m
s-1 )
0.
99
0.98
1.
04
1.01
1.
00
0.98
1.
15
1.19
1.
21
1.20
1.
14
1.11
Dis
char
ge Q
(m3 s
-1)
8.19
8.
20
9.54
8.
92
8.92
8.
59
14.8
4 16
.16
16.5
9 16
.70
14.6
7 14
.06
Spec
ific
Stre
am P
ower
(W
m-2
) 14
.9
14.8
17
.2
15.8
15
.5
14.8
21
.8
24.0
24
.7
24.5
21
.4
20.2
ET03
ET04
Ban
kful
l Hyd
raul
ic
Geo
met
ry P
aram
eter
s 19
98
1999
20
00
2001
20
02
2003
19
98
1999
20
00
2001
20
02
2003
Area
(m2 )
7.
57
7.80
8.
31
7.93
8.
25
8.13
6.
26
6.39
6.
38
6.55
6.
53
6.54
Wid
th (m
) 7.
65
7.63
7.
68
7.74
7.
85
7.96
6.
85
6.85
7.
04
7.11
6.
69
7.01
Hyd
raul
ic m
ean
dept
h (m
) 0.
99
1.02
1.
08
1.02
1.
05
1.02
0.
91
0.93
0.
91
0.92
0.
98
0.93
Max
imum
dep
th (m
) 1.
518
1.60
3 1.
654
1.61
4 1.
626
1.58
7 1.
261
1.32
1 1.
320
1.33
6 1.
397
1.33
9
Mea
n ve
loci
ty (m
s-1 )
0.
96
0.98
1.
02
0.98
1.
00
0.98
0.
91
0.92
0.
91
0.92
0.
95
0.92
Dis
char
ge Q
(m3 s
-1)
7.28
7.
66
8.48
7.
80
8.26
7.
98
5.70
5.
90
5.78
6.
00
6.21
6.
04
Spec
ific
Stre
am P
ower
(W
m-2
) 14
.0
14.8
16
.2
14.8
15
.5
14.7
12
.2
12.7
12
.1
12.4
13
.6
12.7
23
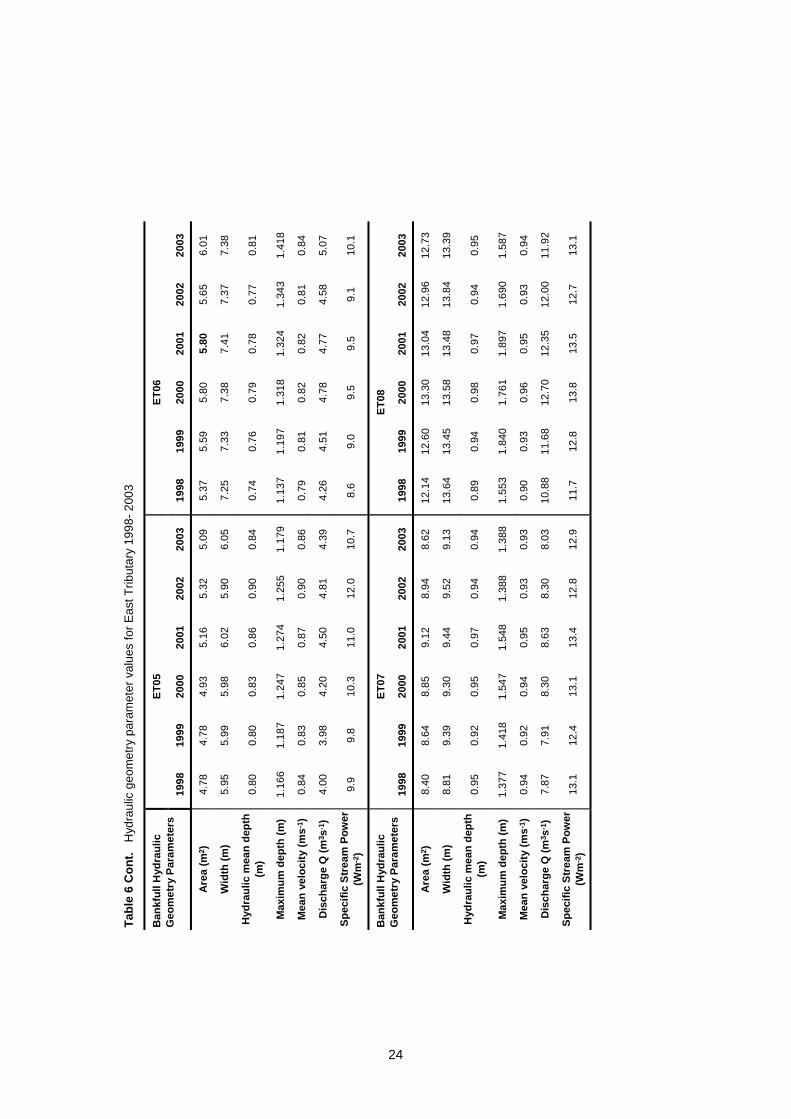
Tabl
e 6
Con
t. H
ydra
ulic
geo
met
ry p
aram
eter
val
ues
for E
ast T
ribut
ary
1998
- 200
3
ET05
ET06
Ban
kful
l Hyd
raul
ic
Geo
met
ry P
aram
eter
s 19
98
1999
20
00
2001
20
02
2003
19
98
1999
20
00
2001
20
02
2003
Area
(m2 )
4.
78
4.78
4.
93
5.16
5.
32
5.09
5.
37
5.59
5.
80
5.80
5.
65
6.01
Wid
th (m
) 5.
95
5.99
5.
98
6.02
5.
90
6.05
7.
25
7.33
7.
38
7.41
7.
37
7.38
Hyd
raul
ic m
ean
dept
h (m
) 0.
80
0.80
0.
83
0.86
0.
90
0.84
0.
74
0.76
0.
79
0.78
0.
77
0.81
Max
imum
dep
th (m
) 1.
166
1.18
7 1.
247
1.27
4 1.
255
1.17
9 1.
137
1.19
7 1.
318
1.32
4 1.
343
1.41
8
Mea
n ve
loci
ty (m
s-1 )
0.
84
0.83
0.
85
0.87
0.
90
0.86
0.
79
0.81
0.
82
0.82
0.
81
0.84
Dis
char
ge Q
(m3 s
-1)
4.00
3.
98
4.20
4.
50
4.81
4.
39
4.26
4.
51
4.78
4.
77
4.58
5.
07
Spec
ific
Stre
am P
ower
(W
m-2
) 9.
9 9.
8 10
.3
11.0
12
.0
10.7
8.
6 9.
0 9.
5 9.
5 9.
1 10
.1
ET07
ET08
Ban
kful
l Hyd
raul
ic
Geo
met
ry P
aram
eter
s 19
98
1999
20
00
2001
20
02
2003
19
98
1999
20
00
2001
20
02
2003
Area
(m2 )
8.
40
8.64
8.
85
9.12
8.
94
8.62
12
.14
12.6
0 13
.30
13.0
4 12
.96
12.7
3
Wid
th (m
) 8.
81
9.39
9.
30
9.44
9.
52
9.13
13
.64
13.4
5 13
.58
13.4
8 13
.84
13.3
9
Hyd
raul
ic m
ean
dept
h (m
) 0.
95
0.92
0.
95
0.97
0.
94
0.94
0.
89
0.94
0.
98
0.97
0.
94
0.95
Max
imum
dep
th (m
) 1.
377
1.41
8 1.
547
1.54
8 1.
388
1.38
8 1.
553
1.84
0 1.
761
1.89
7 1.
690
1.58
7
Mea
n ve
loci
ty (m
s-1 )
0.
94
0.92
0.
94
0.95
0.
93
0.93
0.
90
0.93
0.
96
0.95
0.
93
0.94
Dis
char
ge Q
(m3 s
-1)
7.87
7.
91
8.30
8.
63
8.30
8.
03
10.8
8 11
.68
12.7
0 12
.35
12.0
0 11
.92
Spec
ific
Stre
am P
ower
(W
m-2
) 13
.1
12.4
13
.1
13.4
12
.8
12.9
11
.7
12.8
13
.8
13.5
12
.7
13.1
24
25
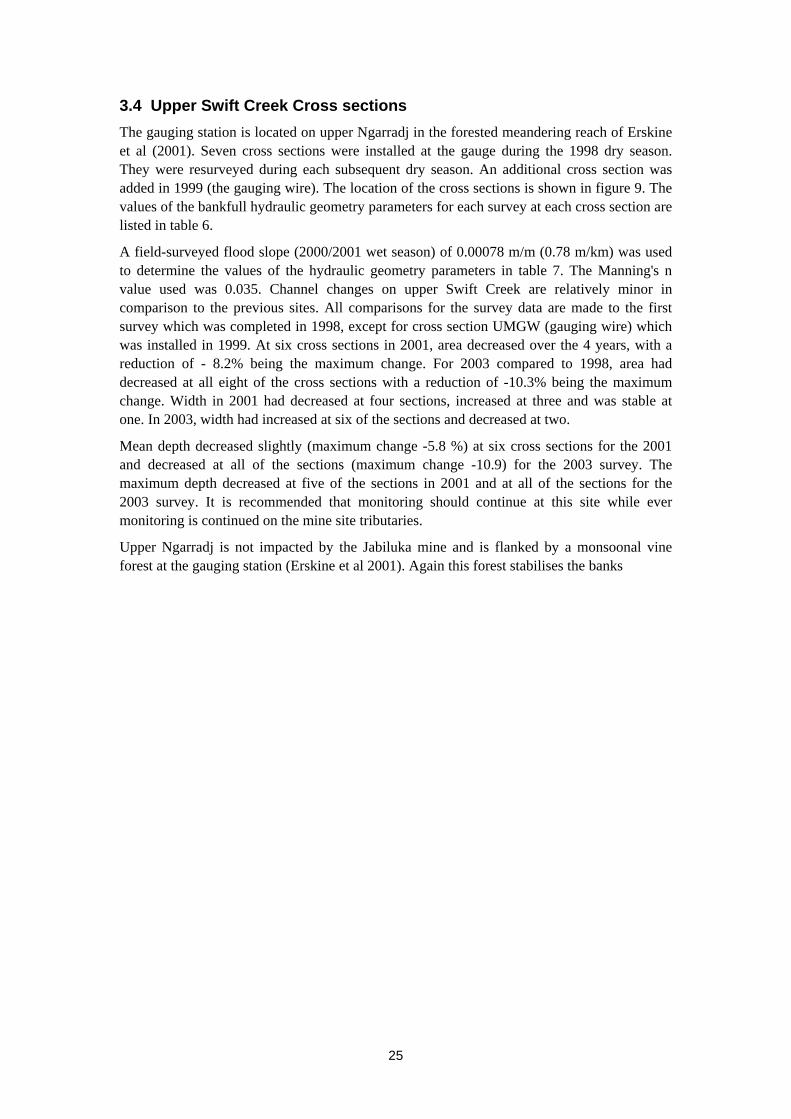
3.4 Upper Swift Creek Cross sections The gauging station is located on upper Ngarradj in the forested meandering reach of Erskine et al (2001). Seven cross sections were installed at the gauge during the 1998 dry season. They were resurveyed during each subsequent dry season. An additional cross section was added in 1999 (the gauging wire). The location of the cross sections is shown in figure 9. The values of the bankfull hydraulic geometry parameters for each survey at each cross section are listed in table 6.
A field-surveyed flood slope (2000/2001 wet season) of 0.00078 m/m (0.78 m/km) was used to determine the values of the hydraulic geometry parameters in table 7. The Manning's n value used was 0.035. Channel changes on upper Swift Creek are relatively minor in comparison to the previous sites. All comparisons for the survey data are made to the first survey which was completed in 1998, except for cross section UMGW (gauging wire) which was installed in 1999. At six cross sections in 2001, area decreased over the 4 years, with a reduction of - 8.2% being the maximum change. For 2003 compared to 1998, area had decreased at all eight of the cross sections with a reduction of -10.3% being the maximum change. Width in 2001 had decreased at four sections, increased at three and was stable at one. In 2003, width had increased at six of the sections and decreased at two.
Mean depth decreased slightly (maximum change -5.8 %) at six cross sections for the 2001 and decreased at all of the sections (maximum change -10.9) for the 2003 survey. The maximum depth decreased at five of the sections in 2001 and at all of the sections for the 2003 survey. It is recommended that monitoring should continue at this site while ever monitoring is continued on the mine site tributaries.
Upper Ngarradj is not impacted by the Jabiluka mine and is flanked by a monsoonal vine forest at the gauging station (Erskine et al 2001). Again this forest stabilises the banks

26
UM07
UM06
UM07
UM05UM04
UM03
UM02
UM01
UM05
UM01
UM02
UM03
UM04
RAIN GAUGE
UMGW
GAUGING STATION
0 10 20 30 40 50 metresSCALE
N
UM06
Figure 9 Location of the cross sections at the upper Swift Creek gauge

Tabl
e 7
Hyd
raul
ic g
eom
etry
par
amet
er v
alue
s fo
r Upp
er S
wift
Cre
ek 1
998-
200
3. A
ll of
the
valu
es fo
r UM
01 fo
r eac
h of
the
year
s ha
ve b
een
reca
lcul
ated
as
the
poin
t of I
nfle
xion
has
cha
nged
.
UM
01
U
M02
Ban
kful
l Hyd
raul
ic
Geo
met
ry P
aram
eter
s 19
98
1999
20
00
2001
20
02
2003
19
98
1999
20
00
2001
20
02
2003
Area
(m2 )
11
.88
11.6
4 11
.68
11.7
1 11
.85
11.5
7 11
.25
10.7
7 10
.67
10.8
8 10
.70
10.5
1
Wid
th (m
) 11
.08
11.2
9 11
.05
10.6
9 10
.67
11.2
1 10
.21
10.1
3 10
.21
10.3
6 10
.33
10.7
2
Hyd
raul
ic m
ean
dept
h (m
) 1.
07
1.03
1.
06
1.10
1.
11
1.03
1.
10
1.06
1.
04
1.05
1.
04
0.98
Max
imum
dep
th (m
) 1.
781
1.68
7 1.
724
1.73
2 1.
723
1.72
4 1.
643
1.56
4 1.
607
1.63
3 1.
598
1.53
1
Mea
n ve
loci
ty (m
s-1 )
0.
46
0.45
0.
45
0.46
0.
47
0.45
0.
47
0.45
0.
45
0.45
0.
45
0.43
Dis
char
ge Q
(m3 s
-1)
5.43
5.
18
5.29
5.
43
5.54
5.
15
5.24
4.
89
4.79
4.
91
4.78
4.
53
Spec
ific
Stre
am P
ower
(W
m-2
) 1.
1 1.
0 1.
1 1.
2 1.
2 1.
1 1.
2 1.
1 1.
1 1.
1 1.
1 1.
0
UM
03
U
MG
W
B
ankf
ull H
ydra
ulic
G
eom
etry
Par
amet
ers
1998
19
99
2000
20
01
2002
20
03
1998
19
99
2000
20
01
2002
20
03
Area
(m2 )
7.
11
6.80
6.
55
6.53
6.
44
6.38
N
A 9.
46
9.51
9.
63
9.42
9.
31
Wid
th (m
) 7.
25
7.20
7.
06
6.73
6.
72
7.02
N
A 8.
75
8.77
8.
97
8.96
9.
02
Hyd
raul
ic m
ean
dept
h (m
) 0.
98
0.94
0.
93
0.97
0.
96
0.91
N
A 1.
08
1.09
1.
07
1.05
1.
03
Max
imum
dep
th (m
) 1.
277
1.20
2 1.
241
1.30
3 1.
188
1.13
1 N
A 1.
381
1.38
0 1.
474
1.39
3 1.
363
Mea
n ve
loci
ty (m
s-1 )
0.
43
0.42
0.
41
0.43
0.
42
0.41
N
A 0.
46
0.46
0.
46
0.45
0.
45
Dis
char
ge Q
(m3 s
-1)
3.06
2.
86
2.72
2.
79
2.73
2.
61
NA
4.35
4.
38
4.40
4.
25
4.15
Spec
ific
Stre
am P
ower
(W
m-2
) 1.
0 0.
9 0.
9 0.
9 0.
9 0.
8 N
A 1.
1 1.
1 1.
1 1.
1 1.
1
27

Tabl
e 7
Con
t. H
ydra
ulic
geo
met
ry p
aram
eter
val
ues
for U
pper
Sw
ift C
reek
199
8- 2
003
UM
04
U
M05
Ban
kful
l Hyd
raul
ic
Geo
met
ry P
aram
eter
s 19
98
1999
20
00
2001
20
02
2003
19
98
1999
20
00
2001
20
02
2003
Area
(m2 )
10
.66
10.3
5 10
.66
10.6
9 10
.84
10.5
5 11
.53
11.2
5 11
.27
11.2
3 11
.28
11.2
2
Wid
th (m
) 9.
36
9.35
9.
41
9.36
9.
48
9.55
9.
97
9.94
10
.09
10.0
3 10
.03
10.1
2
Hyd
raul
ic m
ean
dept
h (m
) 1.
14
1.11
1.
13
1.14
1.
14
1.11
1.
16
1.13
1.
12
1.12
1.
12
1.11
Max
imum
dep
th (m
) 1.
574
1.47
1 1.
471
1.57
4 1.
556
1.46
9 1.
551
1.48
3 1.
479
1.49
0 1.
466
1.44
7
Mea
n ve
loci
ty (m
s-1 )
0.
48
0.47
0.
47
0.48
0.
48
0.47
0.
48
0.47
0.
47
0.47
0.
47
0.47
Dis
char
ge Q
(m3 s
-1)
5.07
4.
83
5.05
5.
09
5.17
4.
92
5.54
5.
33
5.29
5.
28
5.32
5.
24
Spec
ific
Stre
am P
ower
(W
m-2
) 1.
2 1.
2 1.
2 1.
2 1.
2 1.
2 1.
3 1.
2 1.
2 1.
2 1.
2 1.
2
UM
06
U
M07
Ban
kful
l Hyd
raul
ic
Geo
met
ry P
aram
eter
s 19
98
1999
20
00
2001
20
02
2003
19
98
1999
20
00
2001
20
02
2003
Area
(m2 )
14
.24
14.0
9 14
.06
14.0
1 13
.95
13.8
4 15
.96
15.3
6 15
.49
14.9
7 15
.26
14.7
7
Wid
th (m
) 12
.26
12.1
4 12
.83
12.3
2 12
.27
12.1
8 11
.60
11.6
0 11
.54
11.5
4 11
.60
11.6
5
Hyd
raul
ic m
ean
dept
h (m
) 1.
16
1.16
1.
10
1.14
1.
14
1.14
1.
38
1.32
1.
34
1.30
1.
32
1.27
Max
imum
dep
th (m
) 1.
545
1.53
5 1.
504
1.50
4 1.
499
1.49
0 1.
927
1.79
7 1.
923
1.74
1.
831
1.65
6
Mea
n ve
loci
ty (m
s-1 )
0.
48
0.48
0.
46
0.48
0.
48
0.47
0.
54
0.53
0.
53
0.52
0.
52
0.51
Dis
char
ge Q
(m3 s
-1)
6.86
6.
79
6.52
6.
66
6.63
6.
57
8.61
8.
08
8.22
7.
77
7.99
7.
54
Spec
ific
Stre
am P
ower
(W
m-2
) 1.
3 1.
3 1.
2 1.
2 1.
2 1.
2 1.
7 1.
6 1.
6 1.
5 1.
6 1.
5
28

29
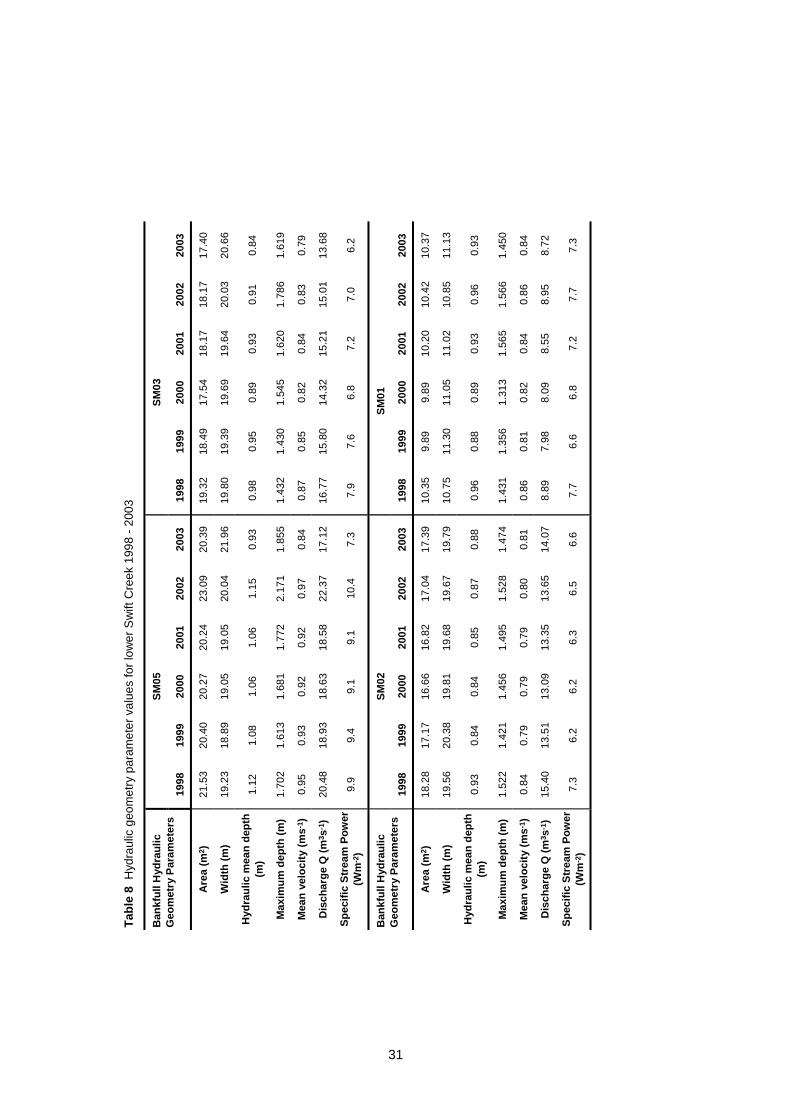
3.5 Swift Creek Cross sections The gauging station is located on Ngarradj in the sinuous reach of Erskine et al (2001). Eight cross sections were installed at the gauge during the 1998 dry season. They were resurveyed during each subsequent dry season. The location of the cross sections is shown in figure 10. The values of the bankfull hydraulic geometry parameters for each survey at each cross section are listed in table 8.
A field-surveyed bed slope of 0.00095 m/m (0.95 m/km) was used to determine the values of the hydraulic geometry parameters in table 8. The Manning's n value used was 0.035. All comparisons for the survey data are made to the first survey which was completed in 1998.
All of the cross sections experienced a decrease in cross sectional area up to both 2001 (maximum -8.2 %) and 2003 (maximum - 9.9). Width decreased at six sections in 2001 but increased at six in 2003. Mean depth decreased at seven cross sections in 2001 and at five sections in 2003. Maximum depth decreased at five of the sections in 2001 indicating that there has been general bed aggradation since 1998. The 2003 survey had bed levels increasing at seven of the cross sections, indicating that the bed has aggraded above the 1998 levels. This shows that sediment is being stored in the bed.
It is recommended that monitoring should continue at this site while ever monitoring is being conducted elsewhere in the Ngarradj catchment to provide a comprehensive baseline of information about sediment.

30
To East Tributary
0 50 100 metresSCALE
Gauging Station
To Oenpelli Rd
SM05
SM03
SM02
SM01
SM06
SM04
SM07
SM08
N
Figure 10 Location of cross sections at the lower Swift Creek gauge
.
Tabl
e 8
Hyd
raul
ic g
eom
etry
par
amet
er v
alue
s fo
r low
er S
wift
Cre
ek 1
998
- 200
3
SM05
SM03
Ban
kful
l Hyd
raul
ic
Geo
met
ry P
aram
eter
s 19
98
1999
20
00
2001
20
02
2003
19
98
1999
20
00
2001
20
02
2003
Area
(m2 )
21
.53
20.4
0 20
.27
20.2
4 23
.09
20.3
9 19
.32
18.4
9 17
.54
18.1
7 18
.17
17.4
0
Wid
th (m
) 19
.23
18.8
9 19
.05
19.0
5 20
.04
21.9
6 19
.80
19.3
9 19
.69
19.6
4 20
.03
20.6
6
Hyd
raul
ic m
ean
dept
h (m
) 1.
12
1.08
1.
06
1.06
1.
15
0.93
0.
98
0.95
0.
89
0.93
0.
91
0.84
Max
imum
dep
th (m
) 1.
702
1.61
3 1.
681
1.77
2 2.
171
1.85
5 1.
432
1.43
0 1.
545
1.62
0 1.
786
1.61
9
Mea
n ve
loci
ty (m
s-1 )
0.
95
0.93
0.
92
0.92
0.
97
0.84
0.
87
0.85
0.
82
0.84
0.
83
0.79
Dis
char
ge Q
(m3 s
-1)
20.4
8 18
.93
18.6
3 18
.58
22.3
7 17
.12
16.7
7 15
.80
14.3
2 15
.21
15.0
1 13
.68
Spec
ific
Stre
am P
ower
(W
m-2
) 9.
9 9.
4 9.
1 9.
1 10
.4
7.3
7.9
7.6
6.8
7.2
7.0
6.2
SM02
SM01
Ban
kful
l Hyd
raul
ic
Geo
met
ry P
aram
eter
s 19
98
1999
20
00
2001
20
02
2003
19
98
1999
20
00
2001
20
02
2003
Area
(m2 )
18
.28
17.1
7 16
.66
16.8
2 17
.04
17.3
9 10
.35
9.89
9.
89
10.2
0 10
.42
10.3
7
Wid
th (m
) 19
.56
20.3
8 19
.81
19.6
8 19
.67
19.7
9 10
.75
11.3
0 11
.05
11.0
2 10
.85
11.1
3
Hyd
raul
ic m
ean
dept
h (m
) 0.
93
0.84
0.
84
0.85
0.
87
0.88
0.
96
0.88
0.
89
0.93
0.
96
0.93
Max
imum
dep
th (m
) 1.
522
1.42
1 1.
456
1.49
5 1.
528
1.47
4 1.
431
1.35
6 1.
313
1.56
5 1.
566
1.45
0
Mea
n ve
loci
ty (m
s-1 )
0.
84
0.79
0.
79
0.79
0.
80
0.81
0.
86
0.81
0.
82
0.84
0.
86
0.84
Dis
char
ge Q
(m3 s
-1)
15.4
0 13
.51
13.0
9 13
.35
13.6
5 14
.07
8.89
7.
98
8.09
8.
55
8.95
8.
72
Spec
ific
Stre
am P
ower
(W
m-2
) 7.
3 6.
2 6.
2 6.
3 6.
5 6.
6 7.
7 6.
6 6.
8 7.
2 7.
7 7.
3
31

Tabl
e 8
Con
t. H
ydra
ulic
geo
met
ry p
aram
eter
val
ues
for l
ower
Sw
ift C
reek
199
8 –
2003
SM06
SM04
Ban
kful
l Hyd
raul
ic
Geo
met
ry P
aram
eter
s 19
98
1999
20
00
2001
20
02
2003
19
98
1999
20
00
2001
20
02
2003
Area
(m2 )
17
.57
17.0
9 16
.91
17.1
4 17
.56
17.5
2 10
.08
9.40
8.
91
9.25
9.
71
9.83
Wid
th (m
) 17
.99
17.6
3 17
.78
17.4
3 17
.76
18.5
9 11
.65
11.5
1 10
.96
10.7
7 10
.83
11.1
3
Hyd
raul
ic m
ean
dept
h (m
) 0.
98
0.97
0.
95
0.98
0.
99
0.94
0.
87
0.82
0.
81
0.86
0.
90
0.88
Max
imum
dep
th (m
) 1.
763
1.69
7 1.
691
1.74
5 1.
876
1.78
5 1.
173
1.10
7 1.
135
1.15
8 1.
327
1.19
5
Mea
n ve
loci
ty (m
s-1 )
0.
87
0.86
0.
85
0.87
0.
87
0.85
0.
80
0.77
0.
77
0.80
0.
82
0.81
Dis
char
ge Q
(m3 s
-1)
15.2
5 14
.76
14.4
2 14
.95
15.3
6 14
.86
8.07
7.
24
6.84
7.
37
7.95
7.
98
Spec
ific
Stre
am P
ower
(W
m-2
) 7.
9 7.
8 7.
6 8.
0 8.
1 7.
5 6.
5 5.
9 5.
8 6.
4 6.
9 6.
7
SM07
SM08
Ban
kful
l Hyd
raul
ic
Geo
met
ry P
aram
eter
s 19
98
1999
20
00
2001
20
02
2003
19
98
1999
20
00
2001
20
02
2003
Area
(m2 )
18
.87
18.1
6 17
.64
17.5
4 18
.98
18.8
3 19
.75
18.7
4 18
.21
18.3
7 18
.46
18.6
8
Wid
th (m
) 15
.05
14.7
7 15
.61
14.8
2 15
.29
15.0
8 18
.80
18.6
5 18
.68
18.5
5 18
.84
18.7
3
Hyd
raul
ic m
ean
dept
h (m
) 1.
25
1.23
1.
13
1.18
1.
24
1.25
1.
05
1.01
0.
97
0.99
0.
98
1.00
Max
imum
dep
th (m
) 1.
768
1.66
2 1.
651
1.75
1 2.
002
2.06
2 1.
717
1.53
1.
634
1.60
3 1.
755
1.78
5
Mea
n ve
loci
ty (m
s-1 )
1.
03
1.01
0.
96
0.99
1.
02
1.02
0.
91
0.88
0.
87
0.88
0.
87
0.88
Dis
char
ge Q
(m3 s
-1)
19.3
5 18
.38
16.8
8 17
.30
19.3
3 19
.26
18.0
0 16
.58
15.7
9 16
.09
16.0
6 16
.44
Spec
ific
Stre
am P
ower
(W
m-2
) 12
.0
11.6
10
.1
10.9
11
.8
11.9
8.
9 8.
3 7.
9 8.
1 8.
0 8.
2
32
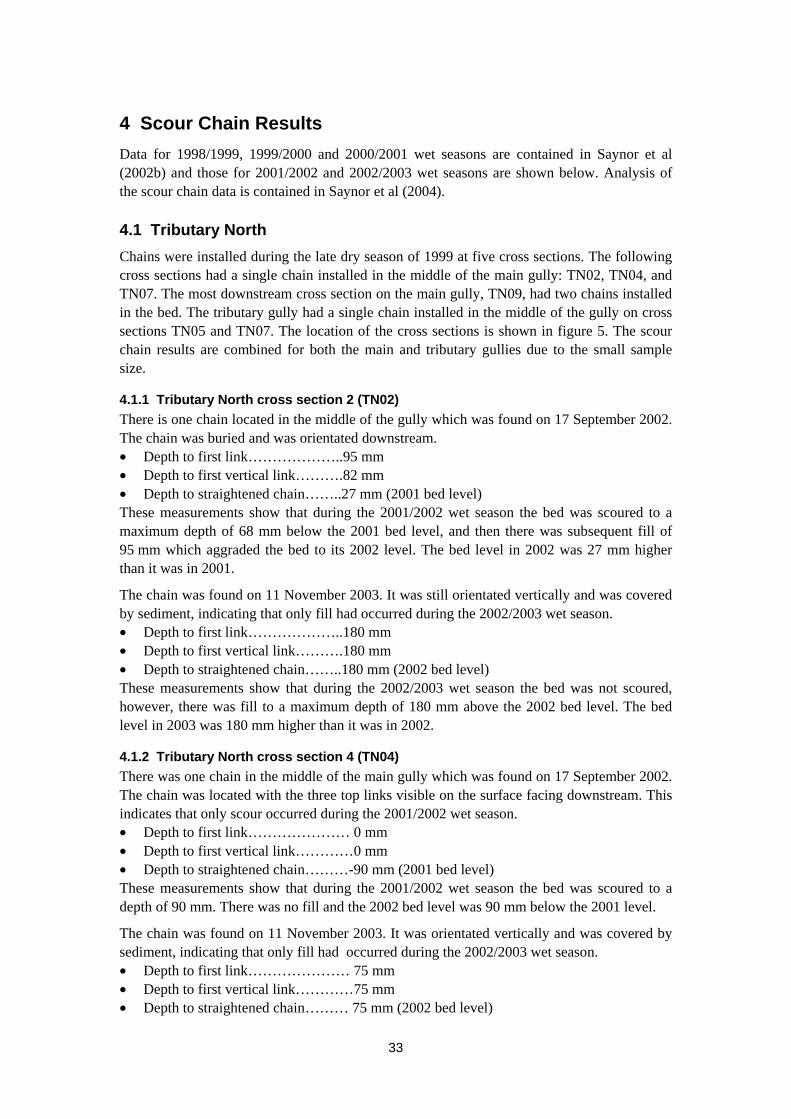
33
4 Scour Chain Results Data for 1998/1999, 1999/2000 and 2000/2001 wet seasons are contained in Saynor et al (2002b) and those for 2001/2002 and 2002/2003 wet seasons are shown below. Analysis of the scour chain data is contained in Saynor et al (2004).
4.1 Tributary North Chains were installed during the late dry season of 1999 at five cross sections. The following cross sections had a single chain installed in the middle of the main gully: TN02, TN04, and TN07. The most downstream cross section on the main gully, TN09, had two chains installed in the bed. The tributary gully had a single chain installed in the middle of the gully on cross sections TN05 and TN07. The location of the cross sections is shown in figure 5. The scour chain results are combined for both the main and tributary gullies due to the small sample size.
4.1.1 Tributary North cross section 2 (TN02) There is one chain located in the middle of the gully which was found on 17 September 2002. The chain was buried and was orientated downstream. • Depth to first link………………..95 mm • Depth to first vertical link……….82 mm • Depth to straightened chain……..27 mm (2001 bed level) These measurements show that during the 2001/2002 wet season the bed was scoured to a maximum depth of 68 mm below the 2001 bed level, and then there was subsequent fill of 95 mm which aggraded the bed to its 2002 level. The bed level in 2002 was 27 mm higher than it was in 2001.
The chain was found on 11 November 2003. It was still orientated vertically and was covered by sediment, indicating that only fill had occurred during the 2002/2003 wet season. • Depth to first link………………..180 mm • Depth to first vertical link……….180 mm • Depth to straightened chain……..180 mm (2002 bed level) These measurements show that during the 2002/2003 wet season the bed was not scoured, however, there was fill to a maximum depth of 180 mm above the 2002 bed level. The bed level in 2003 was 180 mm higher than it was in 2002.
4.1.2 Tributary North cross section 4 (TN04) There was one chain in the middle of the main gully which was found on 17 September 2002. The chain was located with the three top links visible on the surface facing downstream. This indicates that only scour occurred during the 2001/2002 wet season. • Depth to first link………………… 0 mm • Depth to first vertical link…………0 mm • Depth to straightened chain………-90 mm (2001 bed level) These measurements show that during the 2001/2002 wet season the bed was scoured to a depth of 90 mm. There was no fill and the 2002 bed level was 90 mm below the 2001 level.
The chain was found on 11 November 2003. It was orientated vertically and was covered by sediment, indicating that only fill had occurred during the 2002/2003 wet season. • Depth to first link………………… 75 mm • Depth to first vertical link…………75 mm • Depth to straightened chain……… 75 mm (2002 bed level)

34
These measurements show that during the 2002/2003 wet season the bed was not scoured, however, there was fill to a maximum depth of 75 mm above the 2002 bed level. The bed level in 2003 was 75 mm higher than it was in 2002.
4.1.3 Tributary North cross section 5 (TN05) Tributary North cross section 5 (TN05) is located on the tributary gully channel and has one chain located in the middle of the gully. This chain was located on 17 September 2002. All links were vertical. • Depth to first link………………..20 mm • Depth to first vertical link……….20 mm • Depth to straightened chain……..20 mm (2001 bed level) These measurements show that during the 2001/2002 wet season the bed aggraded by 20 mm and that there was no scour. The bed level in 2002 was 20 mm higher than in 2001, indicating that only fill had occurred during the 2001/2002 wet season. The chain was found on 11 November 2003. It was orientated vertically and was covered by sediment, indicating that only fill had occurred during the 2002/2003 wet season. • Depth to first link………………… 36 mm • Depth to first vertical link…………36 mm • Depth to straightened chain……… 36 mm (2002 bed level) These measurements show that during the 2002/2003 wet season the bed was not scoured, however, there was fill to a maximum depth of 36 mm above the 2002 bed level. The bed level in 2003 was 36 mm higher than it was in 2002.
4.1.4 Tributary North cross section 7 (TN07) Cross section 7 is located across both the main channel and the tributary gully (fig 5). A single scour chain was installed in each gully. 4.1.4.1 Tributary North Cross Section 7, (TN07- main gully) This chain was located in the middle of the bed and was found on 17 September 2002. The top of the chain was visible on the bed and was orientated downstream. • Depth to first link………………….0 mm • Depth to first vertical link…………0 mm • Depth to straightened chain………-75 mm (2001 bed level) These measurements show that during the 2001/2002 wet season the bed was scoured to a depth of 75 mm below the 2001 bed level, and then there was no subsequent fill. The bed level in 2002 was 75 mm lower than the 2001 bed level.
The chain was found on 11 November 2003. It was orientated vertically and covered by sediment, indicating that only fill had occurred during the 2002/2003 wet season. • Depth to first link………………… 76 mm • Depth to first vertical link…………76 mm • Depth to straightened chain……… 76 mm (2002 bed level) These measurements show that during the 2002/2003 wet season the bed was not scoured, however, there was fill to a maximum depth of 76 mm above the 2002 bed level. The bed level in 2003 was 76 mm higher than it was in 2002.
4.1.4.2 Tributary North Cross Section 7, (TN07- tributary) This chain was located in the middle of the tributary gully and was found on 17 September 2002. The top link of the chain was orientated vertically indicating that there had been no scour. • Depth to first link…………………60 mm

35
• Depth to first vertical link………...60 mm • Depth to straightened chain………60 mm (2001 bed level) These measurements show that during the 2001/2002 wet season the bed was not scoured but that there had been 60 mm of fill, which aggraded the bed to 60 mm above the 2001 level. The chain was found on 11 November 2003. It was orientated slightly towards the left bank and downstream. • Depth to first link…………………130 mm • Depth to first vertical link………...110 mm • Depth to straightened chain………0 mm (2002 bed level) These measurements show that during the 2002/2003 wet season the bed was scoured to a maximum depth of 130 mm and then filled by 130 mm. The 2003 bed level was the same as the 2002 bed level.
4.1.5 Tributary North cross section 9 (TN09) This cross section is located on the main gully downstream of the confluence with the left bank tributary gully but upstream of the junction with Ngarradj (fig 5). 4.1.5.1 Scour Chain 1, (TN09-1) Scour Chain 1 is located towards the left bank and was found on 17 September 2002. The chain was orientated downstream. • Depth to first link…………………50 mm • Depth to first vertical link………...70 mm • Depth to straightened chain………48 mm (2001 bed level) These measurements show that during the 2001/2002 wet season the bed was scoured to a depth of 22 mm and then filled by 70 mm. The 2002 bed level was 48 mm higher than the 2001 bed level.
The chain was found on 11 November 2003. It was orientated vertically and covered by sediment, indicating that only fill had occurred during the 2002/2003 wet season. • Depth to first link………………… 26 mm • Depth to first vertical link…………26 mm • Depth to straightened chain……… 26 mm (2002 bed level) These measurements show that during the 2002/2003 wet season the bed was not scoured, however, there was fill to a maximum depth of 26 mm above the 2002 bed level. The bed level in 2003 was 26 mm higher than it was in 2002.
4.1.5.2 Scour Chain 2, (TN09-2) Scour Chain 2 is located towards the right bank of cross section 9 and was found on 17 September 2002. The chain was orientated towards the left bank and slightly downstream. • Depth to first link………………….22 mm • Depth to first vertical link…………32 mm • Depth to straightened chain……….0 mm (2001 bed level) These measurements show that during the 2001/2002 wet season the bed was scoured to a depth of 32 mm below the 2001 bed level, and then there was subsequent fill of 32 mm. The 2002 bed level was the same as the 2001 bed level.
At TN09 the average scour for the 2001/2002 wet season was 27 mm and the average fill was 51 mm. There was no scour for the 2002/2003 wet season and the average fill was 13 mm. These results suggest that there was not much activity at this section because the cross section was backwater affected at high flows.
36
4.2 Tributary Central A single chain was located on each of three cross sections, TC09, TC11 and TC03 before the 1988/1999 wet season (fig 7). The scour chain results are presented below
4.2.1 Tributary Central cross section 9 (TC09) There is one chain located in the middle of the channel which was found on 18 September 2002. The top link was visible on the bed surface and was orientated downstream. • Depth to first link……………….5 mm • Depth to first vertical link………20 mm • Depth to straightened chain……0mm (2001 bed level) These measurements show that during the 2001/2002 wet season the bed was scoured to a maximum depth of 20 mm below the 2001 bed level, and then there was fill of 20 mm. The bed level in 2002 was the same as in 2001.
The chain was found on 11 November 2003. The top one half of the first link was exposed and was orientated vertically. • Depth to first link………………..0 mm • Depth to first vertical link……….0 mm • Depth to straightened chain……-15 mm (2002 bed level) These measurements show that during the 2002/2003 wet season the bed was scoured to a maximum depth of 15 mm below the 2002 bed level, and then there was no fill. The bed level in 2003 was 15 mm below the 2002 bed level.
4.2.2 Tributary Central cross section 11 (TC11) There is one chain located in the middle of the channel which was found on 18 September 2002. There is a gravel armoured sand bar at this location. There were two links on the surface orientated downstream. • Depth to first link………………..0 mm • Depth to first vertical link……….0 mm • Depth to straightened chain…….-60 mm (2001 bed level) These measurements show that during the 2001/2002 wet season the bed was scoured to a maximum depth of 60 mm below the 2001 bed level, and then there was no fill. The bed level in 2002 was 60 mm below the 2001 bed level.
The chain was found on 11 November 2003. The chain was orientated vertically. The channel at this cross section is shifting laterally and the chain was no longer in the middle of the channel. • Depth to first link……………….0 mm • Depth to first vertical link………0 mm • Depth to straightened chain…….0 mm (2002 bed level) These measurements show that during the 2001/2002 wet season the bed remained stable with no scour or fill. The 2003 bed level was the same as the 2002 bed level.
4.2.3 Tributary Central cross section 3 (TC03) There is one chain located in the middle of the channel which was found on 18 September 2002. The links were lying in a pile orientated to the left bank. • Depth to first link……………….96 mm • Depth to first vertical link………130 mm • Depth to straightened chain…….40mm (2001 bed level)

37
These measurements show that during the 2001/2002 wet season the bed was scoured to a maximum depth of 90 mm below the 2001 bed level, and then there was subsequent fill of 130 mm. The 2002 bed level was 40 mm higher than the 2001 bed level.
The chain was found on 11 November 2003. The top two links were orientated downstream. • Depth to first link……………….110 mm • Depth to first vertical link………120 mm • Depth to straightened chain…….50mm (2002 bed level) These measurements show that during the 2002/2003 wet season the bed was scoured to a maximum depth of 120mm below the 2002 bed level, and then there was subsequent fill of 50 mm. The 2003 bed level was 70 mm lower than the 2002 bed level.
4.3 East Tributary scour chains Scour chains were installed at four cross sections at the East Tributary gauging station before the 1998/99 wet season. Two chains were located on cross section ET01 and one chain was located on ET04, ET07 and ET08 (fig 8).
4.3.1 East Tributary cross section 1 (ET01) 4.3.1.1 Chain 1 (ET01-1) Scour chain 1 is located towards the left bank and was found on 17 September 2002. The chain was orientated diagonally upstream and towards the right bank. • Depth to first link ………….…...125 mm • Depth to first vertical link………115 mm • Depth to straightened chain…….30 mm (2001 bed level) These measurements show that during the 2001/2002 wet season the bed was scoured to a maximum depth of 95 mm below the 2001 bed level, and then there was subsequent fill of 125 mm. The 2002 bed level was 30 mm higher than the 2001 bed level.
Scour chain 1 was found on 12 November 2003. The chain was orientated downstream and slightly towards the right bank. • Depth to first link ………….…...170 mm • Depth to first vertical link………150 mm • Depth to straightened chain…….25 mm (2002 bed level) These measurements show that during the 2002/2003 wet season the bed was scoured to a maximum depth of 145 mm below the 2002 bed level, and then there was subsequent fill of 170 mm. The 2003 bed level was 25 mm higher than the 2002 bed level.
4.3.1.2 Chain 2 (ET01-2) This chain was found on 17 September 2002. The chain was buried and was orientated downstream. • Depth to first link ………….…..135mm • Depth to first vertical link………170 mm • Depth to straightened chain……-30 mm (2001 bed level) The measurements show that during the 2001/2002 wet season the bed was scoured to a maximum depth of 200 mm and then there was subsequent fill of 170 mm. The bed level is 2002 was 30 mm lower than the 2001 bed level.
This chain was found on 12 November 2003 and was located towards the right bank. The chain was buried and was orientated downstream and slightly towards the left bank. • Depth to first link ………….……360mm • Depth to first vertical link……….365 mm • Depth to straightened chain……..240 mm (2002 bed level)

38
The measurements show that during the 2002/2003 wet season the bed was scoured to a maximum depth of 125 mm and then there was subsequent fill of 365 mm. The bed level in 2003 was 240 mm higher than the 2002 bed level.
For East Tributary Cross Section 1, the 2001/2002 wet season average scour was 148 mm and the average fill was 148 mm. For the 2002/2003 wet season, the average scour was 135 mm and the average fill was 268 mm.
4.3.2 East Tributary cross section 4 (ET04) There is one chain in the middle of the channel which was located on 17 September 2002. The chain was orientated in a downstream direction. • Depth to first link ………….…….120 mm
• Depth to first vertical link.……….135 mm • Depth to straightened chain……...95 mm (2001 bed level) The measurements show that during the 2001/2002 wet season the bed was scoured to a maximum depth of 40 mm and then there was subsequent fill of 135 mm. The bed level in 2002 was 95 mm higher than the 2001 bed level.
The chain was found on 12 November 2003. The chain was orientated in a downstream direction. • Depth to first link ………….…….70 mm
• Depth to first vertical link.……….85 mm • Depth to straightened chain……..-55 mm (2002 bed level) The measurements show that during the 2002/2003 wet season the bed was scoured to a maximum depth of 140 mm and then there was subsequent fill of 85 mm. The bed level in 2003 was 55 mm lower than the 2002 bed level. 4.3.3 East Tributary cross section 7 (ET07) There is one chain located in the middle of the channel which was located on 17 September 2002. It was orientated towards the right bank but angled downstream • Depth to first link ………….……200 mm • Depth to first vertical link……….215 mm • Depth to straightened chain……..23 mm (2001 bed level) These measurements show that during the 2001/2002 wet season the bed was scoured to a maximum depth of 192 mm below the 2001 bed level, and then there was subsequent fill of 215 mm. The 2002 bed level was 23 mm higher than the 2001 bed level.
The chain was located on 12 November 2003 and was orientated downstream • Depth to first link ………….……290 mm • Depth to first vertical link……….280 mm • Depth to straightened chain……..10 mm (2002 bed level) These measurements show that during the 2002/2003 wet season the bed was scoured to a maximum depth of 280 mm below the 2002 bed level, and then there was subsequent fill of 290 mm. The 2003 bed level was 10 mm higher than the 2002 bed level.
4.3.4 East Tributary cross section 8 (ET08) There is one chain located near the thalweg on the outside of the point bar towards the left bank. The chain was located on 17 September 2002 and was orientated downstream. • Depth to first link ………….……50 mm • Depth to first vertical link……….95 mm • Depth to straightened chain…….-12 mm (2001 bed level)

39
These measurements show that during the 2001/2002 wet season the bed was scoured to a maximum depth of 107 mm below the 2001 bed level, and then there was subsequent fill of 95 mm. The bed level in 2002 was 12 mm lower than the 2001 bed level.
The chain was located on 12 November 2003 and was orientated downstream. • Depth to first link ………….……175 mm • Depth to first vertical link……….175 mm • Depth to straightened chain……..120 mm (2002 bed level) These measurements show that during the 2002/2003 wet season the bed was scoured to a maximum depth of 55 mm below the 2002 bed level, and then there was subsequent fill of 175 mm. The bed level in 2003 was 120 mm higher than the 2002 bed level.
4.4 Upper Swift Creek scour chains Scour chains were installed at three cross sections at the Upper Swift Creek gauging station before the 1998/99 wet season. Two chains were located at cross sections UM02, UM05 and UM07. The location of the cross sections is shown in figure 9.
4.4.1 Upper Swift Creek cross section 2 (UM02) Chain 1 was located closer to the left bank and chain 2, closer to the right bank.
4.4.1.1 Chain 1 (UM02-1) This chain was located on 18 September 2002 and was orientated downstream. • Depth to first link……………….340 mm • Depth to first vertical link………350 mm • Depth to straightened chain…….15 mm (2001 bed level) These measurements show that during the 2001/2002 wet season the bed was scoured to a maximum depth of 335 mm and then there was subsequent fill of 350 mm. The 2002 bed level was 15 mm above the 2001 level.
The chain was located on 12 November 2003 and was orientated mainly downstream and slightly towards the left bank. • Depth to first link……………….360 mm • Depth to first vertical link………380 mm • Depth to straightened chain…….60 mm (2002 bed level) These measurements show that during the 2002/2002 wet season the bed was scoured to a maximum depth of 320 mm and then there was subsequent fill of 380 mm. The 2003 bed level was 60 mm above the 2002 level.
4.4.1.2 Chain 2 (UM02-2) This chain was located on 18 September 2002 and was lying in a circular pattern across the bed and orientated downstream. • Depth to first link……………….…340 mm • Depth to first vertical link…………360 mm • Depth to straightened chain…….…30 mm (2001 bed level) These measurements indicate that during the 2001/2002 wet season the bed was scoured to a depth 330 mm and then there was subsequent fill of 360 mm. The 2002 bed level was 30 mm above the 2001 level.
This chain was located on 12 November 2003 and was lying in a circular pattern towards the left bank but orientated downstream. • Depth to first link……………….…440 mm • Depth to first vertical link…………430 mm
40
• Depth to straightened chain…….…20 mm (2002 bed level) These measurements indicate that during the 2002/2003 wet season the bed was scoured to a maximum depth 420 mm and then there was subsequent fill of 440 mm. The 2003 bed level was 20 mm above the 2002 level.
For the 2001/2002 wet season at Upper Swift Creek cross section 2, the average scour was 333 mm and the average fill was 355 mm. For the 2002/2003 wet season the average scour was 370 mm and the average fill was 410 mm.
4.4.2 Upper Swift Creek cross section 5 (UM05) Chain 1 was located closer to the left bank and chain 2, closer to the right bank.
4.4.2.1 Chain 1 (UM05-1) This chain was located on 18 September 2002 and was orientated diagonally upstream towards the right bank. • Depth to first link……………….160 mm • Depth to first vertical link………220 mm • Depth to straightened chain……0 mm (2001 bed level) These measurements show that during the 2001/2002 wet season the bed was scoured to a maximum depth of 220 mm below the 2001 bed level and then there was subsequent fill of 220 mm. The 2002 bed level was the same as the 2001 bed level.
This chain was located on 12 November 2003 and was orientated diagonally downstream towards the right bank. • Depth to first link……………….135 mm • Depth to first vertical link………160 mm • Depth to straightened chain…… 15mm (2002 bed level) These measurements show that during the 2002/2003 wet season the bed was scoured to a maximum depth of 145 mm below the 2002 bed level and then there was subsequent fill of 160 mm. The 2003 bed level was 15 mm above the 2002 level.
4.4.2.2 Chain 2 (UM05-2) This chain was located on 18 September 2002 orientated at right angles to the bed towards the left bank. • Depth to first link……………….180 mm • Depth to first vertical link………200 mm • Depth to straightened chain…….0 mm (2001 bed level) These measurements show that during the 2001/2002 wet season the bed was scoured to a maximum depth of 200 mm below the 2001 bed level and then there was subsequent fill of 200 mm. The 2002 bed level was the same as the 2001 bed level.
This chain was located on 12 November 2003 and was orientated diagonally downstream towards the left bank. • Depth to first link……………….65 mm • Depth to first vertical link………140 mm • Depth to straightened chain…….0 mm (2002 bed level) These measurements show that during the 2002/2003 wet season the bed was scoured to a maximum depth of 140 mm below the 2002 bed level and then there was subsequent fill of 140 mm. The 2003 bed level was the same as the 2002 bed level.
For Upper Swift Creek cross section 5, the 2001/2002 wet season average scour was 210 mm and the average fill was 210 mm. For the 2002/2003 wet season, the average scour was 143 mm and the average fill was 150 mm.
41
4.4.3 Upper Swift Creek cross section 7 (UM07) Chain 1 was located closer to the left bank and chain 2, closer to the right bank.
4.4.3.1 Chain 1 (UM07-1) This chain was located on 18 September 2002 and was orientated towards the right bank and slightly upstream. • Depth to first link………………….170 mm • Depth to first vertical link…………190 mm • Depth to straightened chain……….5 mm (2001 bed level) These measurements show that during the 2001/2002 wet season the bed was scoured to a maximum depth of 185 mm below the 2001 bed level and then there was fill of 190 mm. The 2002 bed level was 5 mm above the 2001 bed level.
This chain was located on 12 November 2003 and was orientated towards the right bank. • Depth to first link………………….225 mm • Depth to first vertical link…………223 mm • Depth to straightened chain……….50 mm (2002 bed level) These measurements show that during the 2002/2003 wet season the bed was scoured to a maximum depth of 175 mm below the 2002 bed level and then there was fill of 225 mm. The 2003 bed level was 50 mm above the 2002 bed level. 4.4.3.2 Chain 2 (UM07-2) This chain was located on 18 September 2002, and was orientated diagonally upstream towards the left bank. • Depth to first link…………………..320 mm • Depth to first vertical link………….290 mm • Depth to straightened chain……….0 mm (2001 bed level) These measurements show that during the 2001/2002 wet season the bed was scoured to a maximum depth of 320 mm below the 2001 bed level and then there was subsequent fill of 320 mm. The 2002 bed level was the same as the 2001 bed.
This chain was located on 12 November 2003, and was found in a circular pattern towards the left bank but then orientated downstream. • Depth to first link…………………..330 mm • Depth to first vertical link………….340 mm • Depth to straightened chain……….20 mm (2002 bed level) These measurements show that during the 2002/2003 wet season the bed was scoured to a maximum depth of 320 mm below the 2002 bed level and then there was subsequent fill of 340 mm. The 2003 bed level was 40 mm above the 2002 bed level.
For Upper Swift Creek cross section 7, the 2001/2002 wet season average scour was 253 mm and the average fill was 255 mm. For the 2002/2003 wet season, the average scour was 248 mm and the average fill was 283 mm.
42
4.5 Swift Creek scour chains Scour chains were installed at two cross sections at the Swift Creek gauging station before the 1998/99 wet season. Three chains were located at cross sections SM05 and SM08. Additional chains were installed at cross section SM02 before the 1999/2000 wet season. The location of the cross sections is shown in figure 10.
4.5.1 Swift Creek cross section 5 (SM05) The three chains at cross section 5 were searched for on 18 September 2002. The water table was reached at a depth of 200 mm below the surface and one of the chains (SM05-1) could be felt by hand at a depth of approximately 500 mm. It was not possible to make any measurements at any of the scour chains. The chains were not reset and thus there were similar problems when the chains were searched for on 12 November 2003. Therefore, no scour and fill data were obtained at this section for the 2001/2002 and 2002/2003 wet seasons.
4.5.2 Swift Creek cross section 2 (SM02) 4.5.2.1 Chain 1 SM02-1 This chain was located on 18 September 2002 and was above the current ground surface. This was caused by pig damage and no measurements were possible. The chain was reset.
This chain was located on 11 November 2003 and was orientated downstream. • Depth to first link………………….58 mm • Depth to first vertical link…………65 mm • Depth to straightened chain………15 mm (2002 bed level)
These measurements show that during the 2002/2003 wet season the bed was scoured to a maximum depth of 50 mm below the 2002 level, and then there was subsequent fill of 65 mm. The 2003 bed level was 15 mm above the 2003 bed level.
4.5.2.2 Chain 2 (SM02-2) This chain was located on 18 September 2002. The upper 200 mm of bed had been greatly disturbed by pigs and hence no measurements were possible. The chain was reset.
This chain was located on 11 November 2003 and was orientated downstream. There were several spirals in the chain • Depth to first link…………………63 mm • Depth to first vertical link………..140 mm • Depth to straightened chain………4 mm (2002 bed level)
These measurements show that during the 2002/2003 wet season the bed was scoured to a maximum depth of 136 mm below the 2002 level, and then there was subsequent fill of 140 mm. The 2003 bed level was 4 mm higher than the 2002 bed level.
4.5.2.3 Chain 3 (SM02-3) This chain was located on 18 September 2002 and was orientated diagonally upstream towards the left bank. There was some pig damage to the bed but some measurements were possible. • Depth to first link……………….….Unknown • Depth to first vertical link………….95 mm • Depth to straightened chain………..40 mm (2001 bed level).
These measurements suggest that during the 2001/2002 wet season the bed may have been scoured to a depth of 55 mm below the 2001 level with subsequent fill of 95 mm. The 2002 bed

43
level was 40 mm higher than the 2001 bed level. Due to the pig damage there is uncertainty in these measurements and these values were not used in the net scour and fill calculations.
This chain was located on 11 November 2003 and was orientated towards the left bank. The chain was lying on the surface. • Depth to first link……………….….0 mm • Depth to first vertical link………….0 mm • Depth to straightened chain……-190 mm (2002 bed level).
These measurements show that during the 2002/2003 wet season the bed was scoured to a depth of 190 mm below the 2002 level, and then there was no subsequent fill. The 2003 bed level was 190 mm lower than the 2002 bed level.
For Swift Creek Cross Section 2, there was no average scour or fill calculations because the pig damage had been too extensive. For the 2002/2003 wet season, the average scour was 125 mm and the average fill was 68 mm.
4.5.3 Swift Creek cross section 8 (SM08) 4.5.3.1 Chain 1 (SM08-1) This chain was located on 18 September 2002 and was orientated upstream and towards the right bank. • Depth to first link…………………...250 mm • Depth to first vertical link…………..260 mm • Depth to straightened chain………...85 mm (2001 bed level)
These measurements show that during the 2001/2002 wet season the bed was scoured to a maximum depth of 175 mm below the 2001 bed level, and then there was subsequent fill of 260 mm. The 2002 bed level was 85 mm higher than the 2001 bed level.
This chain was located on 11 November 2003 and was orientated towards the right bank. • Depth to first link…………………...415 mm • Depth to first vertical link…………..385 mm • Depth to straightened chain………...0 mm (2002 bed level)
These measurements show that during the 2002/2003 wet season the bed was scoured to a maximum depth of 415 mm below the 2002 bed level, and then there was subsequent fill of 415 mm. The 2003 bed level was the same as the 2002 bed level.
4.5.3.2 Chain 2 (SM08-2) This chain was located on 18 September 2002 and was orientated diagonally downstream and towards the right bank. • Depth to first link………………….115 mm • Depth to first vertical link…………195 mm • Depth to straightened chain……….0 mm (2001 bed level)
These measurements show that during the 2001/2002 wet season the bed was scoured to a maximum depth of 195 mm and then there was fill of 195 mm. The 2002 bed level was the same as the 2001 bed level.
This chain was located on 11 November 2003 and was orientated towards the left bank. • Depth to first link………………….295 mm • Depth to first vertical link…………325 mm • Depth to straightened chain……….0 mm (bed level not changed)
44
These measurements show that during the 2002/2003 wet season the bed was scoured to a maximum depth of 325 mm below the 2002 bed level, and then there was subsequent fill of 325 mm. The 2003 bed level was the same as the 2002 bed level.
4.5.3.3 Chain 3 (SM08-3) This chain was located on 18 September 2002 and was orientated towards the left bank. • Depth to first link…………………..75 mm • Depth to first vertical link………….142 mm • Depth to straightened chain………..35 mm (2001 bed level)
These measurements show that during the 2001/2002 wet season the bed was scoured to a maximum depth of 107 mm and then there was subsequent fill of 142 mm. The 2002 bed level was 35 mm higher than the 2001 bed level.
This chain was located on 11 November 2003 and was orientated towards the left bank and slightly upstream. • Depth to first link…………………..247 mm • Depth to first vertical link………….230 mm • Depth to straightened chain………..-25 mm (2002 bed level)
These measurements show that during the 2002/2003 wet season the bed was scoured to a maximum depth of 272 mm and then there was subsequent fill of 247 mm. The 2003 bed level was 25 mm lower than the 2002 bed level.
For Swift Creek Cross Section 8, the 2001/2002 average scour was 159 mm and the average fill was 199 mm. For the 2002/2003 wet season there was 337 mm of scour and 329 mm of fill.
5 Conclusions and recommendations The channel cross sectional data collected by eriss on Tributary North, Tributary Central, East Tributary and Swift Creek have been presented in this report as survey data (appendix 1). There are now 56 permanently monumented cross sections installed in the Ngarradj catchment following the Vigil Network method of the US Geological Survey developed for the International Hydrological Decade. These cross sections have been surveyed each dry season between 1998 and 2003 to determine the impact, if any, of the Jabiluka mine on channel changes and sediment storage in the Ngarradj catchment. Scour chains have been installed at some of the cross section and provide information about the scour and fill that occurs during each wet season.
The program includes two monitoring reaches (East Tributary and upper Swift Creek) on channels not impacted by the mine, two tributaries draining the mine site (Tributaries North and Central) and Swift Creek downstream of the two mine site tributaries and the two sites not impacted by the mine.
Continued monitoring of the cross sections and scour chains is recommended while the mine is in a care and maintenance phase. This will provide an excellent baseline data set against which the impacts of the mine can be evaluated should the Jabiluka mine proceed in the future.
45
6 References Arcement GJ & Schneider, VR 1984 Guide for selecting Manning’s roughness coefficients
for natural channels and flood plains. US Geological Survey Water – Supply paper 2339, Washington DC.
Barnes HR Jr, 1967. Roughness characteristics of natural channels US Geological Survey Water Supply Paper 1849, Washington DC.
Cowan WL 1956. Estimating hydraulic roughness coefficients Agricultural Engineering 37, 473–475.
Darby SE & Simon A (Ed) 1999. Incised river channels: Processes, forms, engineering and management. Wiley, Chichester.
Emmett WW 1965. The Vigil network: Methods of measurement and a sampling of data collected. International Association of Hydrological Sciences Publ. No. 66, 89–106.
Emmett WW & Hadley RF 1968. The Vigil network: Preservation and access of data. US Geological Survey Circular 460-C, Washington DC.
Erskine WD, Saynor MJ, Evans KG & Boggs GS 2001. Geomorphic research to determine the off-site impacts of the Jabiluka Mine on Swift (Ngarradj) Creek, Northern Territory. Supervising Scientist Report 158, Supervising Scientist, Darwin.
Fowler KK & Wilson JT 1995. Characteristics, and yield of sediment in Juday Creek, St. Joseph County, Indiana, 1993-94. Water Resources Investigations Report: 95-4135, Denver.
Leopold LB 1962. The Vigil network. Hydrological Sciences Bulletin 7, 5–9.
Leopold LB & Emmett WW 1965. Vigil network sites: A sample of data for permanent filing. Hydrological Sciences Bulletin 10, 12–21.
Leopold LB, Emmett WW & Myrick RM 1966. Channel and hillslope processes in a semiarid area New Mexico. US Geological Survey Profession Paper 352-G, Washington DC.
Locher H 1997. Sediment transport in the King River, Tasmania. Mount Lyell Remediation Research and Demonstration Program. Supervising Scientist Report 120, Supervising Scientist, Canberra.
Moliere DR, Boggs GS, Evans KG, Saynor MJ & Erskine WD 2002. Baseline hydrology characteristics of the Ngarradj catchment, Northern Territory. Supervising Scientist Report 172, Supervising Scientist, Darwin NT.
Roberts RG 1991. Sediment budgets and quaternary history of the Magela Creek catchment, Tropical Northern Australia. Open file record 80, Supervising Scientist for the Alligator Rivers Region, Canberra. Unpublished paper.
Saynor MJ 2000. Hydrology, sediment transport and sediment sources in the swift creek catchment Northern Territory: A PhD proposal. Internal Report 339, Supervising Scientist, Darwin. Unpublished paper.
Saynor MJ, Evans KG, Smith BL, Crisp E & Fox G 2001. Field monitoring information for the Swift (Ngarradj) Creek catchment, Northern Territory. Internal Report 355, Supervising Scientist, Darwin. Unpublished paper.

46
Saynor MJ, Erskine WD, Smith BL, Fox GJ & Evans KG 2002a. Cross sectional data and a preliminary assessment of channel changes in the Swift Creek (Ngarradj) catchment between 1998 and 2001. Internal Report 385, Supervising Scientist, Darwin. Unpublished paper.
Saynor MJ, Erskine WD, Smith BL, Fox GJ & Evans KG 2002b. Scour and fill in the Swift Creek (Ngarradj) catchment: Results of scour chains for the 1998/1999, 1999/2000 and 2000/2001 Wet seasons. Internal Report 388, Supervising Scientist, Darwin. Unpublished paper.
Saynor MJ, Erskine WD & Evans KG (2004) Cross sectional and scour and fill changes in the Ngarradj catchment between 1998 and 2003. Supervising Scientist, Supervising Scientist, Darwin NT (in Prep).
Williams GP 1978. Bank-full discharge of rivers. Water Resources Research 14, 1141–1154.
Wolman MG 1955. The natural channel of Brandywine Creek, Pennsylvania. US Geological Survey Profession Paper 271, Washington DC.

47
Appendix 1 This appendix contains the survey data for each cross section for the 2002 and 2003 dry seasons. The sections are listed in increasing numerical order which does not always correspond to their location in downstream sequence. Refer to the relevant diagrams in Section 3 to determine where they are located.
The datum used for each section is an assumed datum with a horizontal angle of either 0°, 90°, 180°, 270° so that there is a distance (chainage) and a height for each survey point. All measurements are in metres and each cross section is independent of each other cross section. The assumed datum is often different between cross sections.
The location of the data files on the eriss network is in the following directories:
\\Landscape Characterisation and Monitoring\Jabiluka\(Dry) Channel stability in the Ngarradj catchment\Data\Survey xsections\location
where location refers to one of the five sites at which the cross sections are located, namely Tributary North, Tributary Central, East Tributary, Upper Swift Creek and Swift Creek.

48
Tributary North Cross sections 1 to 4 2002
TN01 20-Jun-02 TN02 20-Jun-02 TN03 20-Jun-02 TN04 18-Jun-02
Distance Assumed Distance Assumed Distance Assumed Distance Assumed
(m) Height (m) (m) Height (m) (m) Height (m) (m) Height (m)
4968.956 11.005 3974.715 9.868 2977.928 10.012 1973.514 10.264
4969.088 10.790 3974.828 9.693 2978.054 9.818 1973.622 10.054
4970.888 10.753 3976.586 9.638 2979.197 9.791 1975.110 10.023
4973.521 10.717 3978.400 9.628 2981.190 9.727 1976.444 10.026
4975.100 10.676 3980.336 9.582 2983.230 9.673 1978.673 10.006
4976.566 10.623 3981.246 9.486 2984.146 9.658 1980.517 9.979
4978.256 10.574 3981.588 9.374 2984.855 9.534 1982.097 9.967
4979.859 10.523 3981.891 9.323 2985.065 9.396 1984.015 9.901
4981.115 10.469 3981.968 9.233 2985.412 9.236 1984.996 9.825
4981.419 10.414 3982.482 8.986 2985.717 9.111 1985.548 9.592
4981.721 10.278 3983.240 8.839 2986.040 9.009 1985.770 9.503
4982.018 10.104 3983.447 8.630 2986.309 8.929 1986.034 9.295
4982.173 9.966 3983.571 8.498 2986.582 8.849 1986.572 9.045
4982.447 9.916 3983.766 8.338 2986.760 8.683 1986.738 8.876
4982.623 9.703 3984.063 8.338 2986.871 8.568 1986.942 8.752
4982.909 9.665 3984.429 8.439 2987.039 8.454 1987.265 8.595
4983.091 9.564 3984.764 8.508 2987.189 8.365 1987.387 8.489
4983.240 9.472 3984.921 8.809 2987.560 8.369 1987.564 8.504
4983.470 9.472 3985.271 8.933 2988.001 8.480 1987.784 8.616
4983.728 9.589 3985.527 9.052 2988.266 8.826 1988.225 8.819
4984.009 9.624 3985.861 9.120 2988.707 8.964 1988.408 9.072
4984.302 9.730 3986.003 9.185 2988.868 9.136 1988.767 9.203
4984.767 9.778 3986.927 9.264 2989.064 9.260 1989.495 9.331
4985.022 9.981 3987.535 9.352 2989.437 9.386 1990.586 9.369
4985.498 10.206 3988.006 9.473 2990.065 9.686 1991.680 9.411
4985.811 10.194 3989.743 9.572 2990.724 9.721 1992.351 9.498
4985.884 10.435 3991.768 9.631 2992.048 9.705 1993.126 9.437
4987.070 10.505 3993.844 9.688 2993.716 9.717 1994.073 9.442
4988.152 10.538 3995.519 9.760 2995.647 9.744 1995.658 9.445
4990.076 10.587 3997.674 9.800 2997.030 9.776 1996.896 9.499
4992.005 10.664 2998.375 9.815 1997.861 9.617
4993.946 10.696 2001.685 9.827
4997.943 10.795 2002.874 9.832
5002.742 10.827 2004.377 9.814
5006.666 10.761 2005.851 9.823
5009.300 10.728 2006.927 9.778
5011.951 10.677 2007.438 9.681
5013.284 10.673 2007.983 9.508
5013.704 10.635 2008.242 9.393
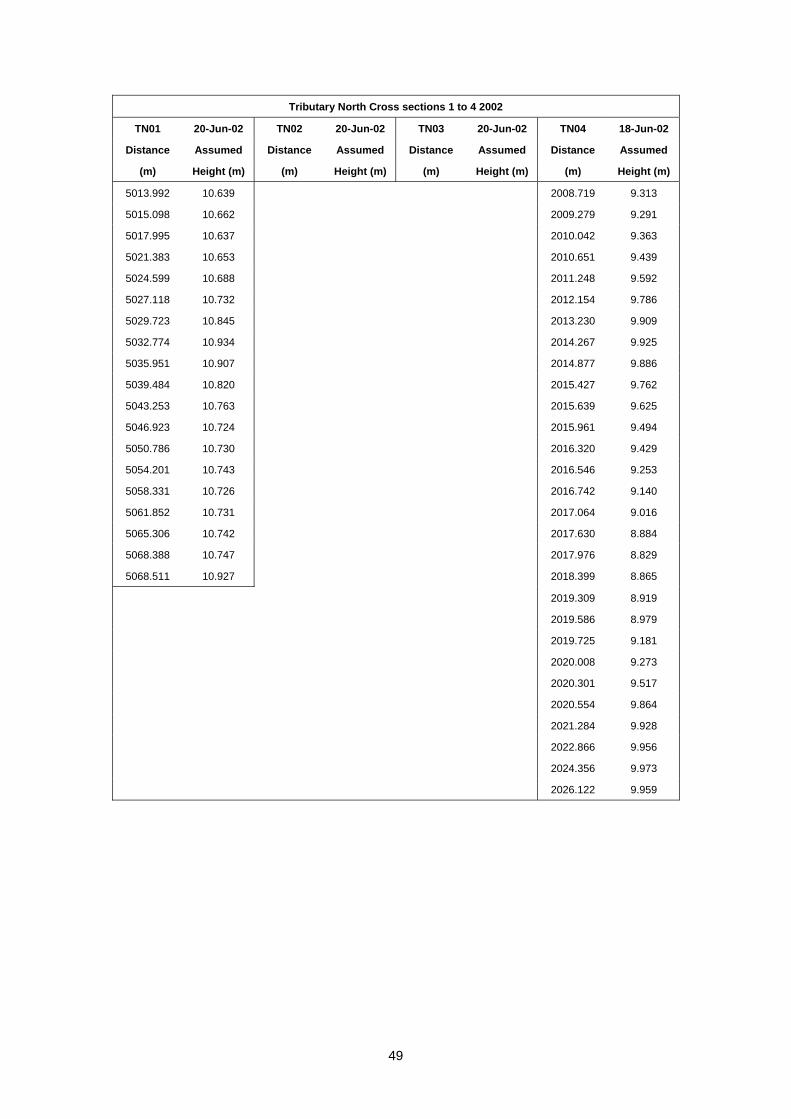
49
Tributary North Cross sections 1 to 4 2002
TN01 20-Jun-02 TN02 20-Jun-02 TN03 20-Jun-02 TN04 18-Jun-02
Distance Assumed Distance Assumed Distance Assumed Distance Assumed
(m) Height (m) (m) Height (m) (m) Height (m) (m) Height (m)
5013.992 10.639 2008.719 9.313
5015.098 10.662 2009.279 9.291
5017.995 10.637 2010.042 9.363
5021.383 10.653 2010.651 9.439
5024.599 10.688 2011.248 9.592
5027.118 10.732 2012.154 9.786
5029.723 10.845 2013.230 9.909
5032.774 10.934 2014.267 9.925
5035.951 10.907 2014.877 9.886
5039.484 10.820 2015.427 9.762
5043.253 10.763 2015.639 9.625
5046.923 10.724 2015.961 9.494
5050.786 10.730 2016.320 9.429
5054.201 10.743 2016.546 9.253
5058.331 10.726 2016.742 9.140
5061.852 10.731 2017.064 9.016
5065.306 10.742 2017.630 8.884
5068.388 10.747 2017.976 8.829
5068.511 10.927 2018.399 8.865
2019.309 8.919
2019.586 8.979
2019.725 9.181
2020.008 9.273
2020.301 9.517
2020.554 9.864
2021.284 9.928
2022.866 9.956
2024.356 9.973
2026.122 9.959

50
Tributary North Cross sections 5 to 8 2002
TN05 18-Jun-02 TN06 18-Jun-02 TN07 18-Jun-02 TN08 18-Jun-02
Distance Assumed Distance Assumed Distance Assumed Distance Assumed
(m) Height (m) (m) Height (m) (m) Height (m) (m) Height (m)
3523.957 9.881 2021.024 9.066 1976.162 8.886 4963.987 7.784
3523.853 9.711 1972.659 8.628 1976.274 8.720 4964.146 7.582
3523.851 9.717 1974.495 8.592 1978.146 8.672 4965.271 7.534
3523.847 9.716 1976.576 8.565 1979.867 8.652 4966.973 7.511
3521.972 9.719 1978.536 8.552 1981.122 8.620 4968.476 7.478
3519.993 9.716 1979.655 8.433 1981.830 8.615 4969.638 7.438
3518.394 9.719 1980.233 8.247 1982.560 8.561 4970.247 7.410
3516.539 9.708 1980.752 8.091 1982.836 8.419 4970.334 7.367
3515.090 9.713 1981.285 7.904 1983.237 8.305 4970.880 7.343
3514.479 9.683 1981.590 7.746 1983.647 8.129 4971.207 7.181
3513.989 9.532 1982.213 7.653 1984.235 7.954 4971.483 7.138
3513.894 9.454 1982.737 7.581 1984.871 7.853 4971.797 7.061
3513.494 9.319 1983.076 7.535 1985.140 7.773 4972.536 6.987
3513.166 9.236 1983.228 7.310 1985.412 7.695 4973.061 6.927
3512.880 9.127 1983.405 7.346 1985.788 7.588 4973.680 6.873
3512.565 9.050 1983.981 7.618 1986.016 7.499 4974.316 6.831
3512.413 8.905 1984.484 7.905 1986.476 7.569 4975.005 6.886
3511.855 8.830 1984.898 8.069 1986.665 7.682 4975.653 6.849
3511.464 8.737 1985.411 8.163 1986.944 7.957 4976.100 6.695
3511.171 8.704 1985.779 8.235 1987.336 8.168 4976.657 6.690
3510.586 8.764 1986.345 8.256 1987.748 8.236 4976.974 6.641
3510.069 8.819 1987.073 8.205 1988.144 8.320 4977.365 6.528
3509.705 8.935 1987.725 8.180 1988.611 8.426 4977.463 6.534
3509.382 9.167 1988.282 8.206 1989.497 8.501 4977.706 6.380
3508.992 9.334 1988.578 8.289 1990.393 8.585 4978.236 6.345
3508.647 9.441 1988.816 8.436 1991.733 8.700 4978.594 6.311
3508.273 9.614 1988.985 8.472 1993.310 8.687 4978.796 6.325
3507.822 9.701 1989.914 8.535 1994.407 8.704 4979.104 6.539
3506.827 9.722 1991.744 8.548 1996.024 8.721 4979.454 6.797
3505.173 9.744 1993.336 8.593 1998.513 8.779 4979.737 6.968
3503.377 9.759 1995.800 8.663 2001.645 8.840 4980.013 7.120
3501.556 9.787 1997.359 8.727 2003.386 8.889 4980.520 7.337
1999.012 8.778 2004.858 8.893 4981.201 7.703
2001.354 8.829 2007.137 8.946 4982.236 7.706
2003.454 8.853 2009.574 8.992 4983.908 7.776
2005.038 8.851 2012.062 8.991 4985.313 7.805
2005.555 8.785 2013.819 9.010 4986.292 7.806
2005.828 8.556 2015.771 9.028 4986.934 7.677
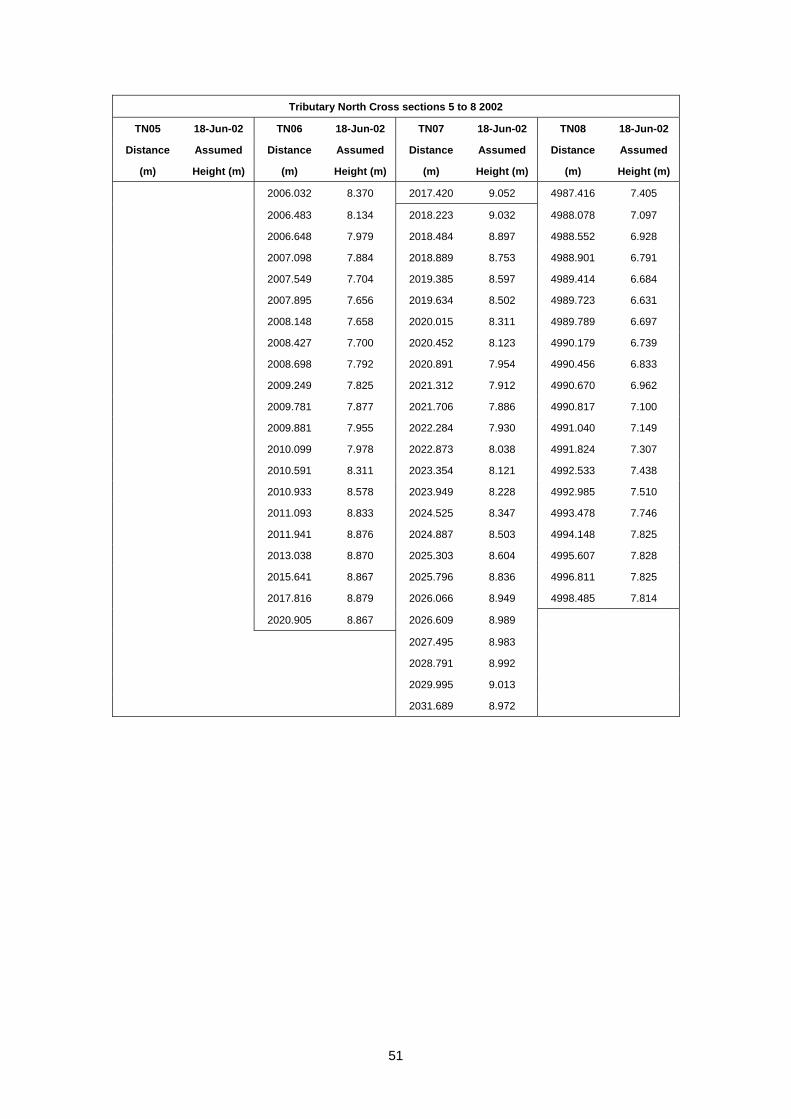
51
Tributary North Cross sections 5 to 8 2002
TN05 18-Jun-02 TN06 18-Jun-02 TN07 18-Jun-02 TN08 18-Jun-02
Distance Assumed Distance Assumed Distance Assumed Distance Assumed
(m) Height (m) (m) Height (m) (m) Height (m) (m) Height (m)
2006.032 8.370 2017.420 9.052 4987.416 7.405
2006.483 8.134 2018.223 9.032 4988.078 7.097
2006.648 7.979 2018.484 8.897 4988.552 6.928
2007.098 7.884 2018.889 8.753 4988.901 6.791
2007.549 7.704 2019.385 8.597 4989.414 6.684
2007.895 7.656 2019.634 8.502 4989.723 6.631
2008.148 7.658 2020.015 8.311 4989.789 6.697
2008.427 7.700 2020.452 8.123 4990.179 6.739
2008.698 7.792 2020.891 7.954 4990.456 6.833
2009.249 7.825 2021.312 7.912 4990.670 6.962
2009.781 7.877 2021.706 7.886 4990.817 7.100
2009.881 7.955 2022.284 7.930 4991.040 7.149
2010.099 7.978 2022.873 8.038 4991.824 7.307
2010.591 8.311 2023.354 8.121 4992.533 7.438
2010.933 8.578 2023.949 8.228 4992.985 7.510
2011.093 8.833 2024.525 8.347 4993.478 7.746
2011.941 8.876 2024.887 8.503 4994.148 7.825
2013.038 8.870 2025.303 8.604 4995.607 7.828
2015.641 8.867 2025.796 8.836 4996.811 7.825
2017.816 8.879 2026.066 8.949 4998.485 7.814
2020.905 8.867 2026.609 8.989
2027.495 8.983
2028.791 8.992
2029.995 9.013
2031.689 8.972

52
Tributary North Cross sections 9 to 12 2002
TN09 18-Jun-02 TN10 20-Jun-02 TN11 20-Jun-02 TN12 18-Jun-02
Distance Assumed Distance Assumed Distance Assumed Distance Assumed
(m) Height (m) (m) Height (m) (m) Height (m) (m) Height (m)
3969.693 8.164 5090.488 12.274 7077.004 13.160 7927.322 13.160
3969.817 7.964 5090.367 12.055 7076.889 12.981 7927.467 12.979
3971.990 7.969 5087.495 12.032 7074.373 12.859 7930.371 12.951
3974.332 7.946 5085.173 11.960 7072.170 12.735 7933.253 12.945
3976.247 7.915 5083.406 11.884 7070.057 12.577 7936.511 13.021
3977.327 7.907 5082.039 11.826 7069.356 12.502 7938.948 12.979
3978.434 7.838 5080.878 11.783 7068.642 12.404 7940.095 12.891
3978.917 7.746 5080.230 11.683 7068.245 12.426 7941.741 12.862
3979.245 7.647 5080.051 11.440 7068.015 12.273 7942.719 12.731
3979.567 7.479 5079.725 11.368 7067.556 12.311 7943.178 12.653
3979.988 7.330 5079.259 11.323 7067.261 12.207 7943.969 12.634
3980.337 7.194 5078.684 11.372 7066.713 12.167 7944.174 12.578
3980.679 6.941 5078.108 11.519 7066.118 12.209 7944.349 12.435
3981.045 6.776 5077.892 11.691 7065.702 12.261 7944.509 12.401
3981.317 6.726 5076.769 11.739 7064.610 12.449 7944.807 12.441
3981.833 6.763 5074.045 11.828 7063.709 12.540 7945.126 12.345
3982.513 6.738 5070.723 11.827 7061.608 12.590 7945.417 12.331
3982.985 6.669 5068.215 11.814 7059.417 12.621 7945.471 12.480
3983.490 6.591 5065.272 11.800 7057.231 12.661 7945.948 12.743
3983.750 6.568 5061.879 11.773 7055.303 12.640 7946.637 12.914
3984.062 6.476 5058.590 11.742 7051.953 12.591 7948.120 12.957
3984.549 6.482 5055.082 11.873 7049.013 12.554 7950.026 12.902
3985.036 6.551 5051.803 11.891 7046.184 12.569 7953.194 12.850
3985.658 6.568 5048.525 11.810 7042.842 12.586 7955.610 12.835
3986.075 6.619 5045.336 11.809 7040.268 12.563 7958.786 12.807
3986.397 6.711 5042.688 11.785 7038.009 12.633 7961.928 12.775
3986.619 6.787 5039.265 11.683 7036.920 12.567 7965.403 12.705
3987.259 6.797 5036.153 11.627 7036.499 12.579 7968.270 12.685
3987.501 6.934 5034.518 11.576 7036.202 12.606 7971.793 12.628
3987.982 7.168 5032.742 11.549 7035.854 12.573 7973.879 12.625
3988.669 7.352 5029.970 11.547 7035.586 12.409 7976.812 12.643
3989.028 7.433 5027.017 11.570 7035.412 12.336 7979.664 12.585
3989.479 7.581 5023.845 11.559 7034.991 12.321 7981.277 12.497
3990.443 7.604 5021.354 11.551 7034.449 12.385 7983.132 12.491
3991.560 7.633 5018.059 11.559 7034.167 12.462 7983.731 12.442
3992.676 7.669 5014.556 11.576 7033.878 12.669 7984.225 12.349
3994.334 7.687 5011.575 11.597 7032.824 12.673 7984.714 12.280
3995.857 7.729 5008.113 11.640 7029.543 12.594 7985.264 12.266
3997.282 7.755 5005.321 11.717 7026.646 12.616 7985.875 12.239

53
Tributary North Cross sections 9 to 12 2002
TN09 18-Jun-02 TN10 20-Jun-02 TN11 20-Jun-02 TN12 18-Jun-02
Distance Assumed Distance Assumed Distance Assumed Distance Assumed
(m) Height (m) (m) Height (m) (m) Height (m) (m) Height (m)
3999.051 7.791 5002.912 11.758 7023.864 12.637 7986.188 12.244
7021.070 12.670 7986.383 12.229
7018.353 12.660 7986.639 12.276
7014.979 12.677 7986.801 12.373
7011.846 12.692 7987.095 12.423
7008.533 12.726 7988.105 12.457
7005.485 12.759 7990.148 12.536
7002.279 12.791 7992.178 12.607
7994.826 12.738
7997.760 12.788
Tributary North Cross section 13 2002
TN13 18-Jun-02 TN13 Cont. 18-Jun-02
Distance Assumed Distance Assumed
(m) Height (m) (m) Height (m)
8960.518 14.267 8989.389 13.547
8960.653 14.074 8989.537 13.544
8962.911 14.039 8989.779 13.436
8964.897 14.025 8990.006 13.392
8966.724 13.947 8990.295 13.447
8969.328 13.884 8990.459 13.586
8971.755 13.854 8991.538 13.642
8974.220 13.796 8993.023 13.711
8976.838 13.719 8994.485 13.685
8979.513 13.686 8996.223 13.749
8981.442 13.618 8997.252 13.822
8981.762 13.558
8982.204 13.542
8982.895 13.526
8983.898 13.502
8985.007 13.511
8986.255 13.490
8988.076 13.527
8988.970 13.574
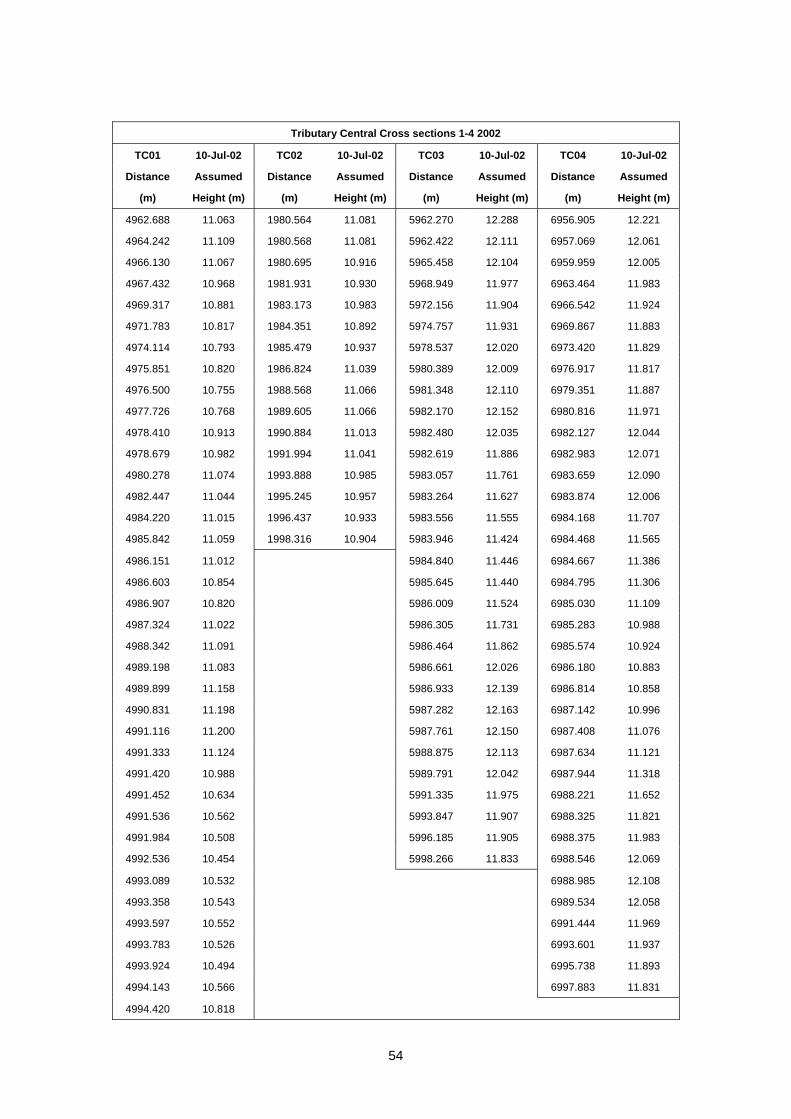
54
Tributary Central Cross sections 1-4 2002
TC01 10-Jul-02 TC02 10-Jul-02 TC03 10-Jul-02 TC04 10-Jul-02
Distance Assumed Distance Assumed Distance Assumed Distance Assumed
(m) Height (m) (m) Height (m) (m) Height (m) (m) Height (m)
4962.688 11.063 1980.564 11.081 5962.270 12.288 6956.905 12.221
4964.242 11.109 1980.568 11.081 5962.422 12.111 6957.069 12.061
4966.130 11.067 1980.695 10.916 5965.458 12.104 6959.959 12.005
4967.432 10.968 1981.931 10.930 5968.949 11.977 6963.464 11.983
4969.317 10.881 1983.173 10.983 5972.156 11.904 6966.542 11.924
4971.783 10.817 1984.351 10.892 5974.757 11.931 6969.867 11.883
4974.114 10.793 1985.479 10.937 5978.537 12.020 6973.420 11.829
4975.851 10.820 1986.824 11.039 5980.389 12.009 6976.917 11.817
4976.500 10.755 1988.568 11.066 5981.348 12.110 6979.351 11.887
4977.726 10.768 1989.605 11.066 5982.170 12.152 6980.816 11.971
4978.410 10.913 1990.884 11.013 5982.480 12.035 6982.127 12.044
4978.679 10.982 1991.994 11.041 5982.619 11.886 6982.983 12.071
4980.278 11.074 1993.888 10.985 5983.057 11.761 6983.659 12.090
4982.447 11.044 1995.245 10.957 5983.264 11.627 6983.874 12.006
4984.220 11.015 1996.437 10.933 5983.556 11.555 6984.168 11.707
4985.842 11.059 1998.316 10.904 5983.946 11.424 6984.468 11.565
4986.151 11.012 5984.840 11.446 6984.667 11.386
4986.603 10.854 5985.645 11.440 6984.795 11.306
4986.907 10.820 5986.009 11.524 6985.030 11.109
4987.324 11.022 5986.305 11.731 6985.283 10.988
4988.342 11.091 5986.464 11.862 6985.574 10.924
4989.198 11.083 5986.661 12.026 6986.180 10.883
4989.899 11.158 5986.933 12.139 6986.814 10.858
4990.831 11.198 5987.282 12.163 6987.142 10.996
4991.116 11.200 5987.761 12.150 6987.408 11.076
4991.333 11.124 5988.875 12.113 6987.634 11.121
4991.420 10.988 5989.791 12.042 6987.944 11.318
4991.452 10.634 5991.335 11.975 6988.221 11.652
4991.536 10.562 5993.847 11.907 6988.325 11.821
4991.984 10.508 5996.185 11.905 6988.375 11.983
4992.536 10.454 5998.266 11.833 6988.546 12.069
4993.089 10.532 6988.985 12.108
4993.358 10.543 6989.534 12.058
4993.597 10.552 6991.444 11.969
4993.783 10.526 6993.601 11.937
4993.924 10.494 6995.738 11.893
4994.143 10.566 6997.883 11.831
4994.420 10.818
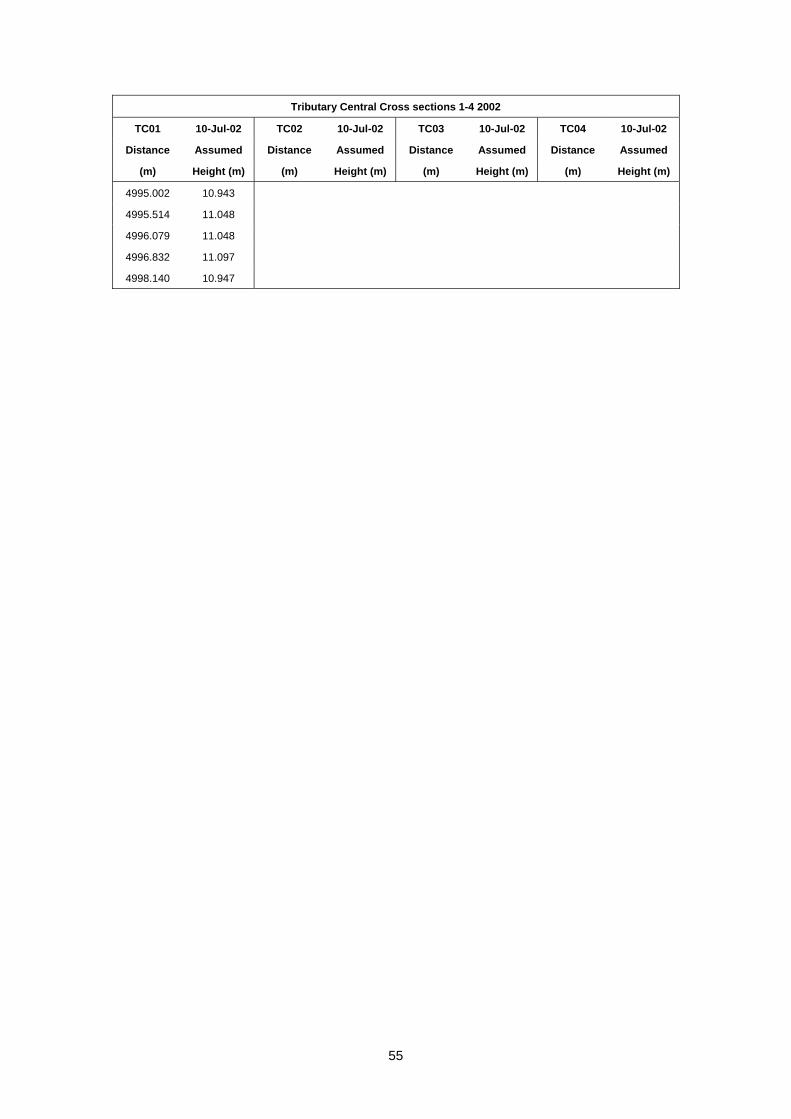
55
Tributary Central Cross sections 1-4 2002
TC01 10-Jul-02 TC02 10-Jul-02 TC03 10-Jul-02 TC04 10-Jul-02
Distance Assumed Distance Assumed Distance Assumed Distance Assumed
(m) Height (m) (m) Height (m) (m) Height (m) (m) Height (m)
4995.002 10.943
4995.514 11.048
4996.079 11.048
4996.832 11.097
4998.140 10.947

56
Tributary Central Cross sections 5-6C 2002
TC05 27-Jun-02 TC06A 27-Jun-02 TC06B 27-Jun-02 TC06C 27-Jun-02
Distance Assumed Distance Assumed Distance Assumed Distance Assumed
(m) Height (m) (m) Height (m) (m) Height (m) (m) Height (m)
7942.512 12.589 9031.201 14.265 0.139 13.995 0.150 13.427
7942.629 12.380 9028.668 14.260 2.258 13.977 1.340 13.461
7945.007 12.358 9024.951 14.271 3.675 14.015 2.966 13.524
7948.399 12.278 9021.438 14.242 5.305 14.032 4.589 13.593
7951.378 12.230 9019.517 14.232 6.852 14.052 6.205 13.663
7953.470 12.198 9018.073 14.227 8.153 14.069 7.867 13.751
7956.299 12.148 9017.414 14.185 9.305 14.071 9.445 13.820
7958.116 12.102 9017.130 14.129 9.892 14.063 10.791 13.856
7960.944 12.029 9017.041 14.055 10.274 14.058 11.461 13.919
7962.275 11.973 9017.068 13.460 10.488 13.986 11.737 13.917
7963.358 11.920 9016.844 13.344 10.725 12.855 12.048 13.864
7964.280 11.902 9016.501 13.223 10.855 12.785 12.226 13.674
7965.232 11.937 9016.392 12.803 11.340 12.570 12.440 13.481
7966.044 11.983 9016.238 12.707 11.518 12.559 12.774 13.320
7967.240 12.045 9016.150 12.720 11.992 12.730 12.899 13.170
7967.958 12.061 9015.856 12.823 12.590 12.936 13.341 12.930
7968.325 12.018 9015.750 12.839 13.180 12.967 13.576 12.616
7968.372 11.622 9015.241 12.725 13.773 13.046 14.046 12.353
7968.679 11.474 9014.939 12.714 14.233 13.107 14.268 12.359
7968.913 11.455 9014.746 12.724 14.809 13.131 14.995 12.482
7969.119 11.267 9014.000 12.869 15.307 13.263 15.955 12.520
7969.292 11.041 9012.875 12.970 16.335 13.387 16.487 12.657
7969.628 10.851 9012.288 13.020 17.339 13.479 16.716 12.623
7970.258 10.891 9011.782 13.111 17.971 13.576 17.024 12.673
7971.175 10.942 9011.374 13.207 18.827 13.560 17.194 12.652
7972.045 10.942 9010.601 13.247 19.623 13.550 17.620 12.751
7972.258 10.935 9010.156 13.257 19.888 13.467 18.058 12.856
7972.568 11.168 9009.661 13.478 20.158 13.437 18.400 12.832
7972.960 11.247 9009.199 13.529 20.598 13.487 18.998 13.016
7973.108 11.461 9008.699 13.513 21.569 13.569 19.335 12.948
7973.544 11.907 9007.735 13.544 22.233 13.605 19.947 13.033
7974.196 12.095 9007.443 13.584 23.232 13.564 20.410 13.105
7975.208 12.125 9006.932 13.598 24.179 13.568 20.696 13.159
7977.354 12.057 9006.320 13.635 24.848 13.567 21.064 13.341
7979.223 12.003 9005.577 13.529 25.656 13.596 21.943 13.372
7981.067 11.978 9005.257 13.524 26.788 13.687 22.881 13.327
7981.901 11.905 9004.784 13.579 28.396 13.733 23.367 13.291
7982.503 11.830 9003.545 13.676 23.899 13.391
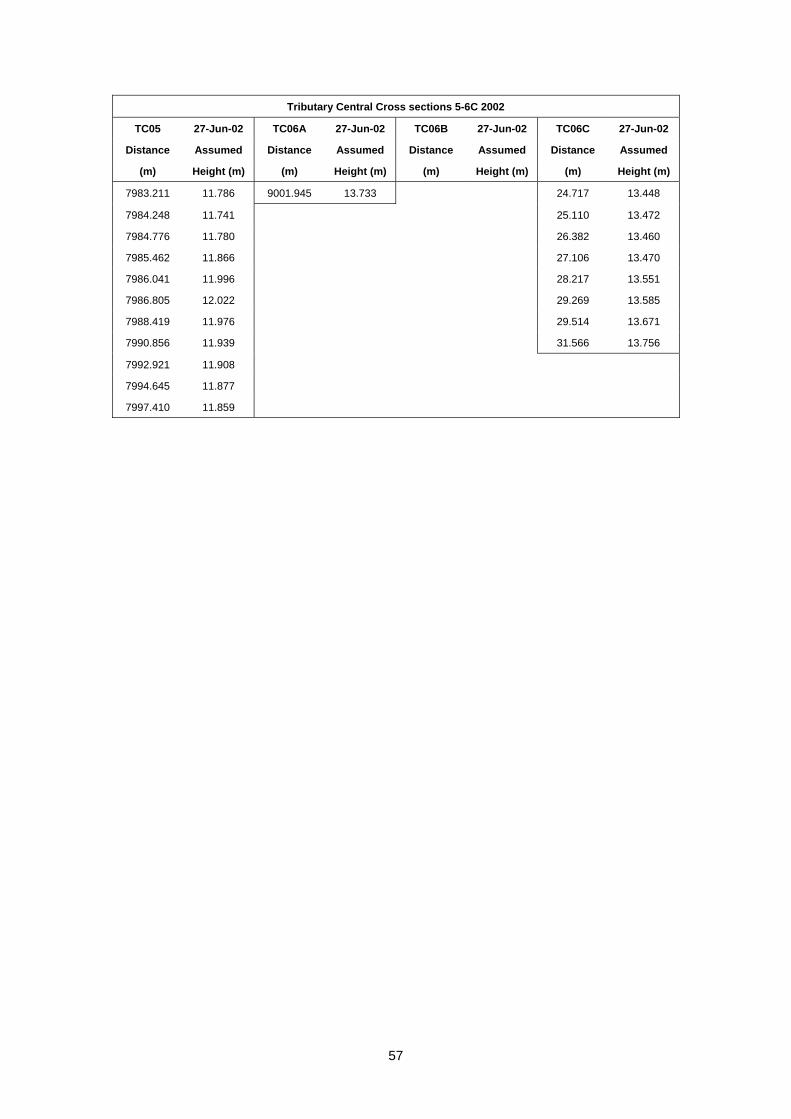
57
Tributary Central Cross sections 5-6C 2002
TC05 27-Jun-02 TC06A 27-Jun-02 TC06B 27-Jun-02 TC06C 27-Jun-02
Distance Assumed Distance Assumed Distance Assumed Distance Assumed
(m) Height (m) (m) Height (m) (m) Height (m) (m) Height (m)
7983.211 11.786 9001.945 13.733 24.717 13.448
7984.248 11.741 25.110 13.472
7984.776 11.780 26.382 13.460
7985.462 11.866 27.106 13.470
7986.041 11.996 28.217 13.551
7986.805 12.022 29.269 13.585
7988.419 11.976 29.514 13.671
7990.856 11.939 31.566 13.756
7992.921 11.908
7994.645 11.877
7997.410 11.859

58
Tributary Central Cross sections 7A-8 2002
TC07A 27-Jun-02 TC07B 27-Jun-02 TC07C 27-Jun-02 TC08 27-Jun-02
Distance Assumed Distance Assumed Distance Assumed Distance Assumed
(m) Height (m) (m) Height (m) (m) Height (m) (m) Height (m)
1032.984 13.263 0.126 12.778 0.149 12.821 5976.113 12.758
1032.878 13.090 1.816 12.859 1.729 12.818 5976.267 12.558
1030.884 13.132 3.499 12.960 3.235 12.840 5977.616 12.535
1029.130 13.184 5.246 12.975 5.208 12.833 5979.264 12.585
1027.320 13.225 6.557 12.988 6.718 12.852 5980.905 12.463
1025.730 13.234 7.710 13.016 8.644 12.861 5981.707 12.341
1024.579 13.256 8.411 13.005 10.125 12.885 5982.179 12.139
1023.642 13.265 8.501 12.570 12.122 12.890 5982.788 11.956
1023.552 12.219 8.772 12.359 14.177 12.921 5983.072 11.784
1023.227 12.020 8.910 12.207 15.546 12.912 5983.463 11.673
1022.611 11.677 9.378 11.971 16.400 12.855 5983.920 11.504
1022.387 11.640 9.766 11.575 16.572 12.133 5984.015 11.391
1022.159 11.514 10.089 11.199 16.836 11.911 5984.246 11.282
1022.029 11.546 10.435 11.224 16.954 11.752 5984.333 11.182
1022.031 11.546 10.809 11.315 17.347 11.396 5984.519 11.056
1021.715 11.489 11.037 11.316 17.556 11.401 5984.809 10.892
1021.471 11.502 11.386 11.291 17.740 11.270 5985.013 10.891
1021.222 11.588 12.019 11.324 18.164 11.179 5985.235 10.898
1020.616 11.588 12.471 11.357 18.837 11.037 5985.728 10.810
1020.278 11.624 13.124 11.429 19.207 11.037 5986.032 10.846
1019.967 11.694 13.582 11.462 19.447 11.196 5986.408 10.843
1019.467 11.528 13.965 11.543 19.773 11.542 5986.883 11.091
1018.919 11.473 14.244 11.622 20.422 11.792 5987.474 11.361
1018.757 11.344 14.733 11.653 21.279 11.916 5987.752 11.533
1018.318 11.217 15.156 11.654 22.012 11.979 5988.050 11.698
1017.944 11.257 15.518 11.743 22.504 12.135 5988.388 11.777
1017.487 11.427 15.747 11.799 23.582 12.348 5988.690 12.031
1017.082 11.421 16.025 11.896 24.293 12.386 5989.223 12.317
1016.525 11.545 16.985 12.101 25.065 12.527 5989.790 12.465
1015.895 11.718 17.913 12.230 26.181 12.489 5990.676 12.621
1015.484 11.780 18.367 12.267 26.998 12.557 5991.382 12.694
1014.888 11.713 18.592 12.327 28.377 12.650 5993.135 12.761
1014.073 11.926 18.795 12.236 29.363 12.652 5994.764 12.783
1013.622 11.861 19.220 12.228 5996.771 12.810
1013.053 12.032 19.816 12.324 5998.255 12.813
1012.847 12.024 20.287 12.363
1012.557 12.100 20.739 12.398
1012.218 12.103 21.439 12.532
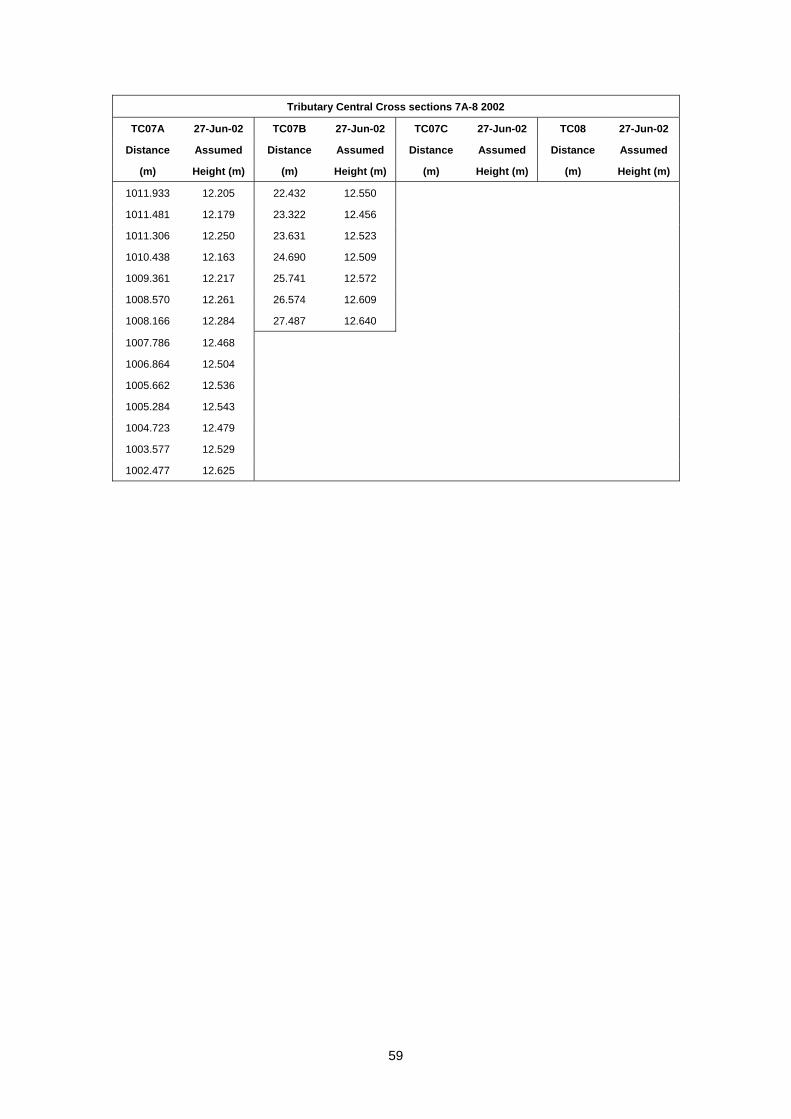
59
Tributary Central Cross sections 7A-8 2002
TC07A 27-Jun-02 TC07B 27-Jun-02 TC07C 27-Jun-02 TC08 27-Jun-02
Distance Assumed Distance Assumed Distance Assumed Distance Assumed
(m) Height (m) (m) Height (m) (m) Height (m) (m) Height (m)
1011.933 12.205 22.432 12.550
1011.481 12.179 23.322 12.456
1011.306 12.250 23.631 12.523
1010.438 12.163 24.690 12.509
1009.361 12.217 25.741 12.572
1008.570 12.261 26.574 12.609
1008.166 12.284 27.487 12.640
1007.786 12.468
1006.864 12.504
1005.662 12.536
1005.284 12.543
1004.723 12.479
1003.577 12.529
1002.477 12.625

60
Tributary Central Cross sections 9-11 2002
TC09 27-Jun-02 TC10 27-Jun-02 TC11 27-Jun-02
Distance Assumed Distance Assumed Distance Assumed
(m) Height (m) (m) Height (m) (m) Height (m)
8962.482 13.113 7965.297 12.871 6969.909 13.066
8962.615 12.927 7965.438 12.689 6970.041 12.860
8964.215 12.858 7967.470 12.678 6972.743 12.827
8966.553 12.834 7970.147 12.688 6975.627 12.797
8968.635 12.856 7972.591 12.725 6978.138 12.764
8970.658 12.896 7974.083 12.774 6979.207 12.786
8972.375 12.890 7975.381 12.806 6979.526 12.785
8973.125 12.870 7976.109 12.801 6979.712 12.744
8973.648 12.802 7976.978 12.709 6979.774 12.678
8973.682 12.437 7977.094 12.324 6979.840 12.389
8974.008 12.265 7977.304 12.154 6979.976 12.362
8974.180 12.209 7977.531 12.037 6980.364 11.926
8974.461 11.746 7977.775 11.854 6980.645 11.725
8974.826 11.646 7978.257 11.770 6980.772 11.662
8974.905 11.526 7978.612 11.729 6980.912 11.330
8975.115 11.393 7978.815 11.649 6981.009 11.302
8975.457 11.495 7979.517 11.550 6981.294 11.329
8976.030 11.405 7980.761 11.593 6981.584 11.450
8976.376 11.425 7981.229 11.601 6981.902 11.560
8977.194 11.472 7981.801 11.689 6982.487 11.629
8977.675 11.535 7982.288 11.768 6983.181 11.711
8978.057 11.529 7982.783 12.034 6983.716 11.845
8978.477 11.591 7983.507 12.046 6984.183 11.912
8978.820 11.714 7984.047 12.074 6984.448 12.012
8979.130 11.753 7984.908 12.267 6984.726 12.063
8979.327 11.925 7985.727 12.392 6984.966 12.073
8979.654 12.178 7986.798 12.434 6985.158 12.006
8980.101 12.224 7987.987 12.467 6985.548 11.945
8980.638 12.348 7988.907 12.505 6986.144 11.999
8981.106 12.613 7989.691 12.574 6986.714 12.122
8981.490 12.752 7990.399 12.671 6986.967 12.338
8982.347 12.894 7992.173 12.838 6987.186 12.415
8983.807 12.984 7994.571 12.801 6987.597 12.399
8985.596 12.967 7997.514 12.749 6988.645 12.427
8987.254 12.946 6989.792 12.413
8988.901 12.926 6990.641 12.382
8991.238 12.860 6991.535 12.451
8992.803 12.826 6992.607 12.645

61
Tributary Central Cross sections 9-11 2002
TC09 27-Jun-02 TC10 27-Jun-02 TC11 27-Jun-02
Distance Assumed Distance Assumed Distance Assumed
(m) Height (m) (m) Height (m) (m) Height (m)
8994.620 12.815 6993.901 12.741
8996.186 12.806 6995.309 12.773
8997.910 12.796 6996.950 12.809
6998.547 12.818

62
East Tributary Cross sections 1 to 4- 2002
ET01 7-Jun-02 ET02 10-Jul-02 ET03 10-Jul-02 ET04 10-Jul-02
Distance Assumed Distance Assumed Distance Assumed Distance Assumed
(m) Height (m) (m) Height (m) (m) Height (m) (m) Height (m)
975.717 14.879 1971.698 14.903 2976.631 14.956 3974.118 14.900
925.528 14.122 1971.819 14.704 2976.761 14.768 3974.255 14.709
927.980 14.118 1973.131 14.713 2978.288 14.769 3975.261 14.725
930.813 14.139 1974.480 14.739 2979.741 14.789 3976.780 14.745
934.020 14.155 1976.327 14.727 2980.492 14.797 3978.251 14.781
936.428 14.197 1976.842 14.721 2981.710 14.820 3979.898 14.842
939.688 14.240 1977.220 14.577 2983.323 14.864 3981.459 14.886
942.371 14.368 1977.430 14.315 2984.400 14.875 3983.054 14.914
945.403 14.477 1978.188 14.091 2985.156 14.791 3983.606 14.776
948.562 14.545 1978.473 13.809 2985.782 14.671 3984.096 14.495
951.424 14.624 1978.785 13.662 2986.043 14.549 3984.310 14.365
954.220 14.680 1979.092 13.574 2986.235 14.283 3984.510 14.329
957.232 14.694 1979.240 13.516 2986.413 14.228 3984.824 14.264
960.073 14.689 1979.710 13.499 2986.546 14.372 3984.832 13.649
963.030 14.734 1981.084 13.421 2986.864 14.238 3985.127 13.508
966.258 14.691 1981.710 13.374 2986.954 14.105 3985.796 13.384
969.365 14.731 1982.080 13.196 2987.076 13.981 3986.394 13.349
972.117 14.753 1982.286 13.113 2987.385 13.620 3987.131 13.365
975.045 14.679 1982.409 13.132 2988.112 13.176 3987.876 13.352
975.677 14.876 1982.852 13.055 2988.363 13.169 3988.304 13.327
975.827 14.692 1983.655 12.992 2988.757 13.206 3988.648 13.230
977.304 14.698 1983.938 12.827 2989.181 13.242 3988.962 13.303
978.510 14.691 1984.503 12.654 2989.752 13.205 3989.377 13.617
979.522 14.733 1985.094 12.702 2990.048 13.103 3989.777 13.907
980.229 14.801 1985.313 12.748 2990.751 13.111 3990.197 14.301
981.316 14.841 1985.695 12.834 2991.082 13.128 3990.560 14.519
982.046 14.833 1985.971 13.012 2991.342 13.429 3990.928 14.668
982.578 14.650 1986.036 13.445 2992.099 13.661 3991.567 14.726
982.921 14.576 1986.393 13.566 2992.513 14.100 3992.087 14.766
983.186 14.410 1986.541 13.707 2992.814 14.397 3992.548 14.918
983.385 14.038 1986.777 14.081 2993.273 14.709 3992.838 14.925
983.552 13.865 1986.889 14.499 2993.748 14.882 3994.102 14.881
983.841 13.593 1987.065 14.755 2994.461 14.919 3995.495 14.873
984.279 13.423 1987.395 14.856 2995.622 14.873 3996.459 14.824
984.557 13.279 1988.588 14.836 2996.719 14.872 3997.507 14.822
985.186 13.228 1990.055 14.803 2998.357 14.826 3998.752 14.847
985.824 13.199 1991.591 14.831
986.310 13.044 1994.204 14.809

63
East Tributary Cross sections 1 to 4- 2002
ET01 7-Jun-02 ET02 10-Jul-02 ET03 10-Jul-02 ET04 10-Jul-02
Distance Assumed Distance Assumed Distance Assumed Distance Assumed
(m) Height (m) (m) Height (m) (m) Height (m) (m) Height (m)
986.924 12.955 1996.156 14.831
987.760 13.069 1998.532 14.804
988.370 13.200
988.425 13.489
988.717 13.557
988.914 13.850
989.303 14.040
989.655 14.205
990.105 14.456
990.394 14.611
990.601 14.657
991.110 14.743
992.292 14.732
994.412 14.761
996.637 14.807
998.934 14.826
1001.522 14.841
1003.268 14.829
1005.400 14.835
1008.888 14.839
1012.355 14.885
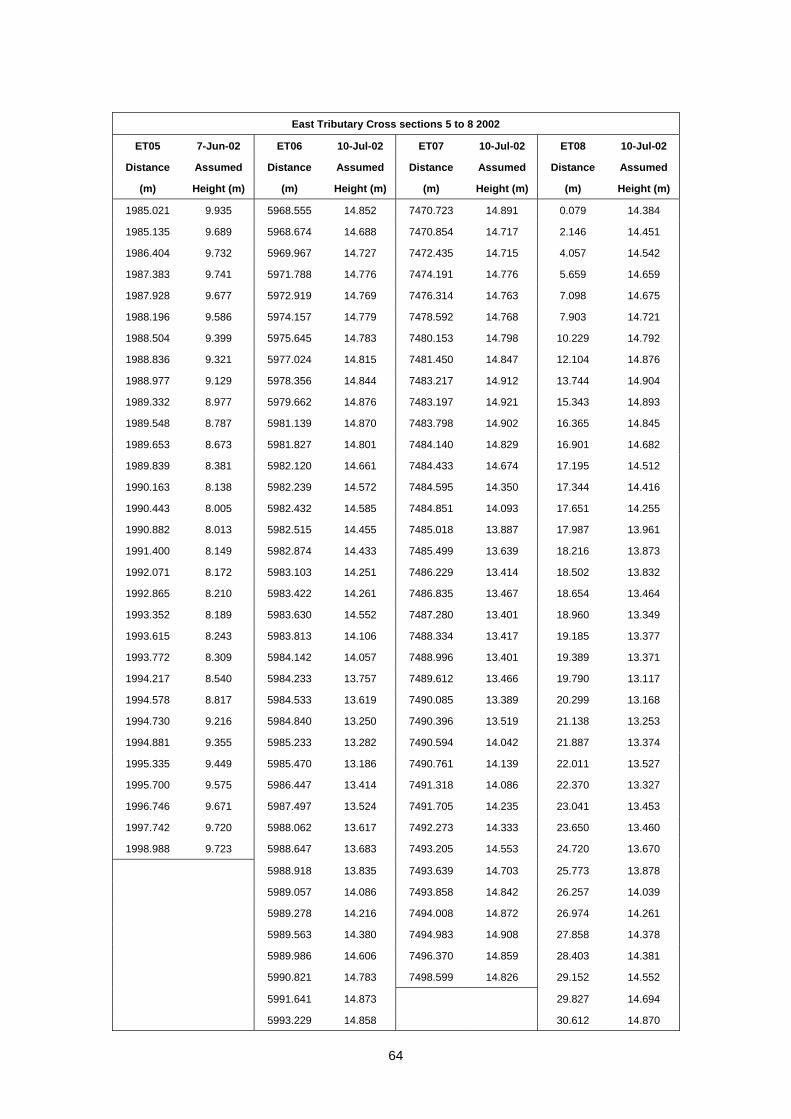
64
East Tributary Cross sections 5 to 8 2002
ET05 7-Jun-02 ET06 10-Jul-02 ET07 10-Jul-02 ET08 10-Jul-02
Distance Assumed Distance Assumed Distance Assumed Distance Assumed
(m) Height (m) (m) Height (m) (m) Height (m) (m) Height (m)
1985.021 9.935 5968.555 14.852 7470.723 14.891 0.079 14.384
1985.135 9.689 5968.674 14.688 7470.854 14.717 2.146 14.451
1986.404 9.732 5969.967 14.727 7472.435 14.715 4.057 14.542
1987.383 9.741 5971.788 14.776 7474.191 14.776 5.659 14.659
1987.928 9.677 5972.919 14.769 7476.314 14.763 7.098 14.675
1988.196 9.586 5974.157 14.779 7478.592 14.768 7.903 14.721
1988.504 9.399 5975.645 14.783 7480.153 14.798 10.229 14.792
1988.836 9.321 5977.024 14.815 7481.450 14.847 12.104 14.876
1988.977 9.129 5978.356 14.844 7483.217 14.912 13.744 14.904
1989.332 8.977 5979.662 14.876 7483.197 14.921 15.343 14.893
1989.548 8.787 5981.139 14.870 7483.798 14.902 16.365 14.845
1989.653 8.673 5981.827 14.801 7484.140 14.829 16.901 14.682
1989.839 8.381 5982.120 14.661 7484.433 14.674 17.195 14.512
1990.163 8.138 5982.239 14.572 7484.595 14.350 17.344 14.416
1990.443 8.005 5982.432 14.585 7484.851 14.093 17.651 14.255
1990.882 8.013 5982.515 14.455 7485.018 13.887 17.987 13.961
1991.400 8.149 5982.874 14.433 7485.499 13.639 18.216 13.873
1992.071 8.172 5983.103 14.251 7486.229 13.414 18.502 13.832
1992.865 8.210 5983.422 14.261 7486.835 13.467 18.654 13.464
1993.352 8.189 5983.630 14.552 7487.280 13.401 18.960 13.349
1993.615 8.243 5983.813 14.106 7488.334 13.417 19.185 13.377
1993.772 8.309 5984.142 14.057 7488.996 13.401 19.389 13.371
1994.217 8.540 5984.233 13.757 7489.612 13.466 19.790 13.117
1994.578 8.817 5984.533 13.619 7490.085 13.389 20.299 13.168
1994.730 9.216 5984.840 13.250 7490.396 13.519 21.138 13.253
1994.881 9.355 5985.233 13.282 7490.594 14.042 21.887 13.374
1995.335 9.449 5985.470 13.186 7490.761 14.139 22.011 13.527
1995.700 9.575 5986.447 13.414 7491.318 14.086 22.370 13.327
1996.746 9.671 5987.497 13.524 7491.705 14.235 23.041 13.453
1997.742 9.720 5988.062 13.617 7492.273 14.333 23.650 13.460
1998.988 9.723 5988.647 13.683 7493.205 14.553 24.720 13.670
5988.918 13.835 7493.639 14.703 25.773 13.878
5989.057 14.086 7493.858 14.842 26.257 14.039
5989.278 14.216 7494.008 14.872 26.974 14.261
5989.563 14.380 7494.983 14.908 27.858 14.378
5989.986 14.606 7496.370 14.859 28.403 14.381
5990.821 14.783 7498.599 14.826 29.152 14.552
5991.641 14.873 29.827 14.694
5993.229 14.858 30.612 14.870

65
East Tributary Cross sections 5 to 8 2002
ET05 7-Jun-02 ET06 10-Jul-02 ET07 10-Jul-02 ET08 10-Jul-02
Distance Assumed Distance Assumed Distance Assumed Distance Assumed
(m) Height (m) (m) Height (m) (m) Height (m) (m) Height (m)
5994.723 14.881 31.647 14.889
5995.819 14.863 33.007 14.844
5996.714 14.848 34.585 14.835
5998.528 14.825
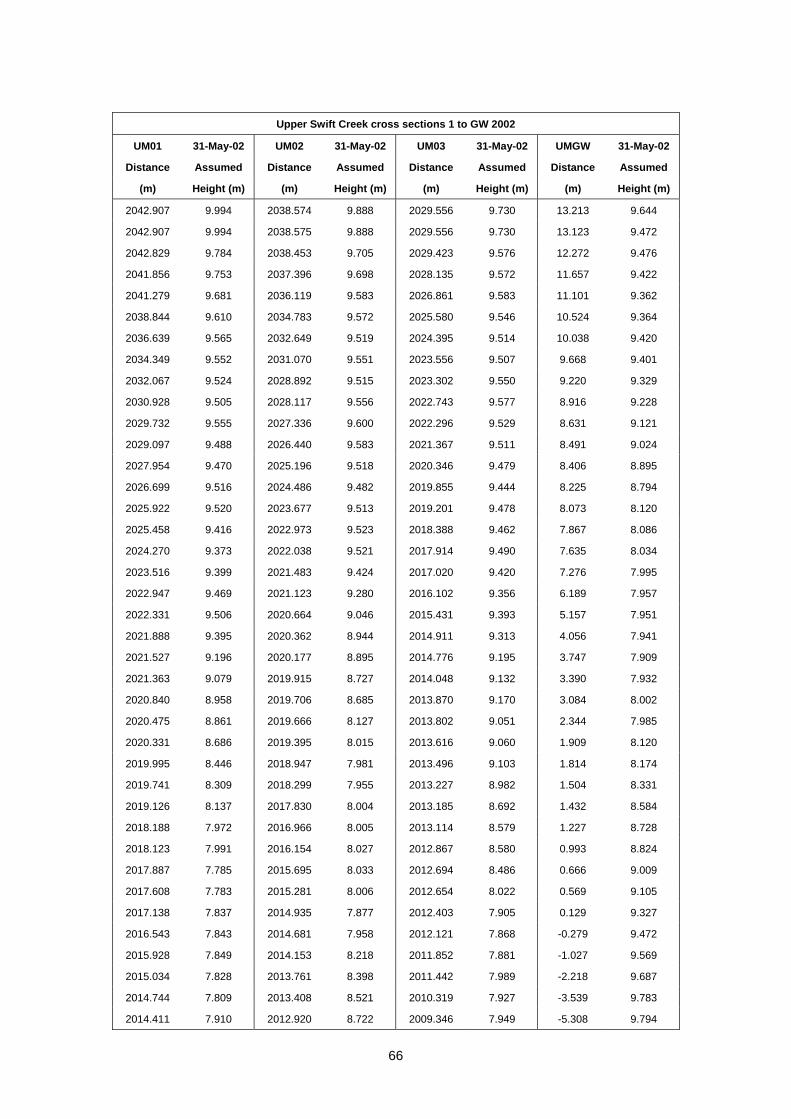
66
Upper Swift Creek cross sections 1 to GW 2002
UM01 31-May-02 UM02 31-May-02 UM03 31-May-02 UMGW 31-May-02
Distance Assumed Distance Assumed Distance Assumed Distance Assumed
(m) Height (m) (m) Height (m) (m) Height (m) (m) Height (m)
2042.907 9.994 2038.574 9.888 2029.556 9.730 13.213 9.644
2042.907 9.994 2038.575 9.888 2029.556 9.730 13.123 9.472
2042.829 9.784 2038.453 9.705 2029.423 9.576 12.272 9.476
2041.856 9.753 2037.396 9.698 2028.135 9.572 11.657 9.422
2041.279 9.681 2036.119 9.583 2026.861 9.583 11.101 9.362
2038.844 9.610 2034.783 9.572 2025.580 9.546 10.524 9.364
2036.639 9.565 2032.649 9.519 2024.395 9.514 10.038 9.420
2034.349 9.552 2031.070 9.551 2023.556 9.507 9.668 9.401
2032.067 9.524 2028.892 9.515 2023.302 9.550 9.220 9.329
2030.928 9.505 2028.117 9.556 2022.743 9.577 8.916 9.228
2029.732 9.555 2027.336 9.600 2022.296 9.529 8.631 9.121
2029.097 9.488 2026.440 9.583 2021.367 9.511 8.491 9.024
2027.954 9.470 2025.196 9.518 2020.346 9.479 8.406 8.895
2026.699 9.516 2024.486 9.482 2019.855 9.444 8.225 8.794
2025.922 9.520 2023.677 9.513 2019.201 9.478 8.073 8.120
2025.458 9.416 2022.973 9.523 2018.388 9.462 7.867 8.086
2024.270 9.373 2022.038 9.521 2017.914 9.490 7.635 8.034
2023.516 9.399 2021.483 9.424 2017.020 9.420 7.276 7.995
2022.947 9.469 2021.123 9.280 2016.102 9.356 6.189 7.957
2022.331 9.506 2020.664 9.046 2015.431 9.393 5.157 7.951
2021.888 9.395 2020.362 8.944 2014.911 9.313 4.056 7.941
2021.527 9.196 2020.177 8.895 2014.776 9.195 3.747 7.909
2021.363 9.079 2019.915 8.727 2014.048 9.132 3.390 7.932
2020.840 8.958 2019.706 8.685 2013.870 9.170 3.084 8.002
2020.475 8.861 2019.666 8.127 2013.802 9.051 2.344 7.985
2020.331 8.686 2019.395 8.015 2013.616 9.060 1.909 8.120
2019.995 8.446 2018.947 7.981 2013.496 9.103 1.814 8.174
2019.741 8.309 2018.299 7.955 2013.227 8.982 1.504 8.331
2019.126 8.137 2017.830 8.004 2013.185 8.692 1.432 8.584
2018.188 7.972 2016.966 8.005 2013.114 8.579 1.227 8.728
2018.123 7.991 2016.154 8.027 2012.867 8.580 0.993 8.824
2017.887 7.785 2015.695 8.033 2012.694 8.486 0.666 9.009
2017.608 7.783 2015.281 8.006 2012.654 8.022 0.569 9.105
2017.138 7.837 2014.935 7.877 2012.403 7.905 0.129 9.327
2016.543 7.843 2014.681 7.958 2012.121 7.868 -0.279 9.472
2015.928 7.849 2014.153 8.218 2011.852 7.881 -1.027 9.569
2015.034 7.828 2013.761 8.398 2011.442 7.989 -2.218 9.687
2014.744 7.809 2013.408 8.521 2010.319 7.927 -3.539 9.783
2014.411 7.910 2012.920 8.722 2009.346 7.949 -5.308 9.794
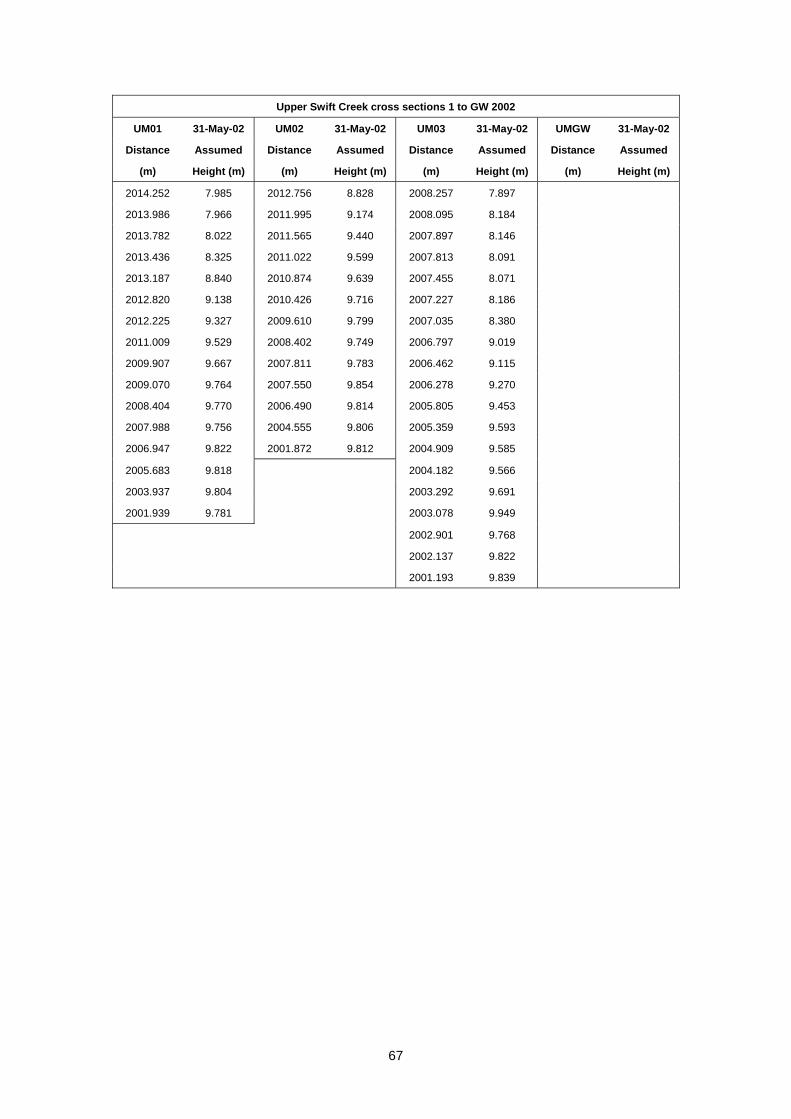
67
Upper Swift Creek cross sections 1 to GW 2002
UM01 31-May-02 UM02 31-May-02 UM03 31-May-02 UMGW 31-May-02
Distance Assumed Distance Assumed Distance Assumed Distance Assumed
(m) Height (m) (m) Height (m) (m) Height (m) (m) Height (m)
2014.252 7.985 2012.756 8.828 2008.257 7.897
2013.986 7.966 2011.995 9.174 2008.095 8.184
2013.782 8.022 2011.565 9.440 2007.897 8.146
2013.436 8.325 2011.022 9.599 2007.813 8.091
2013.187 8.840 2010.874 9.639 2007.455 8.071
2012.820 9.138 2010.426 9.716 2007.227 8.186
2012.225 9.327 2009.610 9.799 2007.035 8.380
2011.009 9.529 2008.402 9.749 2006.797 9.019
2009.907 9.667 2007.811 9.783 2006.462 9.115
2009.070 9.764 2007.550 9.854 2006.278 9.270
2008.404 9.770 2006.490 9.814 2005.805 9.453
2007.988 9.756 2004.555 9.806 2005.359 9.593
2006.947 9.822 2001.872 9.812 2004.909 9.585
2005.683 9.818 2004.182 9.566
2003.937 9.804 2003.292 9.691
2001.939 9.781 2003.078 9.949
2002.901 9.768
2002.137 9.822
2001.193 9.839
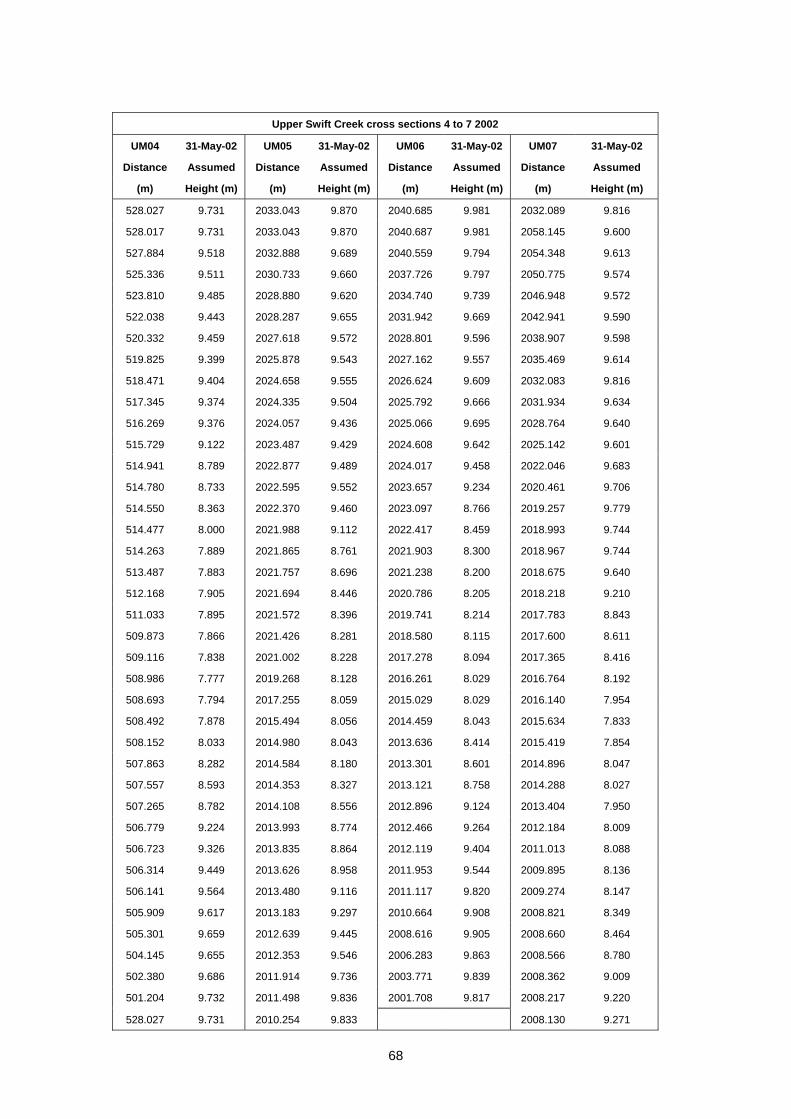
68
Upper Swift Creek cross sections 4 to 7 2002
UM04 31-May-02 UM05 31-May-02 UM06 31-May-02 UM07 31-May-02
Distance Assumed Distance Assumed Distance Assumed Distance Assumed
(m) Height (m) (m) Height (m) (m) Height (m) (m) Height (m)
528.027 9.731 2033.043 9.870 2040.685 9.981 2032.089 9.816
528.017 9.731 2033.043 9.870 2040.687 9.981 2058.145 9.600
527.884 9.518 2032.888 9.689 2040.559 9.794 2054.348 9.613
525.336 9.511 2030.733 9.660 2037.726 9.797 2050.775 9.574
523.810 9.485 2028.880 9.620 2034.740 9.739 2046.948 9.572
522.038 9.443 2028.287 9.655 2031.942 9.669 2042.941 9.590
520.332 9.459 2027.618 9.572 2028.801 9.596 2038.907 9.598
519.825 9.399 2025.878 9.543 2027.162 9.557 2035.469 9.614
518.471 9.404 2024.658 9.555 2026.624 9.609 2032.083 9.816
517.345 9.374 2024.335 9.504 2025.792 9.666 2031.934 9.634
516.269 9.376 2024.057 9.436 2025.066 9.695 2028.764 9.640
515.729 9.122 2023.487 9.429 2024.608 9.642 2025.142 9.601
514.941 8.789 2022.877 9.489 2024.017 9.458 2022.046 9.683
514.780 8.733 2022.595 9.552 2023.657 9.234 2020.461 9.706
514.550 8.363 2022.370 9.460 2023.097 8.766 2019.257 9.779
514.477 8.000 2021.988 9.112 2022.417 8.459 2018.993 9.744
514.263 7.889 2021.865 8.761 2021.903 8.300 2018.967 9.744
513.487 7.883 2021.757 8.696 2021.238 8.200 2018.675 9.640
512.168 7.905 2021.694 8.446 2020.786 8.205 2018.218 9.210
511.033 7.895 2021.572 8.396 2019.741 8.214 2017.783 8.843
509.873 7.866 2021.426 8.281 2018.580 8.115 2017.600 8.611
509.116 7.838 2021.002 8.228 2017.278 8.094 2017.365 8.416
508.986 7.777 2019.268 8.128 2016.261 8.029 2016.764 8.192
508.693 7.794 2017.255 8.059 2015.029 8.029 2016.140 7.954
508.492 7.878 2015.494 8.056 2014.459 8.043 2015.634 7.833
508.152 8.033 2014.980 8.043 2013.636 8.414 2015.419 7.854
507.863 8.282 2014.584 8.180 2013.301 8.601 2014.896 8.047
507.557 8.593 2014.353 8.327 2013.121 8.758 2014.288 8.027
507.265 8.782 2014.108 8.556 2012.896 9.124 2013.404 7.950
506.779 9.224 2013.993 8.774 2012.466 9.264 2012.184 8.009
506.723 9.326 2013.835 8.864 2012.119 9.404 2011.013 8.088
506.314 9.449 2013.626 8.958 2011.953 9.544 2009.895 8.136
506.141 9.564 2013.480 9.116 2011.117 9.820 2009.274 8.147
505.909 9.617 2013.183 9.297 2010.664 9.908 2008.821 8.349
505.301 9.659 2012.639 9.445 2008.616 9.905 2008.660 8.464
504.145 9.655 2012.353 9.546 2006.283 9.863 2008.566 8.780
502.380 9.686 2011.914 9.736 2003.771 9.839 2008.362 9.009
501.204 9.732 2011.498 9.836 2001.708 9.817 2008.217 9.220
528.027 9.731 2010.254 9.833 2008.130 9.271

69
Upper Swift Creek cross sections 4 to 7 2002
UM04 31-May-02 UM05 31-May-02 UM06 31-May-02 UM07 31-May-02
Distance Assumed Distance Assumed Distance Assumed Distance Assumed
(m) Height (m) (m) Height (m) (m) Height (m) (m) Height (m)
528.017 9.731 2008.670 9.811 2008.031 9.315
527.884 9.518 2006.792 9.828 2007.927 9.405
525.336 9.511 2004.384 9.811 2007.674 9.593
523.810 9.485 2001.608 9.812 2007.180 9.662
522.038 9.443 2005.996 9.721
520.332 9.459 2003.870 9.779
519.825 9.399 2001.720 9.792
518.471 9.404 1998.514 9.793
517.345 9.374 1996.363 9.778
516.269 9.376 1992.547 9.710
515.729 9.122 1989.633 9.674
514.941 8.789 1986.400 9.692
514.780 8.733 1983.185 9.714
514.550 8.363 1979.890 9.669
514.477 8.000 1976.315 9.632
514.263 7.889 1972.843 9.573
513.487 7.883 1968.474 9.555
512.168 7.905 1964.525 9.549
511.033 7.895 1961.466 9.534
509.873 7.866 1957.781 9.484
509.116 7.838
508.986 7.777
508.693 7.794

70
Swift Creek Cross sections 1 to 4 2002
SM01 10-Jul-02 SM02 11-Jul-02 SM03 11-Jul-02 SM04 11-Jul-02
Distance Assumed Distance Assumed Distance Assumed Distance Assumed
(m) Height (m) (m) Height (m) (m) Height (m) (m) Height (m)
462.588 9.053 2037.794 7.992 2040.639 8.044 2033.234 7.968
462.721 8.846 2037.654 7.818 2040.522 7.919 2033.066 7.778
466.033 8.782 2035.319 7.885 2037.589 7.925 2030.789 7.780
467.707 8.770 2033.124 7.923 2035.092 7.879 2029.004 7.841
468.263 8.738 2030.873 7.948 2033.175 7.843 2027.323 7.903
469.009 8.664 2029.658 7.905 2032.408 7.776 2025.982 7.919
469.417 8.608 2028.785 7.802 2031.410 7.563 2025.263 7.965
469.955 8.595 2028.133 7.650 2030.624 7.403 2025.005 7.974
470.619 8.597 2027.464 7.525 2029.999 7.127 2024.584 7.817
471.460 8.610 2026.787 7.496 2029.387 6.931 2024.460 7.600
471.732 8.582 2026.529 7.411 2028.838 6.903 2024.110 7.552
472.175 8.438 2025.816 7.112 2028.218 6.841 2023.685 7.293
472.484 8.310 2025.271 6.921 2027.202 6.788 2023.107 7.127
473.187 8.202 2024.947 6.781 2025.836 6.626 2022.968 6.824
473.649 7.997 2024.109 6.638 2024.526 6.454 2022.761 6.518
474.167 7.759 2023.116 6.576 2023.687 6.339 2022.440 5.943
474.603 7.559 2022.048 6.527 2022.596 6.271 2022.255 5.931
474.741 7.404 2021.126 6.493 2021.929 6.230 2021.614 6.099
475.158 7.274 2020.396 6.325 2020.919 6.127 2020.024 6.121
476.157 7.266 2019.723 6.222 2019.998 5.938 2018.803 6.182
476.887 7.241 2019.026 6.211 2019.131 5.814 2017.515 6.260
477.693 7.169 2018.607 6.253 2018.782 5.825 2016.402 6.386
478.188 7.135 2018.351 6.339 2018.615 5.952 2015.386 6.454
478.627 7.073 2017.857 6.366 2018.364 6.018 2014.562 6.425
479.055 7.061 2017.472 6.278 2018.247 6.091 2013.827 6.418
479.359 7.078 2017.057 6.145 2017.899 6.432 2013.378 6.728
479.571 6.990 2016.588 5.971 2017.458 6.627 2012.930 7.182
479.797 6.975 2016.026 5.936 2016.751 6.754 2012.714 7.265
480.083 7.132 2015.381 6.027 2016.187 6.854 2011.923 7.402
480.199 7.219 2014.812 6.078 2015.791 6.962 2011.500 7.444
480.520 7.507 2014.437 6.172 2015.457 6.936 2010.503 7.535
481.140 7.665 2014.297 6.207 2014.898 6.754 2009.366 7.629
481.340 7.773 2014.123 6.228 2014.539 6.787 2007.762 7.722
481.543 7.925 2013.923 6.365 2014.194 6.847 2005.595 7.802
482.051 8.159 2013.630 6.458 2013.878 7.106 2002.269 7.796
482.400 8.425 2013.387 6.643 2013.310 7.344
483.031 8.664 2013.246 6.671 2012.399 7.536
483.320 8.809 2012.428 6.633 2011.527 7.602

71
Swift Creek Cross sections 1 to 4 2002
SM01 10-Jul-02 SM02 11-Jul-02 SM03 11-Jul-02 SM04 11-Jul-02
Distance Assumed Distance Assumed Distance Assumed Distance Assumed
(m) Height (m) (m) Height (m) (m) Height (m) (m) Height (m)
483.864 9.000 2011.701 6.607 2010.559 7.601
485.629 9.024 2011.181 6.669 2010.026 7.520
488.030 8.976 2010.249 6.826 2008.896 7.496
490.290 8.918 2009.432 7.001 2007.748 7.482
492.339 8.899 2008.755 7.202 2006.403 7.510
494.552 8.881 2007.680 7.357 2004.489 7.601
496.727 8.867 2006.656 7.523 2002.920 7.687
498.489 8.843 2005.293 7.666
2004.076 7.721
2001.834 7.792

72
Swift Creek Cross sections 5 to 8 2002
SM05 11-Jul-02 SM06 11-Jul-02 SM07 11-Jul-02 SM08 11-Jul-02
Distance Assumed Distance Assumed Distance Assumed Distance Assumed
(m) Height (m) (m) Height (m) (m) Height (m) (m) Height (m)
2082.672 7.999 2047.863 7.788 2060.659 7.714 2052.934 7.853
2082.528 7.801 2047.708 7.609 2060.518 7.510 2052.794 7.678
2079.815 7.775 2044.543 7.615 2056.861 7.618 2049.618 7.677
2077.734 7.795 2040.711 7.659 2053.678 7.671 2045.557 7.688
2075.572 7.884 2037.511 7.693 2050.167 7.695 2041.959 7.686
2073.714 7.946 2035.100 7.721 2046.466 7.752 2040.023 7.770
2071.806 7.953 2033.140 7.766 2043.988 7.864 2038.257 7.765
2070.511 7.969 2031.612 7.671 2041.791 7.907 2037.090 7.607
2070.537 7.969 2030.670 7.516 2040.970 7.902 2036.178 7.608
2069.970 7.905 2029.490 7.158 2040.541 7.843 2035.646 7.608
2069.544 7.735 2028.706 6.858 2040.183 7.675 2035.295 7.492
2068.989 7.487 2028.086 6.503 2040.009 7.470 2034.816 7.332
2068.460 7.179 2027.688 6.349 2039.851 7.086 2034.203 6.972
2068.185 6.972 2027.055 5.924 2039.736 6.919 2033.512 6.577
2068.138 6.972 2025.858 5.960 2039.489 6.859 2032.645 6.397
2067.679 6.779 2024.327 6.010 2039.289 6.733 2031.872 6.280
2067.483 6.340 2023.214 6.031 2038.894 6.536 2030.750 6.262
2067.252 6.220 2022.704 6.036 2038.454 6.174 2029.967 6.300
2067.105 5.760 2022.149 5.997 2038.246 5.791 2028.674 6.258
2066.339 5.584 2021.977 5.939 2037.882 5.817 2027.505 6.157
2065.533 5.533 2021.834 5.855 2036.528 5.931 2026.203 6.115
2064.495 5.701 2021.563 5.877 2035.767 6.001 2025.470 6.086
2063.827 5.820 2021.196 6.043 2035.210 5.923 2024.493 5.920
2062.885 5.844 2020.951 6.100 2034.225 6.111 2024.075 6.026
2062.203 5.969 2020.488 6.487 2033.308 6.194 2023.632 6.187
2061.484 5.953 2019.826 6.732 2032.869 6.221 2023.404 6.366
2060.691 6.040 2019.556 6.858 2031.706 6.385 2023.023 6.460
2060.137 5.999 2018.767 6.944 2030.498 6.498 2022.691 6.759
2059.531 5.990 2018.124 7.113 2029.119 6.517 2022.456 6.961
2059.061 6.082 2017.881 7.180 2028.415 6.566 2022.005 7.119
2058.496 6.222 2017.531 7.353 2028.161 6.781 2021.438 7.238
2058.224 6.358 2016.250 7.570 2027.872 6.951 2020.184 7.239
2057.558 6.501 2015.239 7.693 2027.656 7.255 2019.613 7.384
2056.723 6.697 2014.309 7.776 2027.246 7.492 2019.119 7.566
2055.800 6.836 2013.963 7.711 2026.314 7.617 2018.395 7.784
2054.753 6.994 2013.037 7.751 2025.878 7.734 2017.596 7.901
2054.046 7.079 2011.392 7.737 2025.539 7.765 2015.635 7.901
2053.440 7.182 2009.454 7.728 2024.675 7.826 2014.315 7.871
2052.730 7.332 2007.392 7.707 2023.228 7.815 2012.598 7.759
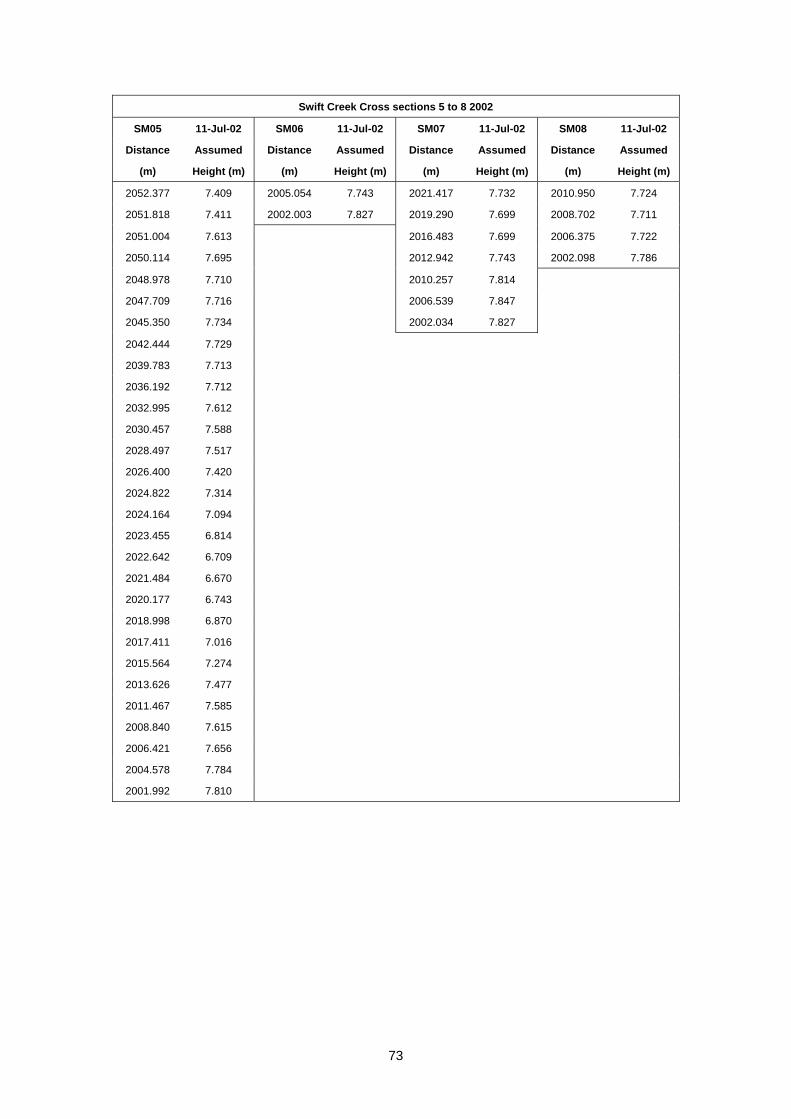
73
Swift Creek Cross sections 5 to 8 2002
SM05 11-Jul-02 SM06 11-Jul-02 SM07 11-Jul-02 SM08 11-Jul-02
Distance Assumed Distance Assumed Distance Assumed Distance Assumed
(m) Height (m) (m) Height (m) (m) Height (m) (m) Height (m)
2052.377 7.409 2005.054 7.743 2021.417 7.732 2010.950 7.724
2051.818 7.411 2002.003 7.827 2019.290 7.699 2008.702 7.711
2051.004 7.613 2016.483 7.699 2006.375 7.722
2050.114 7.695 2012.942 7.743 2002.098 7.786
2048.978 7.710 2010.257 7.814
2047.709 7.716 2006.539 7.847
2045.350 7.734 2002.034 7.827
2042.444 7.729
2039.783 7.713
2036.192 7.712
2032.995 7.612
2030.457 7.588
2028.497 7.517
2026.400 7.420
2024.822 7.314
2024.164 7.094
2023.455 6.814
2022.642 6.709
2021.484 6.670
2020.177 6.743
2018.998 6.870
2017.411 7.016
2015.564 7.274
2013.626 7.477
2011.467 7.585
2008.840 7.615
2006.421 7.656
2004.578 7.784
2001.992 7.810
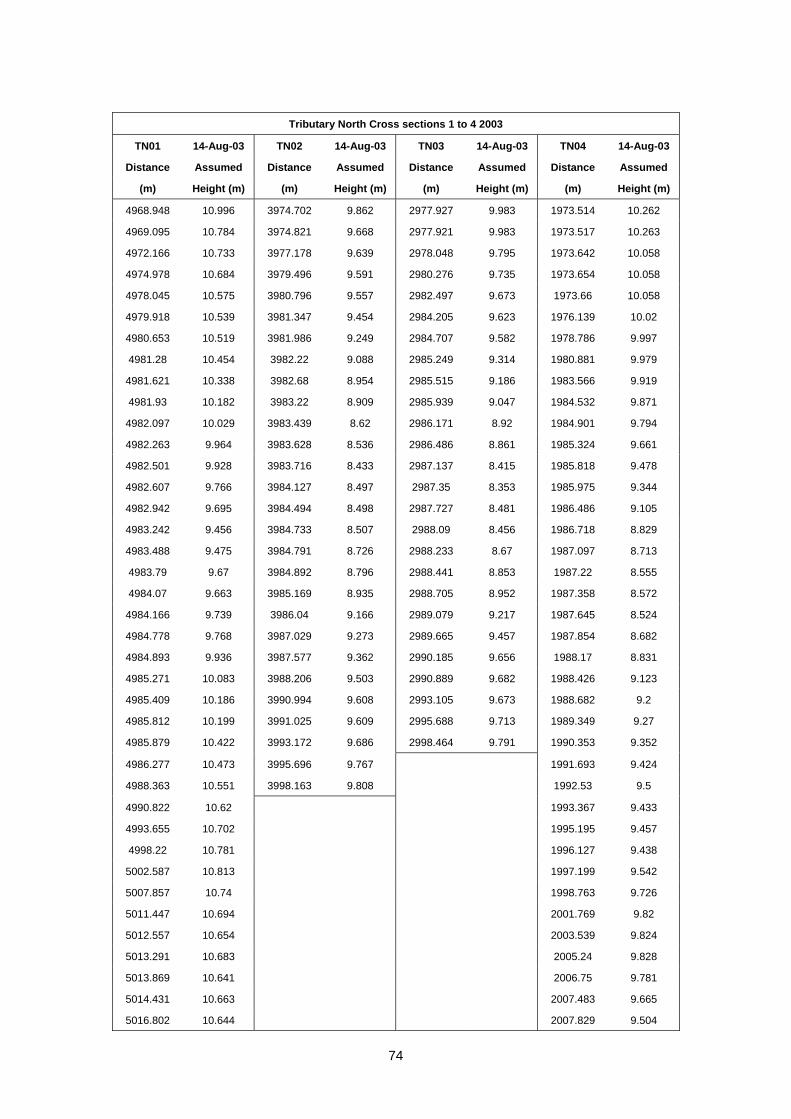
74
Tributary North Cross sections 1 to 4 2003
TN01 14-Aug-03 TN02 14-Aug-03 TN03 14-Aug-03 TN04 14-Aug-03
Distance Assumed Distance Assumed Distance Assumed Distance Assumed
(m) Height (m) (m) Height (m) (m) Height (m) (m) Height (m)
4968.948 10.996 3974.702 9.862 2977.927 9.983 1973.514 10.262
4969.095 10.784 3974.821 9.668 2977.921 9.983 1973.517 10.263
4972.166 10.733 3977.178 9.639 2978.048 9.795 1973.642 10.058
4974.978 10.684 3979.496 9.591 2980.276 9.735 1973.654 10.058
4978.045 10.575 3980.796 9.557 2982.497 9.673 1973.66 10.058
4979.918 10.539 3981.347 9.454 2984.205 9.623 1976.139 10.02
4980.653 10.519 3981.986 9.249 2984.707 9.582 1978.786 9.997
4981.28 10.454 3982.22 9.088 2985.249 9.314 1980.881 9.979
4981.621 10.338 3982.68 8.954 2985.515 9.186 1983.566 9.919
4981.93 10.182 3983.22 8.909 2985.939 9.047 1984.532 9.871
4982.097 10.029 3983.439 8.62 2986.171 8.92 1984.901 9.794
4982.263 9.964 3983.628 8.536 2986.486 8.861 1985.324 9.661
4982.501 9.928 3983.716 8.433 2987.137 8.415 1985.818 9.478
4982.607 9.766 3984.127 8.497 2987.35 8.353 1985.975 9.344
4982.942 9.695 3984.494 8.498 2987.727 8.481 1986.486 9.105
4983.242 9.456 3984.733 8.507 2988.09 8.456 1986.718 8.829
4983.488 9.475 3984.791 8.726 2988.233 8.67 1987.097 8.713
4983.79 9.67 3984.892 8.796 2988.441 8.853 1987.22 8.555
4984.07 9.663 3985.169 8.935 2988.705 8.952 1987.358 8.572
4984.166 9.739 3986.04 9.166 2989.079 9.217 1987.645 8.524
4984.778 9.768 3987.029 9.273 2989.665 9.457 1987.854 8.682
4984.893 9.936 3987.577 9.362 2990.185 9.656 1988.17 8.831
4985.271 10.083 3988.206 9.503 2990.889 9.682 1988.426 9.123
4985.409 10.186 3990.994 9.608 2993.105 9.673 1988.682 9.2
4985.812 10.199 3991.025 9.609 2995.688 9.713 1989.349 9.27
4985.879 10.422 3993.172 9.686 2998.464 9.791 1990.353 9.352
4986.277 10.473 3995.696 9.767 1991.693 9.424
4988.363 10.551 3998.163 9.808 1992.53 9.5
4990.822 10.62 1993.367 9.433
4993.655 10.702 1995.195 9.457
4998.22 10.781 1996.127 9.438
5002.587 10.813 1997.199 9.542
5007.857 10.74 1998.763 9.726
5011.447 10.694 2001.769 9.82
5012.557 10.654 2003.539 9.824
5013.291 10.683 2005.24 9.828
5013.869 10.641 2006.75 9.781
5014.431 10.663 2007.483 9.665
5016.802 10.644 2007.829 9.504
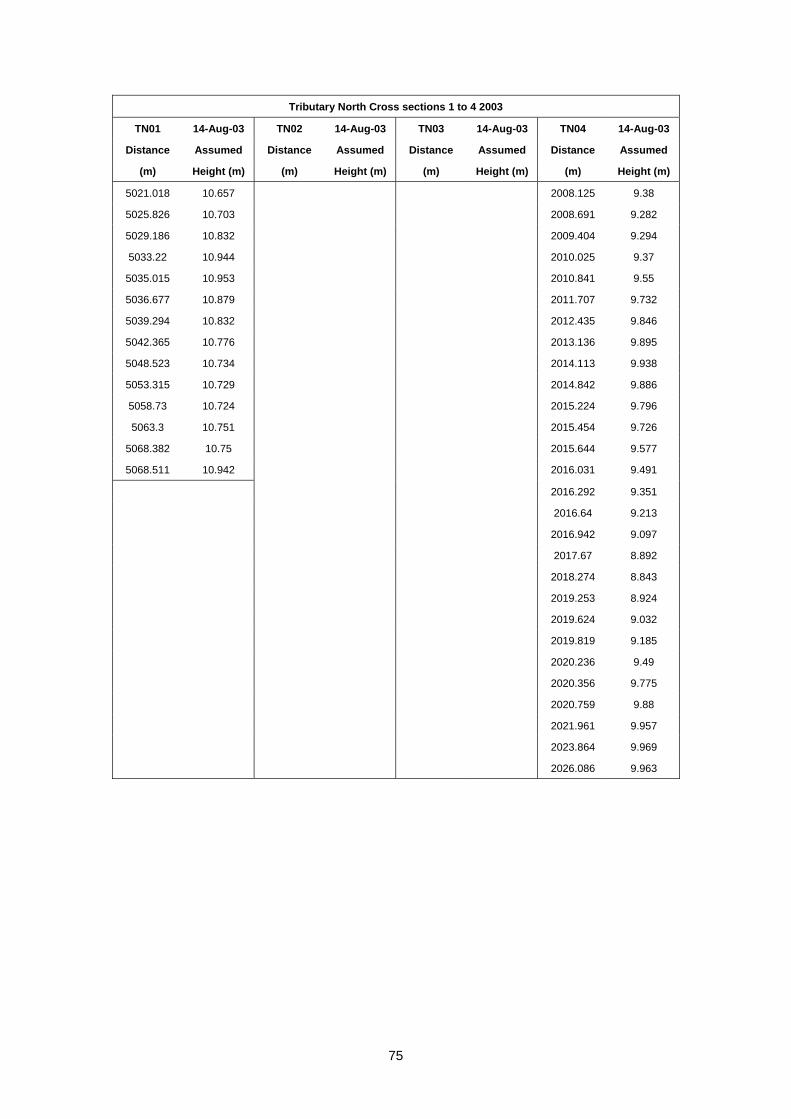
75
Tributary North Cross sections 1 to 4 2003
TN01 14-Aug-03 TN02 14-Aug-03 TN03 14-Aug-03 TN04 14-Aug-03
Distance Assumed Distance Assumed Distance Assumed Distance Assumed
(m) Height (m) (m) Height (m) (m) Height (m) (m) Height (m)
5021.018 10.657 2008.125 9.38
5025.826 10.703 2008.691 9.282
5029.186 10.832 2009.404 9.294
5033.22 10.944 2010.025 9.37
5035.015 10.953 2010.841 9.55
5036.677 10.879 2011.707 9.732
5039.294 10.832 2012.435 9.846
5042.365 10.776 2013.136 9.895
5048.523 10.734 2014.113 9.938
5053.315 10.729 2014.842 9.886
5058.73 10.724 2015.224 9.796
5063.3 10.751 2015.454 9.726
5068.382 10.75 2015.644 9.577
5068.511 10.942 2016.031 9.491
2016.292 9.351
2016.64 9.213
2016.942 9.097
2017.67 8.892
2018.274 8.843
2019.253 8.924
2019.624 9.032
2019.819 9.185
2020.236 9.49
2020.356 9.775
2020.759 9.88
2021.961 9.957
2023.864 9.969
2026.086 9.963

76
Tributary North Cross sections 5 to 8 2003
TN05 14-Aug-03 TN06 14-Aug-03 TN07 14-Aug-03 TN08 14-Aug-03
Distance Assumed Distance Assumed Distance Assumed Distance Assumed
(m) Height (m) (m) Height (m) (m) Height (m) (m) Height (m)
3523.974 9.876 1972.699 8.613 1976.162 8.881 4964.005 7.782
3523.966 9.877 1975.117 8.593 1976.164 8.881 4963.986 7.781
3523.833 9.706 1976.788 8.552 1976.338 8.729 4964.124 7.572
3521.139 9.717 1978.594 8.552 1979.136 8.656 4966.726 7.505
3518.137 9.718 1979.353 8.498 1981.301 8.613 4969.082 7.469
3515.426 9.714 1979.911 8.349 1982.028 8.606 4970.034 7.432
3514.781 9.718 1980.686 8.11 1982.547 8.562 4970.774 7.32
3514.405 9.646 1981.31 7.877 1983.542 8.156 4971.264 7.175
3514.265 9.576 1981.46 7.758 1984.223 7.96 4971.708 7.075
3514.013 9.54 1982.069 7.693 1984.872 7.84 4972.868 6.935
3513.943 9.452 1982.424 7.617 1985.324 7.745 4973.928 6.844
3513.211 9.243 1983.006 7.576 1985.624 7.618 4974.511 6.828
3513.105 9.219 1983.229 7.349 1985.859 7.614 4974.962 6.897
3512.606 9.032 1983.574 7.41 1986.209 7.542 4975.803 6.832
3512.398 8.92 1984.025 7.609 1986.487 7.593 4976.181 6.722
3511.84 8.822 1984.598 7.932 1986.718 7.692 4976.781 6.666
3511.375 8.717 1985.126 8.112 1986.966 7.982 4977.593 6.432
3510.775 8.743 1985.746 8.23 1987.145 8.04 4977.856 6.422
3510.104 8.809 1986.413 8.27 1987.625 8.127 4978 6.36
3509.711 8.917 1987.522 8.221 1988.438 8.322 4978.316 6.333
3509.576 9.009 1988.309 8.27 1989.689 8.488 4978.841 6.367
3509.453 9.148 1988.565 8.339 1991.053 8.634 4979.182 6.491
3509.017 9.289 1988.659 8.426 1993.256 8.682 4979.288 6.664
3508.667 9.433 1989.395 8.527 1995.932 8.726 4979.754 6.897
3508.144 9.66 1990.857 8.56 1998.482 8.772 4980.272 7.12
3507.502 9.734 1993.334 8.607 2001.587 8.83 4980.681 7.287
3505.772 9.744 1995.85 8.678 2007.605 8.956 4981.142 7.663
3503.447 9.764 1998.346 8.749 2010.218 8.994 4983.417 7.724
3501.644 9.789 2001.89 8.829 2013.058 9.005 4985.626 7.794
2004.342 8.841 2015.357 9.023 4986.831 7.761
2005.562 8.844 2017.227 9.047 4987.167 7.492
2006.06 8.721 2018.342 9.018 4987.316 7.423
2006.118 8.46 2018.69 8.819 4988.059 7.091
2006.276 8.233 2019.113 8.687 4988.99 6.815
2006.863 7.948 2020.03 8.345 4989.369 6.659
2007.37 7.788 2020.7 8.012 4989.703 6.637
2008.101 7.688 2021.55 7.862 4990.075 6.695
2008.392 7.687 2021.865 7.806 4990.516 6.841

77
Tributary North Cross sections 5 to 8 2003
TN05 14-Aug-03 TN06 14-Aug-03 TN07 14-Aug-03 TN08 14-Aug-03
Distance Assumed Distance Assumed Distance Assumed Distance Assumed
(m) Height (m) (m) Height (m) (m) Height (m) (m) Height (m)
2008.558 7.773 2022.187 7.9 4990.78 6.997
2009.072 7.826 2022.776 8.007 4991.113 7.17
2009.728 7.88 2023.554 8.133 4991.599 7.248
2009.987 7.97 2024.453 8.328 4992.817 7.487
2010.569 8.239 2024.741 8.471 4993.205 7.588
2010.882 8.505 2025.372 8.606 4993.655 7.761
2011.147 8.838 2025.914 8.844 4994.004 7.821
2012.221 8.901 2026.559 9.003 4996.431 7.845
2014.753 8.869 2027.8 9.011 4998.49 7.794
2017.762 8.871 2029.993 9.007
2020.887 8.862 2031.695 8.98
2021.035 9.064
2021.038 9.065

78
Tributary North Cross sections 9 to 12 2003
TN09 14-Aug-03 TN10 14-Aug-03 TN11 14-Aug-03 TN12 14-Aug-03
Distance Assumed Distance Assumed Distance Assumed Distance Assumed
(m) Height (m) (m) Height (m) (m) Height (m) (m) Height (m)
3969.697 8.162 5090.489 12.276 7077.02 13.175 7927.324 13.15
3969.695 8.162 5090.484 12.275 7077.018 13.176 7927.305 13.151
3969.823 7.964 5090.357 12.045 7076.883 12.977 7927.447 12.969
3972.018 7.955 5087.151 12.037 7073.567 12.796 7930.21 12.954
3974.721 7.939 5084.49 11.926 7071.09 12.665 7934.258 12.933
3976.953 7.899 5081.469 11.777 7069.397 12.511 7935.726 12.964
3978.34 7.868 5080.253 11.674 7068.527 12.411 7937.018 13.053
3978.726 7.799 5080.104 11.477 7067.551 12.298 7938.072 13.036
3979.199 7.642 5079.761 11.346 7066.803 12.173 7939.696 12.916
3979.993 7.32 5079.161 11.311 7066.153 12.206 7941.321 12.858
3980.727 6.911 5078.434 11.392 7065.616 12.294 7942.211 12.845
3980.969 6.8 5078.191 11.471 7064.917 12.423 7942.592 12.778
3981.285 6.743 5077.986 11.562 7063.902 12.516 7943.023 12.667
3981.873 6.764 5077.813 11.716 7061.312 12.585 7943.983 12.623
3982.745 6.704 5076.25 11.743 7057.247 12.64 7944.177 12.545
3983.372 6.605 5073.192 11.834 7052.856 12.593 7944.34 12.459
3984.188 6.465 5069.961 11.833 7049.022 12.55 7944.643 12.446
3985.071 6.567 5066.102 11.795 7046.374 12.537 7944.888 12.465
3985.93 6.594 5062.569 11.761 7044.027 12.554 7945.407 12.383
3986.346 6.665 5058.469 11.739 7043.585 12.546 7945.458 12.477
3986.627 6.768 5057.49 11.74 7042.635 12.554 7945.674 12.577
3987.281 6.844 5055.615 11.852 7041.247 12.563 7945.91 12.75
3987.402 6.875 5053.442 11.888 7039.052 12.588 7946.451 12.894
3987.945 7.161 5051.055 11.896 7037.678 12.659 7947.359 12.98
3988.479 7.328 5050.275 11.818 7037.376 12.573 7948.33 12.96
3988.749 7.434 5049.319 11.848 7036.989 12.537 7950.649 12.872
3989.371 7.571 5048.762 11.812 7036.366 12.572 7954.258 12.828
3990.982 7.619 5048.039 11.835 7035.988 12.593 7957.599 12.798
3992.993 7.67 5044.076 11.786 7035.777 12.543 7959.481 12.782
3995.093 7.707 5039.972 11.702 7035.581 12.4 7959.808 12.772
3998.025 7.759 5036.702 11.635 7035.3 12.331 7960.275 12.796
5034.207 11.576 7034.96 12.319 7961.092 12.741
5032.351 11.54 7034.453 12.385 7961.723 12.754
5028.663 11.57 7034.199 12.44 7962.513 12.779
5025.291 11.567 7034.03 12.529 7964.341 12.718
5021.886 11.579 7033.898 12.625 7967.64 12.697
5016.432 11.578 7032.902 12.665 7971.483 12.649
5011.676 11.608 7030.623 12.59 7974.89 12.622
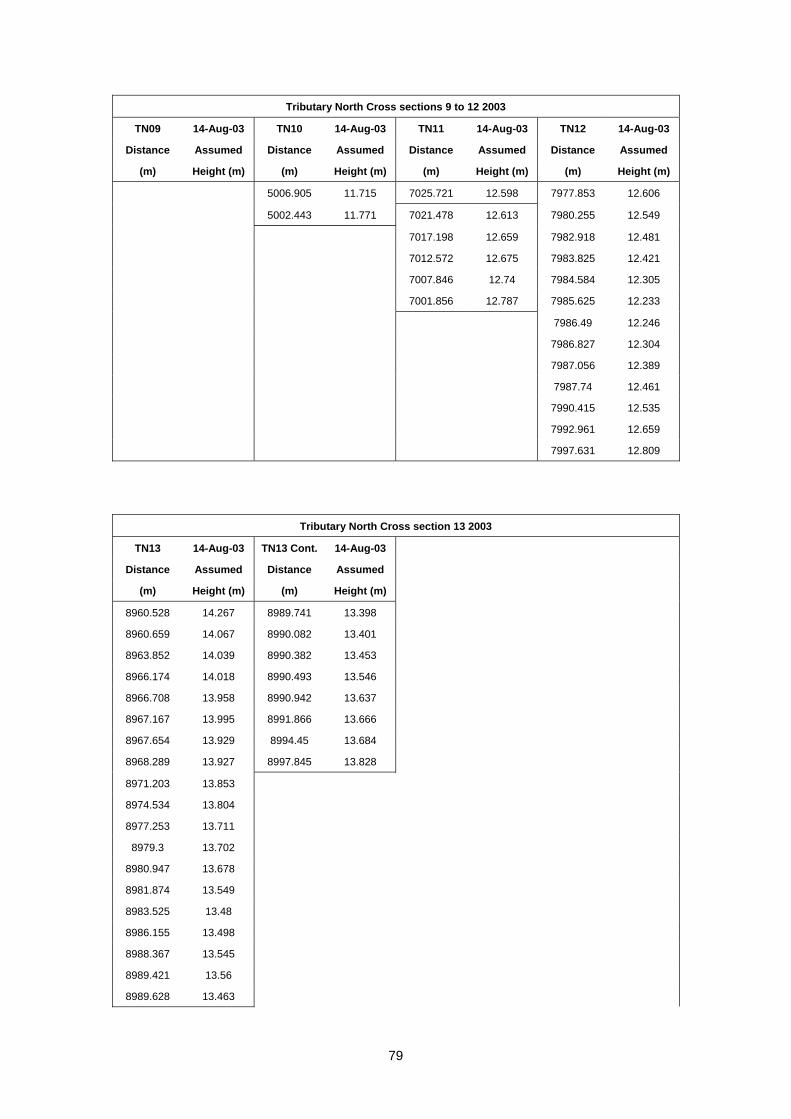
79
Tributary North Cross sections 9 to 12 2003
TN09 14-Aug-03 TN10 14-Aug-03 TN11 14-Aug-03 TN12 14-Aug-03
Distance Assumed Distance Assumed Distance Assumed Distance Assumed
(m) Height (m) (m) Height (m) (m) Height (m) (m) Height (m)
5006.905 11.715 7025.721 12.598 7977.853 12.606
5002.443 11.771 7021.478 12.613 7980.255 12.549
7017.198 12.659 7982.918 12.481
7012.572 12.675 7983.825 12.421
7007.846 12.74 7984.584 12.305
7001.856 12.787 7985.625 12.233
7986.49 12.246
7986.827 12.304
7987.056 12.389
7987.74 12.461
7990.415 12.535
7992.961 12.659
7997.631 12.809
Tributary North Cross section 13 2003
TN13 14-Aug-03 TN13 Cont. 14-Aug-03
Distance Assumed Distance Assumed
(m) Height (m) (m) Height (m)
8960.528 14.267 8989.741 13.398
8960.659 14.067 8990.082 13.401
8963.852 14.039 8990.382 13.453
8966.174 14.018 8990.493 13.546
8966.708 13.958 8990.942 13.637
8967.167 13.995 8991.866 13.666
8967.654 13.929 8994.45 13.684
8968.289 13.927 8997.845 13.828
8971.203 13.853
8974.534 13.804
8977.253 13.711
8979.3 13.702
8980.947 13.678
8981.874 13.549
8983.525 13.48
8986.155 13.498
8988.367 13.545
8989.421 13.56
8989.628 13.463

80
Tributary Central Cross sections 1-4 2003
TC01 14-Aug-03 TC02 14-Aug-03 TC03 14-Aug-03 TC04 14-Aug-03
Distance Assumed Distance Assumed Distance Assumed Distance Assumed
(m) Height (m) (m) Height (m) (m) Height (m) (m) Height (m)
4962.502 11.239 1980.551 11.08 5962.26 12.281 6956.901 12.217
4962.687 11.06 1980.685 10.946 5962.409 12.109 6957.072 12.056
4964.058 11.085 1982.442 10.954 5965.358 12.106 6960.852 11.994
4965.082 11.224 1983.711 10.929 5968.103 11.991 6965.25 11.947
4965.841 11.085 1985.061 10.999 5970.959 11.906 6969.63 11.86
4967.894 10.948 1986.326 10.997 5973.716 11.927 6973.771 11.817
4970.671 10.85 1987.686 10.988 5976.536 12.015 6977.402 11.818
4973.586 10.802 1988.261 11.048 5979.273 12.074 6978.652 11.831
4975.524 10.839 1989.568 11.106 5980.72 12.109 6979.879 11.97
4976.797 10.754 1990.861 11.029 5981.469 12.187 6981.499 11.964
4978.082 10.839 1991.749 11.073 5982.046 12.167 6982.817 12.067
4978.773 10.985 1994.148 10.996 5982.33 12.149 6983.618 12.078
4979.72 11.02 1996.221 10.933 5982.467 11.94 6983.925 12.02
4981.183 11.012 1998.417 10.897 5982.603 11.851 6984.319 11.828
4983.754 11.018 5983.405 11.604 6984.554 11.492
4985.515 11.067 5983.81 11.457 6985.003 11.119
4986.007 11.027 5984.619 11.512 6985.296 10.956
4986.498 10.887 5985.495 11.509 6985.591 10.965
4986.886 10.804 5985.954 11.56 6985.839 10.903
4987.262 10.996 5986.455 11.909 6986.833 10.843
4987.772 11.071 5986.753 12.143 6987.243 10.978
4989.265 11.11 5987.362 12.179 6987.735 11.135
4989.973 11.157 5988.872 12.125 6988.015 11.421
4990.681 11.199 5990.988 12.025 6988.292 11.62
4991.154 11.18 5993.167 11.963 6988.44 11.938
4991.306 11.067 5994.764 11.972 6988.655 12.059
4991.333 10.686 5996.51 11.927 6988.98 12.091
4991.505 10.564 5998.246 11.9 6990.623 11.989
4991.933 10.655 6991.532 11.954
4992.381 10.514 TC01 Cont. 14-Aug-03 6994.241 11.926
4992.865 10.533 Distance Assumed 6998.135 11.822
4993.304 10.566 (m) Height (m)
4993.546 10.547 4995.014 10.962
4993.67 10.501 4995.311 11.162
4993.951 10.499 4995.45 11.163
4994.257 10.579 4995.761 10.999
4994.507 10.736 4996.832 11.067
4994.677 10.871 4997.99 10.982

81
Tributary Central Cross sections 5-6C 2003
TC05 14-Aug-03 TC06A 14-Aug-03 TC06B 14-Aug-03 TC06C 14-Aug-03
Distance Assumed Distance Assumed Distance Assumed Distance Assumed
(m) Height (m) (m) Height (m) (m) Height (m) (m) Height (m)
7942.494 12.589 9031.362 14.453 0.000 14.189 0.000 13.648
7942.491 12.59 9031.36 14.452 0.145 13.993 0.134 13.442
7942.623 12.401 9031.218 14.262 2.759 14.022 2.456 13.495
7948.381 12.298 9027.072 14.265 5.367 14.027 4.745 13.609
7953.031 12.209 9023.188 14.26 8.202 14.069 7.093 13.694
7957.862 12.121 9019.76 14.23 9.751 14.056 9.512 13.819
7961.882 11.99 9017.404 14.175 10.259 14.056 10.833 13.854
7963.379 11.912 9017.079 14.08 10.571 13.887 11.822 13.895
7964.155 11.911 9017.012 13.457 10.643 13 12.060 13.821
7965.465 11.948 9016.511 13.205 10.873 12.759 12.249 13.52
7967.214 12.037 9016.374 12.832 11.233 12.608 12.579 13.274
7968.044 12.051 9016.219 12.773 11.736 12.733 12.760 13.195
7968.297 11.965 9015.868 12.55 12.179 12.877 13.072 13.083
7968.354 11.692 9015.37 12.567 12.484 12.916 13.653 12.485
7968.502 11.541 9014.321 12.756 13.585 12.911 13.920 12.402
7968.827 11.492 9013.59 12.846 14.233 12.941 14.238 12.499
7969.049 11.313 9012.288 13.027 14.786 13.005 15.040 12.836
7969.224 11.091 9011.717 13.13 15.254 13.146 15.317 12.897
7969.611 10.854 9011.052 13.255 16.049 13.19 16.589 13.03
7969.907 10.818 9010.448 13.287 17.582 13.458 17.182 13.133
7970.834 10.859 9009.886 13.274 18.384 13.578 18.686 13.175
7971.937 10.853 9009.522 13.424 19.575 13.549 19.540 13.238
7972.267 10.892 9009.028 13.504 19.984 13.466 19.908 13.361
7972.409 10.992 9007.594 13.535 20.512 13.447 20.562 13.433
7972.464 11.189 9006.717 13.618 21.626 13.546 20.791 13.428
7972.883 11.247 9005.876 13.606 23.076 13.577 21.110 13.36
7973.136 11.48 9005.374 13.528 24.346 13.562 22.664 13.389
7973.4 11.608 9003.997 13.646 26.064 13.624 23.744 13.355
7973.523 11.874 9001.856 13.753 28.287 13.727 24.283 13.437
7973.99 12.026 25.287 13.469
7974.52 12.135 TC05 Cont. 14-Aug-03 27.606 13.5
7976.724 12.111 Distance Assumed 28.882 13.587
7979.033 12.006 (m) Height (m) 30.926 13.716
7981.034 11.975 7986.245 11.99 32.445 13.759
7982.218 11.868 7987.528 11.999
7983.015 11.79 7991.197 11.938
7984.332 11.762 7994.42 11.881
7984.956 11.783 7998.096 11.821

82
Tributary Central Cross sections 7A-8 2003
TC07A 14-Aug-03 TC07B 14-Aug-03 TC07C 14-Aug-03 TC08 14-Aug-03
Distance Assumed Distance Assumed Distance Assumed Distance Assumed
(m) Height (m) (m) Height (m) (m) Height (m) (m) Height (m)
1032.999 13.268 0.000 12.965 0.000 13.002 5976.094 12.76
1032.86 13.084 0.139 12.785 0.131 12.814 5976.247 12.559
1030.74 13.143 2.313 12.894 3.336 12.827 5977.667 12.537
1029.512 13.182 3.923 12.959 6.834 12.843 5978.931 12.593
1027.453 13.224 5.698 12.996 9.981 12.87 5979.853 12.568
1025.26 13.265 7.126 13.013 12.690 12.891 5981.278 12.418
1023.687 13.254 7.938 13.044 15.269 12.908 5981.573 12.356
1023.649 12.359 8.312 12.996 16.188 12.891 5981.93 12.248
1023.493 12.132 8.378 12.155 16.479 12.836 5982.508 12.012
1022.676 11.611 8.576 11.985 16.577 12.292 5983.495 11.68
1022.467 11.594 8.966 11.589 16.720 12.036 5984.019 11.434
1022.399 11.5 9.464 11.386 17.177 11.612 5984.259 11.28
1021.312 11.441 9.781 11.406 17.560 11.424 5984.678 10.967
1020.903 11.478 10.005 11.332 18.102 11.209 5984.836 10.866
1020.282 11.478 10.361 11.191 18.478 10.977 5985.205 10.8
1019.127 11.362 10.795 11.296 18.918 10.989 5985.555 10.807
1018.335 11.365 11.409 11.404 19.485 10.928 5986.148 10.912
1017.619 11.457 12.431 11.463 19.921 11.083 5986.456 10.937
1017.148 11.556 13.842 11.669 20.183 11.485 5986.887 11.114
1016.268 11.695 14.108 11.783 20.346 11.855 5987.484 11.379
1015.939 11.798 14.852 11.863 21.222 11.951 5987.971 11.705
1015.547 11.757 15.465 11.872 21.962 12.004 5988.484 11.909
1015.178 11.787 16.381 12.045 22.896 12.191 5989.06 12.153
1014.912 11.759 17.618 12.216 24.145 12.39 5989.33 12.366
1013.89 11.904 18.830 12.284 25.171 12.516 5990.441 12.594
1013.543 11.964 20.624 12.349 26.155 12.507 5991.573 12.711
1013.207 12.124 21.209 12.457 27.572 12.595 5993.812 12.756
1012.295 12.208 21.610 12.548 29.850 12.655 5995.958 12.844
1010.544 12.148 22.195 12.582 5998.291 12.821
1009.513 12.202 22.743 12.568
1008.29 12.291 23.101 12.451
1007.714 12.471 24.922 12.508
1005.6 12.526 25.984 12.582
1004.992 12.491 28.157 12.657
1004.424 12.477
1003.304 12.557
1001.479 12.663
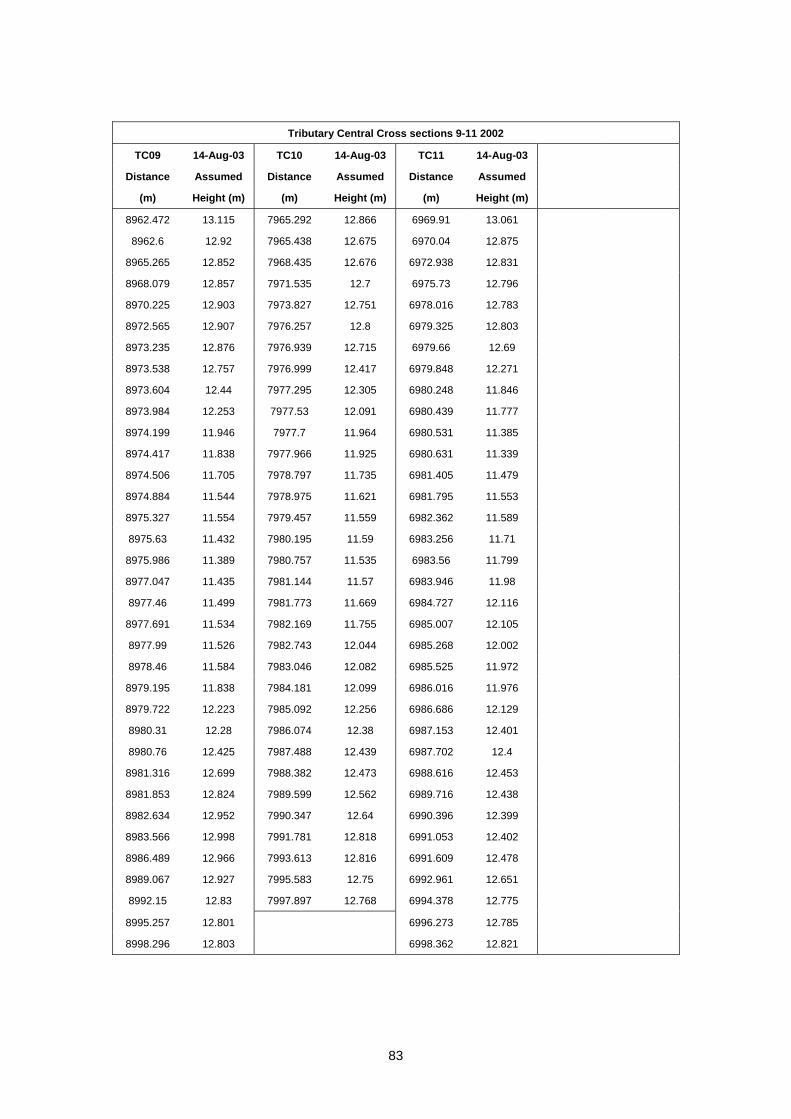
83
Tributary Central Cross sections 9-11 2002
TC09 14-Aug-03 TC10 14-Aug-03 TC11 14-Aug-03
Distance Assumed Distance Assumed Distance Assumed
(m) Height (m) (m) Height (m) (m) Height (m)
8962.472 13.115 7965.292 12.866 6969.91 13.061
8962.6 12.92 7965.438 12.675 6970.04 12.875
8965.265 12.852 7968.435 12.676 6972.938 12.831
8968.079 12.857 7971.535 12.7 6975.73 12.796
8970.225 12.903 7973.827 12.751 6978.016 12.783
8972.565 12.907 7976.257 12.8 6979.325 12.803
8973.235 12.876 7976.939 12.715 6979.66 12.69
8973.538 12.757 7976.999 12.417 6979.848 12.271
8973.604 12.44 7977.295 12.305 6980.248 11.846
8973.984 12.253 7977.53 12.091 6980.439 11.777
8974.199 11.946 7977.7 11.964 6980.531 11.385
8974.417 11.838 7977.966 11.925 6980.631 11.339
8974.506 11.705 7978.797 11.735 6981.405 11.479
8974.884 11.544 7978.975 11.621 6981.795 11.553
8975.327 11.554 7979.457 11.559 6982.362 11.589
8975.63 11.432 7980.195 11.59 6983.256 11.71
8975.986 11.389 7980.757 11.535 6983.56 11.799
8977.047 11.435 7981.144 11.57 6983.946 11.98
8977.46 11.499 7981.773 11.669 6984.727 12.116
8977.691 11.534 7982.169 11.755 6985.007 12.105
8977.99 11.526 7982.743 12.044 6985.268 12.002
8978.46 11.584 7983.046 12.082 6985.525 11.972
8979.195 11.838 7984.181 12.099 6986.016 11.976
8979.722 12.223 7985.092 12.256 6986.686 12.129
8980.31 12.28 7986.074 12.38 6987.153 12.401
8980.76 12.425 7987.488 12.439 6987.702 12.4
8981.316 12.699 7988.382 12.473 6988.616 12.453
8981.853 12.824 7989.599 12.562 6989.716 12.438
8982.634 12.952 7990.347 12.64 6990.396 12.399
8983.566 12.998 7991.781 12.818 6991.053 12.402
8986.489 12.966 7993.613 12.816 6991.609 12.478
8989.067 12.927 7995.583 12.75 6992.961 12.651
8992.15 12.83 7997.897 12.768 6994.378 12.775
8995.257 12.801 6996.273 12.785
8998.296 12.803 6998.362 12.821

84
East Tributary Cross sections 1 to 4- 2003
ET01 14-Aug-03 ET02 14-Aug-03 ET03 14-Aug-03 ET04 14-Aug-03
Distance Assumed Distance Assumed Distance Assumed Distance Assumed
(m) Height (m) (m) Height (m) (m) Height (m) (m) Height (m)
975.705 14.89 1971.688 14.905 2976.624 14.954 3974.118 14.901
975.709 14.89 1971.848 14.7 2976.755 14.954 3974.258 14.701
975.841 14.686 1974.098 14.726 2979.234 14.772 3976.671 14.738
977.456 14.697 1975.869 14.731 2981.484 14.791 3978.973 14.803
978.593 14.686 1976.774 14.716 2983.776 14.847 3980.697 14.841
979.199 14.691 1977.251 14.511 2984.637 14.885 3982.058 14.913
980.114 14.776 1977.346 14.371 2985.219 14.894 3983.22 14.907
980.95 14.853 1977.835 14.151 2985.657 14.761 3983.473 14.845
981.861 14.84 1978.227 14.075 2985.955 14.703 3984.078 14.445
982.145 14.802 1978.323 13.828 2986.127 14.54 3984.292 14.36
982.406 14.69 1978.538 13.773 2986.309 14.307 3984.453 14.343
982.943 14.525 1978.846 13.775 2986.419 14.279 3984.572 14.354
983.292 14.131 1979.255 13.609 2986.662 14.398 3984.722 14.275
983.633 13.64 1979.703 13.562 2986.673 14.323 3984.781 13.673
984.193 13.411 1980.369 13.43 2986.909 14.118 3985.118 13.509
984.428 13.26 1980.878 13.197 2987.061 14.052 3985.594 13.414
984.954 13.225 1980.944 13.127 2987.215 13.934 3985.832 13.379
985.637 13.265 1981.221 13.082 2987.495 13.699 3986.236 13.355
986.482 13.209 1981.476 12.939 2987.723 13.549 3986.79 13.288
987.153 13.152 1981.661 12.978 2987.899 13.51 3987.472 13.373
987.884 13.253 1982.307 13.217 2988.39 13.403 3988.051 13.462
988.231 13.285 1982.65 13.173 2989.114 13.236 3988.497 13.388
988.381 13.252 1982.875 13.224 2989.503 13.142 3988.679 13.393
988.557 13.5 1983.259 13.211 2989.859 13.228 3988.903 13.315
988.821 13.558 1983.631 13.117 2990.294 13.265 3989.453 13.633
988.961 13.875 1984.001 13.085 2990.731 13.346 3989.617 13.726
989.471 14.056 1984.411 12.935 2991.44 13.39 3989.727 13.891
989.937 14.28 1984.875 12.853 2991.557 13.373 3989.958 14.051
990.341 14.542 1985.376 12.891 2991.98 13.48 3990.503 14.497
990.73 14.683 1985.701 13.097 2992.342 13.617 3990.765 14.62
991.398 14.752 1986.041 13.148 2992.589 13.74 3991.391 14.721
993.017 14.735 1986.114 13.425 2992.854 14.091 3991.99 14.777
995.524 14.785 1986.384 13.553 2993.412 14.274 3992.488 14.909
998.202 14.833 1986.784 14.101 2993.874 14.725 3993.45 14.91
1986.901 14.552 2994.651 14.903 3995.357 14.891
1987.188 14.801 2996.158 14.932 3996.449 14.845
1987.542 14.858 2998.447 14.884 3998.667 14.864
1989.115 14.859

85
East Tributary Cross sections 1 to 4- 2003
ET01 14-Aug-03 ET02 14-Aug-03 ET03 14-Aug-03 ET04 14-Aug-03
Distance Assumed Distance Assumed Distance Assumed Distance Assumed
(m) Height (m) (m) Height (m) (m) Height (m) (m) Height (m)
1990.073 14.826
1991.64 14.842
1993.692 14.815
1996.327 14.84
1998.161 14.824

86
East Tributary Cross sections 5 to 8 2003
ET05 14-Aug-03 ET06 14-Aug-03 ET07 14-Aug-03 ET08 14-Aug-03
Distance Assumed Distance Assumed Distance Assumed Distance Assumed
(m) Height (m) (m) Height (m) (m) Height (m) (m) Height (m)
1984.997 9.937 5968.559 14.871 7471.183 14.885 0.117184 14.372
1985.125 9.717 5968.687 14.696 7471.313 14.729 2.746834 14.503
1986.417 9.746 5970.921 14.761 7474.166 14.742 4.378736 14.564
1987.403 9.774 5973.106 14.806 7475.706 14.763 5.712472 14.664
1987.782 9.74 5975.072 14.782 7477.574 14.765 7.978096 14.713
1988.208 9.589 5977.638 14.829 7479.681 14.781 9.531745 14.785
1988.405 9.41 5979.865 14.869 7481.632 14.859 11.50584 14.871
1988.771 9.28 5981.21 14.869 7483.342 14.89 13.6243 14.904
1988.98 9.09 5981.799 14.803 7484.266 14.897 15.14305 14.915
1989.263 9.003 5981.903 14.761 7484.524 14.586 15.98296 14.895
1989.46 8.793 5982.053 14.644 7484.631 14.219 16.50308 14.828
1989.649 8.665 5982.344 14.584 7484.832 13.972 16.83856 14.712
1989.766 8.382 5982.539 14.375 7485.297 13.679 17.18264 14.51
1990.022 8.251 5982.824 14.291 7485.823 13.487 17.50023 14.315
1990.28 8.081 5983.342 14.253 7486.636 13.5 17.72644 14.179
1990.834 8.18 5983.493 14.351 7486.936 13.502 17.95414 13.928
1991.605 8.258 5983.688 14.039 7487.679 13.41 18.30254 13.802
1992.624 8.306 5983.805 13.976 7488.237 13.389 18.41417 13.495
1993.23 8.285 5984.097 13.976 7488.934 13.48 18.77083 13.338
1993.335 8.238 5984.176 13.987 7489.609 13.541 19.04331 13.22
1993.599 8.264 5984.393 13.544 7489.921 13.484 19.62111 13.224
1993.999 8.368 5984.529 13.382 7490.25 13.556 20.25355 13.306
1994.401 8.58 5984.863 13.276 7490.335 14.027 21.31305 13.421
1994.585 8.795 5985.126 13.262 7490.51 14.068 21.9823 13.477
1994.776 9.208 5985.418 13.111 7490.57 13.956 22.41033 13.392
1994.949 9.337 5985.656 13.125 7490.913 13.91 22.81853 13.463
1995.449 9.505 5986.1 13.317 7491.089 14.214 23.38631 13.486
1995.694 9.592 5986.715 13.482 7491.366 14.199 23.83921 13.566
1996.87 9.694 5986.934 13.518 7491.766 14.22 24.52132 13.671
1998.567 9.74 5987.917 13.51 7492.339 14.393 25.26962 13.754
5988.322 13.605 7492.983 14.555 25.67617 13.802
5988.646 13.67 7493.355 14.705 26.03519 13.943
5988.943 13.831 7493.642 14.853 26.26023 14.043
5989.186 14.043 7494.845 14.907 26.61083 14.128
5989.375 14.295 7497.697 14.858 27.28089 14.323
5989.757 14.52 27.74826 14.394
5990.019 14.647 28.24797 14.378
5990.797 14.789 28.72519 14.45
5991.05 14.836 29.08266 14.578

87
East Tributary Cross sections 5 to 8 2003
ET05 14-Aug-03 ET06 14-Aug-03 ET07 14-Aug-03 ET08 14-Aug-03
Distance Assumed Distance Assumed Distance Assumed Distance Assumed
(m) Height (m) (m) Height (m) (m) Height (m) (m) Height (m)
5992.63 14.869 29.75841 14.71
5993.903 14.862 29.99871 14.831
5994.915 14.895 31.16328 14.87
5996.268 14.866 33.7794 14.833
5998.088 14.877

88
Upper Swift Creek cross sections 1 to GW 2003
UM01 14-Aug-03 UM02 14-Aug-03 UM03 14-Aug-03 UMGW 14-Aug-03
Distance Assumed Distance Assumed Distance Assumed Distance Assumed
(m) Height (m) (m) Height (m) (m) Height (m) (m) Height (m)
2042.9 9.987 2038.574 9.884 2029.567 9.722 2020.153 9.644
2042.903 9.987 2038.427 9.689 2029.566 9.722 2020.151 9.644
2042.813 9.784 2035.862 9.588 2029.405 9.543 2020.047 9.463
2042.566 9.833 2035.011 9.562 2028.952 9.527 2019.209 9.456
2042.023 9.75 2034.431 9.604 2028.028 9.579 2018.428 9.404
2041.124 9.662 2033.696 9.508 2026.643 9.565 2017.623 9.42
2038.218 9.593 2032.531 9.51 2025.939 9.571 2017.414 9.373
2036.548 9.559 2031.746 9.581 2025.74 9.526 2016.829 9.43
2035.823 9.578 2031.073 9.552 2025.452 9.567 2016.329 9.373
2035.57 9.619 2030.485 9.529 2024.576 9.523 2016.016 9.276
2035.255 9.554 2029.542 9.566 2024.292 9.549 2015.824 9.159
2034.749 9.546 2028.551 9.5 2023.789 9.507 2015.672 9.113
2034.518 9.56 2028.274 9.524 2023.402 9.553 2015.421 8.91
2034.072 9.533 2027.747 9.63 2022.714 9.609 2015.223 8.795
2033.013 9.535 2026.715 9.587 2022.389 9.533 2015.162 8.529
2032.618 9.505 2026.385 9.58 2020.942 9.456 2015.057 8.441
2032.234 9.51 2026.228 9.665 2020.361 9.494 2015.018 8.117
2031.879 9.569 2026.078 9.558 2020.041 9.44 2014.722 8.092
2031.149 9.489 2024.646 9.485 2019.119 9.47 2014.503 8.105
2030.521 9.553 2023.979 9.509 2018.72 9.428 2014.113 8.053
2030.005 9.535 2023.296 9.486 2018.009 9.482 2012.57 7.983
2029.721 9.57 2022.334 9.486 2016.219 9.362 2011.533 7.945
2029.324 9.498 2021.538 9.447 2015.351 9.374 2010.893 7.965
2028.159 9.468 2021.216 9.353 2014.939 9.294 2010.394 7.939
2026.71 9.516 2020.993 9.181 2014.816 9.189 2009.615 8.006
2025.396 9.404 2020.607 9.006 2014.621 9.132 2009.101 8.055
2024.227 9.367 2020.282 8.922 2014.133 9.123 2008.813 8.085
2023.371 9.403 2019.837 8.695 2013.984 9.184 2008.687 8.369
2022.365 9.517 2019.69 8.668 2013.855 9.074 2008.626 8.334
2022.096 9.458 2019.668 8.143 2013.626 9.073 2008.472 8.327
2021.54 9.205 2019.376 7.991 2013.506 9.105 2008.356 8.633
2021.362 9.079 2017.963 7.998 2013.237 8.999 2008.068 8.733
2020.499 8.853 2016.675 8.065 2013.198 8.697 2007.88 8.823
2020.391 8.872 2015.862 8.084 2013.127 8.578 2007.601 8.953
2020.287 8.65 2015.357 8.129 2012.887 8.567 2007.512 9.093
2020.091 8.485 2014.893 7.944 2012.691 8.465 2007.211 9.252
2019.789 8.432 2014.724 7.955 2012.672 8.033 2006.885 9.379
2019.703 8.31 2014.447 8.096 2012.327 7.962 2006.365 9.517
2019.132 8.149 2013.955 8.385 2011.723 7.993 2005.349 9.616

89
Upper Swift Creek cross sections 1 to GW 2003
UM01 14-Aug-03 UM02 14-Aug-03 UM03 14-Aug-03 UMGW 14-Aug-03
Distance Assumed Distance Assumed Distance Assumed Distance Assumed
(m) Height (m) (m) Height (m) (m) Height (m) (m) Height (m)
2018.152 7.991 2013.501 8.475 2011.374 8.018 2004.269 9.721
2017.85 7.782 2013.121 8.622 2009.995 7.959 2002.358 9.787
2017.369 7.813 2012.349 9.01 2009.398 7.969
2017.007 7.844 2012.074 9.113 2008.711 7.984
2016.676 7.857 2011.569 9.42 2008.263 7.925
2016.023 7.958 2011.02 9.592 2008.201 8.094
2015.588 7.985 2010.478 9.7 2007.99 8.164
2015.126 7.938 2010.067 9.761 2007.873 7.986
2014.729 7.886 2009.476 9.823 2007.514 8.055
2014.444 7.958 2008.613 9.756 2007.216 8.201
2014.016 8.103 2007.865 9.78 2006.965 8.395
2013.448 8.306 2007.252 9.843 2006.762 8.793
2013.413 8.5 2005.586 9.815 2006.559 8.955
2013.323 8.661 2003.333 9.825 2006.397 9.009
2013.097 8.907 2001.469 9.811 2006.217 9.219
2012.884 9.082 2006.046 9.267
2012.51 9.226 2005.747 9.403
2012.132 9.319 2005.292 9.567
2011.152 9.501 2004.643 9.551
2009.974 9.631 2004.123 9.578
2009.261 9.766 2003.156 9.707
2008.673 9.783 2003.056 9.946
2008.143 9.757 2002.846 9.764
2007.612 9.767 2001.467 9.811
2006.905 9.821
2005.071 9.77
2004.306 9.776
2003.669 9.832
2003.281 9.79
2001.721 9.781
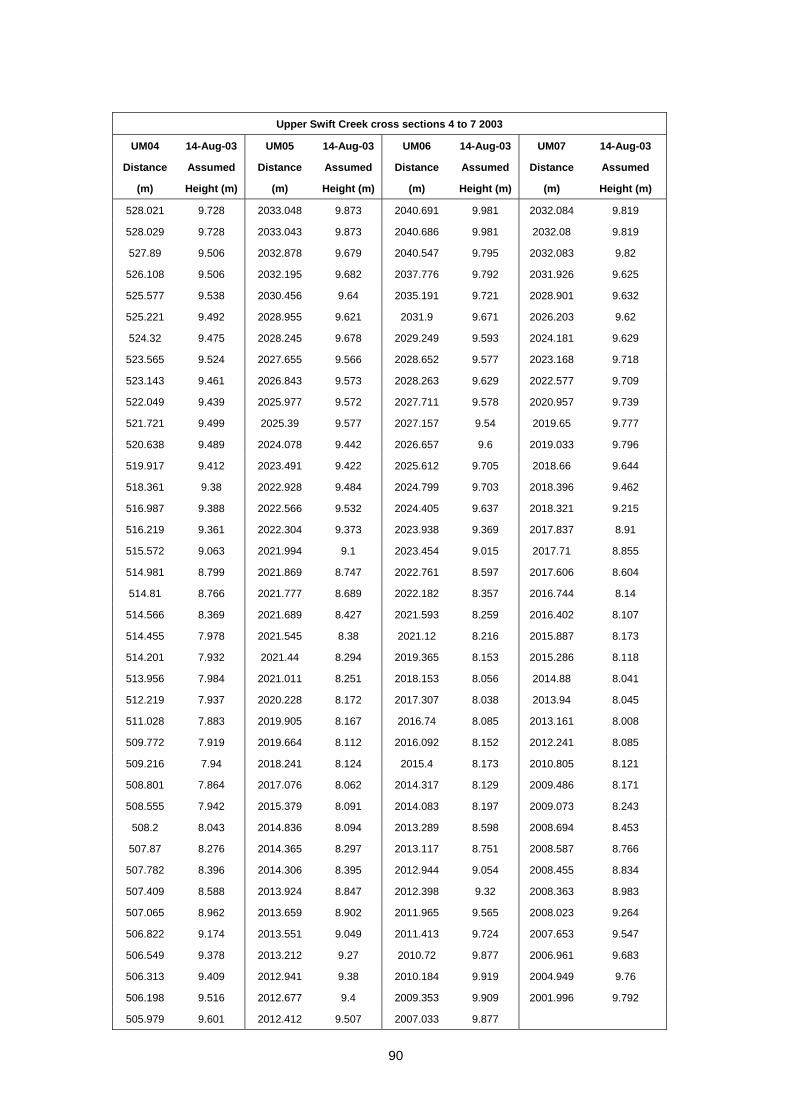
90
Upper Swift Creek cross sections 4 to 7 2003
UM04 14-Aug-03 UM05 14-Aug-03 UM06 14-Aug-03 UM07 14-Aug-03
Distance Assumed Distance Assumed Distance Assumed Distance Assumed
(m) Height (m) (m) Height (m) (m) Height (m) (m) Height (m)
528.021 9.728 2033.048 9.873 2040.691 9.981 2032.084 9.819
528.029 9.728 2033.043 9.873 2040.686 9.981 2032.08 9.819
527.89 9.506 2032.878 9.679 2040.547 9.795 2032.083 9.82
526.108 9.506 2032.195 9.682 2037.776 9.792 2031.926 9.625
525.577 9.538 2030.456 9.64 2035.191 9.721 2028.901 9.632
525.221 9.492 2028.955 9.621 2031.9 9.671 2026.203 9.62
524.32 9.475 2028.245 9.678 2029.249 9.593 2024.181 9.629
523.565 9.524 2027.655 9.566 2028.652 9.577 2023.168 9.718
523.143 9.461 2026.843 9.573 2028.263 9.629 2022.577 9.709
522.049 9.439 2025.977 9.572 2027.711 9.578 2020.957 9.739
521.721 9.499 2025.39 9.577 2027.157 9.54 2019.65 9.777
520.638 9.489 2024.078 9.442 2026.657 9.6 2019.033 9.796
519.917 9.412 2023.491 9.422 2025.612 9.705 2018.66 9.644
518.361 9.38 2022.928 9.484 2024.799 9.703 2018.396 9.462
516.987 9.388 2022.566 9.532 2024.405 9.637 2018.321 9.215
516.219 9.361 2022.304 9.373 2023.938 9.369 2017.837 8.91
515.572 9.063 2021.994 9.1 2023.454 9.015 2017.71 8.855
514.981 8.799 2021.869 8.747 2022.761 8.597 2017.606 8.604
514.81 8.766 2021.777 8.689 2022.182 8.357 2016.744 8.14
514.566 8.369 2021.689 8.427 2021.593 8.259 2016.402 8.107
514.455 7.978 2021.545 8.38 2021.12 8.216 2015.887 8.173
514.201 7.932 2021.44 8.294 2019.365 8.153 2015.286 8.118
513.956 7.984 2021.011 8.251 2018.153 8.056 2014.88 8.041
512.219 7.937 2020.228 8.172 2017.307 8.038 2013.94 8.045
511.028 7.883 2019.905 8.167 2016.74 8.085 2013.161 8.008
509.772 7.919 2019.664 8.112 2016.092 8.152 2012.241 8.085
509.216 7.94 2018.241 8.124 2015.4 8.173 2010.805 8.121
508.801 7.864 2017.076 8.062 2014.317 8.129 2009.486 8.171
508.555 7.942 2015.379 8.091 2014.083 8.197 2009.073 8.243
508.2 8.043 2014.836 8.094 2013.289 8.598 2008.694 8.453
507.87 8.276 2014.365 8.297 2013.117 8.751 2008.587 8.766
507.782 8.396 2014.306 8.395 2012.944 9.054 2008.455 8.834
507.409 8.588 2013.924 8.847 2012.398 9.32 2008.363 8.983
507.065 8.962 2013.659 8.902 2011.965 9.565 2008.023 9.264
506.822 9.174 2013.551 9.049 2011.413 9.724 2007.653 9.547
506.549 9.378 2013.212 9.27 2010.72 9.877 2006.961 9.683
506.313 9.409 2012.941 9.38 2010.184 9.919 2004.949 9.76
506.198 9.516 2012.677 9.4 2009.353 9.909 2001.996 9.792
505.979 9.601 2012.412 9.507 2007.033 9.877
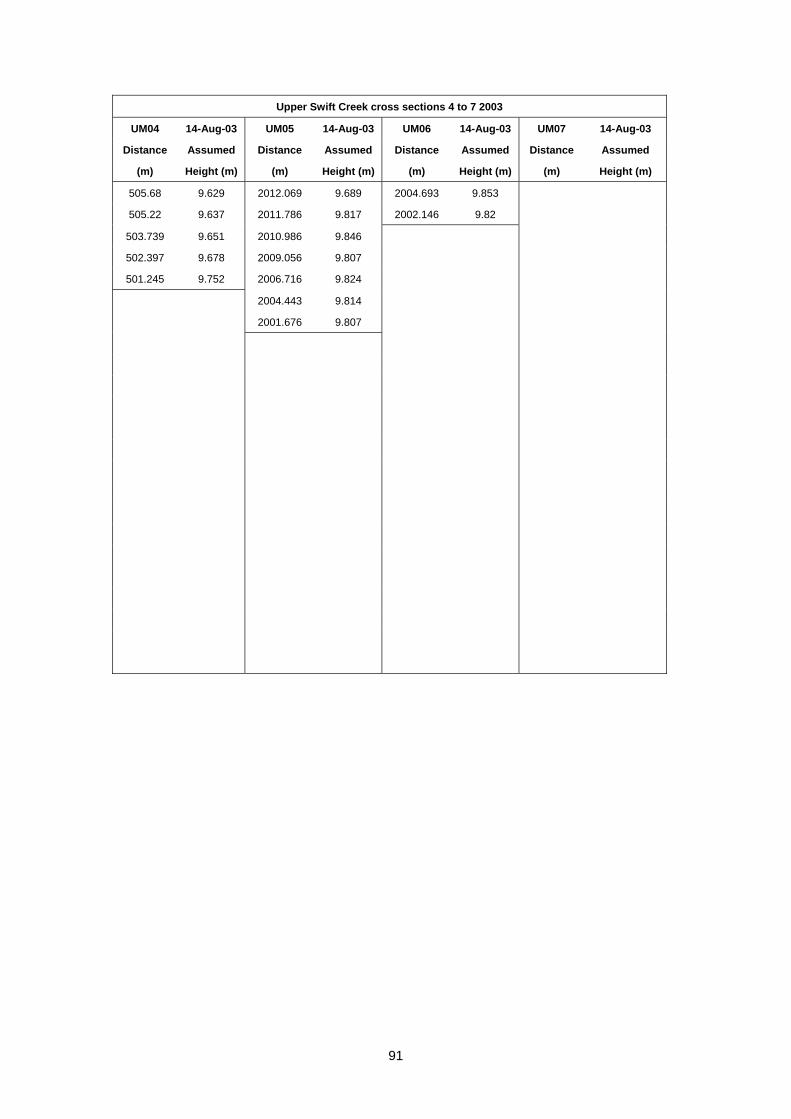
91
Upper Swift Creek cross sections 4 to 7 2003
UM04 14-Aug-03 UM05 14-Aug-03 UM06 14-Aug-03 UM07 14-Aug-03
Distance Assumed Distance Assumed Distance Assumed Distance Assumed
(m) Height (m) (m) Height (m) (m) Height (m) (m) Height (m)
505.68 9.629 2012.069 9.689 2004.693 9.853
505.22 9.637 2011.786 9.817 2002.146 9.82
503.739 9.651 2010.986 9.846
502.397 9.678 2009.056 9.807
501.245 9.752 2006.716 9.824
2004.443 9.814
2001.676 9.807

92
Swift Creek Cross sections 1 to 4 2003
SM01 14-Aug-03 SM02 14-Aug-03 SM03 14-Aug-03 SM04 14-Aug-03
Distance Assumed Distance Assumed Distance Assumed Distance Assumed
(m) Height (m) (m) Height (m) (m) Height (m) (m) Height (m)
462.587 9.051 2037.797 7.992 2040.628 8.042 2033.244 7.958
462.588 9.051 2037.805 7.994 2040.632 8.042 2033.067 7.77
462.723 8.85 2037.668 7.854 2040.492 7.911 2030.428 7.801
464.475 8.802 2034.742 7.878 2037.255 7.902 2027.48 7.908
466.337 8.768 2032.076 7.932 2034.454 7.857 2026.078 7.933
467.784 8.794 2029.664 7.913 2032.928 7.822 2025.003 7.958
468.868 8.665 2029.189 7.847 2031.292 7.543 2024.663 7.864
469.792 8.576 2028.192 7.662 2030.423 7.36 2024.46 7.634
471.039 8.573 2027.123 7.516 2029.722 7.049 2024.162 7.52
471.545 8.588 2026.666 7.425 2027.762 6.893 2023.996 7.294
472.197 8.425 2025.8 7.159 2026.243 6.784 2023.671 7.063
472.553 8.309 2024.988 6.833 2025.418 6.583 2023.265 6.965
473.48 8.133 2024.807 6.69 2023.448 6.315 2023.031 6.973
473.928 7.933 2023.283 6.512 2021.166 6.202 2022.815 6.525
474.611 7.537 2022.245 6.443 2019.744 6.096 2022.69 6.44
474.826 7.368 2021.67 6.312 2018.619 5.981 2022.463 6.063
475.321 7.248 2020.687 6.263 2018.213 6.124 2022.092 6.127
476.128 7.28 2019.526 6.191 2017.89 6.429 2021.849 6.108
476.555 7.189 2018.881 6.278 2017.256 6.67 2019.925 6.175
478.117 7.162 2017.745 6.353 2016.566 6.787 2018.673 6.186
479.903 7.091 2017.226 6.2 2015.406 6.842 2018.377 6.249
480.165 7.206 2016.422 5.99 2014.829 6.756 2017.103 6.356
480.578 7.515 2015.624 6.001 2014.367 6.872 2015.884 6.364
481.269 7.734 2014.743 6.093 2013.958 7.191 2014.798 6.287
482.085 8.17 2014.137 6.247 2012.787 7.494 2014.27 6.281
483.041 8.627 2013.62 6.487 2010.824 7.608 2014.004 6.328
483.941 9.003 2013.409 6.663 2009.143 7.49 2013.691 6.518
486.435 9.006 2012.923 6.626 2006.634 7.51 2013.41 6.695
488.871 8.966 2011.612 6.625 2004.364 7.605 2013.321 6.849
491.691 8.9 2010.617 6.822 2001.593 7.734 2013.195 6.905
494.448 8.878 2009.456 6.985 2013.006 7.076
495.644 8.87 2007.704 7.385 2012.923 7.22
497.828 8.829 2006.172 7.577 2012.438 7.392
2005.028 7.691 2011.442 7.489
2001.736 7.78 2009.793 7.613
2007.434 7.753
2004.678 7.802
2001.741 7.799

93
Swift Creek Cross sections 5 to 8 2003
SM05 14-Aug-03 SM06 14-Aug-03 SM07 14-Aug-03 SM08 14-Aug-03
Distance Assumed Distance Assumed Distance Assumed Distance Assumed
(m) Height (m) (m) Height (m) (m) Height (m) (m) Height (m)
2082.678 7.995 2047.848 7.767 2060.654 7.725 2052.945 7.849
2082.672 7.995 2047.723 7.593 2060.65 7.725 2052.944 7.851
2082.532 7.82 2044.867 7.606 2060.514 7.526 2052.803 7.663
2079.674 7.773 2041.118 7.636 2057.432 7.582 2048.84 7.681
2076.994 7.822 2039.042 7.664 2054.276 7.681 2044.849 7.694
2074.608 7.908 2036.46 7.703 2051.089 7.68 2041.867 7.702
2071.589 7.952 2033.699 7.738 2048.238 7.719 2040.802 7.743
2070.398 7.949 2031.859 7.701 2046.115 7.774 2039.157 7.778
2069.761 7.835 2030.913 7.599 2044.214 7.842 2037.935 7.739
2069.112 7.517 2030.145 7.349 2042.034 7.898 2037.152 7.618
2068.142 6.942 2029.231 7.03 2040.616 7.856 2036.267 7.625
2067.71 6.66 2028.118 6.454 2040.237 7.698 2035.836 7.671
2067.482 6.244 2027.349 6.032 2040.004 7.5 2035.314 7.568
2067.251 6.199 2027.084 5.987 2039.735 6.958 2034.883 7.365
2067.183 5.849 2026.486 5.946 2039.417 6.878 2034.133 6.93
2066.78 5.945 2025.055 5.997 2039.238 6.703 2033.327 6.401
2066.563 6.033 2023.731 6.066 2038.889 6.56 2032.744 6.308
2065.737 6.186 2022.604 6.077 2038.438 6.189 2031.944 6.256
2064.781 6.196 2021.704 6.146 2038.271 5.862 2030.848 6.222
2063.793 6.139 2020.859 6.153 2037.969 5.731 2029.096 6.255
2062.159 6.162 2020.627 6.364 2036.103 5.956 2027.732 6.231
2059.876 6.197 2020.044 6.612 2035.191 6.091 2026.31 6.084
2058.427 6.188 2019.71 6.78 2033.685 6.245 2024.726 5.89
2058.206 6.267 2018.594 6.978 2032.4 6.266 2023.934 6.029
2057.944 6.478 2017.873 7.173 2031.986 6.326 2023.279 6.351
2055.893 6.865 2017.601 7.272 2031.428 6.218 2022.789 6.633
2054.286 7.146 2017.5 7.34 2030.831 6.225 2022.517 6.888
2052.979 7.253 2015.667 7.608 2030.279 6.43 2021.989 7.165
2052.466 7.425 2014.411 7.779 2029.276 6.515 2021.441 7.269
2052.087 7.367 2013.842 7.689 2028.61 6.697 2020.109 7.308
2050.441 7.696 2011.052 7.732 2028.333 6.738 2019.495 7.456
2047.534 7.704 2008.135 7.707 2027.934 6.979 2018.674 7.71
2044.176 7.748 2005.248 7.729 2027.653 7.348 2018.112 7.866
2039.309 7.708 2001.832 7.799 2027.39 7.486 2016.701 7.9
2035.832 7.682 2026.873 7.596 2014.668 7.872
2032.041 7.601 2026.066 7.693 2012.532 7.751
2028.311 7.502 2025.708 7.782 2010.05 7.722
2026.033 7.375 2024.337 7.829 2006.564 7.725
2025.022 7.326 2022.476 7.783 2003.923 7.753

94
Swift Creek Cross sections 5 to 8 2003
SM05 14-Aug-03 SM06 14-Aug-03 SM07 14-Aug-03 SM08 14-Aug-03
Distance Assumed Distance Assumed Distance Assumed Distance Assumed
(m) Height (m) (m) Height (m) (m) Height (m) (m) Height (m)
2024.287 7.19 2019.949 7.7 2001.698 7.777
2023.072 6.748 2017.074 7.685
2021.879 6.654 2013.037 7.74
2020.179 6.745 2009.049 7.825
2017.002 7.074 2005.798 7.845
2013.841 7.443 2001.997 7.831
2010.242 7.598
2007.023 7.644
2004.593 7.761
2001.722 7.804