table of contents · table of contents chapter 1 introduction 1 1.1 background 1 1.2 biomass...
TRANSCRIPT

University of Alberta
Techno-economic Assessment of Charcoal Production
for Carbon Sequestration
By Jignesh Thakkar
A thesis submitted to the Faculty of Graduate Studies and Research in partial fulfillment of the requirements for the degree of
Master of Science
in
Engineering Management
Department of Mechanical Engineering
©Jignesh Thakkar Spring 2013
Edmonton, Alberta
Permission is hereby granted to the University of Alberta Libraries to reproduce single copies of this thesis and to lend or sell such copies for private, scholarly or scientific research purposes only. Where the thesis is converted to, or otherwise made available in digital form, the University of Alberta will advise potential users of the thesis of these terms.
The author reserves all other publication and other rights in association with the copyright in the thesis and, except as herein before provided, neither the thesis nor any substantial portion thereof may be printed or otherwise reproduced in any material form whatsoever without the author's prior written permission

Abstract
Greenhouse gas (GHG) emission is one of the important environmental issues that
world is facing today. Biomass usage, specifically capturing energy from biomass
that would otherwise decay, is one the of many options available to mitigate the
impact of the buildup of GHG emissions from fossil fuel utilization. This
research investigates the pathway of utilization of agricultural biomass (e.g.
straw) for charcoal production and its landfilling for sequestration of carbon. This
pathway can help in increasing the rate of carbon sequestration. Charcoal is a
solid fuel, which can be produced from agricultural biomass such as wheat and
barley straw. It is an organic solid and can be produced by slow pyrolysis of
straw. This research involves a conceptual techno-economic study to estimate the
cost of production of charcoal from straw in a centralized plant and its storage in a
landfill to sequester carbon. This study draws on actual data to determine the cost
of charcoal production. The cost of production of charcoal from straw in a
centralized system with nutrient replacement cost and its landfilling cost is
$332.2/tonne of charcoal. The life cycle GHG emission for this pathway is 0.372
tonne of CO2/tonne of charcoal produced. Based on the cost of production and
landfilling of charcoal and the GHG emissions in this pathway, the cost of carbon
sequestration is about $129.88/tonne of CO2. This is higher than the biomass
based electricity generation pathway but lower than some estimates of carbon
capture and storage technologies for carbon sequestration.
ACKNOWLEDGEMENT
First and foremost, I would like to thank my supervisor Dr. Amit Kumar for
giving me the wonderful opportunity to work in his group and for all the time
he has invested in guiding me through my research. The experiences I have
gained through these opportunities have helped me grow academically. I
would like to thank Canadian School of Energy and Environment (CSEE) for
their financial support.
I would like to thank my lab mates for their guidance through-out my tenure:
Disela Malinga, Amit, Veena, Arun, and Arifa who taught me a lot about the
work in this lab. I wish them all best of luck in their future endeavors.
I would like to thank my friends for always being there for me: Neha, Akila,
and Aditya.
Finally, I would like to extend sincere gratefulness to my whole family for the
encouragement and especially my wife, Adi for her endless patience and
continuous support.

Table of Contents
CHAPTER 1 INTRODUCTION .................................................................................. 1
1.1 BACKGROUND ...................................................................................................... 1
1.2 BIOMASS FEEDSTOCKS ........................................................................................... 6
1.2.1 WHOLE FOREST AND RESIDUES ..................................................................................... 6
1.2.2 AGRICULTURE RESIDUE ................................................................................................ 7
1.3 STATEMENT OF THE PROBLEM .................................................................................. 8
1.4 OBJECTIVE OF THE STUDY ...................................................................................... 10
1.5 LIMITATIONS OF STUDY ......................................................................................... 11
1.6 ORGANIZATION OF THESIS ..................................................................................... 12
1.7 REFERENCES ...................................................................................................... 13
CHAPTER 2 TECHNO-ECONOMIC ASSESSMENT OF CHARCOAL PRODUCTION ........ 19
2.1 INTRODUCTION................................................................................................... 19
2.2 SCOPE OF RESEARCH AND METHODOLOGY ................................................................ 19
2.3 BIOMASS FEED STOCKS AND ITS AVAILABILITY ............................................................ 23
2.4 CURRENT TECHNOLOGIES FOR CHARCOAL PRODUCTION ............................................... 28
2.4.1 BIO ENERGY LCC (RUSSIA) ......................................................................................... 28
2.4.2 ALTERNA ENERGY INC. (CANADA) ................................................................................ 29
2.4.3 BEST PYROLYSIS INC. (AUSTRALIA) ............................................................................... 29
2.4.4 LAMBIOTTE KILN (BELGIUM). ...................................................................................... 30
2.4.5 GENESIS EQUIPMENT (USA) ....................................................................................... 31
2.4.6 ADAM-RETORT (GERMANY) ....................................................................................... 32
2.4.7 BLACK IS GREEN PTY. LTD (BIG) .................................................................................. 33
2.5 INPUT DATA AND ASSUMPTIONS ............................................................................ 34
2.5.1 BIOMASS COST ......................................................................................................... 35
2.5.2 BIOMASS TRANSPORTATION COSTS .............................................................................. 40
2.5.3 CHARCOAL PRODUCTION COST .................................................................................... 43
2.5.4 PRODUCTION COST FOR BIG CHAR EQUIPMENT ............................................................. 44
2.6 RESULTS FOR CENTRALIZED PRODUCTION OF CHARCOAL ............................................... 47
2.7 SENSITIVITY CASES .............................................................................................. 49
2.7.1 CAPITAL COST CURVE ................................................................................................ 49
2.7.2 EFFECT OF CHARCOAL YIELD ....................................................................................... 49
2.7.3 AUXILIARY COSTS ...................................................................................................... 50
2.7.4 BIOMASS TRANSPORT DISTANCE ................................................................................. 51
2.7.5 OPERATIONAL COST .................................................................................................. 52
2.7.6 SUMMARY OF COST ANALYSIS ..................................................................................... 52
2.8 CHARCOAL PRODUCTION IN A PORTABLE PLANT ......................................................... 53
2.8.1 VARIOUS PORTABLE TECHNOLOGIES FOR CHARCOAL PRODUCTION ............................... 54
2.8.2 INPUT DATA AND ASSUMPTIONS ................................................................................. 56
2.8.3 COST ESTIMATION ..................................................................................................... 58
2.8.4 RESULTS AND DISCUSSION .......................................................................................... 60
2.9 COST OF LANDFILLING OF CHARCOAL ....................................................................... 62
2.9.1 PRODUCTIVITY CALCULATIONS .................................................................................... 63
2.9.2 COST OF CHARCOAL TRANSPORTATION ......................................................................... 65
2.9.3 CHARCOAL PRODUCTION COST WITH LANDFILLING COST .................................................. 66
2.10 CONCLUSION ................................................................................................... 67
2.11 REFERENCES .................................................................................................... 68
CHAPTER 3 LIFE CYCLE ENERGY AND EMISSION ANALYSIS OF CHARCOAL
PRODUCTION FROM BIOMASS AND ITS SEQUESTRATION .......................................... 77
3.1 INTRODUCTION................................................................................................... 77
3.2 METHODOLOGY, SCOPE AND LIMITATIONS ................................................................ 78
3.3 LIFE CYCLE ASSESSMENT FOR PRODUCTION OF CHARCOAL ............................................ 81
3.3.1 GOAL AND SCOPE ..................................................................................................... 82
3.3.2 UNIT PROCESSES ....................................................................................................... 83
3.4 IMPACT ASSESSMENT (CENTRAL PRODUCTION SYSTEM) ............................................... 84
3.4.1 STRAW HARVESTING, COLLECTION AND PROCESSING (UP1) ............................................ 84
3.4.2 STRAW TRANSPORT (UP2) ......................................................................................... 86
3.4.3 PLANT CONSTRUCTION, OPERATION AND COMMISSIONING (UP3) ................................... 87
3.4.4 TRANSPORTATION (UP4) AND LANDFILLING OF CHARCOAL (UP5) .................................... 90
3.5 ENERGY AND EMISSION ANALYSIS ........................................................................... 92

3.5.1 ENERGY RATIO ......................................................................................................... 93
3.6 EMISSION AND ENERGY ANALYSIS OF PORTABLE SYSTEM .............................................. 94
3.6.1 IMPACT ASSESSMENT ................................................................................................ 94
3.6.2 ENERGY AND GHG EMISSION RESULTS FOR PORTABLE SYSTEM......................................... 95
3.7 SENSITIVITY CASES ....................................................................................................... 96
3.8 CONCLUSION ............................................................................................................... 99
3.9 REFERENCES .............................................................................................................. 101
CHAPTER 4 CONCLUSION AND FUTURE WORK ................................................... 106
4.1 CONCLUSION ................................................................................................... 106
4.2 RECOMMENDATIONS FOR FUTURE RESEARCH .......................................................... 110
APPENDIX ................................................................................................................ 111
List of Tables Table 1-1: Biomass pathways............................................................................................. 5 Table 2-1: Average straw yield .......................................................................................... 24 Table 2-2: Amount of straw to be left in the field for soil conservation ........................... 25 Table 2-3: Loss of straw in its collection and harvesting ................................................... 26 Table 2-4: Storage and transportation losses ................................................................... 26 Table 2-5: Net straw for bio-energy facilities .................................................................... 27 Table 2-6: Lambiotte technical specifications (Herla, 2010; Lambiotte & Cie, 2008) ....... 31 Table 2-7: Straw properties ............................................................................................... 34 Table 2-8: Straw processing equipment selection ............................................................. 37 Table 2-9: Percentage dry matter losses in straw storage................................................ 37 Table 2-10: Bale wrapping cost ......................................................................................... 38 Table 2-11: Straw storage cost ......................................................................................... 38 Table 2-12: Nutrient replacement cost ............................................................................. 39 Table 2-13: Premium cost ................................................................................................. 40 Table 2-14: Biomass loading and unloading cost ............................................................. 42 Table 2-15: Economic assumptions ................................................................................... 43 Table 2-16: Labor costs ..................................................................................................... 44 Table 2-17: Assumption for Big Char equipment case ...................................................... 45 Table 2-18: Capital cost break-up ..................................................................................... 46 Table 2-19: Cost of electricity in Alberta (cents/kWh) ...................................................... 47 Table 2-20: Impact of auxiliary costs ................................................................................ 51 Table 2-21: Sensitivity case summaries............................................................................. 53 Table 2-22: Characteristics of BIG Char technology .......................................................... 55 Table 2-23: Characteristics of plant by Biochar Engineering Corporation ........................ 56 Table 2-24: Key assumptions for portable charcoal production ....................................... 57 Table 2-25: Capital cost of portable equipment................................................................ 58 Table 2-26: Equipment transportation cost ...................................................................... 59 Table 2-27: Cost assessment charcoal production from portable plant ........................... 60 Table 2-28: Input data and assumptions for landfilling ................................................... 63 Table 2-29: Charcoal-landfilling cost ................................................................................ 64 Table 2-30: Charcoal transportation cost ......................................................................... 65 Table 3-1: Emission and energy factors ............................................................................ 80 Table 3-2: Energy and emission for UP1 ........................................................................... 86 Table 3-3: Energy and GHG emissions for UP2 ................................................................. 87 Table 3-4: Energy and GHG emissions for plant operations (UP3) ................................... 90 Table 3-5: Energy and emission calculation for UP4 and Up5 .......................................... 91 Table 3-6: Energy and GHG emissions for portable systems............................................. 96 Table 3-7: Sensitivity study results .................................................................................... 98 Table 4-1: Summary of results ........................................................................................ 108

Table 4-2: Results for energy and emission calculation .................................................. 109 Table 4-3: Carbon abatement cost .................................................................................. 109
List of Figures Figure 2-1: Scope of centralized production of charcoal for carbon sequestration .......... 21 Figure 2-2: Scope of charcoal production in a portable system and its spreading in the field ................................................................................................................................... 22 Figure 2-3: Biochar production cost break-down .............................................................. 48 Figure 2-4: Breakdown of charcoal production cost ($/tonne of charcoal) ...................... 48 Figure 2-5: Effect of capital cost ....................................................................................... 49 Figure 2-6: Effect of variation in charcoal yield on the charcoal production cost............. 50 Figure 2-7: Impact of biomass transportation distance .................................................... 51 Figure 2-8: Operational cost analysis ................................................................................ 52 Figure 2-9: Various portable Biochar Equipment costs ..................................................... 61 Figure 3-1: LCA and energy methodology ......................................................................... 81 Figure 3-2: Unit operations involved in charcoal production from agricultural biomass. 84 Figure 3-3: GHG emissions source break-up ..................................................................... 92 Figure 3-4: Energy consumption in Charcoal production .................................................. 93 Figure 3-5: Impact on Net carbon sequestration ............................................................ 100 Figure 3-6: Impact on NER .............................................................................................. 100
Appendix A1: Capital cost factors ................................................................................................... 111 A2: Electrical energy calculations ................................................................................... 111 A3: Biomass process cost and calculations ..................................................................... 112 A4: Biomass process cost calculations (cont.) ................................................................. 113 A5: Biomass process cost calculations (cont.) ................................................................. 114 A6: NPV calculations for centralized plant ...................................................................... 115 A7: NPV calculations for centralized plant ...................................................................... 116 A8: NPV calculation for portable equipment .................................................................. 117 A9: Land filing equipment selection and calculation ...................................................... 118 A10: Cost of landfilling .................................................................................................... 120 A11: NPV calculation for biochar production with land filling ........................................ 121 A12: Energy and emission calculations for portable production of biochar ................... 122 A13: Energy and emission results for portable system ................................................... 124 A14: Energy and emission results for portable system (cont.) ........................................ 125
List of Abbreviations
BC British Colombia BiG Black Is Green CAD Canadian Dollar CSS Carbon Capture And Storage CO2 Carbon Dioxide CHP Combined Heat And Power dtpd Dry Tonne Per Day ft. Feet gal Gallon Gj Gigajoule GWP Global Warming Potential GHGs Green House Gas Emissions ha Hectare HHV Higher Heating Value hr. Hour H/C Hydrogen To Carbon Ratio ICPS Improved Charcoal Production System kpa Kilo Gram Per Hour km Kilometer kW Kilowatt kWh Kilowatt-Hour kWh Kilowatt-Hour LCA Life Cycle Assessment lcy Loose Cubic Yards LHV Lower Heating Value Mj Mega Joule m/s Meter Per Second CH4 Methane mm Millimeter NREL National Renewable Energy Limited NER Net Energy Ratio NOx Nitrogen Oxides N2O Nitrous Oxide oDt Oven Dry Tonnes PV Present Value SO2 Sulfur Dioxide tmph Ton Mile Per Hour t Tonne TEPC Total Annual Production Cost UP Unit Processes
Chapter 1: Introduction
1
Chapter 1 Introduction
1.1 Background
Today primary source of energy for mankind is fossil fuels and the demand
for this energy is increasing significantly. The use of fossil fuels is associated
with emission of greenhouse gases (GHGs). This is a major concern for the
world as GHGs are one of the primary contributors to global warming. Total
GHG emissions in Canada in 2008 were 734 mega tonnes of carbon dioxide
equivalent (Natural Resource Canada, 2012). Each GHG has a different
potential to contribute to warming. Each GHG has been assigned a global
warming potential (GWP), based on the gases' ability to contribute to global
warming. Carbon dioxide is set as the baseline. (e.g., the GWP for methane
(CH4) is 21). The long-term trend indicates that emissions in 2008 were
about 24% above the 1990 total for Canada. CO2 emissions are a large part of
the total GHG emissions. CO2, which is emitted mainly due to the
consumption of the fossil fuels, accounts for more than 75% of
Canadian GHG emissions. Methane is produced mainly from agricultural
activities, but also from waste sites and from the production and
transportation of fossil fuels. Methane's share of GHG emissions is higher in
provinces where agriculture and fossil fuel production are important
economic activities.
Chapter 1: Introduction
2
There is a need to reduce the emissions of GHGs and this can be done in three
different ways. These include: increase in efficiency for energy consumption
and production in various energy demand and supply sectors; substitution of
fossil fuel sources by renewable energy sources (e.g. wind, biomass,
geothermal, hydro, solar); and, capture of emitted GHGs and its sequestration
in the environmental sinks.
The interest in development of renewable energy technologies has grown in
the recent years. Canada is considered to be a leader in terms of renewable
sources around the world. About 16% of Canada’s total primary energy
supply comes from renewable sources (Natural Resource Canada, 2012).
Renewable energy sources mainly include hydropower, wind energy, solar
energy, geothermal energy, ocean energy and energy from biomass.
Biomass usage, specifically capturing energy from biomass that would
otherwise decay, is one of many options available to mitigate the impact of
the buildup of GHG emissions from fossil fuel utilization. Biomass is a key
renewable energy source. There are various pathways to convert biomass in
different forms of energy. Biomass can be directly converted to heat or
electricity or other forms, such as liquid biofuel or combustible biogas or
solid fuel like charcoal. One of the pathways of biomass processing is its
thermo-chemical conversion. These are processes in which heat is the
dominant agent to convert biomass into another chemical form. The basic

Chapter 1: Introduction
3
alternatives are separated principally by the extent to which the chemical
reactions involved are allowed to proceed. Various pathways are categorized
on the basis of temperature of the operation as shown in Table 1-1. These
conversion technologies are at different stages of development, deployment
and commercialization.
Gasification is the conversion of biomass into gaseous fuel or chemical
feedstock. In this process biomass is heated to high temperature using steam
in the presence of a limited supply of air or oxygen. The end product i.e.
syngas, can be burned to release energy or used for production of value-
added chemicals. The gasification process increases hydrogen and strips
carbon away from the feedstock to produce gases with a higher hydrogen-to-
carbon (H/C) ratio (Basu, 2010; Dem, 2001; Sarkar & Kumar, 2010).
Gasification consists of a series of process including heating and drying,
pyrolysis, solid-gas reactions that consume char, and gas-phase reactions
that adjust the final chemical composition of the producer gas (Basu, 2010;
Brown, 2008; Mitchell et al., 1995). It requires a gasifying medium like steam,
air, or oxygen to rearrange the molecular structure of the feedstock in order
to convert the solid feedstock into gases or liquids.
Pyrolysis is a form of thermal process, which decomposes organic materials
by heat in the absence of oxygen to vapors, which can further be condensed
to liquid. Pyrolysis typically occurs under pressure and at operating

Chapter 1: Introduction
4
temperatures about 400 to 500 °C (Bridgwater, 1999 & 2012; Bridgwater et
al., 1999; Bridgwater & Peacocke, 2000; Sánchez et al., 2009; Yaman, 2004).
The residue resulting from low- temperature pyrolysis is a form of charcoal
called biochar, which is a fuel in itself.
Solid fuels such as biochar or charcoal can be produced from thermo-
chemical treatment of biomass. Charcoal is interestingly different from other
biomass-based solid fuels. The major difference is that charcoal, the product
of the process, can be deposited back in the soil by land filling. Land filling
has many environmental benefits (Lehmann, 2007a & 2007b; Lehmann et al.,
2006). About 50% of the organic carbon found in crops can be returned back
to ground where it originally belongs. One of the important characteristics of
charcoal is its very long half-life in comparison with biomass or organic
matter not undergone pyrolysis (Baldock, 2002). Re-growing biomass used
for production of charcoal and landfilling of charcoal results in a net
withdrawal of carbon dioxide from the atmosphere. There is a high
theoretical potential to reduce global greenhouse gas emissions through the
use of charcoal sequestration (Lehmann, 2007a & 2007b).

Chapter 1: Introduction
5
Table 1-1: Biomass pathways
Process Process Description Resultant Products
Product Characteristics
Torrefaction (200-
300°)(Uslu et al., 2008)
Torrefaction is a thermal pre-treatment technology performed
at atmospheric pressure in the
absence of oxygen (Uslu et al., 2008)
A solid uniform product with very
low moisture content and a high calorific
value compared to fresh biomass
Torrefied biomass typically contains 70%
of its initial weight and 90% of the original energy
content(Prins et al., 2006)
Pyrolysis (400-
800°C)(Bridgwater, 1999 &
2012)
Pyrolysis can be described as the direct
thermal decomposition of
biomass in the absence of oxygen
(Yaman, 2004)
The products1 are gas, liquid and
solid char, generally, the
yields are 40–65 wt.% organic
condensates, 10–20% char, 10–
30% gases and 5–15% water based
on dry feed. (Bridgwater,
1999 & 2012)
The energy content of the pyrolysis oil is
around 15–18 MJ/kg with moisture content around 25%. The LHV
of gas is around 15 MJ/Nm3 and the char is around 32 MJ/kg
Gasification (Above 800°C)
Gasification is the process of heating biomass to a high
temperature using steam in presence of a
limited supply of air or oxygen (Basu,
2010)
Syngas is a mixture of carbon
monoxide and hydrogen (Basu,
2010)
Combustion Direct combustion of biomass in a chamber in presence of excess
air
Direct heat, which can be converted
into power.
1The product mixture varies with the heating rate, type of biomass used and temperature. It
can be optimized for production of bio-oil (higher temperature and faster heating rate) or bio-
char (lower temperature and slower heating rate).
Chapter 1: Introduction
6
1.2 Biomass Feedstocks
Canada harvests millions of tonnes of biomass each year in various forms as
trees and crops. It is estimated that the residues from forestry, agriculture
and related manufacturing industries are equivalent to approximately 18–27
percent of the energy Canada derives from fossil fuel (BioProducts Canada,
2004). Biomass can be intentionally grown, such as switchgrass for ethanol
production, or as a byproduct of some other industry or agricultural process
(popularly known as opportunity-biomass) (Agriculture and Agri-Food
Canada, 2012). Opportunity biomass can be straw, corn stover, wood
resulting from insect attack such as the mountain pine infested wood (Kumar
et al., 2008) in BC, forest fires, wood processing operations and timber
related operations (Agriculture and Agri-Food Canada, 2012).
1.2.1 Whole Forest and Residues
Major sources of forest residues as described by (Roser et al., 2008) are as
follows:
• Results of forest management, such as biomass from forest thinning,
harvesting residues, non-commercial species.
• Industrial processes have several by-products, such as bark, sawdust and
black liquor
• By-products of demolition, construction and packaging processes

Chapter 1: Introduction
7
Canadian sawmills are responsible for the majority of forest mill residues
produced in 2004, lumber production in Canada was 35,510 Mfbm (million
board feet) (BW McCloy & Associates Inc., 2005). According to a study
performed by BW McCloy and Associates in 2005 there was surplus of
2,472,992 million bone-dry tonnes (BDt) of biomass, which is approximately
equivalent to over 49,460 TJ of energy. Another study performed (Bradley,
2006) reports that Canada had 2.3 million oven dry tonnes (ODt) in 2007.
According to the study, in Saskatchewan and in the eastern provinces
incineration is not permitted and mills pile excess residue at the site. These
are economically unusable as they get degraded due to natural causes. In
2005 total surplus heritage bark piles was 15,407,000 ODt. (Bradley , 2006 &
2007). Studies suggest that forest biomass though abundant cannot satisfy
more than a small fraction of current energy demands (David et al., 2011)
1.2.2 Agriculture Residue
Crops are grown on 36 million hectares of land (Statistics Canada, 2010),
representing 53% of total farmland (Li et al., 2012). This generates millions
of tonnes of crop residues annually. In Western Canada, large amounts of
forest and agricultural residues (e.g. wheat and barley straw) are left in the
forest/field, which could be harvested for energy production. On an average
3.19 million dry tonnes/year of agricultural residue available in Alberta can
be put to use (Kumar et al., 2006; Statistics Canada, 2010; Sultana et al.,
2010). An earlier study has estimated the amount of agricultural residue

Chapter 1: Introduction
8
available in Western Canada (Kumar et al., 2006). Studies have also shown
that large-scale power production is also economically competitive with
fossil fuel (Kumar et al., 2003). It can compete only if supported by carbon
credits (Kumar et al., 2003) Section 2.3 of this study explains in depth
analysis of availability of agricultural residue for production of biochar.
1.3 Statement of the Problem
Various studies have been performed on the use of biomass as a substitute to
fossil fuels. Biomass energy has a potential to greatly reduce greenhouse gas
emissions. Use of biomass approximately releases same amount of emissions
as the use of fossil fuels. However fossil fuel captured carbon millions of
years ago, hence emissions in today’s world affect the balance. On the
contrary emissions by use of biomass are largely balanced by the carbon
dioxide captured in its own growth (depending how much energy was used
to grow, harvest, and process the fuel). Hence they are considered to be
carbon-neutral (Gupta, 2009; Roberts et al., 2010; Sebastián & Royo, 2007).
This is one of the methods of reducing emissions but the efficiency rates
seem not be low for energy conversion, as suggested by Manomet Center for
Conservation Sciences 2010, green wood to electrical power is only 25%, into
combined heat and power (CHP) is about 75%, and the efficiency of
producing heat from wood pellets is 80% (David et al., 2011; Walker et al.,
2010) Other means for reduction in emissions are – (1) Energy efficiency
improvement (2) Use of renewable energy and (3) Increased use of Nuclear
Chapter 1: Introduction
9
energy for power generation. These methods along with biomass-to-power
reduce emissions that are yet to be generated (Gupta, 2008).
The focus of the problem is to reduce existing emissions or in other words
capture carbon from atmosphere. There are various methods to achieve this
currently the most popular and mature method is carbon capture and storage
(CSS)(Gupta, 2009) Some of the issues with CSS as described, are high costs
and issues with post operation liability. Studies suggest the cost of simply
sequestering carbon is in the order of $115-$150 per tonne of CO2 (Gupta,
2009; Harrison, 2009; Metz et al., 2005).
The alternative approach to address the issues is charcoal production,
converting biomass to charcoal and sequestering it into the earth. As
described above the process is energy self-sufficient as syngas produced
during pyrolysis acts as a source of energy for carrying out pyrolysis of
remaining biomass. This produces charcoal and hence it is considered to be a
carbon negative process. This biomass can be re-grown and it absorbs new
carbon from atmosphere, which results to further withdrawal. Some studies
(Gupta, 2010; Lehmann et al., 2011) highlight the advantages of biochar
sequestration.
• Charcoal is stable and can be stored for thousands of years (Laird, 2008)
• An easy monitoring and measurement of sequestered carbon

Chapter 1: Introduction
10
• The sequestered carbon can be used for production of energy when GHG
emissions issue dies down
• Biochar for soil enhancement (Lehmann et al., 2011; Sánchez et al., 2009)
One issue where there is limited research has been conducted is to determine
the cost of sequestration. This study focuses on determination of cost for
carbon sequestration or in other words $ per tonne of CO2 mitigated.
1.4 Objective of the Study
The overall aim of this research was to perform a techno-economic
assessment of production of charcoal from agricultural biomass and land
filling of this charcoal for sequestration for carbon. This work involves a
conceptual estimation of the cost of production of biochar from straw in a
centralized plant and its storage in a landfill to sequester carbon. This study
draws on actual data to determine the cost of charcoal production. The
specific objectives of the work include:
• Identify and analyze various technologies for production of charcoal;
• Estimation of the overall delivered cost of straw to the charcoal
production plant;
• Estimation of the cost of transportation of charcoal to the landfill site;
• Estimation of the cost of land filling;
• Estimation of GHG emissions over the life cycle of this pathway of
charcoal production and land filling;

Chapter 1: Introduction
11
• Estimation of the overall cost of carbon sequestration through charcoal
land filling ($/tonne of charcoal);
• Estimate the cost of mitigation of CO2 ($/tonne of CO2).
1.5 Limitations of study
• This study is based on utilization of straw from wheat, oat and barely
available in Alberta.
• This study focuses on currently available pyrolysis equipment and selects
most suitable option for the selected biomass type.
• Various cost used have been adjusted for location and size of the plant
considered.
• The study considers two cases for evaluation of costs, firstly a centralized
plant where biomass is transported to a central location and secondly
portable plant where the equipment travels to the biomass location.
• Charcoal produced is transported to field and landfill sites. The overall
system comprises of following processes – straw harvesting, bailing
transport, pyrolysis (conversation to charcoal), charcoal transport and
land filling.
• A portable pyrolysis plant for production of charcoal in the farm has also
been considered.
Chapter 1: Introduction
12
1.6 Organization of Thesis
This thesis has four chapters apart from table of contents, list of figures, list
of tables and appendices.
Chapter One – This chapter introduces the field of research and briefly
explains the need for the study.
Chapter Two – This chapter describes the development of techno-economic
model and gives the detailed review of the various technologies considered
for pyrolysis of biomass. Both mobile and de-centralized plants are are
described.
Chapter Three – This chapter deals with assessment of carbon sequestration
and describes the estimation of the cost of land filling charcoal, and
determines the abatement cost ($/tonne of CO2) mitigated by land filling.
This chapter also determines the net carbon sequestered in process of
biochar production.
Chapter Four – It summarizes the findings and explains the conclusion of the
thesis. It also hints upon some future work that could be performed on the
thesis.
Chapter 1: References
13
1.7 References
Agriculture and Agri-Food Canada. (2012). Biomass. Retrieved 1 October,
2010. Retrieved from: http://www4.agr.gc.ca/AAFC-AAC/display-
afficher.do?id=1226356636533&lang=eng
Baldock, J. (2002). Chemical composition and bioavailability of thermally
altered Pinus resinosa (Red pine) wood. Organic Geochemistry, 33(9),
1093-1109.
Basu, P. (2010). Chapter 5 - Gasification Theory and Modeling of Gasifiers
(pp. 117-165). Boston: Academic Press.
BioProducts Canada. (2004). Innovation roadmap on bio-based feedstocks,
Fuels and Industrial Products. (54124E/F). Retrieved
from: http://www.ic.gc.ca/eic/site/trm-crt.nsf/vwapj/biobased-
biomasse_eng.pdf/$FILE/biobased-biomasse_eng.pdf
Bradley, D. (2006). Canada Biomass-Bioenergy Report (pp. 1-20). Ontario.
Canada Climate Change Solutions. Retrived from:
http://www.canbio.ca/upload/documents/canada-report-on-
bioenergy-2010-sept-15-2010.pdf
Bradley, D. (2007). Canada- Sustainable Forest Biomass Supply Chains (pp. 1-
31). Ontario, Canada Climate Change Solutions. Retrived from:
http://www.canbio.ca/upload/documents/sustainableforestsupplych
ainsoct192007.pdf

Chapter 1: References
14
Bridgwater A. V. (1999). Principles and practice of biomass fast pyrolysis
processes for liquids. Journal of Analytical and Applied Pyrolysis, 51(1-
2), 3-22.
Bridgwater A. V. (2012). Review of fast pyrolysis of biomass and product
upgrading. Biomass and Bioenergy, 38, 68-94.
Bridgwater A. V., Meier D., & Radlein D. (1999). An overview of fast pyrolysis
of biomass. Organic Geochemistry, 30(12), 1479-1493.
Bridgwater A. V., & Peacocke G. V. C. (2000). Fast pyrolysis processes for
biomass. Renewable and Sustainable Energy Reviews, 4(1) 1- 73.
Brown, R. C. (2008). Biomass Conversion: Gasification and Pyrolysis October.
Mankato, Minnesota: Iowa State University.
BW McCloy & Associates Inc. (2005). Estimated Production, Consumption
and Surplus Mill Wood Residues in Canada - 2004. Forest Products
Association of Canada(November). Retrived from:
http://publications.gc.ca/collections/Collection/Fo4-7-2004E.pdf
David P., Pierre B., Evelyne T., & Titus B D. (2011). The potential of forest
biomass as an energy supply for Canada. Forestry, 71-76.
Dem, R. A. (2001). Biomass to charcoal, liquid, and gaseous products via
varbonization process. Energy Sources, Part A: Recovery, Utilization,
and Environmental Effects, 23(6), 579-587.
Gupta S. (2008). Carbon harvesting for saving the planet. Paper presented at
the Canadian International Petroleum Conference, Calgary, Alberta
Canada. Jun 17 - 19, 2008
Chapter 1: References
15
Gupta S. (2009, 4–7 October 2009). Are there Less Costly Ways to Sequester
Carbon than CCS ? Paper presented at the SPE Annual Technical
Conference and Exhibition, New Orleans, Louisiana, USA. 4-7 October
2009.
Gupta S. (2010). A practical way out of the GHG emissions problem. Journal of
Canadian Petroleum Technology, 49(8), 33-42.
Kumar, A., Cameron, J. B., & Flynn, P. C. (2003). Biomass power cost and
optimum plant size in western Canada. Biomass and Bioenergy, 24(6),
445-464.
Kumar, A., Flynn, P., & Sokhansanj, S. (2008). Biopower generation from
mountain pine infested wood in Canada: An economical opportunity
for greenhouse gas mitigation. Renewable Energy, 33(6), 1354-1363.
Kumar, A., Sokhansanj, S., & Flynn, P. C. (2006). Development of a
multicriteria assessment model for ranking biomass feedstock
collection and transportation systems. Applied biochemistry and
biotechnology, 129-132, 71-87.
Laird, D. A. (2008). The Charcoal Vision: A Win-Win-Win Scenario for
Simultaneously Producing Bioenergy, Permanently Sequestering
Carbon, while Improving Soil and Water Quality. Agronomy Journal.
100: 178–181
Lehmann, J. (2007a). Biochar for mitigating climate change: carbon
sequestration in the black. Forum Geookol, 18(2). 15-17
Lehmann, J. (2007b). A handful of carbon. Nature, 447(7141), 143-144.
Chapter 1: References
16
Lehmann, J., Gaunt, J., & Rondon, M. (2006). Bio-char sequestration in
terrestrial ecosystems – A review. Mitigation and Adaptation
Strategies for Global Change, 11(2), 395-419.
Lehmann, J., Rillig, M. C., Thies, J., Masiello, C. a., Hockaday, W. C., & Crowley,
D. (2011). Biochar effects on soil biota – A review. Soil Biology and
Biochemistry, 43(9), 1812-1836.
Li, X., Mupondwa, E., Panigrahi, S., Tabil, L., Sokhansanj, S., & Stumborg, M.
(2012). A review of agricultural crop residue supply in Canada for
cellulosic ethanol production. Renewable and Sustainable Energy
Reviews, 16(5), 2954-2965.
Metz, B., Davidson, O., Coninck, H. D., Loos, M., & Meyer, L. (2005, 2005).
Summary for policymakers of the intergovernmental panel on climate
change (IPCC), Montreal, Canada.
Mitchell, C. P., Bridgwater, A. V., & Stevens, D. J. (1995). Technoeconomic
assessment of biomass to energy. Biomass and, 9(95), 205-226.
Natural Resource Canada. (2012). The Atlas of Canada, Retrived on 17th
October 2011, Retrieved
from: http://atlas.nrcan.gc.ca/auth/english/maps/climatechange/at
mospherestress/trendsgreenhousegasemission
Prins, M. J., Ptasinski, K. J., & Janssen, F. J. J. G. (2006). Torrefaction of wood.
Journal of Analytical and Applied Pyrolysis, 77(1), 35-40.
Roberts, K. G., Gloy, B. A., Joseph, S., Scott, N. R., & Lehmann, J. (2010). Life
cycle assessment of biochar systems: estimating the energetic,
Chapter 1: References
17
economic, and climate change potential. Environmental science &
technology, 44(2), 827-833.
Roser, D., Asikainen, A., Stupak, I., & Pasanen, K. (2008). Sustainable use of
forest biomass for energy. A synthesis with focus on the Baltic and
Nordic Region. Springer, Dordrecht, The Netherlands.
Sánchez, M. E., Lindao, E., Margaleff, D., Martínez, O., & Morán, a. (2009).
Pyrolysis of agricultural residues from rape and sunflowers:
Production and characterization of bio-fuels and biochar soil
management. Journal of Analytical and Applied Pyrolysis, 85(1-2), 142-
144.
Sarkar, S., & Kumar, A. (2010). Biohydrogen production from forest and
agricultural residues for upgrading of bitumen from oil sands. Energy,
35(2), 582-591.
Sebastián, F., Royo, J., & Serra, L. (2007). Life Cycle Assessment of Greenhouse
Gas Emissions from Biomass Electricity Generation: Co-firing and
Biomass Monocombustion. Paper presented at the 4th Dubrovnik
Conference on Sustainable Development of Energy, Water and
Environment Systems, Dubrovnik, Croatia.
Statistics Canada. (2010). Total farm area, land tenure and land in crops, by
province (Census of agriculture, 1986 to 2006) Retrieved 10 June,
2010, from http://www.statcan.gc.ca/tables-tableaux/sum-
som/l01/cst01/agrc25a-eng.htm
Chapter 1: References
18
Sultana, A., Kumar, A., & Harfield, D. (2010). Development of agri-pellet
production cost and optimum size. Bioresource technology, 101(14),
5609-5621.
Uslu, A., Faaij, A. P. C., & Bergman, P. C. A. (2008). Pre-treatment technologies,
and their effect on international bioenergy supply chain logistics.
Techno-economic evaluation of torrefaction, fast pyrolysis and
pelletisation. Energy, 33(8), 1206-1223.
Walker, T., Cardellichio, P., Colnes, A., Gunn, J., Kittler, B., Perschel, R., & Aah,
D. (2010). Massachu- setts biomass sustainability and carbon policy
study: report to the commonwealth of Massachusetts department of
energy resources. Manomet Center for Conservation Sciences.(June).
Retrived from:
http://www.mass.gov/eea/docs/doer/renewables/biomass/manome
t-biomass-report-full-hirez.pdf
Yaman, S. (2004). Pyrolysis of biomass to produce fuels and chemical
feedstocks. Energy Conversion and Management, 45(5), 651-671.
Chapter 2: Economic Analysis of Charcoal Production
19
Chapter 2 Techno-economic Assessment of Charcoal
Production
2.1 Introduction
Biomass is considered nearly carbon neutral, as the amount of CO2 released
during its combustion is nearly the same as taken up by the plants during its
growth. Biomass can be used for production of solid, liquid and gaseous fuels
as discussed in Chapter 1. The focus of this research is on techno-economic
assessment of the pathway of conversion of biomass to charcoal and its
landfilling for sequestration of carbon. Charcoal can be produced from
biomass through slow heating process in absence of oxygen. This process is
called as pyrolysis (Laird, et al. 2009). The charcoal produced from biomass
can be either used as catalyst (Lehmann, 2009) or fertilizer (Deal et al., 2012;
Gaunt & Lehmann, 2008; Lehmann et al., 2011) or fuels (Roberts et al., 2010;
Society, 2012).
2.2 Scope of Research and Methodology
The overall aim of this research is to develop techno-economic models for the
assessment of cost of production of charcoal from Alberta’s agricultural-
based biomass sources and storage of charcoal in the landfill for carbon
sequestration.

Chapter 2: Economic Analysis of Charcoal Production
20
In this study, two scenarios of production of charcoal have been estimated.
First scenario as shown in Figure 2-1, system includes production of charcoal
in a centralized plant where the required biomass is transported to the plant
using trucks and is converted to charcoal through pyrolysis. The charcoal
produced through this process is then transported back to the field for
sequestration.
Second scenario includes production of charcoal in a mobile plant, which
moves around and produces charcoal. This charcoal is then spread in the
field. For both the scenarios, the whole chain is divided into a number of unit
operations. Figure 2-2 shows various unit operations involved in production
of charcoal from agricultural biomass.
Data were collected related to the characteristics and costs of each unit
operation. These are detailed in subsequent sections. Data collection was
based on detailed literature review, in consultation with the various
manufacturing companies and in consultation with the experts in field.
Wherever data was not available, it was developed based on certain
assumptions. Once all the data were estimated, data intensive techno-
economic models were developed to estimate the cost of production of
charcoal in Alberta from the agricultural biomass and the cost of landfilling it.

Chapter 2: Economic Analysis of Charcoal Production
21
Figure 2-1: Scope of centralized production of charcoal for carbon sequestration

Chapter 2: Economic Analysis of Charcoal Production
22
Figure 2-2: Scope of charcoal production in a portable system and its spreading in the field
These techno-economic models are based on discounted cash flow analysis
and use the standard procedure used in the industry today. A detailed
sensitivity analysis was also performed to assess the impact of variation in
parameters. Assumptions for the techno-economic models were specific to
the scenarios and are discussed in the subsequent sections.

Chapter 2: Economic Analysis of Charcoal Production
23
2.3 Biomass Feed stocks and its Availability
Agriculture sector is an important contributor to Albert’s economy. This
sector produces large amount of grains, which are predominantly used for
food. In the current practice, once the grains are harvested from the field, the
associated straw is left in the field to rot. This straw decomposes emitting
GHG to the atmosphere (Kumar et al., 2003). There is a large potential for
production of fuels and chemicals from straw. Utilization of left over straw
for production of charcoal is the focus of this study. Based on the estimates of
grain production in Alberta and various agronomic factors overall availability
of straw in Alberta can be estimated. Various parameters such as climate,
type of crop, and the collection and harvesting operations have an impact on
the straw yield. The net straw availability also depends on factors such as
amount of straw, which needs to be left in the field; amount of straw
currently used for animal feeding and associated transportation losses. For
this study we consider year-to-year production of three major crops in
Canada; wheat, oat and barley. Grain yields for last 11 years from 1997-2008
have been used for estimation of straw yield. Average yields of wheat, barley
and oats in Alberta are 2.69, 3.15 and 2.58 green tonnes/ha, respectively
(Agriculture Statistics Yearbook, 2010) The province has harvested area of
about 2.77 Mha of land for wheat production, 1.51 Mha for barley production
and 0.2 Mha for oat production in the year 2008. The yield data were
collected from (Agricultural Statistical Yearbook – 2008). The detailed
methodology used in the following section for determining the net

Chapter 2: Economic Analysis of Charcoal Production
24
availability of straw was adapted from (Sultana et al., 2010). A detailed
assessment of the feedstock availability has been discussed in Sultana et al.
(2010).
To estimate the net straw yield from the harvested area, one of the key
parameters that was used is straw-to-grain conversation ratio. The straw-to-
grain ratio factors for wheat, barley and oats are 1.1, 0.8 and 1.1, respectively
(Sultana et al., 2010). Details on various straw-to-grain ratios and estimation
of gross straw yields are given in Table 2-1.
Table 2-1: Average straw yield
Crop Average Grain Yield1
(green tonne/ha)
Assumed Straw-to-grain ratio2
Gross Straw Yield (green tonne/ha)
Wheat 2.69 1.1 2.96 Barley 3.15 0.8 2.52 Oat 2.58 1.1 2.83
According to earlier studies, some portion of straw has to be retained in soil
for fertility and soil health. Table 2-2 indicates various estimates for the
amount of straw that is required for soil retention and health. For this study
we assume 0.75 tonne/ha of straw is left in the field.
1 Source: (Alberta Agriculture and Rural Development, 2008) 2 Source: (Sultana et al., 2010)
Chapter 2: Economic Analysis of Charcoal Production
25
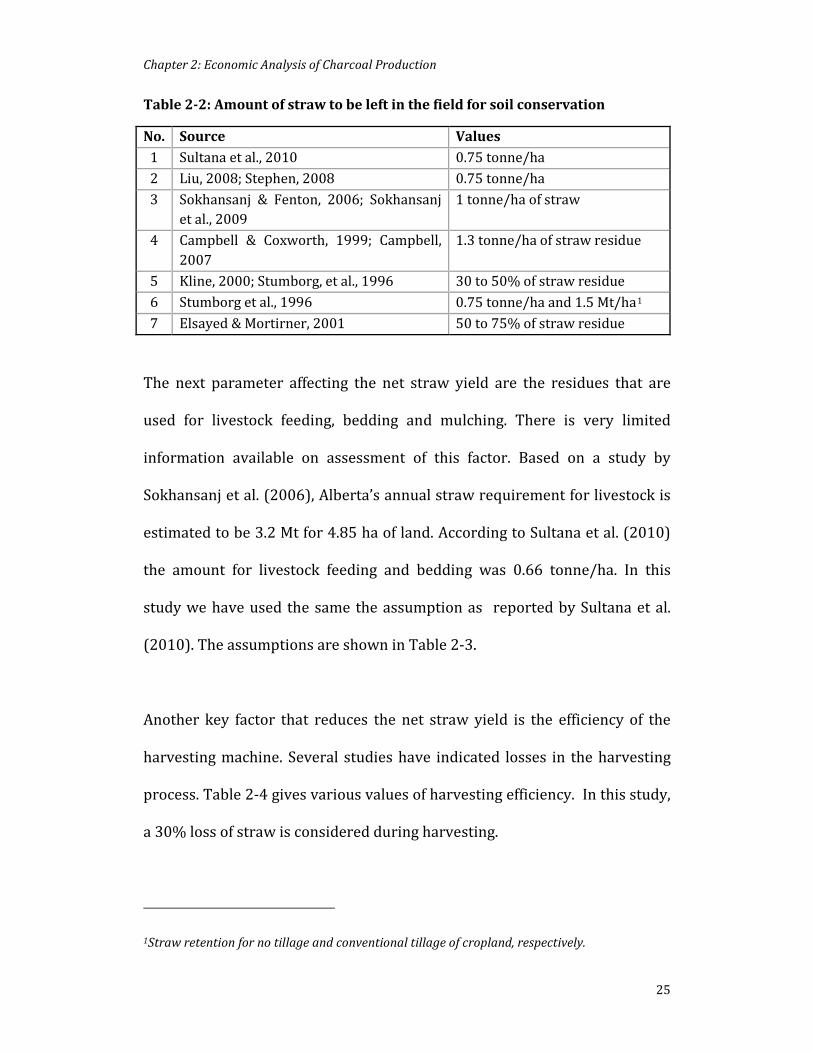
Table 2-2: Amount of straw to be left in the field for soil conservation
No. Source Values 1 Sultana et al., 2010 0.75 tonne/ha 2 Liu, 2008; Stephen, 2008 0.75 tonne/ha 3 Sokhansanj & Fenton, 2006; Sokhansanj
et al., 2009 1 tonne/ha of straw
4 Campbell & Coxworth, 1999; Campbell, 2007
1.3 tonne/ha of straw residue
5 Kline, 2000; Stumborg, et al., 1996 30 to 50% of straw residue 6 Stumborg et al., 1996 0.75 tonne/ha and 1.5 Mt/ha1 7 Elsayed & Mortirner, 2001 50 to 75% of straw residue
The next parameter affecting the net straw yield are the residues that are
used for livestock feeding, bedding and mulching. There is very limited
information available on assessment of this factor. Based on a study by
Sokhansanj et al. (2006), Alberta’s annual straw requirement for livestock is
estimated to be 3.2 Mt for 4.85 ha of land. According to Sultana et al. (2010)
the amount for livestock feeding and bedding was 0.66 tonne/ha. In this
study we have used the same the assumption as reported by Sultana et al.
(2010). The assumptions are shown in Table 2-3.
Another key factor that reduces the net straw yield is the efficiency of the
harvesting machine. Several studies have indicated losses in the harvesting
process. Table 2-4 gives various values of harvesting efficiency. In this study,
a 30% loss of straw is considered during harvesting.
1Straw retention for no tillage and conventional tillage of cropland, respectively.

Chapter 2: Economic Analysis of Charcoal Production
26
Table 2-3: Loss of straw in its collection and harvesting
No. Source Harvesting Efficiency / Loss 1 Sultana et al., 2010 30% loss. 2 Sokhansanj & Fenton,
2006; Sokhansanj et al., 2009
25% loss.
3 USDA, 2009 40%1 loss. 4 Montross et al., 2003 Efficiency of 64-75% for corn stover. 5 Lang & Specialist, 2002 Efficiency of 80%. 6 Sheehan et al., 2003 Efficiency of 70% of residue collection in no-
tillage condition and 40% with continuous tillage.
7 Liu, 2008 37% loss.
Due to bulky nature of straw, there are challenges in its transportation and
storage. This adds to the cost of these unit operations. This is one of the key
reasons for the restricted use of biomass for energy processes. The following
Table 2-4 shows the losses during storage and transportation of straw based
on literature.
Table 2-4: Storage and transportation losses
No. Source Storage and Transportation Losses 1 Sultana et al., 2010 30% loss. 2 Liu, 2008 18% (3% loss in field, 5% for transport and 2 to
10% for storage). 3 Campbell, 2007 10% loss due to handling and decomposition. 4 Perlack et al., 2005 Storage and handling losses of 10%. 5 Perlack et al., 2005 Storage piled at the roadside is 3.5% and a loss in
intermediate storage and bunker is 2%. The typical dry matter losses for solid biomass transport are about 15%.
1According to USDA (2005), it is possible under some conditions to remove as much as 60% to
70% with currently available equipment.
Chapter 2: Economic Analysis of Charcoal Production
27
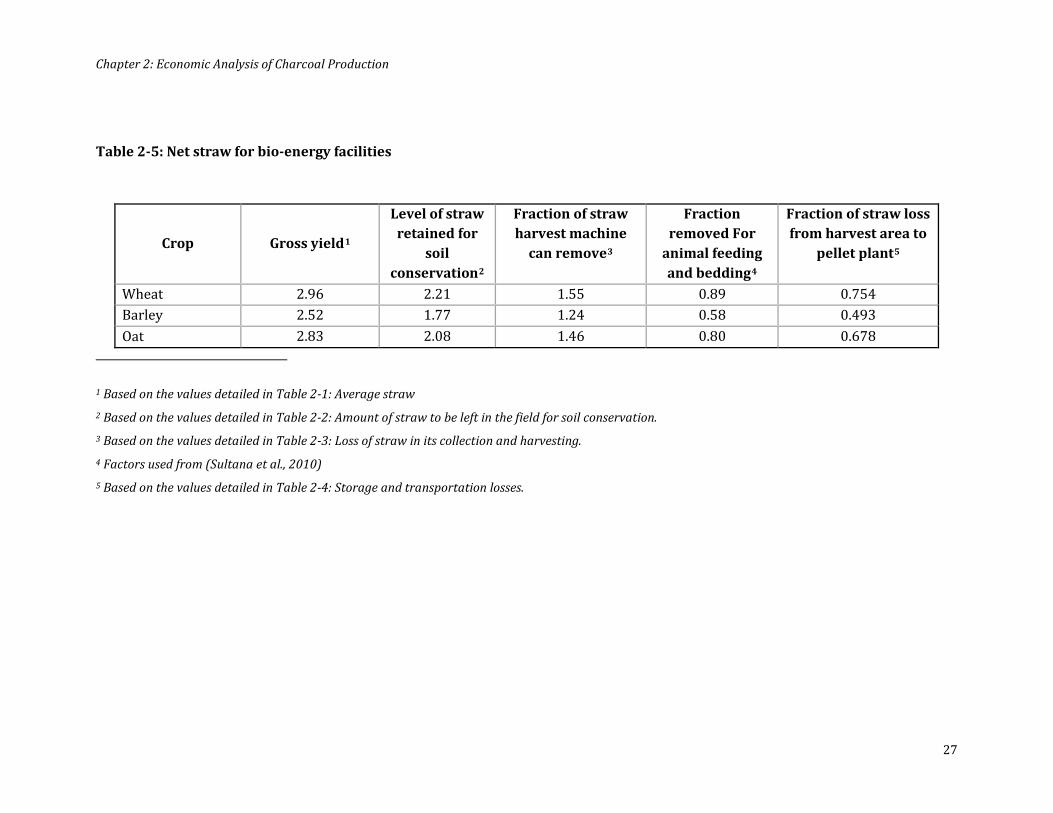
Table 2-5: Net straw for bio-energy facilities
Crop Gross yield1
Level of straw retained for
soil conservation2
Fraction of straw harvest machine
can remove3
Fraction removed For
animal feeding and bedding4
Fraction of straw loss from harvest area to
pellet plant5
Wheat 2.96 2.21 1.55 0.89 0.754 Barley 2.52 1.77 1.24 0.58 0.493 Oat 2.83 2.08 1.46 0.80 0.678
1 Based on the values detailed in Table 2-1: Average straw 2 Based on the values detailed in Table 2-2: Amount of straw to be left in the field for soil conservation. 3 Based on the values detailed in Table 2-3: Loss of straw in its collection and harvesting. 4 Factors used from (Sultana et al., 2010) 5 Based on the values detailed in Table 2-4: Storage and transportation losses.

Chapter 2: Economic Analysis of Charcoal Production
28
2.4 Current Technologies for Charcoal Production
Charcoal production from biomass is at a stage of development and
demonstration. There are a number of technologies, which are in different
stages of the development. Various companies around the world have
developed technologies including different types of kilns, machines and
retorts to convert biomass to charcoal. These companies use variety of
biomass including wood, animal waste, straw and other sources of biomass
for production of charcoal. There is a lot of focus on production of bio-oil (a
thick dark liquid) through fast pyrolysis and production of charcoal as a
secondary product. A detailed literature review of the technology was done
as part of this study. The following section gives detail on some of the key
technologies reviewed in this study.
2.4.1 Bio Energy LCC (Russia)
Bio Energy LCC has developed a family of Kilns called the EKOLON. The
design has vertical movable retorts, which hold the biomass (in this case
firewood). These retorts are placed in the kiln. The retorts have a special
device at the bottom to extract steam and gas mixture to the furnace. To
avoid emissions, the produced syngas and liquid products (tar) from wood
decomposition are completely burned in the furnace. The heat flows through
the sections for providing energy for pyrolysis and drying. There is no other
power consumption except the lighting, mechanical wood-chopper and
hoisting equipment - a crane with 3-5 tonne lifting capacity (Bio Energy LCC,
Chapter 2: Economic Analysis of Charcoal Production
29
2010). The equipment developed by this company uses wood as a source of
biomass. It can also accommodate any bulky biomass (e.g. straw in the form
of briquettes). The source of energy to initiate pyrolysis and continuous
operation is extra biomass in addition to requirement for production of
charcoal. The upper limit of moisture content in the biomass is 40%. The
capacity of the retorts ranges from 1 – 5.2 tonnes of charcoal per day. About
eight people are required for the operation of these retorts and is highly
dependent on the degree mechanization of the process.
2.4.2 Alterna Energy Inc. (Canada)
Alterna Energy Inc. is working on building and demonstrating a multi-
module biochar production facility that will convert 110,000 tonnes of green
wood residues (bark, forest waste including pine-beetle killed wood, hog fuel
and sawmill residues) annually into 25,000 tonnes of biochar. They currently
have a small industrial facility in South Africa and a demonstration plant in
McBride, BC (Kutney, 2010). The equipment can handle any kind of biomass.
Three persons are required per shift for the plant. The total capital costs for a
25,000 tonnes per year biochar facility is about $10 million.
2.4.3 Best Pyrolysis Inc. (Australia)
BEST Energies has a fully operational demonstration plant that has a capacity
to take 300 kg/hr. of biomass. This design has been scaled up into 48 and 96
tonnes/day (dry feed basis) commercial modular units. These modular units

Chapter 2: Economic Analysis of Charcoal Production
30
can be designed with an engine component for electricity production or to
interface with thermal energy processes such as steam boilers, dryers and
absorption chillers (Best Pyrolysis Inc, 2010). The equipment operates on a
continuous kiln mechanism. The biomass is put into small containers and are
passed through the kiln and hence converted to char. The basic steps are
shredding of the biomass into smaller size, drying to minimize moisture
content, carbonization, cooling to avoid ignition, screening, grinding, bagging
and shipping. It requires a process area of 70’ x 100’ and two operators to
run the facility. The capital cost of the facility reported in 2009 is $3,500,000
and it takes about 18 months for installation. The capacity of the unit for
production of biochar is 6,600 tonnes per year (Best Pyrolysis Inc, 2010).
2.4.4 Lambiotte Kiln (Belgium).
The automatic continuous Lambiotte SIFIC/CISR carbonization retort
includes the system for preparation of wood, the retort itself, and the
charcoal storage and handling equipment. In the Lambiotte process, the
pyroligneous vapors are burnt for energy, which results in a yield 2 to 5
times higher than with the traditional processes. Water from the gas cooling
circuit is recycled and the surplus pyroligneous vapors are burnt in a flare-
stack to ensure the protection of environment. These vapors can also be
reclaimed to feed a boiler. The charcoal produced has an excellent purity and
consistency, with a very high carbon content (Herla, 2010; Lambiotte & Cie,
2008).

Chapter 2: Economic Analysis of Charcoal Production
31
Table 2-6: Lambiotte technical specifications (Herla, 2010; Lambiotte & Cie, 2008)
1 Annual charcoal production 6,000 tonnes 2 Characteristics of the charcoal produced by the
LAMBIOTTE process Fixed carbon: 82 -90 % Moisture: 3 to 4 %
3 Reclaimable pyroligneous vapors ~3,000,000 kcal/H 4 Annual wood requirement 24,000 to 27,000 tonnes 5 Installed power 250 to 300 kW 6 Power consumption 100 to 120 kW 7 Man-power 14 to 17 people 8 Average life time 15 years 9 Approximate weight / volume 100-120 tonnes / 1200 m3
2.4.5 Genesis Equipment (USA)
Genesis Industries (eGen) is another provider of pyrolysis machines. The
existing commercial machine has been operationally tested for production of
clean burning syngas and biochar. The machine has been designed for easy
use and has a continuous feed system, and runs on a wide variety of waste
biomass ranging from wood chips to poultry litter (E Genesis Industries,
2010). The equipment has clean, simple and continuous operation. It is a
rugged design, which can handle various biomass variety of feedstock
material from cereal straw to feedlot waste and timber-based wastes. Low-
grade waste exhaust gases are utilized to pre-dry feedstock material to
increase overall efficiency and reduce CO2 emissions. Pyrolysis gases
(syngas) maintain temperatures and high flow rates through the unit.
Depending on biomass moisture content/energy values, excess syngas can be
produced. Excess pyrolysis gases can be used to power a micro-turbine or
furnace/boiler. The system requires outside energy source for start-up
Chapter 2: Economic Analysis of Charcoal Production
32
including natural gas or propane. The footprint of the site required for this
kind of system is 40 ft. x 20ft x 15 ft. high with electrical service of 100 amp,
water line and gas supply (propane or natural gas at a maximum rate of
280MJ @ 40kpa) (Gelwicks, 2010). Feedstock capacity of this unit assuming
moisture content of 20-25% is 1000 kg/hr. and produces 250 kg/hr. of
biochar (E Genesis Industries, 2010).
2.4.6 Adam-Retort (Germany)
The Adam-Retort or the Improved Charcoal Production System (ICES) was
developed in Burundi/East Africa and India. It is semi-portable equipment,
with efficiency of about 30%. The retort uses a low cost construction model
with material easily available in any part of the world. It can be considered as
an improvised version of an earth kiln. The ICPS is basically a brick wall
construction with two chimneys and a few metal plates. A single person can
operate it. The pyrolysis is achieved in a two-phase process. In phase one of
operation, the retort chamber with biomass in it, is open from two ends. Heat
from an external firebox is used for drying and preheating the biomass. The
firebox contains biomass, which is the initial source of energy to start the
process. In phase two of operation, one of the open chambers is sealed.
Smoke and gasses from heated biomass are forced in firebox. The smoke and
volatiles (including methane) burns in hot firebox and gives it an additional
advantage in the carbonization process. The heat transfer takes place
through the metal sheets in the retort. This design prevents the harmful
Chapter 2: Economic Analysis of Charcoal Production
33
gases to leave the chamber and are less harmful to the environment (Adam,
2009 & 2010). The size of the retort depends upon the size of the metal sheet
available. For this study, a dimension of 2.46 m (length), 1.26 m (width) and
1 m (height), therefore a total volume of 3.1 m3 was considered based on
discussion with the technology developer (Adam, 2009 &2010). The Adam
retort efficiency is about 30-40% depending upon the moisture content in
biomass. It uses wood as a biomass resource, and extra biomass for initiation
of pyrolysis process. Life of one retort is about 3 years. It operates in batch
process and can have maximum (ideal) of 5 batches per week (Adam, 2009 &
2010).
2.4.7 Black is Green Pty. Ltd (BiG)
Black is Green Pty. Ltd (BiG) is a private Australian Company which has
developed various pyrolysis equipment. BiG char units are offered in mobile
or fixed configurations. BiG’s patented fast rotary hearth technology was
developed to satisfy a need for cost effective conversion of waste biomass to
charcoal products. It has a self-fuelled direct pyrolysis by a patented fast
rotary hearth process. The hearth is double walled, insulated vessel with
stainless steel lining and decks. A range of feedstocks including chipped
green waste, manures, crop waste, grass, and weeds etc. can be used for
production of char through this technology. It needs one person for
operation. It has nominal feed input of 5,500 kg/hr. and typical conversion

Chapter 2: Economic Analysis of Charcoal Production
34
efficiency of biomass to char is about 30-35 %. The equipment needs low
maintenance.
2.5 Input Data and Assumptions
This study aims at developing data intensive techno-economic models for the
production of charcoal from biomass and landfilling of this charcoal for
carbon sequestration. In order to develop the techno-economic models, two
cases are considered which vary in terms of scale of operation. Large-scale
operation is based on the technology proposed by the North American
Company BigChar This equipment is an automated machine, developed for a
variety of feedstocks. In this study, the large-scale production of charcoal is
done in a centralized facility. The other equipment (kiln) the Adam-retort is
on small scale and is an easy to build kiln design and this technology has been
considered as a representative case for portable option. This study develops
detailed unit operations for Alberta and develops the costs and
characteristics of the each unit operation including the detailed biomass
supply and logistics. Table 2-7 shows properties of all the three straw types
considered for the production of biomass based char.
Table 2-7: Straw properties
Characteristic Wheat Straw
Barley Straw
Oat Straw
Moisture content (%)a 15.9 13.6 17.2 Lower heating value (GJ/ODt)b 18.45 19.2 18.1 Bulk density (kg/m3)3 79 82 -

Chapter 2: Economic Analysis of Charcoal Production
35
Characteristic Wheat Straw
Barley Straw
Oat Straw
Nutrient content (%)d Nitrogen 0.66 0.64 0.64 Phosphorus 0.09 0.05 0.1 Potassium 1.6 2.5 2.4 Sulfur 0.17 0.19 0.16 Ashd 8 8 7
a Derived from (Varhegyi, Chen, & Godoy, 2009) b, dDerived from (Bailey-Stamler S., Samson R., & Lem, 2007) c, dDerived from Kumar et al., 2003.
The scope of the study includes several unit operations starting from
harvesting of straw and to the production of charcoal. The total cost of
production of charcoal consists of three broad categories of costs. These
include:
1. Biomass delivery cost;
2. Capital cost;
3. Operational cost.
2.5.1 Biomass Cost
The delivered cost of biomass depends on the location of production and the
producers. Straw needs to be harvested, collected, baled and tarped before it
can be stored and transported. All these unit operations incur a cost. The
straw removed from soil carries nutrients (as stated in Table 2-7). Once
straw is removed for production of charcoal, these nutrients need to be
replaced. In this study we have estimated the nutrient replacement cost. In
addition to the cost of delivering straw to the charcoal production facility and
Chapter 2: Economic Analysis of Charcoal Production
36
nutrient replacement cost, in this study, we have also considered a payment
to the farmers for selling their straw to the bioenergy facility. This cost is to
ensure a continuous supply of biomass. Detailed delivered cost of biomass
collection are given in Tables A3, A4 and A5 in the appendix.
2.5.1.1 Straw Harvesting and Collecting Cost
In this study, it is assumed that the plant owner contracts out the straw
harvesting process; hence there is no capital cost of harvesting equipment
involved. These contractors could be farmers or a third party supplier.
The cost of harvesting depends upon various factors but largely upon the
equipment used in harvesting but a typical cost is about $10.50/bale
($21.00/green tonne for 500 kg bales) and $3.25/bale ($6.5/dry tonne for
road siding) (Campbell, 2007). Earlier studies have suggested the cost of
shredding, raking and baling to be $3.67, $2.31 and $3.65 per tonne,
respectively (Brechbill & Tyner, 2008; Sultana et al., 2010). (Kumar et al.,
2003; Sarkar & Kumar, 2010) Other studies have suggested the harvesting
cost of straw as $8.86 per green tonne (Kumar et al., 2003) and $10.58 per
dry tonne (Sarkar & Kumar, 2010), respectively. The cost of various
harvesting operations for this study is given in Table 2-8.

Chapter 2: Economic Analysis of Charcoal Production
37
Table 2-8: Straw processing equipment selection1
Equipment Working Rate
Unit Operational Cost
($/tonne)
Notes/ Source
Shredding 25 dry tonnes/hr. 35.55 Shahab Sokhansanj, Turhollow, & Wilkerson, 2008
Raking 30 dry tonnes/hr. 6.64 Baler 20 dry tonnes/hr. 71.06 Stinger – Wrapper 60 bales/hr. 27.24 Weight per bale 0.512 tonnes
2.5.1.2 Bale Wrapping Cost
Straw transport is usually in form of bales. Currently there are three types of
baling options available. Depending upon the storage time required the
baling could be either twine, plastic or net wrap. Plastic wrap is the most
protective and is used for long-term storage options. Table 2-9 summarizes
the percentage loss in dry matter for various types of storage (Brechbill &
Tyner, 2008; Kumar et al., 2003; Sarkar & Kumar, 2010).
Table 2-9: Percentage dry matter losses in straw storage
Type of wrap Values Sources Net wrap 18.8% (Brechbill & Tyner, 2008; Kumar
et al., 2003; Sarkar & Kumar, 2010).
Twine wrap 8.4% Plastic wrap 6.15%
Table 2.10 lists the cost of bale wrapping for all three types of baling and also
the bale collection cost.
1Cost of equipment [(Quantity of biomass to be processed / capacity of equipment in dt/hr.)* $
cost per hour)]

Chapter 2: Economic Analysis of Charcoal Production
38
Table 2-10: Bale wrapping cost1
Cost Factor Cost ($/tonne)
Source/Comments
Twine Wrap 0.49 (Brechbill & Tyner, 2008; Sultana et al., 2010) Net Wrap 1.77 Plastic Wrap 2.48 Twine Wrap 0.891 (Sokhansanj, Turhollow & Wilkerson, 2008) 1Cost in $/bale.
2.5.1.3 Straw Storage Cost
Biomass storage is another cost involved in the overall biomass delivery cost.
The way biomass is stored also affects the quality of biomass. The loss in the
storage depends largely upon the method of storage. In the plant considered
in this study, storage requirement is for three months, as transportation from
fields is difficult during early spring in Alberta. The bales are stored on
ground to minimize the cost. On-field storage method is the cheapest option
but the dry matter loss is 25% (Sokhansanj et al., 2008) to 30% (Campbell,
2007). Table 2-11 gives the straw storage cost.
Table 2-11: Straw Storage Cost
Equipment Working rate (unit)
Cost amortized
Notes/Source
Storage 3.62 (kg/cubic feet)
0.16 (Sokhansanj et al., 2008)
Height of storage facility
10 (feet) Assumption
On field storage cost
1.80 (Campbell, 2007)
1Bailing wrapping cost is calculated [(total biomass to be baled / weight per bale) * cost per
bale]
Chapter 2: Economic Analysis of Charcoal Production
39
Equipment Working rate (unit)
Cost amortized
Notes/Source
Storage Premium 0.10 (Brechbill & Tyner, 2008)
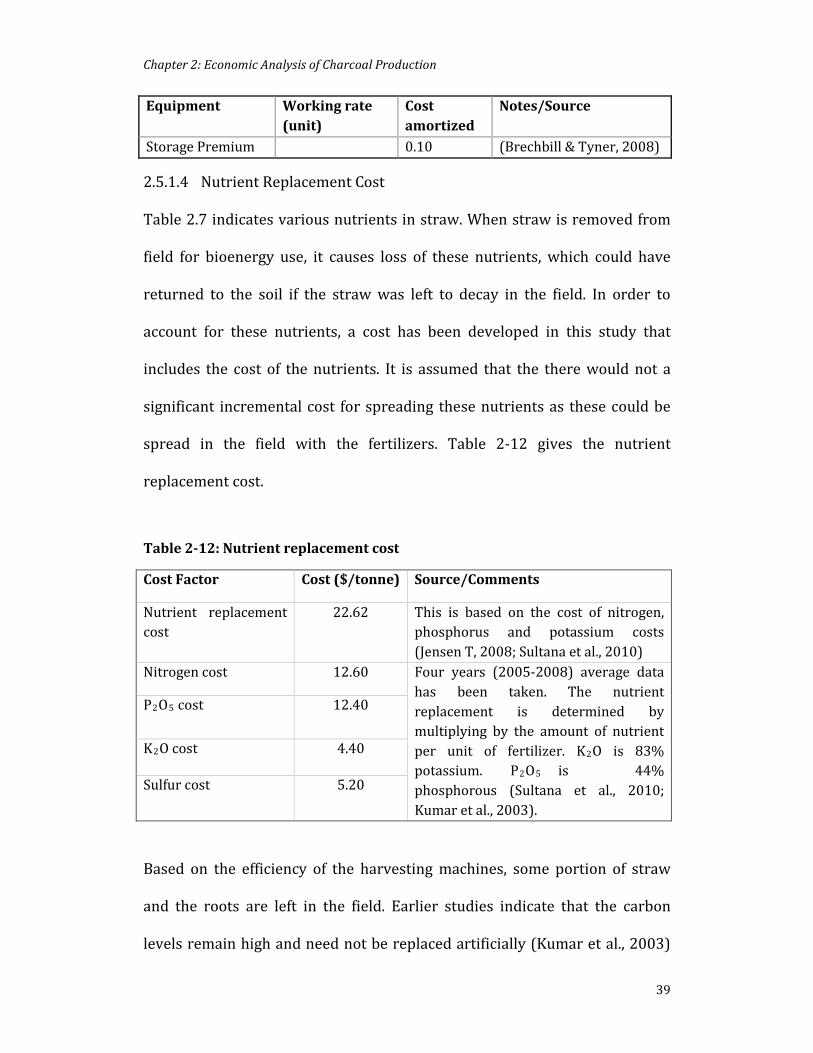
2.5.1.4 Nutrient Replacement Cost
Table 2.7 indicates various nutrients in straw. When straw is removed from
field for bioenergy use, it causes loss of these nutrients, which could have
returned to the soil if the straw was left to decay in the field. In order to
account for these nutrients, a cost has been developed in this study that
includes the cost of the nutrients. It is assumed that the there would not a
significant incremental cost for spreading these nutrients as these could be
spread in the field with the fertilizers. Table 2-12 gives the nutrient
replacement cost.
Table 2-12: Nutrient replacement cost
Cost Factor Cost ($/tonne) Source/Comments
Nutrient replacement cost
22.62 This is based on the cost of nitrogen, phosphorus and potassium costs (Jensen T, 2008; Sultana et al., 2010)
Nitrogen cost 12.60 Four years (2005-2008) average data has been taken. The nutrient replacement is determined by multiplying by the amount of nutrient per unit of fertilizer. K2O is 83% potassium. P2O5 is 44% phosphorous (Sultana et al., 2010; Kumar et al., 2003).
P2O5 cost 12.40
K2O cost 4.40
Sulfur cost 5.20
Based on the efficiency of the harvesting machines, some portion of straw
and the roots are left in the field. Earlier studies indicate that the carbon
levels remain high and need not be replaced artificially (Kumar et al., 2003)

Chapter 2: Economic Analysis of Charcoal Production
40
Alberta has abundance of calcium and minerals in its soil, hence replacement
of these nutrients are not considered in this study (Alberta Agricultural and
Rural Development, 2010; Kumar et al., 2003). In this study, only the
fertilizer cost equivalent to the straw nutrients is evaluated. It is assumed
that the spreading is done along with existing operations in farming.
2.5.1.5 Premium to Farmer
To ensure an uninterrupted supply of biomass, in addition to harvesting,
collection and nutrient cost, a premium is also is paid to the farmer for
making the straw available for charcoal production. Table 2-13
Table 2-13: Premium cost
Cost Factor Cost ($/tonne) Source/Comments Farmer premium cost 5.5 Cost of replacing the lost
nutrients in the process of straw removal. (Kumar et al., 2003)
2.5.2 Biomass Transportation Costs
Various studies have indicated that the biomass transportation cost is a
critical component of the overall delivered cost. The transportation cost of
biomass in this study has been estimated based on following assumptions.
• The area from which the plant draws straw is circular.
• The straw transport is done on existing roads via trucks.
• The straw distribution in this circular region is assumed to be uniform;
and the fraction of the harvest area used to grow wheat, barley and oats

Chapter 2: Economic Analysis of Charcoal Production
41
to the total area is 30% in Alberta (Alberta Official Statistics, 2008;
Sultana et al., 2010).
• Practically the distance of transport of biomass depends on the
geographical locations as the roads are not always in a straight line.
Hence a tortuosity factor or winding factor of 1.27 is considered in this
study (Overend R. P., 2004; Perlack R.D. & Turhollow, 2002; Sarkar S.,
2009; Sultana et al., 2010).
• The area required for a particular plant depends on the plant capacity
and straw yield.
The transportation cost consists of fixed cost and variable cost. Fixed cost of
transportation includes loading and unloading costs ($/dry tonne of
biomass). Variable cost includes driver cost, fuel cost and other costs that are
dependent on the distance ($/dry tonne/km).
The bales need to be loaded and stacked until the transport trucks come to
pick them up. This is an additional operation for handling bales. Various
studies have reported costs for this operation. Liu (2008) suggests $0.67/
green tonne for bale picker and $3.58/green tonne for tractor. (Kumar et al.
(2003) and Sultana et al. (2010) have suggested $4.80/green tonne and
$4.0/dry tone as loading and unloading values for straw, respectively.
Mahmudi & Flynn (2006) suggests a value of $4.16/green tonne of fixed
loading-unloading cost and 0.1309 $/green tonne/km of variable cost. The
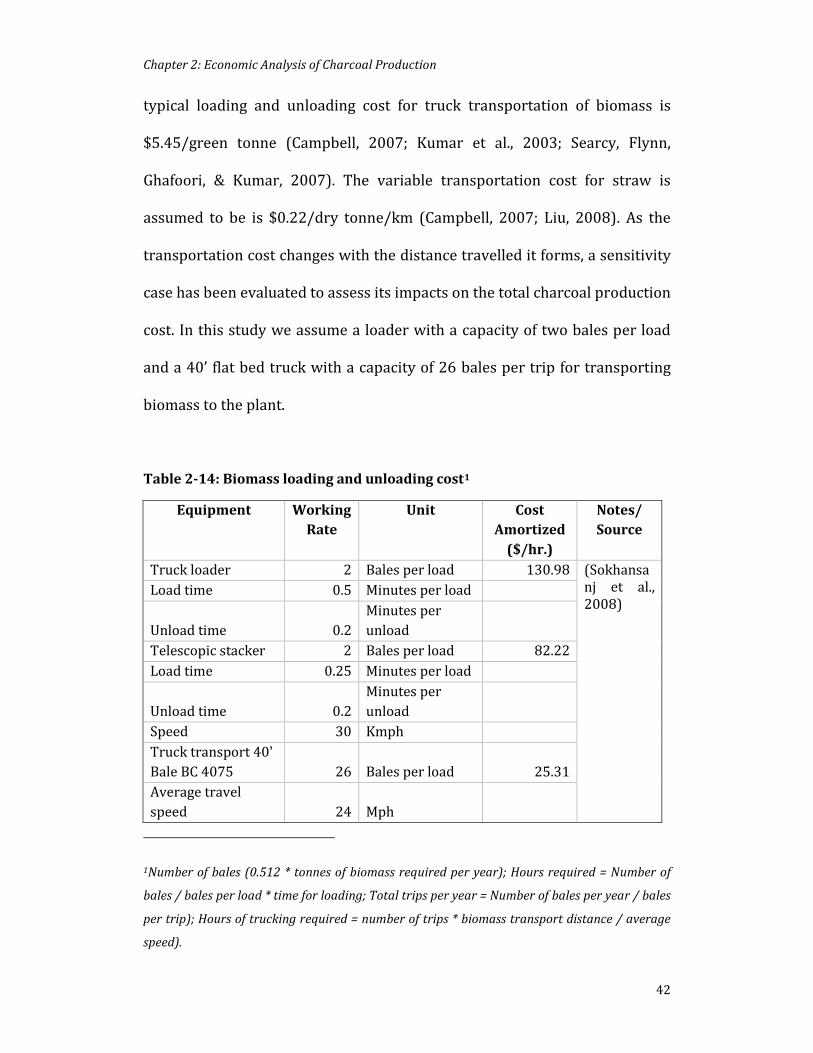
Chapter 2: Economic Analysis of Charcoal Production
42
typical loading and unloading cost for truck transportation of biomass is
$5.45/green tonne (Campbell, 2007; Kumar et al., 2003; Searcy, Flynn,
Ghafoori, & Kumar, 2007). The variable transportation cost for straw is
assumed to be is $0.22/dry tonne/km (Campbell, 2007; Liu, 2008). As the
transportation cost changes with the distance travelled it forms, a sensitivity
case has been evaluated to assess its impacts on the total charcoal production
cost. In this study we assume a loader with a capacity of two bales per load
and a 40’ flat bed truck with a capacity of 26 bales per trip for transporting
biomass to the plant.
Table 2-14: Biomass loading and unloading cost1
Equipment Working Rate
Unit Cost Amortized
($/hr.)
Notes/ Source
Truck loader 2 Bales per load 130.98 (Sokhansanj et al., 2008)
Load time 0.5 Minutes per load
Unload time 0.2 Minutes per unload
Telescopic stacker 2 Bales per load 82.22 Load time 0.25 Minutes per load
Unload time 0.2 Minutes per unload
Speed 30 Kmph Truck transport 40' Bale BC 4075 26 Bales per load 25.31 Average travel speed 24 Mph
1Number of bales (0.512 * tonnes of biomass required per year); Hours required = Number of
bales / bales per load * time for loading; Total trips per year = Number of bales per year / bales
per trip); Hours of trucking required = number of trips * biomass transport distance / average
speed).

Chapter 2: Economic Analysis of Charcoal Production
43
Equipment Working Rate
Unit Cost Amortized
($/hr.)
Notes/ Source
Time for load unload 2.6 Minute per bale x
number of bales
Time for inspection 1.3
Using the calculations and equipment as mentioned in the table above, we get
a loading-unloading cost of $1.056 ($/dry tonne) and $0.1584 ($/green
tonne /km). The detailed calculation is shown in Table A3. This cost is low as
per the literature found, thus we use $5.6 $per green tonne as loading and
unloading cost.
2.5.3 Charcoal Production Cost
The production cost for charcoal has been evaluated for two cases. These
have been described earlier in the section 2.3.7. Some of the common
assumptions are listed in the Table 2-15. The detailed equipment/kiln
specific costs are indicated in separate sections below.
Table 2-15: Economic assumptions
Factor Value Source/Comments Inflation 2% This is the average inflation over 12 years
(Kumar et al., 2003; Sarkar & Kumar, 2009; Sultana et al., 2010)
Internal rate of return
10% Assumed.
Inflation rates CAD USD 2003-2009 1.110 1.170
(Bank of Canada, 2010)
2004-2009 1.090 1.140 2007-2009 1.020 1.030 2008-2009 1.010 1.000

Chapter 2: Economic Analysis of Charcoal Production
44
Factor Value Source/Comments 1 USD to $ CDN 1.065 (USA Inflation Calculator, 2010)
2.5.3.1 Labor Costs
There are two kinds of employees, temporary (hourly paid) and permanent
(paid on monthly or annually salary). The requirement of number of labor
depends upon the level of automation in the plant. Table 2.16 below
summarizes the employee wages assumed for both the plants in the study.
Table 2-16: Labor costs
Type of Employee Wage/Rate Source/Comments
Labor ($/per annum) $40,000
(PayScale, 2009) Office Clark ($/per annum) $60,000
Manager (1) ($/per annum) $100,000
2.5.4 Production Cost for BiG Char Equipment
BiG Char is based on pyrolysis technology. The typical life of the plant is
assumed to be 10 years based on discussion with the manufacture of the
equipment (Joyce, 2011). Table 2.17 below lists various technical and
economic assumptions related to BiG Char technology. In this case charcoal is
produced in centralized facility and transported to the landfill for carbon
sequestration.

Chapter 2: Economic Analysis of Charcoal Production
45
Table 2-17: Assumption for Big Char equipment case
Parameter Value Comments/remarks Plant life 10 Plant life is based upon life of equipment,
which is 15 years. Site reclamation 10% (Kumar et al., 2003; Sarkar & Kumar, 2009). Capacity profile
Year 1 Year 2
Year 3 and onwards
80% 85% 90%
There values are assumed based on operating factors reported in earlier studies on biomass handling facilities (Kumar et al., 2003; Sarkar & Kumar, 2009).
Biomass capacity (kg/hr.)
5,500 (Bigchar, 2009).
Charcoal production (kg/hr.)
1,925 The charcoal production efficiency ranges from 20 – 35%. The conversion efficiency depends on the type of biomass. The actual efficiency needs to be determined by practical experiments with the kind of biomass intended to be used. Hence, in this study an average efficiency of 30% for biochar conversion is assumed.
Capital cost ($/kiln) (Base year 2009)
1,884,000 (Bigchar, 2009)
Maintenance cost (% of capital cost)
5% (Bigchar, 2009)
Biomass req. 48,180 This is at 100% capacity, Charcoal production (tonne/annum)
14,454
2.5.4.1 Capital Cost
The capital cost involved in this plant comprises of two major costs. The
capital cost of the equipment and the plant set-up cost. The BiG Char has two
models of pyrolysis equipment. These vary in size and in capacity for
production of charcoal. Model BiGChar 3500 and Model BiGChar 4800 have
biomass utilization capacity of 3,000 and 5,500Kg/hr., respectively. The BiG
Char Model 4800, which is the largest available model for production of
charcoal, is used in this study. It costs approximately US$ 1,844,000. This
model is an automatic and continuous flow pyrolysis machine. The total
capital cost components are shown in Table 2.18 based on assumption from

Chapter 2: Economic Analysis of Charcoal Production
46
earlier studies (Dassanayake & Kumar, 2012; Kabir & Kumar, 2011; Spath et
al., 2005). Details on the calculation of each component are given in Appendix
Table. A1.
Table 2-18: Capital cost break-up
Cost component Cost ($ values on base year 2009) 1 Equipment cost 1,884,000 2 Construction cost 640,560 3 Legal 433,320 4 Project contingency 697,080 5 Building cost 546,360 Total capital cost 4,201,320
2.5.4.2 Labor Requirements and Cost
Labor cost is another key cost component of the overall charcoal production
cost. The automation of the equipment decides the labor requirements. In the
centralized production of charcoal assumed in this study, there is a need of
total four people for biomass and charcoal handling. Another operator is
required who is responsible for operating the kiln, this also acts as a back up
for the biomass/charcoal handlers. For other responsibilities pertaining to
the plant, it is assumed that one administrative staff, one accountant and one
plant manager will be required.
2.5.4.3 Power Cost
The charcoal production plant requires electrical energy for its own
operation. The electrical energy consumption is 4% of the total energy
required to heat the biomass at the operational temperatures. Hence the total
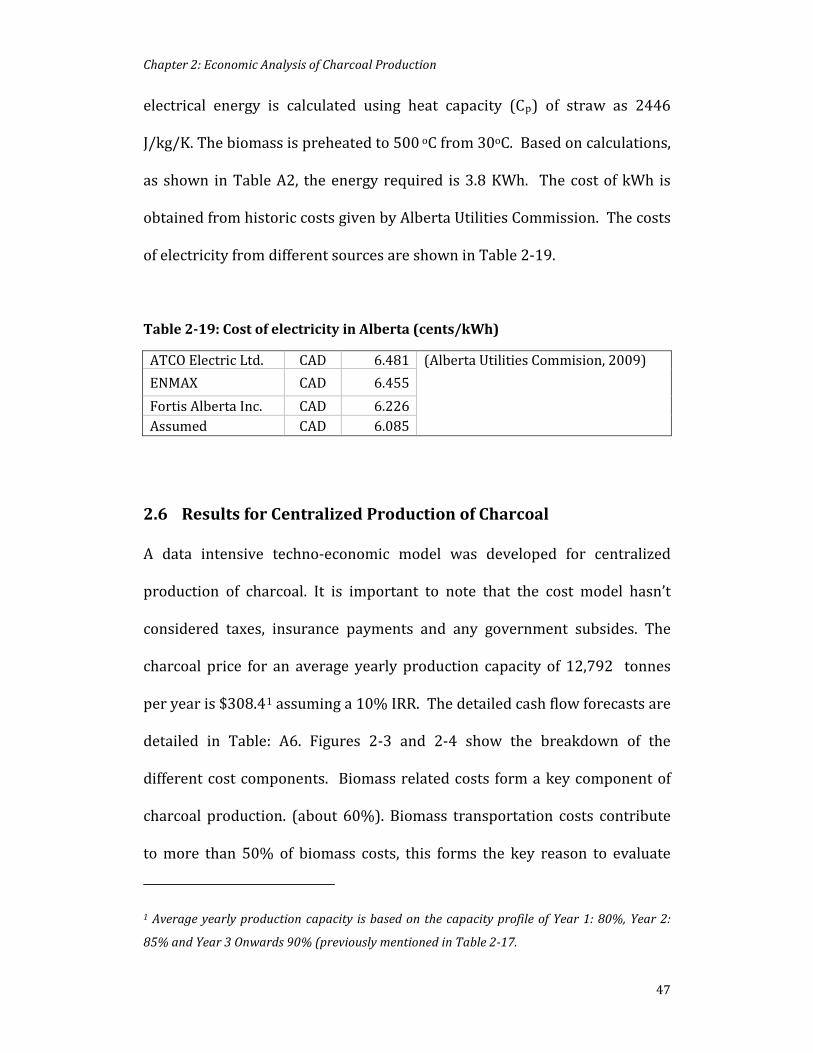
Chapter 2: Economic Analysis of Charcoal Production
47
electrical energy is calculated using heat capacity (Cp) of straw as 2446
J/kg/K. The biomass is preheated to 500 oC from 30oC. Based on calculations,
as shown in Table A2, the energy required is 3.8 KWh. The cost of kWh is
obtained from historic costs given by Alberta Utilities Commission. The costs
of electricity from different sources are shown in Table 2-19.
Table 2-19: Cost of electricity in Alberta (cents/kWh)
ATCO Electric Ltd. CAD 6.481 (Alberta Utilities Commision, 2009) ENMAX CAD 6.455
Fortis Alberta Inc. CAD 6.226 Assumed CAD 6.085
2.6 Results for Centralized Production of Charcoal
A data intensive techno-economic model was developed for centralized
production of charcoal. It is important to note that the cost model hasn’t
considered taxes, insurance payments and any government subsides. The
charcoal price for an average yearly production capacity of 12,792 tonnes
per year is $308.41 assuming a 10% IRR. The detailed cash flow forecasts are
detailed in Table: A6. Figures 2-3 and 2-4 show the breakdown of the
different cost components. Biomass related costs form a key component of
charcoal production. (about 60%). Biomass transportation costs contribute
to more than 50% of biomass costs, this forms the key reason to evaluate
1 Average yearly production capacity is based on the capacity profile of Year 1: 80%, Year 2:
85% and Year 3 Onwards 90% (previously mentioned in Table 2-17.
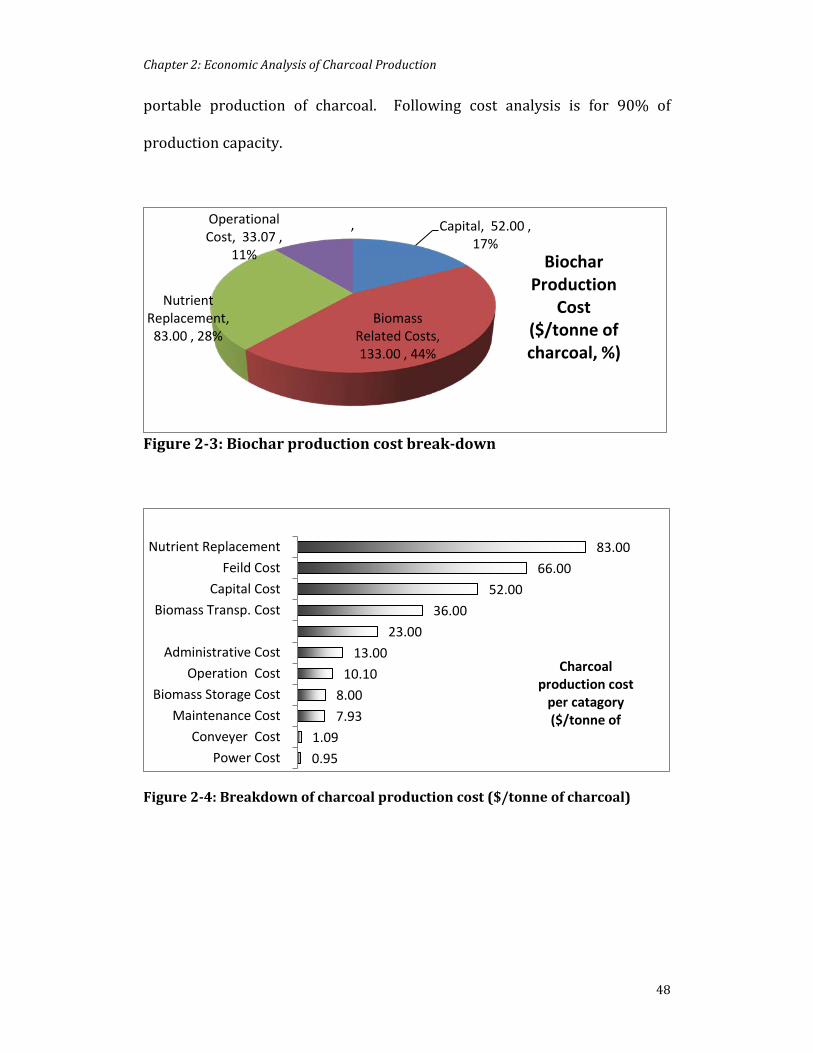
Chapter 2: Economic Analysis of Charcoal Production
48
portable production of charcoal. Following cost analysis is for 90% of
production capacity.
Figure 2-3: Biochar production cost break-down
Figure 2-4: Breakdown of charcoal production cost ($/tonne of charcoal)
Capital, 52.00 , 17%
Biomass Related Costs, 133.00 , 44%
Nutrient Replacement, 83.00 , 28%
Operational Cost, 33.07 ,
11%
,
Biochar Production
Cost ($/tonne of charcoal, %)
0.95 1.09
7.93 8.00
10.10 13.00
23.00 36.00
52.00 66.00
83.00
Power Cost Conveyer Cost
Maintenance Cost Biomass Storage Cost
Operation Cost Administrative Cost
Biomass Transp. Cost Capital Cost
Feild Cost Nutrient Replacement
Charcoal production cost
per catagory ($/tonne of

Chapter 2: Economic Analysis of Charcoal Production
49
2.7 Sensitivity Cases
2.7.1 Capital Cost Curve
Capital cost for charcoal production plants depend on the level of
sophistication or stage of development of the technology of the plant. Figure
2-5 shows the variation in cost of production of charcoal with capital cost.
Figure 2-5: Effect of capital cost
2.7.2 Effect of Charcoal Yield
The charcoal yield can be enhanced if the machine feeding mechanism and
process are modified further to suit straw as a biomass. Charcoal production
cost as a function of yield is shown in Figure 2-6. The yield values have been
varied from 15% to 35% as shown in Figure 2-6.
250260270280290300310320330340350
-40% -30% -20% -10% 0% 10% 20% 30% 40%
Char
coal
pro
duct
ion
cost
$/t
onne
% Change in capital cost

Chapter 2: Economic Analysis of Charcoal Production
50
Figure 2-6: Effect of variation in charcoal yield on the charcoal production cost
2.7.3 Auxiliary Costs
Farmers’ premium costs and nutrient replacement costs are two costs
considered in the analysis to protect the farmer’s future requirement and
consistent supply of biomass for the plant. These costs can be skipped, if
charcoal production is as a secondary operation to farming. The farmer
benefits from the charcoal and uses it along with its fertilizer, hence
preventing the soil erosion and carbon content. All this happens through
landfilling of charcoal.
250
300
350
400
450
500
550
600
650
0% 5% 10% 15% 20% 25% 30% 35% 40%
Char
coal
pro
duct
ion
cost
$/t
onne
Yield %
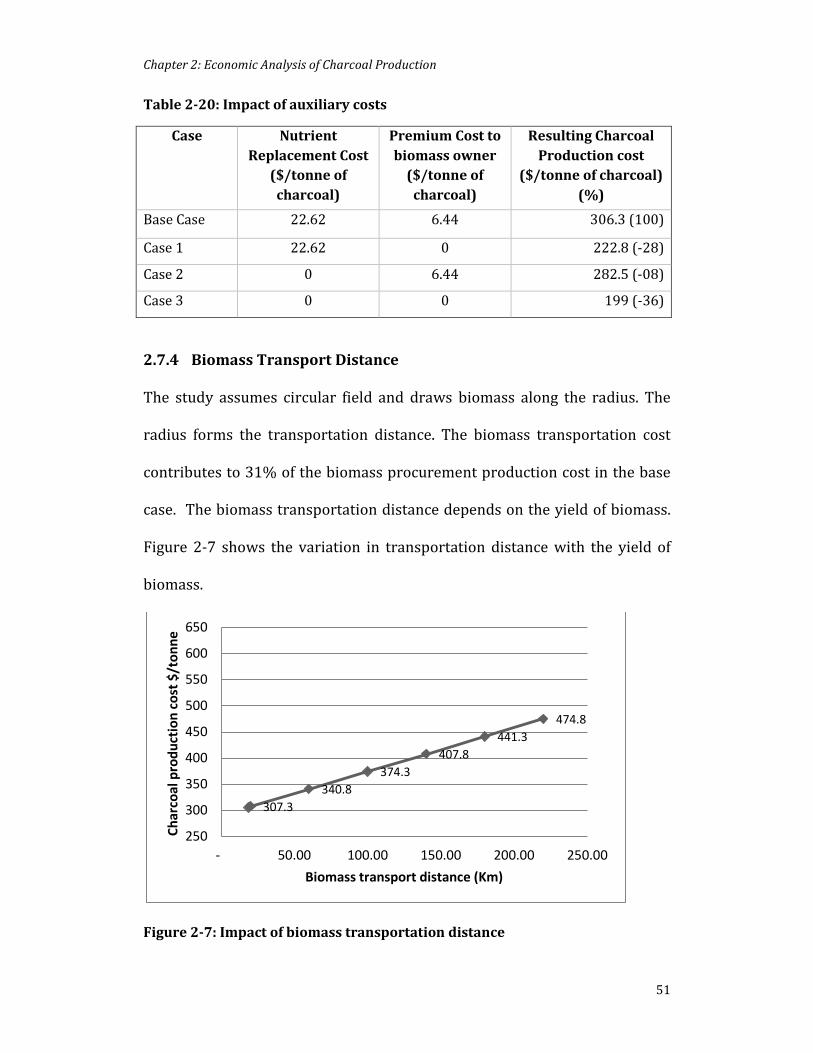
Chapter 2: Economic Analysis of Charcoal Production
51
Table 2-20: Impact of auxiliary costs
Case Nutrient Replacement Cost
($/tonne of charcoal)
Premium Cost to biomass owner
($/tonne of charcoal)
Resulting Charcoal Production cost
($/tonne of charcoal) (%)
Base Case 22.62 6.44 306.3 (100)
Case 1 22.62 0 222.8 (-28)
Case 2 0 6.44 282.5 (-08)
Case 3 0 0 199 (-36)
2.7.4 Biomass Transport Distance
The study assumes circular field and draws biomass along the radius. The
radius forms the transportation distance. The biomass transportation cost
contributes to 31% of the biomass procurement production cost in the base
case. The biomass transportation distance depends on the yield of biomass.
Figure 2-7 shows the variation in transportation distance with the yield of
biomass.
Figure 2-7: Impact of biomass transportation distance
474.8 441.3
407.8 374.3
340.8 307.3
250
300
350
400
450
500
550
600
650
- 50.00 100.00 150.00 200.00 250.00
Char
coal
pro
duct
ion
cost
$/t
onne
Biomass transport distance (Km)
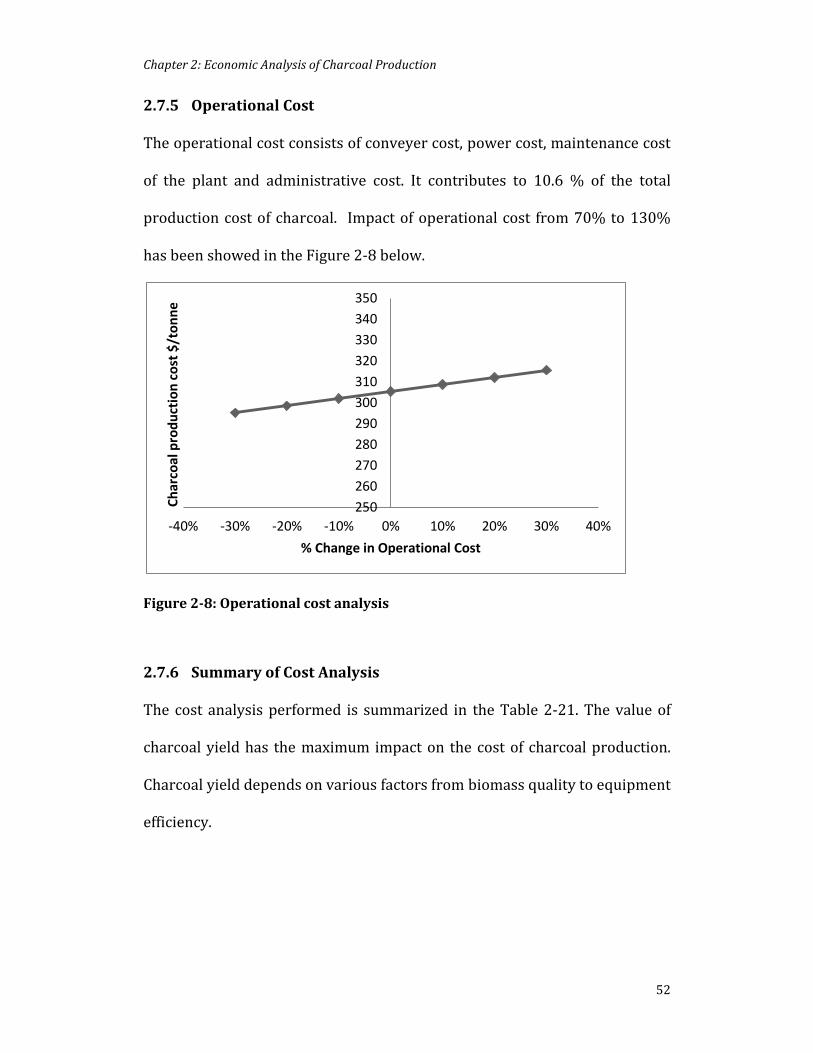
Chapter 2: Economic Analysis of Charcoal Production
52
2.7.5 Operational Cost
The operational cost consists of conveyer cost, power cost, maintenance cost
of the plant and administrative cost. It contributes to 10.6 % of the total
production cost of charcoal. Impact of operational cost from 70% to 130%
has been showed in the Figure 2-8 below.
Figure 2-8: Operational cost analysis
2.7.6 Summary of Cost Analysis
The cost analysis performed is summarized in the Table 2-21. The value of
charcoal yield has the maximum impact on the cost of charcoal production.
Charcoal yield depends on various factors from biomass quality to equipment
efficiency.
250260270280290300310320330340350
-40% -30% -20% -10% 0% 10% 20% 30% 40%
Char
coal
pro
duct
ion
cost
$/t
onne
% Change in Operational Cost

Chapter 2: Economic Analysis of Charcoal Production
53
Table 2-21: Sensitivity case summaries
Parameter % Variation from base
value
Min Value Cost
($/tonne)
Max Value Cost
($/tonne)
% Change
Capital cost -30% 30% 296.5 314.3 3.13% 0.00% Charcoal yield -50% 17% 610.8 261.8 0-84 % 21.2% Biomass Transport Distance
0% 325% 306 474.8 8.01% -7.81%
2.8 Charcoal Production in a Portable Plant
The second set-up for production of charcoal assesses the production of
charcoal in a portable plant. The study identifies various portable
technologies for charcoal production and estimates the cost of production of
charcoal. The system consists of portable plant, which is transported to the
source of biomass i.e. to the field. The plant converts biomass to charcoal and
is spread in the field. The farmer along with spreading of other fertilizers will
spread the charcoal back to the farm.
This system eliminates the need to transport biomass over long distances,
hence reducing the transportation costs and some losses of biomass
associated with long distance transport of biomass. The plant size is
restricted due to the need for portability. This reduces the annual charcoal
production capacity and is also a barrier to getting economy of scale benefits.
This section covers various assumptions, technologies currently available
and costs involved in the production of charcoal through portable plant. The
trade-off between portability and volume is studied.

Chapter 2: Economic Analysis of Charcoal Production
54
2.8.1 Various Portable Technologies for Charcoal Production
2.8.1.1 BiG Char
Black is Green Pty. Ltd (BiG) is a private Australian Company which
developed various pyrolysis equipment. BiG Char units are available in
mobile configuration. BIG’s has developed a fast rotary hearth technology to
convert biomass to charcoal products. They have two models for portable
biochar equipment. These include version 2200-G, optimized for processing
of chipped green waste, manures and sawdust and version 2200-C which is
optimized for processing fibrous, lighter grasses and crop wastes (e.g. cotton
and cane trash, straw, hay, stubble, grass and weeds) (Bigchar, 2009).
These technologies include self-fuelled direct pyrolysis by fast rotary hearth
process. These are double walled, insulated vessel with stainless steel lining
and decks. These can take a variety of feedstocks including chipped green
waste, manures, crop waste, grass, weeds etc. These are movable by trailer
or light truck. One person could operate these. These can be operated on a
vehicle, off a vehicle, or in containers. These systems have removable jacking
legs for easy loading/unloading without need of a forklift or crane and this
makes it easily portable equipment. It requires minimal maintenance and has
controlled emissions.

Chapter 2: Economic Analysis of Charcoal Production
55
Table 2-22: Characteristics of BIG Char technology
Items Values/Features Biomass feedstock Chipped green waste, manures, crop
waste, grass, weeds etc. Feed input rate 1000-1200 kg/hr. Charcoal output rate 200-360 kg/hr. Charcoal Yield 20-30% Operating temperature 400-600 0C Equipment size 2000 mm in diameter and 1200 mm in
height Power requirement 900 watts, 24 volt DC Number of operators per equipment 1 Weight of the equipment 2 tonnes
2.8.1.2 Biochar Engineering Corporation (BEC)
BEC is developing light industrial equipment that produces charcoal. This
unit processes up to 500 lbs. of woody biomass per hour. These mobile units
can be deployed at the source of the biomass. Over 500 lbs./hr. (225 kg/hr.)
screened woody biomass or agricultural biomass could be used. The biomass
should have 10% or less moisture on a dry weight basis. It can use biomass
with maximum moisture content of 20%. The electric power requirement is
about 10 kW and 12 kW at startup. The electrical connection requirement
should be about 208 V, 3-phase, or 240 V single-phase. It needs about 0.25
lb./hr. of propane at the start-up. Charcoal production capacity for this
equipment is 50-100 lbs./hr. (22-45 kg/hr.). Charcoal produced by this
equipment has about 90-98% fixed carbon. The heat requirement for these
systems is about 1.5 million Btu/hr. or 440 kW/hr. The thermal energy for
these systems could come from producer gas. The footprints of these
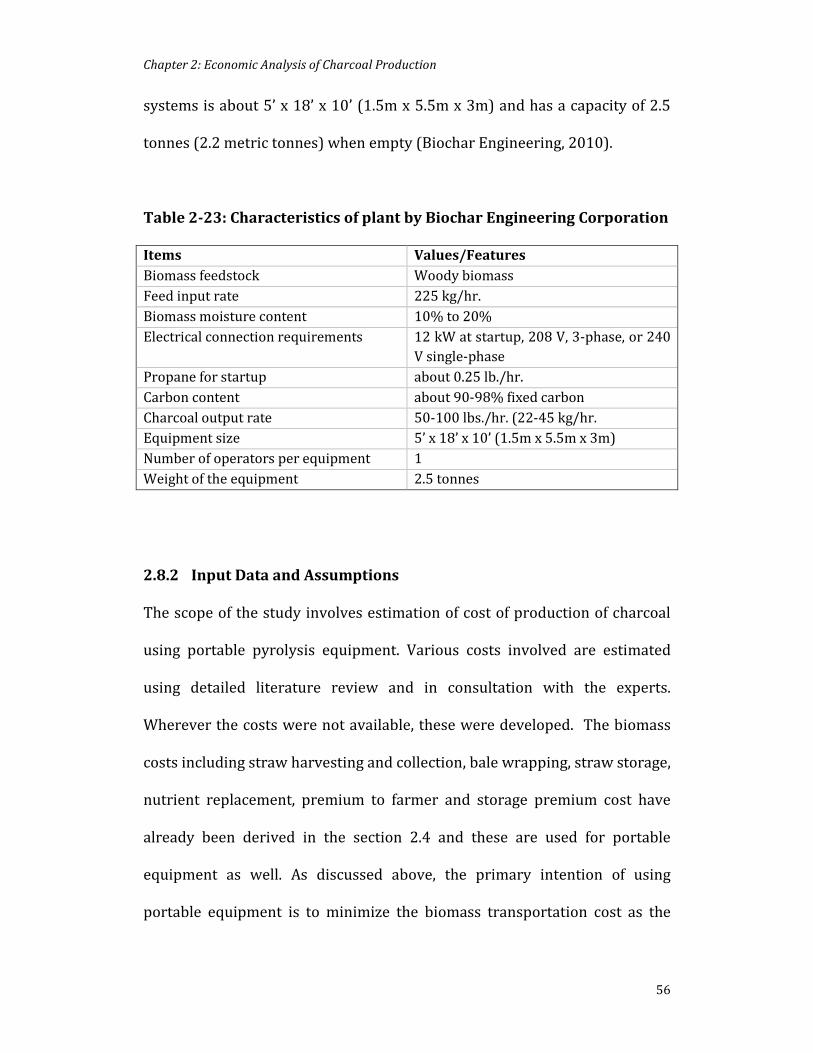
Chapter 2: Economic Analysis of Charcoal Production
56
systems is about 5’ x 18’ x 10’ (1.5m x 5.5m x 3m) and has a capacity of 2.5
tonnes (2.2 metric tonnes) when empty (Biochar Engineering, 2010).
Table 2-23: Characteristics of plant by Biochar Engineering Corporation
Items Values/Features Biomass feedstock Woody biomass Feed input rate 225 kg/hr. Biomass moisture content 10% to 20% Electrical connection requirements 12 kW at startup, 208 V, 3-phase, or 240
V single-phase Propane for startup about 0.25 lb./hr. Carbon content about 90-98% fixed carbon Charcoal output rate 50-100 lbs./hr. (22-45 kg/hr. Equipment size 5’ x 18’ x 10’ (1.5m x 5.5m x 3m) Number of operators per equipment 1 Weight of the equipment 2.5 tonnes
2.8.2 Input Data and Assumptions
The scope of the study involves estimation of cost of production of charcoal
using portable pyrolysis equipment. Various costs involved are estimated
using detailed literature review and in consultation with the experts.
Wherever the costs were not available, these were developed. The biomass
costs including straw harvesting and collection, bale wrapping, straw storage,
nutrient replacement, premium to farmer and storage premium cost have
already been derived in the section 2.4 and these are used for portable
equipment as well. As discussed above, the primary intention of using
portable equipment is to minimize the biomass transportation cost as the
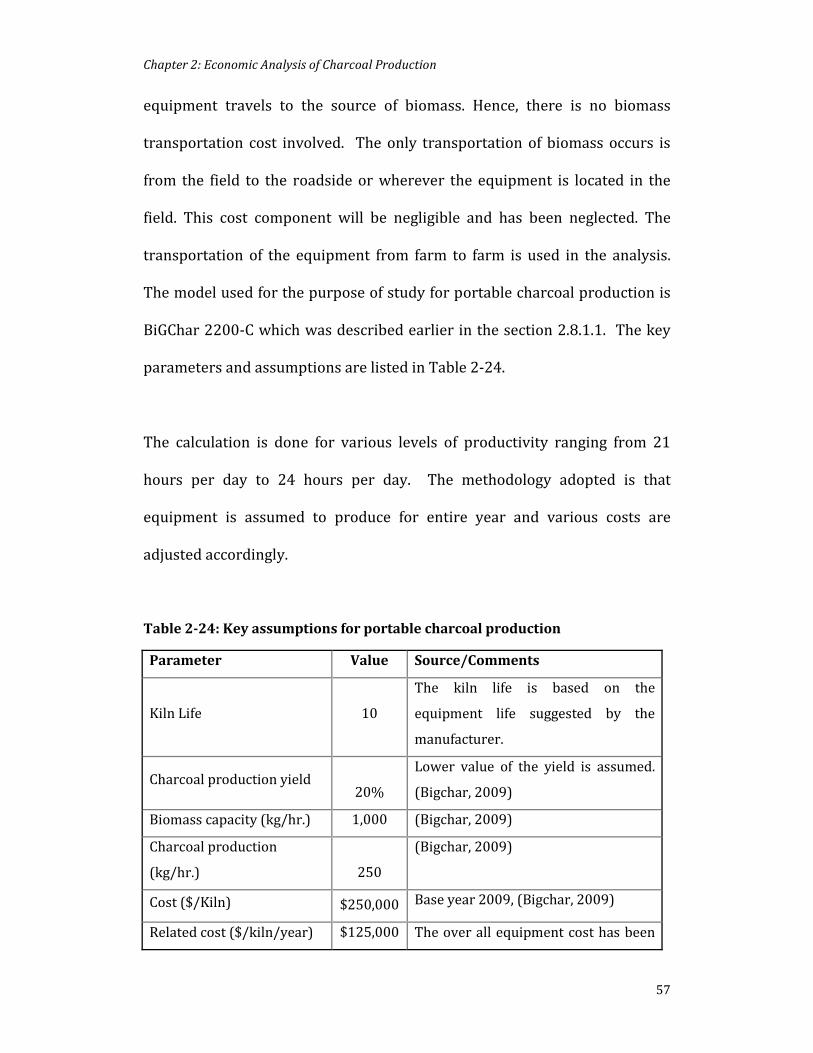
Chapter 2: Economic Analysis of Charcoal Production
57
equipment travels to the source of biomass. Hence, there is no biomass
transportation cost involved. The only transportation of biomass occurs is
from the field to the roadside or wherever the equipment is located in the
field. This cost component will be negligible and has been neglected. The
transportation of the equipment from farm to farm is used in the analysis.
The model used for the purpose of study for portable charcoal production is
BiGChar 2200-C which was described earlier in the section 2.8.1.1. The key
parameters and assumptions are listed in Table 2-24.
The calculation is done for various levels of productivity ranging from 21
hours per day to 24 hours per day. The methodology adopted is that
equipment is assumed to produce for entire year and various costs are
adjusted accordingly.
Table 2-24: Key assumptions for portable charcoal production
Parameter Value Source/Comments
Kiln Life 10
The kiln life is based on the
equipment life suggested by the
manufacturer.
Charcoal production yield 20%
Lower value of the yield is assumed.
(Bigchar, 2009)
Biomass capacity (kg/hr.) 1,000 (Bigchar, 2009)
Charcoal production
(kg/hr.) 250
(Bigchar, 2009)
Cost ($/Kiln) $250,000 Base year 2009, (Bigchar, 2009)
Related cost ($/kiln/year) $125,000 The over all equipment cost has been
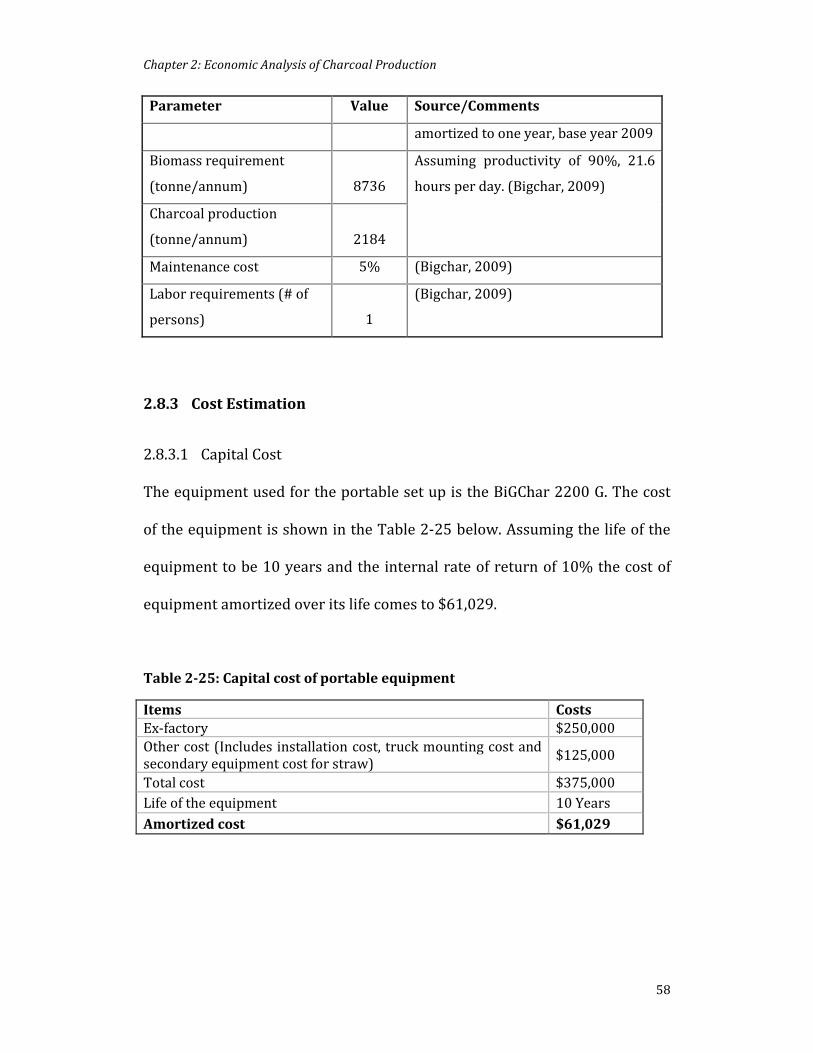
Chapter 2: Economic Analysis of Charcoal Production
58
Parameter Value Source/Comments
amortized to one year, base year 2009
Biomass requirement
(tonne/annum) 8736
Assuming productivity of 90%, 21.6
hours per day. (Bigchar, 2009)
Charcoal production
(tonne/annum) 2184
Maintenance cost 5% (Bigchar, 2009)
Labor requirements (# of
persons) 1
(Bigchar, 2009)
2.8.3 Cost Estimation
2.8.3.1 Capital Cost
The equipment used for the portable set up is the BiGChar 2200 G. The cost
of the equipment is shown in the Table 2-25 below. Assuming the life of the
equipment to be 10 years and the internal rate of return of 10% the cost of
equipment amortized over its life comes to $61,029.
Table 2-25: Capital cost of portable equipment
Items Costs Ex-factory $250,000 Other cost (Includes installation cost, truck mounting cost and secondary equipment cost for straw) $125,000
Total cost $375,000 Life of the equipment 10 Years Amortized cost $61,029
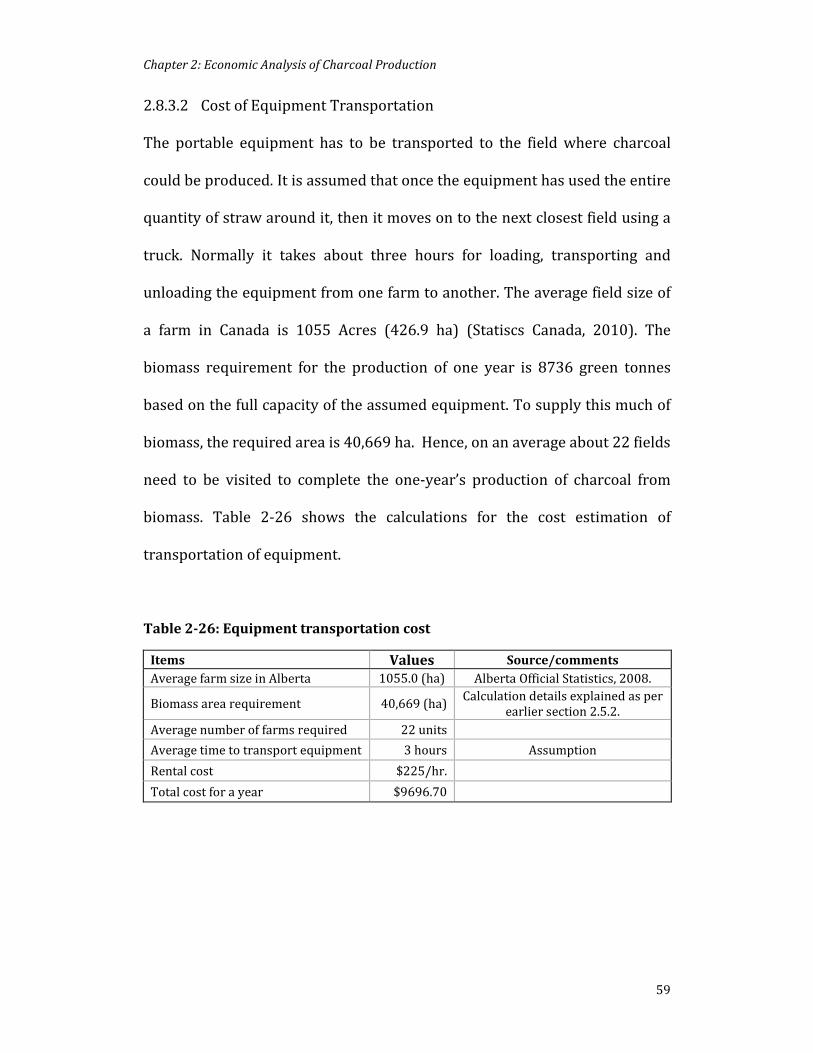
Chapter 2: Economic Analysis of Charcoal Production
59
2.8.3.2 Cost of Equipment Transportation
The portable equipment has to be transported to the field where charcoal
could be produced. It is assumed that once the equipment has used the entire
quantity of straw around it, then it moves on to the next closest field using a
truck. Normally it takes about three hours for loading, transporting and
unloading the equipment from one farm to another. The average field size of
a farm in Canada is 1055 Acres (426.9 ha) (Statiscs Canada, 2010). The
biomass requirement for the production of one year is 8736 green tonnes
based on the full capacity of the assumed equipment. To supply this much of
biomass, the required area is 40,669 ha. Hence, on an average about 22 fields
need to be visited to complete the one-year’s production of charcoal from
biomass. Table 2-26 shows the calculations for the cost estimation of
transportation of equipment.
Table 2-26: Equipment transportation cost
Items Values Source/comments Average farm size in Alberta 1055.0 (ha) Alberta Official Statistics, 2008.
Biomass area requirement 40,669 (ha) Calculation details explained as per earlier section 2.5.2.
Average number of farms required 22 units Average time to transport equipment 3 hours Assumption Rental cost $225/hr. Total cost for a year $9696.70

Chapter 2: Economic Analysis of Charcoal Production
60
2.8.4 Results and Discussion
The analysis was done for various productivity levels of the equipment. The
range of calculations is from 10 hrs. per day (low productivity case) to the
maximum of 20 hours a day (high productivity case). To ensure that the
volume of production does not impact the cost we have developed this
methodology. The total production in a given period (a year in our case) of
time is determined; it is then divided by the total cost incurred in running the
equipment for the given year. The cost of production of tonne of charcoal
ranges from $330 to $365/tonne of charcoal depending upon the capacity.
Table 2-23 gives the charcoal production cost from portable equipment.
Table 2-27: Cost assessment charcoal production from portable plant
Items Values (Low productivity
case)
Values (high productivity case)
Productivity (hrs. /day) 12 21 Productivity % 50.00% 87.50% Biomass Quantity (tonne/year) 4,600 8,050 Biomass Area (he) 20,336 35,587 Charcoal Quantity (tonne/year) 874 2,293
Capital Cost ($/year) 61,030 61,030 Field Cost ($/year) 82,883 145,045 Biomass Transp. Cost ($/year) 3,511 6,144 Nutrient Replacement ($/year) 104,050 182,088 Premium to fuel owner ($/year) 25,070 43,872 Biomass Storage Cost ($/year) 10,141 17,747
Conveyer Cost ($/year) 1,364 2,386
Operation Cost ($/year) 20,800 36,400
Maintenance Cost ($/year) 1,526 2,670

Chapter 2: Economic Analysis of Charcoal Production
61
Items Values (Low productivity
case)
Values (high productivity case)
Truck Transport Cost ($/year) 8,674 15,179
Total Costs ($/year) 319,048 $512,561
Cost of charcoal ($/tonne) $365.2 $335.3
Figure 2.9 shows various portable equipment costs with the capacity of the
equipment. In the figure X-axis is the capacity of equipment per year and Y-
axis is the $/tonne cost of production of charcoal.
Figure 2-9: Various portable Biochar Equipment costs1
1 Detailed NPV calculation for other equipment shown in the graph is detailed in Appendix:
Table A6.

Chapter 2: Economic Analysis of Charcoal Production
62
2.9 Cost of Landfilling of Charcoal
The cost of carbon sequestration through landfilling of charcoal involves
three major costs: cost of production of charcoal; cost of transportation of
charcoal; and cost of landfilling it. The landfilling cost is estimated as one
option and another option include the spreading of charcoal in the field along
with fertilizer to obtain other benefits of charcoal for plant growth.
Landfilling of charcoal is considered for the case when it is produced in a
centralized plant and in larger amount. The spreading of charcoal in the field
is considered for the case when it is produced in portable plants and in
smaller amount.
Charcoal storage at the plant for a longer time can be a significant fire hazard.
To mitigate this risk we consider disposing of charcoal approximately every
two-three months when its production is in a centralized plant. This leads to
a landfill site to be created every two-three months of production.
The quantity of charcoal produced in one year by the centralized plant is
12,792 tonnes per year (at a 90% plant capacity factor) and is used as a basis
for calculations in this study. The density of charcoal is assumed to be 300
kg/m3 (ECN, 2010). Thus average volume of charcoal per year is 43,362 m3.

Chapter 2: Economic Analysis of Charcoal Production
63
2.9.1 Productivity Calculations
To execute the landfill digging in one pass, the dimensions of landfill should
be based upon the arm length of the excavator. A detailed literature review
and consultation with the industry was conducted to decide on the selection
of the equipment. The medium range CAT excavators are the best suited.
Caterpillar® (CAT) has a series of excavator options; they are categorized into
mini, small, medium, large and ultra high demolition excavators (CAT®,
2010). The easily available CAT excavator was found to be CAT 385C-L. This
was considered in this as the digging equipment. Table 2-28 give the
details on the input data and assumptions used for estimating the landfilling
cost of the charcoal. Equations for calculation of the productivity and cycle
time are given in the appendix.
Table 2-28: Input data and assumptions for landfilling
No Item Value Source/comments 1 Sand gravel density
around land fill site 1317 kg/m3 Assumption, as area for landfill is
not a rocky land (SI Metric, 2010). 2 Bucket size 5 Cu. ft. Equipment manual and based on
the sand grave density (CAT®, 2000).
3 Depth of landfill 9 m 90% of arm length, suggested for optimum performance of the excavator.
4 Width of landfill 14 m
5 Volume of the landfill 4516 m3
Estimated based on the length, width and depth of the landfill.
6 Volume of charcoal 43,362 m3 Average yearly production. 7 Number of landfills 10 Rounded up. 8 Gravel dump distance 10 km Assumption. 9 Excavator cycle time 0.283 min (CAT, 2009).
10 Truck volumetric capacity 31.4 l cycle
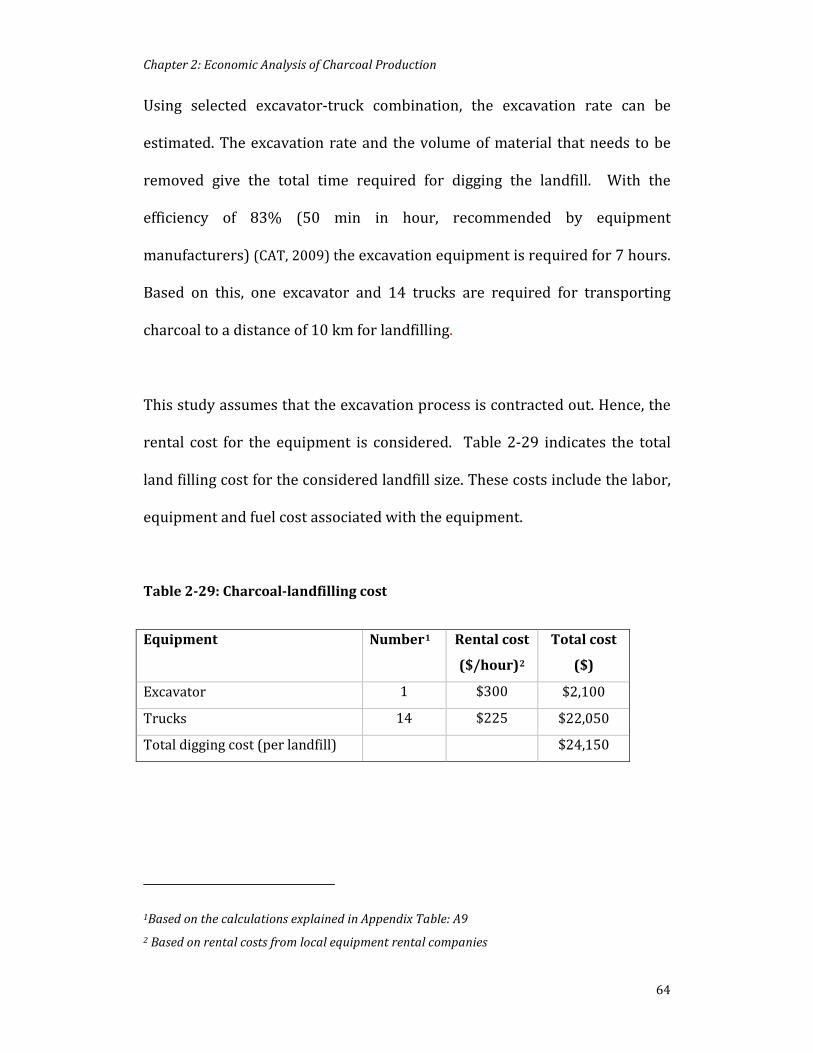
Chapter 2: Economic Analysis of Charcoal Production
64
Using selected excavator-truck combination, the excavation rate can be
estimated. The excavation rate and the volume of material that needs to be
removed give the total time required for digging the landfill. With the
efficiency of 83% (50 min in hour, recommended by equipment
manufacturers) (CAT, 2009) the excavation equipment is required for 7 hours.
Based on this, one excavator and 14 trucks are required for transporting
charcoal to a distance of 10 km for landfilling.
This study assumes that the excavation process is contracted out. Hence, the
rental cost for the equipment is considered. Table 2-29 indicates the total
land filling cost for the considered landfill size. These costs include the labor,
equipment and fuel cost associated with the equipment.
Table 2-29: Charcoal-landfilling cost
Equipment Number1 Rental cost
($/hour)2
Total cost
($)
Excavator 1 $300 $2,100
Trucks 14 $225 $22,050
Total digging cost (per landfill) $24,150
1Based on the calculations explained in Appendix Table: A9 2 Based on rental costs from local equipment rental companies

Chapter 2: Economic Analysis of Charcoal Production
65
2.9.2 Cost of charcoal transportation
The second component of cost of landfilling is the charcoal transportation
cost. The process of charcoal transport involves two stages: the loading of
charcoal on trucks; and transportation of charcoal to the landfill site. Similar
to the excavation, the transportation is also done through contractors.
Equations 4-1 and 4-2 (included in the appendix) can also be applied to the
loader and truck. It is assumed that the transportation of charcoal is done on
a weekly basis. The number of trucks required for the transportation of
charcoal per week is based on the net volume of charcoal production in a
week and the truck’s volumetric capacity.
The total truck time required is the sum of truck loading time, dump time,
and haul time and empty return time. The truck loading time is the sum of
the loader cycle time and total number of loader bucket loads required to fill
the truck. The detailed calculations are shown in the Table A: 9 in the
appendix.
Table 2-30: Charcoal transportation cost
Items Values Comments Charcoal transportation cost
$0.1832/tonne Five axle semi – trailer with 2200 cubic feet capacity is used for transportation of charcoal. Cost is specific for Alberta conditions and needs to be adjusted for other jurisdictions.
Loader heaped capacity
5 cy Maximum quantity of material the loader bucket can hold. Equipment

Chapter 2: Economic Analysis of Charcoal Production
66
Items Values Comments Manual (CAT, 1999)
Loader cycle time 0.28 min Equipment Manual (CAT, 1999) Loader production rate
1015 cy/hr. Calculated using equation 2-1.
Loader rental cost $300/hr. Loader total cost $16,768 Total rental cost of the loading
equipment
2.9.3 Charcoal production cost with landfilling cost
The landfilling cost has a significant impact on the total charcoal production
costs. The landfilling is estimated based on the digging cost as estimated in
Table 2-29 and charcoal loading and transportation cost as estimated in
Table 2-30. Based on these costs the landfilling cost is $26.80/tonne of
charcoal. Hence, the total production cost of charcoal with landfilling 332.2
$/tonne. Table A11 in the appendix gives the detail on charcoal production
and landfilling cost.
In the base case, the landfill site distance of 20 km is assumed. For distances
of 10 km, 20 km, 30 km and 40 km, the total charcoal landfilling costs are
$332, $340, $348.1 $356 $363.9 and $371.8 tonne of charcoal.
In portable production of charcoal, it is assumed that the charcoal is spread
in the field along with fertilizers. Existing equipment is used hence this case
does not incur extra cost.

Chapter 2: Economic Analysis of Charcoal Production
67
2.10 Conclusion
Total production cost for centralized production of cost is $306.3 per tonne
for an average annual capacity of 12,729 tonnes of charcoal. Biomass related
costs are major components of charcoal production cost; about 50%. Using
sensitivity case studies, Charcoal yield has the maximum impact on the cost
of production, while the capital cost, operational cost and transport distance
have a lower impact on the production cost.
Charcoal production in portable plant costs $335.3 tonne of charcoal, with an
annual capacity of 1,529 tones of charcoal. The major component of portable
costs is biomass related costs contributing over 60% of production cost.
Thus portable system costs lower but has lower volumes.
Charcoal production with landfilling costs is $332.2 tonne of charcoal and
landfilling cost is a major component for landfilling contributing to 80% of
costs.
Chapter 2: References
68
2.11 References
Adam, J. C. (2009). Improved and more environmentally friendly charcoal
production system using a low-cost retort–kiln (Eco-charcoal).
Renewable Energy, 34(8), 1923-1925.
Adam, J. C. (2010). [Personal Communication].June, 2010
Agricultural Statistics Yearbook 2008. (2008). Edmonton, Alberta Canada:
Retrieved
from: http://www1.agric.gov.ab.ca/$department/deptdocs.nsf/all/sd
d12885.
Agriculture Statistics Yearbook. (2010). (1927-4106). Edmonton Alberta.
Retrived from:
http://www1.agric.gov.ab.ca/$department/deptdocs.nsf/all/agdex13
714
Alberta Utilities Commision. (2009). Rate and tariffs, Retrieved
from: http://www.auc.ab.ca/utility-sector/rates-and-
tariffs/Pages/default.aspx
Bailey-Stamler S., Samson R., & Lem, C. H. (2007). Assessing the Agri-Fibre
Biomass Residue Resources for Creating a BIOHEAT Industry in
Alberta. Sainte Anne de Bellevue, Quebec: Resource Efficient
Agricultural Production (REAP)-Canada. Retrived from:
http://www.reap-
canada.com/online_library/feedstock_biomass/Assessing%20the%20

Chapter 2: References
69
Agri-Fibre%20Biomass%20Residue....%20(Bailey-
Stamler%20et%20al.,%202007).pdf
Bank of Canada. (2010). Rates and Statistics. Retrieved 1 July 2011,
from: http://www.bank-banque-
canada.ca/en/rates/inflation_calc.html
Best Pyrolysis Inc. (2010). Sponsored listings. Retrieved 1 August, 2010,
from: http://www.bestenergies.com/companies/bestpyrolysis.html
Bigchar, T. (2009). Black is Green Pty Ltd BiGchar 2200. Retrived from:
http://www.ehp.qld.gov.au/ecobiz/network/previous-
forums/pdf/mackay-2011/chris-gruhler.pdf
Bio Energy LCC. (2010). Bioenergy LCC ecologically clean charcoal
technologies, Russia Retrieved 1 July, 2009,
from: http://www.bioenergylists.org/stovesdoc/Yudkevitch/charcoal
/business.html
Biochar Engineering. (2010). BEC Biochar Sales. In B. Engineering (Ed.),
Water Resources (Vol. v.1.0 6/25/10, pp. 25).
Brechbill, S. C., & Tyner, W. E. (2008). The Economics of biomass collection,
transportation and supply to Indiana celluosic. Working Papers 08-03,
Purdue University, College of Agriculture, Department of Agricultural
Economics.
Campbell, C. A., & Coxworth, E. (1999). Final report on feasibility of
sequestering carbon through use of crop residue for industrial

Chapter 2: References
70
products. Report to options table of Agriculture and Agri-food table on
climate change: Analysis of greenhouse gas mitigation practices, 1999.
Campbell, K. A. (2007). A feasibility study guide for an agricultural biomass
pellet company. Agricultural Utilization Research Institute. Retrived
from: http://www.auri.org/wp-
content/assets/legacy/research/FINAL%20FEASIBILITY%20STUDY
%20GUIDE%2011-26-07.pdf
CAT. (1999). Wheel loader. In CAT (Ed.), (Vol. 3). AEHQ5657-02 (5-07) USA
CAT. (2009). Articulated truck. In CAT (Ed.), (pp. 1-20). AEHQ6031-01 (04-
2009). USA
CAT®. (2000). Comparative Bulletin 320C and 320B. In CAT (Ed.), (TEJB7010
ed.).
Dassanayake, G. D. M., & Kumar, A. (2012). Techno-economic assessment of
triticale straw for power generation. Applied Energy, 98, 236-245.
David A. Laird, Robert C. Brown, James E. Amonette, & Johannes Lehmann.
(2009). Review of the pyrolysis platform for coproducing bio-oil and
biochar. Biofuels Bioproducts & Biorefining(3), 547-562.
Deal, C., Brewer, C. E., Brown, R. C., Okure, M. a. E., & Amoding, A. (2012).
Comparison of kiln-derived and gasifier-derived biochars as soil
amendments in the humid tropics. Biomass and Bioenergy, 37, 161-
168.
Development, A. A. a. R. (2010, November 2, 2011). Agriculture Statistics
Yearbook, Retrieved
Chapter 2: References
71
from: http://www.agric.gov.ab.ca/flippingbook/agdex/853-
10/html/index.html
E Genesis Industries. (2010). E Genesis Industries Retrieved 1 November,
2010, from: http://www.egenindustries.com/
ECN. (2010). Phyllis database for biomass and waste, Retrieved
from: http://www.ecn.nl/phyllis/DataTable.asp
Elsayed M. A., & Mortirner N.B. (2001). Carbon and Energy Modelling of
Biomass Systems: Conversion Plant and Data Updates. Journal of
Environmental Quality, 8(4), 533-537.
Gaunt, J. L., & Lehmann, J. (2008). Energy balance and emissions associated
with biochar sequestration and pyrolysis bioenergy production.
Environmental Science & Technology, 42(11), 4152-4158.
Gelwicks, J. (2010). [Personal Communication]. Co-founder, Genesis
Industries, March 2010.
Herla, F. (2010). [Personal Communication]. Lamboitte Brusels, Feburary
2010.
Jensen T. (2008). Food Production and Economics of fertilizer Use —
Tracking the Returns in a Grain Crop. Better Crops, 92(3), 26-27.
Joyce, S. A. (2011). [Personal Communication]. Director, Black is Green Pty
Ltd., January 2011.
Kabir, M. R., & Kumar, A. (2011). Development of net energy ratio and
emission factor for biohydrogen production pathways. Bioresource
Technology, 102(19), 8972-8985.

Chapter 2: References
72
Kline, R. (2000). Estimating Crop Residue Cover for Soil Erosion Control. Soil
FactSheet(641), 1-4.
Kumar, A., Cameron, J. B., & Flynn, P. C. (2003). Biomass power cost and
optimum plant size in western Canada. Biomass and Bioenergy, 24(6),
445-464.
Kutney, G. (2010). [Personal Communication]. Gerry Kutney Chief Operating
Officer, Alterna Biocarbon. Feburary 2010.
Lambiotte & Cie. (2008). Lambiotte & Cie Retrieved 1 September, 2008,
from: http://www.lambiotte.com/page.php?use=62
Lang, B., & Specialist, E. C. (2002). Estimating the Nutrient Value in Corn and
Soybean Stover. Office, 5-6.
Lehmann, J. (2009). Biological carbon sequestration must and can be a win-
win approach. Climatic Change, 97(3-4), 459-463.
Lehmann, J., Rillig, M. C., Thies, J., Masiello, C. a., Hockaday, W. C., & Crowley,
D. (2011). Biochar effects on soil biota – A review. Soil Biology and
Biochemistry, 43(9), 1812-1836.
Liu, E. (2008). Straw Procurement business case. Retrived from:
https://www.gov.mb.ca/agriculture/ri/community/pdf/straw_procu
rement.pdf
Mahmudi, H., & Flynn, P. C. (2006). Rail vs truck transport of biomass. Applied
Biochemistry and Biotechnology, 129-132, 88-103.
Montross M.D., Prewitt R., Shearer S.A., Stombaugh T.S., McNeil S.G., &
Sokhansanj S. (2003). Economics of Collection and Transportation of
Chapter 2: References
73
Corn Stover. Paper presented at the American Society of Agricultural
Engineers Annual International Meeting, no. 036081. Berkeley,
California
Overend Ralph P. (2004). Thermochemical conversation of biomass.
Renewable Energy Sources Charged with Energy from the Sun and
Originated from Earth-Moon Interaction. Oxford ,UK: UNESCO, Eolss
Publishers, Encyclopedia of Life Support Systems (EOLSS)
PayScale. (2009). Compare your Salary. Retrieved Jan 2010,
from: http://www.payscale.com/
Perlack, R. D., & Turhollow, A. F. (2002). Assessmment of optionf for the
collection, handling and transport of corn stover. Retrived from:
http://www.ornl.gov/~webworks/cppr/y2001/rpt/113127.pdf
Perlack, R. D., Wright, L. L., Turhollow, A. F., Graham, R. L., Stokes, B. J.,
Erbach, D. C., & Tn, O. R. N. L. (2005). Biomass as feedstock for a
bioenergy and bioproducts industry: the technical feasibility of a
billion-ton annual supply. US Department of Agriculture. Retrived
from:
http://www1.eere.energy.gov/biomass/pdfs/final_billionton_vision_r
eport2.pdf
Roberts, K. G., Gloy, B. A., Joseph, S., Scott, N. R., & Lehmann, J. (2010). Life
cycle assessment of biochar systems: estimating the energetic,
economic, and climate change potential. Environmental Science &
Technology, 44(2), 827-833.

Chapter 2: References
74
Sarkar, S., & Kumar, A. (2009). Tehcno-economic assessment o biohydrogen
production from forest biomass in western Canada. Transactions of
the ASABE, 52(2), 519-530.
Sarkar, S., & Kumar, A. (2010). Biohydrogen production from forest and
agricultural residues for upgrading of bitumen from oil sands. Energy,
35(2), 582-591.
Sarkar Susanjib. (2009). Hydrogen production from biomass. M Sc. Thesis,
Department of Mechanical Engineering, University of Alberta,
Edmonton, Alberta.
Searcy, E., Flynn, P., Ghafoori, E., & Kumar, A. (2007). The relative cost of
biomass energy transport. Applied Biochemistry and Biotechnology,
137-140(1-12), 639-652.
Sheehan, J., Aden, A., Paustian, K., Killian, K., Brenner, J., Walsh, M., & Nelson,
R. (2003). Energy and environmental aspects of using corn stover for
fuel ethanol. Journal of Industrial Ecology, 7(3/4), 117-146.
SI Metric. (2010). SI Metric Retrieved 1 August, 2010,
from: http://www.simetric.co.uk/si_materials.htm
Society, E. (2012). Bio-energy in the black. America, 5(7), 381-387.
Sokhansanj, S., & Fenton, J. (2006). Cost Benefit of Biomass Supply and Pre-
processing. BIOCAP Canada Foundation, Kingston, Ontario, Canada
Retrived from: http://www.biocap.ca/rif/report/Sokhansanj_S.pdf
Sokhansanj, S., Mani, S., Turhollow, A., Kumar, A., Bransby, D., Lynd, L., &
Laser, M. (2009). Large-scale production, harvest and logistics of

Chapter 2: References
75
switchgrass (Panicum virgatum L.)-current technology and
envisioning a mature technology. Biofuels, Bioproducts and Biorefining,
3(2), 124-141.
Sokhansanj, S., Turhollow, A., & Wilkerson, E. (2008). Development of the
integrated biomass supply analysis and logistics model ( IBSAL )
Biomass and Bioenergy, 30 (10) 838 - 847
Spath, P., Aden, A., Eggeman, T., Ringer, M., Wallace, B., & Jechura, J. (2005).
Biomass to hydrogen production detailed design and economics
utilizing the battelle columbus heated gasifier biomass to hydrogen
production detailed design and dconomics Utilizing the dattelle
columbus.NREL. Retrived from
http://www.nrel.gov/docs/fy05osti/37408.pdf
Statiscs Canada. (2010). Total farm area, land tenure and land in crops, by
province (Census of Agriculture, 1996 to 2006). Retrieved 10 June,
2010, from: http://www.statcan.gc.ca/tables-tableaux/sum-
som/l01/cst01/agrc25a-eng.htm
Stephen, J. D. (2008). Biorefinery feedstock availablity and price variablity:
Case study of the Peace River region. Retrived from:
https://circle.ubc.ca/handle/2429/1008
Stumborg, M., Townley-Smith, L., & Coxworth, E. (1996). Sustainability and
economic issues for cereal crop residue export. Canadian Journal of
Plant Science/Revue Canadienne de Phytotechnie, 76(4), 669-673.

Chapter 2: References
76
Sultana, A., Kumar, A., & Harfield, D. (2010). Development of agri-pellet
production cost and optimum size. Bioresource Technology, 101(14),
5609-5621.
USA Inflation Calculator. (2010). USA Inflation Calculator Retrieved 1 July,
2010, from: http://www.usinflationcalculator.com/
Usda. (2009). North America ’ s Wood Pellet Sector. United Stated department
of Agriculture. Retrived from:
http://www.fpl.fs.fed.us/documnts/fplrp/fpl_rp656.pdf
Varhegyi, G. b., Chen, H., & Godoy, S. (2009). Thermal Decomposition of
Wheat, Oat, Barley, and Brassica carinata Straws. A Kinetic Study.
Energy & Fuels, 23(2), 646-652.
Chapter 3: Life Cycle Energy and Emission Analysis of Charcoal Production form Biomass and its Sequestration
77
Chapter 3 Life Cycle Energy and Emission Analysis of
Charcoal Production from Biomass and its Sequestration
3.1 Introduction
The charcoal produced from agricultural biomass is landfilled that can help
in sequestering of carbon in the soil. Charcoal predominantly consists of
carbon and it can stay there for a long time with minimal degradation. The
stability of charcoal depends upon the feedstock properties and pyrolysis
process (Gaunt & Lehmann, 2008). In this study the focus is on production of
charcoal from straw. Currently, most of the straw produced in Canada is left
in the field to rot and ultimately it emits carbon dioxide to the atmosphere
(Kumar et al., 2003; Sultana et al., 2010).
The process of production of charcoal from straw and its landfilling involves
a number of unit operations. All these unit operations need energy and
material inputs. Hence, it is critical to assess the amount of GHG emissions in
all these unit operations. This would help in finally assessing the net carbon
sequestration through this pathway. In this chapter the focus is on
assessment of energy inputs and associated GHG emissions over the life cycle
of the charcoal production and it’s landfilling.
Chapter 3: Life Cycle Energy and Emission Analysis of Charcoal Production form Biomass and its Sequestration
78
There are some studies done on carbon sequestration through charcoal
production. Earlier studies on charcoal production use theoretical values of
yield of charcoal from biomass (Gaunt & Lehmann, 2008; Hammond et al.,
2011; Ibarrolaet al., 2012). In reality, the key constraint for current charcoal
production equipment is capacity of the plant. The capacities of plants
discussed in earlier studies are higher than any current commercially
available pyrolysis equipment optimized for charcoal production. The
results of the life cycle assessment of all the cases are discussed in Chapter 4.
3.2 Methodology, Scope and Limitations
In this study, the GHG emissions in various operations of charcoal production
are assessed. Various studies have shown numbers for GHG emissions in
agricultural activities, such as harvesting, bailing and transportation (Nagy,
1999; Sokhansanj et al., 2008). The estimation of CO2 abatement is
dependent on the quantity of carbon in landfilled charcoal (80% of charcoal).
The carbon abatement cost is also calculated ($ per tonne of CO2 mitigated)
based on the production cost charcoal estimated in chapter 2.
Studies have shown that charcoal has a capacity to reduce N2O emissions
from soil (Beesley et al., 2011; Bruun et al, 2012; Bruun, et al. 2011; Loa,
2010; Rogovska et al., 2008). Currently we do not have enough data to
identify the net sequestration; but this can enhance the potential of GHG
mitigation through landfilling of charcoal. In addition, charcoal also enhances

Chapter 3: Life Cycle Energy and Emission Analysis of Charcoal Production form Biomass and its Sequestration
79
the plant growth and hence increases the rate of absorption of CO2 by
biomass. This additional sequestration potential of CO2 has not been
considered in this study (Bruun et al., 2011; Loa, 2010; Rogovska et al.,
2008).
The net carbon mitigation in production of charcoal and its sequestration in
landfill are estimated by taking into account the carbon emissions in various
unit operations including harvesting and collection of straw, transportation
of straw, pyrolysis of straw, transportation of charcoal and landfilling of
charcoal. The carbon emissions are calculated based on the amount of fuel
consumption in each of the unit operations. Table 3-1 summarizes various
parameters used to calculate energy requirements and carbon emissions in
various unit operations. Figure 3-1 shows the unit operations involved in life
cycle assessment.

Chapter 3: Life Cycle Energy and Emission Analysis of Charcoal Production form Biomass and its Sequestration
80
Table 3-1: Emission and energy factors
Items Energy required (GJ/t)1
GHG emissions involved (Kg CO2 eq./t)2
% To be land filled 3
Source / Comments
Steel (usage 30%) 25.5 2500 25%
For material acquisition, manufacturing and transportation (ICF Consulting, 2005)
Recycled steel (usage 70%)
9.7 1820
Aluminum 120.3 3470 100%
Landfilling 0.08 7.45
Based on transportation of charcoal to a distance of 200 km for landfilling(ICF Consulting, 2005).
Concrete 0.87 120
100%
Includes procurement, processing, and transportation of concrete (Flower & Sanjayan, 2007; Horvath, 2004)
Diesel 51.5 4.1
Values for IL of diesel combustion ((S&T)2 Consultants Inc., 2009; Elsayed et al., 2003; ICF Consulting, 2005)
1Energy required in GJ per tonne of raw material consumption due to its manufacturing,
transportation, acquisition and other related operations. 2GHG emissions involved in per tonne of raw material consumption (manufacturing,
transportation, acquisition and other related operations). 3This column indicates the % of material that is assumed to be landfilled after the plant is
decommissioned.

Chapter 3: Life Cycle Energy and Emission Analysis of Charcoal Production form Biomass and its Sequestration
81
Figure 3-1: LCA and energy methodology
3.3 Life Cycle Assessment for Production of Charcoal
The life cycle assessment (LCA) of the pathway for production of charcoal
and its landfilling would help in assessing the net impact of the process on
the environment. This study is based on the LCA methodology documented
in ISO 14040 and ISO 14044. The overall process of LCA follows three steps
as defined by the standard and these include: goal and scope definition,
inventory analysis and impact assessment.
Chapter 3: Life Cycle Energy and Emission Analysis of Charcoal Production form Biomass and its Sequestration
82
3.3.1 Goal and Scope
The LCA is used in this study to determine the net carbon sequestered in the
soil through conversion of agricultural biomass to charcoal and it landfilling.
The GHG emitted in each of the unit operations involved in this pathway has
also been considered in determining the net carbon sequestration. The
results of this study would help in comparative assessment of this pathway of
sequestration of carbon with other pathways of carbon sequestration based
on other renewable energy processes.
3.3.1.1 Key Objectives
The overall objective of this study is to assess the total carbon sequestration
in the conversion of agricultural biomass to charcoal and its sequestration in
the landfill. The specific objectives are:
• Determination of life cycle energy consumption in production of 1 tonne
of charcoal from agricultural biomass and its landfilling;
• Determination of net energy ratio (NER) for this pathway where the NER
of the system is defined as the energy produced divided by the life cycle
fossil fuel energy consumption. (Kabir et al. 2012; Keoleian & Volk, 2005)
• Quantification of GHG emissions in production of 1 tonne of charcoal
from agricultural biomass and its landfilling;
• Determination of GHG emissions over the life cycle of charcoal from
agricultural biomass considering all the unit operations involved in this
pathway.
Chapter 3: Life Cycle Energy and Emission Analysis of Charcoal Production form Biomass and its Sequestration
83
3.3.1.2 Functional Unit
The primary purpose of the functional unit is to provide a reference to
compare the inputs and outputs of the different unit operations. In this study
one tonne of C is the functional unit.
3.3.2 Unit Processes
The overall charcoal production and landfilling pathway is divided into five
major unit operations over the life cycle. These include: straw processing
(UP1), straw transport (UP2), plant operations & charcoal production (UP3),
charcoal transport (UP4) and landfilling of charcoal (UP5). These major unit
operations have several sub-unit operations. The GHG emissions have been
assessed for all these unit operations. The system omits processes for
production of biomass as it is assumed that existing straw is used. Figure 3.2
shows the detailed unit operations involved in production of charcoal from
straw and it’s landfilling.
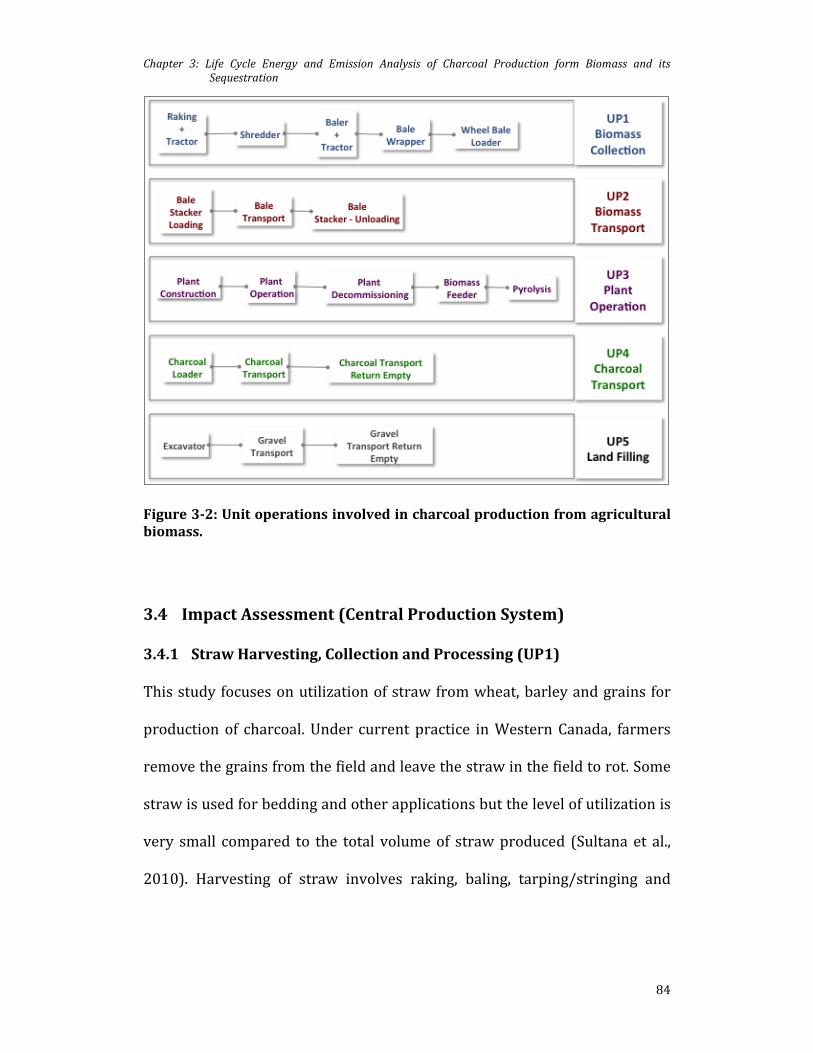
Chapter 3: Life Cycle Energy and Emission Analysis of Charcoal Production form Biomass and its Sequestration
84
Figure 3-2: Unit operations involved in charcoal production from agricultural biomass.
3.4 Impact Assessment (Central Production System)
3.4.1 Straw Harvesting, Collection and Processing (UP1)
This study focuses on utilization of straw from wheat, barley and grains for
production of charcoal. Under current practice in Western Canada, farmers
remove the grains from the field and leave the straw in the field to rot. Some
straw is used for bedding and other applications but the level of utilization is
very small compared to the total volume of straw produced (Sultana et al.,
2010). Harvesting of straw involves raking, baling, tarping/stringing and

Chapter 3: Life Cycle Energy and Emission Analysis of Charcoal Production form Biomass and its Sequestration
85
road siding. This study has assumed zero-till system since it is environment
friendly and cost efficient (Tillage, 2012).
The total amount of straw harvested per year depends on the size of the
charcoal production plant. In the LCA study, the size of the charcoal
production is assumed to be the same as discussed in Chapter 2. The total
production capacity of charcoal from straw is 13,009 tonnes per year based
on earlier calculation for a centralized system. The average harvested area
for production of 13,009 tonnes of charcoal is 196,774 ha.
The LCA analysis assumes conventional equipment, which is used for
harvesting in Western Canada, and data has been collected from earlier
studies. Wherever possible, the largest size of the machinery has been
considered to get better processing efficiency. The assumption in this study is
that the baler picks up the straw and produces rectangular bales (4΄ x 4΄ x 8΄).
After baling, the automatic bale collector collects the bales and puts them
into the side of the field. In section 2.5.1 of this thesis, various equipment
costs have been determined. These calculations were based on the hours
required by equipment to complete the process for the selected size of the
plant. Equipment fuel requirements were determined from earlier studies
(Sokhansanj et al., 2008; Nagy, 1999). Table 3.2 gives the detail on energy
requirement and GHG emissions for straw collection and processing.
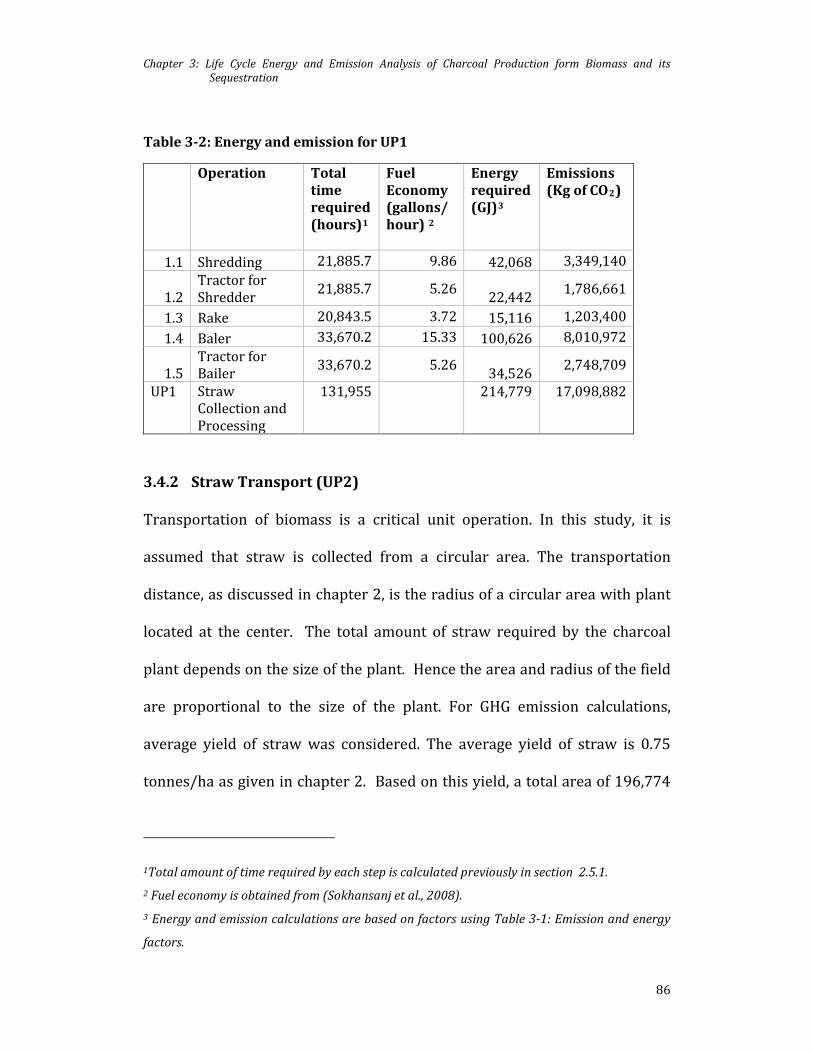
Chapter 3: Life Cycle Energy and Emission Analysis of Charcoal Production form Biomass and its Sequestration
86
Table 3-2: Energy and emission for UP1
Operation Total time required (hours)1
Fuel Economy (gallons/ hour) 2
Energy required (GJ)3
Emissions (Kg of CO2)
1.1 Shredding 21,885.7 9.86 42,068 3,349,140
1.2 Tractor for Shredder 21,885.7 5.26 22,442 1,786,661
1.3 Rake 20,843.5 3.72 15,116 1,203,400 1.4 Baler 33,670.2 15.33 100,626 8,010,972
1.5 Tractor for Bailer 33,670.2 5.26 34,526 2,748,709
UP1 Straw Collection and Processing
131,955 214,779 17,098,882
3.4.2 Straw Transport (UP2)
Transportation of biomass is a critical unit operation. In this study, it is
assumed that straw is collected from a circular area. The transportation
distance, as discussed in chapter 2, is the radius of a circular area with plant
located at the center. The total amount of straw required by the charcoal
plant depends on the size of the plant. Hence the area and radius of the field
are proportional to the size of the plant. For GHG emission calculations,
average yield of straw was considered. The average yield of straw is 0.75
tonnes/ha as given in chapter 2. Based on this yield, a total area of 196,774
1Total amount of time required by each step is calculated previously in section 2.5.1. 2 Fuel economy is obtained from (Sokhansanj et al., 2008). 3 Energy and emission calculations are based on factors using Table 3-1: Emission and energy
factors.

Chapter 3: Life Cycle Energy and Emission Analysis of Charcoal Production form Biomass and its Sequestration
87
ha and radius of 21.19 km is estimated. Table 3.3 gives the energy and GHG
emissions for straw transport.
Table 3-3: Energy and GHG emissions for UP2
Operation Total time required (hours)1
Fuel Economy (gallons/ hour)2
Energy required (GJ)3
Emissions (Kg of CO2)
2.1 Loader field 2550.8 14.81 7,365 586,306
2.2 Biomass loading 2550.8 3.5 1,740 138,560
2.3 Biomass truck transport 69660.5 24.09 327,147 26,044,734
2.4 Unloaded 2040.6 3.5 1,392 110,848 UP2 Straw
transport (Sub-total)
76802.6 337,645 26,880,447
3.4.3 Plant Construction, Operation and Commissioning (UP3)
3.4.3.1 Plant Construction
Energy and GHG emissions in production of the materials used for the
construction of the plant have been studied to determine the GHG emissions
in overall plant construction. Primary energy inputs and GHG emissions
during the plant construction is difficult to determine and can be considered
negligible compared to the construction materials embodied impacts.
1Total amount of time required by each step is calculated previously in section 2.5.2. 2 Fuel economy is obtained from (Sokhansanj et al., 2008) 3Energy and emission calculations are based on factors using Table 3-1: Emission and energy
factors multiplied by fuel consumption

Chapter 3: Life Cycle Energy and Emission Analysis of Charcoal Production form Biomass and its Sequestration
88
Various earlier studies such as LCA of natural gas combined power
generation system (Mann & Spath, 2000), hydrogen production via natural
gas steam reforming (Mann & Spath, 2001), bio-hydrogen production (Kabir
& Kumar, 2011) and power production from triticale (Dassanayake, 2011)
were used to approximate the plant size and material required. GHG
emissions and energy requirements for plant construction are detailed in
Table 3-4: Energy and GHG emissions for plant operations (UP3)
3.4.3.2 Plant Operation
Energy input and GHG emissions involved during plant maintenance is found
to be 2.5 to 5% of the plant construction energy and GHG emission (Elsayed
et al., 2003). For this study, it is considered that the GHG emissions are 3%
(assumption) of the plant construction.
Pyrolysis: It is assumed that CO2 emissions during biomass conversion step
are balanced by the CO2 absorbed during the phases of its growth (Gupta,
2010; Roberts et al., 2010). Hence, GHG emissions during energy conversion
stage of straw (pyrolysis) have been disregarded. No fossil fuel or electricity
needed to operate a pyrolysis plant (Ringer et al., 2006).
Biomass feeding mechanism: A chain conveyer is used to transfer biomass to
the pyrolysis equipment. The equipment is a chain conveyer with a capacity
of 50 dt/hour and fuel consumption of 2.19 gallons/hour (Sokhansanj et al.,

Chapter 3: Life Cycle Energy and Emission Analysis of Charcoal Production form Biomass and its Sequestration
89
2006). The total hours required for this operation was calculated previously
in section 2.5.3.
3.4.3.3 Plant Decommissioning
For all plants, the decommissioning impact is assumed to amount to 3% of
the construction impact (Dassanayake & Kumar, 2012; Kabir et al., 2012).
After decommissioning, materials are transported by truck for 50 km to a
landfill. Inventory data for the truck are given above. All non-recyclables are
landfilled at a distance of 50 km from the plant. Only 25% of the steel used is
landfilled while all the other materials are 100% landfilled (ICF Consulting,
2005).

Chapter 3: Life Cycle Energy and Emission Analysis of Charcoal Production form Biomass and its Sequestration
90
Table 3-4: Energy and GHG emissions for plant operations (UP3)
Material required in plant
construction
Amount of
material required (tonnes)
Energy required (GJ)1
GHG emissions (Kg of CO2 eq.)
Plant Construction2 Concrete 967.72 842 116,126 Steel 307.20 4,436 621,767 Aluminum 2.02 243 7,008 Total (plant construction) 5,521 744,901 Plant Operation 3% of Construction 166 22,347 Plant Decommissioning Land filling concrete 100% 77 116,126 Land filling steel 25% 6 572 Land filling aluminum 100% 0.16 15 Decommissioning process 3% of construction 221 29,796
3.4.4 Transportation (UP4) and Landfilling of Charcoal (UP5)
The volume of charcoal produced in a year is 13,009 tonnes. The
transportation of charcoal is described in section 2.9.2 of this thesis. The
1Energy and emission calculations are based on parameters using Table 3-1: Emission and
energy factors. 2Materials required for the construction of the size of the charcoal production plant considered
in this study were estimated based on data from earlier studies and also adjusted using a scale
factor of 0.76 (Anex et al., 2010; Gaunt & Lehmann, 2008; Kabir et al., 2012; Mann & Spath,
2001).
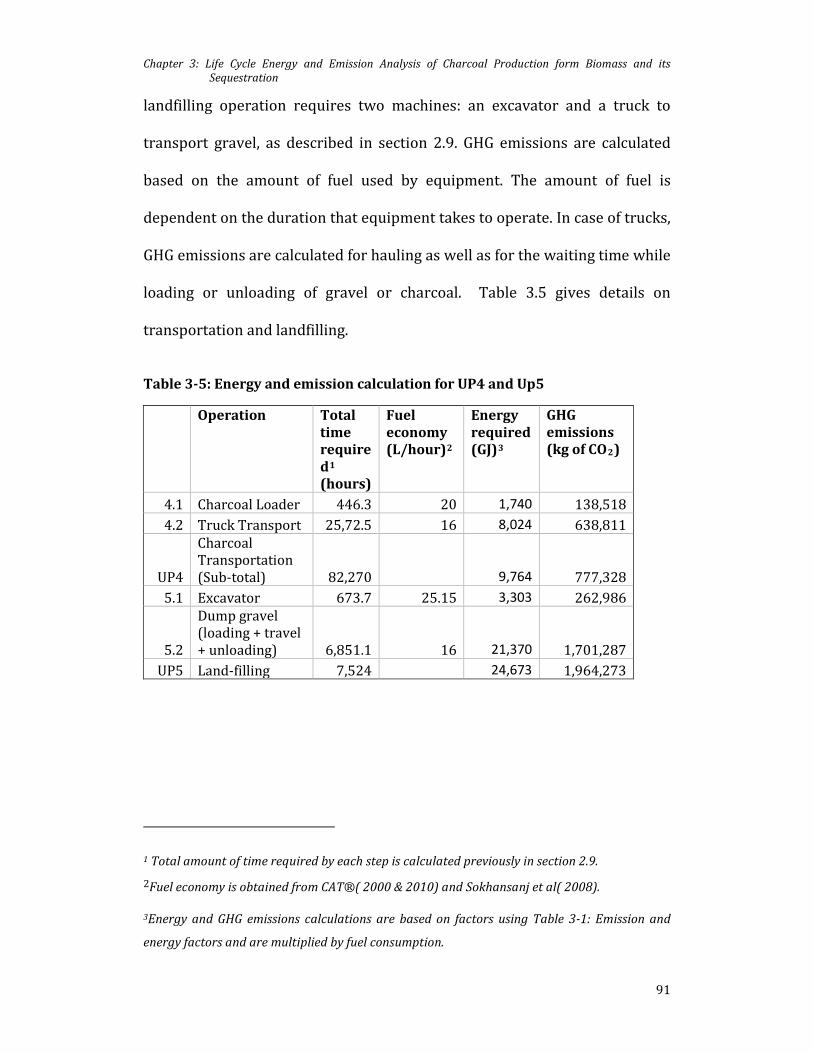
Chapter 3: Life Cycle Energy and Emission Analysis of Charcoal Production form Biomass and its Sequestration
91
landfilling operation requires two machines: an excavator and a truck to
transport gravel, as described in section 2.9. GHG emissions are calculated
based on the amount of fuel used by equipment. The amount of fuel is
dependent on the duration that equipment takes to operate. In case of trucks,
GHG emissions are calculated for hauling as well as for the waiting time while
loading or unloading of gravel or charcoal. Table 3.5 gives details on
transportation and landfilling.
Table 3-5: Energy and emission calculation for UP4 and Up5
Operation Total time required1 (hours)
Fuel economy (L/hour)2
Energy required (GJ)3
GHG emissions (kg of CO2)
4.1 Charcoal Loader 446.3 20 1,740 138,518 4.2 Truck Transport 25,72.5 16 8,024 638,811
UP4
Charcoal Transportation (Sub-total) 82,270 9,764 777,328
5.1 Excavator 673.7 25.15 3,303 262,986
5.2
Dump gravel (loading + travel + unloading) 6,851.1 16 21,370 1,701,287
UP5 Land-filling 7,524 24,673 1,964,273
1 Total amount of time required by each step is calculated previously in section 2.9. 2Fuel economy is obtained from CAT®( 2000 & 2010) and Sokhansanj et al( 2008).
3Energy and GHG emissions calculations are based on factors using Table 3-1: Emission and
energy factors and are multiplied by fuel consumption.

Chapter 3: Life Cycle Energy and Emission Analysis of Charcoal Production form Biomass and its Sequestration
92
3.5 Energy and Emission Analysis
The above steps determine the net fuel consumption for each unit processes
production of biomass-based charcoal. Figure 3-31 summarizes the results
for the GHG emissions and energy consumptions for each unit process. Straw
transport contributes to 56% of the GHG emissions followed by straw
processing (36%). The total average fuel consumption per year is 2,452,358
liters of diesel, which amounts to the GHG emissions of 9951 tonnes of CO2
per year. Biomass-based charcoal consists of 80% carbon (ECN, 2010;
Lehmann, 2007; Roberts, Gloy, Joseph, Scott, & Lehmann, 2010), thus using
molecular weight of carbon dioxide we can estimate the amount of carbon
sequestered.
Figure 3-3: GHG emissions source break-up
1 The values in pie charts for emission are in the format (UP, KgCO2eq per tonne of biochar, %
share) for emission and are (UP, GJ/tonne of biochar, % Share) for energy consumed.
UP1: Biomass Collection,
133.67, 36% UP2: Biomass
Transport, 210.14, 56%
UP3: Plant Operation, 7.20, 2%
UP4: Charcoal
Transport, 6.08, 2%
UP5: Charcoal Land filling, 15.36, 4%
Emission Produced per tonne of Biochar

Chapter 3: Life Cycle Energy and Emission Analysis of Charcoal Production form Biomass and its Sequestration
93
Figure 3-4: Energy consumption in Charcoal production
The net carbon sequestered is 7,691 tonne per year. Thus efficiency in
mitigation is calculated as per Equation 3-1.
Equation 3-1 Efficiency of Carbon Mitigation
𝜂𝑚𝑖𝑡𝑖𝑔𝑎𝑡𝑖𝑜𝑛 = (𝐶𝑝 − 𝐶𝑓)/(𝐶𝑝)
Where: 𝜂𝑚𝑖𝑡𝑖𝑔𝑎𝑡𝑖𝑜𝑛 is plant efficiency of carbon mitigation, Cp is carbon
content in biomass-based charcoal and Cf is carbon consumed due to use of
fossil fuel. The carbon mitigation efficiency including the landfilling operation
is about 87%.
3.5.1 Energy Ratio
The net energy of the system is defined as the energy produced in the form of
charcoal divided by the life cycle fossil fuel energy consumption (Kabir &
Kumar, 2011; Kabir et al., 2012; Keoleian & Volk, 2005). This value gives the
utilization effectiveness of fossil fuel consumption. It can be used as a
UP1: Biomass Collection,
214,779, 36%
UP2: Biomass Transport,
337,645, 57%
UP3: Plant Operation, 5,991,
1%
UP4: Charcoal Transport, 9,764, 2%
UP5: Charcoal Land filling, 24,673, 4%
Total Energy Consumed (GJ)

Chapter 3: Life Cycle Energy and Emission Analysis of Charcoal Production form Biomass and its Sequestration
94
benchmark to compare other GHG mitigation pathways. Life cycle efficiency
on the other hand is a measure of overall system efficiency. It is basically
total output energy in form of charcoal to total fossil fuel input energy. The
calorific value of charcoal is assumed to be 28 MJ/Kg (ECN, 2010), this is
used to calculate net energy ratio. Total energy consumed during production
is 592,852 GJ while the total energy produced in form of charcoal is
3,581,701 GJ. Hence, the net energy ratio is 5.041.
3.6 Emission and Energy Analysis of Portable System
3.6.1 Impact Assessment
3.6.1.1 Straw Harvesting Collection and Processing (UP1)
GHG emission and energy calculations are done as described in section 3.4.
The in-depth calculations have been shown in Table A12.
3.6.1.2 Straw Transport (UP2)
Portable system eliminates a major unit operation compared to the
centralized system. This is biomass transport to the conversion plant. As
concluded in previous (section 3.5) biomass transport contributes to over
50% of energy consumption and emissions involved in charcoal production.
Hence, UP2 is not considered for portable system.

Chapter 3: Life Cycle Energy and Emission Analysis of Charcoal Production form Biomass and its Sequestration
95
3.6.1.3 Plant Construction, Operation and Decommissioning (UP3)
The GHG emissions in plant construction, operation and decommissioning
have also been not considered in the portable production. As the portable
equipment travels to the field for processing, emissions and energy
consumption in plant set-up is also omitted.
3.6.1.4 Transportation (UP4) and Land Filling Biochar (UP5)
The quantities of charcoal produced in the portable equipment are much
lower as compared to centralized production (5% to 20% of average yearly
production). The charcoal is not landfilled but spread in the field along with
fertilizers at no extra cost. It is assumed that this operation is performed with
existing farming equipment hence there is no new energy consumption or
emissions involved. As the equipment travels to the field and charcoal is
spread in the field, any special transporting equipment is not required.
3.6.2 Energy and GHG emission Results for Portable System
Table 3-6 summarizes the results from energy and emission calculations. In
comparison to base case the NER increases to 14.4 (5.01 for centralized) and
mitigation efficiency increases to nearly 100% (87% for centralized
production).
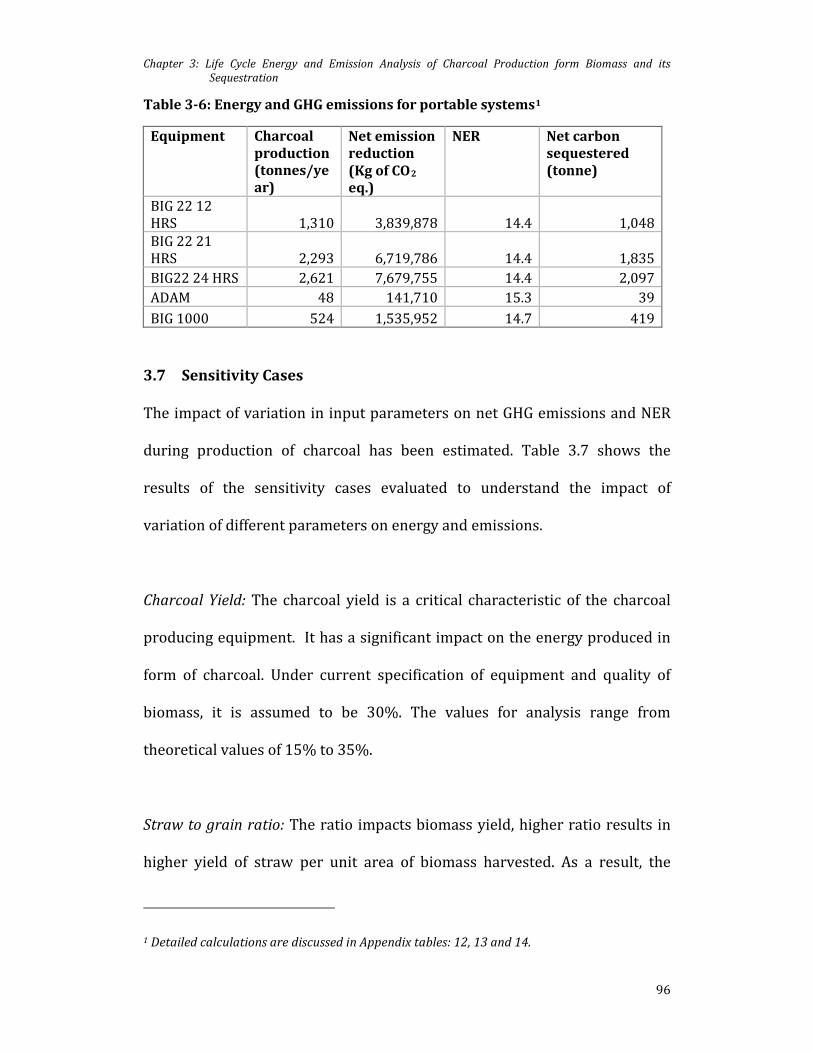
Chapter 3: Life Cycle Energy and Emission Analysis of Charcoal Production form Biomass and its Sequestration
96
Table 3-6: Energy and GHG emissions for portable systems1
Equipment Charcoal production (tonnes/year)
Net emission reduction (Kg of CO2 eq.)
NER Net carbon sequestered (tonne)
BIG 22 12 HRS 1,310 3,839,878 14.4 1,048 BIG 22 21 HRS 2,293 6,719,786 14.4 1,835 BIG22 24 HRS 2,621 7,679,755 14.4 2,097 ADAM 48 141,710 15.3 39 BIG 1000 524 1,535,952 14.7 419
3.7 Sensitivity Cases
The impact of variation in input parameters on net GHG emissions and NER
during production of charcoal has been estimated. Table 3.7 shows the
results of the sensitivity cases evaluated to understand the impact of
variation of different parameters on energy and emissions.
Charcoal Yield: The charcoal yield is a critical characteristic of the charcoal
producing equipment. It has a significant impact on the energy produced in
form of charcoal. Under current specification of equipment and quality of
biomass, it is assumed to be 30%. The values for analysis range from
theoretical values of 15% to 35%.
Straw to grain ratio: The ratio impacts biomass yield, higher ratio results in
higher yield of straw per unit area of biomass harvested. As a result, the
1 Detailed calculations are discussed in Appendix tables: 12, 13 and 14.

Chapter 3: Life Cycle Energy and Emission Analysis of Charcoal Production form Biomass and its Sequestration
97
transportation distance for straw is lower for higher yields. Lower distance
results in lower GHG emissions compared to the base case. Various studies
have suggested values for straw-to-grain ratio. The range of values is from
0.8 to 2.
Heating Value of Charcoal: Charcoal’s heating value determines the energy
output of the system. Charcoal properties are dependent upon the feedstock
properties and the pyrolysis process parameters.
Charcoal Loss in Transportation: Charcoal is transported to landfill site using
a loader and a truck, as explained in section 2.9. The base case assumed 0%
losses in charcoal handling and transportation. For the sensitivity analysis,
range of handling losses is assumed to be 5% to 25%.
Biomass Transportation Distance: As described before the study assumes a
circular field and the plant draws biomass from the area around it. The
radius of the circular area is the transportation distance for biomass. As
discussed earlier in cost and energy analysis, UP2 biomass transport
contributes to more than 50% of emissions in production of charcoal. Thus
the impact of biomass transport is studied by varying the distance of
transport from 20 to 220 km.
Charcoal Transportation Distance: The location of landfill site for charcoal

Chapter 3: Life Cycle Energy and Emission Analysis of Charcoal Production form Biomass and its Sequestration
98
can vary. The base case assumes a distance of 20 km. The impact of charcoal
transport is studied by varying the distance of its transport from 20-220 km.
Table 3-7: Sensitivity study results1
Parameter Range2 % Change in net carbon sequestration3
% Change in NER
Charcoal yield 15% to 35% -57% to +19% -58% to 19%
Straw to grain ratio 0.88 to 2 -3% to +3% -19% to 32%
Heating value of charcoal 24 to 30 MJ/Kg No change -17% to 9%
Biochar loss in transportation 25% to 5% -28% to 6% -29% to -6%
Biomass transportation distance
220 km to 20 km -78% to –16% -101% to -63%
Biochar transport distance
220 km to 20 km -1% to 0% -10% to -2%
The net impact of all above parameters on carbon sequestration and NER are
showed in Figure 3-5 and Figure 3-6. Variation in charcoal yield and biomass
transportation distance has large impact on the net carbon sequestration,
while charcoal transportation distance has a negligible impact. Variation
charcoal yield and straw to grain ratio also have a substantial impact on NER
for the system.
1 The detailed calculations for each case have been attached in the appendix. 2 Range indicates the extreme values for the selected parameter in consideration. 3 Indicates the corresponding percentage change with respect to the base case values at the end
values of the range.
Chapter 3: Life Cycle Energy and Emission Analysis of Charcoal Production form Biomass and its Sequestration
99
3.8 Conclusion
Energy and emission calculations have been done on basis of a functional
unit of per tonne of charcoal, the overall processes are divided in five unit
processes (UP) straw processing (UP1), straw transport (UP2), plant
operations & charcoal production (UP3), charcoal transport (UP4) and
landfilling of charcoal (UP5). Net CO2 mitigated is 7691 tonne/year. UP2
contributed to 56% of total emissions and UP1 contributed on 36%.
Efficiency of mitigation for centralized production of charcoal was 87%. Net
energy ratio (NER) for centralized production was 5.04.
With portable production of charcoal the mitigation potential is directly
proportional to volume of production, and average NER is 14.1.
Various sensitivity cases were analyzed; biomass transportation has a huge
impact on carbon sequestration, as longer the travel distance lower the
mitigation potential. Charcoal yield and biochar loss in transport have
significant impact on carbon mitigation.

Chapter 3: Life Cycle Energy and Emission Analysis of Charcoal Production form Biomass and its Sequestration
100
Figure 3-5: Impact on Net carbon sequestration
Figure 3-6: Impact on NER
- 20,000 40,000 60,000 80,000 100,000 120,000
Biomass Transport Distance
Charcoal Transport Distance
Loss in Biomass transport
Straw - to Grain ratio
Charcoal Yield
Biochar Heating Value
Net Carbon Sequestered (tonne)
Base value : 89,328
(1.000) - 1.000 2.000 3.000 4.000 5.000 6.000 7.000
Biomass Transport DistanceCharcoal Transport DistanceLoss in Biomass transportStraw - to Grain ratioCharcoal YieldBiochar Heating Value
NER
Base Value : 5.041
Chapter 3: References
101
3.9 References
Anex, R. P., Aden, A., Kazi, F. K., Fortman, J., Swanson, R. M., Wright, M. M.,
Dutta, A. (2010). Techno-economic comparison of biomass-to-
transportation fuels via pyrolysis, gasification, and biochemical
pathways. Fuel, 89, S29-S35.
Beesley, L., Moreno-Jiménez, E., Gomez-Eyles, J. L., Harris, E., Robinson, B., &
Sizmur, T. (2011). A review of biochars' potential role in the
remediation, revegetation and restoration of contaminated soils.
Environmental Pollution (Barking, Essex : 1987), 159(12), 3269-3282.
Bruun, E. W., Ambus, P., Egsgaard, H., & Hauggaard-Nielsen, H. (2012). Effects
of slow and fast pyrolysis biochar on soil C and N turnover dynamics.
Soil Biology and Biochemistry, 46, 73-79.
Bruun, E. W., Müller-Stöver, D., Ambus, P., & Hauggaard-Nielsen, H. (2011).
Application of biochar to soil and N2O emissions: potential effects of
blending fast-pyrolysis biochar with anaerobically digested slurry.
European Journal of Soil Science, 62(4), 581-589.
CAT®. (2000). Comparative Bulletin 320C and 320B. In CAT (Ed.), (TEJB7010
ed.)
CAT®. (2010). CAT - Hydrolic Excavators. In CAT (Ed.)
Dassanayake, G. D. M. (2011). Utilization of Triticale Straw for Power
Generation. M.Sc. Thesis, Department of Mechanical Engineering,
University of Alberta, Edmonton, Alberta.

Chapter 3: References
102
Dassanayake, G. D. M., & Kumar, A. (2012). Techno-economic assessment of
triticale straw for power generation. Applied Energy, 98, 236-245.
ECN. (2010). Phyllis database for biomass and waste., Retieved
from: http://www.ecn.nl/phyllis/DataTable.asp
Elsayed, M. A., Matthews, R., & Mortimer, N. D. (2003). Carbon and energy
balances for a range of biofuels options. Retrived from:
http://webarchive.nationalarchives.gov.uk/+/http://www.berr.gov.u
k/files/file14925.pdf
Flower, D. J. M., & Sanjayan, J. G. (2007). Green house gas emissions due to
concrete manufacture. International Journal of Life Cycle Assessment,
12(5), 282-288.
Gaunt, J. L., & Lehmann, J. (2008). Energy balance and emissions associated
with biochar sequestration and pyrolysis bioenergy production.
Environmental Science & Technology, 42(11), 4152-4158.
Gupta S. (2010). A practical way out of the GHG emissions problem. Journal of
Canadian Petroleum Technology. 33-42
Hammond, J., Shackley, S., Sohi, S., & Brownsort, P. (2011). Prospective life
cycle carbon abatement for pyrolysis biochar systems in the UK.
Energy Policy, 39(5), 2646-2655.
Horvath, A. (2004). Construction materials and the environment. Annual
Review of Environment and Resources, 29, 181-204.

Chapter 3: References
103
Ibarrola, R., Shackley, S., & Hammond, J. (2012). Pyrolysis biochar systems for
recovering biodegradable materials: A life cycle carbon assessment.
Waste Management (New York, N.Y.), 32(5), 859-868.
ICF Consulting. (2005). Determination of the impact of waste management
activities on greenhouse gas emissions: 2005 Update.
Kabir, M. R., & Kumar, A. (2011). Development of net energy ratio and
emission factor for biohydrogen production pathways. Bioresource
Ttechnology, 102(19), 8972-8985.
Kabir, M. R., Rooke, B., Dassanayake, G. D. M., & Fleck, B. A. (2012).
Comparative life cycle energy, emission, and economic analysis of
100 kW nameplate wind power generation. Renewable Energy, 37(1),
133-141.
Keoleian, G. A., & Volk, T. A. (2005). Renewable energy from willow biomass
crops: life cycle Energy, Environmental and Economic Performance.
Critical Reviews in Plant Sciences, 24(5-6), 385-406.
Kumar, A., Cameron, J. B., & Flynn, P. C. (2003). Biomass power cost and
optimum plant size in western Canada. Biomass and Bioenergy, 24(6),
445-464.
Lehmann, J. (2007). Biochar for mitigating climate change: carbon
sequestration in the black. Forum Geookol, 18(2). 15-17
Mann M.K., & Spath P.L. (2000). Life cycle assessment of a natural gas
combined-cycle power generation sSystem. Report No. DE-AC36-99-

Chapter 3: References
104
GO10337, National Renewable Energy Laboratory (NREL), Golden,
Colorado, USA.
Mann M.K., & Spath P.L. (2001). Life Cycle Assessment of Hydrogen
Production via Natural Gas Steam Reforming. Retrived from:
http://www-pord.ucsd.edu/~sgille/mae124_s06/27637.pdf
Nagy, C. N. (1999). Energy Coefficients for Agriculture Inputs in Western
Canada Canadian Agricultural Energy End-Use Data Analysis Centre.
Agriculture
Ringer M., Putsche V., & J., S. (2006). Large-Scale Pyrolysis Oil Production: A
Technology Assessment and Economic Analysis. National Renewable
Energy Laboratory. (NREL), Golden, Colorado, USA.
Roberts, K. G., Gloy, B. A., Joseph, S., Scott, N. R., & Lehmann, J. (2010). Life
cycle assessment of biochar systems: estimating the energetic,
economic, and climate change potential. Environmental Science &
Technology, 44(2), 827-833.
Rogovska, N., Fleming, P., & Laird, D. (2008). Greenhouse gas emissions from
soils as affected by addition of biochar. Retrived from:
http://www.biochar-international.org/images/Rogovska_et_al..pdf
Sokhansanj, S., Kumar, a., & Turhollow, a. (2006). Development and
implementation of integrated biomass supply analysis and logistics
model (IBSAL). Biomass and Bioenergy, 30(10), 838-847.
Chapter 3: References
105
Sokhansanj, S., Turhollow, A., & Wilkerson, E. (2008). Development of the
integrated biomass supply analysis and logistics model (IBSAL)
Biomass and Bioenergy, 30 (10) 838 – 847.
Sultana, A., Kumar, A., & Harfield, D. (2010). Development of agri-pellet
production cost and optimum size. Bioresource Technology, 101(14),
5609-5621.
Tillage, A. R. (2012). Alberta Reduced Tillage Linkages Retrieved 1
September, 2011, Retrieved
from: http://www.reducedtillage.ca/article445.aspx

Chapter 4 Conclusion and Future Work
106
Chapter 4 Conclusion and Future Work
4.1 Conclusion
Biomass utilization for production of fuels and chemicals has lower carbon
footprint compared to fossil fuels. Biomass could be forest-based as well as
agricultural-based. In this study the focus is on agricultural biomass. Several
GHG mitigation pathways based on utilization of biomass have been studied
earlier. This study is focused on utilization of agricultural biomass i.e. straw
for production of charcoal and landfilling of charcoal for sequestration of
carbon.
This study was aimed at conducting techno-economic assessment of
conversion of straw to charcoal and it’s landfilling for sequestration of
carbon. This research involved development of data intensive techno-
economic models including various cost parameters and characteristics of
the conversion system. A life cycle assessment of this pathway was also
performed to estimate the net energy ratio and net GHG emission of this
pathway. The techno-economic model was developed for two scenarios, a
decentralized system and a centralized production system. The main
objective was to estimate the cost of production of charcoal for both these
systems. The cost was also estimated for landfilling of charcoal. The cost of
production and landfilling of charcoal and the net GHG emission of this
pathway were used to estimate the GHG abatement cost ($/tonne of CO2) for

Chapter 4 Conclusion and Future Work
107
this pathway.
The methodology for estimation of cost of production of charcoal and its
landfilling included development of capital cost, field cost, collection cost,
transportation cost, operational cost and landfilling cost. Various equipment
were assessed for both the centralized and decentralized scenarios. The key
results from the techno-economic models are summarized in Table 4-1. In
both scenarios biomass costs for the major cost component of charcoal
production around 50%, followed by capital cost involved. The total cost of
production for centralized production is $332.2 per tonne of charcoal
produced including landfilling operation. The total production cost of
portable system is $335.3 per tonne of charcoal produced. Although the
costs of the centralized and portable systems are similar, the portable system
does not include landfilling cost.
Various parameters were analyzed for performing sensitivity analysis;
charcoal yield has a maximum impact on the cost followed by capital cost and
biomass transport cost.
The net carbon mitigation in production of charcoal and its sequestration in
landfill are estimated by taking into account the carbon emissions in various
unit operations including harvesting and collection of straw, transportation
of straw, pyrolysis of straw, transportation of charcoal and landfilling of
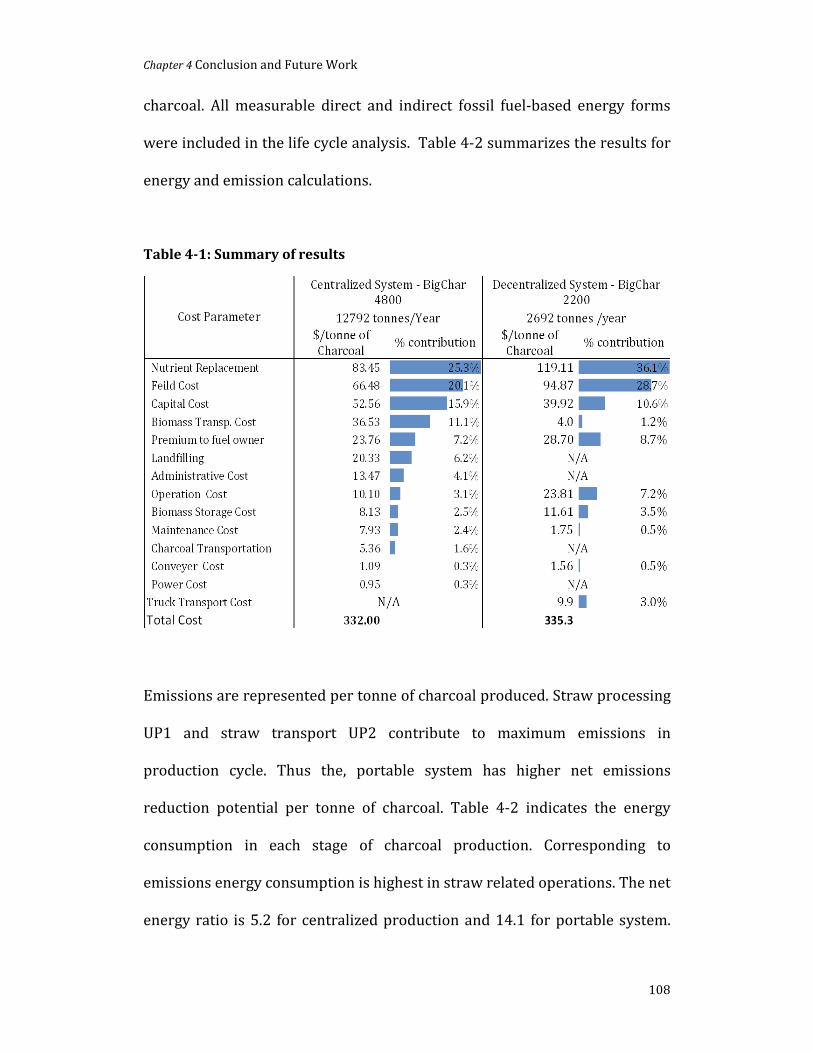
Chapter 4 Conclusion and Future Work
108
charcoal. All measurable direct and indirect fossil fuel-based energy forms
were included in the life cycle analysis. Table 4-2 summarizes the results for
energy and emission calculations.
Table 4-1: Summary of results
Emissions are represented per tonne of charcoal produced. Straw processing
UP1 and straw transport UP2 contribute to maximum emissions in
production cycle. Thus the, portable system has higher net emissions
reduction potential per tonne of charcoal. Table 4-2 indicates the energy
consumption in each stage of charcoal production. Corresponding to
emissions energy consumption is highest in straw related operations. The net
energy ratio is 5.2 for centralized production and 14.1 for portable system.

Chapter 4 Conclusion and Future Work
109
High-energy ratio indicates higher efficiency for portable system.
Table 4-2: Results for energy and emission calculation
Unit Processes
Emission produced per tonne of biochar
Total Energy consumed
KgCO2eq/tonne GJ Central Portable Central Portable
UP1: Straw processing 133.67 141.8 214,779 4,669 UP2: Straw Transport 210.14 0 337,645 0a
UP3: Charcoal Production 7.20 2.7 5,991 87 UP4: Charcoal Transport 6.08 0 9,764 0a
UP5: Charcoal Land filling 15.36 0 24,673 0 a These would very small amount as the transportation is in the farm itself.
In conclusion, production and sequestration of charcoal produced from
biomass helps in sequestration of carbon and can contribute significantly to
efforts of reducing GHG emissions. Table 4-3 indicates the abatement cost of
carbon. Thus $129.88 is the cost per tonne of CO2 mitigation through the
process of landfilling of charcoal using straw as a biomass.
Table 4-3: Carbon abatement cost
Cost Components Values
Total production cost with landfilling cost with nutrient replacement cost ($/tonne of charcoal)
332.2
GHG emissions in production and landfilling of biomass-based charcoal (tonnes of C emitted/tonne of charcoal)
0.102
Amount of carbon sequestered through landfilling of charcoal (tonne of C/tonne of charcoal)
0.800

Chapter 4 Conclusion and Future Work
110
Cost Components Values
Net carbon sequestered through landfilling of charcoal (tonne of C/tonne of charcoal)
0.698
Abatement cost of carbon through landfilling of charcoal ($/tonne of CO2 mitigated )
129.88
4.2 Recommendations for Future Research
i. A study biochar production from other sources of biomass, such as
wood and animal waste would be helpful in comparing the different
options.
ii. Specific equipment can be designed for a certain kind of biomass; this
can enhance the charcoal production yield and would improve overall
efficiency and economics of the plant.
iii. The portable production of biochar can be further analyzed to
accommodate the travel of the equipment from one farm to another.
iv. Biochar has a further potential to absorb nitrogen from atmosphere,
currently this has not been included in this scope of study. It might be
useful to see the impact of emission reduction accommodating this
property of biochar.
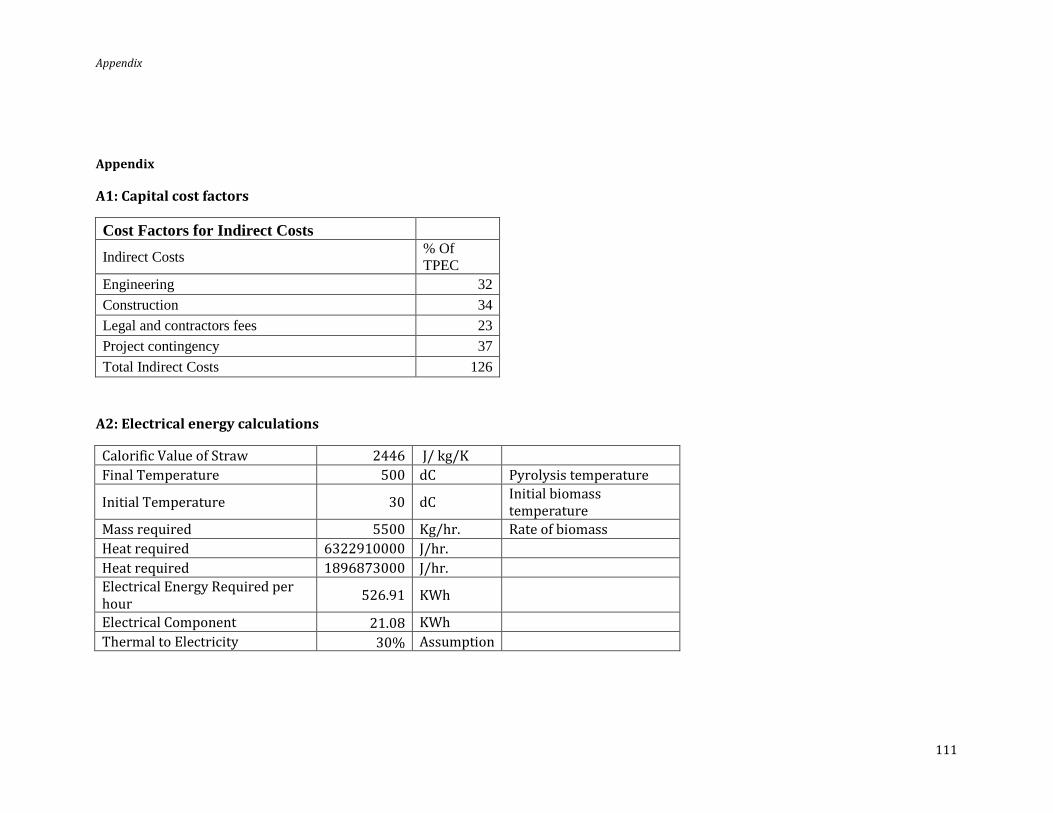
Appendix
111
Appendix
A1: Capital cost factors
Cost Factors for Indirect Costs
Indirect Costs % Of TPEC
Engineering 32 Construction 34 Legal and contractors fees 23 Project contingency 37 Total Indirect Costs 126
A2: Electrical energy calculations
Calorific Value of Straw 2446 J/ kg/K Final Temperature 500 dC Pyrolysis temperature
Initial Temperature 30 dC Initial biomass temperature
Mass required 5500 Kg/hr. Rate of biomass Heat required 6322910000 J/hr. Heat required 1896873000 J/hr. Electrical Energy Required per hour 526.91 KWh
Electrical Component 21.08 KWh Thermal to Electricity 30% Assumption

Appendix
112
A3: Biomass process cost and calculations
Tonne p. a. Ha Km Shredder Tractor RAKER Baler
CASE Biomass Requirement
Min Area Required
p.a. WHEAT
Min Average Radius WHEAT
Hours Cost ($) Hours Cost ($) Hours Cost ($) Hours Twine cost ($) Cost ($)
Year 1 39,567 174,922 17.98 1,978 70,331 1,978 124,261 1,884 12,511 3,044 57,552 273,833
Year 2 42,040 185,854 18.53 2,102 74,727 2,102 132,027 2,002 13,293 3,234 61,149 290,948
Year 3 44,513 196,787 19.07 2,226 79,122 2,226 139,794 2,120 14,075 3,424 64,746 308,062
Year 4 44,513 196,787 19.07 2,226 79,122 2,226 139,794 2,120 14,075 3,424 64,746 308,062
Year 5 44,513 196,787 19.07 2,226 79,122 2,226 139,794 2,120 14,075 3,424 64,746 308,062
Year 6 44,513 196,787 19.07 2,226 79,122 2,226 139,794 2,120 14,075 3,424 64,746 308,062
Year 7 44,513 196,787 19.07 2,226 79,122 2,226 139,794 2,120 14,075 3,424 64,746 308,062
Year 8 44,513 196,787 19.07 2,226 79,122 2,226 139,794 2,120 14,075 3,424 64,746 308,062
Year 9 44,513 196,787 19.07 2,226 79,122 2,226 139,794 2,120 14,075 3,424 64,746 308,062
Year 10 44,513 196,787 19.07 2,226 79,122 2,226 139,794 2,120 14,075 3,424 64,746 308,062
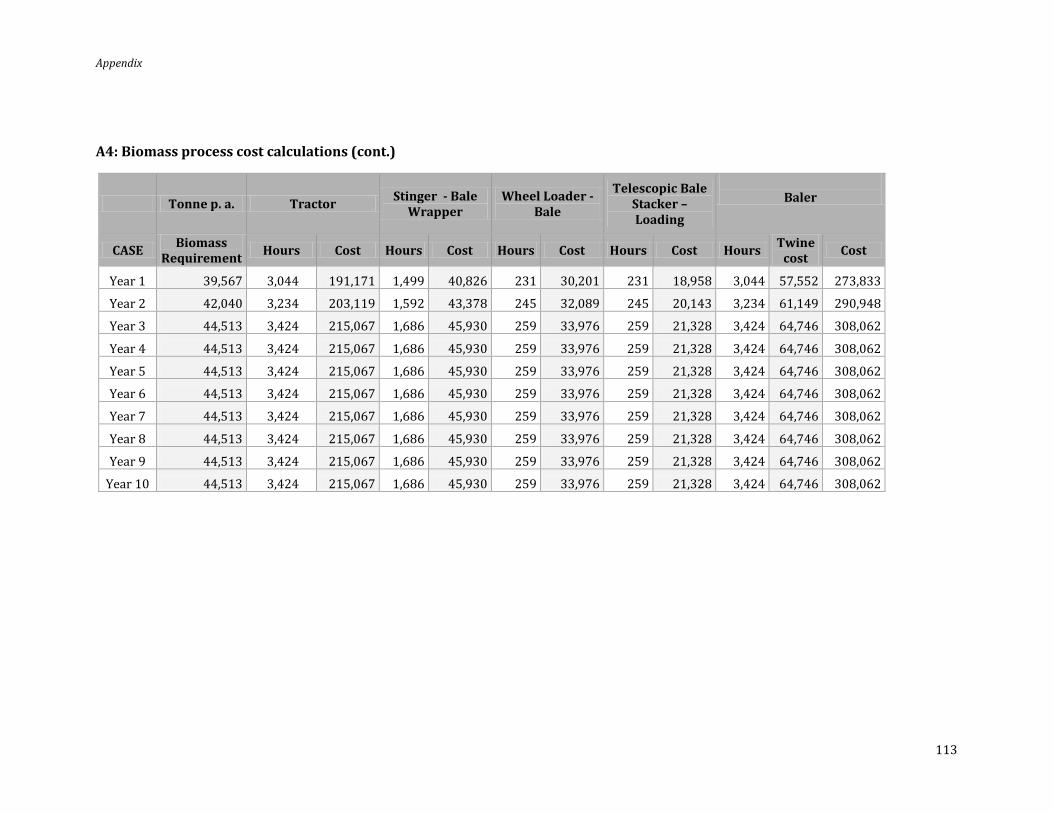
Appendix
113
A4: Biomass process cost calculations (cont.)
Tonne p. a. Tractor Stinger - Bale Wrapper
Wheel Loader - Bale
Telescopic Bale Stacker – Loading
Baler
CASE Biomass Requirement Hours Cost Hours Cost Hours Cost Hours Cost Hours Twine
cost Cost
Year 1 39,567 3,044 191,171 1,499 40,826 231 30,201 231 18,958 3,044 57,552 273,833
Year 2 42,040 3,234 203,119 1,592 43,378 245 32,089 245 20,143 3,234 61,149 290,948
Year 3 44,513 3,424 215,067 1,686 45,930 259 33,976 259 21,328 3,424 64,746 308,062
Year 4 44,513 3,424 215,067 1,686 45,930 259 33,976 259 21,328 3,424 64,746 308,062
Year 5 44,513 3,424 215,067 1,686 45,930 259 33,976 259 21,328 3,424 64,746 308,062
Year 6 44,513 3,424 215,067 1,686 45,930 259 33,976 259 21,328 3,424 64,746 308,062
Year 7 44,513 3,424 215,067 1,686 45,930 259 33,976 259 21,328 3,424 64,746 308,062
Year 8 44,513 3,424 215,067 1,686 45,930 259 33,976 259 21,328 3,424 64,746 308,062
Year 9 44,513 3,424 215,067 1,686 45,930 259 33,976 259 21,328 3,424 64,746 308,062
Year 10 44,513 3,424 215,067 1,686 45,930 259 33,976 259 21,328 3,424 64,746 308,062
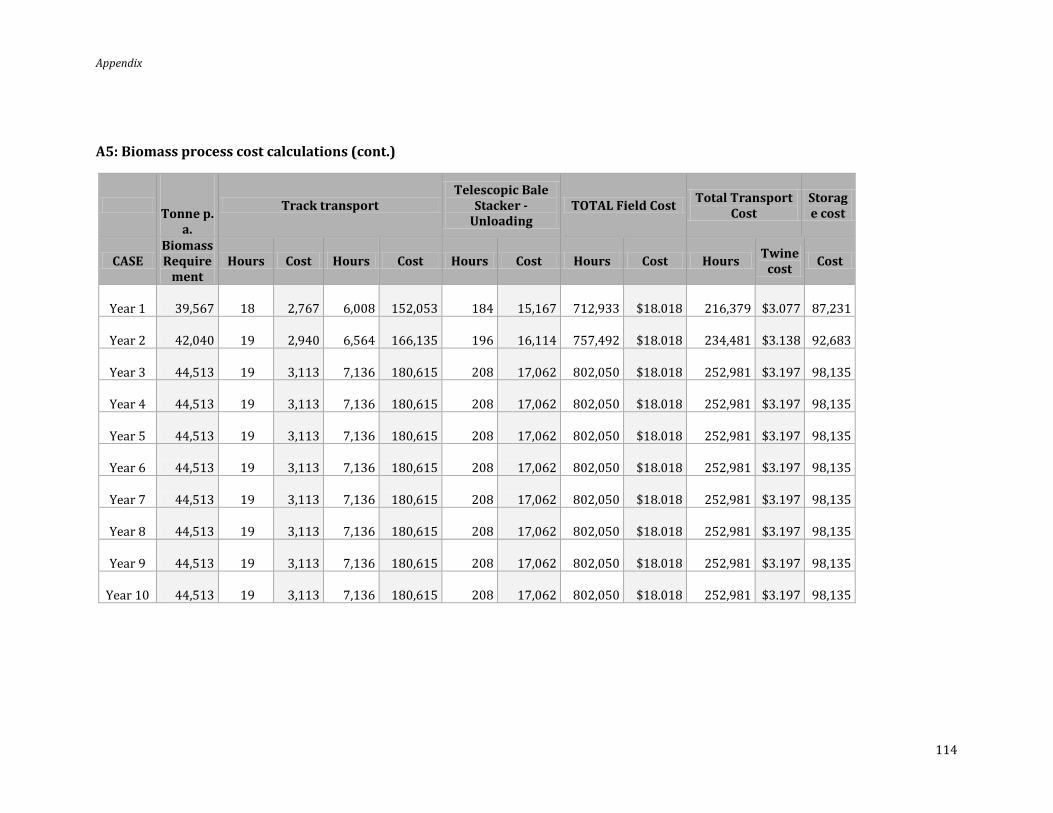
Appendix
114
A5: Biomass process cost calculations (cont.)
Tonne p. a.
Track transport Telescopic Bale
Stacker - Unloading
TOTAL Field Cost Total Transport Cost
Storage cost
CASE Biomass Require
ment Hours Cost Hours Cost Hours Cost Hours Cost Hours Twine
cost Cost
Year 1 39,567 18 2,767 6,008 152,053 184 15,167 712,933 $18.018 216,379
$3.077 87,231
Year 2 42,040 19 2,940 6,564 166,135 196 16,114 757,492 $18.018 234,481
$3.138 92,683
Year 3 44,513 19 3,113 7,136 180,615 208 17,062 802,050 $18.018 252,981
$3.197 98,135
Year 4 44,513 19 3,113 7,136 180,615 208 17,062 802,050 $18.018 252,981
$3.197 98,135
Year 5 44,513 19 3,113 7,136 180,615 208 17,062 802,050 $18.018 252,981
$3.197 98,135
Year 6 44,513 19 3,113 7,136 180,615 208 17,062 802,050 $18.018 252,981
$3.197 98,135
Year 7 44,513 19 3,113 7,136 180,615 208 17,062 802,050 $18.018 252,981
$3.197 98,135
Year 8 44,513 19 3,113 7,136 180,615 208 17,062 802,050 $18.018 252,981
$3.197 98,135
Year 9 44,513 19 3,113 7,136 180,615 208 17,062 802,050 $18.018 252,981
$3.197 98,135
Year 10 44,513 19 3,113 7,136 180,615 208 17,062 802,050 $18.018 252,981
$3.197 98,135

Appendix
115
A6: NPV calculations for centralized plant
Year Capital Cost
Field Cost
Biomass
Transp. Cost
Nutrient Replaceme
nt
Premium to fuel
owner
Biomass
Storage Cost
Conveyer Cost
Operation Cost
Power Cost
Maintenance Cost
Administrative Cost
Year 0 $4,433 $0 $0 $0 $0 $0 $0 $0 $0 $0 $0
Year 1 $0 $713 $383 $895 $255 $87 $12 $120 $2 $94 $160
Year 2 $0 $773 $421 $970 $276 $95 $13 $122 $2 $96 $163
Year 3 $0 $834 $460 $1,048 $298 $102 $14 $125 $2 $98 $166
Year 4 $0 $851 $469 $1,069 $304 $104 $14 $127 $2 $100 $170
Year 5 $0 $868 $479 $1,090 $310 $106 $14 $130 $2 $102 $173
Year 6 $0 $886 $488 $1,112 $317 $108 $15 $132 $2 $104 $177
Year 7 $0 $903 $498 $1,134 $323 $111 $15 $135 $2 $106 $180
Year 8 $0 $921 $508 $1,157 $329 $113 $15 $138 $2 $108 $184
Year 9 $0 $940 $518 $1,180 $336 $115 $15 $141 $2 $110 $187
$0 $959 $528 $1,203 $343 $117 $16 $143 $2 $113 $191
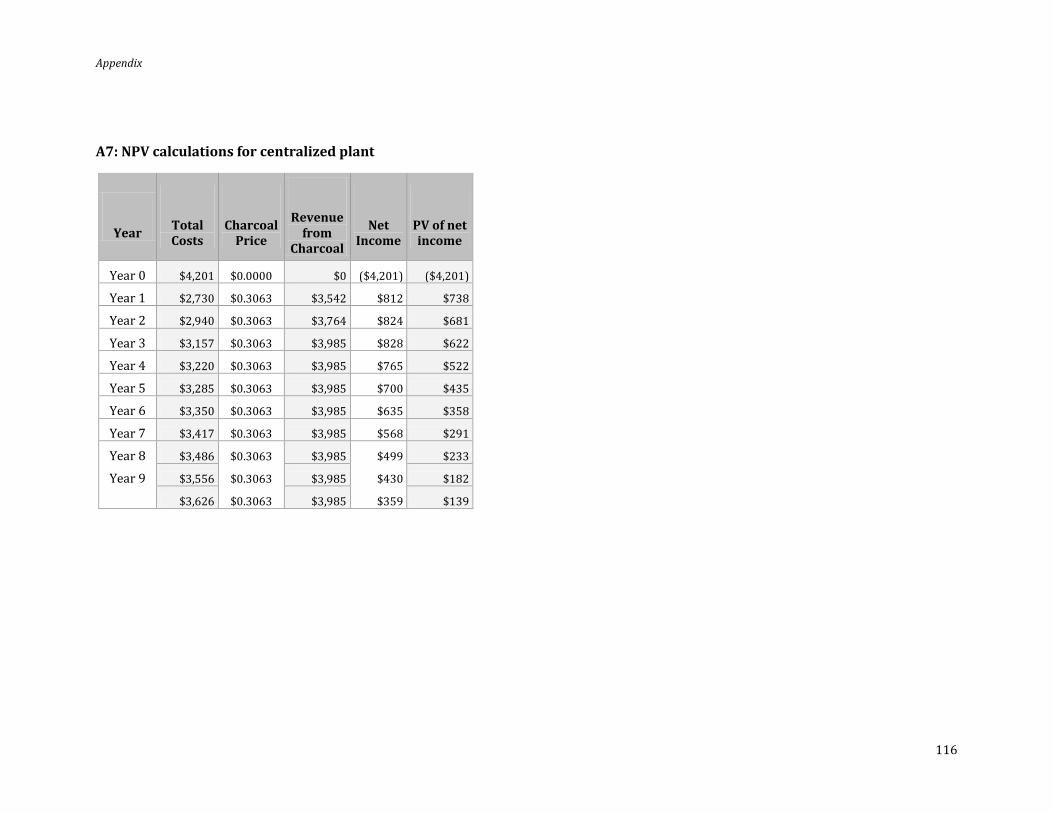
Appendix
116
A7: NPV calculations for centralized plant
Year Total Costs
Charcoal Price
Revenue from
Charcoal
Net Income
PV of net income
Year 0 $4,201 $0.0000 $0 ($4,201) ($4,201)
Year 1 $2,730 $0.3063 $3,542 $812 $738
Year 2 $2,940 $0.3063 $3,764 $824 $681
Year 3 $3,157 $0.3063 $3,985 $828 $622
Year 4 $3,220 $0.3063 $3,985 $765 $522
Year 5 $3,285 $0.3063 $3,985 $700 $435
Year 6 $3,350 $0.3063 $3,985 $635 $358
Year 7 $3,417 $0.3063 $3,985 $568 $291
Year 8 $3,486 $0.3063 $3,985 $499 $233
Year 9 $3,556 $0.3063 $3,985 $430 $182
$3,626 $0.3063 $3,985 $359 $139

Appendix
117
A8: NPV calculation for portable equipment
Big 2200
(50%) Big 2200 (87.5%)
Big 2200 (100%) ADAM Big1000
Productivity (HRS/DAY) 12 21 24 Productivity % 50.00% 87.50% 100.00% Biomass Qty 4,600 8,050 9,200 170 1,840 Biomass Area 20,336 35,587 40,671 750 8,134 Charcoal Qty 1,310 2,293 2,621 48.36 524.16 Capital Cost 61,030 61,030 61,030 273 11,229 Field Cost 82,883 145,045 165,765 3,059 33,153 Biomass Transp. Cost 3,511 6,144 7,022 130 1,404 Nutrient Replacement 104,050 182,088 208,101 0 41,620 Premium to fuel owner 25,070 43,872 50,139 0 10,028 Biomass Storage Cost 10,141 17,747 20,282 374 4,056 Conveyer cost 1,364 2,386 2,727 0 545 Operation Cost 20,800 36,400 41,600 41,600 40,000 Maintenance Cost 1,526 2,670 3,051 200 561 Truck Transport Cost 8,674 15,179 17,348 320 3,470 Total Costs 319,048 $512,561 $577,066 45,956 146,068 Cost per ton $243.5 $223.5 $220.2 $950.3 $278.7

Appendix
118
Equation 4-1 Productivity Calculations
Where- Q = Heaped bucket capacity (lcy), maximum quantity of materiel the
bucket can hold. F = Bucket Fill Factor, this factor depends upon the kind of gravel, for
coarse gravel factor is a low number, for fine gravel such as sand the number tends to 1.
AS: D = angle of swing and depth of cut correction t = cycle time in seconds, time required to load , swing, unload and
return. E = Efficiency (min per hour) Volume correction for loose volume to bank volume = 1/(1+ swell factor),
Equation 4-2 Truckload time
Where- Excavator cycle time = Sum of bucket load time, swing time,
unload time and swing empty time Truck volumetric capacity = Amount of material it can hold Heaped bucket capacity = Maximum volume of material the bucket can hold Load factor = Depends upon the kind of gravel, higher
load factor for fine material
A9: Land filing equipment selection and calculation
Line # Description Unit Value Excavator
10 Heaped Bucket Capacity cy 5.00 15 Unit Bucket Weight Kg 6582.8 20 Bucket Fill Factor 100% 30 Angle Of Swing: Depth 1
Production =3,600sec× Q × F × (AS : D)
t×
E60 − minhr
×1
Veolumecorrection
Truck LoadTime =
ExcavatorCycleTime ×TruckVolumetricCapicaty
Heaped BucketCapicaty × Bucket Load Factor

Appendix
119
Line # Description Unit Value 40 Excavator Cycle Time Min 0.283 41 Load Min 0.154 42 Swing Min 0.047 43 Dump Min 44 Swing Empty Min 0.047 50 Efficiency (Min Per Hour) Min 50 60 Volume Correction Factor 1 70 Production lcy/hr. 882 90 Average Height Of Excavation ft. 15.68
100 Maximum Digging Height Of The Shovel ft. 34.83
102 Maximum Reach ft. 51.42
110 Optimum Digging Height = 50% Of Max ft. 17.42
120 Swing Angle Assumed deg 110 130 % Of Optimum Height ft. 90%
Truck 200 Truck Capacity lcy 31.4 210 Balanced Number Of Bucket Loads # 6.28
210 Balanced Number Of Bucket Loads (Round) # 6.00
220a Load Time Min 1.7 230a Truck Load (Volumetric) cy 30.00 240 Truck Load (Gravimetric) 197485 250 Haul Distance Km 10 260 Haul Speed Km/hr. 54.7 270 Haul Time Min 11.0 280 Return Distance Km 10 290 Return Speed Km/hr. 54.7 300 Return Time Min 11.0 310 Truck Dump Time Min 0.32 320 Truck Cycle Time Min 23.95 330 Balanced Number Of Trucks # 14.09
340a Production (N Rounded To Smaller) cy/hr. 1051.99
350 Empty Tire Load Ton 36 360 Loaded Tire Load Ton 197521 365 Average Truck Load Ton 98778 370 Trips Per Day # 1 380 Hours Per Day hrs. 8 390 Average Speed Mph 2.5
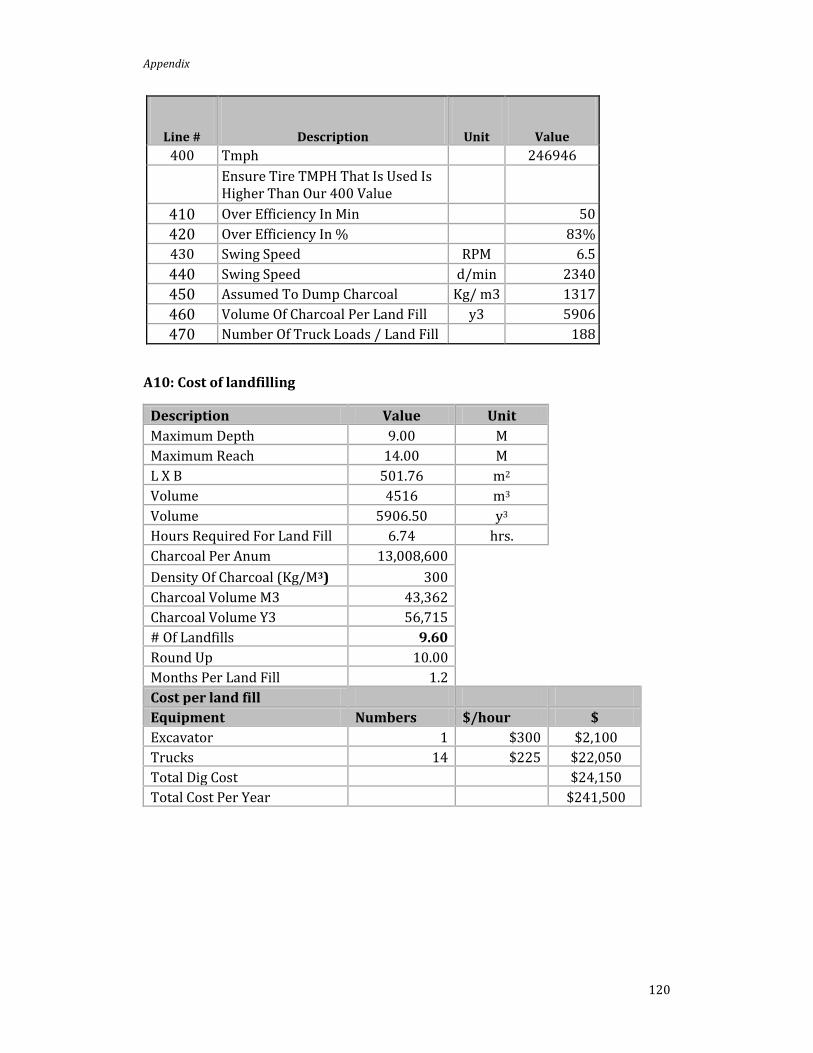
Appendix
120
Line # Description Unit Value 400 Tmph 246946
Ensure Tire TMPH That Is Used Is Higher Than Our 400 Value
410 Over Efficiency In Min 50 420 Over Efficiency In % 83% 430 Swing Speed RPM 6.5 440 Swing Speed d/min 2340 450 Assumed To Dump Charcoal Kg/ m3 1317 460 Volume Of Charcoal Per Land Fill y3 5906 470 Number Of Truck Loads / Land Fill 188
A10: Cost of landfilling
Description Value Unit Maximum Depth 9.00 M Maximum Reach 14.00 M L X B 501.76 m2 Volume 4516 m3 Volume 5906.50 y3 Hours Required For Land Fill 6.74 hrs. Charcoal Per Anum 13,008,600 Density Of Charcoal (Kg/M3) 300 Charcoal Volume M3 43,362 Charcoal Volume Y3 56,715 # Of Landfills 9.60 Round Up 10.00 Months Per Land Fill 1.2 Cost per land fill Equipment Numbers $/hour $ Excavator 1 $300 $2,100 Trucks 14 $225 $22,050 Total Dig Cost $24,150 Total Cost Per Year $241,500

Appendix
121
A11: NPV calculation for biochar production with land filling
Year Capital Cost Field Cost
Biomass Transp.
Cost
Nutrient Replace
ment
Premium to fuel owner
Biomass Storage
Cost
Conveyer Cost
Operation Cost
Power Cost
Maintenance Cost
Administrative Cost
Year 0 $4,433 $0 $0 $0 $0 $0 $0 $0 $0 $0 $0
Year 1 $0 $713 $383 $895 $255 $87 $12 $120 $2 $94 $160
Year 2 $0 $773 $421 $970 $276 $95 $13 $122 $2 $96 $163
Year 3 $0 $834 $460 $1,048 $298 $102 $14 $125 $2 $98 $166
Year 4 $0 $851 $469 $1,069 $304 $104 $14 $127 $2 $100 $170
Year 5 $0 $868 $479 $1,090 $310 $106 $14 $130 $2 $102 $173
Year 6 $0 $886 $488 $1,112 $317 $108 $15 $132 $2 $104 $177
Year 7 $0 $903 $498 $1,134 $323 $111 $15 $135 $2 $106 $180
Year 8 $0 $921 $508 $1,157 $329 $113 $15 $138 $2 $108 $184
Year 9 $0 $940 $518 $1,180 $336 $115 $15 $141 $2 $110 $187
$0 $959 $528 $1,203 $343 $117 $16 $143 $2 $113 $191

Appendix
122
A12: Energy and emission calculations for portable production of biochar
Operation BIG22 12 Hrs.
Fuel Economy (Gallons/hour
)
Total fuel Required
(L/yr.) Energy (GJ) KgCO2e
Shredding 230 9.86 8,584.42 442.10 22.77 Tractor for Shredder 230.0 5.26 4,579.52 235.85 12.15 Raker 219.0 3.72 3,084.52 158.85 8.18 Baler 353.8 15.33 20,533.49 1,057.47 54.46 Tractor for Baler 353.8 5.26 7,045.41 362.84 18.69 Loader 26.8 14.81 1,502.80 77.39 3.99 Conveyer 102.2 2.19 847.41 43.64 2.25 Truck Transport of Kiln 2,378.15 122.47
Operation BIG22 21 Hrs.
Fuel Economy (Gallons/hour
)
Total fuel Required
(L/yr.) Energy (GJ) KgCo2e
Shredding 402.5 9.86 15,022.74 773.67 39.84 Tractor for Shredder 402.5 5.26 8,014.16 412.73 21.26 Raker 383.3 3.72 5,397.91 277.99 14.32 Baler 619.2 15.33 35,933.62 1,850.58 95.30 Tractor for Baler 619.2 5.26 12,329.47 634.97 32.70 Loader 46.9 14.81 2,629.90 135.44 6.98 Conveyer 178.9 2.19 1,482.97 76.37 3.93 Truck Transport of Kiln

Appendix
123
4,161.75 214.33
Operation BIG22 24 Hrs.
Fuel Economy (Gallons/hour
)
Total fuel Required
(L/yr.) Energy (GJ) KgCo2e
Shredding 460.0 9.86 17,168.84 884.20 45.54 Tractor for Shredder 460.0 5.26 9,159.04 471.69 24.29 Raker 438.1 3.72 6,169.04 317.71 16.36 Baler 707.7 15.33 41,066.99 2,114.95 108.92 Tractor for Shredder 707.7 5.26 14,090.83 725.68 37.37 Loader 53.6 14.81 3,005.60 154.79 7.97 Conveyer 204.4 2.19 1,694.83 87.28 4.50 Truck Transport of Kiln 4,756.29 244.95
Operation Adam Fuel Economy (Gallons/hour
)
Total fuel Required
(L/yr.) Energy (GJ) KgCo2e
Shredding 8.5 9.86 316.81 16.32 0.84 Tractor for Shredder 8.5 5.26 169.01 8.70 0.45 Raker 8.1 3.72 113.83 5.86 0.30 Baler 13.1 15.33 757.78 39.03 2.01 Tractor for Shredder 13.1 5.26 260.01 13.39 0.69 Loader 0.0 14.81 0.00 0.00 0.00 Conveyer 0.0 2.19 0.00 0.00 0.00 Truck Transport of Kiln 0.0 0 0.00 0.00 0.00 83.30 4.29
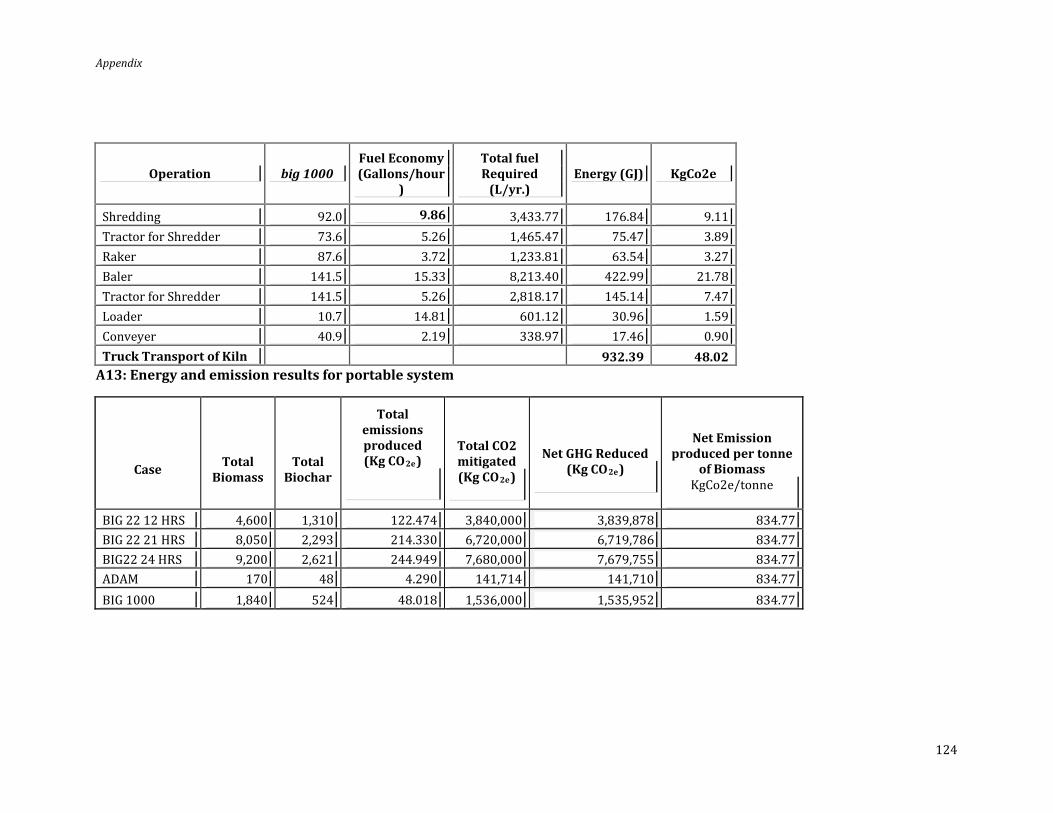
Appendix
124
Operation big 1000 Fuel Economy (Gallons/hour
)
Total fuel Required
(L/yr.) Energy (GJ) KgCo2e
Shredding 92.0 9.86 3,433.77 176.84 9.11 Tractor for Shredder 73.6 5.26 1,465.47 75.47 3.89 Raker 87.6 3.72 1,233.81 63.54 3.27 Baler 141.5 15.33 8,213.40 422.99 21.78 Tractor for Shredder 141.5 5.26 2,818.17 145.14 7.47 Loader 10.7 14.81 601.12 30.96 1.59 Conveyer 40.9 2.19 338.97 17.46 0.90 Truck Transport of Kiln 932.39 48.02
A13: Energy and emission results for portable system
Case Total Biomass
Total Biochar
Total emissions produced (Kg CO2e)
Total CO2 mitigated (Kg CO2e)
Net GHG Reduced (Kg CO2e)
Net Emission produced per tonne
of Biomass KgCo2e/tonne
BIG 22 12 HRS 4,600 1,310 122.474 3,840,000 3,839,878 834.77 BIG 22 21 HRS 8,050 2,293 214.330 6,720,000 6,719,786 834.77 BIG22 24 HRS 9,200 2,621 244.949 7,680,000 7,679,755 834.77 ADAM 170 48 4.290 141,714 141,710 834.77 BIG 1000 1,840 524 48.018 1,536,000 1,535,952 834.77
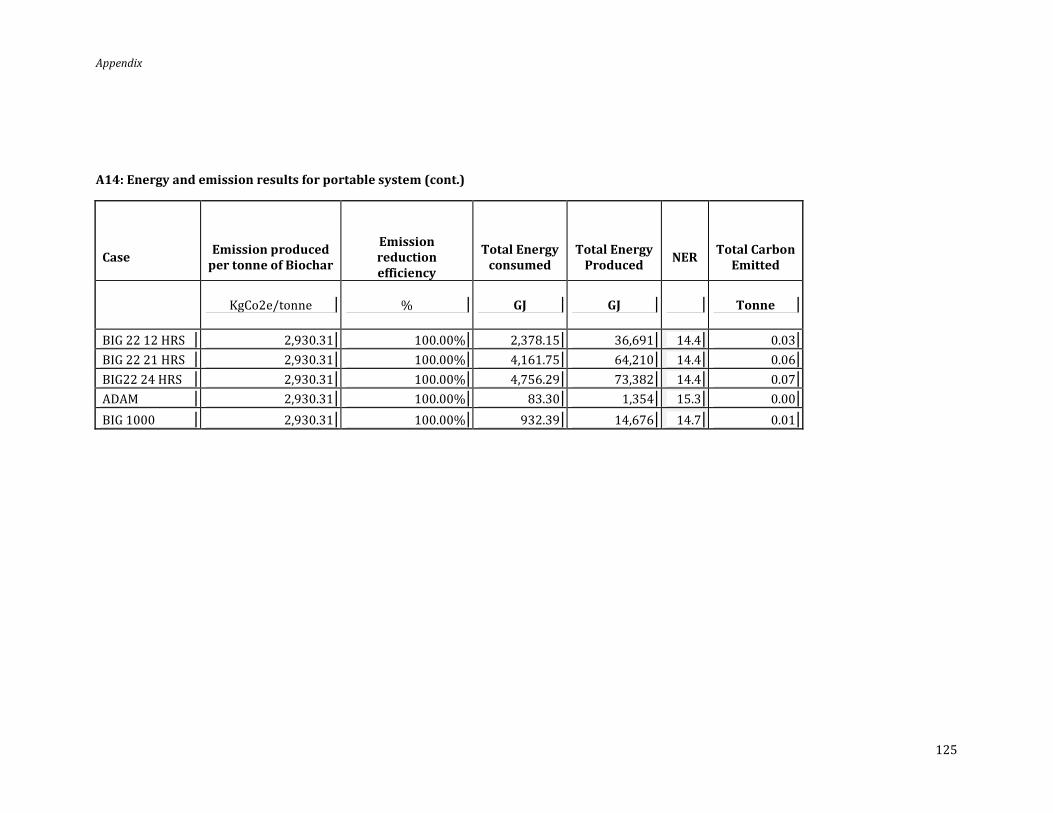
Appendix
125
A14: Energy and emission results for portable system (cont.)
Case Emission produced per tonne of Biochar
Emission reduction efficiency
Total Energy consumed
Total Energy Produced NER Total Carbon
Emitted
KgCo2e/tonne % GJ GJ Tonne
BIG 22 12 HRS 2,930.31 100.00% 2,378.15 36,691 14.4 0.03 BIG 22 21 HRS 2,930.31 100.00% 4,161.75 64,210 14.4 0.06 BIG22 24 HRS 2,930.31 100.00% 4,756.29 73,382 14.4 0.07 ADAM 2,930.31 100.00% 83.30 1,354 15.3 0.00 BIG 1000 2,930.31 100.00% 932.39 14,676 14.7 0.01