table of contents - ska telescope · . september 4th, 2009 geoffrey m. wood profile composites inc....
TRANSCRIPT

Memo 116 Feasibility and Cost Study of Manufacturing Composite Parabolic Reflectors for the SKA
G.M. Wood
The CART Group
09/09
www.skatelescope.org/pages/pagememos.htm

September 4th, 2009
Geoffrey M. Wood PROFILE COMPOSITES INC.
Sidney, BC, Canada
and
The CART GroupNational Research Council
Herzberg Institute of Astrophysics Dominion Radio Astrophysical Observatory
Penticton, BC, Canada

Table of Contents Table of Contents................................................................................................................ 3 List of Tables ...................................................................................................................... 4 List of Figures ..................................................................................................................... 4 1 Summary ..................................................................................................................... 5 2 Introduction and Approach to Analyzing Composite Dish Manufacturing Costs ...... 7
2.1 Overview............................................................................................................. 7 2.2 Criteria and Constraints ...................................................................................... 7 2.3 Manufacturing Labour Assumptions .................................................................. 8 2.4 Manufacturing Materials Assumptions............................................................... 9 2.5 Production Automation..................................................................................... 10 2.6 Transportation and Logistics............................................................................. 11 2.7 Indirect Manufacturing Costs ........................................................................... 12
3 SKA Manufacturing Cost Summary......................................................................... 13 3.1 Overview........................................................................................................... 13 3.2 Capitalization Costs and Manufacturing Lead Times....................................... 13 3.3 Direct Cost of Production ................................................................................. 15 3.4 Indirect Costs of Production ............................................................................. 15 3.5 Overall SKA 12-m Composite Reflector Costing ............................................ 16 3.6 Risk Assessment ............................................................................................... 17 3.7 Potential Technologies for Cost Reduction and Manufacturing Improvement 17
4 Composite Reflector Manufacturing Facilities......................................................... 19 4.1 Overview........................................................................................................... 19 4.2 Plant Lay-out..................................................................................................... 19
5 Dish Manufacturing and Reflector Assembly........................................................... 21 5.1 Overview........................................................................................................... 21 5.2 Reflector Surface Manufacturing...................................................................... 24
5.2.1 Phase 1 Production and Assembly............................................................ 24 5.2.2 Phase 2 Production and Assembly............................................................ 25
5.3 Tooling.............................................................................................................. 27 5.4 Capital Expenditures – Dish Production and Assembly ................................... 28 5.5 Reflector Surface and Assembly Costing ......................................................... 30
6 Beam Manufacturing ................................................................................................ 31 6.1 Overview........................................................................................................... 31 6.2 Process Selection .............................................................................................. 32
6.2.1 Resin Infusion (Vacuum Assist Resin Transfer Molding – VARTM) ..... 33 6.2.2 Wet-Preg Manufacturing .......................................................................... 34 6.2.3 Semi-Preg Drape-Form Manufacturing .................................................... 34
6.3 Beam Production Requirements ....................................................................... 38 6.3.1 Overall Beam Production Requirements .................................................. 38 6.3.2 Facilities.................................................................................................... 39 6.3.3 Major Process Equipment ......................................................................... 40 6.3.4 Trimming .................................................................................................. 40 6.3.5 Post-Curing ............................................................................................... 41 6.3.6 Shipping and Logistics.............................................................................. 41 6.3.7 Waste Disposal.......................................................................................... 42
3
6.4 Beam Costing.................................................................................................... 42 6.5 Summary – Beams ............................................................................................ 44
7 Hub Manufacturing................................................................................................... 46 7.1 Overview........................................................................................................... 46 7.2 Hub Manufacturing........................................................................................... 46
7.2.1 Major Capital Equipment.......................................................................... 47 7.3 Hub Costing ...................................................................................................... 47
8 Summary and Conclusions ....................................................................................... 49
List of Tables Table 2-1 SKA Phase 1 and Phase 2 Production Rates ..................................................... 8 Table 2-2 Materials Quantities Handled Each Day ......................................................... 10 Table 3-1 Phase 1 Capitalization Costs, includes significant major equipment applicable
to Phase 2 (in USD). ................................................................................................. 13 Table 3-2 Phase 2 Capitalization Costs (in USD)............................................................ 13 Table 3-3 Lead Times from Point of Decision on Phase 1 (months elapsed)................... 14 Table 3-4 Direct Cost of Production of SKA Composite Reflectors (USD). ................... 15 Table 3-5 Indirect Cost of Production of SKA Composite Reflectors (USD).................. 16 Table 3-6 Final Cost per Composite Reflector for SKA Phases 1 and 2 (USD). ............. 16 Table 5-1 Reflector Production Requirements Impacting Dish Manufacturing............... 21 Table 5-2 Production Flow Sequence – Phase 1............................................................... 25 Table 5-3 Detailed Daily Operations Sequence, Phase 1 Production, Per Mold.............. 25 Table 5-4 Production Flow Sequence – Phase 2............................................................... 26 Table 5-5 Detailed Daily Operations Sequence, Phase 2 Production, Per Mold.............. 27 Table 5-6 Tooling Cost Estimates, 130 m2 Tooling ......................................................... 28 Table 5-7 Major Capitalization and Mobilization Costs (USD). ...................................... 29 Table 5-8 Reflector Dish Surface Assembly Summary Cost of Fabrication (USD). ....... 30 Table 6-1 Estimation of some factors/costs associated with manufacturing locations
(USD)........................................................................................................................ 32 Table 6-2 Summary Chart Evaluating the Three Major Beam Production Options......... 36 Table 6-3 Manufacturing Flow Sequence for Semi-Preg Beam Manufacturing .............. 37 Table 6-4 Beam Production Overall Requirements .......................................................... 39 Table 6-5 Major Capital Expenditures for Phase 1 and Phase 2 of Beam Production
(USD). ....................................................................................................................... 40 Table 6-6 Summary Costing of Production of 8 Carbon Composite Beams (USD). ....... 43 Table 6-7 Summary of Baseline Assumptions for Costing .............................................. 44 Table 7-1 Hub Production Overall Requirements ............................................................ 46 Table 7-2 Major Capital Expenditures for Phase 1 and Phase 2 of Hub Production (USD).
................................................................................................................................... 47 Table 7-3 Summary Costing for Production of Hubs (USD). .......................................... 47
List of Figures Figure 1 CART 12 m reflector model................................................................................. 7 Figure 2 Potential Manufacturing Plant Layout................................................................ 20 The following report is a final report in support of Public Works and Government Services Canada contract number 31035-081825/001/VAN.
4
1 SummaryThe Composite Applications for Radio Telescopes (CART) project at the Herzberg Institute of Astrophysics’ (HIA) Dominion Radio Astrophysical Observatory (DRAO) in Penticton Canada is an ongoing effort to investigate the application of composite materials to radio telescope structures to provide cost effective collecting area for the Square Kilometer Array (SKA). The first phase of the project is focused on reflectors as they are seen to have the highest potential for cost/performance gains from the application of composite materials. One of the least well understood aspects of advanced composites is the production costing at high volume manufacturing, and the capability to develop business plans with sound input numbers, especially in new applications where no precedent has been set and no historical data is available. A detailed analysis of the potential production costs of delivery of the SKA Phase 1 and Phase 2 requirements, 620 and 3,000 reflectors respectively over 4 years for each program, is presented here.
Two very successful 10-m prototypes have been built and tested at DRAO and as a step towards an SKA compatible reflector a 12 m design has been produced based on the second prototype, the Mk2 (see SKA Memo 106). This design was used as a starting point and, with consideration of all aspects of the manufacturing feasibility, including logistics and risk reduction strategies; an integrated evaluation of the manufacturing cost for the 12-m diameter composite reflector for the SKA program was performed.
The outcome of the study was to recommend that manufacturing of all components of the reflector (dish, beams, and hub) be performed at one location near to the final SKA site. The cost of a complete composite reflector assembly (surface and backing structure) was determined to be $49,100 ($435/m2) for Phase 1 and $45,000 ($398/m2) for Phase 2 (all figures in US Dollars). These values do not include profit margin as this will depend on unknown factors associated with SKA funding of the project and risk of money should a private entity perform the manufacturing. These numbers take into account present costing for Phase 1 and allowance for 4.5% compounded inflation between programs. Input from material suppliers indicates that the maximum economies of scale for quantity based discounts are applicable to a program of this size. The evaluation recommends some specific cost containment strategies that can be researched going into the production scenario. This includes fabrication on-site processing of materials and reduction of production consumables and waste product generation.
The program capitalization requirements are very reasonable, a total of $3.2 million for Phase 1, and $3.9 million for Phase 2. This does not include working capital. Project initiation needs to take place a minimum of 15 months prior to the first delivery date. This number is highly dependent on location selected for the SKA site and available capabilities in the area.
Finally, as a reality check, the numbers and approach were compared to and found to be consistent with the only other similar volume and size production currently in the composites industry, wind turbine blade manufacturing. A 40-m blade has a mold
5

surface area (one-side) about the same as a 12-m reflector made of similar materials and produced at about the same rates as the SKA program will require.
This study is based on a symmetric reflector design; projection to an offset reflector based on preliminary offset designs indicates an increase in costs of up to 25%. This is due to a combination of larger molded area/aperture area and an increase in structural material due to offset loading.
6

2 Introduction and Approach to Analyzing Composite Dish Manufacturing Costs
2.1 OverviewThe manufacture of composite reflectors for this size of antenna has been done in the past. These were for military applications however, and the history of prior manufacturing is such that the reflectors were one-off, very heavily invested in materials and manual labour costs, and not designed to have the serial manufacturing requirements of the scale envisioned for this project. Given the unique nature of the requirements, the SKA manufacturing program was approached from a standpoint of optimization of the production capability of the reflectors, while retaining the baseline requirements for performance and durability. All aspects of reflector manufacture were examined for achieving optimal production and cost of delivered reflectors. All processes were held within the capability and tolerances demonstrated under the CART project.
2.2 Criteria and Constraints The following criteria and constraints were used as baseline input for the manufacturing study, and any other specific limitations will be defined within each of the manufacturing and assembly operations:
� Phase 1 production rate of 620 reflectors over 4 years.
� Phase 2 production rate of 3,000 reflectors over 4 years.
� Production in a remote or “semi-remote” location with accessibility to the installation site.
� Reflector design as specified in the DRAO CART 12-m design, consisting of a monolithic surface and rim with a central hub and 8 beams bonded to the back, see Figure 1.
Figure 1 CART 12 m reflector model.
7

Table 2-1 SKA Phase 1 and Phase 2 Production Rates
Phase 1 Phase 2 Total Reflector Production 620 3,000 Year 1 Production 100 600 Year 2 Production 175 800 Year 3 Production 175 800 Year 4 Production 175 800Maximum Weekly Production 3.6 16.7Maximum Daily Production 0.73 3.3
Reflector Dishes/week 3.6 16.7Number of Dish Tools 2 4Tool Turnaround (hours/reflector) 48 24
Beams/week 29.2 133.3Number of Beam Tools 2 4Beam Tool Turnaround (hrs/beam) 5.5 2
Hubs/week 3.6 16.7Number Hub Tools 1 4Hub Tool Turnaround (hrs/hub) 8 8
� Skilled labour available locally, including the capacity to operate and maintain precision machinery such as water jet cutters.
� Materials sources not available locally and therefore would be procured in Europe, North America, and/or China.
� Project funding such that major commitments to materials and tooling purchases would be available in the initial phases of the project.
� Dedicated facilities built for the manufacturing and assembly operations.
� All processes and manufacturing technology are mature currently and no process development beyond production performance improvement is required.
� Materials required for this scale of manufacturing would be custom designed and specified for the project with materials suppliers providing dedicated and optimized materials.
Table 2.1 defines the planned production rates by year and the ramp-up rate.
2.3 Manufacturing Labour Assumptions The following manufacturing labour assumptions were used as part of the development of the overall rates of production, number and complexity of the tools and jigs, and
8

allocation of plant and facility costs. They are based on attaining a reasonable and sustainable production rate, on capability to attract and keep semi-skilled and skilled employees, on mitigating risk associated with inbound raw materials deliveries and potential schedule delays, and on experience in the wind turbine blade and high-volume production boat markets. Quality issues rapidly develop with overly-aggressive production and finishing schedules, and it is found that production will be optimized given the assumptions made below:
� Manufacturing on no more than 2 shifts/day, 5 days per week.
� Production weeks are 48 per year.
� Productive hours per employee are 1,800/year allowing for training, vacation, holidays, and sick time.
� All tasks are team-based.
� Work environments are fully climate controlled, year-round, and work spaces have no hazardous materials exposures for personnel.
� Training time is half-day per person per month.
� Initial worker training is 4 weeks, amortized into cost of start-up.
� Most employees are cross-trained for multiple jobs on the production line and job responsibilities overlap between work areas, allowing workers in, for example, beam production, to be on the hub production line based on composite process schedules.
2.4 Manufacturing Materials Assumptions The following general assumptions were made based on the manufacturing materials requirements for the three major components, reflector dish surface, hub, and beams
� Dry fiber raw materials for the hub and reflector dish surface would be procured in Europe and North America, as would the core materials.
� Resins for the hub and reflector would be procured in India, China, or in the country of manufacture (South Africa or Australia).
� Semi-preg raw materials for the beams would be procured in Europe and North America.
� All materials would have multiple sources, hence shipping costs are slightly higher than for sole-source procurement.
� In-bound shipments would be consolidated and minimum full-container shipments would be received.
� All waste would be disposed of locally in land-fills, and is non-hazardous.
� Raw materials packaging (size and quantity) would be determined for manufacturing optimization, not for minimized shipping costs.
9

� Inventory (local and in-transit) would be determined based on risk mitigation as required for bi-monthly completed reflector deliveries.
� 12-week shipping time is assumed for all in-bound cargo, ocean freight estimated from West Coast US as baseline.
� Insurance requirements are assumed based on having adequate coverage to air-freight make-up loads of inbound raw materials should ocean freight be displaced.
� Bulk materials orders are placed at the beginning of the program, with deliveries specified in lot-releases. Quantity discounts are at maximum typical for industries in very high-volume production (e.g. wind industry).
2.5 Production Automation Due to the shape of the components, relatively low labour levels, and inherent difficulty in handling dry fiber, automation tasks are at a minimum for the SKA program. They generally are used for trimming of the beams and hub, and resin mix and injection for the reflector dish surface infusions and hub infusions. A significant part of the reasoning for selecting these operations is in repeatability and safety, and not nearly as much cost driven. For example, the trimming of the beams has no net cost benefit due to automation, but removing the workers from the dust environment and containing the waste materials aids greatly in the quality of the workplace. This also sets up the production requirement for Phase 2, as in this particular case, the cell is capable of handling the full Phase 2 demands without additional equipment, only additional jigs for the larger number of incoming parts. Automated painting of the molds was considered, but was rejected due to the size and reach required, the very limited operational time of a dedicated paint robot, plus the added work-space cost necessary.
Automation was considered for the handling of the large quantity of materials, see Table2-2, and the jigs and fixtures costed for capability to handle rolls of fabric and assist the personnel placing materials against the painted mold surface. No easy way could be envisioned to truly automate the final placement of materials, based on the critical requirements for core joints, overlap of fabrics, and contouring of materials without wrinkling. This is an area actively under consideration in other industries and automation will be re-considered if, and as, it matures. Loading and unloading of materials would be assisted with air and electrically driven systems, and lifting fixtures are costed with these requirements in mind, however these are simply assist devices and not delving into production automation at this time. Table 2-2 Materials Quantities Handled Each Day
Reflector Materials(kg/day)
BeamMaterials(kg/day)
HubMaterials(kg/day)
WasteMaterials(kg/day)
Total(kg/day)
Phase 1 930 330 120 180 1,560Phase 2 4,200 1,500 560 840 7,100
10

2.6 Transportation and Logistics This was addressed in two areas, materials shipping into the manufacturing operations, and shipping of completed assemblies to the site. Although transportation to the site was not specifically included or calculated, the realities of getting a reflector to the erection site did affect some of the choices for dish production.
Given that manufacture is almost certainly necessary in a remote location, factors involving shipping, storage, handling, and logistics of materials and sub-components were used to review manufacturing options; for example, sub-contract manufacturing in a low-cost labour region, such as India, Malaysia, or China. Also considered were the logistics and costs of transporting a large volume of container shipments to the assembly site, the risks associated with potential delays, and inventory costs of work-in-progress which, in this case, includes time during shipments of high-value components. For these components, the total labour costs became a negligible factor in the production decision, as demonstrated later.
It was assumed, as a baseline, that manufacturing of the one-piece composite reflector surface would be performed at a facility developed within reasonable transportation distances of the final SKA site, and certainly within the country of that site. Several factors played into that assumption, and included:
� It is unlikely the reflectors could be shipped without full assembly of the structural beams and hub to maintain dimensional tolerance.
� Given the reflectors are fully assembled, the volume requirements for shipping a single reflector is equivalent to 5 side-by-side standard 40-foot shipping containers. With custom designed and fabricated cradles, two reflectors could effectively be stacked on each other for barge shipment.
� A large ocean-going barge would then be capable of transporting 16 reflectors at a time to the nearest port location, and with a three-week en-route time this equates to having up to 8 barges and 6 tugs continuously operating when loading and unloading are included.
� Transport from ports to inland regions would require a dedicated open lane of width exceeding most roadways which is highly unlikely to be accommodated given delivery rates of from 4 to 16 completed assemblies per week. Helicopter transport is almost mandatory in that case, and poses huge logistical challenges for the port operations.
� The very light weight of the reflector dish surface favors transportation of bulk raw materials into a local manufacturing facility, optimizing the delivery costs as materials for several reflectors can be shipped inbound in a single container. Materials for approximately 10 reflectors can be shipped in-bound in one container, giving an approximate shipping cost of $1,500/reflector.
� Local capability for manufacture also translates into local capability for repair and maintenance, as well as regional jobs associated with the SKA project.
11

� Inventory and supplies can be much more effectively managed based on erection schedules at the sites, and repair and rework options are within easy location of both the manufacturing and the site.
2.7 Indirect Manufacturing Costs Indirect manufacturing costs were estimated for functions not directly related to the actual fabrication of the composite reflectors. Costs include general management, accounting and book keeping, janitorial, yard and facilities upkeep, insurance, non-production facilities, automobile expenses, and travel and customer interface support. A historically based figure of 7% of manufacturing cost was calculated for General and Administrative expenses (G&A), and 15% of manufacturing costs for facilities overhead including equipment maintenance.
No allowances were made for ongoing R&D or for sales support, as these functions were assumed to be addressed in the lead-in to the SKA project, and the customer is assumed to be only one. Similarly, no allowances were made for cost of money and line-of-credit due to the sole customer assumption and correspondence indicating funds would be available at the initiation of the program. Although no allowance was made for direct product R&D, costing of indirect expenses for Phase 2 did include the personnel and other expenses necessary to initiate Phase 2 production whilst Phase 1 was still underway, and considering that construction and management would need to be managed through the year prior to starting Phase 2 deliveries.
12

3 SKA Manufacturing Cost Summary
3.1 OverviewThe results of the costing are summarized in this section, and risks and technologies briefly discussed. A timeline is presented that would indicate the major work on a composite production program for SKA needs to be underway at least 15 months prior to the first required delivery. This is of course dependent on the location of the facility and may well need significantly more time. Contract workers covering all aspects of the technologies and experience bases discussed here are readily available, and these would be relied on to initiate the program and train local workers. Detailed attention to the process and production design led to a very significant reduction in costs, and these are reflected in Table 3-4 below. The numbers are conservative however, in all aspects of the costing, to ensure no major surprises in the future. No profit has been used in any of these numbers, but it is the only cost left off. If this needs to be included, it would typically be 10-12% before tax for a project that is captive to one customer, where the cash flow is predictable and the risk of capitalization and operations is mostly removed.
3.2 Capitalization Costs and Manufacturing Lead Times Capitalization costs are presented in Table 3-1 and Table 3-2 for only facility and production capitalization, and not for working capital requirements. They are broken into direct manufacturing capitalization and indirect capitalization. Direct capitalization includes all items such as tooling, production equipment, equipment installation, insurance, shipping, taxes, and contract labour to assemble and prepare facilities such as electricians, plumbers, etc. Indirect capitalization includes capital necessary for engineering and supervision for start-up, pre-engineering and design, construction expenses, permits, fees and upfront costs. Direct capital costs will typically range from 70 to 80% of the equipment total installed costs and indirect from 20-30% of installed cost.Table 3-1 Phase 1 Capitalization Costs, includes significant major equipment applicable to Phase 2 (in USD).
Component/Process Direct Capital Indirect Capital TotalDish Fabrication and Assembly $1,952,000 $546,000 $2,498,000Beam Fabrication $385,700 $96,500 $482,200 Hub Fabrication $149,200 $37,300 $186,500 Totals $2,486,900 $679,800 $3,166,700
Table 3-2 Phase 2 Capitalization Costs (in USD)
Component/Process Direct Capital Indirect Capital TotalDish Fabrication and Assembly $1,781,000 $528,500 $2,309,500Beam Fabrication $1,134,500 $200,000 $1,334,500 Hub Fabrication $166,700 $41,700 $208,400 Totals $3,082,200 $770,200 $3,852,400
13

Table 3-3 Lead Times from Point of Decision on Phase 1 (months elapsed)
1 2 3 4 5 6 7 8 9 10 11 12 13 14 15
Detail Facility Design Quotes&tender
Facility Construction
Final process designs Select utilities and process equipment
Procurement of major items Install & commission
Component final design and models for tooling
Plug(s) procurement & shipping Install Mold builds
Vendor and materials selection PO’s placed Manufacturing Shipping and initial inventory
Detail jig and fixture designs Bids Fabrication of jigs and fixtures Shipping, on-site fabrication
Install
Staffing and personnel hiring Mold and tooling teams
Training and development
For the purposes of these estimates, as the program is a captive supply program to the SKA office, it was assumed that the capitalization costs could be straight-line amortized over the production during each Phase. In essence this means that interest charges, instead of being a fixed cost on a per-unit basis, is an overhead cost to the overall antenna delivery program at SKA. Additionally, due to the length of time involved in the Phase 1 deliveries, 4-years, it was further assumed that the Phase 1 capitalization costs would be fully amortized over that phase alone. Much of the equipment, tooling, and facility capitalization carry forward into Phase 2 with no significant detriment or repair requirements. Phase 2 costs are therefore seen as relatively low as compared to Phase 1.
Manufacturing lead times from the point of decision making are controlled by the facility and by shipping and installation once the facility is prepared. Table 3-3 is an estimate of lead times for the Phase 1 SKA delivery.
This lead time estimate predicts about a 15 month lead time from commitment to initiation of production, with approximately 2 months within that time frame for staff training and hands-on development of final product to the specification. The facility is specifically designed to be easily constructed and be productive immediately, with minimal movement and interference between work cells. Therefore the construction schedule should provide a useful building structure by month 11 and a working environment by month 14.
The SKA Phase 2 schedule will flow directly from within Phase 1, and is estimated to be a 12-month effort to add tooling, modify the building (designed specifically for this to avoid interfering with ongoing production requirements), add utilities, and attend to staffing needs. The largest risk is in location and its effects on shipping and also personnel/staffing, and is an unknown that cannot be readily addressed. The second most significant risk is in the plug and mold development window, considering the dependency
14

of all downstream operations in having these prepared and the remoteness of the potential manufacturing.
3.3 Direct Cost of Production Direct cost of production includes all those costs which are associated with production including fixed and variable costs such as raw materials, labour, and equipment. Due to the nature of the SKA program, in which the set-up for a composite reflector is for a single captive customer, it could be argued that every cash outlay is a direct cost as it is required for this production and none else. However, in order to accurately reflect the comparison between different methods of manufacture of the SKA antenna, the costs have been broken into more traditional categories. Methods of financing the project were not made available, so all capitalization has been amortized into manufacturing costs as a fixed charge on a per-unit basis, and converted into a per square meter of reflector surface basis as shown in Table 3-4.
3.4 Indirect Costs of Production In this case, the indirect costs include administrative and office expenses, cost of allocated space for offices, lunch, bath, and change rooms, cost of grounds-keeping and security, engineering, legal, accounting, and other professional services, communications and travel not directly attributable to production. An estimate is presented in Table 3-5 for each phase, allowing for fairly significant increases in executive and engineering support due to the overall size and nature of Phase 2.
Table 3-4 Direct Cost of Production of SKA Composite Reflectors (USD).
Phase 1 Phase 2 Raw Materials 28,257 30,312 Labour 2,720 3,420 Total Direct Variable Production Cost 30,977 33,732 Amortization expense 5,110 1,303 Facility lease 2,104 729Property tax and insurance 525 184Inventory carrying expenses 685 588Plant overhead costs 5,910 5,480 Total Direct Fixed Production Costs 14,334 8,284
Total Direct Cost of Production $45,311 $42,016 Cost Per Square Meter Collecting Area $401/m2 $372/m2
15

Table 3-5 Indirect Cost of Production of SKA Composite Reflectors (USD).
Indirect Cost Item Estimated Annual Cost Phase 1
Estimated Annual Cost Phase 2
Executive and engineering 350,000 1,200,000 Clerical 45,000 150,000 Office Maintenance 10,000 15,000 Office Floor-space (2-floor, 18m x 10m) 30,000 36,000Communications/computing 16,000 60,000 Travel 60,000 200,000 Vehicles 15,000 60,000 Grounds-keeping 9,000 10,000 External – Personnel/HR 12,000 14,000 External – Legal 8,000 15,000 External – Accounting/payroll 18,000 48,000 Conferences and meetings 10,000 40,000Miscellaneous upkeep 5,000 6,000
Total $588,000 $1,854,000 Cost per reflector $3,793 $2,935 Percentage of Overall Costs 7.8% 6.5%
The G&A (General & Administrative) overhead is within industry norms, even considering the high cost of management salaries and travel due to the technical requirements of the program and the interface with SKA program office and the antenna community. It is anticipated the ramp-up to Phase 2 will need to occur about 12 months prior to the anticipated start of delivery, in order to accommodate the tooling, space, and materials shipping and handling requirements. There is also a development effort necessary to bring the production of the semi-preg in-house, or failing that to set-up a supplier in India or China with this technology. Based on the ramp-up, the costing of the indirect items included in Phase 2 reflector deliveries includes a 4.75 year window for these staff, etc. Table 3-6 Final Cost per Composite Reflector for SKA Phases 1 and 2 (USD).
Phase 1 Phase 2 Direct Cost per Reflector $45,311 $42,016 Indirect Cost per Reflector $3,793 $2,935 Total Reflector Cost $49,104 $44,951 Cost per m2 Collector Area $435/m2 $398/m2
3.5 Overall SKA 12-m Composite Reflector Costing The final costs per reflector shown in Table 3-6 indicate a significant cost saving based on a decrease of total overhead and amortized costs for Phase 2. An average cost escalation of 20% was applied to all materials, personnel, and other costs. This leads to a 4.5% per annum cost increase each year over the previous year.
The total cost does not include any number for profit as the business structure and financing was uncertain at the time. However all other costs are included, and it is felt
16

this represents a very fair estimate, most likely on the high side, as raw materials were costed at or near their North American and European averages, and other costs from shipping to facilities were also kept on the high side to allow for uncertainty in location of production.
3.6 Risk Assessment The primary risk to the composite reflector option for the SKA, and the costing associated with this report, is in the LOCATION and local conditions of the manufacturing plant, as well as the access to trainable labour pool (may need to be imported labour, but given the small numbers this is not a huge concern.)
However, the location may dictate either higher or lower costs, and these could be significant, as they would be determined by everything from air quality (blowing sand and dust) to materials availability in the host country, to transport and port access, to a requirement to build from the ground-up. The current cost estimate assumes ground-up building and lease rates to reflect this concern, however the building costs have been too volatile to select anything other than a middle point estimate of $100/square foot for commercial tilt-slab buildings. The rate does include a higher cost of facility for cleanliness, energy efficiency for comfort and production requirements as well as cost control, and independently zoned HVAC throughout. The risk to the SKA program would potentially come from widely varying costs and more importantly, capacity to erect a building within the time frame allocated.
Little risk is seen from the standpoint of the technologies recommended, even though they vary in some cases from the technologies used for the DRAO MK2 CART prototype, nor should there be any risk associated from the recommended and costed materials changes (hybridizing the reflector surface face-sheets with fiberglass and aramid (Kevlar) fiber, and hybridizing the beam shear and hub shear panels with glass and carbon fiber). These materials and processes have all been used commonly and are known to give results consistent with those achieved in the MK2 program. No significant process development is required for achieving all the goals and the use of the materials selected and costed out.
Some risk is associated with the logistics of shipping materials to the manufacturing facility in the quantity and regularity required, especially when ultimately a container a week will be required to meet the production rate. This risk can be mitigated with careful inventory planning and the capacity to accelerate production faster than SKA delivery schedule demands. The ability to accelerate production allows a significant amount of risk management flexibility, as delays and other factors can be managed without going to overtime and other measures.
3.7 Potential Technologies for Cost Reduction and Manufacturing Improvement
As will be noted in the beam and hub manufacturing sections, it is recommended to adopt a semi-preg drape forming process which can dramatically improve production times, lower labour content, and significantly reduce waste (saving time associated with placing the materials in the first place, and later removing them ultimately as waste.)
17

The high volume of materials associated with the SKA composite option leads naturally to cost reduction by eliminating the raw materials converters that typically have the largest (and least value) mark-up in the process supply chain. It is a relatively inexpensive operation to set-up for internal materials conversion (dry-fiber and resin to semi-preg in this case), and the equipment and technology can be purchased turn-key.The additional savings on shipping and risk associated with having to ship by ocean in refrigerated containers (schedule risk primarily) is a huge program potential benefit, as the raw materials can come packaged in regular containers and there is no shelf-life issue.
Options for added automation were investigated but not used in any significant degree, as the minimum staffing requirements for certain operations were available for tasks a robot would have been able to perform. In addition, the size and shape of the part dictates very long-reach and large robots that would add greatly to the maintenance costs and up-front capitalization. Instead fixtures, jigs, and gantry systems to provide fast and convenient access and placement of materials were evaluated and costed. With the robot option, the usage suffers as there is only a very small widow of actual process benefit, and most of the time is spent idle. Moving robots or molds between cells/stations to improve their productivity is not feasible in this case.
18
19
4 Composite Reflector Manufacturing Facilities
4.1 OverviewFacilities are described for both Phase 1 and Phase 2 manufacturing, showing a logical and simple transition between the two differing production requirements. This is especially important during the transition between Phases where production loss is not acceptable and building modification, tooling development, new jig and fixture build, and ongoing demands have to be coordinated. One option for a dedicated lay-out that should achieve SKA requirements is provided.
4.2 Plant Lay-out Figure 2 shows a potential plant lay-out for the SKA composite production. The two primary reflector dish molds and ancillary operations for Phase 1 production can occur with materials flow from right to left. Each area is capable not only of accommodating its complete operations, but also storage and kitting its weekly materials requirements. The materials for the reflector dish are stored upstairs above the beam manufacturing area, and an elevator is shown for transport of these materials into daily production operation.
With expansion into Phase 2, all building modifications and construction can take place outside the active Phase 1 construction space, adding a major incoming materials storage area to the far right, expanding office and administration areas, and adding two bays for the new paint and plug and mold shops. A very slight reconfiguration of the beam manufacturing area is required to go into Phase 2 production, but otherwise it should then be a matter of opening up doors and continuing without interruption.
For scale, two full-sized 40-foot standard shipping containers are shown. All parts are to scale, including the molds for dishes, the beam molds, the beam parts in oven, and the hub molds and parts

Figu
re 2
Pot
entia
l Man
ufac
turi
ng P
lant
Lay
out
20
5 Dish Manufacturing and Reflector Assembly
5.1 OverviewAccurate cost numbers for the reflector assembly required careful consideration of process options for the dish surface fabrication and final assembly operations. In order to effectively develop these cost numbers a manufacturing flow analysis was performed; and labour, materials, facilities, waste, and specialty equipment sized and evaluated.
Due to the size and nature of the dish itself, and the inability to easily move and transport the tooling or the dish surface component, multiple operations occur on the single tool; this places a severe limitation on the producibility requirements and part turn-around. These limitations also create a very different production sequence for the Phase 1 and Phase 2 requirements, as Phase 2 will need a faster production rate per tool than Phase 1.The production rate requirement for Phase 2 necessitates added equipment for placement of materials, and added jigs for staging materials coming in to the process.
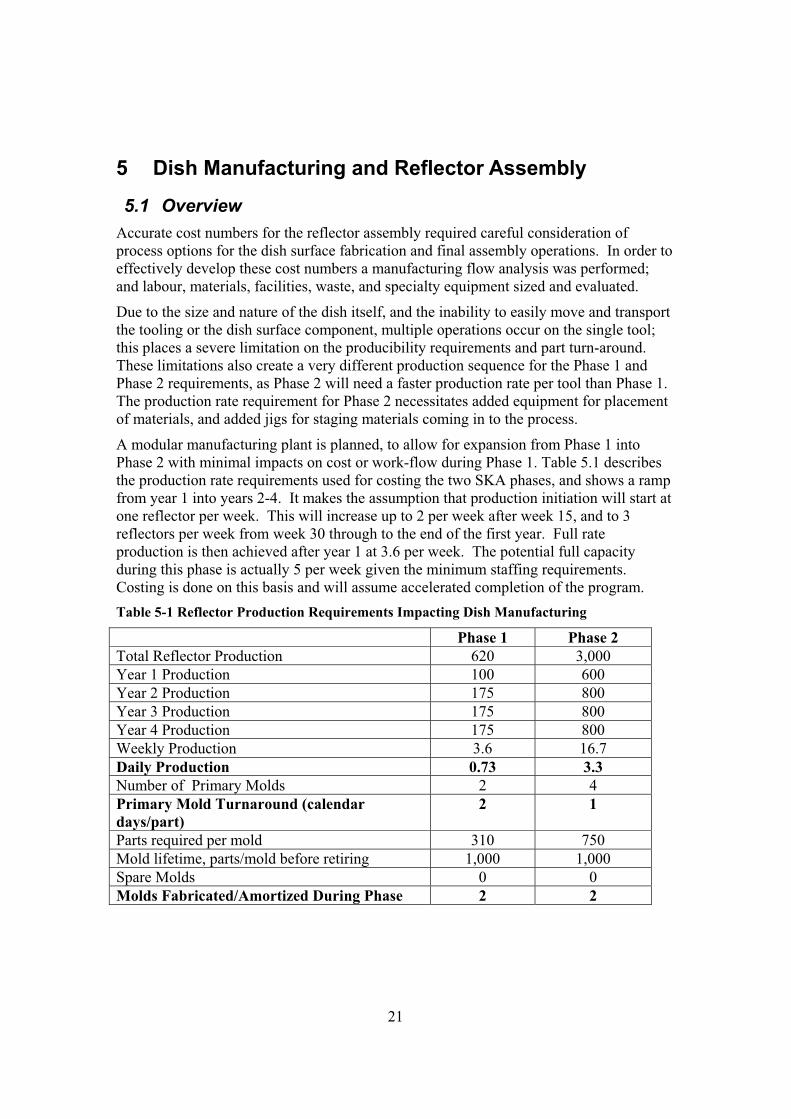
A modular manufacturing plant is planned, to allow for expansion from Phase 1 into Phase 2 with minimal impacts on cost or work-flow during Phase 1. Table 5.1 describes the production rate requirements used for costing the two SKA phases, and shows a ramp from year 1 into years 2-4. It makes the assumption that production initiation will start at one reflector per week. This will increase up to 2 per week after week 15, and to 3 reflectors per week from week 30 through to the end of the first year. Full rate production is then achieved after year 1 at 3.6 per week. The potential full capacity during this phase is actually 5 per week given the minimum staffing requirements. Costing is done on this basis and will assume accelerated completion of the program. Table 5-1 Reflector Production Requirements Impacting Dish Manufacturing
Phase 1 Phase 2 Total Reflector Production 620 3,000Year 1 Production 100 600Year 2 Production 175 800Year 3 Production 175 800Year 4 Production 175 800Weekly Production 3.6 16.7Daily Production 0.73 3.3Number of Primary Molds 2 4Primary Mold Turnaround (calendar days/part)
2 1
Parts required per mold 310 750Mold lifetime, parts/mold before retiring 1,000 1,000Spare Molds 0 0Molds Fabricated/Amortized During Phase 2 2
21

It is possible to meet the production rate with only one mold during Phase 1, but it was felt that the learning curve to get to the volumes required, and the risk to the program by only having one mold available was too great to try to force a single-mold operation. As the molds have an effective product volume of about 1,000 parts each before they would be considered scrap, it is seen that Phase 1 molds can actually accommodate 2,000 parts, and hence these molds can contribute about 40% of the production requirement of Phase 2. However, in the interest of proper cost accounting, the 2 molds are amortized completely over Phase 1, as the time-span of Phase 1 is 4 years, longer than acceptable for normal capitalization payback. No attempt to back purchase the “useable life” in the molds was made as the customer is a captive program and this would only complicate accounting and taxes. Therefore, Phase 2 requires the purchase of only 2 additional molds. Spare molds are not planned due to the size of the tooling, the expense of the facility, and the ability to fabricate parts at a slightly greater rate than that required for typical full production. Risk management planning assumes an added production day per week during the time a mold may need repair (typically 1 week) or rebuilding a new mold (typically 4 weeks since the backup structure will already exist).
Given the performance requirements of the reflector surface, the size of the component, and the need for precision manufacturing, there were only two real options for the production of the dish surface. The surface is a sandwich composite construction made up of two structural skins, currently planned to be a hybrid composite of fibreglass and aramid fibers, over a structural polyvinyl chloride (PVC) foam core. The hybrid fiber option was selected for cost purposes and provides a substantial materials cost reduction over the all-aramid designs currently used, without sacrificing much in the global stiffness of the components. It was felt that the capability to design with the hybrid fiber could easily be developed in the time window prior to SKA inception, and there would be little downside to this material. Resin options were vinylester or epoxy, and both have their benefits and drawbacks, but both would be fully capable of meeting all SKA specifications. The manufacturing options were a) use of semi-preg type materials (applicable to epoxies only and described in detail under the beam manufacturing process), or b) use of vacuum resin infusion (equally applicable to both epoxies and vinylesters.) However, vinylesters do allow the most rapid production, are able to fit into a 24-hour fabrication window for the completed reflector, and are lower cost than epoxies, so are the best choice for Phase 2 manufacturing. It should be noted that epoxies would be able to fit the 24 hour production window; however there is still some uncertainty and process/product development to be done before the technology is “proven and matured” to be able to meet both the production window and reflector specifications at the same time. As a result of this, only the use of vinylester was considered and hence only vacuum resin infusion was considered as a production process. Changing to epoxies, if selected in future, would simply be a matter of adjusting the costing of the resin materials inputs (all other costing is near identical for vacuum resin infusion of epoxies versus vinylesters.) An added potential benefit to epoxies is that they are more environmentally benign and the facilities costs and hazardous materials handling issues are much reduced.
Reflector surface manufacturing also required consideration of the next steps in the completed reflector fabrication, namely bonding of the hub and structural stiffening beams. Two different scenarios were considered here. The first was to use dedicated
22

tooling for the reflector surface manufacturing, remove the reflector surface onto a precision bonding jig by means of a large area vacuum lifter, and return the reflector mold to immediate production availability. The second was to complete all operations on the mold surface, and finish bonding of the hub and beams prior to the reflector release from the mold (this was the selected route for the DRAO fabrication and has met the SKA specifications to date). Analysis shows that the incremental cost of space for the bonding jig ($190/reflector), jig tools and transfer carriage ($140/reflector) add up to $330/reflector. This amount would not offset the cost reduction of the tooling (amounting to $230/reflector) and so there is no financial reason to go this route. The acceleration in production time is significant in absolute terms, but because of the sequence of operations this benefit, in effect, causes a mold to sit idle for part of the time gained unless labour is added to the program. Finally this benefit is offset by the complexity of removing and transferring a very large, relatively thin skin from the production mold to the bonding jig; this is certainly not an easy process to develop and prove-out prior to committing to SKA production.
Once the final process was selected, and the decision to use the same tool for manufacturing the reflector surface and for final assembly was made, a process sequence and facility floor-plan was developed. The tooling is, by necessity due to the scale, rigidly fixed in place and must support the following operations:
� Paint spray booth and robotic paint cell for in-mold antenna surface coating prior to lay-up.
� Curing oven for paint.
� Clean area to eliminate contamination prior to painting and similarly between paint and lay-up.
� Semi-automated work cell for placement of dry fiber materials and core.
� Temperature controlled for infusion and for curing.
� Gantry accessible for placing bonding fixtures and beam/hub bonding.
� Explosion proof for working with vinylester resins.
� Open area to allow workers easy access to all mold surfaces.
� Lifting “device” accessible for full-size part removal and transportation out of facility.
Careful consideration and investment in facility layout and work-flow is demanded by a one-time set-up cost and is amortized into the complete production of Phases 1 and 2.Modular plant layout and design for Phase 2 expansion allows these costs to be minimized, and the payback in worker productivity and mold productivity is excellent.
Designs of the work-cell and work-flow permitting costing for Phase 1 and then Phase 2 production rates, and to estimate the risk associated with failures in various systems. This allows costing for appropriate redundancy based on anticipated repair and service times for major equipment. Work flow management is more difficult in Phase 1, even under the reduced production rate per mold, as the equipment is alternated between molds and workspaces. In Phase 2, each work cell becomes fully autonomous as each cell is on
23

the same parallel production timeline. This allows some added element of risk management as four identical sets of production equipment are in place and hence spares and repair management becomes much more reliable.
The reflector surface fabrication and assembly operations lead on to first Quality Control (QC) and then the trimming and painting of the completed backside of the antenna in a separate booth, and at this stage the product is ready for shipment. No further estimate was made for inventory beyond this point, due to the captive program aspect and assumption that product would be shipped immediately out to the field for installation and hence could be invoiced as finished.
5.2 Reflector Surface Manufacturing The reflector surface is a cored composite assumed manufactured with aramid/fibreglass hybrid fibre skins in vinylester resin, over a core of PVC foam. The foam is slit for resin flow and distribution, and although this adds significantly to the resin cost (due to the amount in the slits), it saves on having to use a distribution media within or external to the laminate. Options exist to improve the manufacturability, such as dual bag infusion, but the costing is likely to be very similar to the calculated costs based on the approach used so far by DRAO in their CART MK2 design. One significant unknown is the cost of waste disposal and this is addressed later in the report. Production requirements lead to a need to have one part roughly every 1.4 days for Phase 1, and 3.3 parts every day for Phase 2. The mold requirements for Phase 2 were used to develop the production planning for Phase 1, in order to optimize the overall costs and reduce risks in each Phase.
5.2.1 Phase 1 Production and Assembly Production sequencing for Phase 1 is developed in Table 5-2, used for determining shift hours for costing, and to validate the production flow and capability to meet daily output. The production operations were set-up such that part removal, lay-up and bagging/vacuum check is always done by the 4-person crew of shift 1, followed by resin injection and beam/hub bonding during shift 2, as well as preparation of the kit and area for tasks the next day. It relies on having gantry and handling systems in place for the fabric and core placements, as well as automation for the painting operations as previously discussed. In Table 5-3, the detailed time flow is developed, with the key main operational stages timed based on experience of higher volume production in the wind-turbine industry. This assumes ramp-up of rates and learning curve as appropriate.Ultimately, production rates of one completed reflector assembly per day are achieved in the program. A significant amount of slack time is seen in the planning, and this is used for cutting kits, area and part preparation and moving and handling of components. All operators are assumed to be trained in all facets of production, providing required skill sets and redundancy.
In the workflow sequence, mold #1 and mold #2 reverse positions/labels at the beginning of each week (in effect a bi-weekly cycle of operation).
24
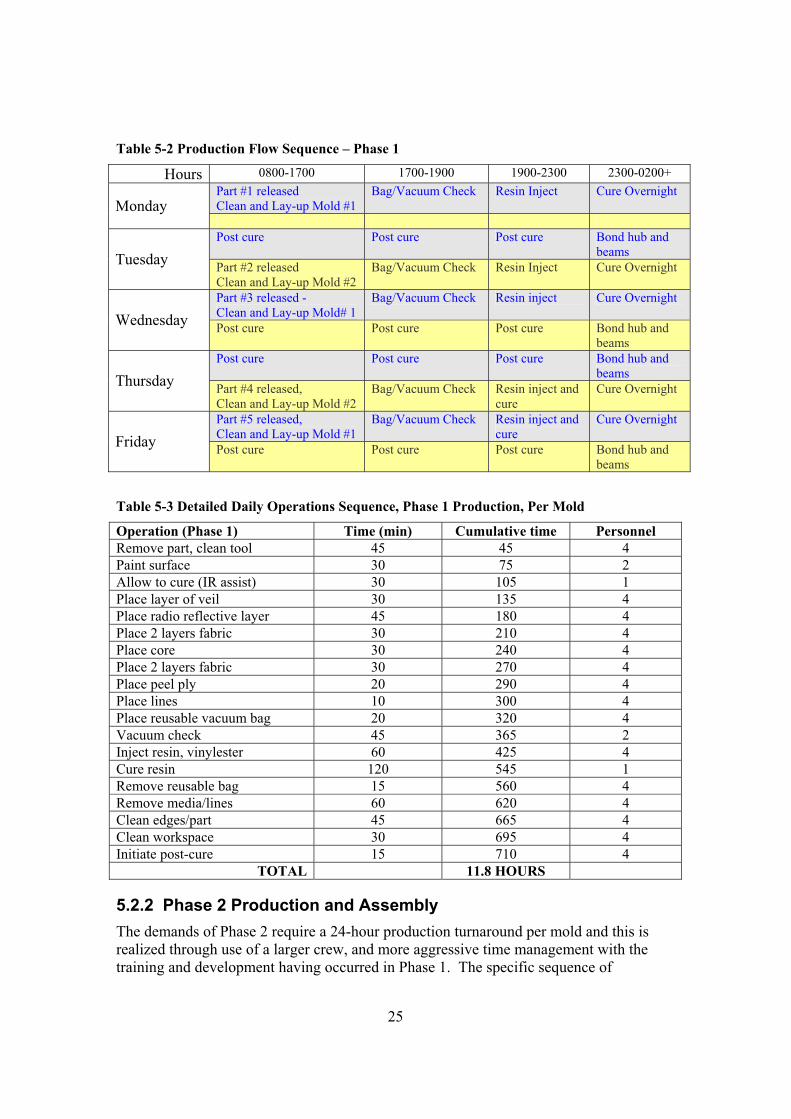
Table 5-2 Production Flow Sequence – Phase 1
Hours 0800-1700 1700-1900 1900-2300 2300-0200+ Part #1 released Clean and Lay-up Mold #1
Bag/Vacuum Check Resin Inject Cure Overnight Monday
Post cure Post cure Post cure Bond hub and beams Tuesday Part #2 released
Clean and Lay-up Mold #2 Bag/Vacuum Check Resin Inject Cure Overnight
Part #3 released - Clean and Lay-up Mold# 1
Bag/Vacuum Check Resin inject Cure Overnight
Wednesday Post cure Post cure Post cure Bond hub and beams
Post cure Post cure Post cure Bond hub and beams Thursday Part #4 released,
Clean and Lay-up Mold #2 Bag/Vacuum Check Resin inject and
cureCure Overnight
Part #5 released, Clean and Lay-up Mold #1
Bag/Vacuum Check Resin inject and cure
Cure Overnight
Friday Post cure Post cure Post cure Bond hub and beams
Table 5-3 Detailed Daily Operations Sequence, Phase 1 Production, Per Mold
Operation (Phase 1) Time (min) Cumulative time PersonnelRemove part, clean tool 45 45 4Paint surface 30 75 2Allow to cure (IR assist) 30 105 1Place layer of veil 30 135 4Place radio reflective layer 45 180 4Place 2 layers fabric 30 210 4Place core 30 240 4Place 2 layers fabric 30 270 4Place peel ply 20 290 4Place lines 10 300 4Place reusable vacuum bag 20 320 4Vacuum check 45 365 2Inject resin, vinylester 60 425 4Cure resin 120 545 1Remove reusable bag 15 560 4Remove media/lines 60 620 4Clean edges/part 45 665 4Clean workspace 30 695 4Initiate post-cure 15 710 4
TOTAL 11.8 HOURS
5.2.2 Phase 2 Production and Assembly The demands of Phase 2 require a 24-hour production turnaround per mold and this is realized through use of a larger crew, and more aggressive time management with the training and development having occurred in Phase 1. The specific sequence of
25
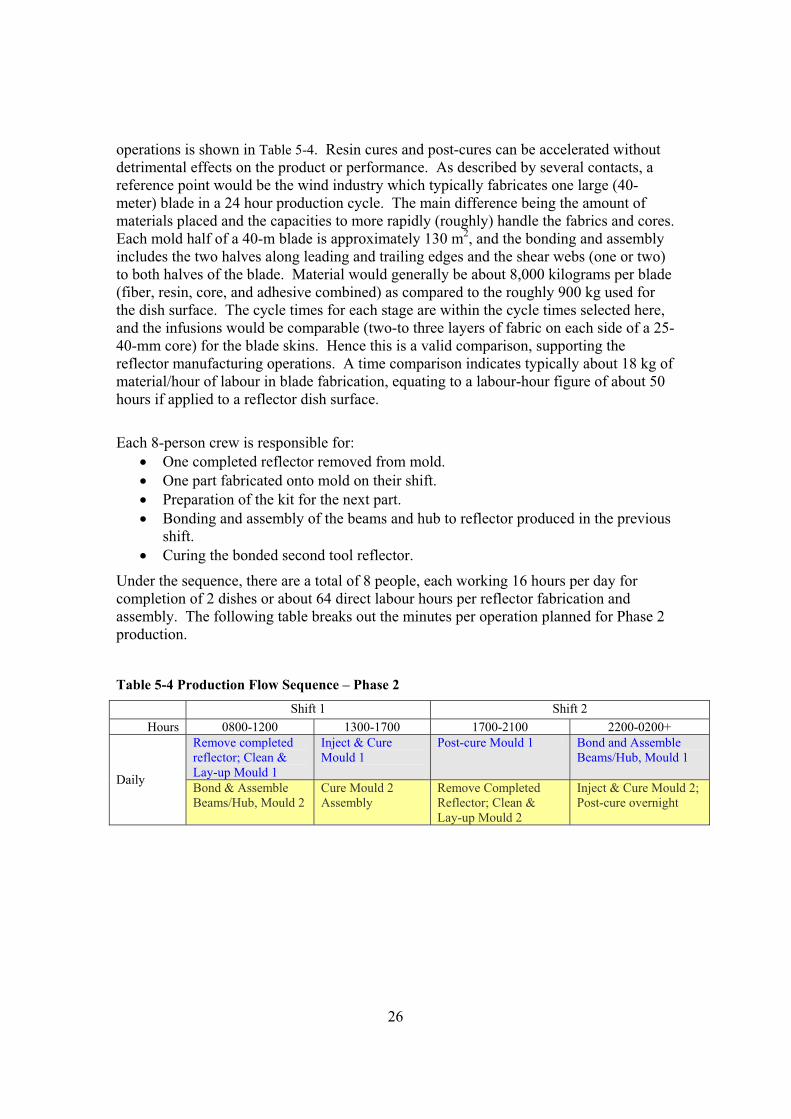
operations is shown in Table 5-4. Resin cures and post-cures can be accelerated without detrimental effects on the product or performance. As described by several contacts, a reference point would be the wind industry which typically fabricates one large (40-meter) blade in a 24 hour production cycle. The main difference being the amount of materials placed and the capacities to more rapidly (roughly) handle the fabrics and cores. Each mold half of a 40-m blade is approximately 130 m2, and the bonding and assembly includes the two halves along leading and trailing edges and the shear webs (one or two) to both halves of the blade. Material would generally be about 8,000 kilograms per blade (fiber, resin, core, and adhesive combined) as compared to the roughly 900 kg used for the dish surface. The cycle times for each stage are within the cycle times selected here, and the infusions would be comparable (two-to three layers of fabric on each side of a 25-40-mm core) for the blade skins. Hence this is a valid comparison, supporting the reflector manufacturing operations. A time comparison indicates typically about 18 kg of material/hour of labour in blade fabrication, equating to a labour-hour figure of about 50 hours if applied to a reflector dish surface.
Each 8-person crew is responsible for: � One completed reflector removed from mold. � One part fabricated onto mold on their shift. � Preparation of the kit for the next part. � Bonding and assembly of the beams and hub to reflector produced in the previous
shift. � Curing the bonded second tool reflector.
Under the sequence, there are a total of 8 people, each working 16 hours per day for completion of 2 dishes or about 64 direct labour hours per reflector fabrication and assembly. The following table breaks out the minutes per operation planned for Phase 2 production.
Table 5-4 Production Flow Sequence – Phase 2 Shift 1 Shift 2
Hours 0800-1200 1300-1700 1700-2100 2200-0200+ Remove completed reflector; Clean & Lay-up Mould 1
Inject & Cure Mould 1
Post-cure Mould 1 Bond and Assemble Beams/Hub, Mould 1
Daily Bond & Assemble Beams/Hub, Mould 2
Cure Mould 2 Assembly
Remove Completed Reflector; Clean & Lay-up Mould 2
Inject & Cure Mould 2; Post-cure overnight
26

Table 5-5 Detailed Daily Operations Sequence, Phase 2 Production, Per Mold
Operation (Phase 2) Time (min) Cumulative time (min)
Personnel
Clean tool 30 30 6Paint surface 20 50 2Allow to cure (IR assist) 30 80 1Place layer of veil 15 95 6Place radio reflective layer
30 125 6
Place 2 layers fabric 15 140 6Place core 15 155 6Place 2 layers fabric 15 170 6Place peel ply 10 180 6Place lines 10 190 6Place reusable vacuum bag
10 200 6
Vacuum check 45 245 2Inject resin, vinylester 45 290 4Cure resin 90 380 2Remove reusable bag 15 395 6Remove media/lines 30 425 6Clean edges/part 30 455 6Clean workspace 15 470 6Initiate post-cure 10 480 4
TOTAL 8 HOURS
5.3 ToolingThe nature of the SKA project places a very high demand on the tooling for the reflector surface, and the size dictates special consideration for all aspects of tooling. Tooling quotes and approaches were developed from three sources, and discussions on the best methods to manufacture and operate the tools were held with contacts in the industry handling tools of equivalent sizes. Based on production rates, materials of manufacture of the reflectors, the requirements for surface dimensional control, and the need to contain costs for the overall program, a tooling approach was developed that would see the project manufacture tools at the dish production site. Tools have multiple functions as discussed, including indexing for painting, materials placement off of gantry systems, and fixtures for location, placement, and vacuum assembly during bonding of ribs and hub. Furthermore, the tools would likely include heating and cooling for temperature control to maintain surface dimensional tolerance over a very rapid and aggressive infusion and cure cycle. This also aids in the painting quality and curing rates necessary for the production rate to be maintained.
Plug and mold costs from tooling suppliers and an estimate for on-site mold manufacturing (assuming production in Australia or South Africa) are shown in Table 5-6.Discussions were held with several leading composite tooling companies over tooling approach, lifetime and handling of molds of this size, and their construction methods. In discussion, it was determined that movement of a mold this size would only be realistic if
27

the mold were fabricated in several segments and shipped individually, then assembled and completed on site. This approach has many drawbacks, especially for multiple molds, due to desire for durable molds (vacuum tight over tool life), very high shipping costs, very high labour costs for the on-site assembly (must be done with tooling manufacturer labour on contract for warranty) and added cost and complexity in the mold manufacturing operations.
A second approach involves manufacturing the plug in multiple pieces, placing and assembling on-site, and finishing the surface locally to give a tool-quality surface, and fabricating the production molds off this plug. This approach was deemed best and costed accordingly, and the overall program cost hence includes the tooling shop and overhead to produce these molds and also the hub and beam molds on-site. Mold repair is simplified, as is the ability to add capacity as program demands dictate. Overall cost is about equivalent to the cost of fabricating the molds offshore and transporting to local site, including all assembly. However the one-piece mold should prove to be significantly more durable and robust than a multi-piece mold.
A final and one-time to the program, plug cost of $286,000 is included in the Phase 1 costing, even though it is equally applicable across Phase 1 and 2. Mold costs of $380,000 are used, allowing a 20% cost escalation between the procurement of Phase 1 and Phase 2 molds.
Secondary tooling consists of bonding jigs, in which the hub and eight beams are pre-assembled, placed on the backside of the dish, and adhesively bonded in place. Due to the relatively small requirements for adhesive dispensing, a manual system is used that is coupled to a simple overhead laser projector to indicate adhesive placement positions. One adhesive system would be used for each two molds. Additional tooling is needed for lifting and transporting the completed parts to final trim, paint and inspection area. This was chosen as a mounting plate that will attach to the hub and a modified front-end loader. This approach is used for easy manipulation throughout the plant, as well as to address issues associated with installing a multiple-teed overhead gantry capable of getting into each of the 6 main bays. Finally, a special fixed dish-inversion jig was planned for securely rotating the final reflectors. Table 5-6 Tooling Cost Estimates, 130 m2 Tooling
Plug Cost Est.Shipping
Cost
On-siteSet-up Costs
Mold Cost Est.Shipping
Cost
On-site Set-upCosts
Tooling Supplier $226,000 $40,000 $20,000 $302,000 $40,000 $24,000
Internal N/A N/A N/A $380,000 Incl. Incl.
5.4 Capital Expenditures – Dish Production and Assembly Table 5-7 documents the major capital items required for dish surface fabrication and assembly, including facilities items specifically for the production.
28

Table 5-7 Major Capitalization and Mobilization Costs (USD).
Equipment ROM Costing – Phase 1
Start-upCosts*
ROM Costing – Phase 2
Start-upCosts*
Adhesive pumps 18,000 2,000 21,000 2,500Bagging systems 30,000 12,000 36,000 15,000Bonding fixtures 120,000 15,000 150,000 20,000Dish flip system 30,000 5,000 0 0Forklift 25,000 2,000 0 0Gantry 80,000 12,000 96,000 16,000HVAC, molding 100,000 20,000 120,000 24,000Kit templates 12,000 1,000 15,000 1,500Lift and transport 35,000 5,000 0 0Molds 760,000 122,500 912,000 147,000Paint shop 65,000 10,000 0 0Paint systems 8,000 1,000 28,000 1,500Paint/resin storage 100,000 12,000 0 0Plug 286,000 44,500 0 10,000Pumps, resin 45,000 5,000 108,000 10,000Pumps, vac – jigs 4,000 1,000 6,000 2,000Pumps, vac/compr. 25,000 5,000 12,000 3,000QC Equip. 100,000 12,000 15,000 2,000Scales/mixers/misc. 35,000 3,000 40,000 4,000Tables and misc. 15,000 0 18,000 0Vacuum Bags 34,000 3,000 204,000 20,000Waste Compactor 25,000 3,000 0 0Contingency 250,000 0 250,000
Sub-total 2,202,000 296,000 2,031,000 278,500Total $2,498,000 $2,309,500Units 620 3,000
*Start-up costs include supplies, basic spares, freight, taxes and insurance, structural installation, instrumentation and controls, plumbing, electrical, and direct contingency.
There are some specific items that bear further discussion in the above list that are not common to a production composite shop and are based on the unique requirements of the SKA reflectors and the location of potential manufacturing.
� A large cost is associated with the HVAC (heating, ventilation and air conditioning system), as this must operate as a fume extractor, work area cooler, and be explosion proof.
� Bonding fixtures will have their own independent vacuum clamping system to hold the beams and hub in place, and will key off features installed in the production molds for precision assembly and glue-line control.
� Molds will be heated and therefore have a large associated cost for electrical and instrumentation and controls.
29

� Resin pumps will be shared in the initial production, but need to have separate units for each molding station in the Phase 2.
� QC equipment includes laser tracking for tooling production and tool calibration.
� Vacuum bags will be reusable (300 part life for this size) latex rubber bags, and will have a separate bagging system fixture to place and remove bags with a vacuum retraction system.
� Contingency was estimated at 12%.
5.5 Reflector Surface and Assembly Costing Direct and indirect manufacturing costs are summarized in Table 5-8. The indirect costs are those associated with the portion of the facility and overhead used for these operations, to allow easy scale-up between Phase 1 and Phase 2. This is considered an independent facility and hence the costing includes facilities, taxes and insurance, and overheads on all associated categories (15%). Amortization costs are calculated as if all equipment and capitalization of Phase 1 is fully amortized in that production, and only the incremental capitalization is included in Phase 2. Although this leads to a possibly skewed higher cost in Phase 1 (especially as noted due to tool life, but also due to major hard equipment) it is appropriate due to the 4-year time frame of Phase 1, and the captive application. The amortization is taken as a simple straight line amortization based on the statements that SKA program funding would be such that commitment to tooling and facilitization and bulk raw materials purchases should be available up-front for the effort, and hence cost of money should be minimal. Inventory is at 90 days, based on shipping transit time, and assumes no inventory cost for completed reflectors only work/materials in progress. Table 5-8 Reflector Dish Surface Assembly Summary Cost of Fabrication (USD).
Category Phase 1 Phase 2 NotesShipping Materials In 1,500 1,800 10 reflectors/container Direct Materials 12,702 15,242 20% cost increase in 4 year Labour 1,600 1,920 $25/hr P1; $30/hr P2 Amortize Capital Equipment
4,030 770
Space – lease costing 1,505 535 $120/m^2 P1; $138/m^2 P2 Taxes and Insurance 375 135 25% lease cost Inventory 256 306 90 days Subtotal $21,968 $20,708Overhead 3,295 3,106 15% direct facility overhead
Total $25,263 $23,814
30

6 Beam Manufacturing
6.1 OverviewThe production of beams is controlled by two primary factors:
a) The need to have a minimum of 8 beams produced per reflector dish assembly.
b) The requirement for carbon fiber composites to meet the defined stiffness and strength demands.
These factors limit the choices of production methods as the physical number of beams to be produced (or delivered) has to match the reflector production rate (nominally one per day for Phase 1). Hence a production rate of 8 beams per day with an allowance for rework and repair needs to be accommodated. As noted earlier, the use of one shift is highly desirable due to manufacturing location options and potential cost and availability of skilled labour. This is especially true with the beams, as the labour skill sets are generally higher than for some other operations. In addition, accommodating the production of beams in a one-day shift then allows an overnight post-cure of the parts to be ready for bond and assembly operations the following morning, in the event of production at the same site as reflector production.
Several options for beam production were analyzed and down-selected to a preferred approach. The down-selection criteria included production rate compatibility; materials options; labour demands; process robustness and repeatability; waste factors; space and equipment requirements; tooling costs; environment and safety; and finally logistics. Mechanical and physical performance specifications were a fixed feature, as was capability to meet tolerances and bonding demands requirements – hence all processes considered were pre-filtered to meet these base functions.
Beam manufacturing was evaluated using lessons recently applied in the aerospace industry and other high-performance composites industries. The production was looked at from a perspective of out-sourcing in a separate country using existing facilities and capability, as well as production near the proposed operational sites for the SKA radio antenna. Table 6-1 provides the analysis and our interpretation of the baseline factors involved in this decision matrix. The conclusions are based on manufacturing cost criteria. Therefore, the final costing is based on materials and overhead costs and a formula that accounts for input of a variable labour rate and an associated variable for shipping and handling dependent on this labour rate. There is also a similarly associated inventory cost to account for in-transit time.
Assuming a manufacturing total cost of about $13,500 per 8 beams, manufactured on site in the same facility as the dish, the added shipping cost of offshore manufacturing is about $1,500. Any off-site beam manufacturing requires the delivery of one container per week to match reflector production rates for Phase 1. Given that the labour, overhead, and facilities costs are in total $3,500 of the above $13,500 then it is near-impossible to validate the costs of going off-shore into a low-labour cost market. With the envisioned (proven) manufacturing process we see only 32 labour hours direct manufacturing input per 8 beams.
31

Table 6-1 Estimation of some factors/costs associated with manufacturing locations (USD)
Option FacilityCost/8beams*
ShippingCost/8Beams
Risk Cost Inventorycosts
Logistics
On-SiteManufacturing
$850/m2 $250 Low tbd In-boundmaterials
Out-sourcing,local
$600/m2 $650** Low - Moderate
tbd Ordering
Out-sourcing - offshore
$400/m2 $1500*** High tbd Massive****
* Costs of construction per m^2 floor-space required, converted to amortized cost of facilities in overall costing. ** Assuming approximately 500 km shipping distance. *** 40 beams per container, plus associated in-bound materials costs.
**** One container delivered per week, assuming 1 reflector produced/day
Hence, from a risk-avoidance perspective, (especially given the need for one container to be delivered per week carrying 40 completed beams), the preferred manufacturing operation is to import the materials directly and manufacture in the same facility as the reflector. The underlying value proposition for this approach is that the shipping costs are applied to the most dense (tightly packed) materials format, raw fiber/resin, and under this scenario, one shipping container will hold a 12-week supply of raw materials for beams.
6.2 Process Selection The process selection analyzed three manufacturing approaches:
� Resin infusion into dry-fiber performs.
� Wet-preg forming.
� Semi-preg drape manufacturing.
The individual choices all have current applications in systems requiring the tolerances and precision of the reflector beam manufacturing, and all are considered well-developed manufacturing processes. In each of the above processes, there is a typical process development cycle required to achieve the specific part design, and to slightly “tweak” the basic process for production rate efficiency and performance. This will be a similar exercise for all approaches studied, and was not a reason to favour or reject any one process. As noted, all processes can also achieve the required baseline performance for stiffness, functionality, and tolerances.
32

6.2.1 Resin Infusion (Vacuum Assist Resin Transfer Molding – VARTM)
The beams produced for the CART MK2 10-m reflector were produced using this technique, hence there is a substantial body of knowledge and proven track-record for meeting performance requirements.
Positive aspects of resin infusion for beam manufacturing application are:
� Proven process, structures have been made and tested, and there is room for further materials optimization for producibility (lower viscosity resin, more permeable uni-directional and bi-axial fabrics, and fabrics specifically stitched at the required weights and widths for these beams).
� Very good properties are achieved, and can be almost as good as aerospace-quality pre-preg primary flight structures.
� Track records of the epoxies (wind-turbine industry, see references to Gamesa, Vestas, Seimens, and, GE/TPI) and ready availability of materials due to this market.
� Bulk materials at their lowest cost, especially the fiber materials, with potential to further reduce some costs by using vinylester resins as a replacement for epoxy resins.
� Low-cost tooling and materials handling, with no issues of materials aging/shelf-life (within reason).
� Predictable and well-understood cost models for production at very similar volumes.
Negative aspects of resin infusion for beam manufacturing application are:
� Quite slow process, relatively speaking.
� Production rate will demand multiple tools.
� Large number of tools and floor-space requirements result in significantly more labour-hours per part.
� Automation is relatively difficult for this process.
� Vinylester resins (lower cost material choice as compared to epoxies) are potentially more difficult to achieve consistency in tolerances over the manufacturing cycle, due to environmental and trace materials sensitivities.
� Waste streams are high, with some hazardous waste, and some containers that will have remaining wet resin components, etc.
� Process is a liquid resin process, requiring mixing, wet resin handling, hazardous materials shipping and handling, explosion-proof (vinylester) environment, and possible sensitivity reactions to resins (epoxies).
� Only limited process acceleration is possible with higher tool temperatures due to the nature of the VARTM resins.
33

6.2.2 Wet-Preg Manufacturing The term “wet-preg” refers to wet resin impregnation of fabrics prior to placement on the tool. This process is used relatively broadly in the light aircraft industry, wind-turbine industry, and high-performance boat building, and involves drawing the carbon fiber fabrics through a bath of wet-resin, typically epoxy. The fabrics are then rolled to controlled resin content, +/- 5% approximately, and then placed onto a mold. Peel ply, breather materials, and vacuum bags are placed and the part cured in an oven or by tool-side heating.
Positive aspects of wet-preg include:
� Materials wetting and placement are very rapid.
� Semi-automation of the fabric wet-out is possible.
� Good properties are achieved, the process has gained Federal Aviation Authority (FAA) certification for primary structure in the US and similar authorities in other countries.
� Resin systems are well developed and readily available.
� Applicable to an exceptionally wide range of fabrics, much more so than resin infusion.
� Predictable and highly repeatable process.
Negative aspects of wet-preg include:
� Open handling typical (but not necessary) of wet resins.
� Worker exposure is highest of processes considered and this includes exposure to the skin-allergy sensitizing properties of wet hardeners of epoxies.
� Not as amenable to using vinylesters due to the styrene exposure and environmental concerns (explosion proofing, etc, as above).
� Hazardous waste is definitely generated.
� High volume of waste typically generated.
� Facilities costs can be very high to protect workers.
� Production rates faster than vacuum infusion but not as fast as semi-preg options.
6.2.3 Semi-Preg Drape-Form Manufacturing The term “semi-preg” refers to a material that is partially combined fabric and resin in a controlled environment with the total amount of required resin placed onto (impregnated onto) one side only of the fabric. They are also called one-side-tacky pre-pregs (OST) and are a variant of the aerospace standard materials. The semi-preg is drawn off the impregnation machine and rolled up with release paper separation layers to keep from sticking to itself. It is cut and placed onto tools at the production
34

site and vacuum bags are placed over the charge and the part cured in an oven or by tool-side heating.
Positive aspects of semi-preg include:
� Controlled resin application by machine.
� No peel ply is required, nor breather cloth, as the dry-fiber portion of the charge is the vacuum path for evacuation of air.
� The semi-preg material is exceptionally easy to handle and place, automation is possible, and no issues exist with just basic (gloves) precautionary methods.
� Good properties are achieved, the process has gained Federal Aviation Authority (FAA) certification for primary structure in the US and similar authorities in other countries.
� Easy to specify fabric formats and resin application.
� Very rapid processing and tool productivity can be quite high.
� Possible to implement internal production of semi-preg for Phase 2 of SKA for very significant materials cost savings.
� Predictable and highly repeatable process.
� Clean process as almost no dry fiber handling and cutting is required.
� Lower skill-set required for repeatable production process than for either wet-preg or infusion for the beams.
Negative aspects of semi-preg include:
� High cost of semi-preg currently, and high cost of release films.
� Quantity of release film waste generated.
� Need to ship in refrigerated containers and to control temperature throughout the process cycle.
� Limited number of manufacturers of semi-preg.
� Materials will age (refers to initiation of curing) once they are warmed up and there is a limited shelf life. However, this should not be an issue with SKA production rates.
� Limited selection of resins and necessity to cure at higher temperatures than other process options.
� Higher temperature curing requires much costlier tool than wet-preg or VARTM.
35

Table 6-2 Summary Chart Evaluating the Three Major Beam Production Options
Attribute VARTM Wet-Preg Semi-Preg Production rate compatibility - + ++ - Hours per part per tool 5 4 2Materials options + ++ +Labour demands -- - +Process robustness and repeatability + + ++Waste factors -- -- +Space and equipment requirements -- - +Tooling costs + + -Environment and safety - -- +Logistics + + -
Summary - - +
Based on the input factors shown in Table 6-2, especially as related to tool productivity and the associated lower labour and facility costs, Semi-Preg is the favored approach to beam manufacturing.
Some of the direct cost numbers available indicate the materials cost of fabrication via VARTM would be about $11,000 versus the direct materials cost with Semi-Preg of about $8,750 – with the primary differences being in the disposable materials costs and the cost of resin that is absorbed into the grooves in VARTM. Some efficiencies may be gained in VARTM with use of a reusable vacuum bag as is planned for Semi-Preg processing, but the costs of peel ply, lines, resin in grooves, drum liners, and clean-up materials still add significantly to the cost per beam set.
The key decision point comes down to the labour cost and tool productivity. With the Semi-Preg approach, resins exist that can be rapidly cured at higher temperatures, and the limiting factor is the tool heating ramp-up rate of 5oC per minute. A feasible production cycle has the Semi-Preg part-to-part cycle time off each tool at about 2 hours. This rate requires a significantly larger investment in the tooling costs, however the amortization over the total number of parts reduces the per-part cost to around $30. Further gains in performance efficiency are seen with the rapid tool cycling and the materials handling benefits of Semi-Preg.
A detailed manufacturing flow sequence has been developed for the various options and after considering equipment and operator inputs, the following sequence in Table 6-3 has been established as the “starting point” for a lean production system – envisioning a 2 hour cycle time per mold and 8 beams produced per day (one shift).
36

Table 6-3 Manufacturing Flow Sequence for Semi-Preg Beam Manufacturing
Operation Task Time (min)
Lag Activity Motion
A Remove following day’s material from cold storage
5 Shift-end Freezer to racks
B Cut first kits for next morning
3 Shift-end Racks, along table, returning
C Retrieve core material kit for first parts next morning
2 Shift-end Into core room and return to kit/cutting room
Beginning of Production Day, 2-hour cycle times, 2 persons 1 Bag removed, part
demolded, mold cleaned 15 None Around tool, part onto
trim fixture 2 +/-45 onto transfer roll 3 None Kitting table 3 Transfer roll to tool, drape
+/-45 onto tool, repeat L/R 5 None Kitting area to tool
4 Transfer Uni to tool 3 None Kitting to tool 5 Core onto tool L/R 6 None Kitting area to tool
6 Transfer roll to tool, drape +/-45 onto tool, repeat L/R
5 None Kitting to tool
7 Lower bag onto tool 2 None At tool 8 Lower oven/shroud onto
tool2 None At tool
9 Vacuum check and seal 10 None At tool 10 Begin process timer 60 Cut next kit,
trim part, cycle start on mold 2
Kitting room, trim room, inspection and storage, move trimmed part to post-cure oven
11 Release bag, remove, part demolded, repeat cycle
9 None At tool, part onto trim fixture
120 min.
The above cycle requires the following equipment custom designed for the process and part.
� Cutting table with traveling semi-preg fabric rollout carriages, 2 rolls of +/-45 bias carbon.
� Cutting table to be equipped with hydraulic press-down bar and cross-cutting head (Eastman style rotary cutter) hard mounted. Integral vacuum (dust/fiber) in press-down bar activated on closure.
� Uni-directional semi-preg rollout fixtures (3 required) for tailored-width rolls of the L/R flanges and cap uni-directionals. Fixture capable of allowing multiple strips of uni-directional to be drawn out together and locked to table for cutting to length.
� Overhead, lengthwise horizontal roll-up spool for +/-45 bias plies, on a transfer carriage. Designed to allow fabric to roll-up, move over top of either mold on overhead gantry, and unroll from top of tool down either side. Primary drape forming tool.
37
� Long teflon (ptfe) plastic transfer spatulas for the flange and cap unidirectional semi-pregs.
� Two mold system with separate heat, cooling, vacuum, and controller. Molds to have combined heating/cooling fluid lines installed into carbon composite tool, insulated on inside, using closed loop oil heat transfer fluid.
� Controller with integrated one button process cycle.
� Drop-down overhead oven with heated air circulation for bag-side of mold, allowing the encapsulating and controlling from both tool-face and bag-side for optimized process window.
� Re-usable vacuum bags on frames capable of being lifted overhead and stored above tools (mounted in a vacuum frame to hold shape, provide stability/support).
� Gripping fixture for part removal and transfer via overhead crane, or swing-arm, onto indexed trim jig.
� Trim jig designed for manual water-jet trimming via track mounted water-jet head, integrated vacuum hold-down and locating features.
� Air handling system and backing-paper waste collector.
� Dedicated heat pump with positive air flow to outside building and filtered intakes.
6.3 Beam Production Requirements
6.3.1 Overall Beam Production Requirements A summary of production requirements is shown in Table 6-4. Both Phase 1 and Phase 2 have a comfortable margin of production with excess annual capacity of about 25%, based on the maximum production rate. This was necessary due to the incremental nature of the production coupled with the uncertainty in process cycle times. It is envisioned that in Phase 1 the optimum production cycle times will be determined and that cost optimization would be in place for the planning and implementation in Phase 2. An alternative use for the excess capacity would be to accelerate beam production during Phase 1 and inventory beams, and have the workers available for other operations within the factory.
38

Table 6-4 Beam Production Overall Requirements
Phase 1 Phase 2 Reflectors Required, SKA Total 620 3,000Beams Required, total SKA program 4,960 24,000Annual Beam Production (max req’d) 1,440 6,400Number Moulds in production 2 4Number Shifts 1 2Personnel/shift 3 5Capital Required, (Phase 2 is incremental) $349,500 $593,500Building Area (m2) 630 874Building Dimensions 35 x 18 m 38 x 23 m Total mold requirement for program 5+ 24+
6.3.2 Facilities The space required for beam manufacturing does not include materials receiving, as that is part of the overall manufacturing for the reflector dishes, but is inclusive of all other operations. Inventory of finished parts is also not included, however, the work flow plan calls for work-in-progress (WIP) buffering to occur in the ovens during post-cure and hence can accommodate 2 reflectors worth of beams (16) in Phase 1 and 4 reflectors worth of beams (32) in Phase 2. Process calls for the beams to move from this station to the bonding jigs directly and onto full reflector assembly. It is only in the case of interruption in the dish manufacturing schedule, or bonding and assembly schedule, that the beams would require additional inventory storage. In such a case it is envisioned that a temporary shelter would suffice so long as the bonding surfaces can be protected.
The beam manufacturing facility is attached directly to the reflector manufacturing and assembly plant, and would be divided into 6 major rooms, consisting of the following:
� Freezer.
� Core Kit/storage.
� Fabric Kit/ Transfer.
� Mold and Vacuum Bag Build.
� Trim and Cleaning.
� Post-cure and Transfer Out.
The beam manufacturing area is costed as an independent facility, as the utilities and climate control required are somewhat different than for the rest of manufacturing operations, and also because doing it this way allows the scaling from Phase 1 to Phase 2 to be relatively easy. Phase 2 space requirements include adding another 244 m2 to the existing Phase 1 facility, and re-configuring the space with expanded rooms serving the same functions as above. It is envisioned that planning for the space development in Phase 1 will allow for easy reconfiguration of utilities, and adding vertical space and floor space for both the freezer and the ovens will be included.
39

6.3.3 Major Process Equipment Major direct process equipment requirements and costs for the beam production are shown in Table 6-5.Table 6-5 Major Capital Expenditures for Phase 1 and Phase 2 of Beam Production (USD).
Equipment ROM Costing – Phase 1 ROM Costing – Phase 2 Freezer 25,000 100,000Cutting Room 25,000 100,000 Core Kitting Room 6,000 15,000Transfer Jig for fabrics 14,000 30,000 Drop-down ovens 30,000 150,000 Vacuum Bags 58,500 325,000 Control Panels 35,000 55,000 Air system 40,000 40,000 Post-cure oven 15,000 15,000 Waste system 8,000 8,000 Racks and tools 12,000 24,000 Trim jigs 6,000 6,000 Water-jet trimmer 55,000 55,000 Bag and tool build equipment and area (shared oven with post-cure)
20,000 20,000
Total $349,500 $943,000 Incremental Cost – Phase 2 $593,500
6.3.4 TrimmingThree approaches were examined for the beam trimming, and selection was based on manufacturing optimization and simplicity of operations and maintenance. The three approaches were:
� Manual trimming with diamond cutters on air tools.
� Robotic trimming with either diamond/air tools or waterjet cutter.
� Traveling carriage trimmer with waterjet cutting.
Manual trimming was not deemed acceptable for work environment conditions as well as cost of dedicated labour for that cell, as this job is typically the highest turnover position in any composite industry. Robotic trimming was a good option, but in examining the two aspects of the trim operation a) that it is a relatively simple vertical to surface trim operation, and b) that the component is very long and the robot would have to be on a gantry to accommodate the reach, leads to selection of option 3, a traveling carriage running around the perimeter of the component indexed to the jig. The robotic choice also suffers from added complexity of maintenance versus a simple carriage, and the work-cell is relatively large and complex to support the gantry axes and robot.
A partially automated work cell is envisioned for trimming and cutting the beam flanges. This cell would use a holding jig for the beam, and a water-jet head mounted on a traveling carriage. A direct-drive DC motor driven carriage on cogs would transit the part and the cutting done with water-only, eliminating the need for abrasive-based water-
40

jet and added waste and system costs. The laminate thickness should support a simple 50,000 psi water-jet. Beam trim is estimated to take about 3 minutes per beam; hence the one cell can accommodate all production requirements of Phase 1 and 2.
6.3.5 Post-Curing The rapid production rates off the beam tools will result in beams that have only around 90% degree of resin cure whilst on the tool. In order to complete the cure cycle, a free-standing post-cure is common and will be used. This post-cure oven will be located adjacent to the beam trimming station, and beams will be shuttled directly into the oven after trim. Overnight batch post-cure is envisioned, and the ovens need only have a simple ramp and soak set-point controller. Waste heat from these ovens can be used very easily to heat the mold oil circulation hot-side fluid and reduce overall energy costs in the facility. Under the higher production rate requirement of Phase 2, these ovens will be in semi-continuous operation, and will serve to buffer inventory flow over to the final assembly operation.
6.3.6 Shipping and Logistics The approach of using Semi-Preg manufacturing allows a relatively simple logistics and risk approach. One refrigerated ocean freight container would be required every 12 weeks during Phase 1 and one container every 3 weeks during Phase 2. In Phase 1, in the event of a missing shipment or loss for some reason (loss of refrigerant en-route through tropics for instance), air shipments can be relied upon for interim manufacturing and would be covered by insurance. This is not feasible during Phase 2, and hence freezer storage capacity has been increased substantially in the costing of Phase 2 to allow for inventory materials for risk reduction. Facilities and internal storage are sized for this inventory demand, and overflow is typically accommodated in local cold storage warehouses. A back-up heat-pump system is provided for in the overall costing, to keep the materials cool and extend their storage life through the production cycle should serious issues develop with the freezer for example.
Calculation of the incoming and storage materials was based on the following information:
� Each pallet is capable of holding 9 standard boxes in a 4’ x 4’ x 4’ cube.
� Packaging allows for 720 m of bias semi-preg per pallet; 1080 m of wide uni-directional semi-preg per pallet; or 2160 m of narrow uni-directional semi-preg per pallet.
� Each shipping container will therefore hold the equivalent (beam only) materials of 60 finished reflectors (480 beams worth) including semi-preg and core.
� Shipping costs were estimated at $15,000/refrigerated container, including inland freight, and was based on US West Coast to Perth and on to Geraldton by truck.Freight rates have been in considerable state of fluctuation recently, and estimates were posted high to account for the fuel cost uncertainties.
41

Using the scenario whereby the semi-preg materials for Phase 2 are manufactured on-site, and the carbon is shipped in dry and resin shipped as separate resin/hardener, then significant risk is averted in the production logistics as follows:
� A freezer failure will not impact production requirements.
� Freezer storage can be dedicated to resin holding and weekly production needs, and resin/hardener can be mixed as required prior to production.
� Multiple and backup vendors will be available over the course of the production.
� Shipping costs are minimized as packaging of the materials is also improved (about 40% increase in packing density is available with dry fiber over semi-preg as backing paper and release films are eliminated).
� Waste streams are significantly reduced as the backing paper and release films may be made reusable on-site.
6.3.7 Waste Disposal Manufacturing of the beams produces two major waste streams, the backing films and papers of the semi-preg, and the trim cuts off each beam. The trim cuts are required no matter what system is used and is a cost of doing business. However, with the semi-preg approach, a very major (volume and mass) waste stream is generated:
� Phase 1 waste materials from the semi-preg backing film and release paper amounts to 36 kg per day.
� Phase 2 waste materials from the semi-preg backing film and release paper amounts to 144 kg per day.
The waste is of a very high volume, and therefore compaction is required at additional expense. However, it is non-hazardous and landfill acceptable.
It is recommended that a significant portion of this waste stream can be eliminated by manufacturing the semi-preg requirements on site and just-in-time, with the considerable added benefits of not handling the waste, lower materials costs, and better production logistics. This should be explored at a minimum for Phase 2 and could be implemented into the facility during the latter parts of Phase 1.
6.4 Beam Costing Following baseline costs in Table 6-6 are derived using the numbers provided for a CART 12-meter design for 8 beams. The major part cost difference comes in the semi-preg costs and the use of reusable vacuum bag media and no peel, breather, resin distribution, or other infusion related materials. In order to achieve this cost, the facility is custom designed to manufacture the beams, and is considered a stand-alone facility internal to the reflector dish manufacturing operation. Hence all equipment, space, taxes, insurance, and overheads are calculated into the cost, and this would be considered an internal cost transfer between divisions, exclusive only of 7% G&A and profit margins. G&A and profit costs would be added at the time of sales of the completed SKA antenna. Overhead is included here as this is the direct overhead of running this manufacturing facility only,
42

and not the complete overhead of the antenna supplier company. Similarly no R&D or recurring product investment costs are included herein.
Data on all aspects of the above manufacturing scenario is current for July, 2009, and does not reflect any anticipated reductions in prices for carbon fiber based on the present over-supply. The current market trend is still towards very large mark-ups on the pre-preg converters. Pricing was therefore obtained through smaller toll manufacturers. A major assumption is that the total cost of Phase 1 is amortized within that production cycle, including all tooling, jigs, and fixtures, and specialty equipment. The Phase 2 costs are therefore only amortized based on incremental capitalization costing. Tooling (primary drape form molds) costs are not significantly impacted in this scenario, as the tools are considered consumable within the program. Table 6-6 Summary Costing of Production of 8 Carbon Composite Beams (USD).
Cost/reflector $ per 8 beam set – Phase 1
$ per 8 beam set – Phase 2
Cost using internally fabricated semi-preg
Shipping Materials In 250 288 240Semi-preg and Core 8,742 10,054 6,955Labour 1,120 1,288 1,288Amortize Tooling 214 247 247Amortize Equipment/Jigs 564 217 217Space on lease 488 168 168Taxes and Insurance 122 42 42Inventory 332 239 166Subtotal 11,833 12,541 9,323Overhead 1,775 1,881 1,398
Total = $13,607 $14,422 $10,721
One scenario is presented to show capability to optimize costs based on the program being a captive consumer of materials just for the SKA production. The last column above captures the materials cost reduction achievable through on-site manufacturing of the semi-preg materials for beam production. The production materials input costs, taking into account the set-up, space, facility, personnel, and equipment requirements for manufacturing equivalent quality semi-pregs, is reduced from $10,054 to $6,955, and reflects a reduction in composite material costs by 35% (core costing remaining equivalent.) Over the life of the SKA program, this amounts to a net cost savings of $11.1 million.
Another reason for investigating this approach is the control over incoming materials deliveries, as the carbon fiber materials can be sourced from possibly 10 additional vendors, thereby having potential further cost reduction to the program. More importantly, the carbon fiber materials are now being shipped in dry form, and the resin is shipped as unmixed resin/hardener.
Beyond the previous discussions on materials, shipping, and labour, the methods of calculation and assumptions are included in Table 6-7.
43

Table 6-7 Summary of Baseline Assumptions for Costing
Item Rate Escalation, annual % Labour $35/hour 3Overhead 15% noneFacilities $120/m^2 4Taxes/Insurance $30/m^2 (25% lease costs) 4Inventory – Phase 1 135 days noneInventory – Phase 2 97 days noneCost of money 8% noneTool life 1000 parts Reusable vacuum bag life 240 parts Waste disposal $250/tonne noneAllowance for bad product NoneRework rate Included in labour, about
5% anticipated Painting and finishing Included in Assembly
6.5 Summary – Beams The high production rates required of the beams and the capability to design the beams to optimize the semi-preg drape forming process were key factors in choosing this as the preferred approach. The semi-preg manufacturing also achieves a minimum of waste and significantly reduces the wet resin handling associated with this number of parts. Materials’ shipping is slightly higher, as is direct raw materials costs, but these are counteracted with the decrease in costs of consumables. With labour costs associated with placing and removing and discarding consumables included, there becomes a significant cost advantage for semi-preg over infusion. Faster production rates allow fewer tools, less labour costs, and is more amenable to semi-automation and achieving high quality.
An evaluation of the costs of local site manufacturing versus external manufacturing was performed, and the hands-down winner is on-site manufacturing due to the dominance of shipping costs. Beam shipping is inherently non-competitive due to the wasted volume, and the logistics issues make the risk exceptionally high, as there is one container delivery per week required for off-site manufacturing. Risks associated with the materials having a shelf life can be mitigated with redundant utilities and HVAC systems, and the compact form of the raw material allows for air shipment under extreme situations. Finally, the cleanliness of the semi-preg approach and worker concerns are confirming factors in the process selection, as this is the most environmentally sound approach given the requirements.
Major cost reductions were identified in the use of in-house manufactured semi-preg, and this should certainly be explored for Phase 2 if not before. Inventory costs are negligible for the beams, but do play a role in the incoming raw materials due to long shipping times. This is a further reason for investigating lowering the input cost of raw materials. Supply side concerns do exist in the use of semi-preg from available commercial sources, as these suppliers are few in number, have large competing markets in aerospace and
44
eventually wind power, and large markups. Little negotiation leverage will be available in contract negotiations and program materials costs reflect this between Phase 1 and 2.
It should be noted that carbon fiber/thermoplastic composites were briefly looked at for the beams, but rejected for reasons of volume supply of raw materials, limited available formats, and high costs of the partially consolidated materials. The higher processing temperatures also bring some inherent limitations on tooling and equipment. Carbon/thermoplastics based on PET would have been applicable for the manufacture and use in this application (carbon/polypropylene was not considered due to possible creep issues at the operational temperatures and the softer matrix having possible susceptibility to wildlife.) The carbon/PET systems are not sufficiently mature given the large thin web and cored approach to design, and the heating systems also become very dominant in energy costs for production.
45

7 Hub Manufacturing
7.1 OverviewHub manufacturing uses resin infusion technology. This was selected based on the quantities of carbon materials and the need to have minimum cost inputs to this component. It is possible for this application to use semi-preg manufacturing similar to the beams, but only in the situation where semi-preg is internally produced and the costs can be controlled.
The production requirement is one hub per day during Phase 1 and up to 4 per day for Phase 2. This is easily accomplished with one mold in Phase 1 and 4 molds in Phase 2. The resin selected is a vinylester resin, primarily for reasons of cost, but also for the capability to produce 4 parts per day in Phase 2 in one shift, and move those into post-curing and bonding preparation with labour overflow from the dish molding operations. Hence the reason for the minimal operator requirement noted in Table 7-1.Table 7-1 Hub Production Overall Requirements
Phase 1 Phase 2 Hubs Required, SKA Total 620 3,000Number Moulds in production 1 4Number Shifts 1 1Personnel/shift 0.25 1Capital Required, (Phase 2 is incremental) $186,500 $208,400Building Area (m2) 144 144Total mold requirement for program 1 4
7.2 Hub Manufacturing Hub manufacturing will be performed with resin infusion under a reusable vacuum bag, identical to the process for reflector surface manufacturing. As such, no detailed process description or flow sequence is required. The hub dry materials will take approximately 45 minutes to completely lay-up and prepare the mold for injection, an approximate 45 minute injection time is envisioned, with the part left in the tool for cure and later moved to the beam curing ovens for post-cure on an overnight cycle. Trimming is done in the same system as the beam trim operations, using a simple perimeter jig guiding the water-jet cutting head. The beam costing included the facilities and equipment.
As with the beam manufacturing, the process is done over a male tool, so that the hub has finished surfaces that are tooled and maintain their precision. One key added feature, is the hub must have a machined, flat indexed surface to mate to the antenna mount. Hence the hub machining operation also includes a surface grind of the mounting points (sometimes called spot-facing) that is done during the trimming stage and the hub fixture is designed for the appropriate degree of accuracy required, typically +/-0.05 mm.
Hub production has no planned capacity margin, under the assumption that as a one shift operation, it is always feasible to add production in the second shift. The major risk factor is the potential loss of a mold in Phase 1, and production hold-up until another is
46

built. It should take approximately 7 days to complete a new production hub mold internally. The flow through effect however, is that the bonding and assembly cannot occur on the two production reflector surface molds, so it is not just a matter of inventory management, but of a major production halt and idling downstream operations. Two approaches to solve this would be to inventory a two-week supply of hubs (preferred) or to build another mold during Phase 1 and have it idle and waiting for Phase 2 unless needed beforehand.
7.2.1 Major Capital Equipment Major capital equipment items and their associated cost estimates are shown in Table 7-2.Several of the items are costed in full in Phase 1 and carried forward into Phase 2 as their useful life is adequate for both production scenarios. For these pieces of equipment, ongoing service and maintenance is included in the overhead costs. Table 7-2 Major Capital Expenditures for Phase 1 and Phase 2 of Hub Production (USD).
Equipment ROM Costing – Phase 1 ROM Costing – Phase 2 Resin injection machine 32,500 0Fabric cutting station 15,000 0Core kitting room 3,000 0Transfer jig for fabrics 3,000 0Drop-down ovens 6,000 21,600 Vacuum bags 4,000 22,600 Control panels 12,000 43,200 Air system 16,000 0Molds (and plug – Phase 1) 59,000 121,000Trim jigs, and face machining 36,000 0
Total $186,500 $208,400
7.3 Hub Costing Hub costing as shown in Table 7-3 is also done within a stand-alone facility, similar to the beams, and no efforts are made to recover/share capital costs with the beam oven, trim station, and materials storage and handling areas. Labour is assumed as overflow from the beam and reflector manufacturing in Phase 1, and is fully costed in Phase 2. Table 7-3 Summary Costing for Production of Hubs (USD).
Cost/hub Phase 1 Phase 2 Shipping Materials In 208 250Fabric and resin 4,215 5,058Core 260 312Consumables 380 456Labour 0 210Amortize Tooling, Equipment/Jigs 301 69Space on lease 111 26Taxes and Insurance 28 7Inventory 97 116Subtotal 5,600 6,504Overhead 840 976
Total = $6,440 $7,480
47

An option would be to move to semi-preg, should internally manufactured product become available. With the higher materials cost of the semi-preg from vendors and the relative material intensity of the hub, it does not make economic sense to use this approach unless semi-preg fabrication is set-up for the beams. In this situation, the choice for semi-preg is really one of materials consolidation and lower consumables trading off against a higher resin cost. It should be noted that the resin for the hub would be the same as the vinylester resin for the reflector dish surface.
48
49
8 Summary and Conclusions The feasibility of manufacturing composite parabolic reflectors for the SKA has been established under the DRAO CART MK1 and MK2 programs. The valuable lessons learned from those programs and the further analysis of the designs for a larger size was examined with regard to costing for a full-scale manufacturing operation for SKA Phase 1 and SKA Phase 2. Using optimum manufacturing techniques the cost of constructing composite reflectors is just under $400USD/m2, with little risk to the program. The manufacturing is required to be on or near to the deployment site, and this poses challenges in personnel and location, however, it optimizes manufacturing costs and saves very significantly on transportation costs.
No show-stoppers were identified, and Phase 2 cost savings through processing of raw materials on-site was identified as one key opportunity. In all aspects of the operation, worker comfort and environmental factors were considered high priority and time, labour, and equipment were all costed with these in mind. Pay rates were set for skilled personnel in developed countries, and considered the factors associated with this being an evaluation of a limited production operation (8 years total duration). Further refinement of the cost numbers should be performed with “detailed engineering and design” level effort, involving actual sizing and selection of equipment, location, on-site evaluation of labour, and local conditions and construction costs.
As the CART design evolves further potential for cost reduction through optimized design will be realized. In considering 15-m diameter reflectors there is a possibility of further cost savings as the larger dish allows the use of heavier fabrics which can be less expensive. This is due to having a similar labour component in the manufacture of heavy and light fabrics.