table of contents ii. market research and...
TRANSCRIPT

2 (S-LAB) | MIT SLOAN| PATAGONIA TABLE OF CONTENTS
I. PROJECT OVERVIEW & METHODOLOGY
III. USER PERSONAS
IV. TOOL WIREFRAME: WAGELY
V. RECOMMENDATIONS & NEXT STEPS
II. MARKET RESEARCH AND ANALYSISTABLE OF CONTENTS

3 (S-LAB) | MIT SLOAN| PATAGONIA TABLE OF CONTENTS
I. PROJECT OVERVIEW & METHODOLOGY
III. USER PERSONAS
IV. TOOL WIREFRAME: WAGELY
V. RECOMMENDATIONS & NEXT STEPS
II. MARKET RESEARCH AND ANALYSIS
S-LAB TeamCompany OverviewProblem Statement
d. Living Wage DefinitionBusiness Case
f. Overview of the FLA ToolProject Methodology
TABLE OF CONTENTS

4 (S-LAB) | MIT SLOAN| PATAGONIA S-LAB TEAM
THE S-LAB TEAM
TIFFANY FERGUSONMCP 2018
JORDAN BAUCUMEMBA 2017
MICHAEL EASTONMBA 2018
PAMELLA ROQUEMBA 2018

5 (S-LAB) | MIT SLOAN| PATAGONIA PROBLEM STATEMENT
COMPANY OVERVIEW
Founded in 1973, Patagonia is an outdoor and adventure apparel company widely known for its environmental activism, high quality gear, and leading edge commitment to high road employer practices. The company mission statement, “build the best product, cause no unnecessary harm, use business to inspire and implement solutions to the environmental crisis” illustrates the company’s proactive orientation toward applying the business tools at their disposal to some of the toughest environmental challenges of our time. The company’s sustainability efforts have grown to include minimizing their own ecological footprint, to industry-wide mobilization of corporate giving to environmental groups, and the improvement of labor standards in the apparel manufacturing industry.

6 (S-LAB) | MIT SLOAN| PATAGONIA PROBLEM STATEMENT
Patagonia committed to the Fair Labor Association’s (FLA) fair compensation project to pilot and implement living wage models in their finished-goods supply chain. Patagonia is interested in reliable aggregate data about what workers are paid, the value of benefits provided to them by suppliers, and the supplemental overtime hours worked to meet a basic standard of living, to understand how far each of their suppliers is from a living wage target.
PROBLEM STATEMENT
7 (S-LAB) | MIT SLOAN| PATAGONIA
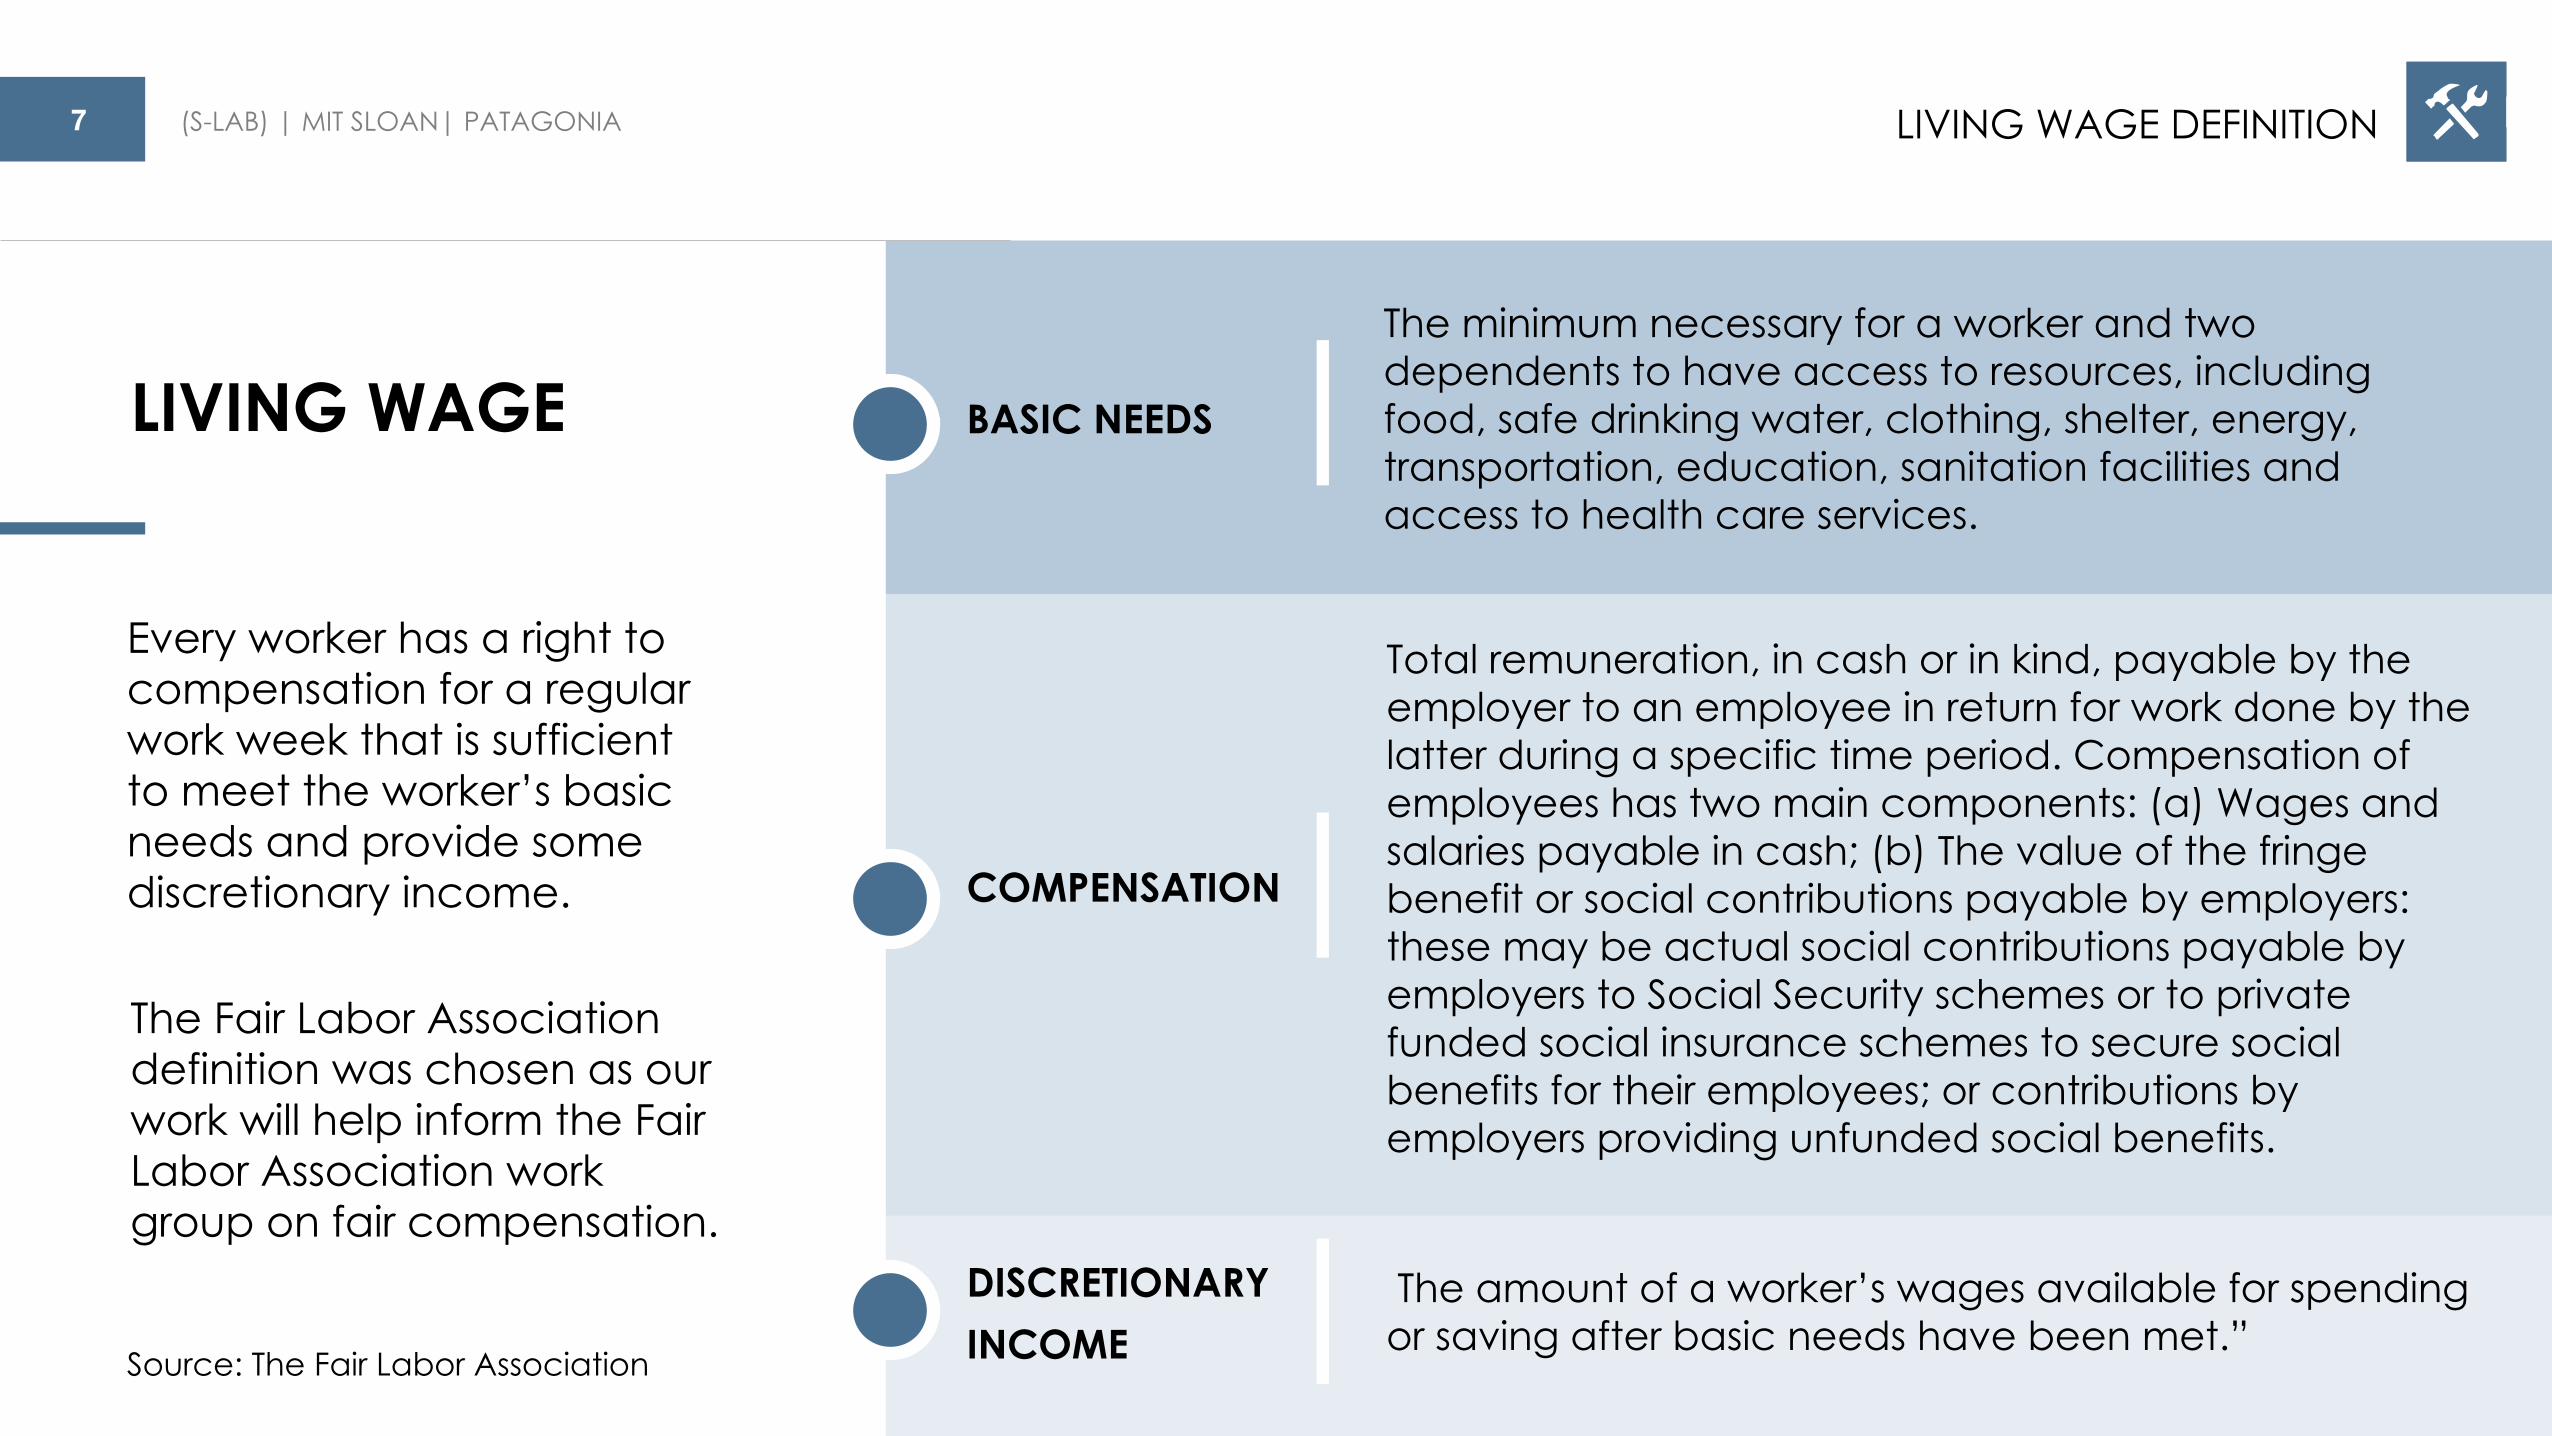
The minimum necessary for a worker and two dependents to have access to resources, including food, safe drinking water, clothing, shelter, energy, transportation, education, sanitation facilities and access to health care services.
LIVING WAGE DEFINITION
COMPENSATION
DISCRETIONARY INCOME
BASIC NEEDS
Total remuneration, in cash or in kind, payable by the employer to an employee in return for work done by the latter during a specific time period. Compensation of employees has two main components: (a) Wages and salaries payable in cash; (b) The value of the fringe benefit or social contributions payable by employers: these may be actual social contributions payable by employers to Social Security schemes or to private funded social insurance schemes to secure social benefits for their employees; or contributions by employers providing unfunded social benefits.
The amount of a worker’s wages available for spending or saving after basic needs have been met.”
LIVING WAGE
Every worker has a right to compensation for a regular work week that is sufficient to meet the worker’s basic needs and provide some discretionary income.
The Fair Labor Association definition was chosen as our work will help inform the Fair Labor Association work group on fair compensation.
Source: The Fair Labor Association

8 (S-LAB) | MIT SLOAN| PATAGONIA BUSINESS CASE
Patagonia has made strides to align business operations with ecologically and socially sustainable practices. By turning attention to fair compensation, Patagonia is able to take yet another step toward fully realizing their mission to use business to inspire solutions to global challenges. Patagonia sees the industry’s race to the bottom as unsustainable and sees great value in taking a strategic and thoughtful approach to reimagining socially sustainable living wage sourcing.
BUSINESS CASE

9 (S-LAB) | MIT SLOAN| PATAGONIA
● Complex: The design of the tool required detailed instructions which were difficult to understand for employees.
● Time Consuming: the tool took factories days to complete instead of the advertized 4 hours.
● Manual Data Entry: the factories were required to input the data manually into the FLA tool.
● Hard to Aggregate: The finalized excel file sent by the factory required data manipulation in order to aggregate across the various factories
● In Kind Benefits: Factories struggled to understand in-kind benefits which led to additional confusion.
CHALLENGES WITH THE FLA TOOL
CHALLENGES WITH THE FLA TOOL
STRENGTHS OF THE FLA TOOL
● Comprehensive Data Collection: The tool enabled consistency and analytical rigor across all countries.
● Standard Software: Leverages standardized and accessible Microsoft Office software.
● Open Source: Tool is editable which allows factories to customize to their needs.
● Test Pilot: Provided a framework and sample data on which to iterate future tools.
● Daylighted the challenge: The complexity of collecting information and the need to approach each country and factory on a case by case basis is now clear.

10 (S-LAB) | MIT SLOAN| PATAGONIA PROJECT METHODOLOGY
During stakeholder interviews, we focused on gathering insights around three primary objectives:
• Strategic Research & Analysis: Understand big-picture strategic objectives from the various stakeholders
• Existing FLA Tool Research & Analysis: Understand the existing FLA tool from a technical perspective
• User/Market Research & Analysis: Understand the operating conditions for supply chain actors
SLAB PROJECT SCOPE & METHODOLOGY

11 (S-LAB) | MIT SLOAN| PATAGONIA TABLE OF CONTENTS
I. PROJECT OVERVIEW & METHODOLOGY
III. USER PERSONAS
IV. TOOL WIREFRAME: WAGELY
V. RECOMMENDATIONS & NEXT STEPS
II. MARKET RESEARCH AND ANALYSIS
a. Resource & Time ConstraintsLiving Wage Complexity
c. Transparencyd. Total Remuneration
FLA Data DashboardFLA Data Insights
TABLE OF CONTENTS
12 (S-LAB) | MIT SLOAN| PATAGONIA MARKET RESEARCH
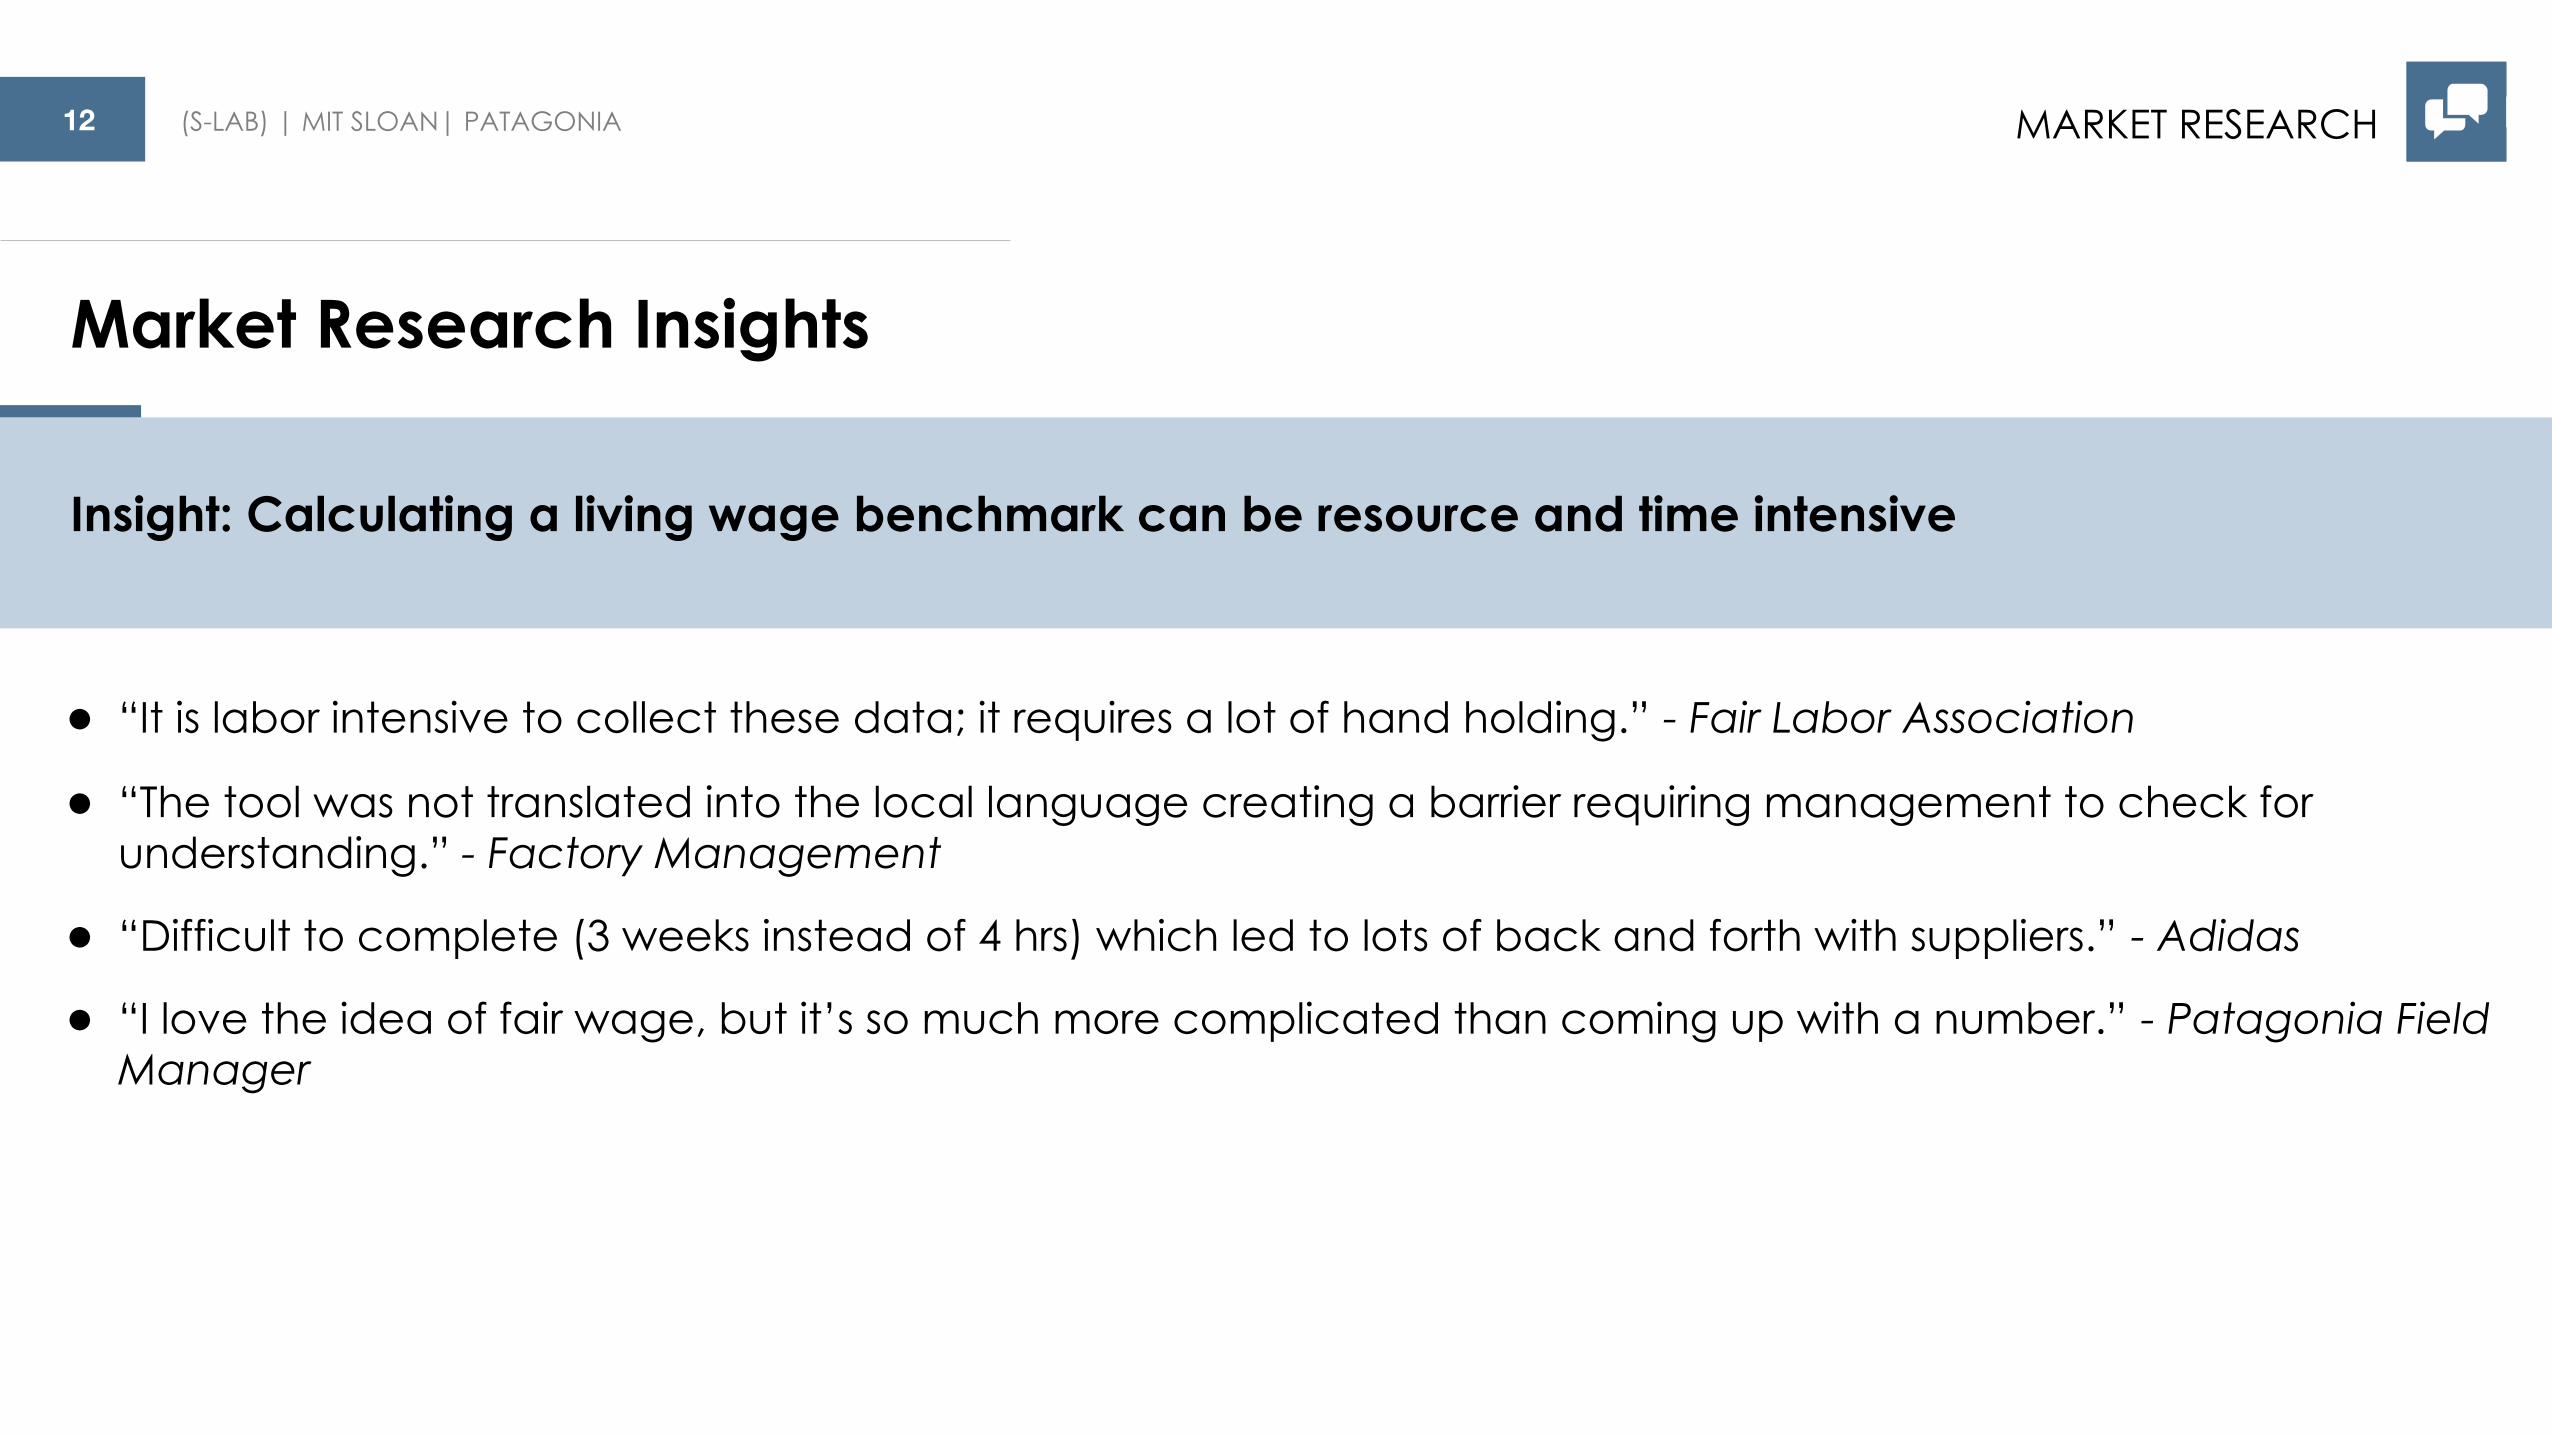
Insight: Calculating a living wage benchmark can be resource and time intensive
● “It is labor intensive to collect these data; it requires a lot of hand holding.” - Fair Labor Association
● “The tool was not translated into the local language creating a barrier requiring management to check for understanding.” - Factory Management
● “Difficult to complete (3 weeks instead of 4 hrs) which led to lots of back and forth with suppliers.” - Adidas
● “I love the idea of fair wage, but it’s so much more complicated than coming up with a number.” - Patagonia Field Manager
Market Research Insights

13 (S-LAB) | MIT SLOAN| PATAGONIA MARKET RESEARCH
● “Payroll is a living document that is constantly changing, the FLA tool is a snapshot in time.” - Adidas
● “The ability to consolidate [data] depends on the sophistication of the supplier. Most factories don’t have the resources to consolidate under single systems.” - Patagonia Field Manager
● “The data itself tells a story, but there’s a larger narrative about what the story is about, what it implies for the retailer or brand and the steps required for companies to close.” - Fair Labor Association
● In response to a request for wage information “sorry for we can not provide excel format for your ref, only PDF format available.” - Factory Manager
Insight: There are numerous ways to conduct living wage calculations. While the methods are typically similar, the complexity of the various operating environments vary
Market Research Insights

14 (S-LAB) | MIT SLOAN| PATAGONIA MARKET RESEARCH
● “In China, we have a lot of transparency issues. Sometimes they do cheat because they want to pass an audit. If we go collect that info, they will give us the same info they use to pass the audit.” - Patagonia Field Manager
● “If you could make the data submission anonymous, companies would be more likely to submit real data.” -Patagonia Field Manager
Insight: Transparency remains a key issue at the individual factory level and current industry tools (like audits) are not enough to address compensation strategies
Market Research Insights
15 (S-LAB) | MIT SLOAN| PATAGONIA MARKET RESEARCH
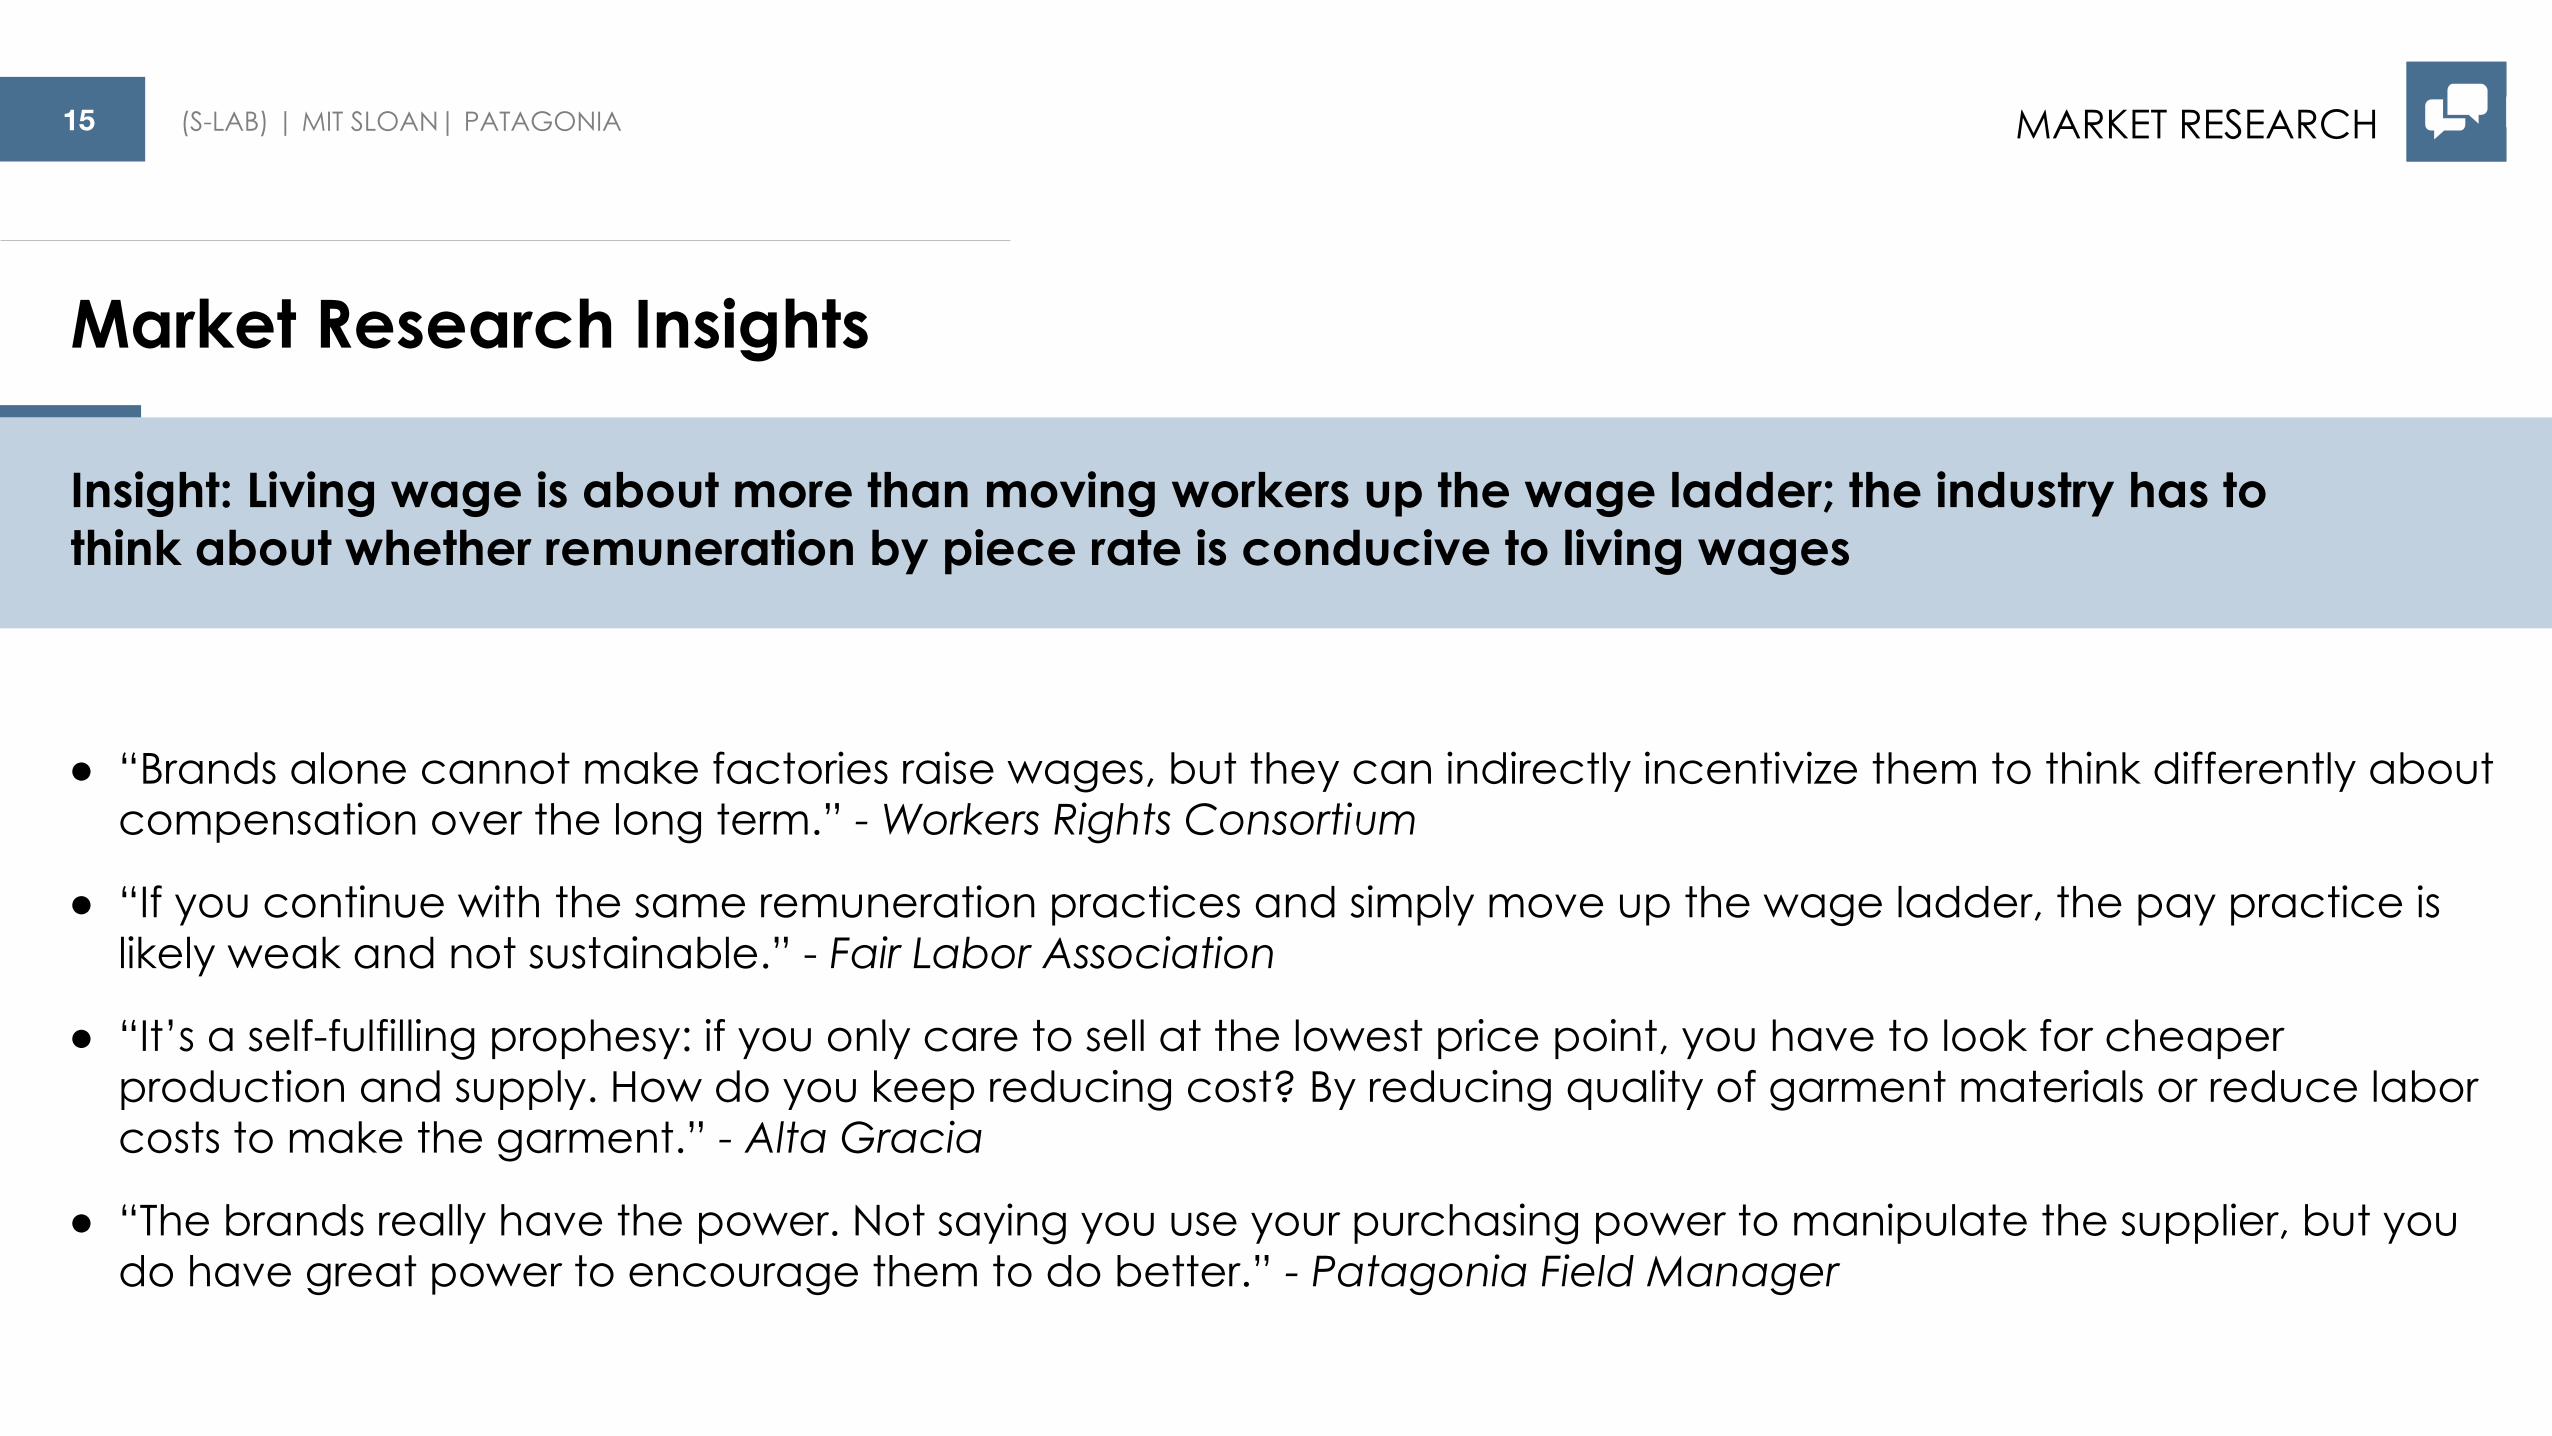
● “Brands alone cannot make factories raise wages, but they can indirectly incentivize them to think differently about compensation over the long term.” - Workers Rights Consortium
● “If you continue with the same remuneration practices and simply move up the wage ladder, the pay practice is likely weak and not sustainable.” - Fair Labor Association
● “It’s a self-fulfilling prophesy: if you only care to sell at the lowest price point, you have to look for cheaper production and supply. How do you keep reducing cost? By reducing quality of garment materials or reduce labor costs to make the garment.” - Alta Gracia
● “The brands really have the power. Not saying you use your purchasing power to manipulate the supplier, but you do have great power to encourage them to do better.” - Patagonia Field Manager
Insight: Living wage is about more than moving workers up the wage ladder; the industry has to think about whether remuneration by piece rate is conducive to living wages
Market Research Insights
16 (S-LAB) | MIT SLOAN| PATAGONIA TABLEAU VISUALIZATION
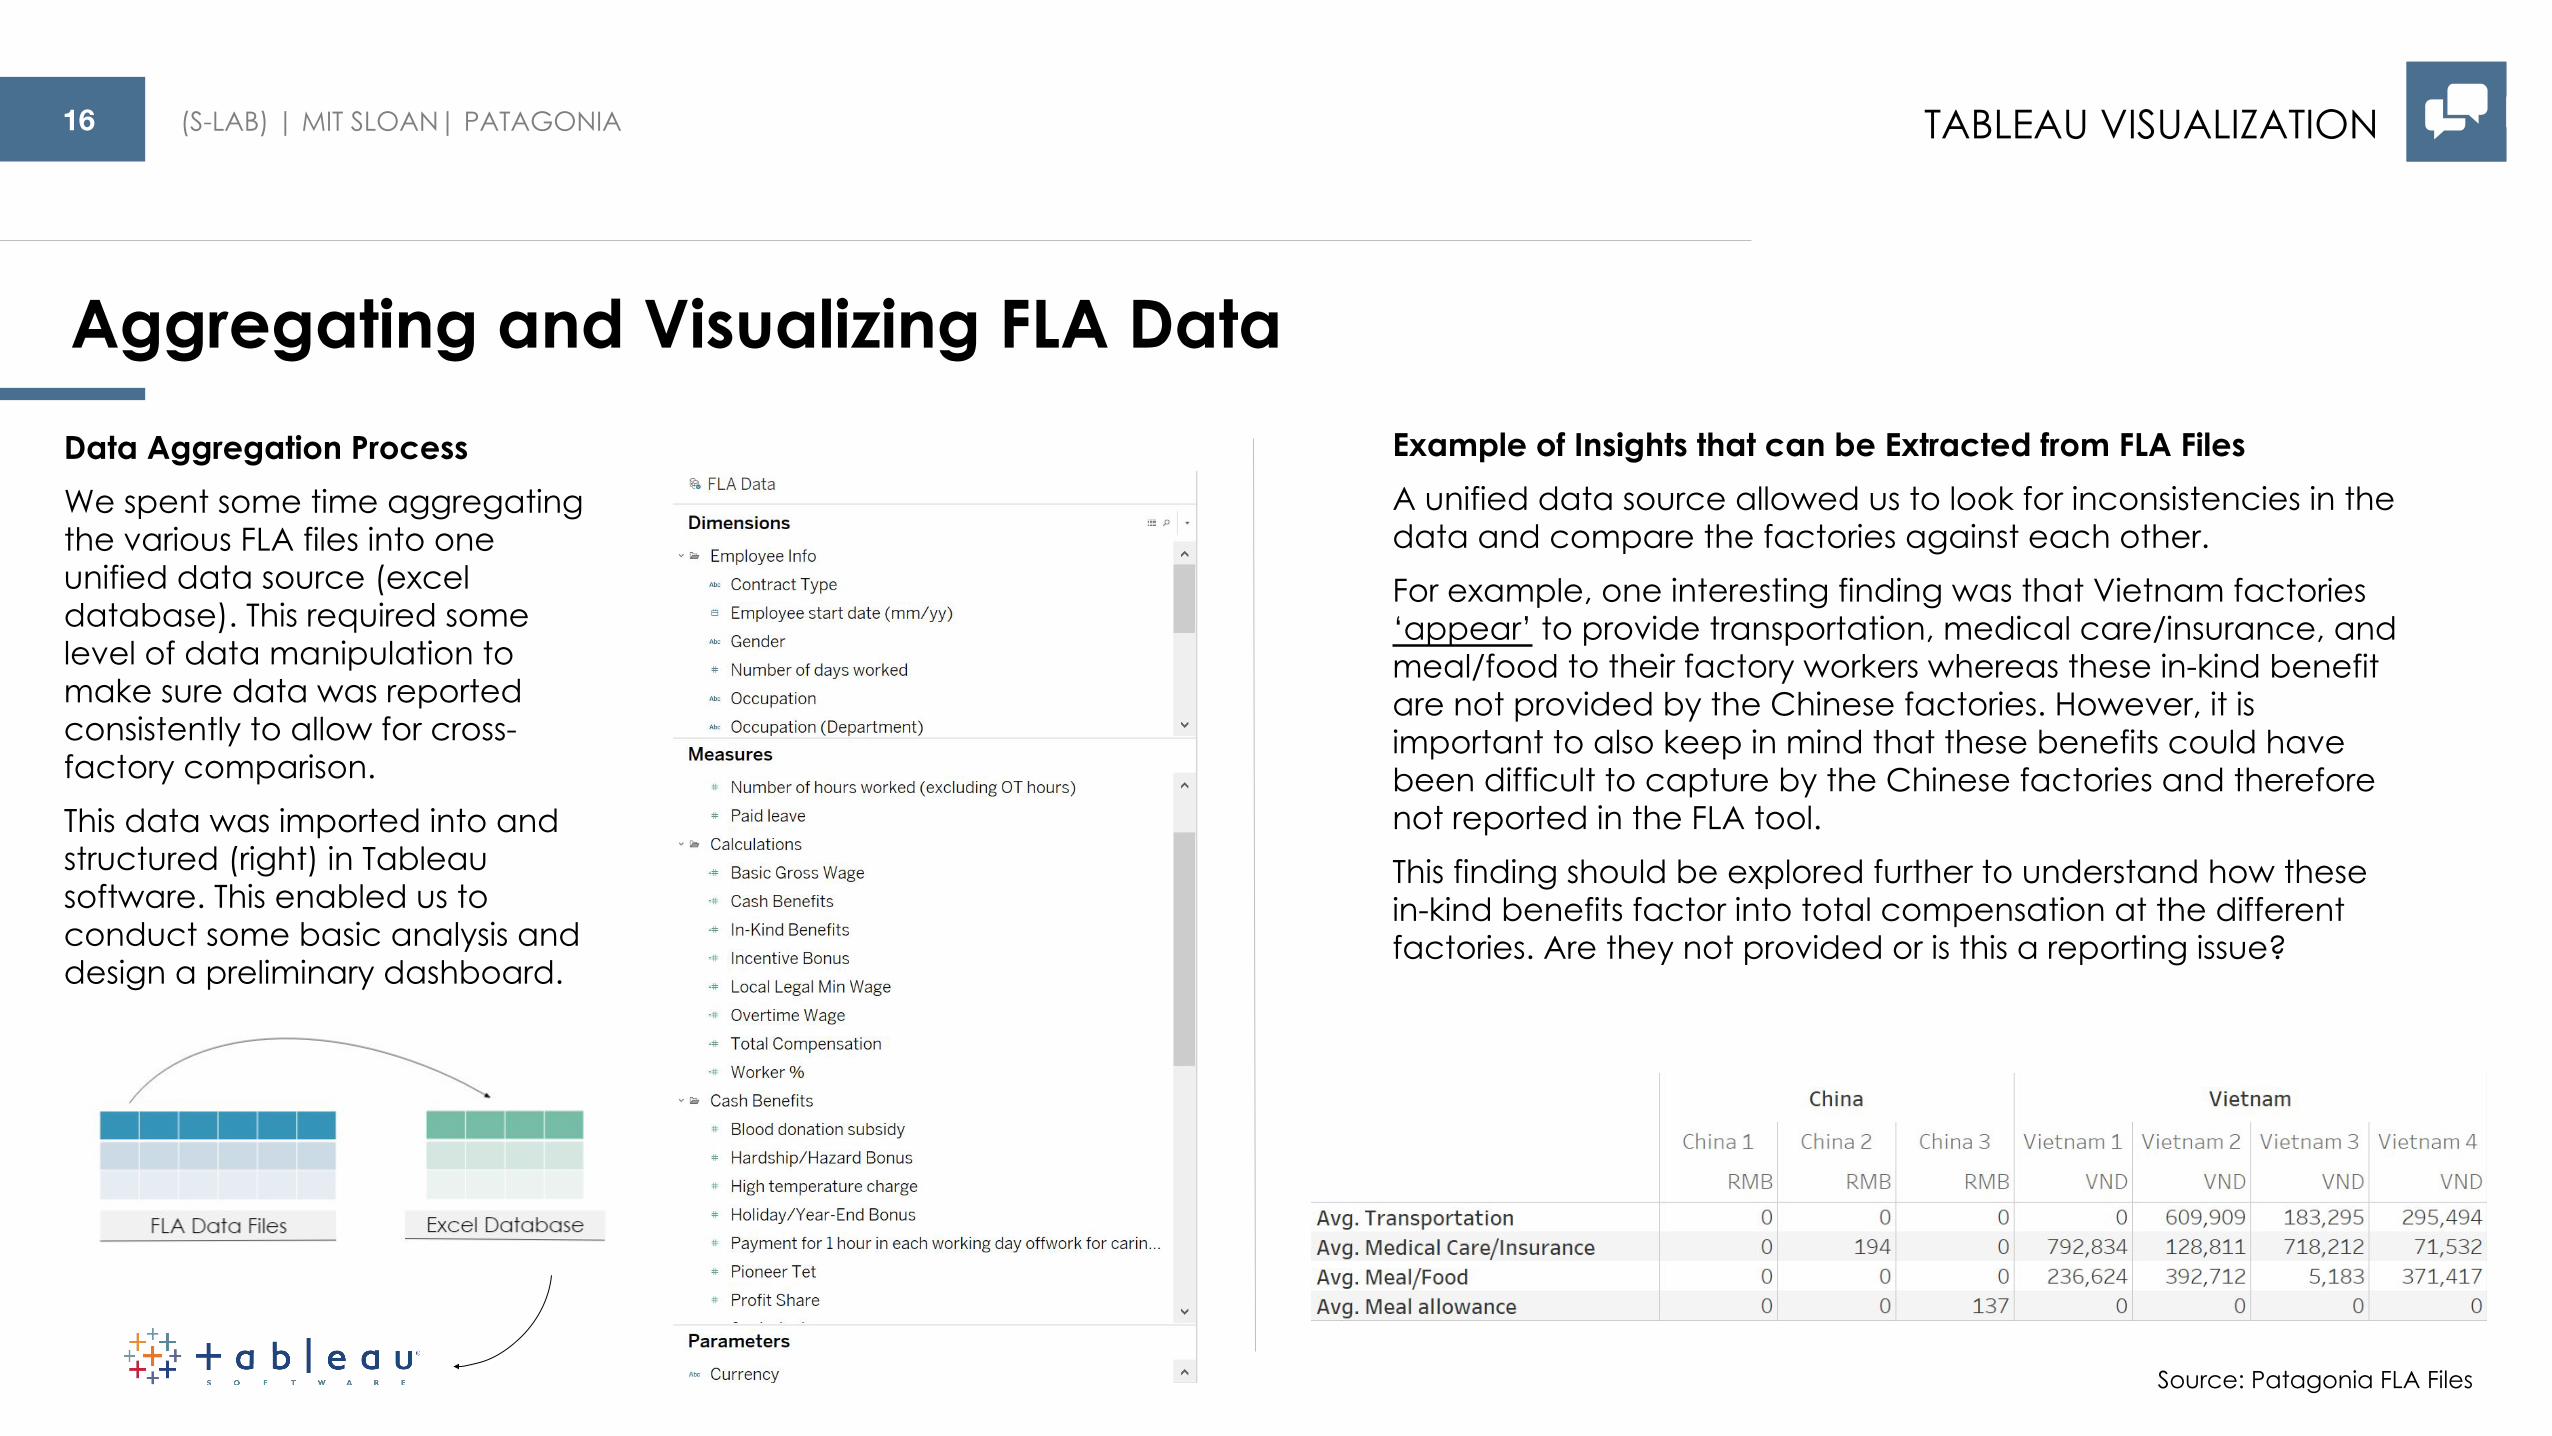
Aggregating and Visualizing FLA Data
Source: Patagonia FLA Files
Example of Insights that can be Extracted from FLA FilesA unified data source allowed us to look for inconsistencies in the data and compare the factories against each other. For example, one interesting finding was that Vietnam factories ‘appear’ to provide transportation, medical care/insurance, and meal/food to their factory workers whereas these in-kind benefit are not provided by the Chinese factories. However, it is important to also keep in mind that these benefits could have been difficult to capture by the Chinese factories and therefore not reported in the FLA tool.This finding should be explored further to understand how these in-kind benefits factor into total compensation at the different factories. Are they not provided or is this a reporting issue?
Data Aggregation ProcessWe spent some time aggregating the various FLA files into one unified data source (excel database). This required some level of data manipulation to make sure data was reported consistently to allow for cross- factory comparison. This data was imported into and structured (right) in Tableau software. This enabled us to conduct some basic analysis and design a preliminary dashboard.

17 (S-LAB) | MIT SLOAN| PATAGONIA TABLEAU VISUALIZATION
Aggregating and Visualizing FLA Data
Source: Patagonia FLA FilesCurrency Conversion Rate: 05/18/2017
01
02
03
04
05
Example of Insights that can be Extracted from FLA Files● 5 main categories: 1) Gross Wage 2) Overtime Wage 3)
Cash Benefits 4) Incentive Bonus 5) In-Kind Benefits● By converting from local currency to USD, we can see where
the factories lie in relation to each other for each component of compensation
● Note: Averages can skew results; this view can be explored in the dashboard by occupation (cutting, Q&A,etc) and by contract type (full-time, piece-rate, etc.)

18 (S-LAB) | MIT SLOAN| PATAGONIA TABLEAU VISUALIZATION
Tableau Preliminary DashboardLeveraging the excel data source we designed a preliminary dashboard that visualizes the key metrics from the FLA data.The dashboard can be filtered by individual factory type and allows the user to include/exclude overtime, and report in local currency or USD. The first part of the dashboard aims at providing user with general summary information on the specific factory, whereas the second part focuses of visualizing the key compensation metrics.
Source: Patagonia FLA Files
Aggregating and Visualizing FLA Data

19 (S-LAB) | MIT SLOAN| PATAGONIA TABLE OF CONTENTS
I. PROJECT OVERVIEW & METHODOLOGY
III. USER PERSONAS
IV. TOOL WIREFRAME: WAGELY
V. RECOMMENDATIONS & NEXT STEPS
II. MARKET RESEARCH AND ANALYSIS
Persona OverviewBrand PersonaSupplier I PersonaSupplier II PersonaAdvocacy Partner Persona
TABLE OF CONTENTS
20 (S-LAB) | MIT SLOAN| PATAGONIA
02 | SUPPLIER I
04 | INTERMEDIARY PARTNER
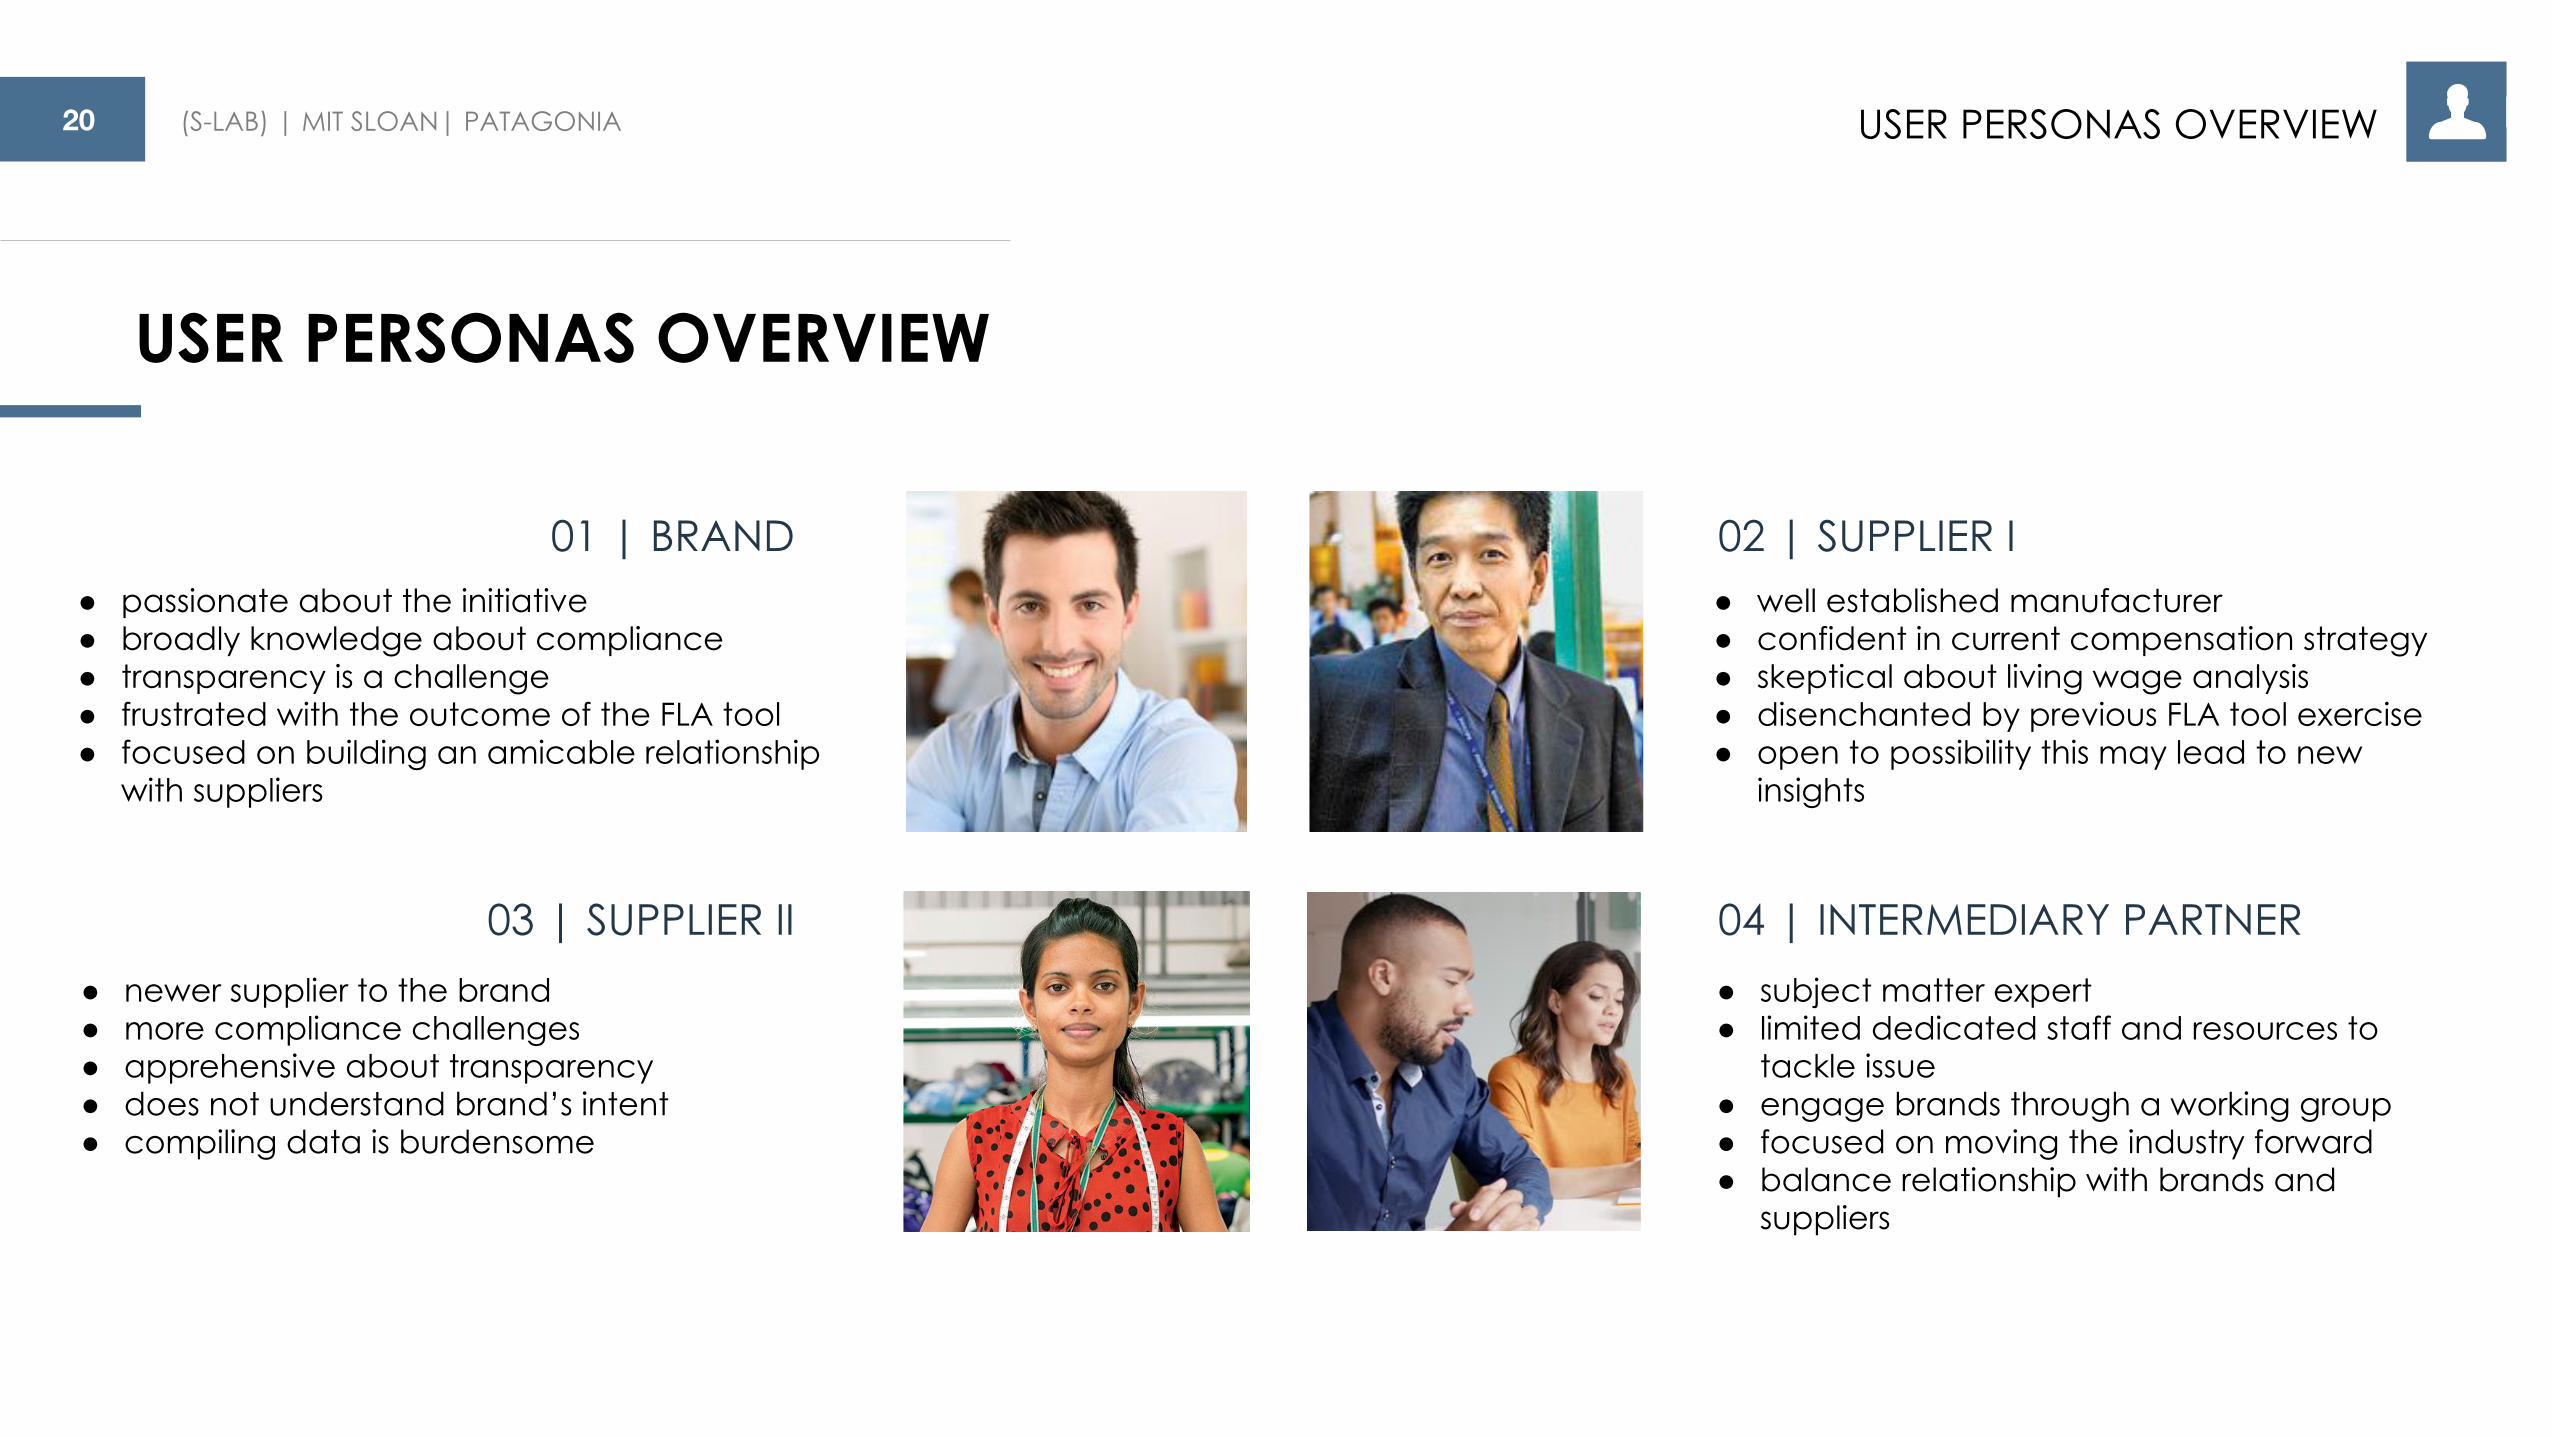
01 | BRAND● passionate about the initiative● broadly knowledge about compliance● transparency is a challenge● frustrated with the outcome of the FLA tool● focused on building an amicable relationship
with suppliers
03 | SUPPLIER II
USER PERSONAS OVERVIEW
USER PERSONAS OVERVIEW
● newer supplier to the brand● more compliance challenges● apprehensive about transparency● does not understand brand’s intent● compiling data is burdensome
● well established manufacturer● confident in current compensation strategy● skeptical about living wage analysis● disenchanted by previous FLA tool exercise● open to possibility this may lead to new
insights
● subject matter expert● limited dedicated staff and resources to
tackle issue● engage brands through a working group ● focused on moving the industry forward● balance relationship with brands and
suppliers

21 (S-LAB) | MIT SLOAN| PATAGONIA BRAND USER PERSONA
Corporate Buy-in
RelationshipWith Factory
Content Knowledge
Michael, the passionate middle manager, has been told by upper management that the company needs to make progress toward lifting wages in the supply chain. Michael is juggling several projects and is working on a small team being stretched in many directions. Many of his projects focus on supplier compliance because the brand wants to buy from good companies that treat their workers well and produce high quality products. Michael doesn't know where to begin with this new initiative! Besides the audits the company conducts every once in a while, he doesn't have a complete sense of wages across more than a small sample of workers in a given factory. Can a data collection tool help Michael acquire more complete compensation data from suppliers? If so, what does Michael need in order to leverage a data collection tool?
Michael's broad knowledge on matters of compliance is invaluable. He knows the ins and outs of how suppliers will tread carefully with providing sensitive wage data. Transparency is surely a challenge. He is able to balance the delicate brand-supplier relationship with a thoughtful approach on which suppliers to target for initial tool piloting and is highly sensitized to the reluctance some suppliers will feel toward sharing compensation data. Michael and his team will excel at discerning between real and fabricated data records; however, the next step will require additional support to conduct more rigorous living wage analysis on the data.
Michael is juggling multiple initiatives, but is lucky to have the buy-in of upper management. He can't do this alone and will need to allocate resources toward making sense of whatever data is collected and transmitted to the brand. Michael can leverage corporate buy-in to galvanize the needed support and partnership with other colleagues who have the quantitative analysis skills and data visualization capacity that he lacks on his team. If intra-organizational support is not feasible, he can look externally for temporary help (an intern) or the support of advocacy partners.
Michael's brand knows they are a smaller buyer in many of the factories they contract with, and are constantly thinking of alternative ways to build rapport with their manufacturing clients. Sometimes this means building the capacity of the factory to enhance productivity or improve conditions for workers. This amicable relationship is key a leverage point in getting factory buy-in. The brand has to be cognizant about what relationships they do and do not have with the middle management factory staff responsible for maintaining the compensation data. Where the relationships are not so strong, Michael and his team need to strategize on how best to build the trust and rapport needed with those individuals.
Michael, the Passionate Middle Manager

22 (S-LAB) | MIT SLOAN| PATAGONIA SUPPLIER I USER PERSONA
Ease of use
Reciprocity
Clarity from the brand
Xact LTD is a well-established apparel manufacturer popular among several global apparel brands, with factories throughout Southeast Asia. They have centralized bookkeeping and accounting, and a sophisticated ERP system in place to aid them in conducting rigorous business analysis. Lucian, Xact LTD’s factory manager, has amicable relationships with clients and is responsive to requests for information or otherwise. Upon hearing from one client's compliance manager that the brand was exploring the possibility of higher compensation in the supply chain, Xact LTD ran some analysis on their wage data records and feel confident they're already performing adequately in this area. Will Xact LTD indulge the brand's data collection exercise request? If so, what does Xact LTD need in order to feel comfortable using a data collection tool?
Xact LTD surely has the capacity to produce reports quickly, but may be reticent to produce raw data for the brand. Lucian is initially concerned about sharing such privileged information. The brand won’t know the ins and outs of the factory’s operations and may come to the wrong conclusions about the company’s compensation strategy. Is this another compliance exercise? Lucian has worked in the industry a while and knows how complicated living wages are; the solution won’t be to simply increase wages. Is that the brand’s ultimate goal? Xact LTD might oblige after a frank one to one conversation to dig into exactly what the brand is after.
The last time the brand requested that Lucian provide wage data, it was a hugely frustrating ordeal. He was assured the process would be straightforward and brief, but it took him a few days and multiple conversations with the brand field manager to make his way through the tool. He found himself toggling between factory metrics and the tool’s data categories, unsure how to fit Xact LTD’s data into the tool, while having to manually enter in data records. Xact LTD is willing to continue collaborating with the brand on this, but does not have the staff time to spare for another marathon data collection exercise.
Lucian is committed to ensuring Xact LTD continues to treat and pay workers adequately, and feels the company is doing better on this front than many competitors. If the brand wants to use this data to tell Xact LTD they should raise wages, Lucian feels the brand doesn’t have a strong case. However, Lucian would find it compelling if the brand can use this data to reveal new insights about compensation and labor management best practices, especially where these insights can lead to cost savings and improved efficiency. Lucian is happy to comply and collaborate with the brand to get them the data they need in the short term, but needs to be affirmed that this can have long term value to Xact LTD if the brand wants continued engagement over time.
Lucian, Factory Manager, Xact LTD

23 (S-LAB) | MIT SLOAN| PATAGONIA SUPPLIER II USER PERSONA
Coaching & support
Reciprocity
Clarity from the brand
HiQ Threads recently entered into a contract with a well-known brand and is still building rapport with a number of teams across the brand. Factory management are on edge since they didn't perform as well as hoped on their latest compliance audit, but are making positive strides to meet the improvement plan goals. The brand's sourcing unit is happy with the quality and price of the products; yet, the compliance unit is applying pressure to make improvements that will cut into operating revenue. The brand asked HiQ Threads factory manager, Rita, for data as part of a living wage project, but she’s not so sure how the brand will use the findings. HiQ Threads values this new client, but doesn't know what a living wage strategy would entail. Will HiQ Threads indulge the brand's data request? If so, what does HiQ Threads need to feel comfortable using a data collection tool?
A brand that is either newer or facing compliance challenges will have greater reason to be apprehensive about this level of transparency. Rita is inclined to be opaque in her response to the brand’s request, but is also more likely to indulge the brand if a case for living wage is woven into her conversations with brand representatives early and often. This is HiQ Threads’ only client asking for this information and Rita perhaps needs ongoing assurances about how this fits into a long-term brand-supplier relationship.
Rita has difficulty understanding why basic wage data is not sufficient for the brand. To compile data on benefits, deductions, and bonuses Rita has to talk to several departments in the factory. HiQ Threads tracks labor costs, but not in the way the brand is requesting. Rita, unlike Lucian who has access to more sophisticated and centralized factory analytics, has a ways to go in order to take the kind of comprehensive view the brand is looking for. She will need a lot of support, or even hand holding. HiQ Threads would also be more receptive to pulling these data together in a timely way if Rita’s colleagues were introduced to the tool.
HiQ Threads feels obliged to round up the data Rita is requesting even if it is not data they use internally to improve operations. If the brand is able to provide on-site trainings on how the tool and its insights might have a positive impact on the factory over the long term, HiQ Threads might be convinced of using a living wage analysis to enhance their understanding of labor costs and productivity.
Rita, Factory Manager, HiQ Threads

24 (S-LAB) | MIT SLOAN| PATAGONIA INDUSTRY INTERMEDIARY USER PERSONA
Limited Resources
Balancing Relationship with Brand & Factories
Subject MatterExpert
Jamie and Lisa work for Wage Transparency Intl. They view their job as passions, but often find themselves stretched too thin. Having come from both the private and public sectors they are ready to tackle big societal challenges, but grow frustrated when the status quo prevails. Their member companies are growing impatient with the lack of progress towards their goals and finding common ground between all of the companies is proving difficult. Recently several of the member companies have expressed dissatisfaction with the current direction and approach and have expressed interest in taking their companies and dues elsewhere. Sometimes they spend more time managing the various personalities than they do on solving the problem. How can Wage Transparency Intl. solve the problem and keep every company engaged.
Jamie and Lisa work for a company with in-depth knowledge on matters of fair labor practices. They know the ins and outs of how suppliers operate and have attempted to provide brands with tools to conduct due diligence of their suppliers. They advocate for greater accountability and transparency among the brands, factories, and other entities involved in the global supply chain. They have committed significant resources to this effort. After their first attempt of building a tool to measure living wage, Jamie and his team learned that a tool could not be designed in isolation and must leverage the relationships with brands and factories to understand the complexities around capturing the data.
Jamie must reach out to the brands and encourage greater participation in the working group to dedicate resources in terms of subject matter expertise. Wage Transparency Intl is struggling with the division of labor for this project. They have limited capacity as do the brands. In order to be successful it require an all hands on deck approach. This will not be successful if Wage Transparency Intl. tackles the problem on their own.
Jamie and Lisa are able to balance the delicate industry intermediary-brand-supplier relationship with a thoughtful approach on which brands to target for initial tool piloting and is highly sensitized to the reluctance that some suppliers will feel toward sharing compensation data with the brands. They have built strong relationships with some of the world's leading brands which have committed to ensuring fair labor practices and safe and humane working conditions throughout their supply chains. Through these relationships they aid companies with the resources necessary to develop and improve social compliance systems that flag issues and lead to sustainable solutions when workers are at risk.
Industry Intermediary, Wage Transparency Intl

25 (S-LAB) | MIT SLOAN| PATAGONIA TABLE OF CONTENTS
I. PROJECT OVERVIEW & METHODOLOGY
III. USER PERSONAS
IV. TOOL WIREFRAME: WAGELY
V. RECOMMENDATIONS & NEXT STEPS
II. MARKET RESEARCH AND ANALYSIS
Wagely OverviewSupplier User Wireframes
c. Brand User Wireframes
TABLE OF CONTENTS

26 (S-LAB) | MIT SLOAN| PATAGONIA WAGELY
WAGELY OVERVIEW
Wagely leverages the insights from our market research to create a TurboTax -like tool to help brands and advocacy partners measure living wage at factories through a step-by-step, easy to use, interactive platform.
This section includes the wireframe and workflow for the factory user persona. The next section contains the workflow for the brand user persona.
For a clickable interactive prototype of Wagely visit:
https://invis.io/YXBQQPNDU

27 (S-LAB) | MIT SLOAN| PATAGONIA WAGELY
My Account
02
01
01 | Wagely Login Page: On the login page, the user will be able to create a new account if they don’t already have one.
02 | Login Section: the user will use their username and password to login. Depending on the user login information, the tool will identify the user type (brand, factory, or advocacy partner). Each user type will see a specific version of the Wagely tool. In the next couple of slides we detail out the workflow for the factory user type.
WIREFRAME FUNCTIONALITY AND FEATURES
Hi, Welcome to Wagely!
Please login or create a new account to get started.
Login
Username:
Password:
Login
Forgot your password? | New Account

28 (S-LAB) | MIT SLOAN| PATAGONIA WAGELY
Hi Alex, welcome to Wagely! We appreciate your commitment in helping us measure compensation at your factory.
LET’S GET STARTED
FACTORY INFORMATION | COMPENSATION | REVIEW & SUBMIT | DASHBOARD
My Account01
02
03
04
01 | My Account: By clicking on My Account, the user will be able to manage username, password, who has access to view this data, and send out the login information for collaboration among other factory employees.
02 | Language Selection: The user will be able to select among various languages. Default is English.
03 | Guiding Menu This menu will help the factories navigate the tool.
04 | Welcoming Message: This message should be engaging.
05 | Information Button: These buttons will be available throughout the tool to help answer common important questions. In the home page, we address the factory‘s concern on what the data will be used for.
06 | Greyed out Menu: Non-clickable sections of the menu will be greyed out to avoid confusion
Why are we collecting this information?05
WIREFRAME FUNCTIONALITY AND FEATURES
06
29 (S-LAB) | MIT SLOAN| PATAGONIA WAGELY
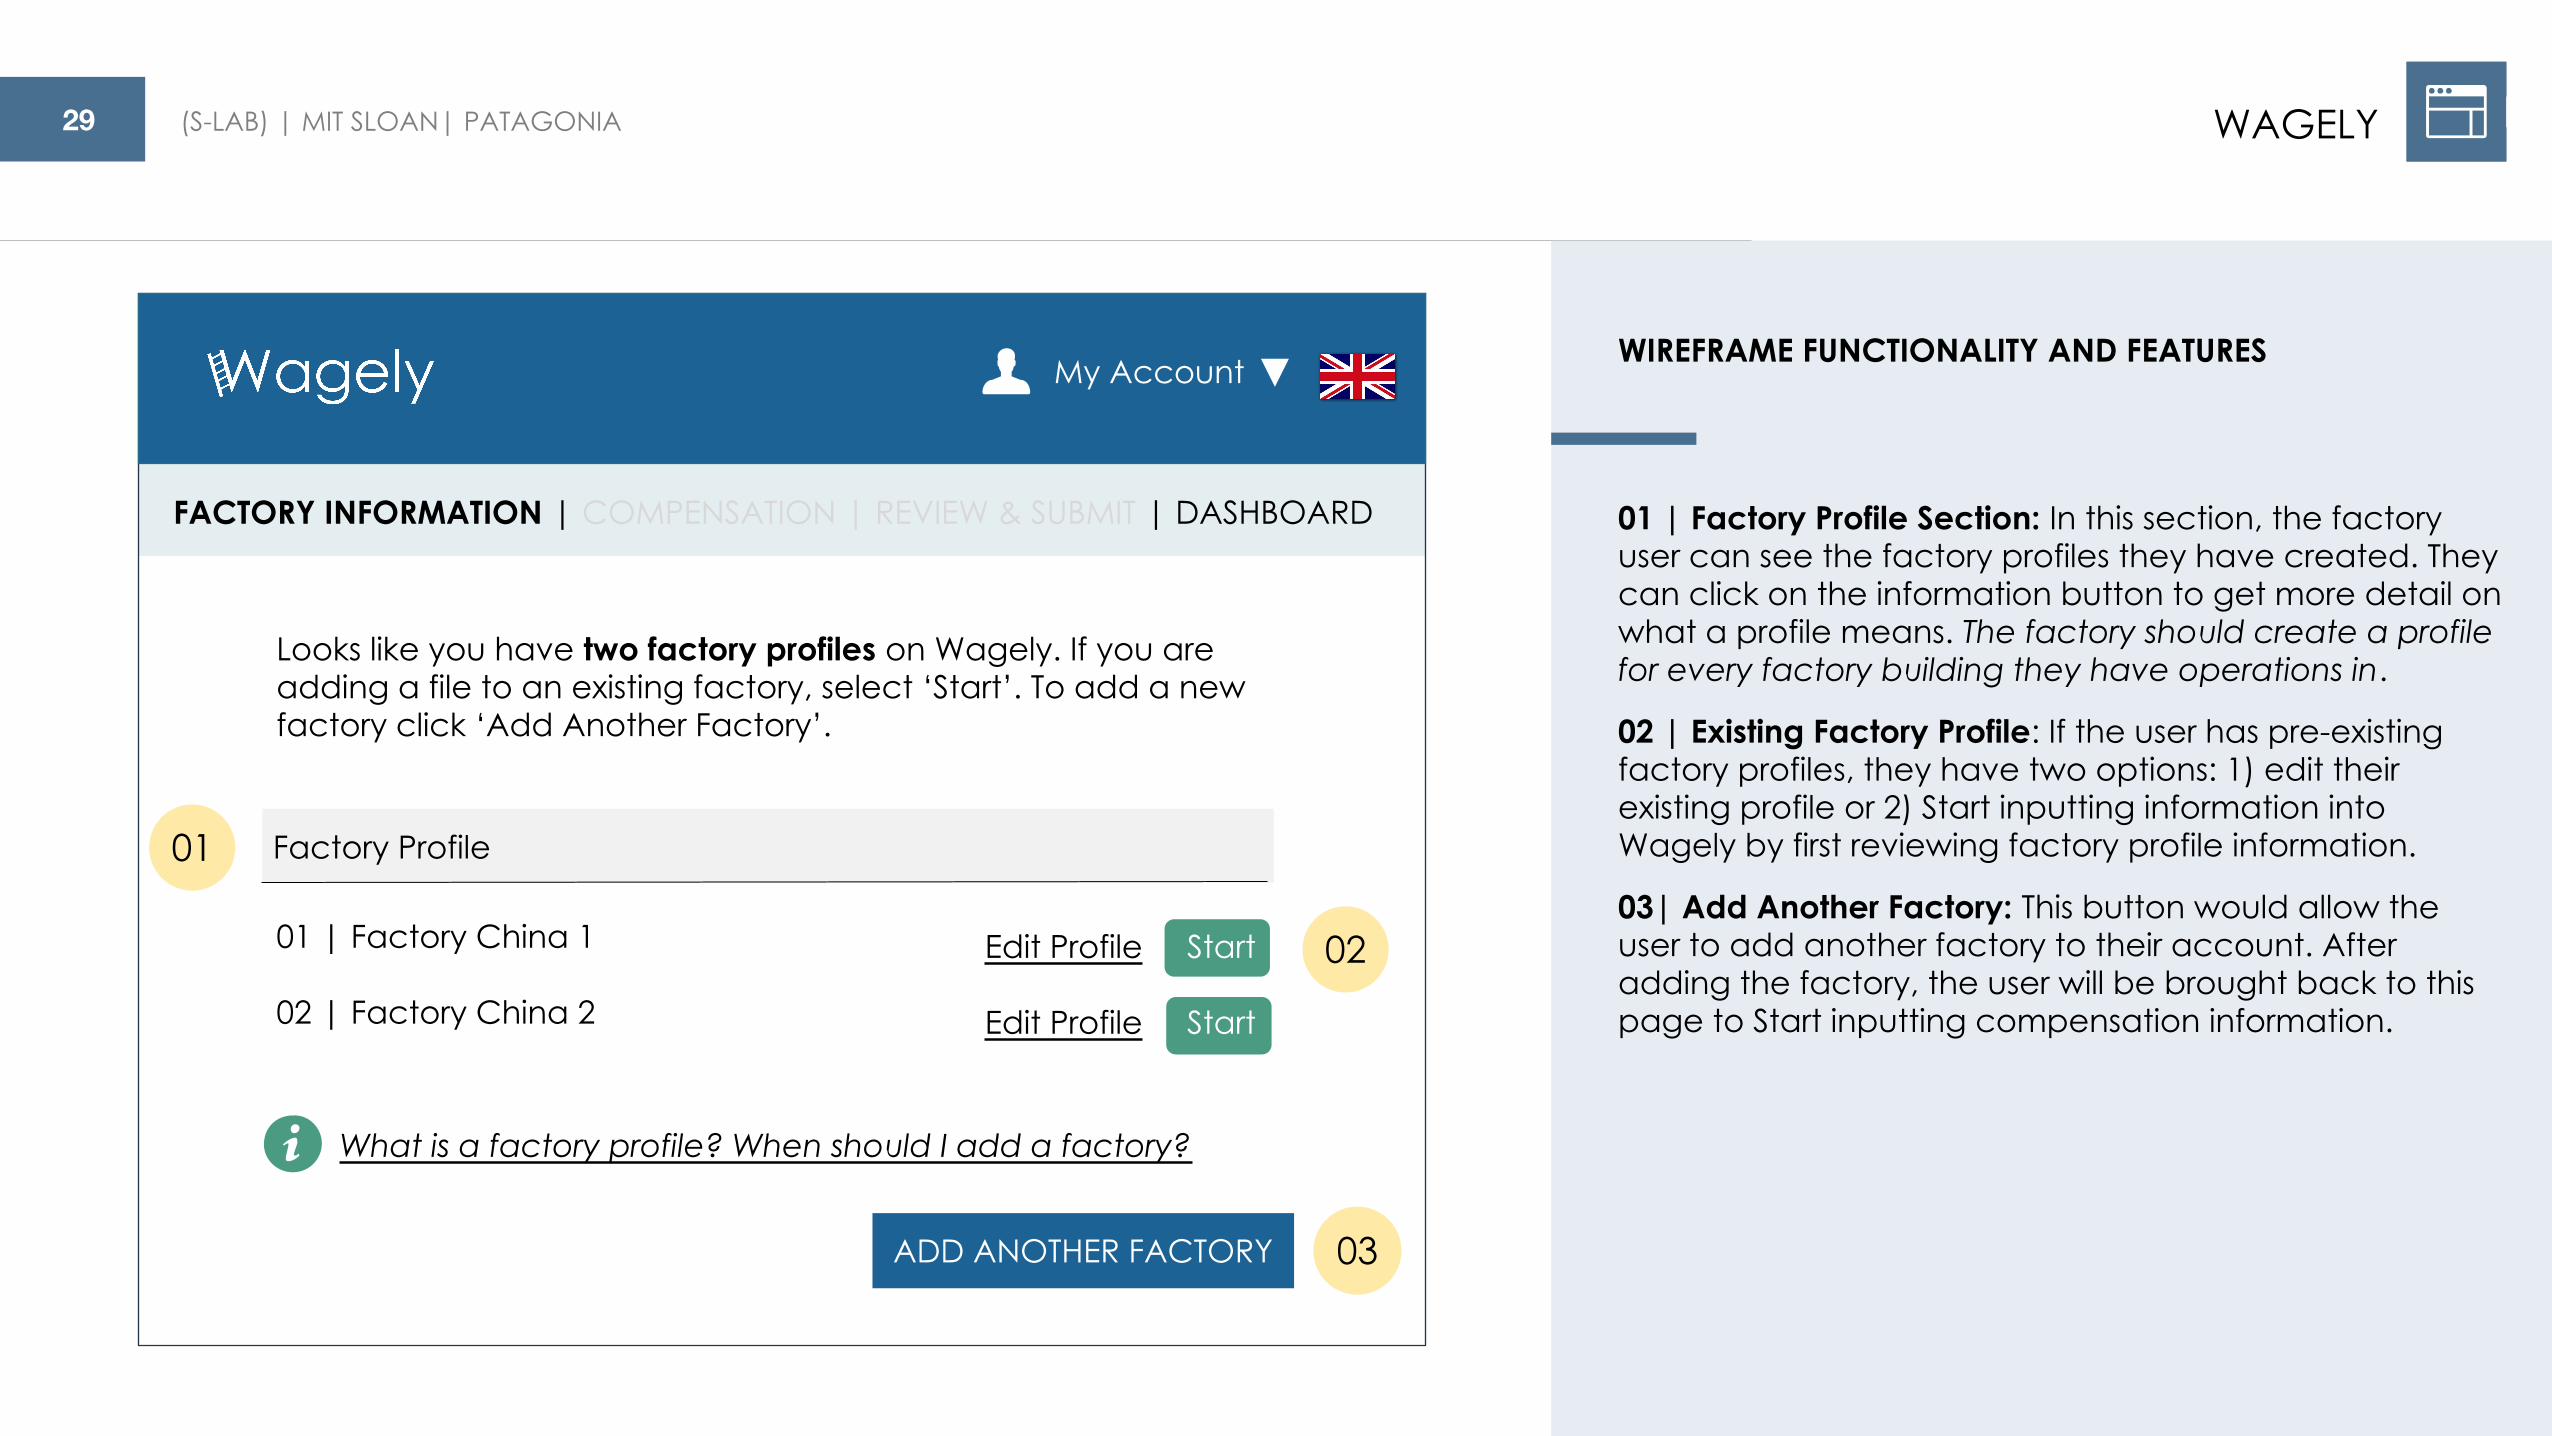
Looks like you have two factory profiles on Wagely. If you are adding a file to an existing factory, select ‘Start’. To add a new factory click ‘Add Another Factory’.
My Account
01 Factory Profile
01 | Factory China 1
02 | Factory China 2
ADD ANOTHER FACTORY
02
03
Edit Profile Start
Edit Profile Start
WIREFRAME FUNCTIONALITY AND FEATURES
01 | Factory Profile Section: In this section, the factory user can see the factory profiles they have created. They can click on the information button to get more detail on what a profile means. The factory should create a profile for every factory building they have operations in.
02 | Existing Factory Profile: If the user has pre-existing factory profiles, they have two options: 1) edit their existing profile or 2) Start inputting information into Wagely by first reviewing factory profile information.
03| Add Another Factory: This button would allow the user to add another factory to their account. After adding the factory, the user will be brought back to this page to Start inputting compensation information.
What is a factory profile? When should I add a factory?
FACTORY INFORMATION | COMPENSATION | REVIEW & SUBMIT | DASHBOARD

30 (S-LAB) | MIT SLOAN| PATAGONIA
Let’s get started on adding a new factory to your account.
CONTINUE
My Account
02 General Information
Factory Name:
Address:
City:
State:
Country:
03
General Information Worker Overview Summary
WAGELY
01
WIREFRAME FUNCTIONALITY AND FEATURES
01 | Sub-Menu: A sub-menu will appear if there are multiple sections within the main heading. For “Factory Information” there are three sub-menu items.
02 | General Information: Under the general information, the user will provide the factory’s name and address.
03 | Continue Button: The ‘Continue’ button will guide the user to the next sub-menu page ‘Worker Overview’.
FACTORY INFORMATION | COMPENSATION | REVIEW & SUBMIT | DASHBOARD

31 (S-LAB) | MIT SLOAN| PATAGONIA
Let’s get started on adding a new factory to your account.
CONTINUE
My Account
01 Worker Overview
How many factory workers do you employ:
Select the type of workers at Factory China 3:
Select the occupation types for the workers at Factory China 3:
General Information Worker Overview Summary
WAGELY
WIREFRAME FUNCTIONALITY AND FEATURES
01 | Worker Overview: In this section, the user will enter more detailed information about their factory.
02 | Select All that Apply: The user will have the option to answer these questions by selecting all that apply to their factory. We would like to note that more research needs to be conducted in order to determine how this data is natively stored and if the existing workflow for importing these various categories of workers still apply.
FACTORY INFORMATION | COMPENSATION | REVIEW & SUBMIT | DASHBOARD
Full-Time Part-Time Piece-Rate Contract
Cutting Sewing Q&A Packaging
02

32 (S-LAB) | MIT SLOAN| PATAGONIA
This is what we’ve gathered so far.
SAVE
My Account
General Information
Factory Name: Factory China 3Address: 1 Chinese St. Shanghai, Shanghai
02
Edit
Worker Overview
# of Employees: 1200Payment Systems: Multiple SelectedOccupations: Multiple Selected
Edit
General Information Worker Overview Summary
WAGELY
WIREFRAME FUNCTIONALITY AND FEATURES
01
FACTORY INFORMATION | COMPENSATION | REVIEW & SUBMIT | DASHBOARD01 | Summary Page: This page will summarize what the user input on the General Information and Worker Overview subsections. By clicking on “edit” under each subsection, the user can return to that page and edit the information.
02 | Save: By clicking on the Save button, this factory profile will be saved and the user will be directed back to the Factory Information main page.

33 (S-LAB) | MIT SLOAN| PATAGONIA
Looks like you have three factory profiles on Wagely. If you are adding a file to an existing factory, select ‘Start’. To add a new factory click ‘Add Another Factory’.
FACTORY INFORMATION | COMPENSATION | REVIEW & SUBMIT | DASHBOARD
My Account
01
Factory Profile
01 | Factory China 1
02 | Factory China 2
03 | Factory China 3
ADD ANOTHER FACTORY
WAGELY
Edit Profile Start
Edit Profile Start
Edit Profile Start
WIREFRAME FUNCTIONALITY AND FEATURES
01 | New Factory Profile: After going through the steps of adding another factory, the user is brought back to the factory information page. Now the user can see the list of existing factories. The user will select Start to add compensation information for each of the factories.

34 (S-LAB) | MIT SLOAN| PATAGONIA
My Account
01
Compensation
In-Kind Benefits
Simple questions about the in-kind benefits at your factory
60 mins
20 mins
Wages, overtime, and cash bonuses
Compensation In-Kind Benefits
Start
Start
WAGELY
WIREFRAME FUNCTIONALITY AND FEATURES
03
Let’s add compensation information for Factory China 3. Click on Start to complete each of the compensation sub-sections.
FACTORY CHINA 301 | Compensation Section: The compensation section is broken into two sections. The main compensation section will gather information related to wages, overtime, and cash bonuses. The In-Kind benefits section will gather information on benefits including food, transportation, health insurance, etc.
02| Factory Label: After the user starts the workflow for a specific factory, a blue label with the factory’s name will appear in the menu subsection. This will serve as a reminder for which factory the user is filling out the information for.
03 | Minutes: The section should provide an approximate number of minutes it takes to complete. We want to be as transparent as possible in the amount of resources and time a factory will have to dedicate.
FACTORY INFORMATION | COMPENSATION | REVIEW & SUBMIT | DASHBOARD
02

35 (S-LAB) | MIT SLOAN| PATAGONIA
My Account
02
WAGELY
WIREFRAME FUNCTIONALITY AND FEATURES
Let’s learn about worker’s wages at Factory China 3. How do you want to enter worker’s wages?
HELP ME CREATE A TEMPLATE
01 | Compensation Sub-section: Under this sub-section the user will be able to import their wage files either based on a pre-existing template or by creating a new template.
Template Definition: A template is created when the user has mapped out each of the columns of their original wage file to a standard pre-defined bucket/category in Wagely. We expect that the initial setup is done in collaboration with the Field Manager.
02 | Use a Pre-Existing Template: The user will select this option if the factory has already mapped out their input file and that file has not changed format.
03 | Create a New Template: The user will select this option if 1) this is the first time they are using the tool (we expect this process be completed with the field manager the first time around) or 2) their file format has changed and modifications need to be made to the template
Use a Pre-Existing Template Create a New Template
Compensation In-Kind Benefits
USE EXISTING TEMPLATE
Looks like you have 1 pre-existing template. Upload a file based on your pre-existing template.
Choose this option if you need to create a new template. We will walk through your file one item at a time to create a template.
What is a template and when should I create a new one?
03
FACTORY INFORMATION | COMPENSATION | REVIEW & SUBMIT | DASHBOARD
01 FACTORY CHINA 3

36 (S-LAB) | MIT SLOAN| PATAGONIA WAGELY
WIREFRAME FUNCTIONALITY AND FEATURES
01 | Creating a New Wage Template Selection: If the user selects the option to create a new template, they will be walked through various steps to map standard wagely information with the user’s native file output
FACTORY INFORMATION | COMPENSATION | REVIEW & SUBMIT | DASHBOARD
My Account
Compensation In-Kind Benefits FACTORY CHINA 3
How a wage template works: The next few steps will allow us to understand your data as outputted by our accounting system. Wagely then captures only the relevant information and standardizes the format across factories.
CONTINUE
Your Raw Data Wagely Format
01

37 (S-LAB) | MIT SLOAN| PATAGONIA
My Account
WAGELY
WIREFRAME FUNCTIONALITY AND FEATURES
01 | Use Existing Template Selection: In this section, the user will upload a file based on the output from their accounting/ERP system. The template then transforms that file into a standardized Wagely output so factories with different wage systems can more easily be compared. They can preview the template in this section. This can serve as a reminder of the type of file they need to upload (can be helpful if they are only doing this once a year).
02 | Upload File: By clicking on the upload button, the user will be able to select the file from their computer to upload to the tool. The file formats that are compatible with the tool can be found by clicking on the information button near the ‘Upload File’ button. In addition, the user can select the labor-type (based on their factory profile) and the currency that corresponds to the file they are uploading.
03 | Compensation Files: Once the user uploads the file, it will appear in this section. A summary of all past files can be found here. This file can be previewed and deleted by clicking on the appropriate link.
Compensation In-Kind Benefits
FACTORY INFORMATION | COMPENSATION | REVIEW & SUBMIT | DASHBOARD
01
02
03
FACTORY CHINA 3
UPLOAD FILE
ID Wage Hrs Total Wage OT Hours OT Rate Total OT Pay
1
File Name Upload Date
factory_china3_wage.csv 05/16/2017 Preview Delete
What file formats are acceptable?
CONTINUE
Let’s upload your compensation files from May 17, 2016 – May 16, 2017. Remember, the file should match the pre-existing template below:
Piece-RateLabor Type: RMB Currency:

38 (S-LAB) | MIT SLOAN| PATAGONIA
My Account
Compensation
In-Kind Benefits
Simple questions about the in-kind benefits at your factory
Last modified: 5/15/15
20 mins
Wages, overtime, and cash bonuses
Compensation In-Kind Benefits
Start
WAGELY
WIREFRAME FUNCTIONALITY AND FEATURES
Let’s add in-kind benefits for Factory China 3.
Edit
Completed
FACTORY INFORMATION | COMPENSATION | REVIEW & SUBMIT | DASHBOARD
02
01
01 | Message : user will be prompted to complete the next sub-section under compensation
02 | Completed: the user will be able to see the section they completed. This will be time-stamped and the user will be allowed to edit. If not complete then user see “incomplete” with last modified date.
FACTORY CHINA 3

39 (S-LAB) | MIT SLOAN| PATAGONIA
My Account
The following are a few questions to help us better understand the benefits supplied by your factory
Compensation In-Kind Benefits
Do you provide food to your employees?
Do you provide transportation to your employees?
Do you provide housing to your employees?
Do you provide healthcare to your employees?
Do you provide health insurance to your employees?
Yes No
CONTINUE
In-Kind Benefits
WAGELY
WIREFRAME FUNCTIONALITY AND FEATURES
02
01
03
04
01 | In-Kind Benefits: Because of the difficulties in collecting in-kind benefits, we decided to simplify the collection of this information by asking a series of yes/no questions. In the back-end, we will leverage Anker to benchmark the monetary value of this benefit. Categories and definitions of Benefits to include in Wagely Tool based on Anker Method can be found in the Appendix.
02 | Questions: This section will have the questions related to in-kind benefits. The user can click on the green hyperlink to learn more about what falls into each of the categories (ie. Food).
03 | Yes or No : The user will answer the question by clicking on Yes or No box. If Yes is selected then No is not selected (vice versa). A check will appear on the answer box. If Yes is selected, users will be asked for additional details on this benefit (next screen).
04 | Continue : Wagely automatically saves data on the page when user clicks continue
FACTORY INFORMATION | COMPENSATION | REVIEW & SUBMIT | DASHBOARD
FACTORY CHINA 3

40 (S-LAB) | MIT SLOAN| PATAGONIA
My Account
Compensation In-Kind Benefits
WAGELY
WIREFRAME FUNCTIONALITY AND FEATURES
01 | In-Kind Benefits Explanation: when the user clicks on the in-kind benefit highlighted word (ie. food), a pop-up will show up explaining what falls into this category. This is to provide some clarity around the benefit. In this example we have included the Anker definition.
FACTORY INFORMATION | COMPENSATION | REVIEW & SUBMIT | DASHBOARD
FACTORY CHINA 3
The following are a few questions to help us better understand the benefits supplied by your factory
Do you provide food to your employees?
Do you provide transportation to your employees?
Do you provide housing to your employees?
Do you provide healthcare to your employees?
Do you provide health insurance to your employees?
Yes No
In-Kind Benefits
How is Food defined?
Meals: Breakfast, Lunch, Dinner that satisfy worker’s hunger for 3 hours or more
Food rations or food commodities given for free or sold at concession rates that satisfy worker’s hunger for less than 3 hours
Close
X
CONTINUE
01

41 (S-LAB) | MIT SLOAN| PATAGONIA
My Account
Compensation In-Kind Benefits
WAGELY
WIREFRAME FUNCTIONALITY AND FEATURES
01 | Warning Message: The tool will notify the user when they have not completed all of the sections.
02 | Call-Out: The tool will highlight in red the sections the user is missing and must fill out in order to be able to move on to the next section.
FACTORY INFORMATION | COMPENSATION | REVIEW & SUBMIT | DASHBOARD
FACTORY CHINA 3
We noticed that you have not answered all the questions. Please answer yes or no for highlighted benefits.
Do you provide food to your employees?
Do you provide transportation to your employees?
Do you provide housing to your employees?
Do you provide healthcare to your employees?
Do you provide health insurance to your employees?
Yes No
CONTINUE
In-Kind Benefits
01
02
42 (S-LAB) | MIT SLOAN| PATAGONIA
FACTORY INFORMATION | COMPENSATION | REVIEW & SUBMIT | DASHBOARD
My Account
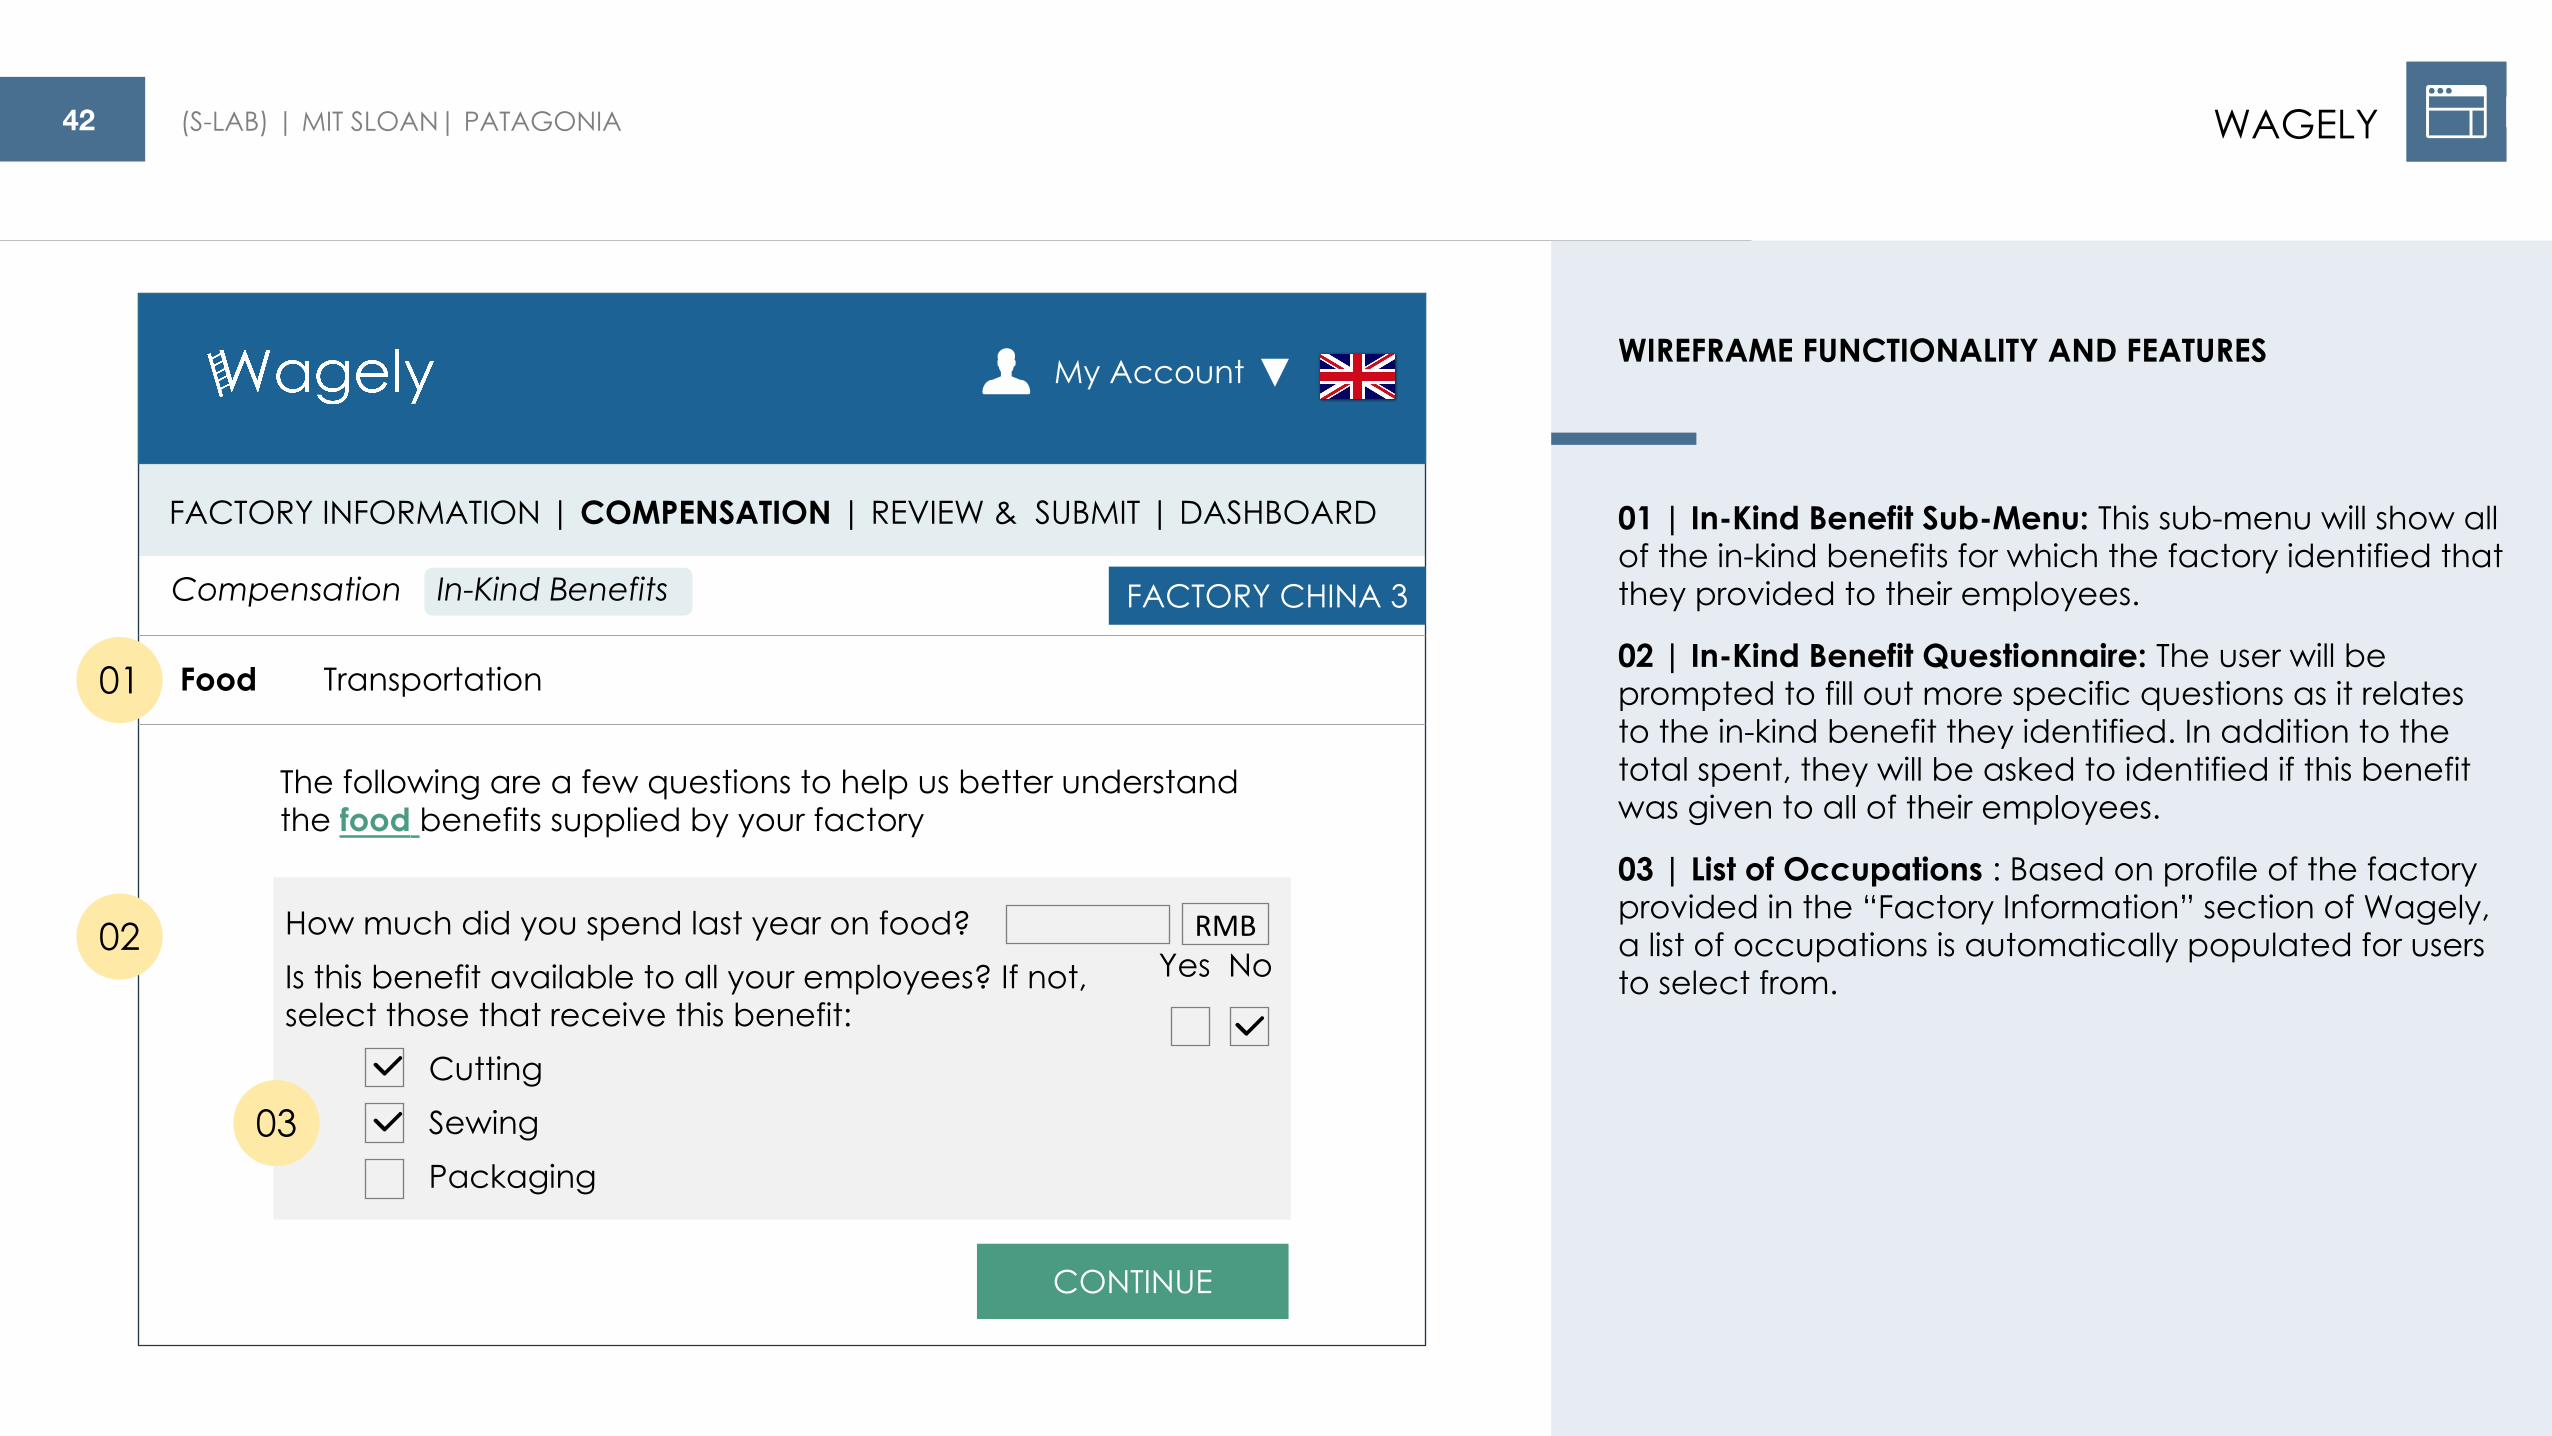
The following are a few questions to help us better understand the food benefits supplied by your factory
Compensation In-Kind Benefits
CONTINUE
How much did you spend last year on food?Is this benefit available to all your employees? If not, select those that receive this benefit:
CuttingSewingPackaging
Yes No
WAGELY
WIREFRAME FUNCTIONALITY AND FEATURES
Food Transportation
01 | In-Kind Benefit Sub-Menu: This sub-menu will show all of the in-kind benefits for which the factory identified that they provided to their employees.
02 | In-Kind Benefit Questionnaire: The user will be prompted to fill out more specific questions as it relates to the in-kind benefit they identified. In addition to the total spent, they will be asked to identified if this benefit was given to all of their employees.
03 | List of Occupations : Based on profile of the factory provided in the “Factory Information” section of Wagely, a list of occupations is automatically populated for users to select from.
01
02
03
FACTORY CHINA 3

43 (S-LAB) | MIT SLOAN| PATAGONIA
FACTORY INFORMATION | COMPENSATION | REVIEW & SUBMIT | DASHBOARD
My Account
Compensation
In-Kind Benefits
Simple questions about the in-kind benefits at your factory
Last modified: 5/15/15
Wages, overtime, and cash bonuses
Compensation In-Kind Benefits
WAGELY
WIREFRAME FUNCTIONALITY AND FEATURES
You completed the compensation for Factory China 3. Please review before submitting.
Edit
Completed
Last modified: 5/15/15 Edit
Completed
SUBMIT
01 | Review and Submit: Once the user has filled out both the compensation and In-Kind benefits, the tool will take the user to the Review & Submit section. After click on the Submit button the user will return to the Factory Information page to start the workflow for another factory.
01
FACTORY CHINA 3

44 (S-LAB) | MIT SLOAN| PATAGONIA
Yay, you completed Factory China 3! Looks like you have two additional factory profiles on Wagely that still need data. Click Start to complete them.
FACTORY INFORMATION | COMPENSATION | REVIEW & SUBMIT | DASHBOARD
My Account
02
Factory Profile
01 | Factory China 1
02 | Factory China 2
03 | Factory China 3
ADD ANOTHER FACTORY
WAGELY
Edit Profile Start
Edit Profile Start
WIREFRAME FUNCTIONALITY AND FEATURES
Last modified: 5/15/15 Edit
Completed
01
01 | Message : user will be prompted to complete compensation for any remaining factories.
02 | Completed: the user will be able to see the factory they completed. This will be time-stamped.
03 | Editable: The user will also be allowed to edit the information they submitted. Each edit is time stamped and a record of changes is kept for review by the factory.
03

45 (S-LAB) | MIT SLOAN| PATAGONIA
FACTORY INFORMATION | COMPENSATION | REVIEW & SUBMIT | DASHBOARD
My Account
WAGELY
WIREFRAME FUNCTIONALITY AND FEATURES
02
0101 | Dashboard: the user will be able to see a summary of the data by clicking on the dashboard with the option to see how their factory compares to industry standards, country minimum requirements, poverty line, etc.
02 | Filtering Functionality: The dashboard will allow users to filter the graphs by factory, change the currency, etc.

46 (S-LAB) | MIT SLOAN| PATAGONIA WAGELY
WAGELY OVERVIEW
This section contains the workflow for the brand user persona.

47 (S-LAB) | MIT SLOAN| PATAGONIA
My Account
WAGELY
WIREFRAME FUNCTIONALITY AND FEATURES
02
0101 | Menu: the brand view of Wagely would contain three sub-sections: Dashboard, Reporting, and Notification.
02 | Dashboard: In the dashboard section, the user will be able to see a visual representation of the data their suppliers reported. They will be able to aggregate this data across all their suppliers as well as see the performance for one-particular factory or region. In addition, the user will be able to visualize previous years’ records.
DASHBOARD | REPORTING | NOTIFICATION BRAND VIEW
- All Factories - China - China Factory 1 - China Factory 2 - China Factory 3 - China Factory 4 - China Factory 5 - Vietnam - Vietnam Factory 1 - Vietnam Factory 2 - Vietnam Factory 3 - Vietnam Factory 4 - Vietnam Factory 5
Archive - 2014 - 2015 - 2016 - 2017

48 (S-LAB) | MIT SLOAN| PATAGONIA
My Account
WAGELY
WIREFRAME FUNCTIONALITY AND FEATURES
01
01 | Notification Section: In the notification section, the user will be able to see a list of their factories and when they last reported on Wagely. The list will be sorted so that factories with the longest period since their last report date will show up at the top. Those with over a year since their last report date will show up in red.
02 | Sending Notifications: The user will be able to send notifications to the factory. To send a notification, the user will select the factory and then select the type of notification (green buttons).
DASHBOARD | REPORTING | NOTIFICATION BRAND VIEW
ID Factory Name Location Last Reported
Notifications:
02
04 | Factory Vietnam 1 Vietnam 5/16/2017
03 | Factory China 3 China 5/16/2017
05 | Factory Vietnam 2 Vietnam 1/24/2017
01 | Factory China 1 China 5/15/2016
02 | Factory China 2 China 5/17/2016

49 (S-LAB) | MIT SLOAN| PATAGONIA
My Account
WAGELY
WIREFRAME FUNCTIONALITY AND FEATURES
01
01 | Customizing the Notification: Before sending out the notification user will be shown a templated message. User will be allowed to modify this message before it gets sent out to the selected factories.
DASHBOARD | REPORTING | NOTIFICATION BRAND VIEW
Notification Editor: Nudge | Push | Thank You
Preview
Dear [Factory NAME],
We noticed that it’s been over a year since you last updated your wage data on Wagely. On behalf of Patagonia, the FLA, and thousands of workers around the world, I kindly ask that you take the time today to upload your factory’s wage data.[INDIVIDUALIZE WAGELY LOGIN LINK]If you are having trouble working with Wagely, please contact me at +555-555-5555 or email [email protected] Regards,Alex
Back

50 (S-LAB) | MIT SLOAN| PATAGONIA
My Account
WAGELY
WIREFRAME FUNCTIONALITY AND FEATURES
01
01 | Reporting: In the reporting tab the user will be able to download excel templated reports. We have included some types of reports as a guidance for this section.
DASHBOARD | REPORTING | NOTIFICATION BRAND VIEW
ID Factory Name Location Last Reported
04 | Factory Vietnam 1 Vietnam 5/16/2017
03 | Factory China 3 China 5/16/2017
05 | Factory Vietnam 2 Vietnam 1/24/2017
01 | Factory China 1 China 5/15/2016
02 | Factory China 2 China 5/17/2016
Download Reports:

51 (S-LAB) | MIT SLOAN| PATAGONIA TABLE OF CONTENTS
I. PROJECT OVERVIEW & METHODOLOGY
III. USER PERSONAS
IV. TOOL WIREFRAME: WAGELY
V. RECOMMENDATIONS & NEXT STEPS
II. MARKET RESEARCH AND ANALYSIS
Short-Term RecommendationsLong-Term Recommendations
TABLE OF CONTENTS

52 (S-LAB) | MIT SLOAN| PATAGONIA RECOMMENDATION ROADMAP
Get factory on board in the short
term
Make sense of living wage data
Align brand operations with
living wage goals
Develop, pilot, and iterate on a tool
Create value for the factory
02 03 04 0501
RECOMMENDATION ROADMAP
Galvanize external partners
06

53 (S-LAB) | MIT SLOAN| PATAGONIA
Learn from the factoryUpon receiving the data, be prepared to conduct data walk-through conversations with suppliers individually to translate what the data categories/columns mean. Gather questions before embarking on this conversation. Consider asking probing questions that provide insight into the logic behind the categories, who maintains these records, the frequency with which these data are updated, and the type of analysis conducted (if any) on compensation and remuneration broadly. Once you begin seeing the different ways each factory maintains compensation related data, it will seem unimaginable that any cross-supplier comparative analysis can be done. At this stage, focus on gathering as much preliminary information about each factory’s compensation strategies.
RECOMMENDATION
GET FACTORY ON BOARD IN THE SHORT TERM01
Build rapportThe importance of rapport and continued engagement by the brand cannot be understated. At every step of the process, it is easy for people on both sides (the brand and the supplier) to lose momentum and clarity about the objective of the project. As outsiders, we found it incredibly helpful for the brand to make introductions to contacts at the factory. Even still, it was easy for things to get lost in translation, fall through the cracks, or slow down when newer people were brought in to liaise with the S-Lab team.
Get the dataSolicit detailed and raw forms of wage data from suppliers to begin understanding what data they are tracking. Where the FLA tool fell short was its inability to build off current factory accounting practices, putting the onus on factory staff to convert their accounting categories into unfamiliar ones needed for a living wage calculation. Getting raw wage data will not be easy. A supplier will want to understand what you plan to do with this data, assurances that the data will be handled with integrity, and not used as a ‘gotcha’ in the future. No matter whether the relationship with the supplier is strong or weak, ongoing engagement and rapport-building are crucial to the effort to retrieve such sensitive data that suppliers are otherwise unaccustomed to benevolently handing over.

54 (S-LAB) | MIT SLOAN| PATAGONIA RECOMMENDATION
DEVELOP, PILOT, AND ITERATE ON A TOOL OVER TIME02
PilotOnce a prototype is built, plan to re-engage the factories from the initial round of data collection for a test. It is recommended that someone from the development team or the brand follow up with factory staff to capture feedback. Prototypes always have bugs and quirks to work through and capturing the feedback from pilot users as soon as possible is important to ongoing iteration and continuous improvement. Prototypes often produce insights crucial to the success or failure of a tool.
IterateThe goal of collecting user feedback is to pinpoint large and small challenges including but not limited to language translations, ease of use, completion time, broken links, missing context, and so on. You also want to collect any reflections about what went well as this will help strengthen features that make the interface easy to use and/or valuable for the supplier. Just as it was important to strengthen rapport when soliciting raw wage data, the brand should be managing expectations early on so the pilot users know this is a multi-step and iterative process.
DevelopGetting the data and learning from the factory requires a serious investment of staff time. Transitioning into the tool development phase requires financial resources and staff time to build a usable prototype. A developer will rely upon the data gathered in the previous phase to build out right-sized questions, options, and functionalities for all users (supplier and brand) so they can navigate through the turbotax style process intuitively. A turbotax interface enables a brand to learn about the factory while also educating the supplier on important labor topics related to the data being collected. The ultimate goal is to develop an interface that not only simplifies the data collection process, but creates value for the supplier instead of subjecting them to another seemingly burdensome compliance exercise.

55 (S-LAB) | MIT SLOAN| PATAGONIA RECOMMENDATION
MAKE SENSE OF THE DATA03
VisualizationThere are a number of options to choose from including traditional Excel techniques to interactive tools like Tableau to free statistical analysis programs like R Studio. With any of these tools, you can import the data, select variables for comparison and output, and look for relationships and trends. Whether the data collection tool itself has a built-in data dashboard or the information is linked to a visualization platform, ‘playing around’ with visualization techniques is a quick way to begin understanding what is happening in the factory. Any dashboard built into the tool should be able to produce three basic chart types: comparison/relationship (bar, stacked bar, line); distribution (scatterplot, histogram); composition (pie, doughnut). Even if elementary, the capacity to quickly visualize and glean preliminary insights about factory compensation data is important to building the muscles of brands and factories committed to improving compensation in the supply chain.
AnalyzeVisualization is the first step in making sense of data. For deeper analysis, one has to know what questions to ask. Statistical analysis and quantitative reasoning techniques will allow you to interrogate different trends and relationships that appear in charts and graphs. Arguably, the data analysis capabilities found in sourcing, finance, or operations teams can be applied to analyzing compensation data if grounded in the objective to locate inefficiencies and/or opportunities for enhancing labor productivity. Even though the Anker method asserts that overtime pay should not be included in wages for comparison to a living wage, analyzing the distribution of overtime hours can reveal important insights about how much workers are relying on overtime as a supplement to base wages. See Appendix for a list of starter questions to understand the data more deeply.
Living wage methodsThere is no easy way to cross-walk the factory's output format neatly with the categories of compensation called for in the Anker method. As not to get bogged down in precise valuations of different benefits, one approach is to oversimplify the value of different benefits in service of approximating living wage benchmarks. At this stage, the brand will need to embrace imperfect data measures in order to build out the back end computational intelligence of the tool. See Appendix for a recommendation on how to approach to the in-kind benefit challenge.

56 (S-LAB) | MIT SLOAN| PATAGONIA RECOMMENDATION
CREATE VALUE FOR THE FACTORY FOR LONG TERM BUY IN04
Competitive advantage A standardized data capture tool for living wage analytics would make it possible for suppliers to concretely measure and compare labor and fair compensation practices across contexts. One such advantage of this would be recognition for factories performing exceptionally. Factories with the capacity to quantify and validate their labor practices (beyond the scope of compliance auditing) are poised to stand out especially if the industry is able to provide incentives for living wage practices. Competition could seed a race not to the bottom, but toward better compensation.
Capacity buildingWhere a brand may have short term success coaxing an engaged supplier to pilot a tool and submit wage data, a long term strategy is needed to engage the rest of the brand’s suppliers. Suppliers are likely to see the living wage pilot exercise as a compliance task. To reset expectations and reimagine a more collaborative brand-supplier relationship, brands and supply chain management partners should consider how living wage statistical analysis can build a supplier’s operational capacity. Similar to the knowledge transfer that occurs when a supplier participates in Fair Trade programs or brand-sponsored trainings, living wage analysis methods could be deployed as a self-assessment tool or best practice that can lead toward concrete company goals.

57 (S-LAB) | MIT SLOAN| PATAGONIA RECOMMENDATION
ALIGN BRAND OPERATIONS WITH FAIR A COMPENSATION AGENDA05
Beyond CSRCorporate living wage initiatives cannot live in the social sustainability office forever. For a paradigm shift to occur in the industry, fair compensation principles must be adopted across all of a brand’s operations, including sourcing and marketing. Paying more for goods from suppliers and/or charging higher prices for sustainably produced goods does not automatically result in higher take home wages for workers. Accordingly, brands are inclined to imagine alternative approaches to increasing factories’ capacity to operate more efficiently. However, the inverse is also true: brands too have to analyze their capabilities and operations for opportunities to operationalize living wage standards in sourcing and leverage marketing tactics to broadly disseminate the principles and benefits of living wage sourcing. Further research is needed to substantiate the relationship between compensation levels and worker productivity and health and wellness outcomes. In the meantime, brands can utilize the living wage analytics collected from suppliers to begin understanding what correlations exist between various worker wage levels, outcomes, and productivity metrics.

58 (S-LAB) | MIT SLOAN| PATAGONIA RECOMMENDATION
GALVANIZE EXTERNAL PARTNERS06
Peer BrandsCoalitions amongst brands and consumers can be difficult to formulate. Research shows that consumers are often sustainably-minded, yet often fall short of consuming ‘sustainable’ products and services. Brands can be similar in the aspiration to source sustainably produced goods, but are often incentivized toward other more critical revenue benchmarks perceived to be in direct opposition to fair compensation. For small brands, influencing a factory in which they are a small share of overall business is challenging. However, what if a factory was interfacing with a coalition of like-minded brands and intermediate partners like the FLA, Fair Trade USA, or supply chain management companies all oriented toward a singular objective? One such scenario can be realized through living wage analytics certification. Living wage certification remains an under-realized opportunity for apparel manufacturing; industry-wide anonymized data collection by an intermediary might be one such opportunity to create an interface that creates value for a wide variety of supply chain actors. For this kind of alignment to occur, the industry needs a standardized methodology to rally around, otherwise the status quo will persist in spite of the efforts of individual engaged brands and suppliers.
Workers & Civil societyThe role of workers and civil society actors cannot be overstated. Historically, these groups have been mobilized to pressure brands to adopt better compliance and monitoring practices. Today, these groups continue to play an important role in monitoring and validating factory labor conditions. In the future, workers and civil society groups could be instrumental in helping to validate cost of living estimates, app-enabled paystub submission (for research and more robust validation of factory living wage data uploads), factory level living wage decision-making groups, and strengthening feedback loops with factory management. These groups are ripe for even deeper engagement. As the Fair Trade USA and Workers Rights Consortium models prove out, worker empowerment and organization is core to bringing about long-lasting change in factories.


60 (S-LAB) | MIT SLOAN| PATAGONIA
Source: Anker Method. Chapter 19.
Categories of In-Kind Benefits to include in Wagely Tool
● Housing and utilities such as water or electricity for home: Include when decent. Deduct co-pay. Maximum 15% of wages. Excludehousing for seasonal workers as they still need year around housing.
● Meals: Include. Deduct co-pay.
● Food rations or food commodities given for free or sold at concession rates: Include. Deduct co-pay.
● Transport to work and from work (and to town on weekends from agricultural estates): Include when safe.
● Child care/crèche: Include. For industry use average value over all workers.
● School for workers’ children: Include. For industry use average value over all workers.
● Meals in crèche or school: Include if paid for by employer. For industry use average over all workers
● Medical services not required by law and not related to work injuries and illnesses: Include. Need to determine cost per worker to employer.
● Private medical insurance: Include. Deduct co-pay.
● Medical expenses paid for treatment in other clinics and hospitals: Include. Need to determine cost per worker to employer.
● Transport to hospital/other health services: Include when for other than work-related problems. Need todetermine cost per worker to employer.
APPENDIX
ANKER METHOD DEFINITIONS

61 (S-LAB) | MIT SLOAN| PATAGONIA
Suggested analytical questions for preliminary data analysis
● Consider starting with simplifying the number of variables: gross wage (base, bonuses, overtime), total hours worked, worker type, and deductions.
● What percentage of workers’ base pay in the factory are below the Asia Floor Wage (AFL)? If not below, what percentage are workers above the AFL and by how much?
● What is the breakdown of gross wages (base wage, bonuses, overtime)? How does that compare to the value of deductions? What proportion of the gross wage is made up of bonus pay? Overtime?
● What is the distribution of bonuses for all workers? By worker type?● What is the distribution of overtime hours for all workers? By worker type?● Are there outliers? Are any workers making substantially more or less by
any measure than the majority of workers?● How many hours a week are workers working on average? For different
worker types?● Does this data include all workers in an establishment like managers or
apprentices? Is that information delineated in the data?
Suggested approach to the in-kind benefit challenge
● How to analyze in-kind benefits – given the tool’s overall objective to standardize supplier compensation data as a living wage output and enable comparison across-suppliers, looking across pilot supplier raw data for common data categories is an important step in concretely identifying what initial categories to limit the analysis to. It is intuitive to compare base wages across all factories, but much more difficult to compare one factory’s transportation benefit to another’s housing stipend. Using the Anker method guidance on in-kind benefits, look for the data categories that cut across all the raw data. Use those data points to a) generate aggregate benefit values where there are dollar amounts provided and b) subsequently compute as partial wage payments to be included in the living wage calculation.
● How to collect in-kind data from the factory – use the tool to collect Y/N answers to whether the factory provides an array of benefits. Where the answer is yes, prompt users to input how much was spent on that benefit in the previous fiscal year. A Y/N answer does not necessarily correlate to a per worker output, and not all suppliers explicitly calculate these as compensation inputs. Alternatively, they might calculate them as such and over or under value the benefit as a compensation input. It is not a perfect measure, but a Y/N is one confirmation that will allow you to compare various living wage method valuations of the particular benefit in that geographic context.
APPENDIX
RECOMMENDED APPROACHES TO MAKE SENSE OF THE DATA

62 (S-LAB) | MIT SLOAN| PATAGONIA APPENDIX
MARKET RESEARCH QUESTIONS: BRAND
Sample of market research questions for brands
1. What is most important to you about supply chain compensation in the long run?
2. If you were to fast forward two, five, ten years from now, what would you want to be true for the progress made in this work?
3. What data, if any, do you have about wages paid in the factories at this time?
4. Tell us about how you acquire this data (frequency, mode of transmission, contacts, whether you believe it’s reliable)?
5. Are there stark differences between sites when it comes to collecting this data?
6. What other fare wage work are you doing in the company? 7. Can you describe a little about how the process for data collection occurs
in general? It may also be helpful to know if and how that process is alike or dissimilar to the current task at hand (staff differences, third parties, collaborators, etc.).
8. Can you give us a sense of your relationship to FLA with this particular project and process?
9. Where have they been most helpful? What could be more helpful?
9. Given all FLA affiliates have committed to this process, are you aware of any peers who have progressed beyond the ‘taking stock’ phase?
10. Do you have peers who have gained traction in the area of collecting more detailed information from their supply-chain?
11. Does FLA facilitate any useful knowledge-sharing between peers who have begun experimenting with various strategies for increasing wages in the supply chain?

63 (S-LAB) | MIT SLOAN| PATAGONIA APPENDIX
MARKET RESEARCH QUESTIONS: SUPPLIER
Sample of market research questions for suppliers
1. Do you have a data backbone? 2. What are the sources and uses of data? 3. Can you talk a bit more about your current data architecture? 4. Are there standardized formats, common toolsets, defined interface
controls, and preferred algorithms or metrics? 5. Revenue generated from their fair-trade products has increased the
workers wages by X%? How do you know this information? 6. Do you accept the FLA standard to be true? 7. What is your understanding of living wages? Is there a need to
calculate an alternative?

64 (S-LAB) | MIT SLOAN| PATAGONIA
InterviewsArguello, Remedios “Remy”. Personal interview. 21 March 2017
Chan, Harvey. Personal Interview. 30 March 2017
Cheng, Eric. Personal interview. 17 March 2017
Choi, Che. Personal interview. 22 March 2017.
Hodge, Donnie. Personal interview. 10 May 2017 Alta Gracia
Nguyen, Anh. Personal interview. 21 March 2017
Shao, Shirley. Personal interview. 12 April 2017
Not QuotedBlyth, Amy. Personal interview. 24 March 2017.
Living Wage Definition (Slide 7) Fair Compensation Work Plan: Fair Labor Association 2015.
Workers Rights Commission (Slide 15)Global Wage Trends for Apparel Workers: Workers Rights Commission. July 2015.
Fair Labor Association - Partnerships (Slide 24)Participating Companies. <http://www.fairlabor.org/affiliates/participating-companies>
ContactedRemedios “Remy”Arguello – Adidas
Amy Blythe – Fair Trade USA, Partnership Development Manager
Harvey Chan – Fair Labor Association, Chief of Accountability &
Innovation
Eric Cheng – Patagonia Field Manager China
Donnie Hodge – Alta Gracia, CEO
Anh Nguyen – MXP, Head of Compliance Department
Bernard Kwok – Young One Factory Manager (Correspondence)
Shirley Shao – NC Accessory (Correspondence)
Chau Diep – Patagonia Field Manager in Vietnam (No Show) Alpay
Celikel – Fair Labor Association Regional Manager – (No Show)
APPENDIX
BIBLIOGRAPHY

65 (S-LAB) | MIT SLOAN| PATAGONIA
Image CreditsSlide 1 Image. Patagonia Logo. <http://www.cloudbasemayhem.com/wp-content/uploads/2015/10/Patagonia_Provisions_Vector.png>
Slide 5 Image. <https://www.adventureapparel.us/pages/patagonia>
Slide 6 Image. Patagonia Factory. <http://www.patagonia.com/static/on/demandware.static/-/Library-Sites-PatagoniaShared/default/dw63be551d/images/environmentalism/1105x622_DSCN0024.jpg>
Slide 8 Image. Patagonia Factory. <http://www.patagonia.com/static/on/demandware.static/-/Library-Sites-PatagoniaShared/default/dw35a82de7/images/corp-responsibilty/1105x622_factories-2_F14.jpg>
Slide 9 Image. Patagonia Factory FLA Tool Screenshot.
Slide 16 Image. Tableau logo. <www.tableau.com>
Slide 21 Image. <http://www.fasttrackpromotion.com/about/>
Slide 22 Image. <http://www.helencouchman.com/wp-content/uploads/2009/08/Factory-owner-K-K-Wong.jpg>
Slide 23 Image. <https://static1.squarespace.com/static/535ae1f7e4b0d43c82387e3e/536163e2e4b04569e722434a/ 57fbd174e6f2e136830f3e0a/1476148553300/davis_t_1865.jpg?format=1500w>
Slide 24 Image. <https://ak9.picdn.net/shutterstock/videos/13965929/thumb/1.jpg>
APPENDIX
Image Credits