table of contents - flint riverflintriver.org/.../fr-green-notebook-031411-edits-copy.docx · web...
TRANSCRIPT

Flint River GREEN Notebook www.FlintRiver.org February, 2011 Version
Section One: Introduction to Flint River GREEN
a. GREEN (Global Rivers Environmental Education Network)The impetus for GREEN began in the spring of 1984 with a group of concerned students at a high school located along the polluted Huron River in Ann Arbor, Michigan. Their teacher contacted Dr . William Stapp at the University of Michigan, and together they developed a comprehensive educational program called GREEN.
The idea quickly caught on and the experience gained with schools along the Huron River set the stage for an expanded program on the Rouge River in 1987- part of an effort to improve education and the environment in metropolitan Detroit. The educational model moved to other watersheds around the Great Lakes in the U.S. and Canada.
By the end of the 1980's at the University of Michigan, Dr. William Stapp and one of his assistants, Mark Mitchell, had developed a program called Global Rivers Environmental Educational Network or GREEN. The vision of the program was to teach students the protocols of water quality monitoring, have the students monitor a stream, and share their data with other students doing the same thing at distant locations. It was believed that those learned skills would help maintain and improve water quality worldwide.
In 1990, General Motors funded the Flint Community Schools participation in Project GREEN. Five Flint teachers volunteered. By 1994 the program expanded to include suburban schools.
Now referred to as Flint River GREEN, the program has grown from approximately 100 students in 1990 to an excess of 1,600 in 2010. The ideal is for all students to test their specific sampling sites along the Flint River Watershed on the same day to conduct an analysis. The data gives a snapshot of the health of the river at that moment. As each year is added, comparisons can be made about the quality of the water running through the watershed over time.
b. Flint River Watershed Coalition Flint River GREEN is one of the educational programs coordinated by the Flint River Watershed Coalition (FRWC) planning committee and serves as the Fiduciary for Flint River GREEN. The FRWC overall mission is: Partnering to Protect, Preserve, and Improve the Flint River Watershed. The Flint River Watershed is increasingly healthy and strong, and offers many recreational, educational, and environmental opportunities. As the leading community-based advocate for clean water resources, the Flint River Watershed Coalition (FRWC) promotes efforts to protect, preserve, and improve our area’s ecosystem through partnership, public education, scientific projects, and community involvement.
We are an organization representing individuals, businesses, community organizations, and local units of government sharing a vision of a healthier Flint River Watershed. We envision a day when the future of our drinking water is secure and the integrity of the Flint River is protected. We believe that all people should have access to the river for
S e c t i o n 1 Page 1 of 114

Flint River GREEN Notebook www.FlintRiver.org February, 2011 Version
recreation, swimming, and fishing as well as the economic value it provides to our communities.
www . FlintRiver . org
c. Earth ForceEarth Force engages young people as active citizens who improve the environment and their communities now and in the future. Earth Force believes that now is the time to foster a scientifically capable and civically engaged populace. Through Earth Force young people get hands-on, real-world opportunities to practice civic skills, acquire and understand environmental knowledge, and develop the skills and motivation to become life-long leaders in addressing environmental issues.
Earth Force achieves these results by training and supporting educators as they implement our unique six-step model for engaging young people. Thanks to 10 years of rigorous evaluation, we know that our model positions young people to use their creativity and passion to play a meaningful role in environmental decision-making.
Earth Force knows that little can be accomplished by working alone. To meet our goals, Earth Force partners with businesses, schools, community-based organizations and civic leaders nationwide.
www . earthforce . org
d. STEM ProgramSTEM is an acronym for Science, Technology, Engineering, and Mathematics and refers to education in one or more of these disciplines. There has been a concern over the past several years of a decline in STEM education the United States. In the new global economy, an education with a STEM focus is a vital step towards providing citizens with the needed skills and technological familiarity that will enable them to take part in the exciting economies of the future. This is also a fertile area where service-learning can flourish and help bring the broadest array of students as possible into the modern workforce. There is a concerted effort by our nation's educators to encourage STEM studies that will enable students to actively engage in the knowledge-economy and to give many more youth from disadvantaged circumstances STEM service-learning opportunities. Educators are also seeking to promote STEM study by America's students, especially those from underrepresented groups, including minority, women, and disadvantaged students. Successful STEM service-learning programs are those that seek out these communities and provide student participants with the opportunity to:
● Use the knowledge and skills of one or more STEM discipline(s) to identify and address community problems;
● Collaborate with peers and community members to set and achieve goals; and
● Develop skills and attitudes useful for the workplace and for participating in civic affairs.
S e c t i o n 1 Page 2 of 114

Flint River GREEN Notebook www.FlintRiver.org February, 2011 Version
e. MSU Extension – 4-H Youth Development
Michigan State University Extension (MSUE) helps people improve their lives through an educational process that applies knowledge to critical issues, needs and opportunities.
Since its beginning, Michigan State University Extension has focused on bringing knowledge-based educational programs to the people of the state to improve their lives and communities. Today, county-based staff members, in concert with on-campus faculty members, serve every county with programming focused on agriculture and natural resources; children, youth and families; and community and economic development.
Michigan 4-H'ers are exploring science, engineering and technology programs; becoming youth entrepreneurs; serving as peer mentors; experiencing environmental and outdoor education opportunities; building leadership skills and serving in their communities; pursuing global and cultural education experiences; and more! Flint River GREEN is a part of the 4-H experience in Genesee County.
f. School Administration Letter Dear School Administrator,
I would like to personally thank you for your continued support of the Flint River GREEN program in your district. Each year, your student’s gain real world experience in the scientific method, water quality testing methods, and critical thinking. Many also have the opportunity to attend our Student Summit, a real world professional conference where they gain skills in creating and giving presentations, meet with their peers from across the watershed, and learn from environmental professionals working in fields as varied as automotive environmental engineers to beekeepers. At the end of every student summit, we solicit feedback from your students. Without fail, students report great enjoyment in their participation in GREEN, and leave with a new sense of appreciation for their local stream and the role they can play in efforts to protect, preserve, and improve their watershed.
In addition to serving as a valuable learning opportunity for your students, Flint River GREEN helps satisfy your district’s required compliance with current NPDES Phase II regulations. As you may recall, the Federal Clean Water Act requires municipalities to obtain storm water permits under the National Pollution Discharge Elimination System (NPDES) permit program. Phase II of the program brought all Michigan municipalities into the program, at which point many municipalities asked the Genesee County Drain Commissioner to coordinate permit compliance efforts on their behalf. In 2001 the Genesee County Board of Commissioners designated the Genesee County Drain Commissioner the County Agency under Act 432 of 1939 for the purpose of storm water management. The communities and school districts of Genesee County entered into a contract with the County to jointly develop and obtain the required permits.
S e c t i o n 1 Page 3 of 114

Flint River GREEN Notebook www.FlintRiver.org February, 2011 Version
All Genesee County school districts, with the exception of Montrose and Goodrich, are part of the current agreement.
In cooperation with the Drain Office, we are pleased to provide this service to your district, and look forward to continuing to work with you in this regard.
I invite you to show your support of students’ and teachers’ efforts by attending the April water quality testing and/or the Student Summit in May. You can contact FRWC’s GREEN program coordinator Suzanne Lossing at 810-767-9491 or [email protected] for times and locations.
2011 Flint River GREEN Program DatesFebruary 4, 2011 GREEN Professional Development and Water Quality Inquiry
April 22, 2011 Targeted Water Quality Test Day (dates may vary)
May 13, 2011 Student Summit
A key aspect to the success of this program has been your encouragement and provision of busing and substitutes for your participating classrooms. Thank you!
I’ve attached a report covering the success of our 2009 GREEN program. I hope you enjoy the overview this report provides, and see the broad support our community has for bringing this program to your district. If you have any questions about Flint River GREEN, Phase II, or your district's school’s participation in the program, please do not hesitate to contact me at 810-767-9559 or [email protected].
Sincerely,
Rebecca FedewaExecutive Director
g. Program SponsorsFinancial Supporters
Genesee County Drain Commission
Genesee County Intermediate School District
Lapeer County Intermediate School District
General Motors
Royal Bank of Canada
Raymond C. and Anne T. Johnson Family Foundation
In-kind Goods and Services
City of Flint, Water Pollution Control Department
Donna’s Donuts
Earth Force
S e c t i o n 1 Page 4 of 114

Flint River GREEN Notebook www.FlintRiver.org February, 2011 Version
Environmental Solutions
Flint River Watershed Coalition
Genesee County Drain Commission
Genesee County Intermediate School District
Lapeer County Intermediate School District
General Motors
Michigan State University Extension
Mott Community College, Science and Math Department
University of Michigan, Flint; Center for Applied Environmental Research
h. Flint River GREEN Objectives1. Give youth exposure to “real world” science and demonstrating how science
learned in the classroom can be applied.
2. Provide high quality data to decision makers so they can better manage the water resources in the Flint River Watershed.
3. Give youth the information and skills needed to make positive change in their environment and community.
4. Expose youth to careers in the environmental and natural resources field.
5. Educate the public about the water quality in the Flint River.
6. Improve perception of the Flint River and its tributaries.
i. FRWC Education Committee (FR GREEN Committee) Darren Bagley - Michigan State University Extension; 4-H Youth Development
Programs
Larry Casler - GISD
James Emmerling - LISD
Rebecca Fedewa - Flint River Watershed Coalition
Eric Hakel - Environmental Science Solutions
Cheryl Hobson - Retired, Bentley Schools
Sue Lossing - Flint River Watershed Coalition
John Maksimchuk III - General Motors
Ashley Miller-Helmholdt – Earth Force
John Moldovan - Retired, General Motors
Bill Welch, Retired, Genesee Intermediate School District
S e c t i o n 1 Page 5 of 114

Flint River GREEN Notebook www.FlintRiver.org February, 2011 Version
S e c t i o n 1 Page 6 of 114

Flint River GREEN Notebook www.FlintRiver.org February, 2011 Version
Section Two: Mentors a. Who are Mentors?Mentors are real people who can be a tremendous asset to the teacher, and result in a wonderful experience for the teacher, mentor and students. Mentors help conduct planning and work with the teacher to ensure that the field testing is performed properly and safely, and that the collected data is valid and reported. Initially, most mentors were GM and Delphi engineers. However, today the mentor network is composed of a wide range of highly qualified individuals, each with significant training to support the teacher. New mentors are added each year and they provide new energy and support to the GREEN program, just like the seasoned veterans. Finally, the mentor helps the students by functioning as a bridge from the school to working in today’s society, providing them encouragement with staying in school and seeking a rewarding career.
b. Timeline for Teachers and Mentor InteractionsThe following is a summary of key GREEN events and responsibilities for the Teacher and Mentor:
Mentors are Matched-up with Teachers: Once the Teachers are confirmed to participate in the program, which normally happens in November and December, the GREEN Planning Committee members will match up teachers and mentors during January and February. Returning teachers and mentors can, but do not have to request the same pairing from last year. If so, that becomes a priority. The FRWC will email teachers the contact information (name, email, and phone number) of their assigned mentor
Teachers Contact their Mentor: Teachers should make the initial contact with their mentor as soon as possible during February. All mentors work with the program as volunteers, and we want to ensure their time and skills are used wisely. It is very important the teacher contact their mentor in a timely manner to avoid scheduling conflicts, assessing your mentor’s talents to better fit him/her into your lesson planning, and/or potential reassignment of mentors.
Teachers and Mentors Attend the GREEN Workshop(s): Usually two workshops sponsored by the FRWC are normally conducted in February/March. The first is for new teachers and the training is focused on the test methods but also covers the overall GREEN program. This first workshop lasts about four hours. The second workshop lasts about six hours and is for all GREEN participants and provides an opportunity for personal interaction between teachers and mentors. Mentors need not attend the first workshop if they are confident in the testing methods and have made contact with their teacher. All teachers and mentors should plan on attending the second workshop.
Teachers Invites the Mentor into the Classroom: Teachers shall invite their mentor into the classroom prior to the field sampling program which generally occurs in late April. Mentors discuss their professional experience and walk the classroom through the GREEN testing, discussing such things as what the tests measure, what they might expect at the stream, etc. Mentors may desire to show a presentation
S e c t i o n 2 Page 7 of 114

Flint River GREEN Notebook www.FlintRiver.org February, 2011 Version
(Powerpoint) or simply talk to the students and answer questions. There are several reasons for this meeting:
o Students get an opportunity to meet their mentor and ask questions.
o Teachers inform their mentors of the sampling day and time the class will arrive at the sampling site
o Teachers and mentors discuss logistics of the testing and safety equipment prior to going out to the river
o Teachers ask their mentor if they will deliver water samples taken during the field testing to the GISD for determining Total Solids and Phosphate.
Mentor Assists Teacher in the Field Testing: Mentors will assist in the field testing in late April. Mentors shall NOT perform any of the tests for the students, but rather help students with understanding testing principles and directions. Mentors will ensure that the tests are conducted using good housekeeping and safety, and keep cognizant for severe weather. Mentors will audit student activities and ask questions of the students. Periodically the mentor shall communicate with the teacher on the field progress or problems encountered with the field work or weather conditions. Finally, mentors can assist the teacher by delivering the water samples for Total Solids and Phosphates to the City of Flint (or GISD) and GM Truck Assembly.
Teacher Invites Mentor to Return to the Classroom: Teachers should invite mentors to return to the classroom within 5-10 days after the field event to help with reviewing the collected data and to determine what information to report to the FRWC in the online data tracking program. This Quality Assurance check of the data is extremely important. At this time, mentors also can help review any problems or issues that happened during the field program and/or work with the classroom on their Student Summit presentation.
Teacher and Mentor Attend Summit: The Student Summit is normally held the middle part of May. At this event, students make their presentations and present their findings. Normally, students give a 5-10 minute PowerPoint presentation that highlights their field efforts. The mentor is highly encouraged to attend the Summit, joining the teacher and students. More details are in the Summit section of this notebook.
c. Importance of MentorsAside from the technical support of the program, mentors often bring many other valuable assets to the classroom:
Career Exploration: The mentor provides a career link to the students by encouraging students to complete high school and further their education. This discussion is normally covered during the mentor’s first visit to the classroom, prior to the field testing. Mentors also can identify the wide variety of potential employers to the students, such as industry, government, and consulting firms that specialize in environmental programs.
S e c t i o n 2 Page 8 of 114

Flint River GREEN Notebook www.FlintRiver.org February, 2011 Version
Helping Make Science Real: Is your mentor’s job one that requires them to manage or test various samples of water for pollutants as part of their day-to-day job? Does your mentor use science as a part of his or her job? What role does science play in your mentor’s career? Mentors can bring the GREEN experience to life for students by relating the need and actual use of the tests they are conducting, the real world use of the data, and how many fun and satisfying careers start with a science background. Many mentors have experience on how polluted water can be cleaned up and reused. These typical points can be covered when the mentor visits the classroom prior to the testing program.
Positive Adult Role Model: A mentor has the opportunity to interact with students on a fairly informal basis. Students gain an approachable adult who is willing and able to talk with them about the program and their career aspirations. Students are exposed to life experiences and career options that they otherwise might never learn about, and can experience firsthand the results of furthering their education. One of the goals of GREEN is to expose youth to careers in the environmental and natural resources field.
Assisting Teachers With Outside Communication Needs: Mentors can help teachers with problems, questions or other concerns that may require contacts and communications from outside the classroom. For example, the mentor may contact the FRWC or LaMotte for clarification of a testing procedure. For many of these issues or questions, the teacher does not have time to pursue or it may be outside of his or her expertise. The Mentors are a valuable resource for teachers. Keep in mind that the Teacher-Mentor relationship does not have to end at the Summit meeting. In fact, many mentors continue to be in contact with their teachers throughout the year, giving both the teacher and mentor running start for the next GREEN program.
d. Inquiry Training Suchman Inquiry Training Model - This model is designed to assist students in developing the skills required to raise questions and seek out answers stemming from their curiosity.
Steps: The five steps involved in this model are as follows:
1. The teacher presents students with a puzzling situation or event. Students are allowed to ask the teacher questions that must be answered by a “yes” or “no”. The purpose of this phase is to verify the facts. A good example of a use of this in GREEN would be, “Is this water safe to swim in?”
2. Students next gather information and verify the occurrence of the puzzling situation. Students could use data, such as fecal coliform test results, to determine if the water is safe.
3. Students identify relevant variables, hypothesize and test causal relationships. Where is the fecal coliform coming from? What could be done to prevent it?
4. Next, the teacher asks students to organize the data and formulate an explanation for the puzzle.
5. Finally, students analyze their pattern of inquiry and propose improvements. What additional information do we need?
S e c t i o n 2 Page 9 of 114

Flint River GREEN Notebook www.FlintRiver.org February, 2011 Version
Resources: http://www.excel.net/~ssmith/models.htmlJoyce, B., Weil, M., Showers, B. (1992). Models of teaching. Boston: Allyn and Bacon.
e. How to talk to youth
Talking to middle school age youth (7th and 8th graders or 12-14 year olds)Young teens move from concrete to more abstract thinking during this time. They still tend to think in all-or-nothing terms, however. If a subject is of interest, it will be intensely explored. Readymade solutions from adults often are rejected in favor of the young teens finding solutions on their own. Adults who can provide supervision without interference can have a great influence on these youth. If an adult respected, his or her opinion will be highly valued by young teens.
Small groups provide an opportunity for young teens to test ideas. Young teens can be very self-conscious, and a smaller group usually is less intimidating.
As they start to deal with abstract ideas and values, justice and equality become important issues for the early teens.
Rather than the adult recognition sought earlier, young teens now seek peer recognition. This period seems to present the biggest challenge to a young person's self concept. So many changes occur, everything from entering a new school to developing a new and unfamiliar body that young people hardly know who they are.
Talking to high school age youth (9th - 12th graders or 14-17 year olds)Adolescents are beginning to be able to think about the future and make realistic plans. Because they are mastering abstract thinking, they can imagine things that never were in a way that challenges, and sometimes threatens, many adults. They still have difficulty understanding compromise, however, and may label adult efforts to cope with the inconsistencies of life as "hypocrisy."
As teens think about the future, tomorrow's vocational goal influences today's activities. The teen years are a time of exploration and preparation for future careers. The teens set goals based on feelings of personal need and priorities. Any goals set by others are apt to be rejected. Conversations with college students and adults working in a wide variety of fields can assist teens with making education and career decisions.
The middle years of adolescence are a time when teens can initiate and carry out their own tasks without supervision. Advanced divisions of projects, requiring research and creativity, give teens the opportunity to demonstrate to themselves and others how much they have learned and how much they can accomplish on their own.
At this stage adolescents would be capable of understanding much of what other people feel-if they were not so wrapped up in themselves. Relationship skills are usually well-developed, however, and friendships formed at this stage are often sincere, close, and long-lasting. Recreation continues to move away from the family and now additionally away from the large group. Middle teens are learning to cooperate with others on an adult level. Time is precious. If programs are filled with "busy work" or meaningless activities, teens soon will lose patience and interest.
S e c t i o n 2 Page 10 of 114

Flint River GREEN Notebook www.FlintRiver.org February, 2011 Version
References:
Ages and Stages of Child and Youth Development: A Guide for 4-H Leaders
Jeanne Karns, Graduate Assistant, and Judith A. Myers-Walls, Extension Specialist, Human Development
Department of Child Development and Family Studies, Purdue University
f. Sample Presentations for Mentors Is available online at:
https :// docs . google . com / present / edit ? id =0 AfcPOyAgvNYXZGNwcnRxcDZfMzBkZDlqaDVmeA & hl = en & authkey = CJjto 2 Y
S e c t i o n 2 Page 11 of 114

Flint River GREEN Notebook www.FlintRiver.org February, 2011 Version
S e c t i o n 3 Page 12 of 114

Flint River GREEN Notebook www.FlintRiver.org February, 2011 Version
Section Three: BEFORE River Activities
FRWC is supportive of teachers’ and mentors’ efforts to conduct a successful learning experience for students. Proper resources and adequate planning is needed in order for teachers, students, and mentors to gain the most from this real-life learning experience.
Each year the FRWC Education Committee carefully plans for the needs of FRG Teachers and Mentors. While materials are provided and training is offered along with Professional Development for all teachers and mentors, the participants of this program provide valuable insight for us all. We have a wonderful group of insightful teachers and mentors and their input is appreciated. Their experiences are often shared at the professional development and we plan to add their helpful information to this notebook.
a. Curriculum Benchmarks and Standards8th Grade EARTH SCIENCE (January, 2007) Flint River GREEN Program
StandardE1
INQUIRY, REFLECTION, AND SOCIAL IMPLICATIONS
Statement E1.1
Scientific InquiryScience is a way of understanding nature. Scientific research may begin by generating new scientific questions that can be answered through replicable scientific investigations that are logically developed and conducted systematically. Scientific conclusions and explanations result from careful analysis of empirical evidence and the use of logical reasoning. Some questions in science are addressed through indirect rather than direct observation, evaluating the consistency of new evidence with results predicted by models of natural processes. Results from investigations are communicated in reports that are scrutinized through a peer review process.
E1.1A Generate new questions that can be investigated in the laboratory or field.E1.1B Evaluate the uncertainties or validity of scientific conclusions using an understanding of
sources of measurement error, the challenges of controlling variables, accuracy of data analysis, logic of argument, logic of experimental design, and/or the dependence on underlying assumptions.
E1.1C Conduct scientific investigations using appropriate tools and techniques (e.g., selecting an instrument that measures the desired quantity—length, volume, weight, time interval, temperature—with the appropriate level of precision).
E1.1D Identify patterns in data and relate them to theoretical models.E1.1E Describe a reason for a given conclusion using evidence from an investigation.E1.1f Predict what would happen if the variables, methods, or timing of an investigation were
changed.E1.1g Use empirical evidence to explain and critique the reasoning used to draw a scientific
conclusion or explanation.E1.1h Design and conduct a systematic scientific investigation that tests a hypothesis. Draw
conclusions from data presented in charts or tables.E1.1i Distinguish between scientific explanations that are regarded as current scientific consensus
and the emerging questions that active researchers investigate.Statement E1.2
Scientific Reflection and Social ImplicationsThe integrity of the scientific process depends on scientists and citizens understanding and respecting the “Nature of Science.” Openness to new ideas, skepticism, and honesty are attributes required for good scientific practice. Scientists must use logical reasoning during investigation design, analysis, conclusion, and communication. Science can produce critical insights on societal problems from a personal and local scale to a global scale. Science both aids in the development of technology and provides tools for assessing the costs, risks, and benefits of technological systems. Scientific conclusions and arguments play a role in personal
S e c t i o n 3 Page 13 of 114

Flint River GREEN Notebook www.FlintRiver.org February, 2011 Version
choice and public policy decisions. New technology and scientific discoveries have had a major influence in shaping human history. Science and technology continue to offer diverse and significant career opportunities.
E1.2A Critique whether or not specific questions can be answered through scientific investigations.E1.2B Identify and critique arguments about personal or societal issues based on scientific evidence.E1.2C Develop an understanding of a scientific concept by accessing information from multiple
sources. Evaluate the scientific accuracy and significance of the information.E1.2D Evaluate scientific explanations in a peer review process or discussion format.E1.2E Evaluate the future career and occupational prospects of science fields.E1.2f Critique solutions to problems, given criteria and scientific constraints.E1.2g Identify scientific tradeoffs in design decisions and choose among alternative solutions.E1.2h Describe the distinctions between scientific theories, laws, hypotheses, and observations.E1.2i Explain the progression of ideas and explanations that leads to science theories that are part
of the current scientific consensus or core knowledge.E1.2j Apply science principles or scientific data to anticipate effects of technological design
decisions.E1.2k Analyze how science and society interact from a historical, political, economic, or social
perspective.Standard E4
THE FLUID EARTH
Statement E4.p1
Water Cycle (prerequisite)Water circulates through the crust and atmosphere and in oceans, rivers, glaciers, and ice caps and connects all of the Earth systems. Groundwater is a significant reservoir and source of freshwater on Earth. The recharge and movement of groundwater depends on porosity, permeability, and the shape of the water table. The movement of groundwater occurs over a long period time. Groundwater and surface water are often interconnected. (prerequisite)
E4.p1A Describe that the water cycle includes evaporation, transpiration, condensation, precipitation, infiltration, surface runoff, groundwater, and absorption. (prerequisite)
E4.p1BAnalyze the flow of water between the elements of a watershed, including surface features (lakes, streams, rivers, wetlands) and groundwater. (prerequisite)
E4.p1C Describe the river and stream types, features, and process including cycles of flooding, erosion, and deposition as they occur naturally and as they are impacted by land use decisions. (prerequisite)
E4.p1D Explain the types, process, and beneficial functions of wetlands.Statement E4.1
HydrogeologyFresh water moves over time between the atmosphere, hydrosphere (surface water, wetlands, rivers, and glaciers), and geosphere (groundwater). Water resources are both critical to and greatly impacted by humans. Changes in water systems will impact quality, quantity, and movement of water. Natural surface water processes shape the landscape everywhere and are affected by human land use decisions.
E4.1A Compare and contrast surface water systems (lakes, rivers, streams, wetlands) and groundwater in regard to their relative sizes as Earth’s freshwater reservoirs and the dynamics of water movement (inputs and outputs, residence times, sustainability).
E4.1B Explain the features and processes of groundwater systems and how the sustainability of North American aquifers has changed in recent history (e.g., the past 100 years) qualitatively using the concepts of recharge, residence time, inputs, and outputs.
E4.1C Explain how water quality in both groundwater and surface systems is impacted by land use decisions.
10th Grade BIOLOGY (January, 2007) Flint River GREEN
StandardB1
INQUIRY, REFLECTION, AND SOCIAL IMPLICATIONS
Statement B1.1 Scientific Inquiry
S e c t i o n 3 Page 14 of 114

Flint River GREEN Notebook www.FlintRiver.org February, 2011 Version
Also E1.1 Science is a way of understanding nature. Scientific research may begin by generating new scientific questions that can be answered through replicable scientific investigations that are logically developed and conducted systematically. Scientific conclusions and explanations result from careful analysis of empirical evidenceand the use of logical reasoning. Some questions in science are addressed through indirect rather than direct observation, evaluating the consistency of new evidence with results predicted by models of natural processes. Results from investigations are communicated in reports that are scrutinized through a peer review process.
B1.1A Generate new questions that can be investigated in the laboratory or field.B1.1B Evaluate the uncertainties or validity of scientific conclusions using an understanding of
sources of measurement error, the challenges of controlling variables, accuracy of data analysis, logic of argument, logic of experimental design, and/or the dependence on underlying assumptions.
B1.1C Conduct scientific investigations using appropriate tools and techniques (e.g., selecting an instrument that measures the desired quantity—length, volume, weight, time interval, temperature—with the appropriate level of precision).
B1.1D Identify patterns in data and relate them to theoretical models.B1.1E Describe a reason for a given conclusion using evidence from an investigation.B1.1f Predict what would happen if the variables, methods, or timing of an investigation were
changed.B1.1g Use empirical evidence to explain and critique the reasoning used to draw a scientific
conclusion or explanation.B1.1h Design and conduct a systematic scientific investigation that tests a hypothesis. Draw
conclusions from data presented in charts or tables.B1.1i Distinguish between scientific explanations that are regarded as current scientific consensus
and the emerging questions that active researchers investigate.Statement B1.2
Also E1.2
Scientific Reflection and Social ImplicationsThe integrity of the scientific process depends on scientists and citizens understanding and respecting the “Nature of Science.” Openness to new ideas, skepticism, and honesty are attributes required for good scientific practice. Scientists must use logical reasoning during investigation design, analysis, conclusion, and communication. Science can produce critical insights on societal problems from a personal and local scale to a global scale. Science both aids in the development of technology and provides tools for assessing the costs, risks, and benefits of technological systems. Scientific conclusions and arguments play a role in personal choice and public policy decisions. New technology and scientific discoveries have had a major influence in shaping human history. Science and technology continue to offer diverse and significant career opportunities.
B1.2A Critique whether or not specific questions can be answered through scientific investigations.B1.2B Identify and critique arguments about personal or societal issues based on scientific
evidence.B1.2C Develop an understanding of a scientific concept by accessing information from multiple
sources. Evaluate the scientific accuracy and significance of the information.B1.2D Evaluate scientific explanations in a peer review process or discussion format.B1.2E Evaluate the future career and occupational prospects of science fields.B1.2f Critique solutions to problems, given criteria and scientific constraints.B1.2g Identify scientific tradeoffs in design decisions and choose among alternative solutions.B1.2h Describe the distinctions between scientific theories, laws, hypotheses, and observations.B1.2i Explain the progression of ideas and explanations that leads to science theories that are
part of the current scientific consensus or core knowledge.B1.2j Apply science principles or scientific data to anticipate effects of technological design
decisions.B1.2k Analyze how science and society interact from a historical, political, economic, or social
perspective.Standard B2 Organization and Development of Living SystemsStatement B2.3 Maintaining Environmental Stability
The internal environment of living things must remain relatively constant. Many systems work together to maintain stability. Stability is challenged by changing physical, chemical,
S e c t i o n 3 Page 15 of 114

Flint River GREEN Notebook www.FlintRiver.org February, 2011 Version
and environmental conditions as well as the presence of disease agents.B2.3A Describe how cells function in a narrow range of physical conditions, such as temperature
and pH (acidity), to perform life functions.B2.3B Describe how the maintenance of a relatively stable internal environment is required for the
continuation of life.B2.3C Explain how stability is challenged by changing physical, chemical, and environmental
conditions as well as the presence of disease agents.
Standard B3 INTERDEPENDENCE OF LIVING SYSTEMS AND THE ENVIRONMENTStatement L3.p1 Populations, Communities, and Ecosystems (prerequisite)
Organisms of one species form a population. Populations of different organisms interact and form communities. Living communities and the nonliving factors that interact with them form ecosystems. (prerequisite)
L3.p1A Provide examples of a population, community, and ecosystem. (prerequisite)Statement L3.p2 L3.p2 Relationships Among Organisms (prerequisite)
Two types of organisms may interact with one another in several ways; they may be in a producer/consumer, predator/prey, or parasite/host relationship. Or one organism may scavenge or decompose another. Relationships may be competitive or mutually beneficial. Some species have become so adapted to each other that neither could survive without the other. (prerequisite)
L3.p2A Describe common relationships among organisms and provide examples of producer/consumer, predator/ prey, or parasite/host relationship. (prerequisite)
L3.p2B Describe common ecological relationships between and among species and their environments (competition, territory, carrying capacity, natural balance, population, dependence, survival, and other biotic and abiotic factors). (prerequisite)
L3.p2C Describe the role of decomposers in the transfer of energy in an ecosystem. (prerequisite)
L3.p2D Explain how two organisms can be mutually beneficial and how that can lead to interdependency. (prerequisite)
Statement L3.p3 Factors Influencing Ecosystems (prerequisite)The number of organisms and populations an ecosystem can support depends on the biotic resources available and abiotic factors, such as quantity of light and water, range of temperatures, and soil composition. (prerequisite)
L3.p3A Identify the factors in an ecosystem that influence fluctuations in population size. (prerequisite)
L3.p3B Distinguish between the living (biotic) and nonliving (abiotic) components of an ecosystem. (prerequisite)
L3.p3C Explain how biotic and abiotic factors cycle in an ecosystem (water, carbon, oxygen, and nitrogen). (prerequisite)
L3.p3D Predict how changes in one population might affect other populations based upon their relationships in a food web. (prerequisite)
Statement L3.p4 Human Impact on Ecosystems (prerequisite)\All organisms cause changes in their environments. Some of these changes are detrimental, whereas others are beneficial. (prerequisite)
L3.p4A Recognize that, and describe how, human beings are part of Earth’s ecosystems. Note that human activities can deliberately or inadvertently alter the equilibrium in ecosystems. (prerequisite)
S e c t i o n 3 Page 16 of 114

Flint River GREEN Notebook www.FlintRiver.org February, 2011 Version
Standard B3 INTERDEPENDENCE OF LIVING SYSTEMS AND THE ENVIRONMENTStatement B3.3 Element Recombination
As matter cycles and energy flows through different levels of organization of living systems—cells, organs, organisms, and communities—and between living systems and the physical environment, chemical elements are recombined in different ways. Each recombination results in storage and dissipation of energy into the environment as heat. Matter and energy areconserved in each change.
B3.3A Use a food web to identify and distinguish producers, consumers, and decomposers and explain the transfer of energy through trophic levels.
B3.3b Describe environmental processes (e.g., the carbon and nitrogen cycles) and their role in processing matter crucial for sustaining life.
Statement B3.4 Changes in EcosystemsAlthough the interrelationships and interdependence of organisms may generate biological communities in ecosystems that are stable for hundreds or thousands of years, ecosystems always change when climate changes or when one or more new species appear as a result of migration or local evolution. The impact of the human species has major consequences for other species.
B3.4A Describe ecosystem stability. Understand that if a disaster such as flood or fire occurs, the damaged ecosystem is likely to recover in stages of succession that eventually result in a system similar to the original one.
B3.4B Recognize and describe that a great diversity of species increases the chance that at least some living organisms will survive in the face of cataclysmic changes in the environment.
B3.4C Examine the negative impact of human activities.Statement B3.4x Human Impact
Humans can have tremendous impact on the environment. Sometimes their impact is beneficial, and sometimes it is detrimental.
B3.4d Describe the greenhouse effect and list possible causes.B3.4e List the possible causes and consequences of global warming.Statement B3.5 Populations
Populations of living things increase and decrease in size as they interact with other populations and with the environment. The rate of change is dependent upon relative birth and death rates.
B3.5A Graph changes in population growth, given a data table.B3.5B Explain the influences that affect population growth.B3.5C Predict the consequences of an invading organism on the survival of other organisms.
Statement B3.5x Environmental FactorsThe shape of population growth curves vary with the type of organism and environmental conditions, such as availability of nutrients and space. As the population increases and resources become more scarce, the population usually stabilizes at the carrying capacity of that environment.
B3.5d Describe different reproductive strategies employed by various organisms and explain their advantages and disadvantages.
B3.5e Recognize that and describe how the physical or chemical environment may influence the rate, extent, and nature of population dynamics within ecosystems.
S e c t i o n 3 Page 17 of 114

Flint River GREEN Notebook www.FlintRiver.org February, 2011 Version
B3.5f Graph an example of exponential growth. Then show the population leveling off at the carrying capacity of the environment.
B3.5rg Diagram and describe the stages of the life cycle for a human disease-causing organism. (recommended)
b. Incorporating Other TeachersCivic Engagement: Social Studies. Language Arts
Flint River GREEN is an opportunity for youth to become involved in the political process, and make their community a better place. Using the data from Flint River GREEN, students have the opportunity to work with local decision makers to enact policies to improve the environment. Here are some examples:
If youth find high levels of fecal coliform bacteria at a sample site, they can work with local officials to determine the source of the “poop in the water.” If the source is leaking sewers or septic systems, they can work with the city to get them repaired. If the source is dog waste, they can work with the city or township to get a “pooper scooper” ordinance enacted, with appropriate signage. If the source is a farm, they can work with the Conservation District to start conservation practices on that farm.
If the students notice a great deal of trash near the stream testing site, they can investigate where the trash is coming from. If it is from a local fast food restaurant, they could talk to the manager. If it is from a public building, they could work on getting more trash cans placed.
ii. Technology, Marketing, Communications If your school has technology, marketing, or communications courses, they
could work to proved Public Service Announcements on what students can do to protect the environment. Students could also provide video footage or photographs to be used in the student summit.
iii. Sharing Testing: Chemistry, Mathematics, Biology Teachers in other science and/or math classes also might benefit from
sharing the data. Science instructors in other disciplines might contribute to analyzing or gathering more data. If you are a chemistry instructor, working with a biology instructor might be useful, or vice versa. Here are some examples:
Chemistry – Chemistry students could do more detailed analysis. A high school chemistry class with an analytical scale could do the Total Dissolved Solids test, the dissolved oxygen test (Winkler Method ), or the phosphorus test. Students could then see how their results compared with the lab results or the kit results.
S e c t i o n 3 Page 18 of 114

Flint River GREEN Notebook www.FlintRiver.org February, 2011 Version
Biology – Students could collect benthic macroinvertebrates and key them out to the family level. An excellent key is the Guide to Aquatic Invertebrates of the Upper Midwest, which is available for download at http :// wrc . umn . edu / pubs / watersqq / guidetoaquaticinverts
Mathematics – Math students could run statistical analysis using past years data to see if changes are significant. They could also look at the results from other sites to see where your testing data “fits in.”
c. Ordering MaterialsShelf Life of Chemicals
The newer kits have expiration date on the chemical bottle.
Older kits must be determined by the packaging information.
The lot number tells you the week and year it was made (first two digits = week, third digit = year). I have listed all of the chemicals that we use for our tests (below) so that should help. If you need to know other LaMotte Chemicals you will need to go to the LaMotte site to determine the years of shelf life.
Example: Chemical V-6282-G, Lot 028206.
This chemical was made on week 02 of 2008. I then look up the shelf life of V-6282-G below and find that it only has a 1 year shelf life. In January of 2009 this chemical should be replaced.
The shelf life of kit chemicals that we use are on the order form below so you have everything in one place.
S e c t i o n 3 Page 19 of 114

Flint River GREEN Notebook www.FlintRiver.org February, 2011 Version
ii. Disposal of Old Chemicals In most cases chemicals can be dissolved, neutralized and then flushed down
the drain. You will need to check this out on the MSDS sheet at the LaMotte website.
S e c t i o n 3 Page 20 of 114
Genesee GREEN Equipment Order Form/ Shelf life 2110 pH Kit ---- Number of Kits on Hand Quantity Needed Item Item Description Shelf Life 2211-G Phenol Red Indicator, 30 mL 2 yr 7414 Dissolved Oxygen Kit ---- Number of Kits on Hand Quantity Needed Item Item Description Shelf Life 4167-G Manganous Sulfate Solution , 30 mL 3 yr 7166-G Alkaline Potassium Iodide-Azide, 30 mL 3 yr 6286-H Sulfamic Acid Pwd, 50 g 2 yr 4169-H Sodium Thiosulfate 0.025N, 60 mL 1.5 yr 4170WT-G Starch Indicator Solution, 30 mL 1.5 yr 0377 Direct Reading Titrator, 0-20 0608 Test Tube w/cap 0688-DO Water Sample Bottle - glass 0697 Spoon, 1.0g 3110 Nitrate Kit ---- Number of Kits on Hand Quantity Needed Item Item Description Shelf Life V-6278-H Mixed Acid Reagent, 60 mL 3 yr V6279-C Nitrate Reducing Reagent, 5g 1 yr 0699 Spoon, 0.1g 0820 Test Tube w/cap 0688 Water Sample Bottle – plastic 3109 Nitrate-N Comparator 0692 Dispenser Cap (White top to add drops) 3121-01 Phosphate Kit ---- Number of Kits on Hand Quantity Needed Item Item Description Shelf Life V-6282-G Phosphate Acid Reagent, 30 mL 1 yr V-6283-G Phosphate Reducing Reagent, 5g 2 yr 3122 Phosphate Comparator 2071 Axial Reader 0843 Test Tube w/cap 0354 Pipet 0699 Spoon, 0.1g 2748 Distilled Water Ampoule 7519 Turbidity Kit ---- Number of Kits on Hand Quantity Needed Item Item Description Shelf Life 7520-H Standard Turbidity Reagent, 60 mL 2 yr 0513 Brush 0835 Turbidity Column

Flint River GREEN Notebook www.FlintRiver.org February, 2011 Version
NOTE: The only chemical that I know of that cannot be disposed of locally is in the Nitrate kit – the nitrate reducing powder. This contains cadmium and needs hazardous waste disposal. You can do this once or twice a year at the hazardous waste collection day in Genesee County.
Reminder: There are two Household Hazardous Waste Collection Days in Genesee County each year, one in October and one in May. You can Google this topic to find specific dates.
d. Inquiry Training: Why is the Data Important?
ii. How can the information be used?
The information gathered by students in Flint River GREEN can be used to share with local decision makers about the quality of the river.
iii. Who is currently interested in the data?
The Genesee County Drain Commissioner ’ s Office uses the information provided
by Flint River GREEN to meet Clean Water Act Phase II Stormwater National Pollution Discharge Elimination Permit (NPDES) requirements. The work done by students as part of Flint River GREEN helps Genesee County, cities and townships within the county and local school districts meet their NPDES Phase II requirements. Failure to do so would result in fines placed upon those organizations.
The Flint River Watershed Coalition uses GREEN data to make decisions about its own monitoring and education programs and to inform local decision makers about the quality of the Flint River.
e. Selecting a Testing Site There are many things that make a good testing site. Below is a listing of qualities to look for; there are very few sites that meet all of these criteria
1. Depth – Preferably the site will be less than two feet deep and at least 6 inches deep to allow for wading, macroinvertebrate collection, and reduce the chances of a water accident.
2. Slope – Ideally a site has gently sloping sides down to the creek. A flat spot right next to the creek to “set up shop” is ideal.
3. Access to bathrooms – If your site is near a business, please contact them ahead of time to ask for permission to access the bathrooms. Access to water at those bathrooms is also important in case of a chemical spill.
S e c t i o n 3 Page 21 of 114

Flint River GREEN Notebook www.FlintRiver.org February, 2011 Version
4. Distance from school – If there is a suitable site that is within a walkable distance from the school, it is ideal to reduce busing costs.
5. Refuge from bad weather - If a thunderstorm or other hazardous weather should occur; hopefully the site has a building or pavilion so students can get out of the weather.
6. Bus accessibility/parking – Scout out the area to make sure the bus can get there, drop off students, and find a suitable place for parking
f. Preparing Kids for the Day At The River
i. Attire - Students should be prepared for any type of weather. You may want to go over the weather forecast the day before.
1. Dress in layers – In Michigan, the weather can change a lot throughout the day. A
jacket or sweatshirt that can be removed later in the day is ideal.
2. Warn students that they WILL GET DIRTY AND/OR WET. This is not the day to wear your $200 basketball shoes to school. Students should wear clothes that they don’t care if they get messed up.
3. Long pants – Many sites have poison ivy, stinging nettles, and/or plants with thorns. Long pants can reduce the danger from these. If it is appropriate, some students may want to bring shorts so they can go wading.
4. Sunscreen – Because we test in the spring, students are often not yet thinking of sunburns.
5. Hat – A hat with a good brim on the front not only protects from the sun, but also reduces glare so you can see into the water better.
6. Sunglasses – Can also help you see into the water.
7. Footwear – Closed-toed shoes are essential. Wear shoes that can get dirty and/or wet. A pair of old sneakers is ideal.
ii. Which student does which test?Not all tests are created equal. Each test requires different amounts of math skills, patience, independence, and time. Teachers should assign students to particular tests while taking into account all those factors. That being said, having multiple teams of students do each test is good “backup” in case one set of tests goes wrong. Some teachers assign a “lead” to each particular test, which gives students opportunities for leadership and keeps them from having to understand all the different procedures.
1. Temperature – Temperature involves taking two temperature readings at different
points on the river. This test usually doesn’t take very long, depending on how
S e c t i o n 3 Page 22 of 114

Flint River GREEN Notebook www.FlintRiver.org February, 2011 Version
quickly the student can travel. The students you select for this should be trusted to walk along the stream bank without supervision, pick a safe spot to go down to the stream, take a temperature measurement, and bring it back to the group. Trustworthiness and the ability to “stay out of trouble” are the important things to consider when selecting students for this test. Students who are familiar with the outdoors are also good, because there may be brush or other obstacles they have to get through to get to the site where they take the temperature.
2. Dissolved Oxygen – Dissolved Oxygen is one of the most important tests and one that is most prone to errors. This test also takes a relatively long time. Students to select for this test are those with attention to detail and patience.
3. Biochemical Oxygen Demand – Because this test is finished after the actual testing day, you need a student who can help remind you later to finish this test. A student who can take time away from the regular classroom instruction to complete this test is also important.
4. pH – pH is one of the simplest tests. A concern for this test is that if students get done early, they might get bored. This is a good test to combine with others, such as temperature, turbidity, or phosphorus.
5. Turbidity – This is another fairly simple test that can be combined with another test.
6. Fecal Coliform – Fecal coliform is a test that is very quick to do at the testing site, but requires a student to have good follow through. Although the test is fairly simple, the student needs to “keep watch” over the samples to make sure they make it from the testing site back to the classroom without spilling, and then check for colonies the next day.
7. Nitrates – The nitrate test is a longer test, so assign a student to it who has patience and can keep themselves entertained while waiting for the reagent to change color.
8. Phosphorus & Total Dissolved Solids – Both of these tests simply require collecting a sample and making bottles get labeled and sent to the lab.
9. Habitat Assessment (optional) – This test involves filling out a form completely. Students who can stick to a task for a fairly lengthy amount of time are good for this. This can also include artistic students who can map the testing site.
10. Benthic Macroinvertebrates – This is for the students who like looking at weird bugs.
g. Running Through the Tests
S e c t i o n 3 Page 23 of 114

Flint River GREEN Notebook www.FlintRiver.org February, 2011 Version
We STRONGLY recommend that all students run through the tests they are conducting before going out to the river. Ideally, you would bring your classroom mentor in for the day(s) you are doing this. You can run through the tests with water from a variety of sources, tap water, local stream or pond water, or even toilet water. IMPORTANT NOTE: If you set up water samples for the students to test, they will change throughout the day. As water heats up, dissolved oxygen, pH, and even nitrate levels can change. As the water sits still, solids will settle out and turbidity will change. Carefully design your grading/evaluation procedure to take this into account.
h. Looking at Historical Data Part of the scientific method involves gathering background research to develop a hypothesis. There are several sources for historical data on the quality of the Flint River.
1. Historical Flint River GREEN Data – collected and reported by students. http :// www . geneseegreen . org / view _ data . php
2. Flint River Watershed Coalition Benthic Monitoring Data – information on the health of the river based on what “critters” are collected. http :// flintriver . org / Programs . html
3. USGS Real Time Stream Flow data – information on the real time and historical levels of water in particular streams.
a. Real Time - http://waterwatch.usgs.gov/?m=real&r=mi&w=mapb. Historical - http :// waterdata . usgs . gov / mi / nwis / current ? type = flow
4. Michigan DNRE Michigan Surface Water Information System (MiSWIM) – lots of historical water data, searchable by map or text. http://www.mcgi.state.mi.us/miswims/
5. Michigan State University’s Institute of Water Research Digital Watershed – lots of different historical water quality data. http :// www . iwr . msu . edu / dw / NOTE: make sure you allow pop-ups on this site to get more information.
6. Digital Photographs (1992, 1998, 2005) are available at: http://www.mcgi.state.mi.us/doqqviewer/
S e c t i o n 3 Page 24 of 114

Flint River GREEN Notebook www.FlintRiver.org February, 2011 Version
i. Notifying the media/elected officials Getting promotion for your Flint River GREEN is good for students, schools, and all the partners involved in the program. In tough budget times, this kind of promotion keeps the program going. List of people to contact:
1. School Board2. School Superintendent3. Building Principal4. Mayor and/or City Council5. Township Officials6. County Commissioners7. State Representatives8. State Senator
Media Contacts:
1. ABC Channel 12 - WJRT http://abclocal.go.com/wjrt/feature?section=resources/inside_station/station_info&id=7095770
2. CBS Channel 5 – WNEM – Fox 66 – WSMH - [email protected]. NBC Channel 25 – WEYI -
http :// www . connectmidmichigan . com / about / submit _ news _ tip . aspx 4. The Flint Journal - http :// www . flintjournal . com / contactus / beatlist . html 5. Tri-County Times - http :// www . tctimes . com / forms / submit _ news /
Sample Press Release The Flint River Watershed Coalition, General Motors, Michigan State University Extension, and the Genesee County Drain Commissioners Office have partnered with (YOUR SCHOOL) to get students testing the Flint River and its tributaries. MSUE provides training for teachers and mentors, GM and the GCDC provide funding and mentors, and the FRWC provides coordination for the project.
In 1990, the Flint Community Schools were offered an opportunity to participate in a water quality monitoring project through a grant from General Motors. Five Flint teachers volunteered to provide this experience for their students.
Flint River Green has grown from approximately 100 Flint Community school students in 1990 to an excess of 3000 students from all across the Flint River Watershed in 2010. The project had involvement from 49 teachers in 29 schools. Each school is paired up with an environmental professional who mentors the students and teacher before, during, and after the testing. Students from (YOUR SCHOOL) will be heading out to (TESTING LOCATION) on (TESTING DATE).
S e c t i o n 3 Page 25 of 114

Flint River GREEN Notebook www.FlintRiver.org February, 2011 Version
The program culminates in our Flint River GREEN Summit where students had a chance to share their data with other students and community members. In addition to sharing their testing results, students participated in 40 breakout sessions where they learn about wastewater treatment, beekeepers, nature centers, canoeists, keeping drinking water safe, and careers in natural resources.
Student evaluations show that students improved their perception of the river, understand how a river becomes polluted, and feel empowered to make a difference in the health and the environment. A student from Carman-Ainsworth said, “That just a small group of freshman can make a difference in the city we live in.” A Davison Middle School student shared, “That water affects everything we do. I also learned that our creek is quite clean, but we can do a lot to clean it more.” Another student, from Holmes Middle School in Flint said, “That instead of dogging our city for not keeping the Flint River clean, I can do my part by keeping it clean.”
j. Permission Slip/Media Release If your school has a standard permission slip/media release, feel free to use that. If not, please use the form provided, so we can provide pictures to local media outlets. http://web1.msue.msu.edu/4h/downloads/Medical-MediaRelease.pdf
k. Optional Activities
i. Model Watershed Activity
Materials: 2 Plastic picnic table covers or tarps 5 Spray bottles, filled halfway with water Plastic bags, newspapers, assorted items to create landscapePollutants: brown cake sprinkles (dog waste), cocoa powder (dirt), green food coloring or cake sprinkles (fertilizer), red food coloring (toxic waste), cooking spray or oil or honey (oil from cars on pavement or machinery), dish soap or baking soda (detergents from laundry and car wash soapy water) Optional: string, thin sponges, green felt, small plastic fences, paper towels for cleaning up any spills!
Directions:1. Lay one tarp flat on ground and throw plastic bags, newspapers and assorted
trash items onto tarp.
2. Ask participants to stand around edge of tarp with toes on edge of tarp, hand trash to different people and a spray bottle to every fifth person. Participants may kneel if in the front row or encourage people to stand in rows so everyone can see.
3. Have participants “fluff” bags and newspaper and throw onto the tarp towards the middle. Arrange any items around the center, away from edges of tarp.
S e c t i o n 3 Page 26 of 114

Flint River GREEN Notebook www.FlintRiver.org February, 2011 Version
4. Ask three volunteers to open second tarp and cover items in middle of tarp, lying tarp on top. Arrange second tarp so it is directly over bottom tarp. Push down on top tarp where there are gaps between the materials, creating “topography.”
5. Ask participants to imagine this is their community. If there are any “peaks” or “hills,” ask the students to identify these land features; unfortunately, this may be a landfill in some communities.
6. Ask those individuals with spray bottles to make it “rain,” directing them to spray towards the middle of the tarp. [I usually put three of the spray bottles on stream and the remaining two on spray.] After water begins to run down the hills and collect in depressions in the landscape, stop the rain and ask the participants to report on what they are observing.
7. Ask participants to identify the bodies of the water they see on the tarp as streams, wetlands, lakes, rivers, etc. in their community. Ask the participants if a drop of water falls on one side of a particular hill where it goes, and if it falls on the other side of a hill, where it goes. This visual observation is demonstrating how a watershed is delineated, using topography and gravity to determine where water eventually flows to when it falls on the land. Ask participants to identify a “watershed,” defined as an area of land that drains the rainwater (or snowmelt) into one location such as a stream, lake, or wetland. Any pollutants from streets, fields and lawns will eventually drain into those streams, lakes or wetlands when rain falls or snow melts, and those pollutants can be identified as nonpoint source pollutants (U.S.EPA Office of Water, What’s Up with our Nation’s Waters?, May 2001).
Optional: Place string on top of tarp to illustrate municipality boundaries; ask participants if the watershed boundaries and runoff reflect these boundaries. Discuss the importance of watershed management between municipalities. 1. Add two drops of red food coloring to one of the tarps and have it rain again with
all spray bottles, students may observe this air pollutant (acid rain) as it mixes with the fresh or clean water on the watershed. Stop raining.
2. Beginning with chocolate cake sprinkles, demonstrate nonpoint and point source pollutants that individuals may find in their watershed.
Brown cake sprinkles = dog waste
3. Ask the students who has a dog and tell a short story of how this individual is on a walk with their dog and of course there is dog waste as a result – what if the owner does not pick up the dog waste? Let the sprinkles remain on tarp.
Cocoa powder = loose dirt
S e c t i o n 3 Page 27 of 114

Flint River GREEN Notebook www.FlintRiver.org February, 2011 Version
4. Choose another section of the tarp and sprinkle some cocoa powder, explaining to participants that this part of the watershed used to be a forest but it was recently clear-cut and all the trees were removed, exposing what (loose soil that is carried with rainwater and snowmelt as runoff into nearby bodies of water)?
Green food coloring or green cake sprinkles = fertilizer
5. Identify a third section of the watershed (near the dog trail area) where there are many nice homes that have very green grass. Ask participants what sort of chemicals are used for green grass, discussing over application of fertilizer will oftentimes not improve the growth of the grass or shrubs and may enter the storm drain as runoff.
6. Fertilizers are also applied to golf courses and public and private parks and gardens.
Red food coloring = toxic waste
7. Discuss a family who finds a container of hazardous waste in their garage and want to get rid of it in a hurry so they dump it down the storm drain in front of their house. Use only a few drops of food coloring for adequate effect.
Cooking spray or oil or honey = oil from cars or machinery
8. Ask who drove to the location and drop oil or honey along an imagined road, discussing how car owners were not properly maintaining their cars and oil is leaking.
Dish soap, Alka-Seltzer or baking soda = detergents
9. Identify a few homes where people are washing their cars in front of their homes on the driveway, letting the soapy water run down the driveway into the storm drain.
Other nonpoint and point source pollutants – feel free to add!
10. Here comes the rain! Ask participants to identify what they see happening to the pollutants in the watershed, how do they mix with the bodies of freshwater, what pollutants are remaining, what will happen to the remaining pollutants still on the land and in the water?
11. Discuss approaches or techniques those human beings responsible for the different pollutants could have done differently. How could you educate people about these pollutants and runoff affecting water quality in your watershed? Possible best management practices or watershed management techniques that could be discussed:
Pick up dog waste and put in compost, trash can or decomposing waste bags
Plant tree saplings, shrubs or ground cover in areas where there is exposed soil
S e c t i o n 3 Page 28 of 114

Flint River GREEN Notebook www.FlintRiver.org February, 2011 Version
Apply fertilizer according to container directions, try organic gardening or growing
Contact your Environmental Protection Agency for Hazardous Waste Household Pick-Up Days or Waste Collection Programs
Keep your car maintained and watch for oil spots on your garage floor
Wash your car at a facility that recycles wastewater or sends it directly to a treatment facility
Wetlands reconstruction or protection (benefits illustrated by placing felt or sponges in areas next to bodies of water that have runoff entering
Keep animals out of waterways (fences)
12. Ask volunteers to pick up four corners and one in the middle of each side to pick up corners of top tarp, making sure wastewater remains in the middle. Wash down the sink or toilet with extra water.
Vocabulary Terms or Topics to Include Topography Rainfall Bodies of water (groundwater-fed springs) Runoff Elevation Watershed Acid rain – air pollution Nonpoint and point source pollution Watershed management Best Management Practices
ii. Watershed Planning
Part I: What’s the problem? All surface waters of the state of Michigan are required to meet all eight designated uses, those uses are:
1. Agriculture2. Industrial water supply3. Public water supply4. Navigation5. Warm water Fishery (or coldwater fishery)6. Other indigenous aquatic wildlife7. Partial body contact recreation
S e c t i o n 3 Page 29 of 114

Flint River GREEN Notebook www.FlintRiver.org February, 2011 Version
8. Full body contact recreation from May 1 to October 1
DISCUSSION: Does the part of the Flint River Watershed you are testing meet all those designated uses? Why doesn’t it? How do you know? See the Appendix “Water Quality Requirements – Standards Set by EPA & DEQ” for more information on what levels are appropriate. There may also be desired uses that are locally determined, such as a recreational biking trail along the river, wetlands to help with flood control, or protecting habitat for a particular endangered species. DISCUSSION: What are some desired uses for the part of the Flint River Watershed you are testing? Does the river currently meet those uses? Impaired desired and designated uses are caused by pollutants, for example, in Bluebell Beach, the full body contact designated use is impaired because of e. coli. DISCUSSION: What are the pollutants causing impaired uses for the part of the Flint River Watershed you are testing? Pollutants can come from a variety of sources; often it isn’t known where those sources are located. For example, in Bluebell Beach, the e. coli could be coming from wildlife (such as geese), livestock in the stream, failing septic systems, or broken sewer pipes. Tracking down the sources of pollutants can be time consuming and expensive. DISCUSSION: What are the suspected or possible sources of the pollutants for the part of the Flint River Watershed you are testing?
Part II: Testing the hypothesis
One of the most difficult parts of watershed planning process is determining what the source of pollution in a watershed is, and determining how to “fix” that problem. In the case of Bluebell Beach, one suspected cause of high e. coli levels was Mott Farm. Since Mott Farm has closed, there still have been some high e. coli levels. Often there are multiple sources of a pollutant. DISCUSSION: How could you prove the source of the pollution? Determining the source of pollutants may be beyond the scope of what your classroom can do. It can involve long term testing over several months or even years. Students can speak with local decision makers and ask them to increase monitoring of a particular problem. Part III: Where to put your time & $$$$ Once a source of pollution is identified, it takes resources to correct a problem. For example, in Bluebell Beach if Canada geese are determined to be the source of the e.
S e c t i o n 3 Page 30 of 114

Flint River GREEN Notebook www.FlintRiver.org February, 2011 Version
coli, how do you get rid of them? Are multiple stakeholders involved or just one? Where do you get the best bang for your buck?
S e c t i o n 3 Page 31 of 114

Flint River GREEN Notebook www.FlintRiver.org February, 2011 Version
Section Four: Day AT the River
a. Deciding Who Goes to the River
In an ideal situation, you would take all students out to the river. This may not be possible for a variety of reasons. Sometimes behavior, transportation issues, or lack of chaperones make that impractical. Some teachers have students go through an application process to determine who gets to go to the river. Some teachers simply take out students who return their permission slip.
b. Checklist - What to Take Out To the River
Supplies to bring and other things to think about:
Instructions, clipboards, MSDS sheets, and testing kits for the following tests:Dissolved OxygenFecal ColiformNitratespHPhosphorusTemperatureTurbidityCell phone with Emergency phone numbers (school, parents, police, poison control center, etc.)ScissorsFirst Aid Kit/Bee sting kitCopy of permission slips/medical information for all participantsCameraWadersPaper towelsSafety GogglesLatex and/or Nitrile glovesStudy gloves for picking up trashTrash bagsEmpty Pop bottle or other container for hazardous waste. Clearly label this bottleDrop cloth for sitting/kneeling (old shower curtains work great)6-10 Buckets: one for each test kit and materials, for paper waste and water waste(flush)Large container of distilled or R.O. water at central use siteAccurate thermometers (pretested 100 degrees boiling water) Calculator for nitrate testCollection bottle for BOD(covered with dark tape)Collection bottle for Total Solids (sent to GISD for testing pick-up, City of Flint) Collection bottle for phosphates (sent to GISD for test pick-up, GM)Catch basin (plastic shoebox) for overflow of kit during testing with hazardous chemicals (Nitrate and Phosphate)Benthic Collection materials (optional)
S e c t i o n 4 Page 32 of 114

Flint River GREEN Notebook www.FlintRiver.org February, 2011 Version
NetsSorting traysInsect collection bottles (baby food jars)Insect identification keysRopeLife jacketsInsect RepellentSunscreenSoap or hand sanitizerEye Wash Kit
c. Safety
Safety is the top priority for Genesee GREEN. There are inherent dangers with any field trip or laboratory activity. Because this program incorporates both field trips and laboratory activities, it is important to follow all the standard safety procedures and policies of your school and district regarding these activities. If you do not know what these procedures and policies are, it is your responsibility to find out.
Below are some suggestions and guidelines that Flint River Watershed Coalition has developed to help participants in the Genesee GREEN to be safe. These are intended as safety tips and do not address every hazard that may be encountered while participating in the Genesee GREEN.
i. General Safety Guidelines
1. Be prepared. Be familiar with everything in this manual as well as general first aid. Have a plan in place for where students and staff on site will go in case of severe weather. Know who to contact at your school in case of emergency and have those numbers available.
2. Practice safety procedures and monitoring tests with students, parents and volunteers before monitoring day. Practicing safety procedures and monitoring tests multiple times before monitoring day will ensure that the students are prepared when they visit the river. If possible, also have parents and volunteers practice. They will be better able to assist students at the river and help make monitoring day as safe as possible.
3. Always wear goggles and gloves. All students, parents, teachers and volunteers MUST wear safety goggles and gloves (vinyl, latex or nitrile) when handling chemicals or river water or are near anyone else handling them.
4. Keep hands, chemicals and river water away from eyes and mouth. Wash hands after handling river water or performing chemical tests. Whenever students, parents, teachers, or volunteers handle any chemicals or river water they should always keep their hands, the water, and the chemicals away from
S e c t i o n 4 Page 33 of 114

Flint River GREEN Notebook www.FlintRiver.org February, 2011 Version
their eyes and mouth. It’s important that everyone washes their hands after handling river water or performing chemical tests.
5. Wear waders or rubber boots when going in the river. Although recent test results have not shown this, some areas of the river may have such poor water quality that it’s advised that skin does not come in direct contact with the water. No one should enter the river unless they are wearing waders or rubber boots that are high enough to prevent their feet from getting wet.
6. Never go in water above your knees and always wear a life jacket. Students, parents, teachers, and volunteers should never go in water above their knees, and they should always be wearing a life jacket. Even shallow water can have strong current or deep pools that are invisible from the water’s surface. Waders fill quickly with water if someone falls, and they become very heavy. The wearer may not be able to lift him/herself up and may be carried downstream under water. It’s a good idea to wear a belt or a piece of rope around the top of the waders to prevent them from filling as quickly if there is an accident.
7. Never go in a flooded river. Students, parents, teachers, and volunteers should never go in a river when it’s flooded. Currents can be surprisingly strong, and the water can be much deeper than it appears from the surface.
8. Never dump chemical waste on the ground. Always bring an empty, marked, plastic jug with you on monitoring day in which to dispose of chemical waste. Back at school, dispose of the chemicals as hazardous waste. Chemicals dumped on the ground could wind up harming your students, volunteers, other park visitors, pets, and wildlife – not to mention the river itself! If there is a spill, collect the contaminated soil and spilled material and dispose of as hazardous waste
9. Dress appropriately for monitoring day. Inform all participants, including students, parents, and other volunteers in advance of how to dress appropriately for monitoring day. They should wear long sleeves and pants to protect from insects and poison ivy; sturdy, closed-toed shoes; and clothes appropriate for mud, hot/cold weather, rain, etc.
10. Be aware of everyday hazards, such as traffic. With all the special considerations of students conducting monitoring tests at a river, it’s easy to overlook the everyday hazards you may encounter, such as students needing to cross busy roads. Stay mindful of all potential hazards and discuss them ahead of time with students, parents and volunteers.
11. Talk about safety with your volunteers. Go over these guidelines with your parent chaperones and other volunteers. If they are unable to meet with you prior to monitoring day, take five minutes at the beginning of monitoring day to go over them. Since they’ll be the ones helping to supervise the students, it’s important that safety is on their mind as well as yours.
12. Be familiar with the Material Safety Data Sheets (MSDS). There is an MSDS sheet for every chemical that is present in the test kits. MSDS sheets have important information about the chemicals, including the danger they post to humans and safety precautions that should be taken when handling them.
S e c t i o n 4 Page 34 of 114

Flint River GREEN Notebook www.FlintRiver.org February, 2011 Version
They also give specific instructions for first aid and cleanup in case of an accident. Make sure you read each MSDS sheet and are familiar with the information it provides before allowing anyone to handle chemicals. Make sure you have quick access to the MSDS sheets every time the chemicals are used. It’s a good idea to keep copies of MSDS sheets in the appropriate test kits.
Additional Safety Suggestions for Monitoring Day:
Check the weather report before leaving the school. If the weather is bad, you may reschedule your monitoring. This is entirely as your discretion, but please let the Flint River Watershed Coalition staff know if you change your plans. Safety is the most important concern. Do not take your students out on a day that has dangerous weather. If flooding is expected and you decide to go to the river, take extra safety precautions.
Do a head count of students when you arrive and when you leave your site.
Be aware of poison ivy . Teach students and volunteers to recognize the plant. Remember, poison ivy can grow as a vine on trees as well as grow on the ground.
Do not go into the water if you have an open wound.
Consider using insect repellent. Insect repellent reduces the risk of insect bites and, therefore, potential insect-borne diseases. Make sure to follow the manufacturer’s direction. Use special care if using insect repellent on or around children.
Check for ticks when done. Tucking in shirts and tucking pant legs into socks can limit exposure to ticks and other insects.
ii. Severe Weather ProceduresThunderstorms – If a thunderstorm is imminent, seek shelter immediately.
Lightning can occur more than 5 miles ahead of a thunderstorm. If you cannot find shelter, find a low spot away from trees or overhead wires.
Flooding – Stay away from high water. Water just 6 inches deep can knock a person down. Do not enter water unless you are confident that it is not moving too swiftly for safety.
Tornadoes – Genesee County has more tornadoes than any other county in Michigan. If there is a tornado warning or watch, seek shelter immediately. If you cannot find shelter, find a low spot away from trees or overhead wires. Do not attempt to out-run or out-drive a tornado.
S e c t i o n 4 Page 35 of 114

Flint River GREEN Notebook www.FlintRiver.org February, 2011 Version
d. Explanations on Natural Phenomenon
Complaint Source
Foam If it feels gritty, it is probably natural; if it feels slippery it is probably from detergents in the water
White Milky Substance Clay particles in the water, carbonate precipitation
“Rust colored paint” Iron oxide usually with iron bacteria; or algae bloom
Rainbow colored sheen If you hit it with a stick and it breaks up, it is from bacterial breakdown; if it floats along the surface it is probably from petroleum
Yellow sheen Tree pollen
Fish kill Low dissolved oxygen in the water(usually larger fish will die first),toxins in the water - black walnut toxicity, pesticide input (usually smaller fish die first); spawning stress
White, slimy, stringy substance
Beggiatoa - a sulfur eating bacteria
Gelatinous ball Bryozoan - a group of moss-like animals
“Paint” various algaes
S e c t i o n 4 Page 36 of 114

Flint River GREEN Notebook www.FlintRiver.org February, 2011 Version
e. What to do when kids are done testing
Each test with each group of students takes a different amount of time. Inevitably, some students will be done early. Here are some things they can do if you have time:
1. Pick up trash. This could even be done as a competition with a prize for the team that picks up the most trash. Some teachers require each group pick up a certain amount of trash, or give extra credit based on how much trash is picked up.
2. A hand-drawn map of the site can be useful for future years. It is especially helpful if students mark sampling sites on the map, so they can be used in future years.
3. Students can try to observe other wildlife. They can look for tracks, listen for bird and frog calls, or look for nests.
4. Organize/pack up materials for the trip back to the school.
f. Tips for Talking to the Media and/or Elected officials1. Know your message – If you know the core message you want to get across to
the media and/or elected officials, you can be prepared for when they arrive. If you do not have a message you want to get across the media, you risk them focusing the story on something irrelevant, or worse, a negative story.
2. ABC – Acknowledge-Bridge-Communicate. Respond to the reporter/officials question, transition to what you want to say, and they get across your point. This puts you in control of the conversation. If the reporter asks several different questions, give them a differently worded response using this strategy.
3. What’s in it for them? – The amount of time you get on TV/Radio or space in print/internet is based on how much interest you can generate among their viewers. Think about what would get you to stop flipping channels and try to make it interesting for views.
g. Other Tips and Tricks1. Use a fishing pole to get thermometer into the stream.
2. Use buckets to carry materials.
3. Laminate instructions for use at site.
S e c t i o n 4 Page 37 of 114

Flint River GREEN Notebook www.FlintRiver.org February, 2011 Version
Section Five: Water Testing Information
a. Temperature
i. Why is this test used?
Water temperature influences many systems in the watershed including: the amount of oxygen that can be dissolved in the water, the rate of photosynthesis by algae and larger aquatic plants, the metabolic rates of aquatic organisms, and the sensitivity of organisms to toxic wastes, parasites and diseases. Some animals can only live in cool water, like trout. (NOTE: Cold water can hold more oxygen than warm water.) One of the ways that humans can raise water temperature is by industrial pollution by adding warm water to the river or lake. Another source may be runoff from warm urban surfaces (streets, parking lots). Another source of temperature increases may be soil erosion. Soil erosion raises water temperatures because it increases the amount of suspended solids which is better at absorbing the sun’s rays. Stream shading also affects water temperature, a tree lined stream will be cooler than one with just grass on the banks. In general, cool water is better.
ii. Water Quality Standards/What is an ideal temperature?
Water temperature determines what kind of fish (and other organisms will live in a particular habitat. Ideally there is under 5 degrees temperature difference in a stream reach.
A coldwater fishery has a temperature range of less than 70 degrees F. Most trout prefer a coldwater fishery.
A coolwater fishery has a temperature range of 65-75 degrees F. Walleye and perch prefer a coolwater fishery.
A warmwater fishery has a temperature range of greater than 75 degrees F. Bass and bluegill prefer a warmwater fishery.
S e c t i o n 5 Page 38 of 114

Flint River GREEN Notebook www.FlintRiver.org February, 2011 Version
iii. How to conduct the test
The purpose of this test is to get, as best we can, a measure of how far the temperature at your testing location is from the "equilibrium temperature" of the river.
The temperature test to be conducted measures the change in water temperature between two points –the test site and a site one mile upstream. By discovering river reaches that undergo rapid temperature changes, we can begin to uncover the sources of thermal pollution.
1. At the testing site, lower the thermometer four inches below the water's surface.
2. Keep the thermometer in the water until a constant reading is obtained (approximately two minutes).
3. Record your measurement in degrees Centigrade (to covert degrees Fahrenheit to degrees Centigrade (C = (*F -32.0)/ 2.80 OR *F = (*C x 1.80) + 32.0).
4. Repeat your measurements until you have three or four readings. Then calculate an average value. (Report this value to the Dissolved Oxygen testing team.)
5. Repeat the test approximately one mile upstream as soon as possible. Try to make sure that the shading conditions are the same as at the downstream site (i.e., if you tested in partial shade downstream, pick a spot with the same amount of shading upstream). Note: Make note of any possible sources of thermal pollution you see between or near the two sites.
6. Subtract the upstream from the downstream temperature using this equation: Temp. downstream – Temp. upstream = Temp. change
7. Record your results (the Temp. change)
S e c t i o n 5 Page 39 of 114

Flint River GREEN Notebook www.FlintRiver.org February, 2011 Version
iv. Determining the Q-Value
S e c t i o n 5 Page 40 of 114
Flint River GREEN Notebook www.FlintRiver.org February, 2011 Version
v. What To Watch Out For: Common Mistakes
1. Make sure you convert the temperature from Fahrenheit to Celsius before choosing the Q-value
2. When determining the Q-value, you are looking for the change in temperature between the two points, not the actual temperature.
3. Try to take both temperatures from a portion of the stream with the same amount of shading (if possible)
4. Try to take the second temperature reading as soon as you can after the first.
5. Wait for the temperature to stabilize. At least two minutes in the water.
6. Try to keep the thermometer below the surface of the water, but not touching the bottom of the stream.
vi. Consistency When Doing Multiple Tests
Water temperature can vary throughout the day, particularly if a weather event brings in water of a different temperature into a stream. Do temperature temps as close to the same time as possible for a consistent result.
vii. Analyzing the results
If there is a temperature change of more than 10 degrees C between the two locations, your students probably want to hypothesize about why that is the case. Possible explanations include:
1. Lack of stream shading
2. Stormwater input (runoff from the road or a parking lot)
3. A tributary stream enters the creek bringing water of significantly different temperature
4. Groundwater input (leads to cooler water)
5. Thermal pollution from a commercial or industrial source
Students can look at aerial photographs (such as Google maps) and look for potential inputs of water of differing temperatures.
S e c t i o n 5 Page 41 of 114

Flint River GREEN Notebook www.FlintRiver.org February, 2011 Version
b. Dissolved Oxygen
i. Why is this test important? What does it measure?
Oxygen is critical for the animals that live in the water. Just as land-based organisms need oxygen to live, so do aquatic animals. The more oxygen dissolved in water; usually the better it is for aquatic life. You typically have the greatest diversity in waters with high levels of dissolved oxygen.
Oxygen comes into water through two processes. The first is photosynthesis. Plants and algae in the water produce oxygen during the daytime. Those same plants consume oxygen during the night. If there are many plants in the water, oxygen levels may increase as the day goes on and plants are photosynthesizing more.
Oxygen also enters the water directly from the atmosphere. Tumbling water mixes and dissolves atmospheric oxygen. Waterfalls and rapids tend to increase the amount of oxygen in water.
As water heats up, gases are driven out of the water. A can of soda pop has carbon dioxide gas dissolved in it, which we call carbonation. As the pop heats up, the carbon dioxide is driven out, and the pop goes flat. Warmer water will have less oxygen in it than colder water.
ii. Water Quality Standards
Rule 64 of the Michigan Water Quality Standards (Part 4 of Act 451) includes minimum concentrations of dissolved oxygen which must be met in surface waters of the state. This rule states that surface waters designated as coldwater fisheries must meet a minimum dissolved oxygen standard of 7 mg/l, while surface waters protected for warmwater fish and aquatic life must meet a minimum dissolved oxygen standard of 5 mg/l.
Dissolved Oxygen levels of around 100% saturation are good for aquatic life.
S e c t i o n 5 Page 42 of 114

Flint River GREEN Notebook www.FlintRiver.org February, 2011 Version
iii. How to conduct the test
NOTE: Make sure everyone involved in conducting the test is wearing gloves and goggles.
1. Pick your location to sample. You want an area of the stream where you can completely submerge the bottle. Try to select a sampling location that is representative of the stream.
2. Rinse the sample bottle with the stream water.
3. After you have rinsed the bottle with stream water, tightly cap the bottle.
4. Submerge the bottle underneath the water completely, and remove the cap with the bottle under the water, and allow the bottle to fill.
5. While the bottle is still underneath the surface of the water, tap the sides of the bottle to get out all the air bubbles.
6. While the bottle is still underneath the surface of the water, put the cap back on the bottle.
7. Retrieve the bottle and make sure there are no trapped bubbles, if you have trapped bubbles, go back to step 3.
S e c t i o n 5 Page 43 of 114

Flint River GREEN Notebook www.FlintRiver.org February, 2011 Version
NOTE: When adding chemicals, be sure to not add air to the sample.
8. Carefully remove the cap from the bottle.
9. Add 8 drops of Manganous Sulfate Solution NOTE: Bottle may overflow, that is ok; that is why you are wearing gloves.
10. Add 8 drops of Alkaline Potassium Iodide Azide NOTE: Bottle may overflow, that is ok; that is why you are wearing gloves.
11. Cap the bottle and wipe off any chemical that overflowed the bottle.
12. Mix by inverting several times. Put your thumb over the cap and turn the bottle upside-down, then right-side-up. DO NOT shake it like a bottle of ketchup; it is more likely to go flying out of your hand that way. “Chunky stuff” will form, this is called precipitate.
13. Set the bottle down and allow the precipitate to settle down below the “shoulders” or curved part of the bottle. This should take about 5 minutes.
14. Immediately use the 1.0 g spoon (0697) to add one level measure of Sulfamic Acid Powder (6286). NOTE: Bottle may overflow, that is ok; that is why you are wearing gloves.
15. Cap the bottle and wipe off any chemical that overflowed the bottle.
16. Mix by inverting several times. Put your thumb over the cap and turn the bottle upside-down, then right-side-up. DO NOT shake it like a bottle of ketchup; it is more likely to go flying out of your hand that way. Keep inverting the bottle until all the precipitate is dissolved. If oxygen in present, the sample will turn a yellow or orange color
NOTE: At this point, the oxygen is “fixed” and the rest of the procedure can be done back at the school, or even on another day.
18. Fill the titration tube (0608) to the 20 mL line with the fixed sample. Cap the tube. There is a small hole in the cap to insert the titration tube.
19. Depress plunger of the Titrator (0377). The titrator looks like a blunt syringe.
20. Insert the Titrator into the plug in the top of the Sodium Thiosulfate, 0.025N (4169) titrating solution.
21. Invert the bottle and slowly withdraw the plunger until the large ring on the plunger is opposite the zero (0) line on the scale. NOTE: If small air bubbles appear in the Titrator barrel, expel them by partially filling the barrel and pumping the titration solution back into the reagent container. Repeat until bubble disappears.
S e c t i o n 5 Page 44 of 114

Flint River GREEN Notebook www.FlintRiver.org February, 2011 Version
22. Turn the bottle upright and remove the Titrator.
23. Add 8 drops of Starch Indicator Solution (4170WT). The sample should turn blue.
24. Insert the tip of the Titrator into the opening of the titration tube cap.
25. Slowly depress the plunger to dispense the titrating solution (Sodium Thiosulfate). As you add the titrating solution, the sample will become more pale. Gently swirl the sample as you add the titrating solution.
26. If you go through a complete titrator-full of Sodium Thiosulfate, repeat steps 19-22 to refill your titrator.
27. Continue titrating until the blue color disappears and the solution becomes colorless. Holding the titration tube over a white piece of paper helps to determine if the solution is colorless.
28. Read the test result directly from the scale where the large ring on the Titrator meets the Titrator barrel. Record as ppm Dissolved Oxygen. Each minor division on the Titrator scale equals 0.2 ppm.
NOTE: If you filled the Titrator more than once, each full Titrator counts as 10ppm
29. Use ppm of Dissolved Oxygen and temperature in degrees Celsius to determine the percent saturation of Dissolved Oxygen in the using the chart below:
S e c t i o n 5 Page 45 of 114

Flint River GREEN Notebook www.FlintRiver.org February, 2011 Version
There is also a fairly complicated equation you can use to determine percent saturation available at http://www.waterontheweb.org/under/waterquality/oxygen.html.
iv. Determining the Q-Value
S e c t i o n 5 Page 46 of 114

Flint River GREEN Notebook www.FlintRiver.org February, 2011 Version
S e c t i o n 5 Page 47 of 114

Flint River GREEN Notebook www.FlintRiver.org February, 2011 Version
v. What To Watch Out For: Common Mistakes
Unfortunately, the DO test probably has the most opportunities for user error, so conducting multiple tests is beneficial.
1. A very common mistake is having a student collect a sample in a bucket, and bringing it up to the shore of the stream, and then pouring the water from the bucket into the sample bottle. This introduces lots of extra oxygen into the sample leading to an inaccurate result. The DO sample bottle MUST be submerged below the surface of the stream and bubbles removed underneath the surface of the water. A student in waders will probably have to get the sample for this test.
2. Be careful not to introduce air bubbles when adding chemicals.
3. Make sure you get all air bubbles out of the bottle.
4. Make sure you remove air bubble from the titrator when adding the Sodium Thiosulfate.
5. Make sure you have temperature in Celsius when calculation percent saturation.
6. Make sure you use percent saturation to determine the q-value, not ppm oxygen.
7. Students who go through multiple titrators of Sodium Thiosulfate, and only get the reading from the last one.
8. Try to get your temperature reading as close to the time of collecting and “fixing” your dissolved oxygen sample as possible.
vi. Consistency when doing multiple tests
Dissolved oxygen levels can vary widely throughout the day as the temperature of the water changes, and as photosynthesis activity by aquatic plants change. Try to conduct these tests as close together as possible.
vii. Analyzing your results
You want DO levels to have a percent saturation of between 80%-120%. Low dissolved oxygen levels can be explained by a high BOD (which will be explained in the next section), stagnant or slow moving water, or high temperature water.
c. Biochemical Oxygen Demand
i. Why is this test important/What does it measure?
S e c t i o n 5 Page 48 of 114

Flint River GREEN Notebook www.FlintRiver.org February, 2011 Version
This test measures the oxygen usage by living matter in the sample in the absence of photosynthesis. During the five days (in the dark), living “critters” use oxygen to survive. By subtracting the BOD(5) value from the D.O. value, oxygen usage by life in the water can be calculated. When little oxygen is removed during the five days that indicates there are very few organisms using the oxygen. The main contributor to BOD is organic waste. Organic waste can come from manure (animal or human), decomposing plant matter (such as leaves or grass clippings dumped near a stream), discharge from food processing plants, or agricultural runoff. High BOD can also come from natural sources, such as runoff from swamps.
ii. Water Quality Standards
Although there are no Michigan Water Quality Standards pertaining directly to BOD, effluent limitations for BOD must be restrictive enough to insure that the receiving water will meet Michigan Water Quality Standards for dissolved oxygen. Also, facilities that discharge waste to Michigan Rivers and streams might have certain requirements as part of their permit. The City of Flint Wastewater Treatment Plant has a BOD permit for 9-24mg/L BOD depending on the season. Good BOD levels are under 3mg/L BOD.
iii. How to conduct the test
The BOD test is essentially the same as the Dissolved Oxygen test, done 5 days later from a dark bottle.
1. Pick your location to sample. You want an area of the stream where you can completely submerge the bottle. Try to select a sampling location that is representative of the stream.
2. Rinse the sample bottle with the stream water.
3. After you have rinsed the bottle with stream water, tightly cap the bottle.
4. Submerge the bottle underneath the water completely, and remove the cap with the bottle under the water, and allow the bottle to fill.
5. While the bottle is still underneath the surface of the water, tap the sides of the bottle to get out all the air bubbles.
S e c t i o n 5 Page 49 of 114

Flint River GREEN Notebook www.FlintRiver.org February, 2011 Version
6. While the bottle is still underneath the surface of the water, put the cap back on the bottle.
7. Retrieve the bottle and make sure there are no trapped bubbles, if you have trapped bubbles, go back to step 3.
8. Wrap the bottle carefully in electrical tape or foil to keep any light from reaching the sample.
9. Place the BOD sample bottle in a dark drawer or cupboard and incubate for 5 days at room temperature (about 68 degrees Fahrenheit).
NOTE: When adding chemicals, be sure to not add air to the sample.
10. Carefully remove the cap from the bottle.
11. Add 8 drops of Manganous Sulfate Solution NOTE: Bottle may overflow, that is ok; that is why you are wearing gloves.
12. Add 8 drops of Alkaline Potassium Iodide Azide NOTE: Bottle may overflow, that is ok; that is why you are wearing gloves.
13. Cap the bottle and wipe off any chemical that overflowed the bottle.
14. Mix by inverting several times. Put your thumb over the cap and turn the bottle upside-down, then right-side-up. DO NOT shake it like a bottle of ketchup, it is more likely to go flying out of your hand that way. “Chunky stuff” will form, this is called precipitate.
15. Set the bottle down and allow the precipitate to settle down below the “shoulders” or curved part of the bottle. This should take about 5 minutes.
S e c t i o n 5 Page 50 of 114

Flint River GREEN Notebook www.FlintRiver.org February, 2011 Version
16. Immediately use the 1.0 g spoon (0697) to add one level measure of Sulfamic Acid Powder (6286). NOTE: Bottle may overflow, that is ok; that is why you are wearing gloves.
17. Cap the bottle and wipe off any chemical that overflowed the bottle.
18. Mix by inverting several times. Put your thumb over the cap and turn the bottle upside-down, then right-side-up. DO NOT shake it like a bottle of ketchup, it is more likely to go flying out of your hand that way. Keep inverting the bottle until all the precipitate is dissolved. If oxygen in present, the sample will turn a yellow or orange color
NOTE: At this point, the oxygen is “fixed” and the rest of the procedure can be done back at the school, or even on another day.
19. Fill the titration tube (0608) to the 20 mL line with the fixed sample. Cap the tube. There is a small hole in the cap to insert the titration tube.
20. Depress plunger of the Titrator (0377). The titrator looks like a blunt syringe.
21. Insert the Titrator into the plug in the top of the Sodium Thiosulfate, 0.025N (4169) titrating solution.
22. Invert the bottle and slowly withdraw the plunger until the large ring on the plunger is opposite the zero (0) line on the scale. NOTE: If small air bubbles appear in the Titrator barrel, expel them by partially filling the barrel and pumping the titration solution back into the reagent container. Repeat until bubble disappears.
23. Turn the bottle upright and remove the Titrator.
24. Add 8 drops of Starch Indicator Solution (4170WT). The sample should turn blue.
25. Insert the tip of the Titrator into the opening of the titration tube cap.
26. Slowly depress the plunger to dispense the titrating solution (Sodium Thiosulfate). As you add the titrating solution, the sample will become more pale. Gently swirl the sample as you add the titrating solution.
27. If you go through a complete titrator-full of Sodium Thiosulfate, repeat steps 19-22 to refill your titrator.
28. Continue titrating until the blue color disappears and the solution becomes colorless. Holding the titration tube over a white piece of paper helps to determine if the solution is colorless.
S e c t i o n 5 Page 51 of 114

Flint River GREEN Notebook www.FlintRiver.org February, 2011 Version
29. Read the test result directly from the scale where the large ring on the Titrator meets the Titrator barrel. Record as ppm Dissolved Oxygen. Each minor division on the Titrator scale equals 0.2 ppm.
NOTE: If you filled the Titrator more than once, each full Titrator counts as 10ppm
30. Determine the BOD level by subtracting the DO level from this sample (the 5 day) from the original DO level: DO (original) – DO (5 day) = BOD5 level
S e c t i o n 5 Page 52 of 114

Flint River GREEN Notebook www.FlintRiver.org February, 2011 Version
iv. Determining the Q – Value
S e c t i o n 5 Page 53 of 114

Flint River GREEN Notebook www.FlintRiver.org February, 2011 Version
v. Common Mistakes
1. A very common mistake is having a student collect a sample in a bucket, and bringing it up to the shore of the stream, and then pouring the water from the bucket into the sample bottle. This introduces lots of extra oxygen into the sample leading to an inaccurate result. The DO sample bottle MUST be submerged below the surface of the stream and bubbles removed underneath the surface of the water. A student in waders will probably have to get the sample for this test.
2. Be careful not to introduce air bubbles when adding chemicals.
3. Make sure you get all air bubbles out of the bottle.
4. Make sure you remove air bubble from the titrator when adding the Sodium Thiosulfate.
5. Make sure you have temperature in Celsius when calculation percent saturation.
6. Make sure you use percent saturation to determine the q-value, not ppm oxygen.
7. Students who go through multiple titrators of Sodium Thiosulfate, and only get the reading from the last one.
8. Try to get your temperature reading as close to the time of collecting and “fixing” your dissolved oxygen sample as possible.
9. Remember to put your sample in a dark bottle and a dark place.
vi. Analysis
If you have a high BOD reading, try to determine what might be using up the oxygen in the water. Was there a high amount of organic matter or “muck” at the bottom of the stream? If there was, where did that “muck” come from? Leaves from nearby trees? Runoff from a field? Grass clippings being dumped in the stream?
S e c t i o n 5 Page 54 of 114

Flint River GREEN Notebook www.FlintRiver.org February, 2011 Version
d. pH
i. Why is this test important?
Scientists use this measurement to determine if a solution is either an acid, neutral or basic (alkaline). Most life does well around the number seven on the pH scale. Since the scale goes from one to fourteen, the further the water is in either direction from seven, the greater stress is upon living things. Normal fresh water lakes and streams will show a pH around the 6-8 range.
Strong acids, like “battery acid”, would have pH around one while a strong base like “Draino” would have a pH near fourteen. Low pH (acidic) could be caused from acid rain or industrial pollution. High pH values (basic) could be caused industrial dumping or natural minerals leaching into the water, soaps and detergents.
PH is a logarithmic scale, which means something with a pH of 6 is ten times as acidic as a liquid with a pH of 7. A liquid with a pH of 5 is one hundred times as acidic as a liquid with a pH of 7.
ii. Water Quality Standards
The general range of pH for US surface waters is about 6.5 to 8.5. The pH depends on many factors such as stream vegetation, bed geology and the presence of water pollutants. In Texas, for example, the pH ranges from 5 to 9. Michigan soils tend to be high in calcium, which buffers lakes and streams from rapid changes in pH. Most Michigan water permits limit the discharge pH to 6.5 to 9 to protect aquatic life. The current drinking water standard for pH is between 6.5-8.5
iii. How to conduct the test
The test method is very simple and can be performed in about one minute.
After taking the water sample from the river or stream, put 5 ml of the sample into a test tube.
Add 10 drops of an indicator solution.
Cap the sample and mix for a few seconds, by inverting the sample. The color of the water sample will change to a blue color that is proportional to the pH of the water sample.
The pH is then determined by matching the color of the water sampled to a standardized color chart provided by the test kit. Read the pH to the nearest 0.5 units. Make sure you have light behind the sample, and a white paper behind the sample can be helpful to reduce error caused by colors in the area.
S e c t i o n 5 Page 55 of 114
Flint River GREEN Notebook www.FlintRiver.org February, 2011 Version
iv. Determining the Q-Value
Once the pH is determined from the test method, the Q-value is determined directly by reading from a graph. The graph gives the highest Q-values for pH readings in the 7 to 8 range. The Q-value is lower as the pH decreases from 7 or increases from 8. For example, at a pH of 6 or 9 the Q-value is only 50. Interestingly, the highest Q-value is about 92 at a pH of 7.4. Based on the chart from Earthforce, a Q-value of 100 cannot be achieved even with a pH level of 7.4 which is considered “perfect.”
S e c t i o n 5 Page 56 of 114

Flint River GREEN Notebook www.FlintRiver.org February, 2011 Version
v. What to watch for: Common Mistakes
The most common error in this test is when adding 10 drops of the indicator solution. It is easy to add more or less than 10 drops if the student is not paying close attention. Adding more than 10 drops provides erroneous results, and may not produce repeatable data. Another common error is in the location of the sampling site or the actual sampling. Sampling too close to the storm outfall presents challenges and in such cases the teacher or mentor should be consulted. Finally, sampling of the water should be performed carefully so that the bottom of the stream or river is not impacted, nor just a surface sample of water taken by the student. The student must be aware that the sample collected must represent the overall condition of the water body. The best place to take a sample is from the middle of a stream, not at the surface, not at the bottom, or not to close to the stream banks. This may be difficult depending on the site.
vi. Consistency when doing multiple tests
Generally, three tests or more if time permits should be performed by the student. Test results should be plus or minor 0.5 pH units. The goal is to obtain data that is accurate and precise. Any result that is extreme should be questioned and with your classroom mentor or FRWC staff. The sample mode, which is the most common pH value should be reported, not the average or mean. For example, assume test pH values are determined to be 7.5, 7.5, 8.0, 7.5 and 8.0. The value of 7.5 should be used to assess the Q-Value, rather than 7.7 which is the mean.
vii. How to analyze why the results are good or bad
There are two key questions to answer to determine if the results are results are good or bad. First, is there confidence in the reported test results? From a statistical standpoint, we are asking if the data has precision and confidence. This first question is independent of the numerical value for pH and deals with having enough test data that is fairly consistent. This results in statistical confidence of the measured value of pH. The above example of pH data shows both precision and confidence. A range of plus or minus 0.5 pH units is good.
For another example, consider the data set of 7, 8 and 9. In this scenario, there is no precision and no data mode. Additionally, the data ranges 2 pH units which is extreme. A difference of 2 pH units is a difference of 100 times! Reporting the average of pH=8 is not correct. At this point there are two options: consider the results as “not available” or continue with more testing. If two more tests revealed a pH=9, then the value of 9 is the mode and is the field sampling result.
The second question addresses if the reported test result is accurate or either an extreme value or a significant change from established norms for the test site. In the first above example, the reported test result was 7.5. If this value is within the normal historical range and what is reasonable for the specific site, then the value of 7.5 can be reported and can be assessed as “good.” In the second example above with a pH=9, the result must be questioned if it is indeed extreme or an outlier based
S e c t i o n 5 Page 57 of 114
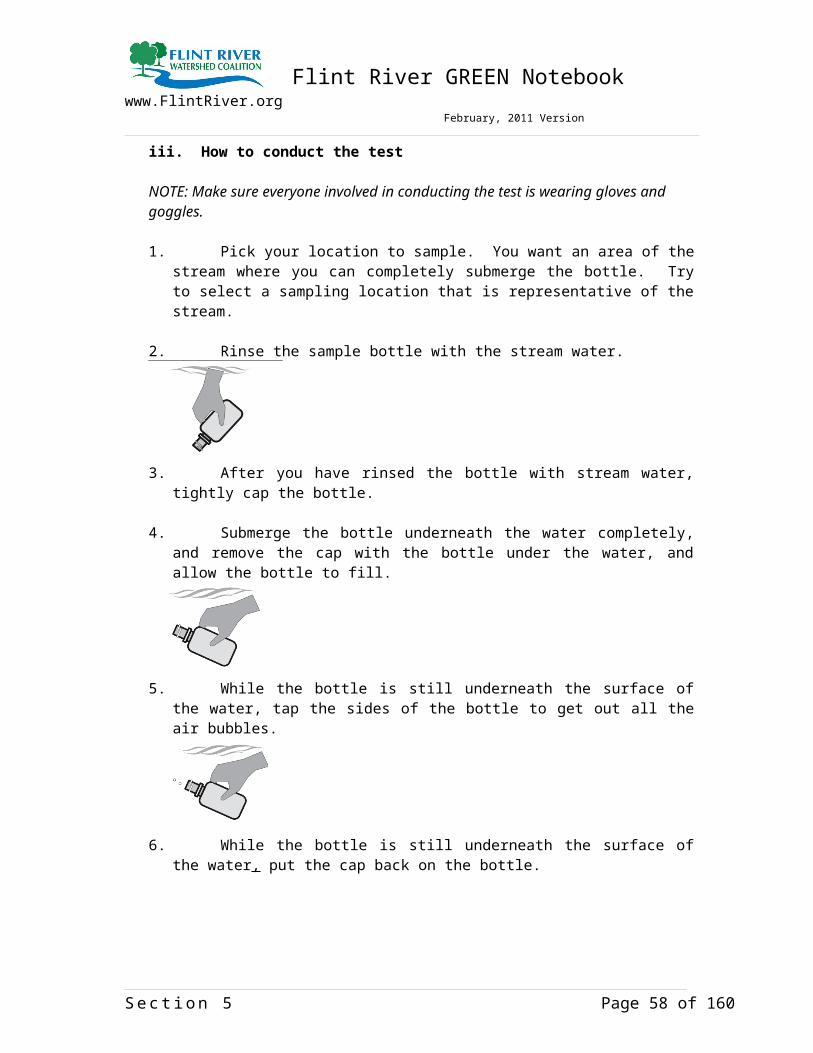
Flint River GREEN Notebook www.FlintRiver.org February, 2011 Version
on historical or long term data. The value of pH=9 maybe reported and still considered “good” provided this assessment is made to validate the data.
It should also be noted that extreme pH results of below 7 or above 9 can indicate sampling or testing error, unique problems or changing conditions with the stream, river or creek flow. In this case, the teacher or mentor should be contacted about this issue. Sampling downstream of the major storm water outfall (discharge pipe) during or after rainfall can produce such unique pH results. As such, the presence of storm water outfalls should be determined by the teacher or mentor prior to the field exercise. Also, a review of historical data in the classroom prior to the field sampling may show the existence of a highly variable pH under unique environmental conditions.
It is extremely important that the reported data be as statistically valid as possible. Some of the GREEN data is being used to satisfy NPDES storm water requirements for the Genesee Drain Commission and other decision makers in the waters. These are important considerations to keep in mind as the GREEN data is compiled.
e. Turbidity
i. Why is this test important/What does it measure
Turbidity is a measure of the relative clarity of water: the greater the turbidity the murkier the water. The amount of suspended matter in water will reduce the penetration of light into the water. As light decreases, so does photosynthesis by deeper plants. That decreases the plant growth for food for herbivores and also results in decreases in oxygen production. High turbidity can also make it difficult for predators that use sight to see and capture their prey. A rain event leading to high turbidity can also lead to bad fishing until the water clears back up again. High turbidity may be caused by soil erosion, waste discharge, urban runoff, abundant bottom feeders (such as carp) that stir up bottom sediments or algal growth.
ii. Water Quality Standards
The drinking water standards for turbidity are 5 JTUs, although most drink water providers strive for less than .1 JTU. Michigan does not have a set surface water standard for turbidity, but “settable and suspended solids should not reduce the depth of the compensation point for photosynthetic activity by more than 10% from the seasonally established norm for aquatic life”. That means that the water should not reduce light penetration by more than 10% of what is “normal”
iii. How to conduct the test
This test compares the turbidity(or clarity) of the water from the river with the clarity of distilled water. This test works by adding a substance to the distilled water to make it “dirtier” or cloudier. The readings are made by looking down through the water at a black dot. The amount of turbidity in the water will make it more difficult to see the dot.
S e c t i o n 5 Page 58 of 114

Flint River GREEN Notebook www.FlintRiver.org February, 2011 Version
1. Fill one Turbidity column to the 50 mL line with the sample water. If you cannot see the dot when looking through the water, pour out the water until you reach the 25 mL line.
2. Fill the second turbidity column with an amount of turbidity free water (distilled, deionized, or reverse osmosis water) equal to the amount being sampled.
3. Place the tubes side by side and notice the difference in clarity. If both tubes are equally clear, the turbidity is zero.
4. Shake the Standard Turbidity Reagent vigorously. DO NOT FORGET TO SHAKE IT UP. Add .5mL of Standard Turbidity Reagent to the “clear water” tube, then stir the tube to equally distribute turbid particles. Keep adding Standard Turbidity Reagent in .5ml intervals and stirring until the “clear water” tube is as cloudy as the river water. Record the amount of Standard Turbidity Reagent added.
5. Each .5ml addition equals 5 Jackson Turbidity Units in the 50mL size sample. If a 25mL sample is used, each .5L addition of Reagent equals 10 JTUs.
S e c t i o n 5 Page 59 of 114

Flint River GREEN Notebook www.FlintRiver.org February, 2011 Version
iv. Determining the Q-Value
S e c t i o n 5 Page 60 of 114

Flint River GREEN Notebook www.FlintRiver.org February, 2011 Version
v. What to Watch Out For: Common Mistakes
One of the most common mistakes in this test is adding the Standard Turbidity Reagent to the river water instead of to the “clear water”
Do not forget to shake up the Standard Turbidity Reagent vigorously before you add it to the “clear water”. Failure to do so will lead to an incorrect result.
Do not forget to stir the river water after each .5mL addition of Standard Turbidity Reagent.
Make sure you are checking for the clarity of the water, not the color of the water when you are doing the test. Sometimes it is easy to confuse the two.
Attempt to get your water sample from a part of the stream that others have not been walking around in yet. If necessary, go upstream from the rest of the students to take your sample.
vi. Consistency When Doing Multiple Tests
If you are conducting multiple tests, use the average (arithmetical mean) of all the results.
If you have a wide variety in your test results, talk to your mentor or FRWC staff about those results.
vii. How to Analyze Why The Results is Good or Bad
Turbidity can vary widely based on what part of the watershed you are in. Proximity to a rain or runoff event can also greatly affect turbidity. If you have a turbidity reading of over 25 JTUs, try to explain why this is the case. If there has been a recent rain event, that may be “normal”. If there has not been a recent runoff event, you may want to see what is causing the turbidity.
S e c t i o n 5 Page 61 of 114

Flint River GREEN Notebook www.FlintRiver.org February, 2011 Version
f. Fecal Coliform
i. Why is This Test Important / What Does it Measure
Fecal coliform bacteria are found in the feces of humans and other warm-blooded animals. These bacteria can enter rivers directly or from agricultural and storm runoff carrying wastes from birds and mammals, and from human sewage discharged into the water. Fecal coliform by themselves are not dangerous (pathogenic). Pathogenic organisms include bacteria, viruses, and parasites that cause diseases and illnesses. Fecal coliform bacteria naturally occur in the human digestive tract, and aid in the digestion of food. In infected individuals, pathogenic organisms are found along with fecal coliform bacteria.
If fecal coliform counts are high (over 200 colonies/100 ml of water sample) in the river, there is a greater chance that pathogenic organisms are also present. A person swimming in such waters has a greater chance of getting sick from swallowing disease-causing organisms, or from pathogens entering the body through cuts in the skin, the nose, mouth, or the ears. Diseases and illness such as typhoid fever, hepatitis, gastroenteritis, dysentery, and ear infections can be contracted in waters with high fecal coliform counts.Pathogens are relatively scarce in water, making them difficult and time-consuming to monitor directly. Instead, fecal coliform levels are monitored, because of the correlation between fecal coliform counts and the probability of contracting a disease from the water.
Cities and suburbs sometimes contribute human wastes to local rivers through their sewer systems. A sewer system is a network of underground pipes that carry wastewater.
In a separate sewer system, sanitary wastes (from toilets, washers, and sinks) flow through sanitary sewers and are treated at the wastewater treatment plant. Storm sewers carry rain and snow melt from streets, and discharge untreated water directly into rivers. Heavy rains and melting snow wash bird and pet wastes from sidewalks and streets and may "flush out" fecal coliform from illegal sanitary sewer connections into the storm sewers.
In a combined sewer system, sanitary wastes and storm runoff are treated at a wastewater treatment plant. After a heavy rain, untreated or inadequately treated waste may be diverted into the river to avoid flooding the wastewater treatment plant. To avoid this problem, some cities have built retention basins to hold excess waste water and prevent untreated wastes from being discharged into rivers. Without retention basins, heavy rain conditions can result in high fecal coliform counts downstream from sewage discharge points. That is why it is important to note weather conditions on the days before a fecal coliform measurement.
ii. E-coli VS Fecal ColiformTotal coliform bacteria are a group of easily cultured organisms used to indicate
S e c t i o n 5 Page 62 of 114

Flint River GREEN Notebook www.FlintRiver.org February, 2011 Version
water quality. The US Environmental Protection Agency considers any total coliform to be unacceptable in drinking water. Total coliform bacteria consist of environmental and fecal types. Coliforms are easy to isolate, present in larger numbers and usually survive longer in an aquatic environment than viruses, parasites and more serious types of bacteria. Most of the total coliforms are not considered pathogens under normal conditions.E. coli is a species of coliform bacteria that is directly linked to fecal contamination by the wastes of warm-blooded animals, including humans. Some strains are pathogens in humans.
Non-coliform bacteria are mainly environmental organisms and in large numbers can compete with total coliform and make it difficult for coliform(s) to be detected. High levels of non-coliform bacteria indicate a reduction in water quality.
ii. Water Quality Standards/What is An Ideal Temperature?
Fecal and total coliform standards for water used for drinking, recreation, and treated sewage.
iii. How to Conduct the Test
Introduction:The Coliscan Easygel medium is a patented formulation for water testing. It contains a sugar linked to a dye which, when acted on by the enzyme p-galactosidase (produced by coliforms including E. coli), turns the colony a pink color.
Similarly, there is a second sugar linked to a different dye which produces a blue-green color when acted on by the enzyme p-glucuronidase. Because E. coli
S e c t i o n 5 Page 63 of 114

Flint River GREEN Notebook www.FlintRiver.org February, 2011 Version
produces both p-galactosidase and p-glucuronidase, E.Coli colonies grow with a purple color (pink + blue). The combination of these two dyes makes possible the unique ability to use one test to differentiate and quantify coliforms and E. coli. (Because E. coli is a member of the coliform group, add the number of purple colonies to the number of pink colonies when counting total coliforms.) ® Coliscan and Easygel are registered trademarks of Micrology Laboratories, LLC.
To order, contact Voigt Global Distribution Inc: [email protected] www.VGDLLC.com In the USA, call Toll Free: 1-877-484-3552
Instructions:
1. Either collect your water sample in a sterile container and transport the water back to the test site, or take a measured water sample directly from the source and place directly into the bottle of Coliscan Easygel. Water samples kept longer than 1 hour prior to plating, or any Coliscan Easygel bottle that has had sample placed into it for transport longer than 10 minutes, should be kept on ice or in a refrigerator until plated.
2. Label the petri dishes with the appropriate sample information. A permanent marker or wax pencil will work.
3. In a sterile manner, transfer water from the sample containers into the bottles of Coliscan Easygel (Consult the following table for rough guidelines for inoculum amount). Swirl the bottles to distribute the inoculum and then pour the medium/inoculum mixtures into the correctly labeled petri dishes.
4. Place the lids back on to the Petri dishes. Gently swirl the poured dish until the entire dish is covered with liquid (but be careful not to splash over the side or on the lid).
Inoculation of Coliscan Easygel Water Sources Inoculum Amount
Environmental: River, lake, pond, stream, ditch 1.0 ~ 5.0mLDrinking water: Well, municipal, bottled 5.0mL
The dishes may be placed right-side-up directly into a level incubator or warm level spot in the room while still liquid. Solidification will occur in approximately 45 minutes.
Incubate at 35° C (95° F) for 24 hours, or at room temperature for 48 hours, (see Comments on incubation)
Inspect the dishes.
S e c t i o n 5 Page 64 of 114

Flint River GREEN Notebook www.FlintRiver.org February, 2011 Version
Count all the purple colonies on the Coliscan dish (disregard any light blue, blue-green or white colonies), and report the results in terms of E. coli or Fecal Coliform per mL of water.
Note: To report in terms of E. coli or Fecal Coliform per 100 mL of water, first find the number to multiply by
Divide 100 by the number of mL that you used for your sample.
Multiply the count in your plate by the result obtained from #1.(e.g. For a 3 mL sample, 100/3 =33.3. So, 4 E. coli colonies multiplied by 33.3 will be equal to 133.2 E. coli per 100 mL of water.)
Count all the pink and purple colonies on the Coliscan dish (disregard any light blue, blue- green or white colonies) and report the results in terms of coliforms per mL of water.
Divide 100 by the number of mL that you used for your sample.
Multiply the count in your plate by the result obtained from #1. e.g. For a 3 mL sample, 100/3 =33.3. So, 4 E. coli colonies multiplied by 33.3 will be equal to 133.2 E. coli per 100 mL of water.
Count all the pink and purple colonies on the Coliscan dish (disregard any light blue, blue- green or white colonies) and report the results in terms of coliforms per mL of water.
Do one of the following prior to disposal in normal trash:
Place dishes and Coliscan bottles in a pressure cooker and cook at 15 Lbs. for 15 minutes.(This is the best method.)
Place dishes and Coliscan bottles in an oven-proof bag, seal it, and heat in an oven at 300° F for 45 minutes.
Place dishes and Coliscan bottles in a large pan, cover with water and boil for 45 minutes.
Place 5 mL (about 1 teaspoon) of straight bleach onto the surface of the medium of each plate.
Allow to sit at least 5 minutes. Place in a water-tight bag and discard in trash.
Comments on Incubation
S e c t i o n 5 Page 65 of 114

Flint River GREEN Notebook www.FlintRiver.org February, 2011 Version
Micrology Laboratories, LLC. in-house studies indicate that Coliscan can effectively differentiate general coliforms from E. coli when incubated at either room temperatures or at elevated temperatures (such as 90-98° F). However, some further explanation may be helpful.
There is no one standard to define room temperature. Most would consider normal room temperature to vary from 68-74° F, but even within this range the growth of bacteria will be varied. Members of the bacterial family Enterobacteriaceae (which includes coliforms and E. coli (x) are generally hardy growers that prefer higher than room temperatures, but which will grow at those temperatures. They tend to grow at a faster rate than most other bacterial types when conditions are favorable. It is therefore logical to try to place inoculated dishes in a "warm" place in a room for incubation if a controlled temperature incubator is not available. It is a very easy task to make an adequate incubator from a box with a 40-60 watt bulb in it to provide heat at an even rate. One can also use a heat tape such as is used to prevent the freezing of pipes in the winter-as your heat source.
Our general instructions indicate that incubation times for coliforms (including E. coli*) are generally 24-48 hours at elevated temperatures (90-98° F) and 48 or more hours at room temperatures. At elevated temperatures, no counts should be made after 48 hours as any coliforms present will be quite evident by that time and if new colonies form after 48 hours they are most likely not coliforms, but some other type of slow growing organism that should not be included in your data. At room temperatures, the best procedure is to watch the plates by checking them at 10-12 hour intervals until you observe some pink or purple colonies starting to form and then allowing another 24-30 hours for the maturation of those colonies. Since the coliforms (including £. coif) are generally the fastest growing organisms, these will be the first to grow and be counted. Colonies that may show up at a later time are likely to not be coliforms. As you can see, there are advantages to incubating your dishes at elevated temperatures. First, you can count the results earlier. At 95° F, it is often possible to do accurate counts at 18-20 hours of incubation. There is also less probability of variation from batch to batch when the incubation temperatures are kept at one uniform level. And a higher incubation temperature will tend to inhibit the growth of non-coliforms that may prefer lower temperatures.
*E.coli is the primary fecal coliform, however, Klebsiella is sometimes of fecal origin. Other general coliform genera include Enterobacter and Citrobacter.
Interpretation of Results
This test method utilizes well established, widely accepted criteria for the recognition of coliforms and E. coli and proper application of the method will result in accurate results Therefore, if you suspect that your water is dangerously contaminated based on the results you get using Coliscan Easygel, you should contact your local health department and ask for their help in performing an official assessment of the water.
Non-fecal coliforms are widely distributed in nature, being found both as naturally occurring soil organisms, and in the intestines of warm-blooded animals and
S e c t i o n 5 Page 66 of 114

Flint River GREEN Notebook www.FlintRiver.org February, 2011 Version
humans. Fecal coliforms are coliforms found naturally only in the intestines of warm-blooded animals and humans. Fecal coliform contamination is therefore the result of some form of fecal contamination. Sources may be either animal or human.
General Notes on Differentiating Coliforms and E.Coli Generally, water containing E coli (the fecal contamination indicator organism) should not be used for drinking water unless it is sanitized in some manner. Contact your local health department for guidelines regarding E. coli and coliforms in recreational waters. Inform them if you suspect that contamination may be occurring from a specific source.
Colonies which have the blue-green color are not exhibiting any p-galactosidase activity (which is evidenced by the pink color). Because of this, they are not considered to be either coliforms or E. coli and therefore should be ignored when counting your coliform or E. coli colonies. Similarly, colonies which are white are exhibiting neither color-causing enzyme, and should also be ignored.
Colonies on the surface of the plate are exposed to the medium on only the underside of the colony. This causes these colonies to appear with much less of the indicator color. E. coli colonies may only have a slight purple tinge to them, and it may appear only in the center of the colony with the remainder of the colony being white. Similarly, coliforms on the surface may be light pink or white with a pink center.
Background information on Coliscan® Easygel®
Coliform bacteria are members of the family Enterobacteriaceae and are defined as gram negative, non-spore-forming rods which ferment the sugar lactose with the evolution of gas and acids. Many coliforms are normally found in soil and water and do not necessarily indicate the presence of fecal contamination, but Escherichia coli (E. coli) is a primary bacterium in the human and animal intestinal tract and its presence in food or water indicates fecal contamination. Therefore, E. coli is the coliform that is used as an indicator for fecal contamination. Other coliform genera include Citrobacter, Enterobacter and Klebsiella. The US EPA acknowledges that E. coli is the best indicator of health risk in fresh water and is currently recommending testing for E. coli instead of fecal coliforms. The term "fecal coliform" indicates coliforms which will grow at a temperature of 44.5° C. This is not an accurate designation as there are coliforms of non-fecal origin that will grow at 44.5° C and there are strains of E. coli that will not grow at 44.5° C.
Traditional tests for coliforms and E. coli or fecal coliforms require the inoculation of media containing lactose, incubation under carefully controlled temperatures, and examination for the presence of gas from lactose fermentation. Additional special media must then be inoculated and incubated at elevated, carefully controlled temperatures to confirm the presence of E. coli or fecal coliforms. All these require extra equipment and careful regulation of time and temperature. This approach is not only expensive and time consuming, but can be less than precise in indicating the numbers of specific organisms present.
S e c t i o n 5 Page 67 of 114

Flint River GREEN Notebook www.FlintRiver.org February, 2011 Version
As a result of the difficulties and lack of precision inherent in the older technology, new approaches have been developed and are being used very successfully. One of the best approaches is based on the fact that in order for coliforms to ferment lactose, they must produce certain enzymes which can be identified and used to verify the presence of the coliforms. General coliforms produce the enzyme galactosidase in lactose fermentation and E. coli produces the enzyme glucuronidase in addition to galactosidase.
Coliscan Easygel utilizes this information to produce a simple, accurate and quantitative method of identifying and differentiating coliforms and E. coli (true fecal coliform) from other bacteria in water and other types of samples. This patented method incorporates two special chromogenic substrates which are acted upon by the enzymes galactosidase and glucuronidase to produce pigments of different colors. To identify the presence and numbers of coliforms and E. coli, Just add a test sample to the medium, pour it into a pretreated petri dish and incubate it at room temperature or at a higher controlled temperature (35° C. is suggested). General coliforms will produce the enzyme galactosidase and the colonies that grow will be a pink color. E. coli will produce galactosidase and glucuronidase, and will grow as blue/purple colonies. It is a simple task to count the blue/purple colonies as E coli and the pink colonies as other coliforms. The sum of the E. coli and the other coliforms is the total coliform number.
Any non-colored colonies that grow in/on the medium are not coliforms or E. coli, but may be members of the family enterobacteriaceae such as Salmonella, Shigella, Proteus, etc. Likewise, it is possible that samples may contain some unusual types or strains of related organisms which produce only the enzyme glucuronidase and not the enzyme galactosidase, and these will grow as teal green colonies. Any non-colored or teal green colonies that grow on/in Coliscan Easygel should not be counted as E. coli or coliforms without further biochemical testing. It is possible that they are very unusual forms of coliform or E coli, or significant other bacterial types which should not be ignored, especially if they occur in large numbers. Since Coliscan contains inhibitors, most other bacterial types do not grow in/on it. Coliscan is best incubated at 30-37° C. (85-99° F) as coliforms grow faster at this temperature range than at lower room temperatures. At this range, counts can normally be made at 24 hours, while at lower room temperatures, counts may be best at 36-48 hours.
The beauty of the Coliscan method is that it uses proven and accepted technology to allow anyone to do effective coliform/E. coli testing. For water testing, you can add up to a 5 ml_ sample of water to the bottle of medium that makes one petri plate. This will detect as small a number of coliforms or E. coli as one living bacterium in five milliliters of water. The method is also easily adapted for large samples with membrane filter use. Beware of copycat methods by other manufacturers who claim similar red and blue colors for coliforms and fecal coliforms, but whose results are unreliable due to inferior technology. They cannot legally copy the patented Coliscan technology.
S e c t i o n 5 Page 68 of 114

Flint River GREEN Notebook www.FlintRiver.org February, 2011 Version
iv. Determining the Q-Value
S e c t i o n 5 Page 69 of 114

Flint River GREEN Notebook www.FlintRiver.org February, 2011 Version
v. What to Watch Out For: Common MistakesWhen transporting the petri dish from the testing site back to the school, make sure you keep it level, so the sample does not spill out
Make sure you put the sample in the incubator when you get back to the school
Make sure you check the sample in the 24-48 hour window
vi. Consistency When Doing Multiple Tests
If you do multiple tests for fecal coliform, use the average (arithmetical mean) of the samples. If there is an extreme difference between the readings, contact your mentor or the FRWC for advice.
vii. How to Analyze Why The Results is Good or Bad
Any reading over 200 FC is cause for concern. You might want to consider re-testing the site. If the site continues to have high fecal coliform readings, this would be a good opportunity for students for try to determine potential sources of fecal contamination in the water.
g. Nitrates
i. Why is this test important/What does it measure
Nitrogen is the most abundant element in the Earth’s atmosphere, making up about 78% of the air around us. Nitrates are a form of nitrogen that all plants need to grow. When you purchase a bag of fertilizer, the first number on the bag represents the amount of available nitrogen for plants. For example, if you buy a hundred pound bag of 12-0-0 fertilizer, 12 pounds of that bag will be nitrogen. Nitrogen can be converted to nitrates through nitrogen fixing bacteria or lightning. Nitrogen fixing bacteria often exist in the roots of plants called legumes, such as clover or beans.
High levels of nitrogen in surface water can lead to increased plant growth. When those plants die, they rot. That decomposition process uses up oxygen so there is not as much available for fish and other life in the water. High nitrate levels in drinking water can prevent babies from carrying oxygen; hence the nickname “blue baby” syndrome (methemoglobinemia). Nitrates can enter a body of water through fertilizers, animal manure (including from pets, wildlife, or farm animals), failing human septic and sewage treatment systems, and decomposing plant material.
S e c t i o n 5 Page 70 of 114

Flint River GREEN Notebook www.FlintRiver.org February, 2011 Version
ii. Water Quality Standards
Current drinking water standards for nitrates, set by EPA are 10 mg/L nitrates (measured as nitrogen) [what does that mean]. Even levels below this can cause “blue baby syndrome” or shortness of breath in some infants. Surface water quality standards are 20 mg/L.
iii. How to conduct the test:
NOTE: THIS TEST HAS HAZARDOUS WASTE MATERIALS: PLEASE WEAR GLOVES & GOGGLES AND MAKE SURE WASTE IS DISPOSED OF PROPERLY.
1. All glassware must be cleaned with dilute HCL and rinsed with deionized water before the test is taken out to the lake. Do not rinse with distilled water; it contains ammonia (NH3) which will interfere with the test. If you cannot rinse with deionized water; rinse all glassware with the sample water(i.e. water from the river).
2. Fill the sample bottle with sample water (Please note the difference between the sample bottle and the test tube; fill the sample bottle so you can re-do the test if needed).
3. Fill the test tube to the 2.5mL line with water from the sample bottle.
4. Dilute to 5 mL line with Mixed Acid Reagent. Cap the test tube and mix by inverting the test tube.
5. Use the .1 gram spoon to add one level measure of Nitrate Reducing Agent. Cap and invert the sample approximately 60 times in one minute.
6. Wait 10 minutes
7. Insert the test tube into the Nitrate Comparator. Match the colors in the sample.
8. Record ppm Nitrate as Nitrate Nitrogen. To convert to Nitrates multiply by 4.4
S e c t i o n 5 Page 71 of 114

Flint River GREEN Notebook www.FlintRiver.org February, 2011 Version
iv. Determining the Q-Value
S e c t i o n 5 Page 72 of 114

Flint River GREEN Notebook www.FlintRiver.org February, 2011 Version
v. Common Mistakes Not waiting the full 10 minutes for the test to finish
Recording the amount incorrectly on the data sheet
adding the chemicals to the sample bottle instead of the test tube
vi. Consistency when doing multiple tests:
This test is very time-intensive, so doing multiple tests can be difficult. If you do multiple tests, use the average (arithmetical mean) and report that result.
If the results are drastically different, contact your mentor or FRWC staff for help making a decision on whether or not to report those results
vii. How to Analyze Why the Results are Good or Bad
Any results over 10ppm nitrates could lead to potential increased plant growth in a stream. If the body of water is used as a drinking water supply, this could negatively affect the health of those drinking the water if it is not properly treated.
h. Phosphorus, Phosphates
i. Why is this test important?
Phosphorus (P) is an element and is abundant in the earth’s crustal material. About 12% of the earth’s crust is P, chiefly as calcium phosphate. It is an important plant nutrient that helps root and flower development. If you buy a bag of fertilizer at the store, the middle number on the bag is the percent of phosphorus by weight. For example, a hundred pound bag of 12-10-10 fertilizer will contain 10 pounds of phosphorus.
Phosphorus makes plants grow in lakes & streams. A pound of phosphorus entering a lake or stream can lead to 500 pounds of “seaweed” or algae growth in that lake or stream. When those plants die, they rot. That decomposition process uses up oxygen so there is not as much available for fish and other life in the water. Too much phosphorus can also lead to algae blooms in the water. Some kinds of algae are toxic to humans and pets. There have been cases of pets getting sick or dying from drinking lake or pond water with toxic algae.
Because of these issues, several communities in Michigan (Allegan, Bay, and Ottawa Counties) and the entire state of Minnesota have banned phosphorus from lawn fertilizers. It has already been banned from laundry detergents and dishwasher detergents.
S e c t i o n 5 Page 73 of 114

Flint River GREEN Notebook www.FlintRiver.org February, 2011 Version
Phosphorus gets into streams mostly through soil erosion. Phosphorus does a good job of “sticking to” particles of soil and wash into the stream. Phosphorus can also enter a body of water through fertilizers, animal manure (including from pets, wildlife, or farm animals), and decomposing plant material.
Understanding the difference between phosphorus, phosphate, and orthophosphate can be confusing.
Phosphorus, is an element (P) that rarely exists in its pure form in nature. Phosphorus occurs in natural waters almost always as phosphates, the oxidized form of P.
Phosphates are classified as orthophosphates, condensed phosphates and organically bound phosphates. They occur in solution, in particles and in the bodies of aquatic organisms. The most common forms of orthophosphates are PO4, HPO4 and H2PO4 depending on the pH of the water.
The test method for determining phosphates is LaMotte Method 3121-01. The method is simple and can be run in about 7-10 minutes. The method is specific for orthophosphates in solution. It is a colorimetric method meaning that chemicals are added to the water sample which turns the water a color, which is proportional to the amount of phosphate in the water. The method has a lower detectable limit of about 0.1 mg/l or ppm, representing a “faint” color. Results from the testing method should be reported to within 0.5 mg/l.
ii. Water Quality Standards
Water quality standards allow for only a small amount phosphates in water. The EPA water quality criteria state that phosphates should not exceed 0.05 mg/l if streams discharge into lakes or reservoirs, 0.025 mg/l within a lake or reservoir, and 0.1 mg/l in streams or flowing waters not discharging into lakes or reservoirs to control algal growth (USEPA, 1986). Surface waters that are maintained at 0.01 to 0.03 mg/l of total phosphorus tend to remain uncontaminated by algal blooms. The natural background levels of total phosphorus are generally less than 0.03 mg/l. The natural levels of orthophosphate usually range from 0.005 to 0.05 mg/l.
iii. How to conduct the testPART 1 Conducting the test using a LaMotte Test Kit (Optional)
1. Obtain the water sample from the river, stream or lake.
2. Fill the test tube (0843) to the 10mL line with the water to be tested for phosphate.
3. Use the 1.0 mL pipet (0354) to add 1.0mL of the Phosphate Acid Reagent (PAR) V-6282 to the sample in the test tube and cap and mix until dissolved. Note: The PAR contains sulfuric acid and an ammonium molybdate compound.
S e c t i o n 5 Page 74 of 114

Flint River GREEN Notebook www.FlintRiver.org February, 2011 Version
4. Wait 5 Minutes.
5. Remove cap from test tube. Place tube in Phosphate Comparator (3122) with Axial Reader (2071). Read Axial Reader Instruction Manual befor proceeding
6. Fill two test tubes (0843) to the 10mL line with sample water. Place in Axial Reader. Match sample color to a color standard. Record as ppm Orthophosphate.
7. When entering the Q-Value on the WQI Form (Water Quality Index), multiply the Q-Value by 4.
In general, the deeper the blue color the more phosphate in the sample water.
NOTE: the waste liquid from this test is classified as hazardous so handle accordingly.
PART 2 Collecting a Sample for GM Lab
Each classroom will be supplied a bottle to collect a sample for the phosphorus test to be done at a GM laboratory. Do NOT pre-rinse the bottles, or rinse the bottles at the river -- Bottles supplied by GM via FRWC are usually pre-treated with sulfuric acid—a small preservative.
Obtaining a water sample should be done carefully and NOT obtained from the surface or bottom, but from the middle layer of the river.
Bottles do NOT need to be completely full.
Samples should be kept in a small cooler after sampling.
If using a bottle that has NOT been treated with sulfuric acid, the sample NEEDS to be kept cooled and analyzed within 48 hours. (Using the acid allows the sample to be tested within a 10-day period of when the sample was taken.)
Samples need to be identified and taken to the Genesee Intermediate School District, Attention: Lisa Hook.
Identification includes:1. Date When Sample was taken2. School Name3. Teacher's Name4. Sample's Test (Total Phosphates, or Total Solids)5. Water body sampled and place of sampling
The samples will be tested and the results sent to the Flint River Watershed Coalition (FRWC) for distribution to the teachers.
S e c t i o n 5 Page 75 of 114

Flint River GREEN Notebook www.FlintRiver.org February, 2011 Version
iv. Determining the Q-ValueOnce the phosphate concentration is determined from the test method, the Q-value is determined directly by reading from a graph. The graph gives the highest Q-value for a phosphate level of zero and decreases rapidly as phosphate increases. For example, at a value of 0.5 mg/l or ppm the Q-Value is only about 50. Interestingly, the highest Q-value is about 98 at a phosphate concentration of zero. Based on the chart from Earthforce, a value of 100 cannot be achieved even with a level of zero.
S e c t i o n 5 Page 76 of 114
Total Phosphate Test Results

Flint River GREEN Notebook www.FlintRiver.org February, 2011 Version
v. What to watch for: Common Mistake
There are several potential errors when conducting this test. First, the most common error in this test is not waiting the required 5 minutes to assess the level of phosphates. Second, another common error is not filtering the sample if it contains a significant amount of solids. Third, is the importance of the location of the sampling site or the actual sampling. Sampling too close to the storm outfall presents challenges and in such cases the teacher or mentor should be consulted. Also, sampling of the water should be performed carefully so that the bottom of the stream or river is not impacted, nor just a surface sample of water taken by the student. The student must be aware that the sample collected must represent the overall condition of the water body.
There may also be confusion in reading the color of the result. Holding a white piece of paper behind the sample can help reduce colors from the environment making it difficult to read the sample.
Finally, there can be confusion about whether to report results for phosphate or phosphorus. As noted the reference test method is specific for orthophosphates. If the data must be reported as phosphorus (P) the results for phosphate should be multiplied by 0.3 to calculate the value of P. The value of 0.3 is the ratio of the atomic weights of P to PO4. Note-the final WQI Data Summary Chart Form provided by Earthforce (and FRWC) lists Total Phosphorus (rather than Total Phosphate) as the testing pollutant of interest. If P is reported on this form and used to assess the water’s overall WQI using the conversion factor mentioned above, the P data form should be footnoted.
vi. Consistency when doing multiple tests
Generally, three tests or more if time permits should be performed by the student. Test results should be plus or minor 0.5 units. The goal is to have data that is accurate and precise. Any result that is extreme should be questioned and perhaps discarded. The sample mode, which is the most common value should be reported, not the average or mean. For example, assume test values are determined to be 1.0, 0.5, 0.5, 1.0 and 0.5. The value of 0.5 should be used to assess the Q-Value, rather than 0.7 which is the mean. This results in a Q-Value of about 50.
vii. How to analyze why the results are good or bad
S e c t i o n 5 Page 77 of 114

Flint River GREEN Notebook www.FlintRiver.org February, 2011 Version
There are two key questions to answer to determine if the results are results are good or bad. First, is there confidence in the reported test results? From a statistical standpoint, we are asking if the data has precision and confidence. This first question is independent of the numerical value for phosphate and deals with having enough test data that is fairly consistent. This results in statistical confidence that the measured value of phosphate. The above example of phosphate data shows both precision and confidence. The data range is only 0.5 units which is good.
For a second example, consider the data set of 0.5, 1.0 and 1.5. In this scenario, there is no precision; no data mode and the results vary by 1.0 unit which is not attractive. Reporting the average of 1.0 is not correct. At this point there are two options: consider the results as “not available” or continue with more testing. If two more tests revealed a phosphate of 1.5, then the value of 1.5 is the mode and is the field sampling result.
The second question addresses if the reported test result is either an extreme value or a significant change from established norms for the test site. Basically, we are interested in data accuracy, but with an eye on possible changing trends. In the first above example, the reported test result was 0.5. If this value is within the normal historical range and what is reasonable for the specific site, then the value of 0.5 can be reported and can be assessed as “good.” In the second example above with a value of 1.5, the result can be questioned if it is indeed extreme or an outlier based on historical or long term data. The value of 1.5 maybe reported and still considered “good” provided this assessment is made to validate the data.
It should also be noted that extreme phosphate results of above 3-5 can indicate sampling or testing error, unique problems or changing conditions with the stream, river or creek flow. In this case, the teacher or mentor should be contacted about this issue. Sampling downstream of the major storm water outfall (discharge pipe) during or after rainfall can produce such unique phosphate results. As such, the presence of storm water outfalls should be determined by the teacher or mentor prior to the field exercise. Also, a review of historical data in the classroom prior to the field sampling may show the existence of a highly variable phosphate under unique environmental conditions.
Finally, it is extremely important that the reported data be as statistically valid as possible. First, some of the GREEN data is being used to satisfy NPDES storm water requirements for the Genesee Drain Commission and being used by other policy makers to make decisions. Second, if a water quality problem is identified and an action plan is developed for a civic approach to resolve or minimize the problem the GREEN data should be as accurate as possible. These are important considerations to keep in mind as the GREEN data is compiled.
i. Turbidity
i. Why is this test important/What does it measure
S e c t i o n 5 Page 78 of 114

Flint River GREEN Notebook www.FlintRiver.org February, 2011 Version
Turbidity is a measure of the relative clarity of water: the greater the turbidity the murkier the water. The amount of suspended matter in water will reduce the penetration of light into the water. As light decreases, so does photosynthesis by deeper plants. That decreases the plant growth for food for herbivores and also results in decreases in oxygen production. High turbidity can also make it difficult for predators that use sight to see and capture their prey. A rain event leading to high turbidity can also lead to bad fishing until the water clears back up again. High turbidity may be caused by soil erosion, waste discharge, urban runoff, abundant bottom feeders (such as carp) that stir up bottom sediments or algal growth.
ii. Water Quality Standards
The drinking water standard for turbidity is 5 JTUs, although most drink water providers strive for less than .1 JTU. Michigan does not have a set surface water standard for turbidity, but “settable and suspended solids should not reduce the depth of the compensation point for photosynthetic activity by more than 10% from the seasonally established norm for aquatic life”. That means that the water should not reduce light penetration by more than 10% of what is “normal”
iii. How to conduct the test
This test compares the turbidity(or clarity) of the water from the river with the clarity of distilled water. This test works by adding a substance to the distilled water to make it “dirtier” or cloudier. The readings are made by looking down through the water at a black dot. The amount of turbidity in the water will make it more difficult to see the dot.
1. Fill one Turbidity column to the 50 mL line with the sample water. If you cannot see the dot when looking through the water, pour out the water until you reach the 25 mL line
2. Fill the second turbidity column with an amount of turbidity free water (distilled, deionized, or reverse osmosis water) equal to the amount being sampled.
3. Place the tubes side by side and notice the difference in clarity. If both tubes are equally clear, the turbidity is zero.
4. Shake the Standard Turbidity Reagent vigorously. DO NOT FORGET TO SHAKE IT UP. Add .5mL of Standard Turbidity Reagent to the “clear water” tube, then stir the tube to equally distribute turbid particles. Keep adding Standard Turbidity Reagent in .5ml intervals and stirring until the “clear water” tube is as cloudy as the river water. Record the amount of Standard Turbidity Reagent added.
5. Each .5ml addition equals 5 Jackson Turbidity Units in the 50mL size sample. If a 25mL sample is used, each .5L addition of Reagent equals 10 JTUs.
S e c t i o n 5 Page 79 of 114

Flint River GREEN Notebook www.FlintRiver.org February, 2011 Version
iv.
Determining the Q-Value
S e c t i o n 5 Page 80 of 114

Flint River GREEN Notebook www.FlintRiver.org February, 2011 Version
v. What to Watch Out For:
Common Mistakes
One of the most common mistakes in this test is adding the Standard Turbidity Reagent to the river water instead of to the “clear water”
Do not forget to shake up the Standard Turbidity Reagent vigorously before you add it to the “clear water”. Failure to do so will lead to an incorrect result.
Do not forget to stir the river water after each .5mL addition of Standard Turbidity Reagent.
Make sure you are checking for the clarity of the water, not the color of the water when you are doing the test. Sometimes it is easy to confuse the two.
Attempt to get your water sample from a part of the stream that others have not been walking around in yet. If necessary, go upstream from the rest of the students to take your sample.
vi. Consistency When Doing Multiple Tests
If you are conducting multiple tests, use the average (arithmetical mean) of all the results.
If you have a wide variety in your test results, talk to your mentor or FRWC staff about those results.
vii. How to Analyze Why The Results is Good or Bad
Turbidity can vary widely based on what part of the watershed you are in. Proximity to a rain or runoff event can also greatly affect turbidity.
If you have a turbidity reading of over 25 JTUs, try to explain why this is the case. If there has been a recent rain event, that may be “normal”.
If there has not been a recent runoff event, you may want to see what is causing the turbidity.
S e c t i o n 5 Page 81 of 114

Flint River GREEN Notebook www.FlintRiver.org February, 2011 Version
j. Total Solids
i. Why is this test important? What does it measure?In this test, two factors are considered, the solids that are dissolved in the water and the solids that do not dissolve in the water. The un-dissolved solids may be soil, plankton or industrial waste and sewage. Dissolved solids may include: salts, minerals, iron, sulfur, and other ions found in water. Un-dissolved solids might be leaves, soil, or decayed plant and animal matter. High concentrations of dissolved solids can lead to unpleasant taste and laxative effects in drinking water (other effects may be: reduced water clarity, decrease in photosynthesis, binding with toxic compounds and heavy metals, and increased water temperature through greater absorption of sunlight). Low concentrations of dissolved solids may limit growth of aquatic organisms (and the effects of such decreases). Total solids is a combination of total dissolved solids (TDS) and total suspended solids (TSS). TDS is all the substances in a solution in ionized or molecular form. TSS are the substances that can be captured by a filter. The term "settleable solids" refers to material of any size that will not remain suspended or dissolved in a holding tank not subject to motion, and excludes both TDS and TSS.
ii. Water Quality StandardsThere are no surface water quality standards for total solids in Michigan.
iii. How to conduct the test Label your sample container with the following information:
o Date Sample was taken.o School Nameo Teacher's Nameo Type of Test "Total Solids"o Water body sampled & place it was sampled.
Place a fresh sample of at least 250 mL taken from the middle depths of the river into a glass or plastic bottle.
Sample is to be bottled and placed on ice until stored in a refrigerator. Sample needs to be at less than or equal to 6 *C (6 degrees Celsius).
Sample must be tested within 7 days.
For testing pick-up Mentors assist teachers with delivering samples to the Genesee Intermediate School District to either Larry Casler and/or Lisa Hook.
The WPC will retrieve the samples for testing.
S e c t i o n 5 Page 82 of 114

Flint River GREEN Notebook www.FlintRiver.org February, 2011 Version
Testing results are sent to the Flint River Watershed Coalition (FRWC) for distribution to the teachers.
Note: It is important that your sample be fresh. Because solid particles suspended in a sample that has been sitting for a while will have settled to the bottom of the sample over time—preventing you from receiving a representative sample. Remove any large floating particles or submerged masses from your sample and put the cap on it.
iv. Q Value
S e c t i o n 5 Page 83 of 114

Flint River GREEN Notebook www.FlintRiver.org February, 2011 Version
v.
What to Watch Out For: Common Mistakes The most common mistake in the total solids test is getting water that is
contaminated by other students who have been walking in the stream. Attempt to collect the sample for this test from an undisturbed portion of the
stream.
vi. Consistency When Doing Multiple Tests
S e c t i o n 5 Page 84 of 114

Flint River GREEN Notebook www.FlintRiver.org February, 2011 Version
Because this test is usually done by one sample submitted to labs at GM, multiple tests is not an issue for this test.
vii. How to Analyze Why The Results is Good or Bad Like turbidity, total solids can vary widely depending on recent weather.
Recent rainfall or snowmelt events can greatly increase total solids. If there has not been a recent rain or snow event, readings of greater than
100mg/L might be cause for more investigation.
S e c t i o n 5 Page 85 of 114

Flint River GREEN Notebook www.FlintRiver.org February, 2011 Version
1. STREAM HABITAT ASSESSMENT
Stream Name:
Location: Circle One: Monitoring Upstream –or— Downstream of road?
Date:_______________________________________Collection Start Time: _____________ (AM / PM)
Site ID:______________________________________County & Township: _____________________
Major Watershed: Flint River Watershed HUC Code (if known):____________________
Latitude: (if known)_____________________________Longitude: (if known) ________________________
Monitoring Team:
Name(s) of Person(s) Completing Datasheet : ___________________________________________
Name(s) of Person(s) Collecting :______________________________________________________
Other Team Members: ______________________________________________________________
Macro invertebrate Collection: Check the habitats that were sampled. Make sure you are sampling all habitats present.
_____ Riffles _____ Large Rocks _____ Submerged Wood/Woody debris
_____ Overhanging Vegetation _____ Leaf Packs _____ Other/Describe Below:
_____ Rooted Aquatic Plants _____ Pools
_____ Runs _____ Eddys
_____ Undercut banks/Overhanging Vegetation
Did you see any: Live Crayfish? --or-- Large Clams? (Crayfish & Clams are Not Collected, just counted.)( ) No, ( ) Yes -- If yes, remember to include them in the assessment at end.
How many crayfish? ______ How many live clams? _______
Collection: Finish Time: _____________________ (AM / PM)
Comments: Were other wildlife present, including fish? If yes, please list what was seen and how many. Possible pollution sources can also be listed here.
S e c t i o n 5 Page 86 of 114

Flint River GREEN Notebook www.FlintRiver.org February, 2011 Version
II. Flow Measurement
To take a correct stream flow measurement, face upstream in a straightaway with your partner 12 feet downstream. Throw your float at least 10 feet upstream from where you stand (away from your partner). This allows the float to fully accelerate by the time it reaches you. Begin timing once it reaches you. Stop when it reaches your partner.
Flow Measurement Data
Measurements Width (feet)
Measuring River Width
Depth (feet)Flow Measurement Data
1/4 Way Into Stream
Middle of Stream
3/4 Across Stream
Average depth
Time (sec)
Distance (feet)(always 12 feet)
1
2
3 Results - Office Use only Average width: Overall Average depth: Average Flow:
EXAMPLE: Measurement Data
Measurement Width (ft)Depth (ft) Distance
(feet)1 2 3 4 Time (sec)1 25 1.7 2.1 2.2 2 12.0 102 24 2.2 2.3 2.4 2.3 15.0 103 21 2.0 1.8 1.7 1.83 13.0 10
Average stream width and depth: - Stream width is the distance from the water’s edge on one side of the stream to the other side.
- Monitors shall take three measurements of width and depth at random straightaways along the 300 foot long sampling area, avoiding sand bars, curves, and debris.
S e c t i o n 5 Page 87 of 114

Flint River GREEN Notebook www.FlintRiver.org February, 2011 Version
III. Bank Height
Vertical banks higher than 3 feet are usually unstable, while banks less than 1 foot, especially with overhang, provide good habitat for fish. Undercut bank angles (<90°) often improve the habitat. While doing the transects, measure the bank heights and record the angle of the bank as indicated on the data sheet. Left/right banks are identified by looking downstream.
Data use: Calculate the percentage of banks with acute (undercut), obtuse, and right angles. Right angles indicate higher erosive potential, while acute angle improve the habitat structure of a stream.
%______ Acute (Undercut)
%______ Obtuse
%______ Right
B. Riparian Zone
S e c t i o n 5 Page 88 of 114

Flint River GREEN Notebook www.FlintRiver.org February, 2011 Version
1. Left Bank (looking downstream)
Circle those land-use types you can see from this stream reach:
Wetlands Forest Residential Lawn Park Shrub, Old Field Agriculture
Construction Commercial Industrial Highways Golf Course Road Other _______________________
1. Right Bank (looking downstream)
Circle those land-use types you can see from this stream reach:
Wetlands Forest Residential Lawn Park Shrub, Old Field Agriculture
Construction Commercial Industrial Highways Golf Course Road Other _______________________
3. Summarize the size and quality of the riparian zone along each bank separately on a scale of 1 through 10 by circling a value below:
Excellent Good Marginal PoorWidth of riparian zone >150 feet, dominated by vegetation, including trees, understory shrubs, or non-woody macrophytes or wetlands; vegetative disruption through grazing or mowing minimal not evident; almost all plants allowed to grow naturally.
Width of riparian zone 75-150 feet; human activities have impacted zone only minimally.
Width of riparian zone 10-75 feet; human activities have impacted zone a great deal.
Width of riparian zone, 10 feet; little or no riparian vegetation due to human activities.
Left bank = 10 9
Left bank = 8 7 6
Left bank = 5 4 3
Left bank = 2 1 0
Right bank = 10 9
Right bank = 8 7 6
Right bank = 5 4 3
Right bank = 2 1 0
S e c t i o n 5 Page 89 of 114

Flint River GREEN Notebook www.FlintRiver.org February, 2011 Version
IV. Stream and Riparian Habitat
S e c t i o n 5 Page 90 of 114
C. General InformationCircle one or more answer as appropriate
1 Event Conditions Rain Sunny Windy Other:
2Channel Condition (Stream shape constrained through human activity?)
Natural Recovering Maintained
3
Has this stream been channelized (stream shape constrained through human activity)?
Yes, currently
Yes, sometime in the past
No
4 Estimate of current stream flow Dry Stagnan
t Low Medium High
5Highest water mark (In feet above the current level.)
<1 1-3 3-5 5-10 >10
6 Estimate of turbidity Clear Slightly Turbid (can vaguely see to bottom)
Turbid (cannot see to bottom)
7Is there a sheen or oil slick visible on the surface of the water?
Yes No
8If yes to # 7, does the sheen break up when poked with a stick?
Yes (sheen is most likely natural)
No (sheen could be artificial)
9 Is there foam present on the surface of the water? Yes No
10
If yes to #9, does the foam feel gritty or slippery? (please circle one)
Gritty – foam is most likely natural
Slippery – foam is most likely artificial
11If the water smells, please describe:
12 Water Temperature (°C)
13 Air Temperature (°C)
14 Has it rained in the last 5 days? Yes No
If yes, approximate the number of inches:

Flint River GREEN Notebook www.FlintRiver.org February, 2011 Version
D. Plant Community
Estimate the percentage of stream covered by overhanging vegetation (near the water) ____________%
Estimate the percentage of stream covered by overhanging tree canopy ____________%
Using the given scale below, estimate the relative abundance of the following types of vegetation present:
Plants in Stream Plants on Bank and in Riparian ZoneAlgae on Surfaces of Rocks or Plants
Filamentous Algae (Streamers)
Shrubs Trees
Macrophytes (Standing Plants)
Other Grasses Other
Scale: 0 = Absent,1 = Rare, 2 = Common, 3 = Abundant, 4= Dominant
E. Streambed SubstrateEstimate percent of stream bed composed of the following substrate, and percent embedded for larger substrateSubstrate type Size Percent of
stream bedPercent Embedded
Boulder >10” diameterCobble 2.5 – 10” diameterGravel 0.1 – 2.5” diameterSand Course grainFines (Silt/Detritus/Muck)
Fine grain/organic matter
Hardpan/Bedrock Solid clay/rock surface
Artificial Man-madeOther (specify)
S e c t i o n 5 Page 91 of 114

Flint River GREEN Notebook www.FlintRiver.org February, 2011 Version
S e c t i o n 5 Page 92 of 114
F. Substrate Embeddedness
Do you have Gravel, Cobble, or Boulders in
your stream?
( ) Yes ( ) No
Please list what percentage they are
embedded
Flint River GREEN Notebook www.FlintRiver.org February, 2011 Version
V. Sources of Degradation
Severity: S – slight (0-25%); M – moderate (26-75%); H – high (76-100%) Clarify below if necessary
Crop Related Sources S M H Signs of cows/horses/etc. using or crossing the stream
S M H
Grazing Related Sources S M H On-site Wastewater Systems S M H
Intensive Animal Feeding Operations
S M H Silviculture (Forestry) S M H
Highway/Road/Bridge Maintenance and Runoff
S M H Resource Extraction (Mining) S M H
Channelization SM
H Recreational/Tourism Activities (general) S M H
Dredging S M H Golf Courses S M H
Removal of Riparian Vegetation S M H Marinas/Recreational Boating (water releases) S M H
Bank and Shoreline Erosion/ Modification/Destruction S M H
Marinas/Recreational Boating (bank or shoreline erosion)
S M H
Flow Regulation/ Modification (Hydrology)
S M H Debris in Water S M H
Land Disposal S M H Debris in Trees S M H
Urban Runoff S M H Trash in trees along bank S M H
Impoundment –Dam (natural or man-made) S M H Industrial Point Source S M H
Construction: Highway, Road, Bridge, Culvert S M H Municipal Point Source S M H
Construction: Land Development S M H Source(s) Unknown S M H
Natural Sources S M H
S e c t i o n 5 Page 93 of 114

Flint River GREEN Notebook www.FlintRiver.org February, 2011 Version
VI. Stream Map
l.
Benthic Collection (optional)
S e c t i o n 5 Page 94 of 114

Flint River GREEN Notebook www.FlintRiver.org February, 2011 Version
Chemical sampling only gives us a snapshot of what is going on in a stream. The benthic macroinvertebrates are the insects and other “creek critter” that have to live in a stream through any particular pollution event. By the number and types of critters found, you can get an idea of the cleanliness of a stream.
Students should sample each habitat, from the most diverse, to the least diverse, in the order below.
After collecting the critters, count and identify them.
i. Procedure
1. Riffles. Riffles are areas with shallow, rapid flow where the water surface “ripples”. Because water is moving rapidly over rocks, these areas tend to have lots of oxygen, and lots of food particles moving by for invertebrates to eat. That is why this is the most diverse habitat.
R.1 Sample both the fastest and slowest moving areas of the riffle. Begin at the downstream end of the reach to be sampled and work upstream. This keeps the working area undisturbed.
R.2 With the net opening facing upstream, place the bottom of the net flush on the stream bottom immediately downstream of the riffle. Do not scoop the substrate with the net! Position the handle perpendicular to the stream flow.
R.3 While one person (the “netter”) holds the net, another person (the “collector”) picks up large rocks (2 inch or greater diameter) within a 1 foot by 1 foot area directly in front of the net opening and gently rubs them in the net opening to remove any clinging organisms. Be sure to hold the rock under the water in front of the net so that flowing water will carry the materials into the net opening. Place (do not toss) the cleaned rocks outside the sampling area.
R.4 When all the rocks (or as many as possible) are removed from the sample area, the “collector” stands approximately one foot upstream of the net opening and kicks the stream bed vigorously to dislodge any remaining organisms into the net. Kick down approximately two inches into the substrate for one to two minutes while moving toward the net.
S e c t i o n 5 Page 95 of 114

Flint River GREEN Notebook www.FlintRiver.org February, 2011 Version
2. Leaf Packs Look in the stream for leaves that are about four to six months old. These old leaf packs are dark brown and slightly decomposed. Only a handful of leaves are necessary.
L.1 Begin at the downstream end of the reach to be sampled and work upstream. This keeps the working area undisturbed.
L.2 With the net opening facing downstream, place the bottom of the net flush on the stream bottom immediately downstream from the leaf pack. Position the handle perpendicular to the stream flow.
L.3 Gently shake the leaf pack in the water to release some of the organisms, then quickly scoop up the net, capturing both the organisms and the leaf pack in the net.
3. Tree Roots, Snag Areas, and Submerged Logs Snags are accumulations of debris caught or “snagged” by logs or boulders lodged in the stream current. Caddisflies, stoneflies, riffle beetles, and midges commonly inhabit these areas.
T.1 Select an area on the tree roots, snap, or submerged logs which is approximately 3 feet by 3 feet in size. Begin at the downstream end of the reach to be sampled and work upstream. This keeps the working area undisturbed.
T.2 Scrape the surface of the tree roots, logs, or other debris with the net while on the downstream side of the snag. You can also disturb such surfaces by scraping them with your foot or large stick, or by pulling off some of the bark to get at the organisms hiding underneath. In all cases, be sure the net is positioned downstream from the snag, so that dislodged material floats into the net.
T.3 You may remove a log from the water to better sample from it, but be sure to replace it when you are done.
4. Undercut Bank Undercut banks are areas where moving water has cut out vertical or nearly vertical banks, just below the surface of the water. In such areas you will find overhanging vegetation and submerged root mats that harbor dragonflies, damselflies, and crayfish.
U.1 Place the net below the surface under the overhanging vegetation.
U.2 Move the net in a bottom – up motion, jabbing at the bank five times in a row to loosen organisms.
S e c t i o n 5 Page 96 of 114

Flint River GREEN Notebook www.FlintRiver.org February, 2011 Version
S e c t i o n 5 Page 97 of 114

Flint River GREEN Notebook www.FlintRiver.org February, 2011 Version
Identification and Assessment
To record the approximate numbers of live organisms collected in each taxa found in the stream reach, use letter codes: R (rare) for 1 to 10; and C (common) for 11 or more. **Do NOT count empty shells, pupae, or terrestrial macro invertebrates.Group 1: Sensitive STREAM QUALITY SCORE
Caddisfly Larvae (Trichoptera) GROUP 1:Except Net-spinning caddis (listed in Group 2) # of R’s x 5.0 =Hellgrammites (Megaloptera)Mayfly nymphs (Ephemeroptera)Gilled (right-handed) snails
(Gastropods) : # of C’s x 5.3 =
Stonefly nymphs (Plecoptera)Water Penny (Coleoptera) Group 1 Total:Water Snipe fly (Diptera)
Group 2: Somewhat Sensitive GROUP 2:Alderrfly larvae (Megaloptera) # of R’s x 3.0 =Beetle adults (Coleoptera)Beetle larvae (Coleoptera)Flack fly larvae (Deptera) # of C’s x 3.2 =Clams (Pelecypoda)Crane Fly larvae (Diptera)Crayfish (from count) (Decapoda) Group 2 Total:Damselfly nymphs (Odonata)Dragonfly nymphs (Odonata)Net-spinning caddisfly larvae
(Hydropsychidae, Trichoptera)
Scuds (Amphipoda)Sowbugs (Isopoda)
Group 3: Tolerant GROUP 3:Aquatic worms (Oligochaeta) # of R’s x 1.1 =Leeches (Hirudinea) # of C’s x 1.0 =Midge larvae (Diptera) Group 3 Total:Pouch snails (Gastropoda)True bugs (Hemiptera) Total Stream Quality Score =Other true flies (Diptera) (Sum of totals for groups 1-3; round to nearest whole #)
Check One:Excellent (>48) Fair (19-33)Good (34-48) Poor (<19)
S e c t i o n 5 Page 98 of 114

Flint River GREEN Notebook www.FlintRiver.org February, 2011 Version
Section 6: After the River/Regrouping
a. Checklist of Remaining “Wrap-Up” Items
After you have been out to the river, your work is still not done, several tests need to be finished back in the school building and data needs to be reported. You might want to put a student in a leadership role of making sure all of these things get done. Make sure all lab glassware/plasticware is cleaned Make note of any chemicals that need to be re-ordered Ensure proper disposal of hazardous chemicals Arrange to take Total Dissolved Solid Test and Total Phosphate Sample bottles
to the GISD Conduct BOD test Conduct Fecal Coliform test Fill out data sheet Report data to the Flint River Watershed Coalition (link to data form)
([email protected]; fax 810-424-5484) Prepare for student summit (link to student summit section)
b. Compare to Other Sites/Historical Data
It is important to confirm your water monitoring data with others in the community or to test multiple times to assure your results are both accurate and valid. Using the online data portal at http://www.geneseegreen.org/history.php , students can access historic data around the watershed, as well as add their own and do comparative analysis. There, the various upstream and downstream data over the last 20 years is available, so that students can see if things have improved and worsened over time, and begin to hypothesize about the root causes. Various policies and practices may have influenced these changes, including bans on pollutants, changes in urban and agricultural practices, and new developments in formally undeveloped land. To understand these possible causes better, contact city, county or state officials who affect zoning and land use issues to find out if their policies or practices might have affected your results. You can also contact official and citizens through a public meeting, like a zoning board meeting, where you share your results and make a case for water quality in decisions about land use and funding allocation.
c. Why is the Data Important (Student's Actual Data)
The data collected by the students in GREEN is used by the Genesee County Drain Commissioner’s Office, the Flint River Watershed Coalition, and other local decision makers to determine the health of the Flint River and its tributaries. Data collected by the students help decision makers see trends, trouble spots, and places to focus protection efforts.
S e c t i o n 6 Page 99 of 114

Flint River GREEN Notebook www.FlintRiver.org February, 2011 Version
d. Next Steps - Leading to Civic Action
Complex environmental problems demand complex solutions, since the physical, chemical and biological systems are interdependent and often have multiple causes. Using the Earth Force Protecting Our Watershed curriculum, however, we can start to isolate one specific root cause which we can affect, whether that is an education campaign about yard fertilizers, advocating for combined sewer overflow updates, or a rain garden and rain barrel campaign. The following is a brief overview of the six step process for taking action on your findings:
1. Conducting a Watershed Inventory. This step calls for water quality monitoring to examine how people use the watershed, and involves the WQI, the PTI and the physical and land use inventory. To supplement these, you can do a photo inventory, a checklist of land use issues you might observe, a community survey of surrounding land owners, and map inventory of issues in space that you observe.
2. Selecting a Watershed Problem. After the river, ask your class - what are the threats that are most pressing or interesting to your group? Through a series of criteria and democratic voting methods, your class then chooses a threat or problem they want to investigate further.
3. Looking at What People Are Doing. This is the research step in which you take another look at the inventory data and start to find out what the root causes are – either policies or practices that affect your issue. You may want to invite an expert panel of community members who deal with this issue, research articles in your local paper, or maybe accessing a database, like a GIS map of land use or the historical WQI data from your local watershed website.
4. Deciding What to Do. After researching the issues, your class should have an idea of potential causes and what’s being done about them in your community. In this step you formulate a solution to your problem that your class can directly affect. You have a list of policies and practices that affect your issue, and you’ll want to change just one that will have a long-term affect. To give an example, a river clean up would be a service project, but would not solve the long-term practice of littering at a public park. In this case, you might choose to institute a recycling program at a park with public education signage.
5. Taking Civic Action. This step involves the development of a planning strategy to carry out your solution. A detailed plan with delegated tasks
S e c t i o n 6 Page 100 of 114

Flint River GREEN Notebook www.FlintRiver.org February, 2011 Version
around funding, influential players and a timeline are all essential to a successful project. Some projects might need to be carried out over several years (like a recycling project) while others could be achieved by a small group (like an educational pamphlet).
6. Looking Back and Ahead. Reflection and celebration of your hard work are important to understanding your impact and carrying your progress forward after the class has completed its project. You can reflect on how well your project went, what still needs to be done, and what you would do better in the future. Having a summit or class presentation to the public are both ways to share your efforts as well as planning for next steps as you wrap up.
S e c t i o n 6 Page 101 of 114

Flint River GREEN Notebook www.FlintRiver.org February, 2011 Version
Section Seven: Student SummitThe Student Summit provides an opportunity for Flint River GREEN students to present their findings to their peers and share with the community.
This is a highlight for students because it provides the opportunity for them to hear from other students from different parts of the watershed. In addition to student presentations, students have the opportunity to attend informative sessions provided by environmental professionals.
a. Who is Invited?
Over 1,600 students participate in the Flint River GREEN program and careful planning is needed to coordinate the schedule and auditorium space. Student attendance is highly desired. FRWC coordinates invitations and accommodations dependent upon the following information from FRG Teachers:
1. Number of students each teacher would like to bring to the summit.
2. Number of adults accompanying school groups (chaperones, school personnel.)
3. Any time constraints such as arriving late or leaving early.
4. Additional people they would like invited to see their students' presentations.
In addition to teachers' requests, FRWC coordinates invitations to the following groups:
1. School Superintendents
2. School Principals
3. Elected Officials
4. FRWC Board Members
5. FRG Mentors
6. FRG Program Supporters
7. Summit Presenters
8. Summit Volunteers
9. Flint River GREEN Committee Members
b. Student Presentations:
Under the direction of their FRG teacher, students create a classroom Power Point presentation summarizing their experience and information obtained. Students present
S e c t i o n 7 Page 102 of 114

Flint River GREEN Notebook www.FlintRiver.org February, 2011 Version
this information to their peers and the community during the Student Summit auditorium presentations.
The Student Summit Guide (link to form) provides teacher and student instructions for the summit and presentations.
A Sample Rubric is also provided for teacher use (link to form).
Software Program for Presentations:Microsoft Power Point is the software required for all Auditorium presentations.Presentations are placed on a flash drive prior to utilizing college equipment for
presentation. Students are welcome to be creative and students desiring to have a video or
movie clips played during lunch, can contact FRWC about arrangements.
Length of Student Presentation Session:Presentations should be approximately 5 minutes long and follow with a
question/answer period not to exceed 3 minutes. Most sessions are forty-five minutes in length allowing for four schools to present
in each session.
Presentation Content:Identify the Flint River GREEN program, school and program participants
(teacher, mentor, school names). Identify the test location and site conditions (clean, wet, etc.)Report on the individual results from each test and discuss the relevance of each
score.Report on local concerns to water quality and the watershed habitat.
c. College & Student Summit Atmosphere
Mott Community College supports the Student Summit and welcomes participants to experience campus facilities such as the science classroom, Geology museum, Greenhouse, and laboratories. While college classes accommodate this Friday program, campus students will be utilizing building facilities and summit participants need to behave respectfully.
Students should not hang around or wander in the hallways, but be in a classroom or auditorium session.
Participants will need to be respectful of others and campus equipment. Although students are not currently at their own schools, they will still need to comply with their school's Code of Conduct in addition to Mott Community College's as listed on their website: http://www.mcc.edu/18_policies/stu_code_conduct.shtml
Break-out Sessions:Teachers designate how their students determine which break-out sessions they
attend. Some teachers designate their students to attend sessions as a group with a designated chaperone, as a class, or individual choice.
S e c t i o n 7 Page 103 of 114

Flint River GREEN Notebook www.FlintRiver.org February, 2011 Version
Students are encouraged to arrive to their designated session early and have an alternate choice if their session is full.
Each session has a designated capacity limit. Break-out sessions are provided by environmental professionals.
d. EvaluationsEvaluations are important as they drive the decision on Presenters for the next Student Summit and are key to sustaining future funding for this program. Feedback is appreciated and has been helpful in enhancing this program.
Teachers are a major key to providing the data necessary for FRWC, the Intermediate School Districts, and Earth Force to be able to report back to funders the value obtained from their funding support.
S e c t i o n 7 Page 104 of 114
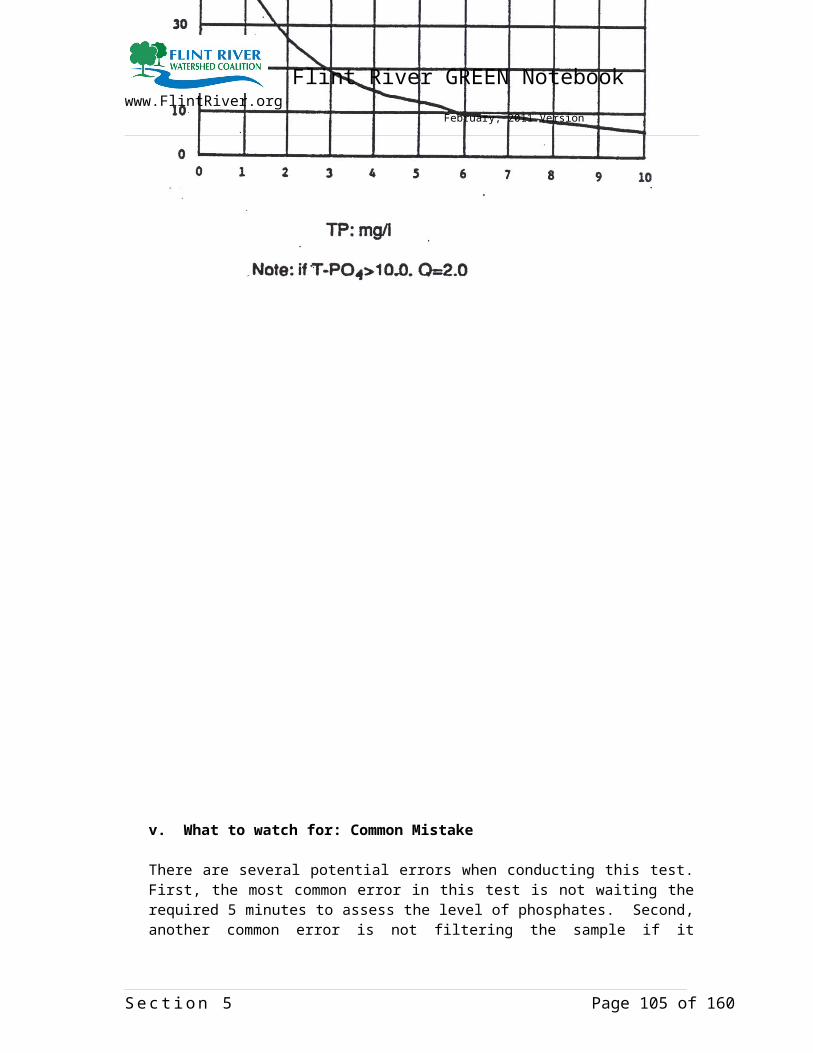
Flint River GREEN Notebook www.FlintRiver.org February, 2011 Version
S e c t i o n 8 Page 105 of 114

Flint River GREEN Notebook www.FlintRiver.org February, 2011 Version
Section Eight: Resources
Bees & Berries (Bee Keeper)Presenter & Live Bee DisplayJim [email protected]; [email protected] (Wilda Dodder)7444 North State RoadDavison, 48423810-653-8547;
City of Flint Water Pollution Control DivisionPresentations, ToursTom HutchingsG-4652 Beecher RoadFlint, 48532
Earth ForceTeacher Resources, GREEN programhttp://earthforce.org/2555 W. 34th AvenueDenver, CO 80211303-433-2956
Environmental Protection Agency (EPA)After the Storm [email protected] obtain a free DVE or VHS copy of the EPA's "After the Storm" (22 minutes long), you can contact them by calling: 1-800-490-9198.Order (free) items from the EPA from website: www.epa.gov/nscepwww.epa.gov/nscep
Flint River WildOnesPresident, Flint River Wild Ones (Native Plants)Rebecca [email protected] East Court StreetFlint, 48503810-762-0455
S e c t i o n 8 Page 106 of 114
Flint River GREEN Notebook www.FlintRiver.org February, 2011 Version
Friends of the Flint River TrailPresentationsBruce Nieuwenhuis2602 Hillcrest AvenueFlint, 40507
Genesee Conservation DistrictPresenations, EnviroScape, Storm Drain Awareness Program, EnvirothonBen [email protected] N. Elms RoadFlint, 48532810-230-8766
Genesee County Drain OfficePresentationsAnn Hall, Joe [email protected]@gcdcwwws.comAnthony Ragnone Treatment PlantG-9290 Farrand RoadMontrose, 48457810-232-7662 / Ann810-735-7135 / Joe
Genesee County Health DepartmentPresentationsRobert Bausick [email protected] S. Saginaw StreetFlint, 48502810-257-3603
Genesee County Parks Park Programs Nancy Edwardsnedwards@gcparks@org5045 Stanley RoadFlint, MI 48506810-736-7100, ext. 831http://geneseecountyparks.org
S e c t i o n 8 Page 107 of 114

Flint River GREEN Notebook www.FlintRiver.org February, 2011 Version
Genesee County Parks, For-Mar Nature PreservePark Naturalist: Presentations, Programs, Hands-On ActivitiesKatie McGlashenkmcglashen@gcparks@org2142 N. Genesee RoadBurton, 48529
Geology Museum/Mott Community CollegeGeology Museum Coordinator, Mott Community CollegeSheila [email protected] East Court StreetFlint, 48503810-762-0288
Keep Genesee County Beautiful (KGCB)Hands-on recycling presentation, supplies for clean-ups, mini-grants, plant and tree guides, and the Annual KGBC Conference in March.Holly Lubowicki [email protected] N. Saginaw Street, Suite #1001Flint, 48502810-767-7184
Lapeer Conservation DistrictForestry, Water Quality and Wildlife Management, 5th Grade Educational Programs; Michigan Water Stewardship Program; Farm *A*Syst (Farm Assessment System); Michigan Agricultural Environmental Assurance Program (MAEAP); Tree [email protected] N. Saginaw StreetLapeer, MI 48446810-664-3941, ext. 3
Michigan Department of Natural Resources and Environment (DNRE)Salmon in the Classroom - Program or Admittance QuestionsNatalie [email protected]
Salmon in the Classroom- For Fish, Tank, or Release QuestionsShana [email protected]
S e c t i o n 8 Page 108 of 114

Flint River GREEN Notebook www.FlintRiver.org February, 2011 Version
269-668-2876
Michigan Sea Grant ExtensionPresentations, Educational Resources, Lesson Plans. Download lesson plans and other info free of charge at: http://www.miseagrant.umich.ed/flow/Mary [email protected] Temple, 6th FloorDetroit, MI313-410-9431
MSU Extension-GeneseeInformation and educational opportunities in the areas of 4-H Youth Development, Agriculture, Community Development, Food Safety and Food Preservation, Horticulture, Commercial Horticulture, Master Gardener, Nutrition and 4-H AmeriCorps Mentoring.605 N. Saginaw Street Flint, MI 48502810-244-85008am to 1pm Monday through Fridayhttp://www.msue.msu.edu/portal/default.cfm?pageset_id=27254
MSU Extension-LapeerInformation and educational opportunities in the areas of 4-H Youth, Development, Agriculture, Community Development, Food Safety and Food Preservation, Horticulture, Commercial Horticulture, Master Gardener, Nutrition, Citizen Planner, Land Use, Field Crops Soil Fertility Information, Crop Connections Newsletter287 W. Nepessing Street, Suite 1 Lapeer, MI 48446810-667-0341http://www.msue.msu.edu/portal/default.cfm?pageset_id=27738
Muddler MinnowsFishing & Fly Tying DemonstrationsGabriell [email protected]
National Wild and Scenic RiversDan Haaswww.rivers.govU.S. Fish and Wildlife Service64 Maple Street
S e c t i o n 8 Page 109 of 114

Flint River GREEN Notebook www.FlintRiver.org February, 2011 Version
Burbank, Washington 99323
NOAA-Great LakesPresentations, Educational ResourcesMargaret [email protected] Commonwealth BoulevardAnn Arbor, 48015734-741-2201, 734-741-2055/fx
One DropWorldwide water projects, cultural concerns, water videos, photos8400 Second AvenueMontreal, QuebecH1W [email protected]
Our Water Program, Genesee County Drain OfficeOur Water program informaiton and teacher materials.Sue [email protected] Beecher RoadFlint, 48532810-732-1590
Ruth Mott Foundation ~ Applewood EstatePresentationsErin [email protected] E. Kearsley StreetFlint, 48503810-233-3835
Seven Ponds Nature CenterPresentations, Programs, Hands-On ActivitiesNaturalists: Layne Hillman, Lois Reaume, Carrie [email protected] Crawford RoadDryden, 48428810-796-3200
S e c t i o n 8 Page 110 of 114

Flint River GREEN Notebook www.FlintRiver.org February, 2011 Version
Sierra ClubClean Energy Campaign Manager, PresentationsLee [email protected] E. Grand River AvenueLansing, 48906616-570-1281
USGS-Great Lakes Science CenterPresentationsStephen [email protected] Green RoadAnn Arbor, 48105734-214-7279
S e c t i o n 8 Page 111 of 114

Flint River GREEN Notebook www.FlintRiver.org February, 2011 Version
Student Summit Guide
Presentation Requirements Presentation Format: Presentations use the Microsoft Power Point format. Place the Power Point files on a flash drive to utilize the college computer and overhead. Students are welcome to be creative. Students desiring to have a video or movie clips played during lunch, can contact FRWC about arrangements.
Presentation Length: Presentations should be approximately 5 minutes long and follow with a question/answer period not to exceed 3 minutes.
Presentation Content: - Identify the Flint River GREEN program, school and program participants
(teacher, mentor, school names). - Identify the test location and site conditions (clean, wet, etc.) - Report on the individual results from each test and discuss the relevance of each
score. - Report on local concerns to water quality and the watershed habitat.
Summit Invitees: - Participants in the Flint River GREEN Water Monitoring program and school
administrators. - Invitations to community members are coordinated by FRWC. Invitees include:
elected officials, Flint River Watershed Coalition Board Members, contributors to the Flint River GREEN program.
- Teachers and Mentors can recommend other individuals they would like to invite. This may include a parent, site resident, school board member, and/or employer.
Lunch: Lunch is provided for registered students, teachers, mentors, program donors, and event volunteers.
Educational Sessions: A variety of educational break-out sessions are provided for teachers and students to enhance their environmental learning. These sessions present a networking ability for students to meet and discuss opportunities with environmental professionals.
Additional Information
For data results and more information, visit the Program section of FRWC website: www.FlintRiver.org. Contact FRWC: Suzanne Lossing, [email protected], 810-767-9491.
S e c t i o n 8 Page 112 of 114

Flint River GREEN Notebook www.FlintRiver.org February, 2011 Version
Many of our FRG Teachers have found this Rubric useful. -- We do not require a Rubic for this program.
Flint River GREEN - Water Quality TestingSummit Power Point Rubric
Student Name: __________________________ Title of Presentation: ______________________
Content (20 total points, 4 points for each requirement)
______ Title slide describes Genesee GREEN, mentor, teacher and school names, and grade
______ Slides contain information on global and local concerns of our water supply
______ Slides demonstrate a knowledge of water testing site description (student awareness)
______ An explanation of a plan to clean up the water supply is included
______ Testing Results are correctly displayed
Bonus Points: 4 points:
______ Comparison of this year's data to a previous year, or another site.
Presentation (15 total points, 3 points for each requirement)
______ Text is clearly visible and easy to understand
______ The layout is aesthetically pleasing and supports the topic.
______ The use of background and colors enhance the look of the slide
______ Slides are free of distracting clutter.
______ Presentation follows a logical order
Writing Mechanics (5 total points)
______ The Text is written with no grammatical, spelling, or punctuation errors.
Completion Story Board (10 total points, 2 points each)
______ Seven story boards are completely filled out
______ Potential graphic of slide is included
______ Description of slide is included
______ Text presented on the slide is included
_______ Total Points (50, + 4 bonus points, are possible) __________ Percentage/Grade
S e c t i o n 8 Page 113 of 114

Suzanne Lossing, 810-767-9491; [email protected]
Flint River GREEN Notebook www.FlintRiver.org February, 2011 Version
PHOTO/VIDEO RELEASE FORM
I hereby give permission for images of my child taken through video, photo and/or digital camera while working on the Flint River GREEN (Global Rivers Environmental Education Network) program to be used solely for the purposes of Flint River GREEN material and publications, and waive any rights of compensation or ownership thereto.
Name of Participant (please print):________________________________________
Name of Parent/Guardian (please print): ________________________________________
Parent/Guardian’s Signature: ______________________________ Date: __________
www.FlintRiver.org Flint River GREEN Financial Sponsors:
S e c t i o n 8 Page 114 of 114
Earth Force; Flint River Watershed Coalition; General Motors; Genesee Intermediate School District; Lapeer Intermediate School District; National Learn and Serve Foundation; and Genesee County Community Water Quality Consortium's Our Water Program.