table of content - quant mutual
TRANSCRIPT

1
Go to Top As on 31st
May 2021 2
Table of content
Scheme Details
quant Liquid Fund 5
quant Active Fund 7
quant Small Cap Fund 9
quant Tax Plan 11
quant Mid Cap Fund 13
quant Large & Mid-Cap Fund 15
quant Focused Fund 17
quant Multi Asset Fund 19
quant ESG Fund 21
quant Quantamental Fund 23
quant Absolute Fund 24
quant Infrastructure Fund 26
quant Consumption Fund 28
Dividend History 30
Glossary 32
Point of Service (PoS) Location 33
Disclaimer: The Factsheet is for general reading purpose only and is not meant to serve as a professional guide. This document has been prepared on the basis
of publicly available information, internally developed data and other sources believed to be reliable. The Sponsor, the Investment Manager, the Trustee or any of
their respective directors, employees, affiliates or representatives (“entities & their affiliates”) do not assume any responsibility for, or warrant the authenticity,
accuracy, completeness, adequacy and reliability of such information. Whilst no action has been solicited based upon the information provided herein; due care
has been taken to ensure that the facts are accurate and opinions given are fair and reasonable. This information is not intended to be an offer or solicitation for
the purchase or sale of any financial product or instrument. Recipients of this information are advised to rely on their own analysis, interpretations &
investigations. Readers are also advised to seek independent professional advice order to arrive at an informed investment decision. Entities & their affiliates shall
not be liable for any direct, indirect, special, incidental, consequential, punitive or exemplary damages, including loss of profits, arising in any way from the
information contained in this material. Entities & their affiliates including persons involved in the preparation or issuance of this material may from time to time
have long or short positions in and buy or sell the securities there of, of company (ies)/ specific economic sectors mentioned herein. NAV of the plan/option of
certain schemes are not provided for certain cases as the NAV was not computed because there were no investors as on the date on which the NAV details are
provided.
Go to Top As on 31st
May 2021 3
Mutual Fund investments are subject to market risks, read all scheme related documents carefully
INVESTMENT PHILOSOPHY In a dynamic world that is continuously changing due to technology and increasingly volatile geopolitics, passive investment strategies can no longer outperform. Alpha belongs to active strategies that can invest in sync with the dynamics at play.
Being relevant comes by staying active.
We believe consistent outperformance requires complete freedom from looking at the world relatively. It is why we design investment strategies with an absolute objective irrespective of market conditions. With this absolute objective, comes clarity of thought.
Being relevant requires an absolute focus on returns.
Embedded within our processes and systems is the conviction that the surest way to success in investing is through cultivation of a multitude of opinions and perspectives. By bringing together this diversity of ideas within our investment framework, we aim to unearth every possible opportunity in any set of circumstances.
Being relevant means having an unconstrained perspective.
CORE BELIEF
Fundamental is the atman, Liquidity the prana, Sentiments the maya
One of the oldest scriptures and philosophy in the world is the Vedic philosophy. These scriptures are a comprehensive effort to describe all aspects of the universe and human existence. To undertake this gigantic task, they rely on three core ideas - Atman, Prana and Maya. These ideas are the inspiration for our perspective on investment research and money management.
‘Atman’ is the ‘true’ or ‘absolute’ self of a person, beyond all names and subjective judgements that the world and the person choose to apply on themself. In that sense, real assets and profit-generating capacity of all economic entities and participants are the 'fundamentals' underlying every kind of market. Without the Atman, an individual cannot exist. Similarly, without fundamentals, value cannot persist.
‘Prana’ refers to universal energy in all it's forms. It is the vibrational force that makes every electron and atom vibrate and move. For markets, the dynamic flow of money which we study as liquidity, enables participants to undertake economic activity and create an ecosystem. While Prana enables life, liquidity imparts a 'value' to assets and organisations.
‘Maya’ depicts the illusion of this world as subjectively experienced by all humans. Each person imagines the world to be in a peculiar way, based on their own opinions and perceptions, and lives accordingly. 'Price' is the illusion market participants assign to every economic unit, according to their subjective ideas of the present and the future, based on a myriad assumptions, experiences and predictions. Maya is the intricate illusion of this universe created by our minds and price is the ever-changing perception of economic value created by investors.

Go to Top As on 31st
May 2021 4
INVESTMENT PRINCIPLES Measurable is reliable
For success in investing, discipline is of more importance than any other attribute of the investment process. Our battle-tested suite of proprietary valuation, liquidity and risk indicators along with extensive financial modelling ensure that we consistently deliver superior results.
Quantamental investing
While measurable is reliable, we also believe the economy and markets cannot be captured completely by models and indicators. Human judgement that comes from years of trading and investing experience has immense value. For optimal results, our decision-making seeks to find the harmony between objectivity and subjectivity.
Multi-asset, multi-manager
We believe that safeguarding investor wealth is paramount. Apart from reducing risk by investing across asset classes, we take diversification to another dimension by ensuring every investment decision comes from a focused discussion between investment managers with a diverse set of capabilities and experience.
Money flows from one asset class to another.
Money is a form of economic energy - the quantification of human effort. As the world evolves, a dynamic set of ideas continuously lead the change. Money flows and grows with these pioneering ideas. Identifying them and the specific assets that benefit is the surest and most consistent method for generating wealth.
Timing is everything
In our framework, time is a critical aspect of investing as the three dimensions of Valuation, Liquidity and Risk interact and move together in cycles across different periods. Alpha generation is optimised only by sanguine identification of the extremes.
quant Global Research (qGR) PREDICTIVE ANALYTICS | ACTIONABLE INDICATORS
Market moves are highly dependent on the aptitude and appetite of market participants. To address this, we at qGR track several proprietary indicators which measure market sentiments from different perspectives. Extreme euphoria or fear can be gauged by many of these indicators, helping us to deduce how players are positioned and how they react to a particular situation. Once we understand investor behavior through these indicators, we can identify times when players are being irrational or making illogical decisions or showing signs of exuberance/paranoia.
qGR objectively follows this paradigm, ever enhancing domain knowledge with technology as an enabler, to develop tools and techniques, and translating them into indicators that have accurately been able to identify cross asset and cross market inflexion points.
qGR predictive analytics indicators are identifiers of inflexion points and opportunities in the complex investing environment. They provide clarity during difficult times when there are many questions that entail event and polity risk.
Go to Top As on 31st
May 2021 5
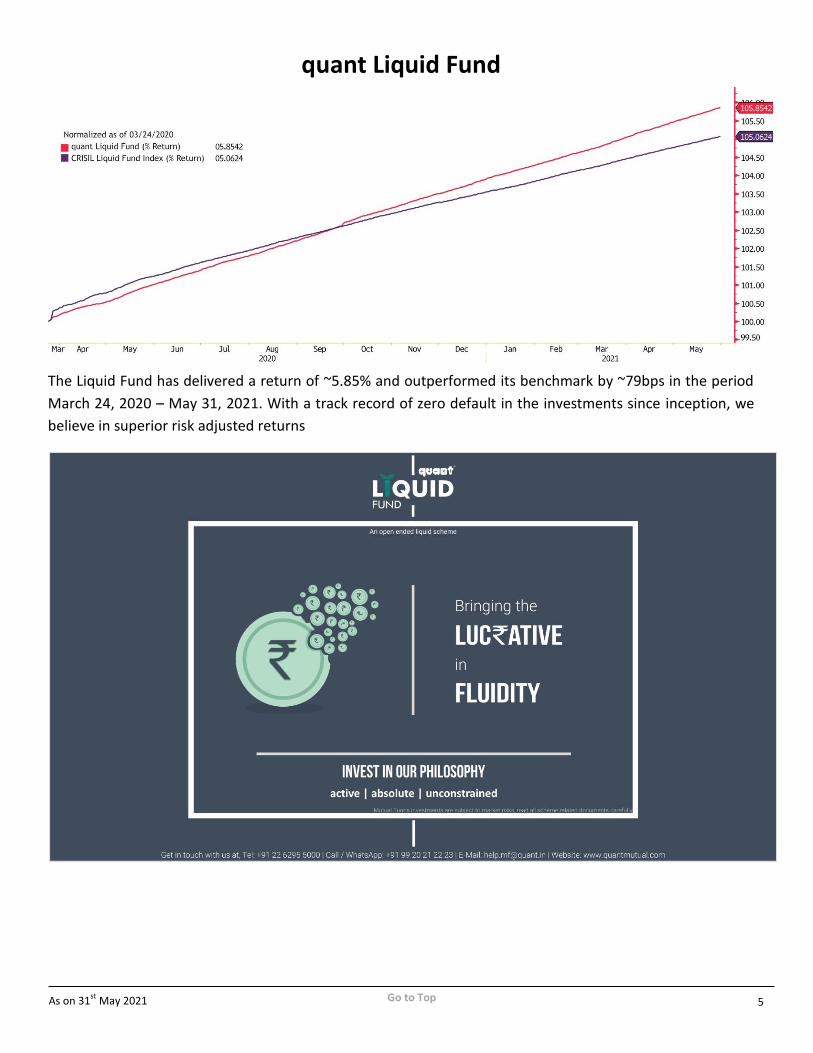
quant Liquid Fund
The Liquid Fund has delivered a return of ~5.85% and outperformed its benchmark by ~79bps in the period
March 24, 2020 – May 31, 2021. With a track record of zero default in the investments since inception, we
believe in superior risk adjusted returns
Go to Top As on 31st
May 2021 6
SCHEME SNAPSHOT PORTFOLIO TOP HOLDING RATING PROFILE/ ASSET ALLOCATION (%)
INVESTMENT OBJECTIVE
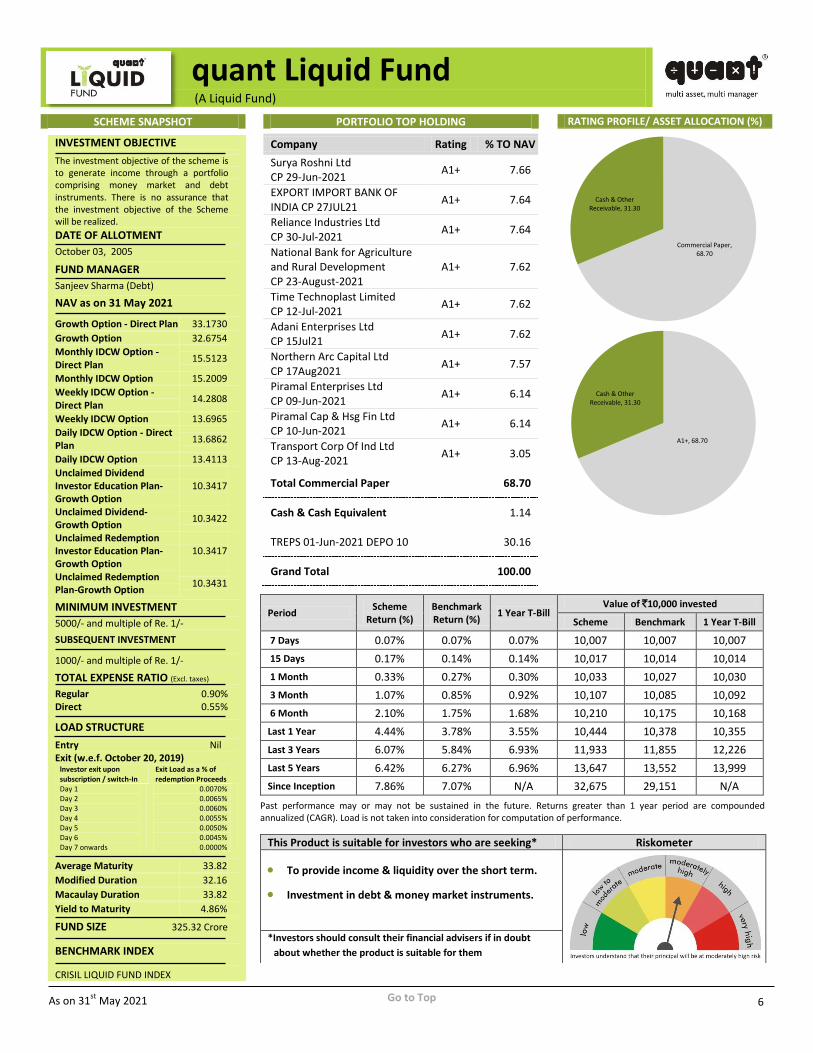
The investment objective of the scheme is to generate income through a portfolio comprising money market and debt instruments. There is no assurance that the investment objective of the Scheme will be realized.
DATE OF ALLOTMENT
October 03, 2005
FUND MANAGER
Sanjeev Sharma (Debt)
NAV as on 31 May 2021
Growth Option - Direct Plan 33.1730
Growth Option 32.6754
Monthly IDCW Option - Direct Plan
15.5123
Monthly IDCW Option 15.2009
Weekly IDCW Option - Direct Plan
14.2808
Weekly IDCW Option 13.6965
Daily IDCW Option - Direct Plan
13.6862
Daily IDCW Option 13.4113
Unclaimed Dividend Investor Education Plan-Growth Option
10.3417
Unclaimed Dividend-Growth Option
10.3422
Unclaimed Redemption Investor Education Plan-Growth Option
10.3417
Unclaimed Redemption Plan-Growth Option
10.3431
MINIMUM INVESTMENT
5000/- and multiple of Re. 1/-
SUBSEQUENT INVESTMENT
1000/- and multiple of Re. 1/-
TOTAL EXPENSE RATIO (Excl. taxes)
Regular 0.90% Direct 0.55%
LOAD STRUCTURE
Entry Nil Exit (w.e.f. October 20, 2019)
lnvestor exit upon subscription / switch-In
Exit Load as a % of redemption Proceeds
Day 1 Day 2 Day 3 Day 4 Day 5 Day 6 Day 7 onwards
0.0070% 0.0065% 0.0060% 0.0055% 0.0050% 0.0045% 0.0000%
Average Maturity 33.82
Modified Duration 32.16
Macaulay Duration 33.82
Yield to Maturity 4.86%
FUND SIZE 325.32 Crore
BENCHMARK INDEX
CRISIL LIQUID FUND INDEX
Company Rating % TO NAV
Surya Roshni Ltd CP 29-Jun-2021
A1+ 7.66
EXPORT IMPORT BANK OF INDIA CP 27JUL21
A1+ 7.64
Reliance Industries Ltd CP 30-Jul-2021
A1+ 7.64
National Bank for Agriculture and Rural Development CP 23-August-2021
A1+ 7.62
Time Technoplast Limited CP 12-Jul-2021
A1+ 7.62
Adani Enterprises Ltd CP 15Jul21
A1+ 7.62
Northern Arc Capital Ltd CP 17Aug2021
A1+ 7.57
Piramal Enterprises Ltd CP 09-Jun-2021
A1+ 6.14
Piramal Cap & Hsg Fin Ltd CP 10-Jun-2021
A1+ 6.14
Transport Corp Of Ind Ltd CP 13-Aug-2021
A1+ 3.05
Total Commercial Paper 68.70
Cash & Cash Equivalent 1.14
TREPS 01-Jun-2021 DEPO 10 30.16
Grand Total 100.00
Period Scheme
Return (%) Benchmark Return (%)
1 Year T-Bill Value of `10,000 invested
Scheme Benchmark 1 Year T-Bill
7 Days 0.07% 0.07% 0.07% 10,007 10,007 10,007
15 Days 0.17% 0.14% 0.14% 10,017 10,014 10,014
1 Month 0.33% 0.27% 0.30% 10,033 10,027 10,030
3 Month 1.07% 0.85% 0.92% 10,107 10,085 10,092
6 Month 2.10% 1.75% 1.68% 10,210 10,175 10,168
Last 1 Year 4.44% 3.78% 3.55% 10,444 10,378 10,355
Last 3 Years 6.07% 5.84% 6.93% 11,933 11,855 12,226
Last 5 Years 6.42% 6.27% 6.96% 13,647 13,552 13,999
Since Inception 7.86% 7.07% N/A 32,675 29,151 N/A
Past performance may or may not be sustained in the future. Returns greater than 1 year period are compounded annualized (CAGR). Load is not taken into consideration for computation of performance.
This Product is suitable for investors who are seeking* Riskometer
To provide income & liquidity over the short term.
Investment in debt & money market instruments.
*Investors should consult their financial advisers if in doubt
about whether the product is suitable for them
Commercial Paper, 68.70
Cash & Other Receivable, 31.30
Commercial Paper
Cash & Other Receivable
A1+, 68.70
Cash & Other Receivable, 31.30
A1+
Cash & Other Receivable
quant Liquid Fund (A Liquid Fund)
Go to Top As on 31st
May 2021 7
quant Active Fund
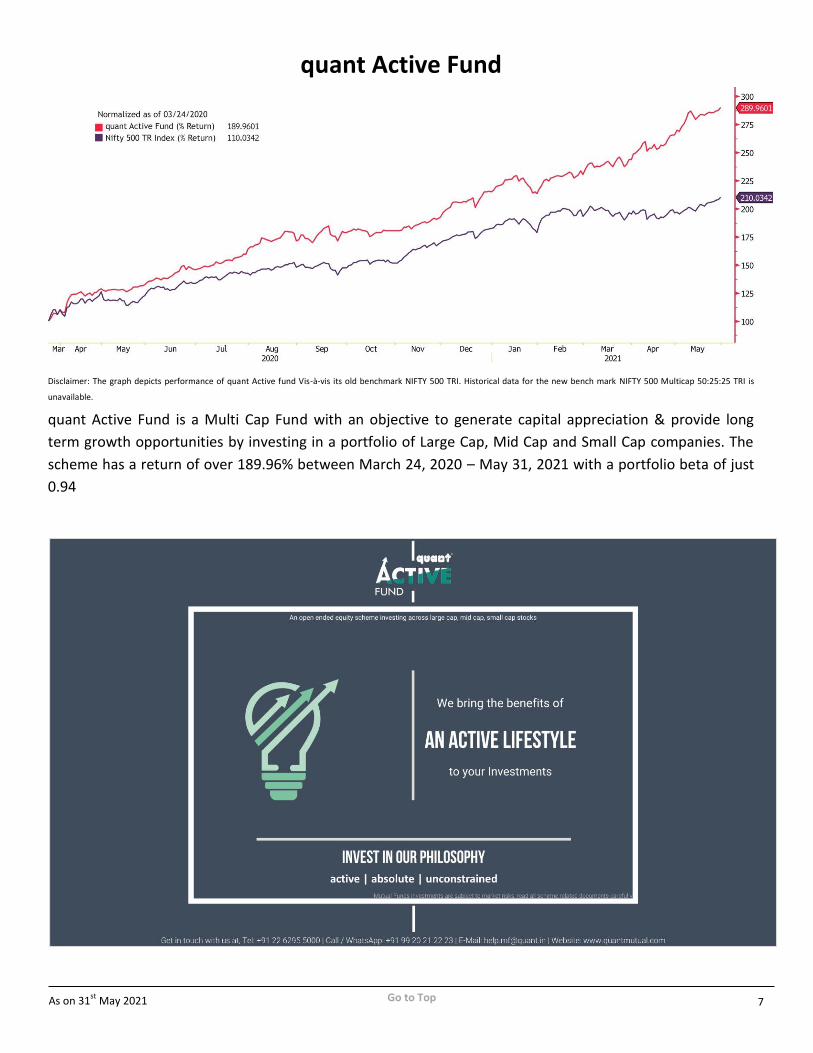
Disclaimer: The graph depicts performance of quant Active fund Vis-à-vis its old benchmark NIFTY 500 TRI. Historical data for the new bench mark NIFTY 500 Multicap 50:25:25 TRI is
unavailable.
quant Active Fund is a Multi Cap Fund with an objective to generate capital appreciation & provide long
term growth opportunities by investing in a portfolio of Large Cap, Mid Cap and Small Cap companies. The
scheme has a return of over 189.96% between March 24, 2020 – May 31, 2021 with a portfolio beta of just
0.94
Go to Top As on 31st
May 2021 8
SCHEME SNAPSHOT PORTFOLIO TOP HOLDING INDUSTRY/ SECTOR ALLOCATION (%)
INVESTMENT OBJECTIVE The primary investment objective of the scheme is to seek to generate capital appreciation & provide long-term growth opportunities by investing in a portfolio of Large Cap, Mid Cap and Small Cap companies. There is no assurance that the investment objective of the Scheme will be realized.
DATE OF ALLOTMENT
April 04, 2001
FUND MANAGERS
Ankit Pande (Equity)
Vasav Sahgal (Equity)
Sanjeev Sharma (Debt)
NAV as on 31 May 2021
GROWTH OPTION 356.6487
GROWTH OPTION-Direct Plan 368.2421
IDCW Option - Direct Plan 42.6429
IDCW Option 40.8340
MINIMUM INVESTMENT
5000/- and multiple of Re. 1/-
SUBSEQUENT INVESTMENT
1000/- and multiple of Re. 1/-
TOTAL EXPENSE RATIO (Excl. taxes)
Regular 2.25% Direct 0.50%
LOAD STRUCTURE Entry Nil Exit Nil
VOLATILITY MEASURES (3 Years) Standard Deviation * 24.18% R- Squared 0.25 Beta 0.94 Sharpe Ratio* 0.89 *Standard Deviation, Sharpe Ratio & Beta are calculated on annualised basis using 3 years history of monthly returns; risk free rate assumed to be 5.96% for calculating Sharpe Ratio (calculated based on annualised CRISIL CBLO Index returns over 3 years)
PORTFOLIO TURNOVER RATIO (1 Year) 3.76 Times
FUND SIZE 595.21 Crore
BENCHMARK INDEX NIFTY 500 Multicap 50:25:25 TRI
STOCK/ INSTRUMENT % TO NAV
ITC Limited 8.66
Fortis Healthcare 8.47
State Bank of India 7.40
ICICI Bank Limited 6.14
Stylam Industries Limited 4.62
Bharti Airtel Limited 4.58
Hindustan Copper Limited 4.12
ICICI Securities Limited 3.77
Sun Pharmaceutical Industries Limited
3.07
Vedanta Limited 2.78
Total of Top 10 Holding 53.62
Equity & Equity Related 95.36
Cash & Other Receivables 4.64
Grand Total 100.00
Period Scheme Return
Benchmark Return
NIFTY Return
Value of `10,000 invested
Scheme Benchmark NIFTY 50
6 Month 48.80% 23.88% 18.87% 14,880 12,388 11,887
1 Year 114.94% 70.76% 58.59% 21,494 17,076 15,859
3 Years 26.23% 13.69% 13.36% 20,116 14,693 14,569
5 Years 22.44% 15.60% 13.76% 27,514 20,639 19,050
Since Inception 19.40% 0.00% 13.86% 356,649 10,000 137,094
Past performance may or may not be sustained in the future. Returns greater than 1 year period are compounded annualized (CAGR). Load is not taken into consideration for computation of performance.
This Product is suitable for investors who are seeking* Riskometer
To generate long term capital appreciation.
Investment in equity and equity related instruments.
*Investors should consult their financial advisers if in doubt
about whether the product is suitable for them
0.65
0.76
0.82
0.86
1.1
1.11
1.42
1.6
1.97
2.38
3.55
3.71
4.58
5.33
5.89
6.9
7.4
7.52
10.73
11.05
16.04
0 5 10 15 20
INDUSTRIAL CAPITAL…
TEXTILE PRODUCTS
TEXTILES - COTTON
MINERALS/MINING
PESTICIDES
FERTILISERS
TELECOM - EQUIPMENT…
CEMENT
OIL
CHEMICALS
FERROUS METALS
INDUSTRIAL PRODUCTS
TELECOM - SERVICES
CONSUMER DURABLES
PHARMACEUTICALS
NON - FERROUS METALS
SOFTWARE
FINANCE
CONSUMER NON…
HEALTHCARE SERVICES
BANKS
quant Active Fund (A Multi Cap Fund)

Go to Top As on 31st
May 2021 9
quant Small Cap Fund
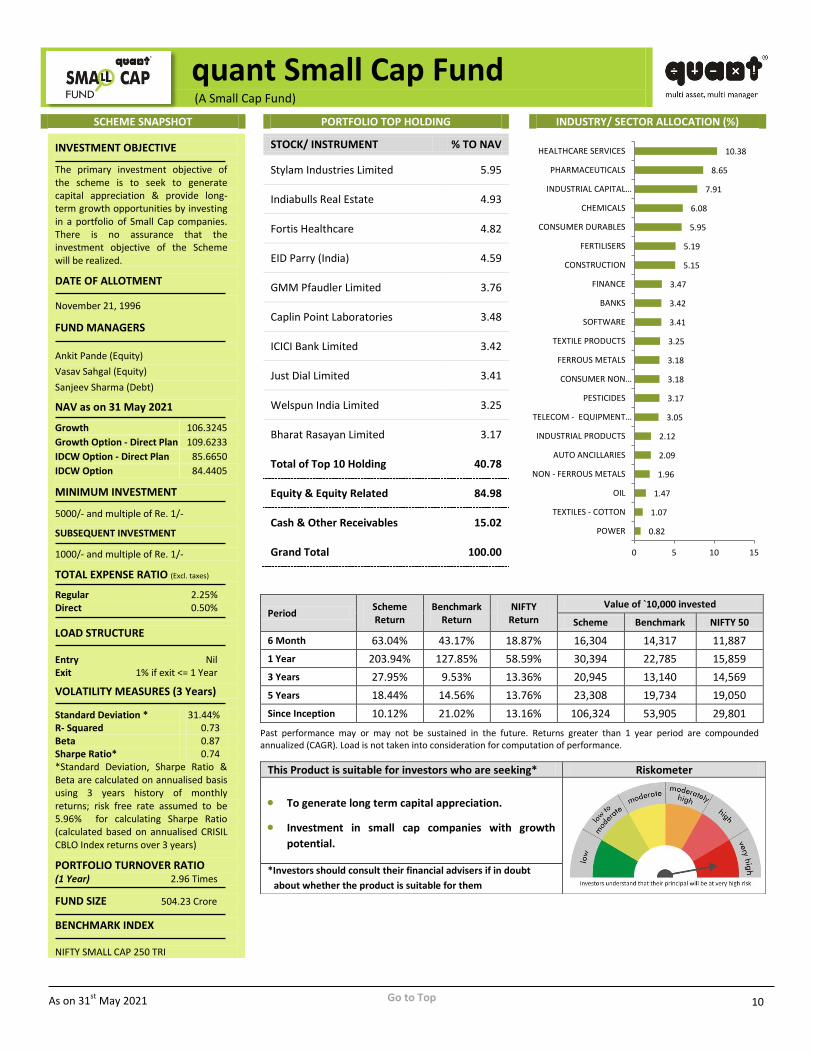
quant Small Cap Fund has an objective to generate capital appreciation & provide long term growth
opportunities by investing in a portfolio predominantly consisting of Small Cap companies. With the highest
returns among quant’s equity-based schemes during the period March 24, 2020 – May 31, 2021, quant Small
Cap Fund has managed to yield a staggering return of 282.50%, with a portfolio beta of just 0.87
Go to Top As on 31st
May 2021 10
SCHEME SNAPSHOT PORTFOLIO TOP HOLDING INDUSTRY/ SECTOR ALLOCATION (%)
INVESTMENT OBJECTIVE
The primary investment objective of the scheme is to seek to generate capital appreciation & provide long-term growth opportunities by investing in a portfolio of Small Cap companies. There is no assurance that the investment objective of the Scheme will be realized.
DATE OF ALLOTMENT
November 21, 1996
FUND MANAGERS
Ankit Pande (Equity)
Vasav Sahgal (Equity)
Sanjeev Sharma (Debt)
NAV as on 31 May 2021
Growth 106.3245
Growth Option - Direct Plan 109.6233
IDCW Option - Direct Plan 85.6650
IDCW Option 84.4405
MINIMUM INVESTMENT
5000/- and multiple of Re. 1/-
SUBSEQUENT INVESTMENT
1000/- and multiple of Re. 1/-
TOTAL EXPENSE RATIO (Excl. taxes)
Regular 2.25% Direct 0.50%
LOAD STRUCTURE Entry Nil Exit 1% if exit <= 1 Year
VOLATILITY MEASURES (3 Years)
Standard Deviation * 31.44% R- Squared 0.73 Beta 0.87 Sharpe Ratio* 0.74 *Standard Deviation, Sharpe Ratio & Beta are calculated on annualised basis using 3 years history of monthly returns; risk free rate assumed to be 5.96% for calculating Sharpe Ratio (calculated based on annualised CRISIL CBLO Index returns over 3 years)
PORTFOLIO TURNOVER RATIO (1 Year) 2.96 Times
FUND SIZE 504.23 Crore
BENCHMARK INDEX NIFTY SMALL CAP 250 TRI
STOCK/ INSTRUMENT % TO NAV
Stylam Industries Limited 5.95
Indiabulls Real Estate 4.93
Fortis Healthcare 4.82
EID Parry (India) 4.59
GMM Pfaudler Limited 3.76
Caplin Point Laboratories 3.48
ICICI Bank Limited 3.42
Just Dial Limited 3.41
Welspun India Limited 3.25
Bharat Rasayan Limited 3.17
Total of Top 10 Holding 40.78
Equity & Equity Related 84.98
Cash & Other Receivables 15.02
Grand Total 100.00
Period Scheme Return
Benchmark Return
NIFTY Return
Value of `10,000 invested
Scheme Benchmark NIFTY 50
6 Month 63.04% 43.17% 18.87% 16,304 14,317 11,887
1 Year 203.94% 127.85% 58.59% 30,394 22,785 15,859
3 Years 27.95% 9.53% 13.36% 20,945 13,140 14,569
5 Years 18.44% 14.56% 13.76% 23,308 19,734 19,050
Since Inception 10.12% 21.02% 13.16% 106,324 53,905 29,801
Past performance may or may not be sustained in the future. Returns greater than 1 year period are compounded annualized (CAGR). Load is not taken into consideration for computation of performance.
This Product is suitable for investors who are seeking* Riskometer
To generate long term capital appreciation.
Investment in small cap companies with growth
potential.
*Investors should consult their financial advisers if in doubt
about whether the product is suitable for them
0.82
1.07
1.47
1.96
2.09
2.12
3.05
3.17
3.18
3.18
3.25
3.41
3.42
3.47
5.15
5.19
5.95
6.08
7.91
8.65
10.38
0 5 10 15
POWER
TEXTILES - COTTON
OIL
NON - FERROUS METALS
AUTO ANCILLARIES
INDUSTRIAL PRODUCTS
TELECOM - EQUIPMENT…
PESTICIDES
CONSUMER NON…
FERROUS METALS
TEXTILE PRODUCTS
SOFTWARE
BANKS
FINANCE
CONSTRUCTION
FERTILISERS
CONSUMER DURABLES
CHEMICALS
INDUSTRIAL CAPITAL…
PHARMACEUTICALS
HEALTHCARE SERVICES
quant Small Cap Fund (A Small Cap Fund)

Go to Top As on 31st
May 2021 11
quant Tax Plan
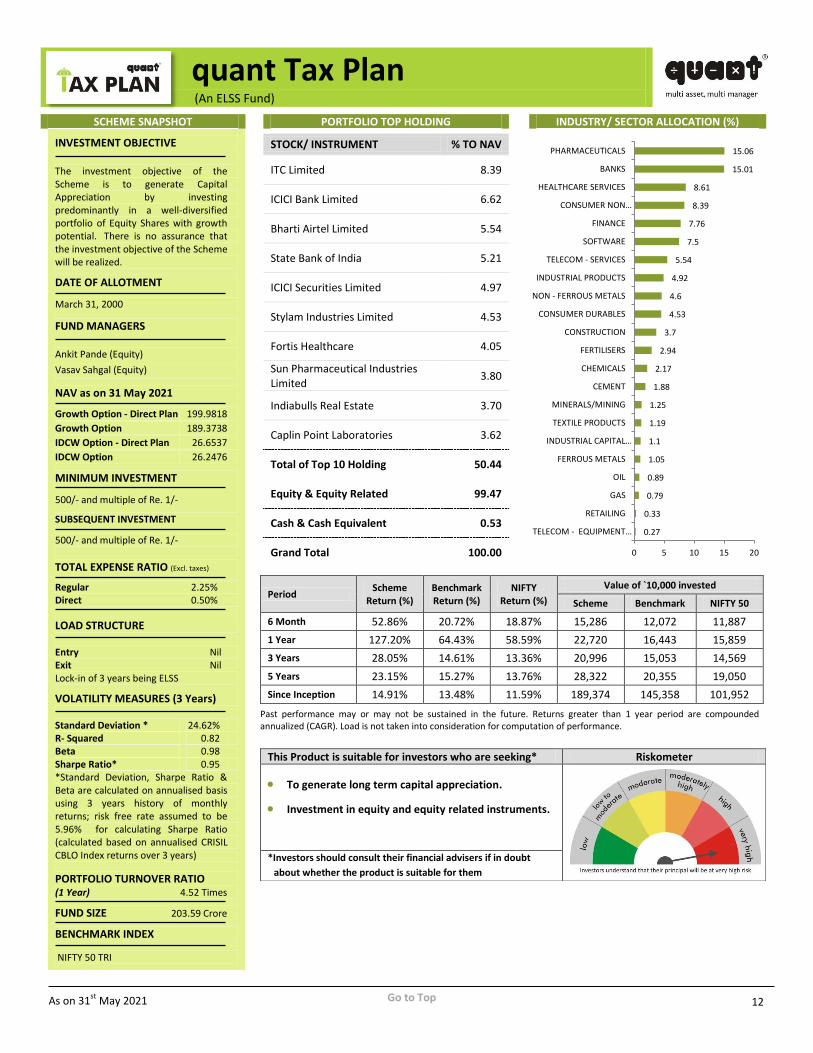
quant Tax Plan is an ELSS Scheme with an objective of Capital Appreciation by investing predominantly in a
well-diversified portfolio of Equity Shares with growth potential. The scheme has a return of 209.23%
between March 24, 2020 – May 31, 2021 with a portfolio beta of 0.98
Go to Top As on 31st
May 2021 12
SCHEME SNAPSHOT PORTFOLIO TOP HOLDING INDUSTRY/ SECTOR ALLOCATION (%)
INVESTMENT OBJECTIVE The investment objective of the Scheme is to generate Capital Appreciation by investing predominantly in a well-diversified portfolio of Equity Shares with growth potential. There is no assurance that the investment objective of the Scheme will be realized.
DATE OF ALLOTMENT
March 31, 2000
FUND MANAGERS
Ankit Pande (Equity)
Vasav Sahgal (Equity)
NAV as on 31 May 2021
Growth Option - Direct Plan 199.9818
Growth Option 189.3738
IDCW Option - Direct Plan 26.6537
IDCW Option 26.2476
MINIMUM INVESTMENT
500/- and multiple of Re. 1/-
SUBSEQUENT INVESTMENT
500/- and multiple of Re. 1/-
TOTAL EXPENSE RATIO (Excl. taxes)
Regular 2.25% Direct 0.50%
LOAD STRUCTURE Entry Nil Exit Nil Lock-in of 3 years being ELSS
VOLATILITY MEASURES (3 Years) Standard Deviation * 24.62% R- Squared 0.82 Beta 0.98 Sharpe Ratio* 0.95 *Standard Deviation, Sharpe Ratio & Beta are calculated on annualised basis using 3 years history of monthly returns; risk free rate assumed to be 5.96% for calculating Sharpe Ratio (calculated based on annualised CRISIL CBLO Index returns over 3 years)
PORTFOLIO TURNOVER RATIO (1 Year) 4.52 Times
FUND SIZE 203.59 Crore
BENCHMARK INDEX
NIFTY 50 TRI
STOCK/ INSTRUMENT % TO NAV
ITC Limited 8.39
ICICI Bank Limited 6.62
Bharti Airtel Limited 5.54
State Bank of India 5.21
ICICI Securities Limited 4.97
Stylam Industries Limited 4.53
Fortis Healthcare 4.05
Sun Pharmaceutical Industries Limited
3.80
Indiabulls Real Estate 3.70
Caplin Point Laboratories 3.62
Total of Top 10 Holding 50.44
Equity & Equity Related 99.47
Cash & Cash Equivalent 0.53
Grand Total 100.00
Period Scheme
Return (%) Benchmark Return (%)
NIFTY Return (%)
Value of `10,000 invested
Scheme Benchmark NIFTY 50
6 Month 52.86% 20.72% 18.87% 15,286 12,072 11,887
1 Year 127.20% 64.43% 58.59% 22,720 16,443 15,859
3 Years 28.05% 14.61% 13.36% 20,996 15,053 14,569
5 Years 23.15% 15.27% 13.76% 28,322 20,355 19,050
Since Inception 14.91% 13.48% 11.59% 189,374 145,358 101,952
Past performance may or may not be sustained in the future. Returns greater than 1 year period are compounded annualized (CAGR). Load is not taken into consideration for computation of performance.
This Product is suitable for investors who are seeking* Riskometer
To generate long term capital appreciation.
Investment in equity and equity related instruments.
*Investors should consult their financial advisers if in doubt
about whether the product is suitable for them
0.27
0.33
0.79
0.89
1.05
1.1
1.19
1.25
1.88
2.17
2.94
3.7
4.53
4.6
4.92
5.54
7.5
7.76
8.39
8.61
15.01
15.06
0 5 10 15 20
TELECOM - EQUIPMENT…
RETAILING
GAS
OIL
FERROUS METALS
INDUSTRIAL CAPITAL…
TEXTILE PRODUCTS
MINERALS/MINING
CEMENT
CHEMICALS
FERTILISERS
CONSTRUCTION
CONSUMER DURABLES
NON - FERROUS METALS
INDUSTRIAL PRODUCTS
TELECOM - SERVICES
SOFTWARE
FINANCE
CONSUMER NON…
HEALTHCARE SERVICES
BANKS
PHARMACEUTICALS
quant Tax Plan (An ELSS Fund)
Go to Top As on 31st
May 2021 13
quant Mid Cap Fund
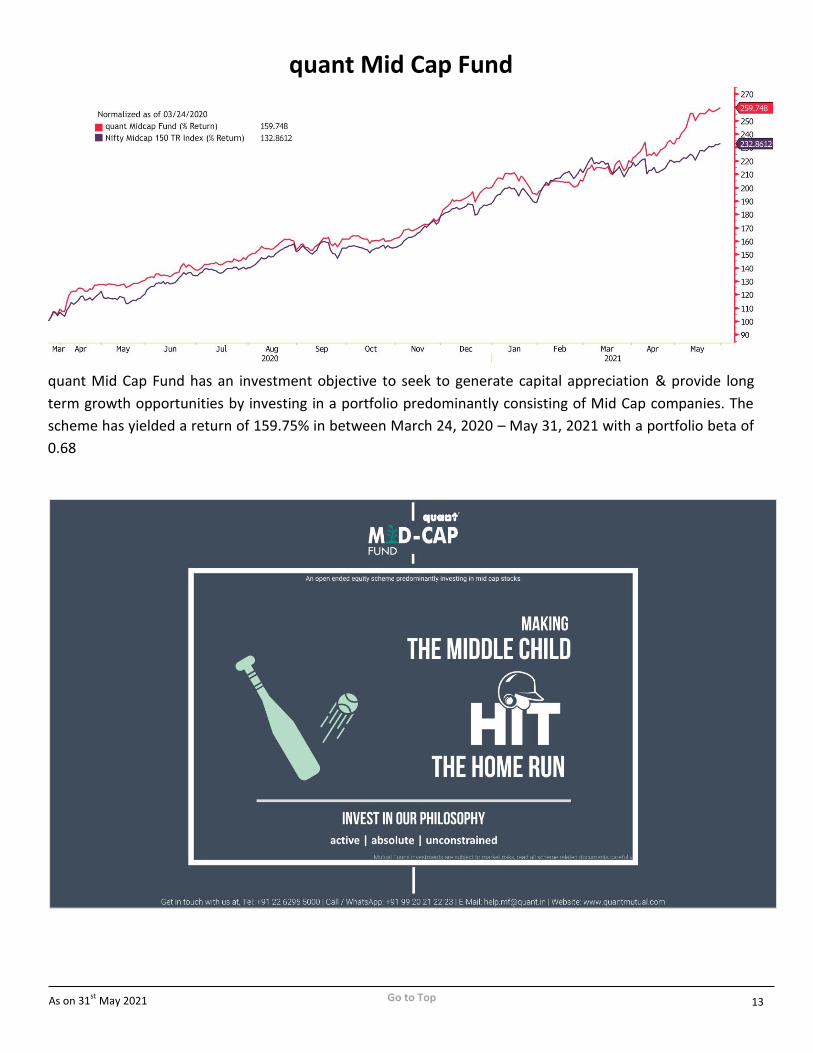
quant Mid Cap Fund has an investment objective to seek to generate capital appreciation & provide long
term growth opportunities by investing in a portfolio predominantly consisting of Mid Cap companies. The
scheme has yielded a return of 159.75% in between March 24, 2020 – May 31, 2021 with a portfolio beta of
0.68

Go to Top As on 31st
May 2021 14
SCHEME SNAPSHOT PORTFOLIO TOP HOLDING INDUSTRY/ SECTOR ALLOCATION (%)
INVESTMENT OBJECTIVE
The primary investment objective of the scheme is to seek to generate capital appreciation & provide long-term growth opportunities by investing in a portfolio of Mid Cap companies. There is no assurance that the investment objective of the Scheme will be realized.
DATE OF ALLOTMENT
March 09, 2001
FUND MANAGERS
Ankit Pande (Equity)
Vasav Sahgal (Equity)
Sanjeev Sharma (Debt)
NAV as on 31 May 2021
Growth Option - Direct Plan 105.8356
Growth Option 100.8531
IDCW Option - Direct Plan 37.3731
IDCW Option 35.7041
MINIMUM INVESTMENT
5000/- and multiple of Re. 1/-
SUBSEQUENT INVESTMENT
1000/- and multiple of Re. 1/-
TOTAL EXPENSE RATIO (Excl. taxes)
Regular 2.25% Direct 0.50%
LOAD STRUCTURE
Entry Nil Exit 1% if exit <= 1 Year
VOLATILITY MEASURES (3 Years)
Standard Deviation * 23.61% R- Squared 0.80 Beta 0.68 Sharpe Ratio* 0.69 *Standard Deviation, Sharpe Ratio & Beta are calculated on annualised basis using 3 years history of monthly returns; risk free rate assumed to be 5.96% for calculating Sharpe Ratio (calculated based on annualised CRISIL CBLO Index returns over 3 years)
PORTFOLIO TURNOVER RATIO
(1 Year) 5.98 Times
FUND SIZE 71.70 Crore
BENCHMARK INDEX
NIFTY MID CAP 150 TRI
STOCK/ INSTRUMENT % TO NAV
Fortis Healthcare 8.58
Jindal Steel & Power 8.52
ICICI Securities Limited 7.77
Syngene International Limited 7.74
Bharat Forge Limited 6.85
Nureca Limited 6.51
Aditya Birla Fashion And Retail 6.25
Godrej Agrovet Limited 5.09
Oracle Financial Services Software
4.49
Just Dial Limited 3.95
Total of Top 10 Holding 65.75
Equity & Equity Related 81.64
Cash & Cash Equivalent 18.36
Grand Total 100.00
Period Scheme Return
Benchmark Return
NIFTY Return
Value of `10,000 invested
Scheme Benchmark NIFTY 50
6 Month 44.24% 30.72% 18.87% 14,424 13,072 11,887
1 Year 95.13% 93.84% 58.59% 19,513 19,384 15,859
3 Years 21.12% 14.37% 13.36% 17,766 14,959 14,569
5 Years 17.23% 18.08% 13.76% 22,143 22,955 19,050
Since Inception 12.10% N/A 13.25% 100,853 N/A 124,190
Past performance may or may not be sustained in the future. Returns greater than 1 year period are compounded annualized (CAGR). Load is not taken into consideration for computation of performance.
This Product is suitable for investors who are seeking* Riskometer
To generate long term capital appreciation.
Investment in mid cap companies with growth
potential.
*Investors should consult their financial advisers if in doubt
about whether the product is suitable for them
2.63
5.09
6.25
6.85
7.57
7.77
8.44
8.52
13.43
15.09
0 5 10 15 20
CONSUMER DURABLES
CONSUMER NONDURABLES
RETAILING
INDUSTRIAL PRODUCTS
BANKS
FINANCE
SOFTWARE
FERROUS METALS
PHARMACEUTICALS
HEALTHCARE SERVICES
quant Mid Cap Fund (A Mid Cap Fund)
Go to Top As on 31st
May 2021 15
quant Large & Mid Cap Fund
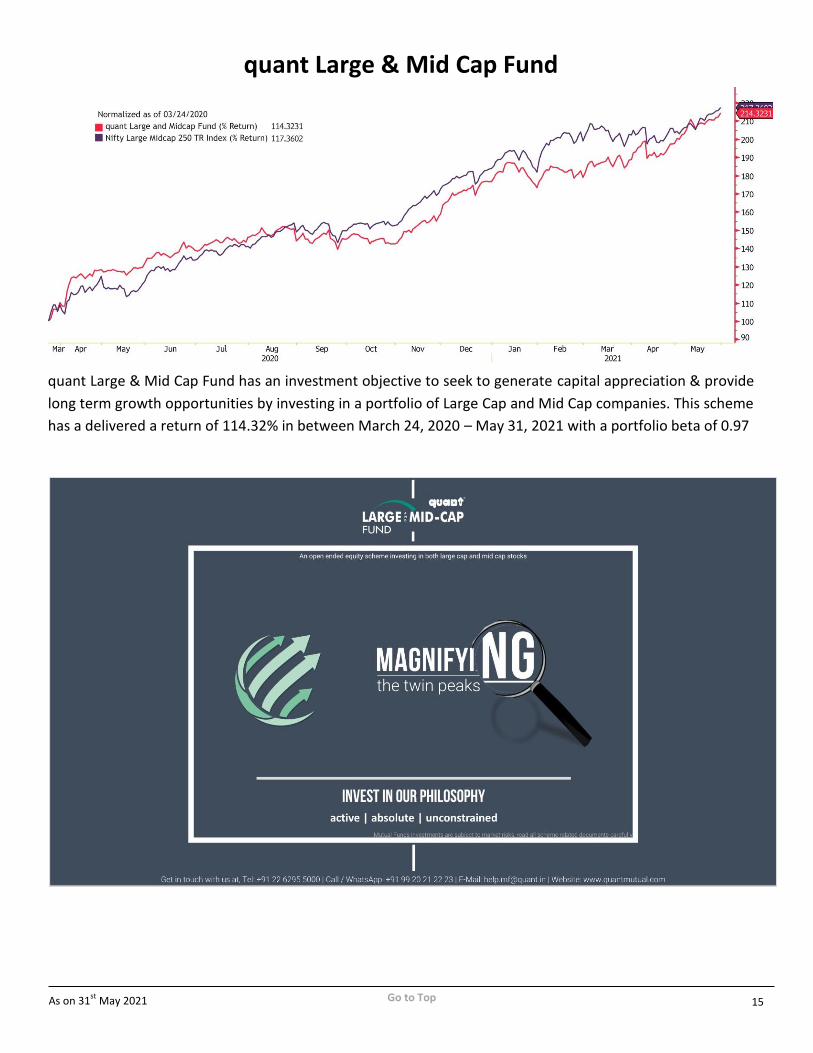
quant Large & Mid Cap Fund has an investment objective to seek to generate capital appreciation & provide
long term growth opportunities by investing in a portfolio of Large Cap and Mid Cap companies. This scheme
has a delivered a return of 114.32% in between March 24, 2020 – May 31, 2021 with a portfolio beta of 0.97
Go to Top As on 31st
May 2021 16
SCHEME SNAPSHOT PORTFOLIO TOP HOLDING INDUSTRY/ SECTOR ALLOCATION (%)
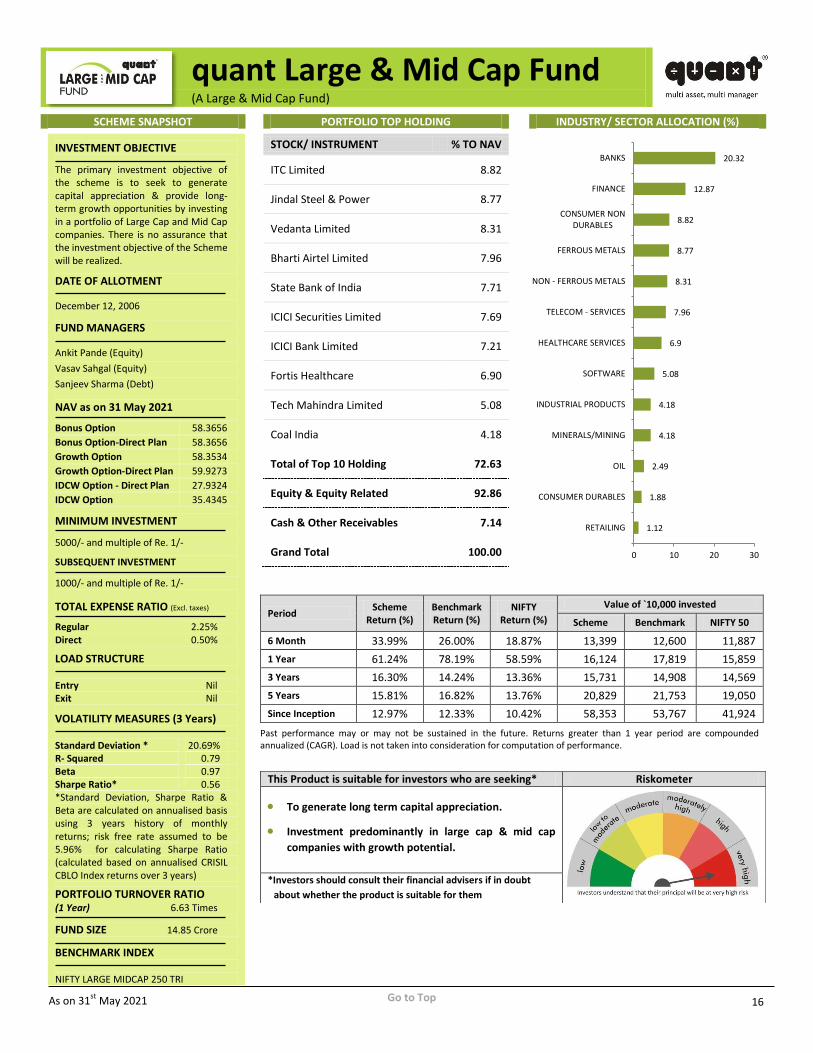
INVESTMENT OBJECTIVE
The primary investment objective of the scheme is to seek to generate capital appreciation & provide long-term growth opportunities by investing in a portfolio of Large Cap and Mid Cap companies. There is no assurance that the investment objective of the Scheme will be realized.
DATE OF ALLOTMENT
December 12, 2006
FUND MANAGERS
Ankit Pande (Equity)
Vasav Sahgal (Equity)
Sanjeev Sharma (Debt)
NAV as on 31 May 2021
Bonus Option 58.3656
Bonus Option-Direct Plan 58.3656
Growth Option 58.3534
Growth Option-Direct Plan 59.9273
IDCW Option - Direct Plan 27.9324
IDCW Option 35.4345
MINIMUM INVESTMENT
5000/- and multiple of Re. 1/-
SUBSEQUENT INVESTMENT
1000/- and multiple of Re. 1/-
TOTAL EXPENSE RATIO (Excl. taxes)
Regular 2.25% Direct 0.50%
LOAD STRUCTURE Entry Nil Exit Nil
VOLATILITY MEASURES (3 Years) Standard Deviation * 20.69% R- Squared 0.79 Beta 0.97 Sharpe Ratio* 0.56 *Standard Deviation, Sharpe Ratio & Beta are calculated on annualised basis using 3 years history of monthly returns; risk free rate assumed to be 5.96% for calculating Sharpe Ratio (calculated based on annualised CRISIL CBLO Index returns over 3 years)
PORTFOLIO TURNOVER RATIO (1 Year) 6.63 Times
FUND SIZE 14.85 Crore
BENCHMARK INDEX NIFTY LARGE MIDCAP 250 TRI
STOCK/ INSTRUMENT % TO NAV
ITC Limited 8.82
Jindal Steel & Power 8.77
Vedanta Limited 8.31
Bharti Airtel Limited 7.96
State Bank of India 7.71
ICICI Securities Limited 7.69
ICICI Bank Limited 7.21
Fortis Healthcare 6.90
Tech Mahindra Limited 5.08
Coal India 4.18
Total of Top 10 Holding 72.63
Equity & Equity Related 92.86
Cash & Other Receivables 7.14
Grand Total 100.00
Period Scheme
Return (%) Benchmark Return (%)
NIFTY Return (%)
Value of `10,000 invested
Scheme Benchmark NIFTY 50
6 Month 33.99% 26.00% 18.87% 13,399 12,600 11,887
1 Year 61.24% 78.19% 58.59% 16,124 17,819 15,859
3 Years 16.30% 14.24% 13.36% 15,731 14,908 14,569
5 Years 15.81% 16.82% 13.76% 20,829 21,753 19,050
Since Inception 12.97% 12.33% 10.42% 58,353 53,767 41,924
Past performance may or may not be sustained in the future. Returns greater than 1 year period are compounded annualized (CAGR). Load is not taken into consideration for computation of performance.
This Product is suitable for investors who are seeking* Riskometer
To generate long term capital appreciation.
Investment predominantly in large cap & mid cap
companies with growth potential.
*Investors should consult their financial advisers if in doubt
about whether the product is suitable for them
1.12
1.88
2.49
4.18
4.18
5.08
6.9
7.96
8.31
8.77
8.82
12.87
20.32
0 10 20 30
RETAILING
CONSUMER DURABLES
OIL
MINERALS/MINING
INDUSTRIAL PRODUCTS
SOFTWARE
HEALTHCARE SERVICES
TELECOM - SERVICES
NON - FERROUS METALS
FERROUS METALS
CONSUMER NONDURABLES
FINANCE
BANKS
quant Large & Mid Cap Fund (A Large & Mid Cap Fund)

Go to Top As on 31st
May 2021 17
quant Focused Fund
quant Focused Fund has an investment objective to seek to generate capital appreciation & provide long
term growth opportunities by investing in a focused portfolio of Large Cap – ‘blue chip’ – companies. This
scheme has a return of 140.78% in between March 24, 2020 – May 31, 2021 with a portfolio beta of just
0.98

Go to Top As on 31st
May 2021 18
SCHEME SNAPSHOT PORTFOLIO TOP HOLDING INDUSTRY/ SECTOR ALLOCATION (%)
INVESTMENT OBJECTIVE
The primary investment objective of the scheme is to seek to generate capital appreciation & provide long-term growth opportunities by investing in a focused portfolio of Large Cap – ‘blue chip’ – companies. There is no assurance that the investment objective of the Scheme will be realized.
DATE OF ALLOTMENT
August 25, 2008
FUND MANAGERS
Ankit Pande (Equity)
Vasav Sahgal (Equity)
Sanjeev Sharma (Debt)
NAV as on 31 May 2021
Growth Option 50.5998
Growth Option-Direct Plan 52.2632
IDCW Option - Direct Plan 30.6179
IDCW Option 37.4404
MINIMUM INVESTMENT
5000/- and multiple of Re. 1/-
SUBSEQUENT INVESTMENT
1000/- and multiple of Re. 1/-
TOTAL EXPENSE RATIO (Excl. taxes)
Regular 2.25% Direct 0.50%
LOAD STRUCTURE Entry Nil Exit Nil
VOLATILITY MEASURES (3 Years)
Standard Deviation * 21.59% R- Squared 0.86 Beta 0.98 Sharpe Ratio* 0.54 *Standard Deviation, Sharpe Ratio & Beta are calculated on annualised basis using 3 years history of monthly returns; risk free rate assumed to be 5.96% for calculating Sharpe Ratio (calculated based on annualised CRISIL CBLO Index returns over 3 years)
PORTFOLIO TURNOVER RATIO (1 Year) 7.70 Times
FUND SIZE 22.88 Crore
BENCHMARK INDEX NIFTY 100 TRI
STOCK/ INSTRUMENT % TO NAV
ITC Limited 9.06
State Bank of India 8.72
Vedanta Limited 8.68
ICICI Bank Limited 8.26
Bharti Airtel Limited 8.25
Coal India 7.75
Oil and Natural Gas Corporation 5.99
Just Dial Limited 5.78
Punjab National Bank 5.61
Tata Steel Limited 5.41
Total of Top 10 Holding 73.49
DERIVATIVES 4.56
Equity & Equity Related 86.97
Cash & Other Receivable 8.47
Grand Total 100.00
Period Scheme
Return (%) Benchmark Return (%)
NIFTY Return (%)
Value of `10,000 invested
Scheme Benchmark NIFTY 50
6 Month 41.51% 21.30% 18.87% 14,151 12,130 11,887
1 Year 77.89% 63.56% 58.59% 17,789 16,356 15,859
3 Years 16.46% 13.95% 13.36% 15,797 14,796 14,569
5 Years 16.41% 15.33% 13.76% 21,375 20,401 19,050
Since Inception 13.54% 12.49% 10.55% 50,600 44,917 35,944
Past performance may or may not be sustained in the future. Returns greater than 1 year period are compounded annualized (CAGR). Load is not taken into consideration for computation of performance.
This Product is suitable for investors who are seeking* Riskometer
To generate long term capital appreciation.
Investment in large cap - ‘Blue chip’ companies with
growth potential.
*Investors should consult their financial advisers if in doubt
about whether the product is suitable for them
1.49
2.23
4.56
5.38
5.41
5.99
7.75
8.25
8.68
9.06
10.15
22.59
0 5 10 15 20 25
HEALTHCARE SERVICES
FINANCE
PHARMACEUTICALS
GAS
FERROUS METALS
OIL
MINERALS/MINING
TELECOM - SERVICES
NON - FERROUS METALS
CONSUMER NONDURABLES
SOFTWARE
BANKS
quant Focused Fund (A Focused Fund – Large Cap Oriented)
Go to Top As on 31st
May 2021 19
quant Multi Asset Fund
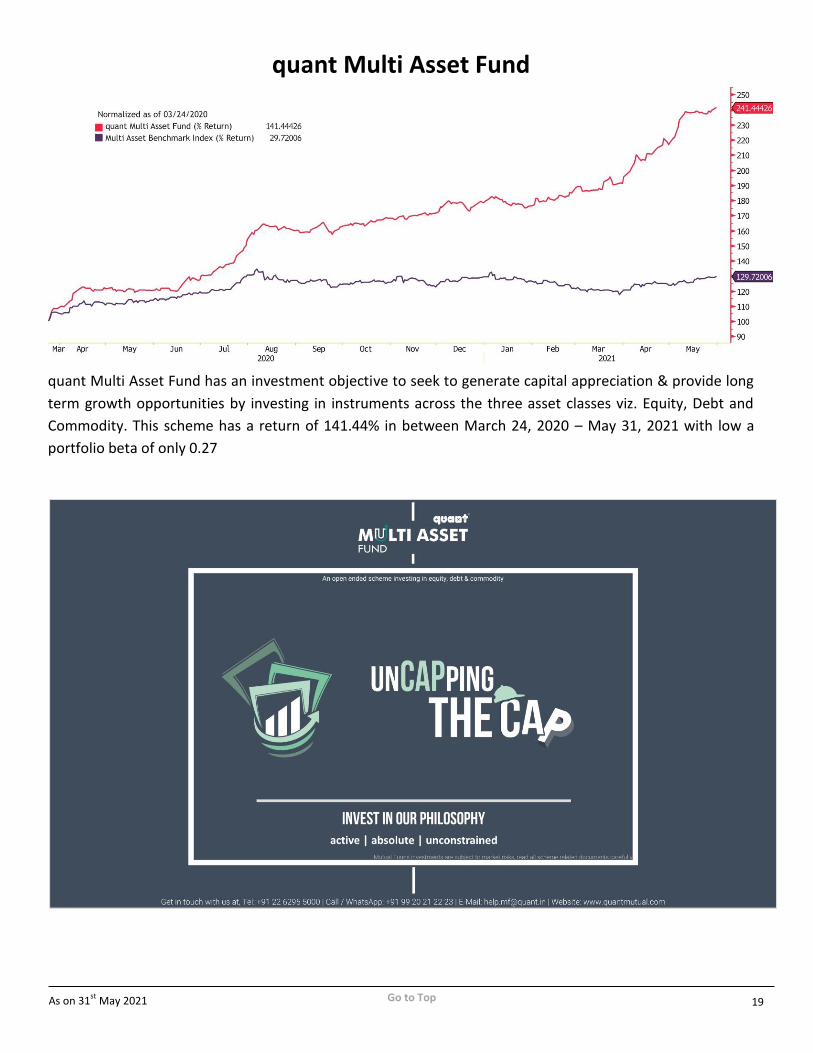
quant Multi Asset Fund has an investment objective to seek to generate capital appreciation & provide long
term growth opportunities by investing in instruments across the three asset classes viz. Equity, Debt and
Commodity. This scheme has a return of 141.44% in between March 24, 2020 – May 31, 2021 with low a
portfolio beta of only 0.27

Go to Top As on 31st
May 2021 20
SCHEME SNAPSHOT PORTFOLIO TOP HOLDING ASSET ALLOCATION (%)
INVESTMENT OBJECTIVE
The investment objective of the scheme is to generate capital appreciation & provide long-term growth opportunities by investing in instruments across the three asset classes viz. Equity, Debt and Commodity. There is no assurance that the investment objective of the Scheme will be realized.
DATE OF ALLOTMENT
April 04, 2001
FUND MANAGERS
Sanjeev Sharma (Debt)
Ankit Pande (Equity)
Vasav Sahgal (Equity)
NAV as on 31 May 2021
IDCW Option - Direct Plan 63.0810
IDCW Option 62.3638
GROWTH OPTION 67.9665
GROWTH OPTION-Direct Plan
68.4113
MINIMUM INVESTMENT
5000/- and multiple of Re. 1/-
SUBSEQUENT INVESTMENT
1000/- and multiple of Re. 1/-
TOTAL EXPENSE RATIO (Excl. taxes)
Regular 2.25% Direct 0.50%
LOAD STRUCTURE Entry Nil Exit Nil
Average Maturity 37.58
Modified Duration 34.97
Macaulay Duration 35.74
Yield to Maturity 3.16%
PORTFOLIO TURNOVER RATIO
(1 Year) 2.87 Times
FUND SIZE 50.99 Crore
BENCHMARK INDEX
1/3 NIFTY 50 TRI + 1/3 CRISIL COMPOSITE BOND FUND INDEX +1/3 INR PRICE OF GOLD FUTURE NEAR-MONTH PRICE ON MCX
Stock/ Instrument % TO NAV
Just Dial Limited 9.45
ITC Limited 8.86
Nureca Limited 6.06
Fortis Healthcare 5.63
HFCL Limited 5.42
Thyrocare Technologies Limited 3.72
PTC India Financial Services 1.79
Total Others 40.92
Axis Mutual Fund - Axis Gold ETF 5.42
Kotak Mutual Fund - Gold ETF 3.78
SBI-ETF Gold 1.54
HDFC MF - Gold ETF - Growth 1.47
Aditya Birla Sun Life Gold ETF - Growth
1.29
UTI Mutual Fund - UTI Gold ETF 1.22
Nippon India ETF Gold Bees 0.71
Total Exchange Traded Funds 15.44
7.16% GOI 20 May 23 Sovereign 2.17
Total Government Securities 2.17
Cash & Other Receivable 1.08
TREPS 01-Jun-2021 DEPO 10 40.39
Grand Total 100.00
Period Scheme
Return (%) Benchmark Return (%)
NIFTY Return (%)
Value of `10,000 invested
Scheme Benchmark NIFTY 50
6 Month 34.13% 7.29% 18.87% 13,413 10,729 11,887
1 Year 88.10% 26.15% 58.59% 18,810 12,615 15,859
3 Years 25.49% 12.50% 13.36% 19,764 14,240 14,569
5 Years 16.65% 9.89% 13.76% 21,601 16,021 19,050
Since Inception 9.97% N/A 13.86% 67,966 N/A 137,094
Past performance may or may not be sustained in the future. Returns greater than 1 year period are compounded annualized (CAGR). Load is not taken into consideration for computation of performance.
This Product is suitable for investors who are seeking* Riskometer
To generate income & capital appreciation in the long term.
Investment in instruments across the three asset classes viz Equity, Debt and Commodity.
*Investors should consult their financial advisers if in doubt
about whether the product is suitable for them
Others, 40.92
ETF, 15.44Goverment
Securities, 2.17
Cash & Other Receivable, 41.47
Others
ETF
Goverment Securities
Cash & Other Receivable
N.A., 56.36
Sovereign, 2.17
Cash & Other Receivable, 41.47
N.A.
Sovereign
Cash & Other Receivable
quant Multi Asset Fund (A Multi Asset Allocation Fund)
Go to Top As on 31st
May 2021 21
quant ESG Equity Fund
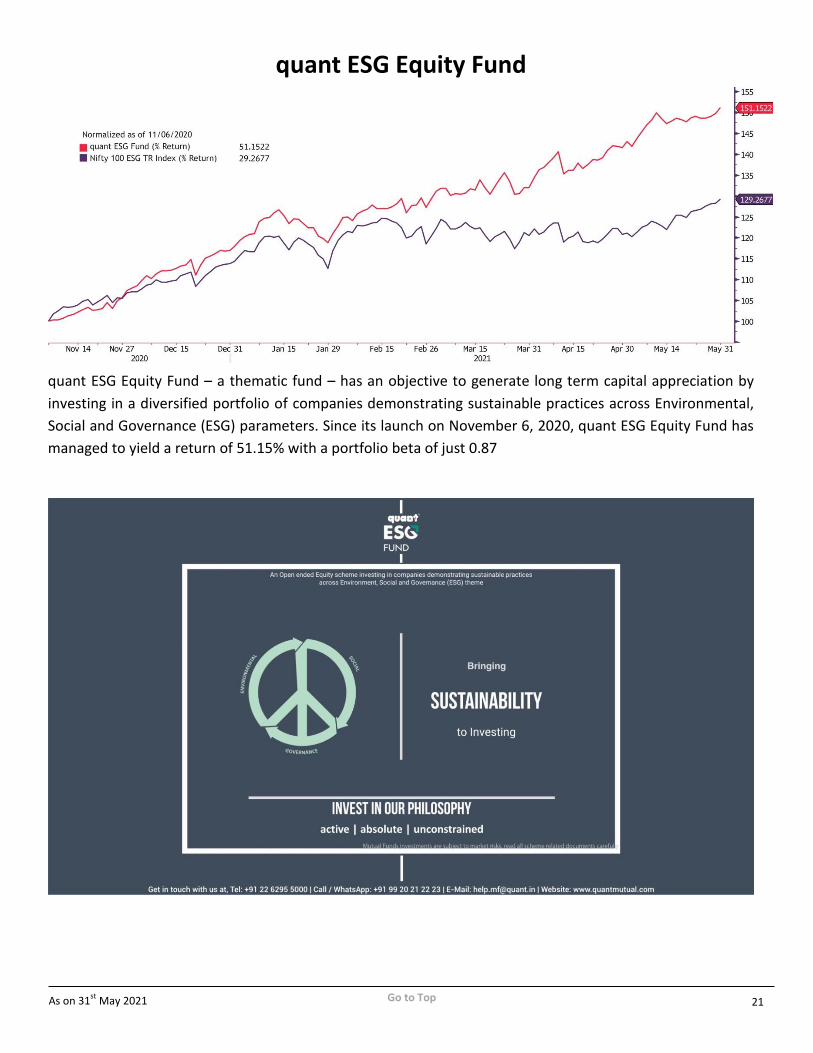
quant ESG Equity Fund – a thematic fund – has an objective to generate long term capital appreciation by
investing in a diversified portfolio of companies demonstrating sustainable practices across Environmental,
Social and Governance (ESG) parameters. Since its launch on November 6, 2020, quant ESG Equity Fund has
managed to yield a return of 51.15% with a portfolio beta of just 0.87
Go to Top As on 31st
May 2021 22
SCHEME SNAPSHOT PORTFOLIO TOP HOLDING INDUSTRY/ SECTOR ALLOCATION (%)
\
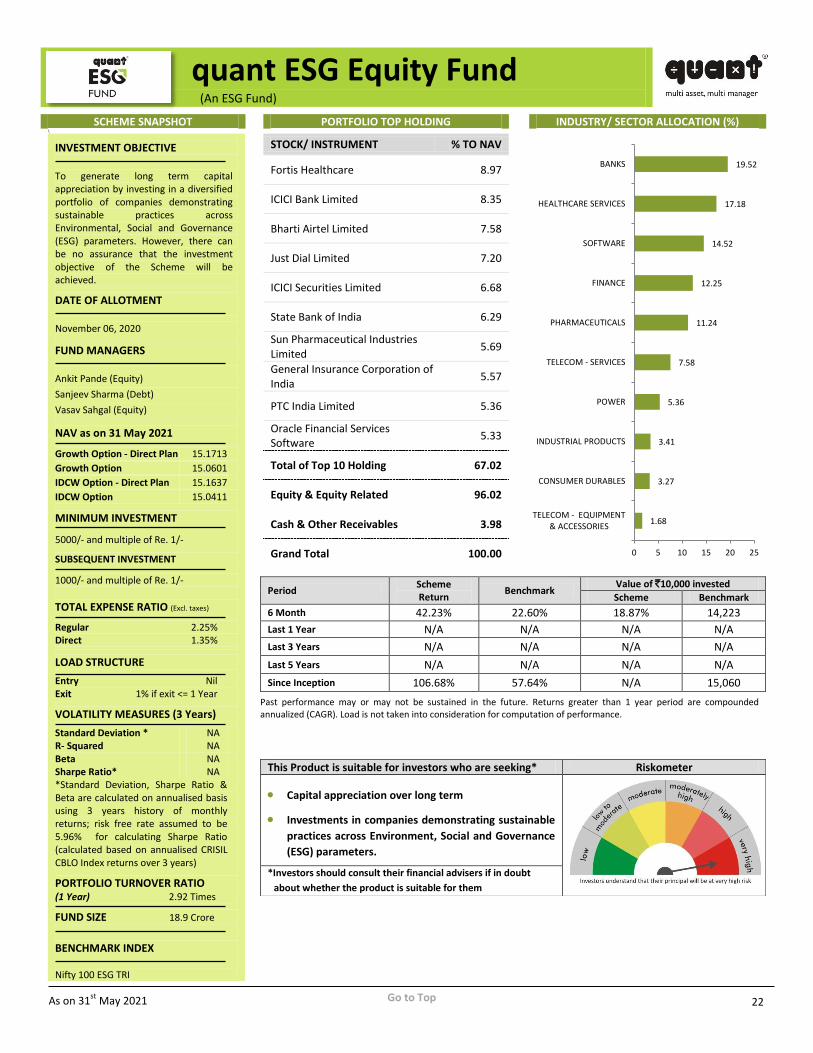
INVESTMENT OBJECTIVE To generate long term capital appreciation by investing in a diversified portfolio of companies demonstrating sustainable practices across Environmental, Social and Governance (ESG) parameters. However, there can be no assurance that the investment objective of the Scheme will be achieved.
DATE OF ALLOTMENT
November 06, 2020
FUND MANAGERS
Ankit Pande (Equity)
Sanjeev Sharma (Debt)
Vasav Sahgal (Equity)
NAV as on 31 May 2021
Growth Option - Direct Plan 15.1713
Growth Option 15.0601
IDCW Option - Direct Plan 15.1637
IDCW Option 15.0411
MINIMUM INVESTMENT
5000/- and multiple of Re. 1/-
SUBSEQUENT INVESTMENT
1000/- and multiple of Re. 1/-
TOTAL EXPENSE RATIO (Excl. taxes)
Regular 2.25% Direct 1.35%
LOAD STRUCTURE
Entry Nil Exit 1% if exit <= 1 Year
VOLATILITY MEASURES (3 Years)
Standard Deviation * NA R- Squared NA Beta NA Sharpe Ratio* NA *Standard Deviation, Sharpe Ratio & Beta are calculated on annualised basis using 3 years history of monthly returns; risk free rate assumed to be 5.96% for calculating Sharpe Ratio (calculated based on annualised CRISIL CBLO Index returns over 3 years)
PORTFOLIO TURNOVER RATIO (1 Year) 2.92 Times
FUND SIZE 18.9 Crore
BENCHMARK INDEX Nifty 100 ESG TRI
STOCK/ INSTRUMENT % TO NAV
Fortis Healthcare 8.97
ICICI Bank Limited 8.35
Bharti Airtel Limited 7.58
Just Dial Limited 7.20
ICICI Securities Limited 6.68
State Bank of India 6.29
Sun Pharmaceutical Industries Limited
5.69
General Insurance Corporation of India
5.57
PTC India Limited 5.36
Oracle Financial Services Software
5.33
Total of Top 10 Holding 67.02
Equity & Equity Related 96.02
Cash & Other Receivables 3.98
Grand Total 100.00
Period Scheme Return
Benchmark Value of `10,000 invested
Scheme Benchmark
6 Month 42.23% 22.60% 18.87% 14,223
Last 1 Year N/A N/A N/A N/A
Last 3 Years N/A N/A N/A N/A
Last 5 Years N/A N/A N/A N/A
Since Inception 106.68% 57.64% N/A 15,060
Past performance may or may not be sustained in the future. Returns greater than 1 year period are compounded annualized (CAGR). Load is not taken into consideration for computation of performance.
This Product is suitable for investors who are seeking* Riskometer
Capital appreciation over long term
Investments in companies demonstrating sustainable
practices across Environment, Social and Governance
(ESG) parameters.
*Investors should consult their financial advisers if in doubt
about whether the product is suitable for them
1.68
3.27
3.41
5.36
7.58
11.24
12.25
14.52
17.18
19.52
0 5 10 15 20 25
TELECOM - EQUIPMENT& ACCESSORIES
CONSUMER DURABLES
INDUSTRIAL PRODUCTS
POWER
TELECOM - SERVICES
PHARMACEUTICALS
FINANCE
SOFTWARE
HEALTHCARE SERVICES
BANKS
quant ESG Equity Fund (An ESG Fund)

Go to Top As on 31st
May 2021 23
SCHEME SNAPSHOT PORTFOLIO TOP HOLDING INDUSTRY/ SECTOR ALLOCATION (%)
\
INVESTMENT OBJECTIVE The investment objective of the Scheme is to deliver superior returns as compared to the underlying benchmark over the medium to long term through investing in equity and equity related securities. The portfolio of stocks will be selected, weighed and rebalanced using stock screeners, factor based scoring and an optimization formula. However, there can be no assurance that the investment objective of the scheme will be realized.
DATE OF ALLOTMENT
May 03, 2021
FUND MANAGERS
Ankit Pande (Equity)
Sandeep Tandon
Sanjeev Sharma (Debt)
Vasav Sahgal (Equity)
NAV as on 31 May 2021
Growth Option - Direct Plan 10.5462
Growth Option 10.5237
IDCW Option - Direct Plan 10.5530
IDCW Option 10.5308
MINIMUM INVESTMENT
5000/- and multiple of Re. 1/-
SUBSEQUENT INVESTMENT
1000/- and multiple of Re. 1/-
TOTAL EXPENSE RATIO (Excl. taxes)
Regular 2.25% Direct 0.50%
LOAD STRUCTURE
Entry Nil Exit 1% if exit <= 1 Year
VOLATILITY MEASURES (3 Years)
Standard Deviation * NA R- Squared NA Beta NA Sharpe Ratio* NA *Standard Deviation, Sharpe Ratio & Beta are calculated on annualised basis using 3 years history of monthly returns; risk free rate assumed to be 5.96% for calculating Sharpe Ratio (calculated based on annualised CRISIL CBLO Index returns over 3 years)
PORTFOLIO TURNOVER RATIO
(1 Year) 0.78 Times
FUND SIZE 47.4 Crore
BENCHMARK INDEX Nifty 500 TRI
STOCK/ INSTRUMENT % TO NAV
ITC Limited 9.05
Vedanta Limited 9.02
Jindal Steel & Power 8.59
Bharti Airtel Limited 8.46
State Bank of India 8.46
Punjab National Bank 6.71
Coal India 6.20
GAIL (India) Limited 5.91
General Insurance Corporation of India
5.81
Tata Steel Limited 5.70
Total of Top 10 Holding 73.92
Equity & Equity Related 91.60
Cash & Other Receivables 8.40
Grand Total 100.00
Period Scheme Return
Benchmark Value of `10,000 invested
Scheme Benchmark
6 Month N/A N/A N/A N/A
Last 1 Year N/A N/A N/A N/A
Last 3 Years N/A N/A N/A N/A
Last 5 Years N/A N/A N/A N/A
Since Inception N/A N/A N/A N/A
Past performance may or may not be sustained in the future. Returns greater than 1 year period are compounded annualized (CAGR). Load is not taken into consideration for computation of performance.
This Product is suitable for investors who are seeking* Riskometer
Capital appreciation over long term
Investment in active portfolio of stocks screened,
selected, weighed and rebalanced on the basis of a
predefined fundamental factor model
*Investors should consult their financial advisers if in doubt
about whether the product is suitable for them
2.88
4.36
5.91
6.2
8.46
9.02
9.05
10.66
14.29
20.76
0 5 10 15 20 25
OIL
INDUSTRIAL PRODUCTS
GAS
MINERALS/MINING
TELECOM - SERVICES
NON - FERROUS METALS
CONSUMER NONDURABLES
FINANCE
FERROUS METALS
BANKS
quant Quantamental Fund (A Quant-based Fund)
Go to Top As on 31st
May 2021 24
quant Absolute Fund
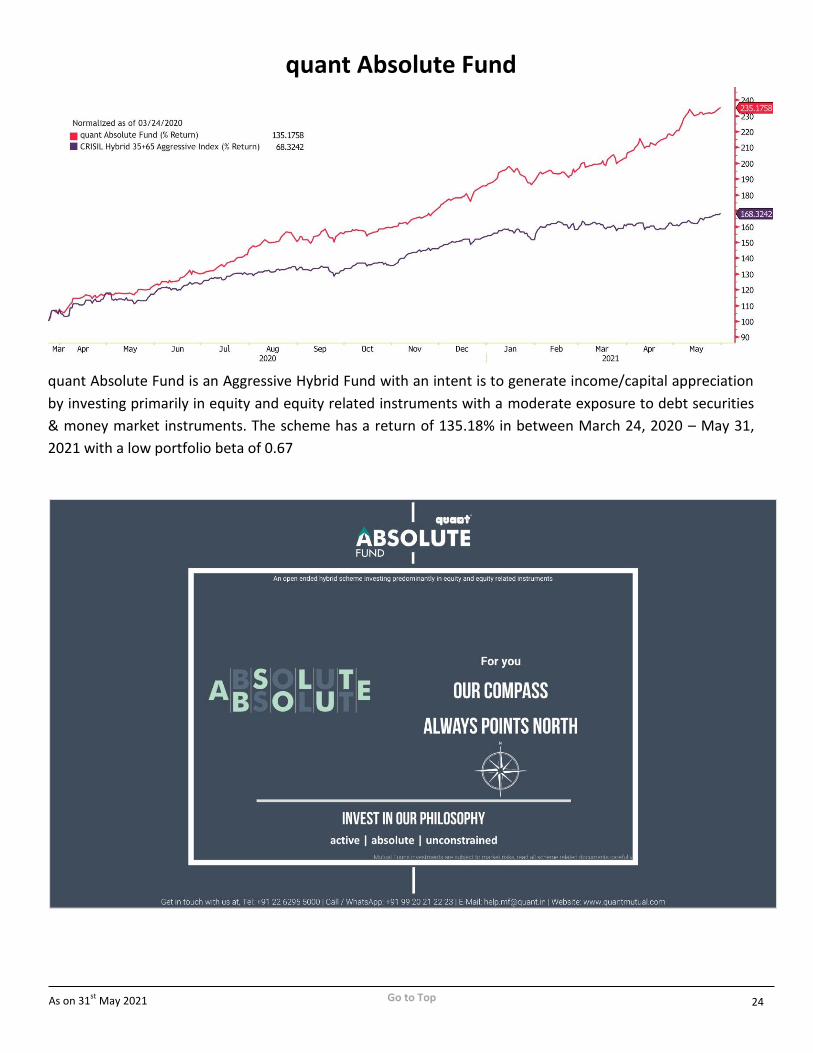
quant Absolute Fund is an Aggressive Hybrid Fund with an intent is to generate income/capital appreciation
by investing primarily in equity and equity related instruments with a moderate exposure to debt securities
& money market instruments. The scheme has a return of 135.18% in between March 24, 2020 – May 31,
2021 with a low portfolio beta of 0.67
Go to Top As on 31st
May 2021 25
SCHEME SNAPSHOT PORTFOLIO TOP HOLDING INDUSTRY/ SECTOR ALLOCATION (%)
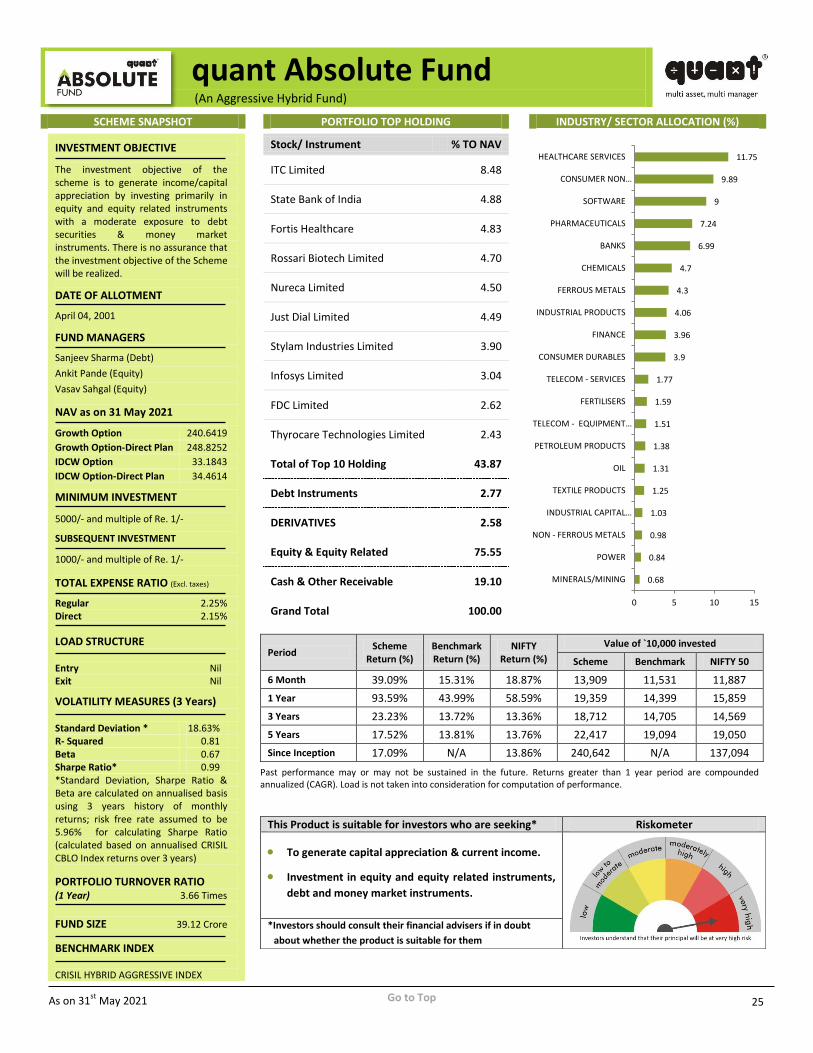
INVESTMENT OBJECTIVE
The investment objective of the scheme is to generate income/capital appreciation by investing primarily in equity and equity related instruments with a moderate exposure to debt securities & money market instruments. There is no assurance that the investment objective of the Scheme will be realized.
DATE OF ALLOTMENT
April 04, 2001
FUND MANAGERS
Sanjeev Sharma (Debt)
Ankit Pande (Equity)
Vasav Sahgal (Equity)
NAV as on 31 May 2021
Growth Option 240.6419
Growth Option-Direct Plan 248.8252
IDCW Option 33.1843
IDCW Option-Direct Plan 34.4614
MINIMUM INVESTMENT
5000/- and multiple of Re. 1/-
SUBSEQUENT INVESTMENT
1000/- and multiple of Re. 1/-
TOTAL EXPENSE RATIO (Excl. taxes)
Regular 2.25% Direct 2.15%
LOAD STRUCTURE Entry Nil Exit Nil
VOLATILITY MEASURES (3 Years) Standard Deviation * 18.63% R- Squared 0.81 Beta 0.67 Sharpe Ratio* 0.99 *Standard Deviation, Sharpe Ratio & Beta are calculated on annualised basis using 3 years history of monthly returns; risk free rate assumed to be 5.96% for calculating Sharpe Ratio (calculated based on annualised CRISIL CBLO Index returns over 3 years)
PORTFOLIO TURNOVER RATIO
(1 Year) 3.66 Times
FUND SIZE 39.12 Crore
BENCHMARK INDEX CRISIL HYBRID AGGRESSIVE INDEX
Stock/ Instrument % TO NAV
ITC Limited 8.48
State Bank of India 4.88
Fortis Healthcare 4.83
Rossari Biotech Limited 4.70
Nureca Limited 4.50
Just Dial Limited 4.49
Stylam Industries Limited 3.90
Infosys Limited 3.04
FDC Limited 2.62
Thyrocare Technologies Limited 2.43
Total of Top 10 Holding 43.87
Debt Instruments 2.77
DERIVATIVES 2.58
Equity & Equity Related 75.55
Cash & Other Receivable 19.10
Grand Total 100.00
Period Scheme
Return (%) Benchmark Return (%)
NIFTY Return (%)
Value of `10,000 invested
Scheme Benchmark NIFTY 50
6 Month 39.09% 15.31% 18.87% 13,909 11,531 11,887
1 Year 93.59% 43.99% 58.59% 19,359 14,399 15,859
3 Years 23.23% 13.72% 13.36% 18,712 14,705 14,569
5 Years 17.52% 13.81% 13.76% 22,417 19,094 19,050
Since Inception 17.09% N/A 13.86% 240,642 N/A 137,094
Past performance may or may not be sustained in the future. Returns greater than 1 year period are compounded annualized (CAGR). Load is not taken into consideration for computation of performance.
This Product is suitable for investors who are seeking* Riskometer
To generate capital appreciation & current income.
Investment in equity and equity related instruments,
debt and money market instruments.
*Investors should consult their financial advisers if in doubt
about whether the product is suitable for them
0.68
0.84
0.98
1.03
1.25
1.31
1.38
1.51
1.59
1.77
3.9
3.96
4.06
4.3
4.7
6.99
7.24
9
9.89
11.75
0 5 10 15
MINERALS/MINING
POWER
NON - FERROUS METALS
INDUSTRIAL CAPITAL…
TEXTILE PRODUCTS
OIL
PETROLEUM PRODUCTS
TELECOM - EQUIPMENT…
FERTILISERS
TELECOM - SERVICES
CONSUMER DURABLES
FINANCE
INDUSTRIAL PRODUCTS
FERROUS METALS
CHEMICALS
BANKS
PHARMACEUTICALS
SOFTWARE
CONSUMER NON…
HEALTHCARE SERVICES
quant Absolute Fund (An Aggressive Hybrid Fund)
Go to Top As on 31st
May 2021 26
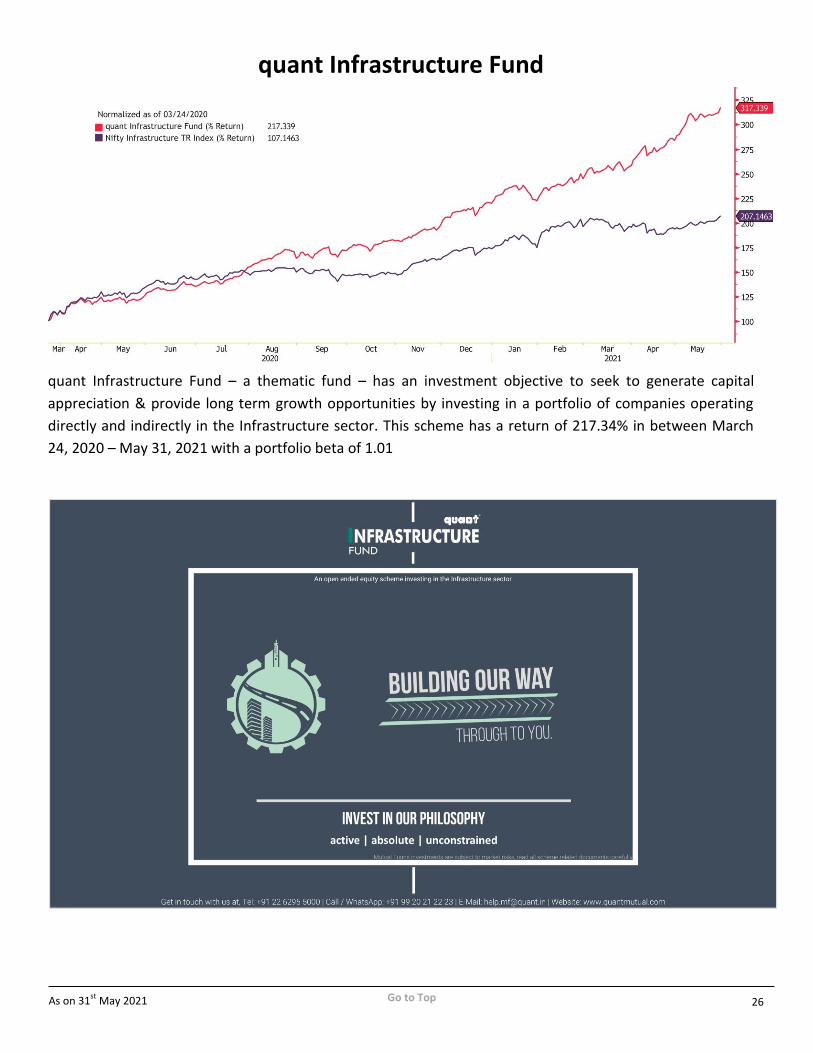
quant Infrastructure Fund
quant Infrastructure Fund – a thematic fund – has an investment objective to seek to generate capital
appreciation & provide long term growth opportunities by investing in a portfolio of companies operating
directly and indirectly in the Infrastructure sector. This scheme has a return of 217.34% in between March
24, 2020 – May 31, 2021 with a portfolio beta of 1.01

Go to Top As on 31st
May 2021 27
SCHEME SNAPSHOT PORTFOLIO TOP HOLDING INDUSTRY/ SECTOR ALLOCATION (%)
INVESTMENT OBJECTIVE The primary investment objective of the scheme is to seek to generate capital appreciation & provide long-term growth opportunities by investing in a portfolio of Infrastructure focused companies. There is no assurance that the investment objective of the Scheme will be realized.
DATE OF ALLOTMENT
September 21, 2007
FUND MANAGERS
Ankit Pande (Equity)
Vasav Sahgal (Equity)
NAV as on 31 May 2021
Growth Option 16.5900
Growth Option-Direct Plan 17.1582
IDCW Option - Direct Plan 17.1496
IDCW Option 16.5550
MINIMUM INVESTMENT
5000/- and multiple of Re. 1/-
SUBSEQUENT INVESTMENT
1000/- and multiple of Re. 1/-
TOTAL EXPENSE RATIO (Excl. taxes)
Regular 2.25% Direct 2.15%
LOAD STRUCTURE Entry Nil Exit 1% if exit <= 1 Year
VOLATILITY MEASURES (3 Years)
Standard Deviation * 28.07% R- Squared 0.77 Beta 1.01 Sharpe Ratio* 0.68 *Standard Deviation, Sharpe Ratio & Beta are calculated on annualised basis using 3 years history of monthly returns; risk free rate assumed to be 5.96% for calculating Sharpe Ratio (calculated based on annualised CRISIL CBLO Index returns over 3 years)
PORTFOLIO TURNOVER RATIO (1 Year) 5.60 Times
FUND SIZE 26.36 Crore
BENCHMARK INDEX NIFTY INFRASTRUCTURE TRI
STOCK/ INSTRUMENT % TO NAV
Vedanta Limited 8.53
State Bank of India 8.45
Bharti Airtel Limited 7.96
Coal India 7.79
ICICI Bank Limited 7.48
Just Dial Limited 7.26
Nureca Limited 5.50
Stylam Industries Limited 4.56
Oil and Natural Gas Corporation 4.18
Fortis Healthcare 3.89
Total of Top 10 Holding 65.59
DERIVATIVES 1.02
Equity & Equity Related 98.43
Cash & Other Receivable 0.54
Grand Total 100.00
Period Scheme
Return (%) Benchmark Return (%)
NIFTY Return (%)
Value of `10,000 invested
Scheme Benchmark NIFTY 50
6 Month 60.97% 27.18% 18.87% 16,097 12,718 11,887
1 Year 151.50% 54.58% 58.59% 25,150 15,458 15,859
3 Years 23.74% 11.21% 13.36% 18,946 13,753 14,569
5 Years 21.00% 11.37% 13.76% 25,932 17,137 19,050
Since Inception 3.77% 1.15% 8.92% 16,590 11,695 32,212
Past performance may or may not be sustained in the future. Returns greater than 1 year period are compounded annualized (CAGR). Load is not taken into consideration for computation of performance.
This Product is suitable for investors who are seeking* Riskometer
To generate long term capital appreciation.
Investment in equity and equity related instruments
of companies in the infrastructure sector.
*Investors should consult their financial advisers if in doubt
about whether the product is suitable for them
1.02
2.06
2.21
2.33
2.57
2.91
3.6
4.18
4.56
4.67
5.43
7.79
7.96
8.53
9.46
12.01
18.15
0 5 10 15 20
PETROLEUM PRODUCTS
TELECOM - EQUIPMENT& ACCESSORIES
POWER
CHEMICALS
INDUSTRIAL CAPITALGOODS
GAS
INDUSTRIAL PRODUCTS
OIL
CONSUMER DURABLES
FINANCE
FERROUS METALS
MINERALS/MINING
TELECOM - SERVICES
NON - FERROUS METALS
SOFTWARE
HEALTHCARE SERVICES
BANKS
quant Infrastructure Fund (A Sectoral Fund)

Go to Top As on 31st
May 2021 28
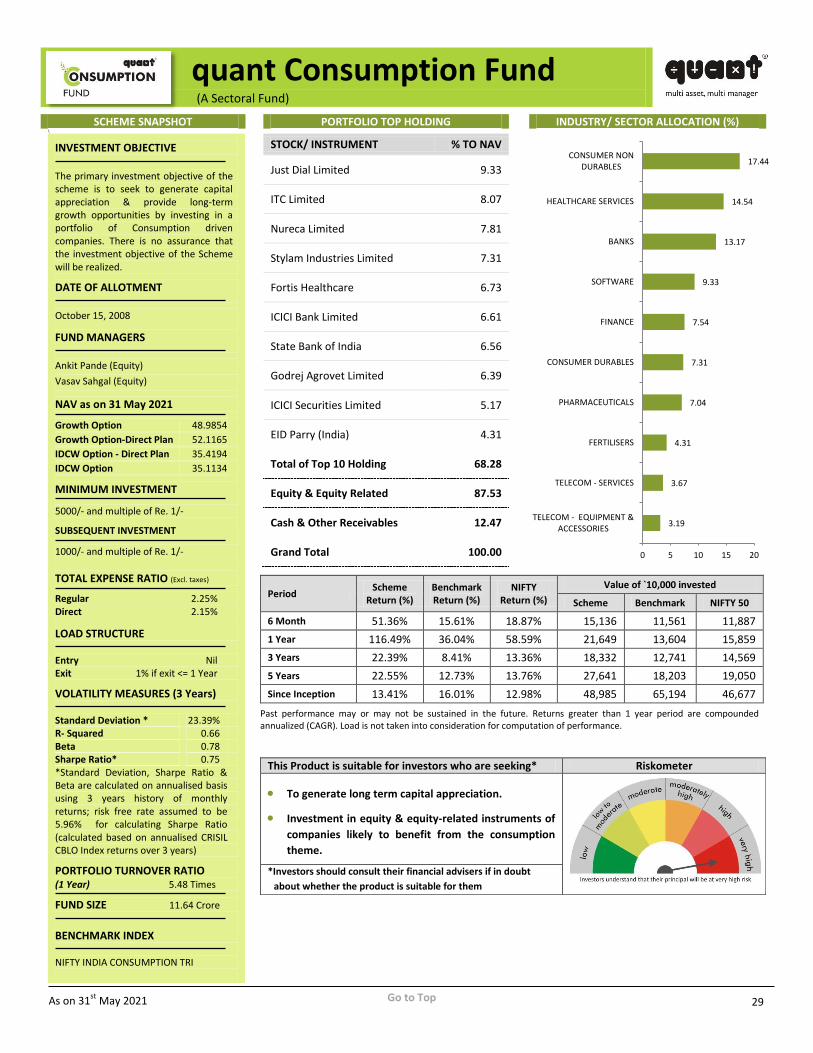
quant Consumption Fund
quant Consumption Fund – a thematic fund – has an investment objective to seek to generate capital
appreciation & provide long term growth opportunities by investing in a portfolio of Consumption driven
companies. This scheme has a return of 195.41% in between March 24, 2020 – May 31, 2021 with a low
portfolio beta of 0.78
Go to Top As on 31st
May 2021 29
SCHEME SNAPSHOT PORTFOLIO TOP HOLDING INDUSTRY/ SECTOR ALLOCATION (%) \
INVESTMENT OBJECTIVE
The primary investment objective of the scheme is to seek to generate capital appreciation & provide long-term growth opportunities by investing in a portfolio of Consumption driven companies. There is no assurance that the investment objective of the Scheme will be realized.
DATE OF ALLOTMENT
October 15, 2008
FUND MANAGERS
Ankit Pande (Equity)
Vasav Sahgal (Equity)
NAV as on 31 May 2021
Growth Option 48.9854
Growth Option-Direct Plan 52.1165
IDCW Option - Direct Plan 35.4194
IDCW Option 35.1134
MINIMUM INVESTMENT
5000/- and multiple of Re. 1/-
SUBSEQUENT INVESTMENT
1000/- and multiple of Re. 1/-
TOTAL EXPENSE RATIO (Excl. taxes)
Regular 2.25% Direct 2.15%
LOAD STRUCTURE
Entry Nil Exit 1% if exit <= 1 Year
VOLATILITY MEASURES (3 Years)
Standard Deviation * 23.39% R- Squared 0.66 Beta 0.78 Sharpe Ratio* 0.75 *Standard Deviation, Sharpe Ratio &Beta are calculated on annualised basis using 3 years history of monthly returns; risk free rate assumed to be 5.96% for calculating Sharpe Ratio (calculated based on annualised CRISIL CBLO Index returns over 3 years)
PORTFOLIO TURNOVER RATIO
(1 Year) 5.48 Times
FUND SIZE 11.64 Crore
BENCHMARK INDEX
NIFTY INDIA CONSUMPTION TRI
STOCK/ INSTRUMENT % TO NAV
Just Dial Limited 9.33
ITC Limited 8.07
Nureca Limited 7.81
Stylam Industries Limited 7.31
Fortis Healthcare 6.73
ICICI Bank Limited 6.61
State Bank of India 6.56
Godrej Agrovet Limited 6.39
ICICI Securities Limited 5.17
EID Parry (India) 4.31
Total of Top 10 Holding 68.28
Equity & Equity Related 87.53
Cash & Other Receivables 12.47
Grand Total 100.00
Period Scheme
Return (%) Benchmark Return (%)
NIFTY Return (%)
Value of `10,000 invested
Scheme Benchmark NIFTY 50
6 Month 51.36% 15.61% 18.87% 15,136 11,561 11,887
1 Year 116.49% 36.04% 58.59% 21,649 13,604 15,859
3 Years 22.39% 8.41% 13.36% 18,332 12,741 14,569
5 Years 22.55% 12.73% 13.76% 27,641 18,203 19,050
Since Inception 13.41% 16.01% 12.98% 48,985 65,194 46,677
Past performance may or may not be sustained in the future. Returns greater than 1 year period are compounded annualized (CAGR). Load is not taken into consideration for computation of performance.
This Product is suitable for investors who are seeking* Riskometer
To generate long term capital appreciation.
Investment in equity & equity-related instruments of
companies likely to benefit from the consumption
theme.
*Investors should consult their financial advisers if in doubt
about whether the product is suitable for them
3.19
3.67
4.31
7.04
7.31
7.54
9.33
13.17
14.54
17.44
0 5 10 15 20
TELECOM - EQUIPMENT &ACCESSORIES
TELECOM - SERVICES
FERTILISERS
PHARMACEUTICALS
CONSUMER DURABLES
FINANCE
SOFTWARE
BANKS
HEALTHCARE SERVICES
CONSUMER NONDURABLES
quant Consumption Fund (A Sectoral Fund)

Go to Top 30
Dividend History quant Liquid Plan
Period Record Date Dividend ̀ Per Unit 2021-2022 25-May-21 0.0560 2021-2022 27-Apr-21 0.0541 2020-2021 30-Mar-21 0.0625 2020-2021 23-Feb-21 0.0469 2020-2021 24-Jan-21 0.0491 2020-2021 24-Nov-20 0.0512 2020-2021 27-Oct-20 0.0616 2020-2021 29-Sep-20 0.07 2020-2021 25-Aug-20 0.052 2020-2021 28-July-20 0.052 2020-2021 30-June-20 0.063 2020-2021 26-May-20 0.064 2020-2021 30-Apr-20 0.05 2019-2020 31-Mar-20 0.01 2019-2020 28-Feb-20 0.07 2019-2020 28-Jan-20 0.07 2019-2020 31-Dec-19 0.09 2019-2020 26-Nov-19 0.08 2019-2020 29-Oct-19 0.09 2019-2020 24-Sept-19 0.07 2019-2020 27-Aug-19 0.08 2019-2020 30-July-19 0.10 2019-2020 25-June-19 0.08 2019-2020 28-May-19 0.09 2019-2020 30-Apr-19 0.10 2018-2019 26-Mar-19 0.09 2018-2019 26-Feb-19 0.09 2018-2019 29-Jan-19 0.10 2018-2019 31-Dec-18 0.09 2018-2019 27-Nov-18 0.09 2018-2019 30-Oct-18 0.06 2018-2019 24-Sep-18 0.08 2018-2019 27-Aug-18 0.08 2018-2019 30-Jul-18 0.10 2018-2019 25-Jun-18 0.08 2018-2019 28-May-18 0.09 2018-2019 23-Apr-18 0.08 2017-2018 26-Mar-18 0.08 2017-2018 26-Feb-18 0.07 2017-2018 29-Jan-18 0.09 2017-2018 25-Dec-17 0.07 2017-2018 27-Nov-17 0.07 2017-2018 30-Oct-17 0.09 2017-2018 25-Sep-17 0.08 2017-2018 28-Aug-17 0.10 2017-2018 24-Jul-17 0.09 2017-2018 26-Jun-17 0.09 2017-2018 29-May-17 0.12 2017-2018 25-Apr-17 0.09 2016-2017 28-Mar-17 0.08 2016-2017 27-Feb-17 0.07 2016-2017 30-Jan-17 0.10 2016-2017 26-Nov-16 0.08 2016-2017 28-Nov-16 0.10 2016-2017 24-Oct-16 0.085 2016-2017 26-Sep-16 0.08
2016-2017 29-Aug-16 0.10 2016-2017 25-Jul-16 0.09 2016-2017 27-Jun-16 0.09 2016-2017 30-May-16 0.12 2016-2017 25-Apr-16 0.09 2015-2016 27-Apr-15 0.10 2015-2016 25-May-15 0.10 2015-2016 29-Jun-15 0.12 2015-2016 27-Jul-15 0.10 2015-2016 24-Aug-15 0.10 2015-2016 28-Sep-15 0.11 2015-2016 26-Oct-15 0.10 2015-2016 23-Nov-15 0.09 2015-2016 28-Dec-15 0.11 2015-2016 26-Jan-16 0.09 2015-2016 22-Feb-16 0.09 2015-2016 28-Mar-16 0.12
quant Active Fund Period Record Date Dividend ̀ Per Unit
2017-2018 26-Feb-18 1.50 2016-2017 1-Mar-17 1.50 2015-2016 2-Feb-16 1.00
quant Small-Cap Fund 2017-2018 26-Feb-18 0.09 2017-2018 28-Jan-18 0.09 2017-2018 27-Dec-17 0.09 2017-2018 7-Dec-17 0.09 2017-2018 1-Nov-17 0.09 2017-2018 2-Oct-17 0.09 2017-2018 26-Sep-17 0.10 2017-2018 29-Aug-17 0.10 2017-2018 23-Jul-17 0.10 2017-2018 20-Jun-17 0.10 2017-2018 28-May-17 0.10 2017-2018 5-May-17 0.10 2016-2017 30-Mar-17 0.10 2016-2017 1-Mar-17 0.10 2016-2017 30-Jan-17 0.10 2016-2017 1-Jan-17 0.10 2016-2017 5-Dec-16 0.10 2016-2017 1-Nov-16 0.10 2016-2017 27-Sep-16 0.10 2016-2017 30-Aug-16 0.10 2016-2017 24-Jul-16 0.10 2016-2017 21-Jun-16 0.10 2016-2017 29-May-16 0.10 2016-2017 5-May-16 0.10 2015-2016 28-Mar-16 0.10 2015-2016 29-Feb-16 0.10 2015-2016 2-Feb-16 0.10 2015-2016 28-Dec-15 0.10 2015-2016 2-Dec-15 0.10 2015-2016 4-Nov-15 0.10 2015-2016 29-Sep-15 0.10 2015-2016 1-Sep-15 0.10 2015-2016 30-Jul-15 0.10
As on 31st
May 2021

Go to Top 31
2015-2016 1-Jul-15 0.10 2015-2016 21-May-15 0.10 2015-2016 5-May-15 0.10
quant Tax Plan Period Record Date Dividend ̀ Per Unit
2017-2018 26-Feb-18 1.50 2017-2018 26-Sep-17 1.25 2016-2017 1-Mar-17 1.50 2016-2017 27-Sep-16 1.25
quant Multi Asset Fund Period Record Date Dividend ̀ Per Unit
2017-2018 26-Feb-18 1.50 2016-2017 1-Mar-17 1.50 2015-2016 2-Feb-16 1.00
quant Focused Fund Period Record Date Dividend ̀ Per Unit
2017-2018 26-Feb-18 2.0 2016-2017 1-Mar-17 2.0 2015-2016 2-Feb-16 2.5
quant Large & Mid-Cap Fund Period Record Date Dividend ̀ Per Unit
2018-2019 6-Aug-18 0.60 2017-2018 26-Feb-18 0.45 2017-2018 27-Dec-17 0.45 2017-2018 26-Sep-17 0.45 2017-2018 20-Jun-17 0.45 2016-2017 30-Mar-17 0.45 2016-2017 1-Jan-17 0.45 2016-2017 27-Sep-16 0.45 2016-2017 21-Jun-16 0.45 2015-2016 29-Feb-16 0.45 2015-2016 4-Nov-15 0.45
quant Money Market Fund Period Record Date Dividend ̀ Per Unit
2017-2018 26-Feb-18 0.10 2017-2018 28-Jan-18 0.10 2017-2018 27-Dec-17 0.10 2017-2018 7-Dec-17 0.10 2017-2018 1-Nov-17 0.10 2017-2018 2-Oct-17 0.10 2017-2018 26-Sep-17 0.11 2017-2018 29-Aug-17 0.11 2017-2018 23-Jul-17 0.11 2017-2018 20-Jun-17 0.11 2017-2018 28-May-17 0.11 2017-2018 5-May-17 0.11 2016-2017 30-Mar-17 0.105 2016-2017 1-Mar-17 0.105 2016-2017 30-Jan-17 0.11 2016-2017 1-Jan-17 0.11 2016-2017 5-Dec-16 0.11 2016-2017 1-Nov-16 0.11 2016-2017 27-Sep-16 0.11 2016-2017 30-Aug-16 0.11 2016-2017 24-Jul-16 0.11
2016-2017 21-Jun-16 0.11 2016-2017 29-May-16 0.11 2016-2017 5-May-16 0.11 2015-2016 28-Mar-16 0.11 2015-2016 29-Feb-16 0.11 2015-2016 2-Feb-16 0.11 2015-2016 28-Dec-15 0.11 2015-2016 2-Dec-15 0.11 2015-2016 4-Nov-15 0.11 2015-2016 29-Sep-15 0.11 2015-2016 1-Sep-15 0.11 2015-2016 30-Jul-15 0.11 2015-2016 1-Jul-15 0.11 2015-2016 21-May-15 0.11 2015-2016 5-May-15 0.11
quant Dynamic Bond Period Record Date Dividend ̀ Per Unit
2017-2018 28-Jan-18 0.08 2017-2018 27-Dec-17 0.08 2017-2018 7-Dec-17 0.08 2017-2018 1-Nov-17 0.08 2017-2018 2-Oct-17 0.08 2017-2018 26-Sep-17 0.092 2017-2018 29-Aug-17 0.092 2017-2018 23-Jul-17 0.092 2017-2018 20-Jun-17 0.092 2017-2018 28-May-17 0.092 2017-2018 5-May-17 0.092 2016-2017 30-Mar-17 0.09 2016-2017 1-Mar-17 0.09 2016-2017 30-Jan-17 0.092 2016-2017 1-Jan-17 0.092 2016-2017 5-Dec-16 0.092 2016-2017 1-Nov-16 0.092 2016-2017 27-Sep-16 0.092 2016-2017 30-Aug-16 0.092 2016-2017 24-Jul-16 0.092 2016-2017 21-Jun-16 0.092 2016-2017 29-May-16 0.092 2016-2017 5-May-16 0.092 2015-2016 28-Mar-16 0.092 2015-2016 29-Feb-16 0.092 2015-2016 2-Feb-16 0.092 2015-2016 28-Dec-15 0.092 2015-2016 2-Dec-15 0.092 2015-2016 4-Nov-15 0.092 2015-2016 29-Sep-15 0.092 2015-2016 1-Sep-15 0.092 2015-2016 30-Jul-15 0.092 2015-2016 1-Jul-15 0.092 2015-2016 21-May-15 0.092 2015-2016 5-May-15 0.092
Past performance may or may not be sustained in the future. There is no assurance or guarantee to Unit holders as to rate/quantum of dividend distribution or that the dividends will be paid regularly. All dividends are on face value of ` 10 per Unit. Please log on to www.quantmutual.com for record date-wise listing of dividends declared.
As on 31st
May 2021
Go to Top As on 31st
May 2021 32
Glossary Sharpe Ratio
Sharpe Ratio is a risk to reward ratio, it measures portfolio returns generated in excess to the investment in risk-free asset, for per unit of total risk taken. While, positive Sharpe ratio indicates, portfolio compensating investors with excess returns (over risk-free rate) for the commensurate risk taken; negative Sharpe ratio indicates, investors are better off investing in risk-free assets.
Beta
Beta of a portfolio is a number indicating the relation between portfolio returns with that of the market index i.e. it measure the volatility, or systematic risk, of a portfolio in comparison to the market as a whole.
Modified Duration
A formula that expresses the measurable change in the value ofa security in response to a change in interest rates. Modified duration of portfolio can be used to anticipate the change in market value of portfolio for every change in portfolio yield.
R Squared It is a statistical measure of how closely the portfolio returns are correlated with its benchmark.
Standard Deviation
A statistical measure that defines expected volatility/risk associated with a portfolio. This explains the variation/deviation from the average returns delivered by the portfolio. A higher standard deviation means higher volatility (risk) and a lower standard deviation means lower volatility
Risk Free Return
The theoretical rate of return of an investment with safest (zero risk) investment in a country.
Total Expense Ratio
Total expenses charged to scheme for the month expressed as a percentage to average monthly net assets.
Average Maturity
Weighted average maturity of the securities in scheme.
Portfolio Yield (Yield To Maturity)
Weighted average yield of the securities in scheme portfolio.
How to read factsheet Fund Manager
An employee of the asset management company such as a mutual fund or life insurer, who manages investments of the scheme. He is usually part of a larger team of fund managers and research analysts.
Application Amount for Fresh Subscription
This is the minimum investment amount for a new investor in a tual fund scheme.
Minimum Additional Amount
This is the minimum investment amount for an existing investor in a mutual fund scheme.
Yield to Maturity
The Yield to Maturity or the YTM is the rate of return anticipated on a bond if held until maturity. YTM is expressed as an annual rate. The YTM factors in the bond’s current market price, par value, coupon interest rate and time to maturity.
SIP
Systematic Investment Plan (SIP) works on the principle of making periodic investments of a fixed sum. It works similar to a recurring bank deposit. For instance, an investor may opt for an SIP that invests `500 every 15th of the month in an equity fund for a period of three years. NAV The NAV or the net asset value is the total asset value per unit of the mutual fund after deducting all related and permissible expenses. AUM
AUM or assets under management refers to the recent / updated cumulative market value of investments managed by a mutual fund.
Modified Duration
Modified duration is the price sensitivity and the percentage change in price for a unit change in yield.
Rating Profile
Mutual funds invest in securities after evaluating their creditworthiness as disclosed by the ratings. A depiction of the mutual fund in various investments based on their ratings becomes the rating profile of the fund. Typically, this is a feature of debt funds.
Benchmark
A group of securities, usually a market index, whose performance is used as a standard or benchmark to measure investment performance of mutual funds, among other investments. Some typical benchmarks include the NIFTY, Sensex, BSE200, BSE500, 10-Year Gsec
Entry Load
A mutual fund may have a sales charge or load at the time of entry and/or exit to compensate the distributor/agent. Entry load is charged at the time an investor purchases the units of a mutual fund. The entry load is added to the prevailing NAV at the time of investment. For instance, if the NAV is `100 and the entry load is 1%, the investor will enter the fund at `101. (Note SEBI, vide circular dated June 30, 2009 has abolished entry load and mandated that the upfront commission to distributors will be paid by the investor directly to the distributor, based on his assessment of various factors including the service rendered by the distributor).
Exit Load
Exit load is charged at the time an investor redeems the units of a mutual fund. The exit load is reduced from the prevailing NAV at the time of redemption. The investor will receive redemption proceed at net value of NAV less Exit Load. For instance if the NAV is `100 and the exit load is 1%, the investor will receive `99.
Go to Top As on 31st
May 2021 33
Point of Service (PoS) Location KFIN Technologies Private Limited
Agartala: Bidurkarta Chowmuhani, J N Bari Road, Tripura ( West ), Agartala - 799001. Agra: 1St Floor, Deepak Wasan Plaza, Behind Holiday Inn, Opp Megdoot Furnitures,Sanjay Place, Agra - 282002. Ahmedabad: 201/202 Shail, Opp: Madhusudan House, Navrangpura, Ahmedabad - 380006. Ajmer: S. No. 1 & 2, 2Nd Floor, Ajmer Tower, Kutchery Road, Ajmer - 305001. Akola: Yamuna Tarang Complex, Shop No 30, Ground Floor, N. H. No- 06, Akola, Akola - 444004. Aligarh: 1St Floor, Kumar Plaza, Aligarh - 202001. Allahabad: Rsa Towers, 2Nd Floor, Above Sony Tv Showroom, 57, S P Marg, Civil Lines, Allahabad - 211001. Alleppy: X1V 172, Jp Towers, Mullackal, Ksrtc Bus Stand, Alleppy - 688011. Alwar: 101, Saurabh Tower, Opp. Uit, Near Bhagat Singh Circle, Road No. 2, Alwar - 301001. Ambala: 6349, Nicholson Road, Adjacent Kos Hospitalambala Cant, Ambala - 133001. Amravati: Shop No 13 & 27, Gulshan Plaza, Badnera Road, Near Bhartiya Mahavidhyalaya, Rajapeth, Amravati - 444605. Amritsar: 72-A, Taylor’S Road, Opp Aga Heritage Club, Amritsar - 143001. Anand: B-42 Vaibhav Commercial Center, Nr Tvs Down Town Shrow Room , Grid Char Rasta, Anand - 380001. Ananthapur: #15/149,1St Floor, S R Towers, Subash Road, Opp. To Lalitha Kala Parishad, Anantapur - 515001. Ankleshwar: L/2 Keval Shopping Center, Old National Highway, Ankleshwar, Ankleshwar - 393002. Asansol: 114/71 G T Road, Near Sony Centre, Bhanga Pachil, Asansol - 713303. Aurangabad: Ramkunj Niwas, Railway Station Road, Near Osmanpura Circle, Aurangabad - 431005. Azamgarh: 1St Floor, Alkal Building, Opp. Nagaripalika Civil Line, Azamgarh - 276001. Balasore: Gopalgaon, M.S Das Street, Gopalgaon, Balasore, Orissa, Balasore - 756001. Bangalore: 59, Skanda puttanna Road, Basavanagudi, Bangalore - 560004. Bankura: Ambika Market Complex (Ground Floor), Nutanganj, Post & Dist Bankura, Bankura - 722101. Bareilly: 1St Floor, 165, Civil Linesopp. Hotel Bareilly Palace, Near Railway Station, Bareilly - 243001. Barhampore (Wb): Thakur Market Complex, Gorabazar, Post Berhampore Dist Murshidabad, 72 No Nayasarak Road, Barhampore (Wb) - 742101. Baroda: Sb-5, Mangaldeep Complex, Opp. Masonic Hall, Productivity Road, Alkapuri, Baroda - 390007. Begusarai: Near Hotel Diamond Surbhi Complex, O.C Township Gate, Kapasiya Chowk, Begusarai - 851117. Belgaum: Cts No 3939/ A2 A1, Above Raymonds Show Room |Beside Harsha Appliances, Club Road, Belgaum - 590001. Bellary: No. 1, Khb Colony, Gandhi Nagar, Bellary - 583103. Berhampur (Or): 3rd Lane Dharam Nagar, Opp – Divya Nandan Kalyan Mandap, Near Lohiya Motor, Orissa, Berhampur (Or) - 760001. Betul: 107,1St Floor, Hotel Utkarsh, | J. H. College Road, Betul - 460001. Bhagalpur: 2Nd Floor, Chandralok Complex, Ghantaghar, Radha Rani Sinha Road, Bhagalpur - 812001. Bharuch: Shop No 147-148, Aditya Complex, Near Kasak Circle, Bharuch - 392001. Bhatinda: #2047-A 2Nd Floor, The Mall Road, Above Max New York Life Insurance, New Delhi - 151001. Bhavnagar: G-11 Giranjali Complex, Beside Bhavnagar Municipal Corporation & Collector Office, Kalanala, Bhavnagar - 364001. Bhilai: Shop No -1, First Floor, Plot No -1, Commercial Complex, Nehru Nagar - East, Bhilai - 490020. Bhilwara: Shop No. 27-28, 1St Floor, Heera Panna Market, Pur Road, Bhilwara - 311001. Bhopal: Kay Kay Business Centre, 133, Zone I, Mp Nagar, Above City Bank, Bhopal - 462011. Bhubaneswar: A/181, Back Side Of Shivam Honda Show Room, Saheed Nagar, Bhubaneswar - 751007. Bikaner: 70-71, 2Nd Floor | Dr.Chahar Building, Panchsati Circle, Sadul Ganj, Bikaner - 334001. Bilaspur: Shop No-201 & 202, 1St Floor, V R Plaza, Link Road, Bilaspur, C. G. Bilaspur - 495001. Bokaro: B-1, 1St Floor, City Centre, Sector - 4, Near Sona Chandi Jwellars, Bokaro - 827004. Burdwan: 63 Gt Road, Halder Complex 1St Floor, Burdwan - 713101. Calicut: Iind Floor Soubhagya Shopping Complex, Arayidathpalam, Mavoor Road, Calicut - 673004. Chandigarh: Sco-371-372S, Above Hdfc Bank, Sector 35-B, Chandigarh - 160036. Chandrapur: Shop No-6, Office No-2 1St Floor, Rauts Raghuvanshi Complex, Beside Azad Garden Main Road, Chandrapur - 442402. Chennai: F-11, Akshaya Plaza, 1St Floor, 108, Adhithanar Salai, Egmore, Opp To Chief Metropolitan Court, Chennai - 600002. Chinsura: J C Ghosh Saranu, Bhanga Gara, Chinsurah, Hooghly, Chinsurah - 712101. Cochin: Ali Arcade, 1St Floor, Kizhavana Road, Panampilly Nagar, Near Atlantis Junction, Ernakualm - 682036. Coimbatore: 1057/1058 Jaya Enclave, 2nd Floor, Avinashi Road, Coimbatore - 641018. Cuttack: Po - Buxi Bazar, Cuttack, Opp Dargha Bazar, Dargha Bazar, Cuttack - 753001. Darbhanga: Jaya Complex, 2Nd Floor, Above Furniture Planet, Donar, Chowk, Darbhanga - 846003. Davangere: 376/2, 4th Main, 8th Cross, P J Extn, Davangere - 577002. Dehradun: Kaulagarh Road, Near Sirmaur Margabove, Reliance Webworld, Dehradun - 248001. Deoria: 1St Floor, 1St Floor, Opp. Zila Panchayat, Civil Lines, Deoria - 274001. Dewas: 27 Rmo House, Station Road, Above Maa Chamunda Gaes Agency, Dewas - 455001. Dhanbad: 208 New Market 2Nd Floor, Bank More, Dhanbad - 826001. Dharwad: G, 7&8 Banashankari Avenue, Opp Nttf,, P B Road, Dharwad - 580001. Dhule: Ashoka Estate, Shop No. 14/A, Upper Ground Floor, Sakri Road, Opp. Santoshi Mata Mandir, Dhule - 424001. Dindigul: No : 9 Old No: 4/B, New Agraharam, Palani Road, Dindigul - 624001. Durgapur: 1St Floor, Old Dutta Automobile Bldg, Nachan Road, Benachity, Durgapur - 713213. Eluru: D.No: 23B-5-93/1, Savithri Complex, Edaravari Street, Near Dr.Prabhavathi Hospital,R. R. Pet, Eluru - 534002. Erode: No: 4, Veerappan Traders Complex, KMY Salai, Sathy Road, Opp. Erode Bus Stand, Erode - 638003. Faridabad: A-2B, Ist Floor, Nehru Groundnit, Faridabad - 121001. Ferozpur: The Mall Road, Chawla Bulding, Ist Floor, Opp. Centrail Jail, Near Hanuman Mandir, Ferozepur - 152002. Gandhidham: 203 2Nd Floor, Bhagwati Chamber, Kutchkala Road, Gandhidham - 370201. Gandhinagar: Plot No - 945/2, Sector - 7/C, Opp Pathika, Gandhinagar - 382007. Gaya: 1St Floor Lal Bhawan, Tower Chowk, Near Kiran Cinema, Gaya - 823001. Ghaziabad: 1St Floorc-7, Lohia Nagar, Ghaziabad - 201001. Ghazipur: 2Nd Floor, Shubhra Hotel Complex, Mahaubagh, Ghazipur - 233001. Gonda: Shri Market, Sahabgunj, Station Road, Gonda - 271001. Gorakhpur: Above V. I. P. Houseajdacent, A.D. Girls College, Bank Road, Gorakpur - 273001. Gulbarga: Cts No 2913 1St Floor, Asian Towers, Jagath Station Main Road, Next To Adithya Hotel, Gulbarga - 585105. Guntur: D No 6-10-27, Srinilayam, Arundelpet, 10/1, Guntur - 522002. Gurgaon: Shop No.18, Ground Floor, Sector - 14, Opp. Akd Tower, Near Huda Office, Gurgaon - 122001. Guwahati: 54 Sagarika Bhawan 2Nd Floor, R G Barooah Road, Aidc, Near Baskin Robbins, Guwahati - 781024. Gwalior: 37/38, Lashkar, Mlb Roadshinde Ki Chhawani, Near Nadi Gate Pul, Gwalior - 474001. Haldwani: Above Kapilaz, Sweet House, Opp Lic Building, Pilikothi, Haldwani - 263139. Haridwar: 8, Govind Puri, Opp. LIC - 2, Above Vijay Bank, Main Road, Ranipur More, Haridwar - 249401. Hassan: St Anthony’S Complex, Ground Floor, H.N. Pura Road, Hassan - 573201. Hissar: Sco-71, 1St Floor, Red Square Market, Hissar - 125001. Hoshiarpur: 1St Floor, The Mall Tower, Opp Kapila Hospital, Sutheri Road, Hoshiarpur - 146001. Hubli: 22Nd & 23Rd, 3Rd Floor, Eureka Junction, Travellers Bunglow, Hubli - 580029. Hyderabad: 8-2-596, Avenue 4, Karvy Plaza, Street No 1, Banjara Hills, Hyderabad - 500034. Indore: 213 B City Center, M.G. Road, Opp. High Court, Indore - 452001. Jabalpur: Grover Chamber, 43 Naya Bazar Malviya Chowk, Opp Shyam Market, Jabalpur - 482002. Jaipur: S16/A Iiird Floor, Land Mark Building Opp Jai Club, Mahaver Marg C Scheme, Jaipur - 302001. Jalandhar: Arora Prime Tower, Lowe Ground Floor, Office No 3 Plot No 28, Jalandhar - 144001. Jalgaon: 113, Navi Peth, B/H Mahalaxmi Dairy, Jalgaon - 425001. Jalpaiguri: D B C Road Opp Nirala Hotel, Opp Nirala Hotel, Jalpaiguri - 735101. Jammu: 5 A/D Extension 2, Near Panama Chowk Petrol Pump, Panama Chowk, Jammu - 180012. Jamnagar: 108 Madhav Palaza, Opp Sbi Bank, Nr Lal Bunglow, Jamnagar - 361001. Jamshedpur: Kanchan Tower, 3Rd Floor, Main Road, Bistupur, Near Traffic Signal, Jamshedpur - 831001. Jaunpur: R N Complex, 1-1-9-G, In Front Of Pathak Honda, Ummarpur, Jaunpur - 222002. Jhansi: 371/01, Narayan Plaza,Gwalior Road, Near Jeevan Shah Chauraha, Jhansi - 284001. Jodhpur: 203, Modi Arcade, Chopasni Road , Jodhpur - 342001. Junagadh: 124-125 Punit Shopping Center, M.G Road, Ranavav Chowk, Junagadh - 362001. Kannur: 2 Nd Floor, Prabhath Complex, Fort Road, Nr. Icici Bank, Kannur - 670001. Kanpur: 15/46, B, Ground Floor, Opp: Muir Mills, Civil Lines, Kanpur - 208001. Karaikudi: Gopi Arcade, 100 Feet Road, Karaikudi - 630001. Karimnagar: H.No.4-2-130/131, Above Union Bank, Jafri Road, Rajeev Chowk, Karimnagar - 505001. Karnal: 18/369, Char Chaman, Kunjpura Road, Behind Miglani Hospital, Karnal - 132001. Karur: No.6, old No.1304, Thiru-vi-ka Road, Near G.R. Kalyan Mahal, Karur - 639001. Kharagpur: 180 Malancha Road, Beside Axis Bank Ltd,
Kharagpur - 721304. Kolhapur: 605/1/4 E Ward, Shahupuri 2Nd
Lane, Laxmi Niwas, Near Sultane Chambers, Kolhapur - 416001. Kolkata: 166 A Rashbihari Avenue 2Nd Floor, Opp - Fortish Hospital, Kolkata - 700029. Kollam: Sree Vigneswara Bhavan, Shastri Junction, Kollam - 691001. Korba: 1St Floor, 35, Indira Complex, P. Nagar, Korba - 495677. Kota: 29, Ist Floor, Near Lala Lajpat Rai Circle, Shopping Centre, Kota - 324007. Kottayam: 1St Floor Csiascension Square, Railway Station Road, Collectorate P O, Kottayam - 686002. Kurnool: Shop No.43, 1St Floor, S V Complex, Railway Station Road, Near Sbi Main Branch, Kurnool - 518004. Lucknow: 24, Prem Nagar, Ashok Marg, Lucknow - 226001. Ludhiana: Sco - 136, 1St Floor Above Airtel Showroom, Feroze Gandhi Market, Ludhiana - 141001. Madurai: Rakesh towers, 30-C, Ist floor, Bye pass Road, Opp Nagappa motors, Madurai - 625010. Malappuram: First Floor, Cholakkal Building, Near U P School, Up Hil, Malappuram - 676505. Malda: Sahis Tuli, Under Ward No.6, No.1 Govt Colony, English Bazar Municipality, Malda - 732101. Mandi: 149/11, School Bazaar, Mandi - 175001. Mangalore: Mahendra Arcade Opp Court Road, Karangal Padi, Mangalore - 575003. Margoa: 2Nd Floor, Dalal Commercial Complex, Pajifond, Margao - 403601. Mathura: Ambey Crown, Iind Floor, In Front Of Bsa College, Gaushala Road, Mathura - 281001. Meerut: 1St Floor, Medi Centreopp Icici Bank, Hapur Road Near Bachha Park, Meerut - 250002. Mehsana: Ul/47 Apollo Enclave, Opp Simandhar Temple, Modhera Cross Road, Mehsana - 384002. Mirzapur: Girja Sadan, Dawari Gunj, Mirzapur - 231001. Moga: 1St Floor,Dutt Road, Mandir Wali Gali, Civil Lines, Barat Ghar, Moga - 142001. Moradabad: Om Arcade, Parker Road, Above Syndicate Bank,Chowk Tari Khana, Moradabad - 244001. Morena: Moti Palace, Near Ramjanki Mandir, Near Ramjanki Mandir, Morena - 476001. Mumbai: 24/B, Raja Bahadur Compound, Ambalal Doshi Marg, Behind Bse Bldg, Fort - 400001. Muzaffarpur: I St Floor, Uma Market, Thana Gumtimoti Jheel, Muzaffarpur - 842001. Mysore: L-350,Silver Tower, Ashoka Road, Opp.Clock Tower, Mysore - 570001. Nadiad: 104/105, Near Paras Cinema, City Point Nadiad, Nadiad - 387001. Nagerkoil: 3A, South Car Street, Nagercoil - 629001. Nagpur: Plot No 2/1 House No 102/1, Mata Mandir Road, Mangaldeep Appartment Opp Khandelwal Jewelers, Dharampeth, Nagpur - 440010. Namakkal: 105/2, Arun Towers, Paramathi Street, Namakkal - 637001. Nanded: Shop No.4, Santakripa Market, G G Road, Opp. Bank Of India, Nanded - 431601. Nasik: S-12,Suyojit Sankul, Sharanpur Road, Near Rajiv Gandhi Bhavan, Nasik - 422002. Navsari: 1/1 Chinmay Aracade, Opp Sattapir Rd, Tower Rd, Mavsari - 396445. Nellore: 16-2-230, Room No : 27, 2Nd Floor, Keizen Heights, Gandhi Nagar, Pogathota, Nellore - 524001. New Delhi: 305 New Delhi House, 27 Barakhamba Road, New Delhi - 110001. Nizamabad: H No:5-6-430, A Bove Bank Of Baroda First Floor, Beside Hdfc Bank, Hyderabad Road, Nizamabad - 503003. Noida: 307 Jaipuria Plazad 68 A, 2Nd Floor, Opp Delhi Public School, Sector 26, Noida - 201301. Palghat: No: 20 & 21, Metro Complex H.P.O.Road Palakkad, H.P.O.Road, Palakkad - 678001. Panipat: 1St Floor,, Krishna Tower, Above Amertex, G.T. Road, Panipat - 132103. Panjim: City Business Centre, Coelho Pereira Building, Room No 18,19 & 20, Dada Vaidya Road, Panjim - 403001. Pathankot: 1St Floor, 9 A, Improvement Trust Building, Patel Chowk, Pathankot - 145001. Patiala: Sco 27 D, Chotti Baradari, Near Car Bazaar, Patiala - 147001. Patna: 3A, 3Rd Floor Anand Tower, Exhibition Road, Opp Icici Bank, Patna - 800001. Pollachi: S S Complex, New Scheme Road, Pollachi - 642002. Pondicherry: No:7, Thiayagaraja Street, Pondicherry - 605001. Proddatur: Shop No:4, Araveti Complex, Mydukur Road, Beside Syndicate Bank, Proddatur - 516360. Pudukottai: Sundaram Masilamani Towers, Ts No. 5476 - 5479, Pm Road, Old Tirumayam Salai, Near Anna Statue, Jublie Arts, Pudukottai - 622001. Pune: Office # 16, Ground Floor, Shrinath Plaza, Near Dyaneshwar Paduka Chowk, F C Road, Pune - 411005. Raipur: 2 & 3 Lower Level, Millenium Plaza, Room No. Ll 2& 3, Behind Indian Coffee House, Raipur - 492001. Rajahmundry: D.No.6-1-4, Rangachary Street, T. Nagar, Near Axis Bank Street, Rajahmundry - 533101. Rajapalayam: Sri Ganapathy Complex, 14B/5/18, T P Mills Road, Rajapalayam - 626117. Rajkot: 104, Siddhi Vinyak Com. Opp Ramkrishna Ashram, Dr Yagnik Road, Rajkot - 360001. Ranchi: Room No 307 3Rd Floor, Commerce Tower, Beside Mahabir Tower, Ranchi - 834001. Ratlam: 1 Nagpal Bhawan, Free Ganj Road , Do Batti, Near Nokia Care, Ratlam - 457001. Renukoot: Shop No.18, Near Complex Birla Market, Renukoot - 231217. Rewa: Ist Floor, Angoori Building, Besides Allahabad Bank, Trans University Road, Civil Lines, Rewa - 485001. Rohtak: 1St Floor, Ashoka Plaza, Delhi Road, Rohtak - 124001. Roorkee: Shree Ashadeep Complex, 16, Civil Lines, Near Income Tax Office, Roorkee - 247667. Rourkela: 1St Floor Sandhu Complex, Kachery Road, Uditnagar, Rourekla - 769012. Sagar: Above Poshak Garments, 5 Civil Lines, Infront Of Income Tax Office, Sagar - 470002. Saharanpur: 18 Mission Market, Court
Road, Saharanpur - 247001. Salem: No:40, 2nd Floor, BrindavanRoad, Fairlands, Near Perumal Koil, Salem - 636016. Sambalpur: Ground Floor Quality Massion, Sambalpur - 768001. Satna: 1St Floor, Gopal Complex, Near Bus Stand, Rewa Road, Satna - 485001. Shaktinagar: 1St/A-375, V V Colony, Dist Sonebhadra, Shaktinagar - 231222. Shillong: Annex Mani Bhawan, Lower Thana Road, Near R K M Lp School, Shillong - 793001. Shimla: Triveni Building, By Pas Chowkkhallini, Shimla - 171002. Shimoga: Udaya Ravi Complex, LLR Road, Durgi Gudi, Shimoga - 577201. Shivpuri: 1St Floor, M.P.R.P. Building, Near Bank Of India, Shivpuri - 473551. Sikar: First Floor, Super Tower, Behind Ram Mandir Near Taparya Bagichi, Sikar - 332001. Silchar: N.N. Dutta Road, Chowchakra Complex, Premtala, Silchar - 788001. Siliguri: Nanak Complex, Sevoke Road, Siliguri - 734001. Sitapur: 12/12-A Sura Complex, Arya Nagar Opp, Mal Godam, Sitapur - 261001. Sivakasi: 363, Thiruthangal Road, Opp: TNEB, Sivakasi - 626123. Solan: Sahni Bhawan, Adjacent Anand Cinema Complex, The Mall, Solan - 173212. Solapur: Block No 06, Vaman Nagar, Opp D-Mart, Jule Solapur - 413004. Sonepat: 205 R Model Town, Above Central Bank Of India, Sonepat - 131001. Sri Ganganagar: 35E Block, Opp: Sheetla Mata Vaateka Sri Ganganagar, Sri Ganganagar - 335001. Srikakulam: D.No-4-1-28/1, Venkateswara Colony, Near Income Tax Office, Srikakulam - 532001. Sultanpur: Rama Shankar Complex, Civil Lines, Faizabad Road, Sultanpur - 228001.Surat: G-5 Empire State Buliding, Nr Udhna Darwaja, Ring Road, Surat - 395002. Thanjavur: No. 70, Nalliah Complex, Srinivasam Pillai Road, Tanjore - 613001. Thodupuzha: First Floor, Pulimoottil Pioneer, Pala Road, Thodupuzha - 685584. Tirunelveli: 55/18, Jeney Building, S N Road, Near Aravind Eye Hospital, Tirunelveli - 627001. Tirupathi: Flot No: 16, 1St Floor, R C Road, Near Palani Theater, Tirupathi - 517501. Tirupur: First floor, 224 A, Kamaraj Road, Opp to Cotton market complex, Tirupur - 641604. Tiruvalla: 2Nd Floor, Erinjery Complex, Ramanchira, Opp Axis Bank, Thiruvalla - 689107. Trichur: 2Nd Floor, Brothers Complex, Naikkanal Junction, Shornur Road, Near Dhanalakshmi Bank H O, Thrissur - 680001. Trichy: 60, Sri Krishna Arcade, Thennur High Road, Trichy - 620017. Trivandrum: 2Nd Floor, Akshaya Tower, Sasthamangalam, Trivandrum - 695010. Tuticorin: 4 - B, A34 - A37, Mangalmal Mani Nagar, Opp. Rajaji Park, Palayamkottai Road, Tuticorin - 628003. Udaipur: 201-202, Madhav Chambers, Opp G P O, Chetak Circle, Udaipur - 313001. Ujjain: 101 Aashta Tower, 13/1 Dhanwantri Marg, Freeganj, Ujjain - 456010. Valsad: Shop No 2, Phiroza Corner, Opp Next Show Room, Tithal Road, Valsad - 396001. Vapi: Shop No-12, Ground Floor, Sheetal Appatment, Near K P Tower, Vapi - 396195. Varanasi: D-64/1321St Floor, Anant Complex, Sigra, Varanashi - 221010. Vellore: 1, M N R Arcade, Officers Line, Krishna Nagar, Vellore - 632001. Vijayanagaram: Soubhagya, 19-6-1/3, 2Nd Floor, Near Fort Branch, Opp: Three Temples, Vizianagaram - 535002. Vijayawada: 39-10-7, Opp : Municipal Water Tank, Labbipet, Vijayawada - 520010. Visakhapatnam: Door No 47-14-5/1, Eswar Paradise, Dwarakanagar Main Road, Visakhapatnam - 530016. Warangal: 5-6-95, 1 St Floor, Opp: B.Ed Collage, Lashkar Bazar, Chandra Complex, Hanmakonda, Warangal - 506001. Yamuna Nagar: Jagdhari Road, Above Uco Bank, Near D.A.V. Girls College, Yamuna Nagar - 135001.
Go to Top As on 31st
May 2021 34
Go to Top
quant mutual fund registered office: 6th floor, sea breeze building, appasaheb marathe marg, prabhadevi, mumbai - 400 025.
tel: +91 22 6295 5000 | phone/whatsapp: +91 9920 21 22 23 | [email protected] | www.quantmutual.com