table 8-1. middle and working class, outline of chapter 8 (kerbo, p. 215) defining and locating the...
Post on 22-Dec-2015
214 views
TRANSCRIPT

Table 8-1. Middle and Working Class, Outline of Chapter 8 (Kerbo, p. 215)
• Defining and Locating the Middle and Working Classes
• Recent Historical Changes
• Consequences of Class Positions
• Economic and Political Position

Table 5-5. The Convergence of Occupational, Bureaucratic, and Property Divisions on Class Categories (Kerbo, p. 145)
Positions in three main types of institutional structures
Class categories Occupation
Bureaucratic
Authority
Property
Relation
Upper Class High High Owner
Corporate Class High High Non-Owner/low
Middle Class High to Mid Mid Non-Owner/low
Working Class Mid to Low Low Non-Owner/low
Lower Class Low Low Non-Owner

Table 8-2. Further Detail on the Middle and Working Classes (based on Kerbo, pp. 217-219)
Class Occupation Authority Property
Middle Class Professional, sales, clericals; non-manual; white collar; higher education
Middle or lower managers and supervisors (new middle class)
Small shopkeepers or employers: petite bourgeoisie (old middle class)
Working Class Lower skilled; less complex; factory, operatives, trades; manual; blue collar; less education
No authority; supervised
Wage workers

Table 8-3. Percent of Civilian Labor Force by Occupation, 1900-1902 (Kerbo, p. 220)
Occupation 1900 1920 1940 1960 1979 1990 2002
Professionals 4% 5% 7% 11% 15% 13% 16%
Managers 6% 7% 7% 11% 11% 11% 15%
Sales/tech 5% 5% 7% 6% 6% 15% 15%
Clerical 3% 8% 10% 15% 18% 15% 13%
Total White Collar 18% 25% 31% 43% 50% 54% 59%
Crafts 11% 13% 13% 13% 13% 11% 11%
Operatives 13% 16% 18% 18% 15% 11% 13%
Laborers 12% 12% 9% 5% 5% 4%
Service 9% 8% 12% 12% 14% 18% 14%
Farmers 38% 27% 17% 8% 3% 3% 3%
Total Blue Collar 83% 76% 68% 56% 50% 47% 41%

Table 8-4. Percent of Households Earning 75-125% of Median in 1995 and Change, 1980-1995 for Major Industrial
Nations (Kerbo, p. 2226)
Country % of Households % Change, 1980-1995
Australia 27.6% -2.6%
Canada 35.8% +2.8%
France 39.4% +3.7%
Germany 43.9% +2.4%
Netherlands 38.7% -2.3%
Norway 45.3% +3.9%
Sweden 52.7% -1.3%
Great Britain 32.6% -3.9%
United States 27.3% -4.4%

Table 8-5. Mean Wealth for Poorest to Wealthiest Fifths of U.S. Population in 1962, 1998, and 2004 (Kerbo, p. 232)
Poorest to Wealthiest Fifth of
Population
1962 1998 2004
Wealthiest Fifth $680,800 $1,305,800 $1,822,600
Second Fifth $112,700 $186,900 $243,600
Third Fifth $45,700 $70.700 $81,900
Fourth Fifth $8,000 $12,900 $14,400
Poorest Fifth -$6,000 -$10,300 -$11,400

Table 8-6. Accidental Deaths in Private Industry per 100,000 Workers by Industry (Kerbo, p. 237)
Industry Deaths Per 100,000 Workers
Agriculture, forestry, fishing 29.2%
Mining 28.3%
Construction 11.6%
Manufacturing 2.5%
Transportation and utilities 16.5%
Trade 1.2%
Services 2.1%
Total Number of Fatal Accidents in Private Industry in 2004 = 4,952

Table 6-2. Classes Defined by Class, Status, and Party
Class Location
Base of Class Location
Class Status Party
Upper Class Wealthy Leisure Active
Corporate Wealthy Business Active
Managerial Rich Business Probably Votes
Professional Rich Professional May be Active
Working Class Moderate Family Might Vote
Lower Class Poor Street Inactive

Table 8-7. Social and Community Participation and Child Rearing Practices of Middle and Working Class (based on Kerbo, pp. 239-241)
Class Social and Community Child Rearing
Middle Class
More Community Involvement (may vary by neighborhood); more articulate, cultured, cosmopolitan; shop Macy’s
Stress initiative, self-reliance, achievement, deferred gratification
Working Class
More Involved with Extended Family; Gender segregated friendships; country western, drag races and beauty contests; shop Wal-Mart
Stress conformity; working with things rather than ideas

Table 8-8. Percent of U.S. Citizens Voting in Selected Elections by Family Income, 1984-2000 (Kerbo, p. 243)
Income 1984 1988 1992 1996 1998 2000
<$5,000 37.5% 34.7% 32.4% 37.9% 21.1% 28.2%
<$10,000 46.2% 41.3% 39.5% 38.3% 23.9% 34.7%
<$15,000 53.5% 47.7% 46.8% 46.7% 30.4% 37.7%
<$20,000 57.1% 53.5% 55.7% 52.8% 34.6% 43.4%
<$25,000 61.1% 57.8% 62.5% 52.8%
<$35,000 67.0% 64.0% 69.6% 56.6% 40.2% 51.0%
<$50,000 72.9% 70.3% 75.7% 62.6% 44.0% 57.5%
$50,000+ 76.0% 75.6% 79.9% 72.8%
49.9% 65.2%<$75,000
$75,000+ 57.3% 71.5%

Table 8-9. Percentage of Poverty Reduction through Government Action and Rank on Class Issues (4=Highest to 1=Lowest) in National Voting for
Selected Countries (Based on Kerbo, p. 245)
Country Poverty Reduction
Class Voting Rank
Mean Poverty Reduction for Rank
Sweden -80.4% 4 -67.5
Denmark -72.1% 4
England -50.0% 4
Belgium -80.6% 3 -65.4
Germany -65.5% 3
Australia -50.0% 3
Netherlands -70.6% 2 -65.9
France -65.3% 2
Italy -64.7% 2
Spain -63.1% 2
Canada -50.0% 1 -39.25
United States -28.5% 1

Table 8-10. Average Hourly Wage, Insurance, Pension, and Total Compensation for Union and Nonunion Workers in the United States in
2005 (Kerbo, p. 247)
Wages Insurance Pension Total
Union $24.10 $3.63 $2.39 $33.17
Nonunion $18.81 $1.54 $0.72 $23.09
Union Premium $
$5.29 $2.09 $1.67 $10.08
Union Premium %
28.1% 135.7% 231.9% 43.7%
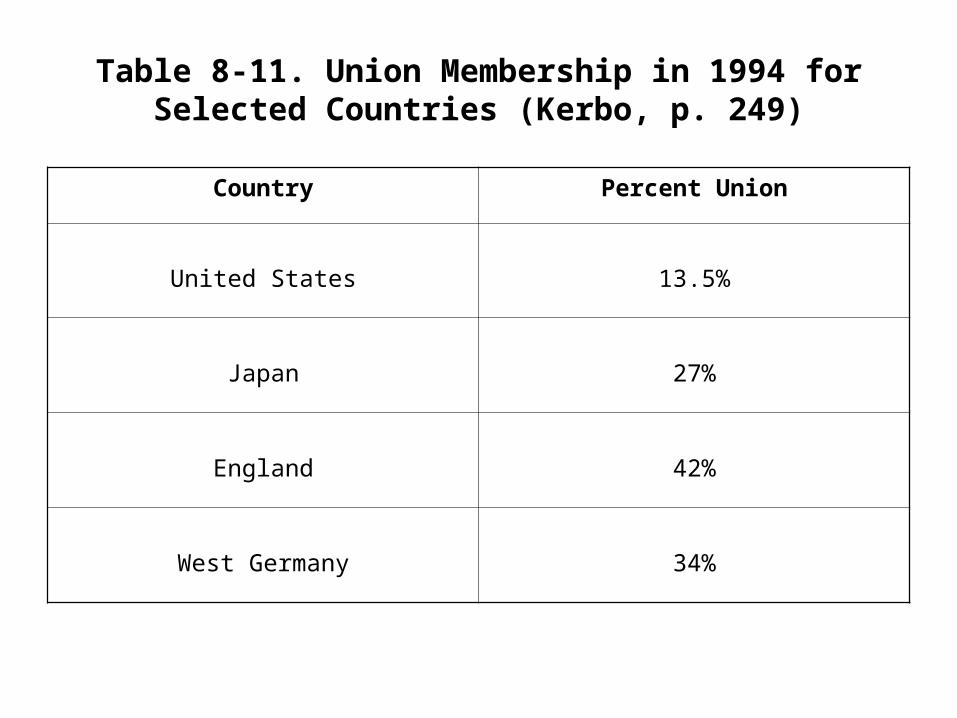
Table 8-11. Union Membership in 1994 for Selected Countries (Kerbo, p. 249)
Country Percent Union
United States 13.5%
Japan 27%
England 42%
West Germany 34%