table 5: worksheet for estimating the use value of orchard ... · table 5: worksheet for estimating...
TRANSCRIPT

Table 5: Worksheet for estimating the use value of orchard land in .Example The estimated net returns assume a planting density of 135 trees per acre. A complete listing of this table for each jurisdiction participating in the land use program is available at the Virginia Department of Taxation. Estimates apply to tax-year 2005.
1. Estimated net returns (loss) per acre applicable to tax-year 2005 (see Table 4 for more detail). Age of Trees Processed Fru ti Percent of To al /1/ t Fresh Fruit Percent of Total /1/ Pre-production aged trees (1 - 4 years) ($1,340.22) 7.0% ($1,427.11) 3.0% Early-production aged trees (5 - 10 years) ($713.30) 17.5% ($1,027.23) 7.5% Full-production aged trees (11 - 25 years) $553.86 35.0% ($40.44) 15.0% Late-production aged trees (26 - 30 years) $142.27 10.5% ($100.18) 4.5% 2 e a) 2003 /2/ . Weight d Average Net Return for 1997-2003.
$34.64 b) 2002 ($113.52) c) 2001 ($108.20) d) 2000 ($59.80) e) 1999 ($46.81) f) 1998 $88.77 g) 1997 $88.77 3 a) Net return to trees and land ("olympic" average o 2a thru 2g) /3/ . Net Returns
$0.00 f b) Net return attributable to land only (class III) /4/ $18.69 c) Net return attributable to trees only (3a - 3b) ($18.69) 5 a) Interest Rate . Capitalization Rate
0.0733 b) Property Tax 0.0043 c) Depreciation of Apple Trees /5 0.0333 / d) Depreciation of "Other" Trees 0.0500 e) Apple Orchard Capitalization Rate 0.1109 f) "Other" Orchard Capitalization Rate 0.1276 . Use Value of Apple Orchard and "Other" Orchard 6
APPL ORCHARDE "OTH R" ORCHARDE Land Class Orchard In ex /7/d Trees Only Trees and Land /8/ Trees Only Trees and Land /8/ I 0.80 ($134.77) $226.44 ($117.17) $244.04 II 1.00 ($168.46) $156.63 ($146.46) $178.63 III 1.00 ($168.46) $72.35 ($146.46) $94.35 IV 1.00 ($168.46) $24.19 ($146.46) $46.19 V 0.75 ($126.34) $18.14 ($109.84) $34.64 VI 0.60 ($101.07) $19.33 ($87.87) $32.53 VII 0.40 ($67.38) $4.86 ($58.58) $13.66 VIII 0.00 $0.00 $24.08 $0.00 $24.08
1/ These percentages assume that 70% of the fruit is produced for the processed market and 30% is produced for the fresh market. In addition, it is assumed that the orchard is 10% pre-production, 25% early production, 50% full production and 15% late 2/ This is the average net return of the eight orchard categories listed in section 1 of this table. The weights are provided by the percent of total trees represented by each category. 3/ In an olympic average, the highest and lowest values are dropped prior to calculating the arithmetic mean. 4/ This is determined by dividing the unadjusted net return value (Table 3 - Line 1) by the soil index factor (Table 3 - Section 4). 5/ The depreciation rate applicable to apple trees assumes that trees are replaced on a 30-year rotation. 6/ "Other" trees refers to peach, cherry, pear, and plum trees. The depreciation rate applicable to "other" trees assumes that trees are replaced on a 20-year rotation. 7/ The orchard index is applicable only in determining the value of the trees. The land index (Table 3 - Section 5) is applied to 8/ The use value of trees and land is determined by adding the appropriate without-risk- land-use-value (see Table 3 - Section5) to the use value of the trees. Table5:1

Table 5: Worksheet for estimating the use value of orchard land in Accomack The estimated net returns assume a planting density of 135 trees per acre. A complete listing of this table for each jurisdiction participating in the land use program is available at the Virginia Department of Taxation. Estimates apply to tax-year 2005.
1. Estimated net returns (loss) per acre applicable to tax-year 2005 (see Table 4 for more detail). Age of Trees Processed Fru ti Percent of To al /1/ t Fresh Fruit Percent of Total /1/ Pre-production aged trees (1 - 4 years) ($1,340.22) 7.0% ($1,427.11) 3.0% Early-production aged trees (5 - 10 years) ($713.30) 17.5% ($1,027.23) 7.5% Full-production aged trees (11 - 25 years) $553.86 35.0% ($40.44) 15.0% Late-production aged trees (26 - 30 years) $142.27 10.5% ($100.18) 4.5% 2 e a) 2003 /2/ . Weight d Average Net Return for 1997-2003.
$34.64 b) 2002 ($113.52) c) 2001 ($108.20) d) 2000 ($59.80) e) 1999 ($46.81) f) 1998 $88.77 g) 1997 $88.77 3 a) Net return to trees and land ("olympic" average o 2a thru 2g) /3/ . Net Returns
$0.00 f b) Net return attributable to land only (class III) /4/ $14.00 c) Net return attributable to trees only (3a - 3b) ($14.00) 5 a) Interest Rate . Capitalization Rate
0.0733 b) Property Tax 0.0058 c) Depreciation of Apple Trees /5 0.0333 / d) Depreciation of "Other" Trees 0.0500 e) Apple Orchard Capitalization Rate 0.1124 f) "Other" Orchard Capitalization Rate 0.1291 . Use Value of Apple Orchard and "Other" Orchard 6
APPL ORCHARDE "OTH R" ORCHARDE Land Class Orchard In ex /7/d Trees Only Trees and Land /8/ Trees Only Trees and Land /8/ I 0.80 ($99.62) $165.93 ($86.76) $178.80 II 1.00 ($124.53) $114.47 ($108.45) $130.55 III 1.00 ($124.53) $52.51 ($108.45) $68.59 IV 1.00 ($124.53) $17.10 ($108.45) $33.18 V 0.75 ($93.40) $12.83 ($81.34) $24.89 VI 0.60 ($74.72) $13.80 ($65.07) $23.45 VII 0.40 ($49.81) $3.30 ($43.38) $9.73 VIII 0.00 $0.00 $17.70 $0.00 $17.70
1/ These percentages assume that 70% of the fruit is produced for the processed market and 30% is produced for the fresh market. In addition, it is assumed that the orchard is 10% pre-production, 25% early production, 50% full production and 15% late 2/ This is the average net return of the eight orchard categories listed in section 1 of this table. The weights are provided by the percent of total trees represented by each category. 3/ In an olympic average, the highest and lowest values are dropped prior to calculating the arithmetic mean. 4/ This is determined by dividing the unadjusted net return value (Table 3 - Line 1) by the soil index factor (Table 3 - Section 4). 5/ The depreciation rate applicable to apple trees assumes that trees are replaced on a 30-year rotation. 6/ "Other" trees refers to peach, cherry, pear, and plum trees. The depreciation rate applicable to "other" trees assumes that trees are replaced on a 20-year rotation. 7/ The orchard index is applicable only in determining the value of the trees. The land index (Table 3 - Section 5) is applied to 8/ The use value of trees and land is determined by adding the appropriate without-risk- land-use-value (see Table 3 - Section5) to the use value of the trees. Table5:2

Table 5: Worksheet for estimating the use value of orchard land in Albemarle The estimated net returns assume a planting density of 135 trees per acre. A complete listing of this table for each jurisdiction participating in the land use program is available at the Virginia Department of Taxation. Estimates apply to tax-year 2005.
1. Estimated net returns (loss) per acre applicable to tax-year 2005 (see Table 4 for more detail). Age of Trees Processed Fru ti Percent of To al /1/ t Fresh Fruit Percent of Total /1/ Pre-production aged trees (1 - 4 years) ($1,340.22) 7.0% ($1,427.11) 3.0% Early-production aged trees (5 - 10 years) ($713.30) 17.5% ($1,027.23) 7.5% Full-production aged trees (11 - 25 years) $553.86 35.0% ($40.44) 15.0% Late-production aged trees (26 - 30 years) $142.27 10.5% ($100.18) 4.5% 2 e a) 2003 /2/ . Weight d Average Net Return for 1997-2003.
$34.64 b) 2002 ($113.52) c) 2001 ($108.20) d) 2000 ($59.80) e) 1999 ($46.81) f) 1998 $88.77 g) 1997 $88.77 3 a) Net return to trees and land ("olympic" average o 2a thru 2g) /3/ . Net Returns
$0.00 f b) Net return attributable to land only (class III) /4/ $12.28 c) Net return attributable to trees only (3a - 3b) ($12.28) 5 a) Interest Rate . Capitalization Rate
0.0733 b) Property Tax 0.0068 c) Depreciation of Apple Trees /5 0.0333 / d) Depreciation of "Other" Trees 0.0500 e) Apple Orchard Capitalization Rate 0.1134 f) "Other" Orchard Capitalization Rate 0.1301 . Use Value of Apple Orchard and "Other" Orchard 6
APPL ORCHARDE "OTH R" ORCHARDE Land Class Orchard In ex /7/d Trees Only Trees and Land /8/ Trees Only Trees and Land /8/ I 0.80 ($86.61) $143.36 ($75.51) $154.46 II 1.00 ($108.26) $98.71 ($94.39) $112.58 III 1.00 ($108.26) $45.05 ($94.39) $58.92 IV 1.00 ($108.26) $14.39 ($94.39) $28.26 V 0.75 ($81.19) $10.79 ($70.79) $21.20 VI 0.60 ($64.95) $11.70 ($56.63) $20.02 VII 0.40 ($43.30) $2.69 ($37.76) $8.24 VIII 0.00 $0.00 $15.33 $0.00 $15.33
1/ These percentages assume that 70% of the fruit is produced for the processed market and 30% is produced for the fresh market. In addition, it is assumed that the orchard is 10% pre-production, 25% early production, 50% full production and 15% late 2/ This is the average net return of the eight orchard categories listed in section 1 of this table. The weights are provided by the percent of total trees represented by each category. 3/ In an olympic average, the highest and lowest values are dropped prior to calculating the arithmetic mean. 4/ This is determined by dividing the unadjusted net return value (Table 3 - Line 1) by the soil index factor (Table 3 - Section 4). 5/ The depreciation rate applicable to apple trees assumes that trees are replaced on a 30-year rotation. 6/ "Other" trees refers to peach, cherry, pear, and plum trees. The depreciation rate applicable to "other" trees assumes that trees are replaced on a 20-year rotation. 7/ The orchard index is applicable only in determining the value of the trees. The land index (Table 3 - Section 5) is applied to 8/ The use value of trees and land is determined by adding the appropriate without-risk- land-use-value (see Table 3 - Section5) to the use value of the trees. Table5:3

Table 5: Worksheet for estimating the use value of orchard land in Alleghany The estimated net returns assume a planting density of 135 trees per acre. A complete listing of this table for each jurisdiction participating in the land use program is available at the Virginia Department of Taxation. Estimates apply to tax-year 2005.
1. Estimated net returns (loss) per acre applicable to tax-year 2005 (see Table 4 for more detail). Age of Trees Processed Fru ti Percent of To al /1/ t Fresh Fruit Percent of Total /1/ Pre-production aged trees (1 - 4 years) ($1,340.22) 7.0% ($1,427.11) 3.0% Early-production aged trees (5 - 10 years) ($713.30) 17.5% ($1,027.23) 7.5% Full-production aged trees (11 - 25 years) $553.86 35.0% ($40.44) 15.0% Late-production aged trees (26 - 30 years) $142.27 10.5% ($100.18) 4.5% 2 e a) 2003 /2/ . Weight d Average Net Return for 1997-2003.
$34.64 b) 2002 ($113.52) c) 2001 ($108.20) d) 2000 ($59.80) e) 1999 ($46.81) f) 1998 $88.77 g) 1997 $88.77 3 a) Net return to trees and land ("olympic" average o 2a thru 2g) /3/ . Net Returns
$0.00 f b) Net return attributable to land only (class III) /4/ $2.43 c) Net return attributable to trees only (3a - 3b) ($2.43) 5 a) Interest Rate . Capitalization Rate
0.0733 b) Property Tax 0.0058 c) Depreciation of Apple Trees /5 0.0333 / d) Depreciation of "Other" Trees 0.0500 e) Apple Orchard Capitalization Rate 0.1124 f) "Other" Orchard Capitalization Rate 0.1291 . Use Value of Apple Orchard and "Other" Orchard 6
APPL ORCHARDE "OTH R" ORCHARDE Land Class Orchard In ex /7/d Trees Only Trees and Land /8/ Trees Only Trees and Land /8/ I 0.80 ($17.32) $28.84 ($15.08) $31.08 II 1.00 ($21.65) $19.90 ($18.85) $22.69 III 1.00 ($21.65) $9.13 ($18.85) $11.92 IV 1.00 ($21.65) $2.97 ($18.85) $5.77 V 0.75 ($16.24) $2.23 ($14.14) $4.32 VI 0.60 ($12.99) $2.40 ($11.31) $4.08 VII 0.40 ($8.66) $0.57 ($7.54) $1.69 VIII 0.00 $0.00 $3.08 $0.00 $3.08
1/ These percentages assume that 70% of the fruit is produced for the processed market and 30% is produced for the fresh market. In addition, it is assumed that the orchard is 10% pre-production, 25% early production, 50% full production and 15% late 2/ This is the average net return of the eight orchard categories listed in section 1 of this table. The weights are provided by the percent of total trees represented by each category. 3/ In an olympic average, the highest and lowest values are dropped prior to calculating the arithmetic mean. 4/ This is determined by dividing the unadjusted net return value (Table 3 - Line 1) by the soil index factor (Table 3 - Section 4). 5/ The depreciation rate applicable to apple trees assumes that trees are replaced on a 30-year rotation. 6/ "Other" trees refers to peach, cherry, pear, and plum trees. The depreciation rate applicable to "other" trees assumes that trees are replaced on a 20-year rotation. 7/ The orchard index is applicable only in determining the value of the trees. The land index (Table 3 - Section 5) is applied to 8/ The use value of trees and land is determined by adding the appropriate without-risk- land-use-value (see Table 3 - Section5) to the use value of the trees. Table5:4

Table 5: Worksheet for estimating the use value of orchard land in Amelia The estimated net returns assume a planting density of 135 trees per acre. A complete listing of this table for each jurisdiction participating in the land use program is available at the Virginia Department of Taxation. Estimates apply to tax-year 2005.
1. Estimated net returns (loss) per acre applicable to tax-year 2005 (see Table 4 for more detail). Age of Trees Processed Fru ti Percent of To al /1/ t Fresh Fruit Percent of Total /1/ Pre-production aged trees (1 - 4 years) ($1,340.22) 7.0% ($1,427.11) 3.0% Early-production aged trees (5 - 10 years) ($713.30) 17.5% ($1,027.23) 7.5% Full-production aged trees (11 - 25 years) $553.86 35.0% ($40.44) 15.0% Late-production aged trees (26 - 30 years) $142.27 10.5% ($100.18) 4.5% 2 e a) 2003 /2/ . Weight d Average Net Return for 1997-2003.
$34.64 b) 2002 ($113.52) c) 2001 ($108.20) d) 2000 ($59.80) e) 1999 ($46.81) f) 1998 $88.77 g) 1997 $88.77 3 a) Net return to trees and land ("olympic" average o 2a thru 2g) /3/ . Net Returns
$0.00 f b) Net return attributable to land only (class III) /4/ $23.37 c) Net return attributable to trees only (3a - 3b) ($23.37) 5 a) Interest Rate . Capitalization Rate
0.0733 b) Property Tax 0.0046 c) Depreciation of Apple Trees /5 0.0333 / d) Depreciation of "Other" Trees 0.0500 e) Apple Orchard Capitalization Rate 0.1112 f) "Other" Orchard Capitalization Rate 0.1279 . Use Value of Apple Orchard and "Other" Orchard 6
APPL ORCHARDE "OTH R" ORCHARDE Land Class Orchard In ex /7/d Trees Only Trees and Land /8/ Trees Only Trees and Land /8/ I 0.80 ($168.09) $281.98 ($146.18) $303.89 II 1.00 ($210.11) $194.95 ($182.73) $222.34 III 1.00 ($210.11) $89.93 ($182.73) $117.32 IV 1.00 ($210.11) $29.93 ($182.73) $57.31 V 0.75 ($157.58) $22.44 ($137.04) $42.98 VI 0.60 ($126.07) $23.96 ($109.64) $40.39 VII 0.40 ($84.04) $5.97 ($73.09) $16.92 VIII 0.00 $0.00 $30.00 $0.00 $30.00
1/ These percentages assume that 70% of the fruit is produced for the processed market and 30% is produced for the fresh market. In addition, it is assumed that the orchard is 10% pre-production, 25% early production, 50% full production and 15% late 2/ This is the average net return of the eight orchard categories listed in section 1 of this table. The weights are provided by the percent of total trees represented by each category. 3/ In an olympic average, the highest and lowest values are dropped prior to calculating the arithmetic mean. 4/ This is determined by dividing the unadjusted net return value (Table 3 - Line 1) by the soil index factor (Table 3 - Section 4). 5/ The depreciation rate applicable to apple trees assumes that trees are replaced on a 30-year rotation. 6/ "Other" trees refers to peach, cherry, pear, and plum trees. The depreciation rate applicable to "other" trees assumes that trees are replaced on a 20-year rotation. 7/ The orchard index is applicable only in determining the value of the trees. The land index (Table 3 - Section 5) is applied to 8/ The use value of trees and land is determined by adding the appropriate without-risk- land-use-value (see Table 3 - Section5) to the use value of the trees. Table5:5

Table 5: Worksheet for estimating the use value of orchard land in Amherst The estimated net returns assume a planting density of 135 trees per acre. A complete listing of this table for each jurisdiction participating in the land use program is available at the Virginia Department of Taxation. Estimates apply to tax-year 2005.
1. Estimated net returns (loss) per acre applicable to tax-year 2005 (see Table 4 for more detail). Age of Trees Processed Fru ti Percent of To al /1/ t Fresh Fruit Percent of Total /1/ Pre-production aged trees (1 - 4 years) ($1,340.22) 7.0% ($1,427.11) 3.0% Early-production aged trees (5 - 10 years) ($713.30) 17.5% ($1,027.23) 7.5% Full-production aged trees (11 - 25 years) $553.86 35.0% ($40.44) 15.0% Late-production aged trees (26 - 30 years) $142.27 10.5% ($100.18) 4.5% 2 e a) 2003 /2/ . Weight d Average Net Return for 1997-2003.
$34.64 b) 2002 ($113.52) c) 2001 ($108.20) d) 2000 ($59.80) e) 1999 ($46.81) f) 1998 $88.77 g) 1997 $88.77 3 a) Net return to trees and land ("olympic" average o 2a thru 2g) /3/ . Net Returns
$0.00 f b) Net return attributable to land only (class III) /4/ $3.93 c) Net return attributable to trees only (3a - 3b) ($3.93) 5 a) Interest Rate . Capitalization Rate
0.0733 b) Property Tax 0.0047 c) Depreciation of Apple Trees /5 0.0333 / d) Depreciation of "Other" Trees 0.0500 e) Apple Orchard Capitalization Rate 0.1113 f) "Other" Orchard Capitalization Rate 0.1280 . Use Value of Apple Orchard and "Other" Orchard 6
APPL ORCHARDE "OTH R" ORCHARDE Land Class Orchard In ex /7/d Trees Only Trees and Land /8/ Trees Only Trees and Land /8/ I 0.80 ($28.26) $47.38 ($24.58) $51.06 II 1.00 ($35.32) $32.75 ($30.72) $37.36 III 1.00 ($35.32) $15.10 ($30.72) $19.71 IV 1.00 ($35.32) $5.02 ($30.72) $9.62 V 0.75 ($26.49) $3.76 ($23.04) $7.21 VI 0.60 ($21.19) $4.02 ($18.43) $6.78 VII 0.40 ($14.13) $1.00 ($12.29) $2.84 VIII 0.00 $0.00 $5.04 $0.00 $5.04
1/ These percentages assume that 70% of the fruit is produced for the processed market and 30% is produced for the fresh market. In addition, it is assumed that the orchard is 10% pre-production, 25% early production, 50% full production and 15% late 2/ This is the average net return of the eight orchard categories listed in section 1 of this table. The weights are provided by the percent of total trees represented by each category. 3/ In an olympic average, the highest and lowest values are dropped prior to calculating the arithmetic mean. 4/ This is determined by dividing the unadjusted net return value (Table 3 - Line 1) by the soil index factor (Table 3 - Section 4). 5/ The depreciation rate applicable to apple trees assumes that trees are replaced on a 30-year rotation. 6/ "Other" trees refers to peach, cherry, pear, and plum trees. The depreciation rate applicable to "other" trees assumes that trees are replaced on a 20-year rotation. 7/ The orchard index is applicable only in determining the value of the trees. The land index (Table 3 - Section 5) is applied to 8/ The use value of trees and land is determined by adding the appropriate without-risk- land-use-value (see Table 3 - Section5) to the use value of the trees. Table5:6

Table 5: Worksheet for estimating the use value of orchard land in Augusta The estimated net returns assume a planting density of 135 trees per acre. A complete listing of this table for each jurisdiction participating in the land use program is available at the Virginia Department of Taxation. Estimates apply to tax-year 2005.
1. Estimated net returns (loss) per acre applicable to tax-year 2005 (see Table 4 for more detail). Age of Trees Processed Fru ti Percent of To al /1/ t Fresh Fruit Percent of Total /1/ Pre-production aged trees (1 - 4 years) ($1,340.22) 7.0% ($1,427.11) 3.0% Early-production aged trees (5 - 10 years) ($713.30) 17.5% ($1,027.23) 7.5% Full-production aged trees (11 - 25 years) $553.86 35.0% ($40.44) 15.0% Late-production aged trees (26 - 30 years) $142.27 10.5% ($100.18) 4.5% 2 e a) 2003 /2/ . Weight d Average Net Return for 1997-2003.
$34.64 b) 2002 ($113.52) c) 2001 ($108.20) d) 2000 ($59.80) e) 1999 ($46.81) f) 1998 $88.77 g) 1997 $88.77 3 a) Net return to trees and land ("olympic" average o 2a thru 2g) /3/ . Net Returns
$0.00 f b) Net return attributable to land only (class III) /4/ $20.77 c) Net return attributable to trees only (3a - 3b) ($20.77) 5 a) Interest Rate . Capitalization Rate
0.0733 b) Property Tax 0.0053 c) Depreciation of Apple Trees /5 0.0333 / d) Depreciation of "Other" Trees 0.0500 e) Apple Orchard Capitalization Rate 0.1119 f) "Other" Orchard Capitalization Rate 0.1286 . Use Value of Apple Orchard and "Other" Orchard 6
APPL ORCHARDE "OTH R" ORCHARDE Land Class Orchard In ex /7/d Trees Only Trees and Land /8/ Trees Only Trees and Land /8/ I 0.80 ($148.50) $248.09 ($129.25) $267.34 II 1.00 ($185.63) $171.30 ($161.56) $195.37 III 1.00 ($185.63) $78.77 ($161.56) $102.83 IV 1.00 ($185.63) $25.89 ($161.56) $49.95 V 0.75 ($139.22) $19.42 ($121.17) $37.47 VI 0.60 ($111.38) $20.82 ($96.94) $35.26 VII 0.40 ($74.25) $5.07 ($64.62) $14.69 VIII 0.00 $0.00 $26.44 $0.00 $26.44
1/ These percentages assume that 70% of the fruit is produced for the processed market and 30% is produced for the fresh market. In addition, it is assumed that the orchard is 10% pre-production, 25% early production, 50% full production and 15% late 2/ This is the average net return of the eight orchard categories listed in section 1 of this table. The weights are provided by the percent of total trees represented by each category. 3/ In an olympic average, the highest and lowest values are dropped prior to calculating the arithmetic mean. 4/ This is determined by dividing the unadjusted net return value (Table 3 - Line 1) by the soil index factor (Table 3 - Section 4). 5/ The depreciation rate applicable to apple trees assumes that trees are replaced on a 30-year rotation. 6/ "Other" trees refers to peach, cherry, pear, and plum trees. The depreciation rate applicable to "other" trees assumes that trees are replaced on a 20-year rotation. 7/ The orchard index is applicable only in determining the value of the trees. The land index (Table 3 - Section 5) is applied to 8/ The use value of trees and land is determined by adding the appropriate without-risk- land-use-value (see Table 3 - Section5) to the use value of the trees. Table5:7

Table 5: Worksheet for estimating the use value of orchard land in Bedford The estimated net returns assume a planting density of 135 trees per acre. A complete listing of this table for each jurisdiction participating in the land use program is available at the Virginia Department of Taxation. Estimates apply to tax-year 2005.
1. Estimated net returns (loss) per acre applicable to tax-year 2005 (see Table 4 for more detail). Age of Trees Processed Fru ti Percent of To al /1/ t Fresh Fruit Percent of Total /1/ Pre-production aged trees (1 - 4 years) ($1,340.22) 7.0% ($1,427.11) 3.0% Early-production aged trees (5 - 10 years) ($713.30) 17.5% ($1,027.23) 7.5% Full-production aged trees (11 - 25 years) $553.86 35.0% ($40.44) 15.0% Late-production aged trees (26 - 30 years) $142.27 10.5% ($100.18) 4.5% 2 e a) 2003 /2/ . Weight d Average Net Return for 1997-2003.
$34.64 b) 2002 ($113.52) c) 2001 ($108.20) d) 2000 ($59.80) e) 1999 ($46.81) f) 1998 $88.77 g) 1997 $88.77 3 a) Net return to trees and land ("olympic" average o 2a thru 2g) /3/ . Net Returns
$0.00 f b) Net return attributable to land only (class III) /4/ $7.10 c) Net return attributable to trees only (3a - 3b) ($7.10) 5 a) Interest Rate . Capitalization Rate
0.0733 b) Property Tax 0.0052 c) Depreciation of Apple Trees /5 0.0333 / d) Depreciation of "Other" Trees 0.0500 e) Apple Orchard Capitalization Rate 0.1119 f) "Other" Orchard Capitalization Rate 0.1285 . Use Value of Apple Orchard and "Other" Orchard 6
APPL ORCHARDE "OTH R" ORCHARDE Land Class Orchard In ex /7/d Trees Only Trees and Land /8/ Trees Only Trees and Land /8/ I 0.80 ($50.80) $84.89 ($44.21) $91.47 II 1.00 ($63.50) $58.62 ($55.27) $66.85 III 1.00 ($63.50) $26.96 ($55.27) $35.19 IV 1.00 ($63.50) $8.86 ($55.27) $17.10 V 0.75 ($47.63) $6.65 ($41.45) $12.82 VI 0.60 ($38.10) $7.13 ($33.16) $12.07 VII 0.40 ($25.40) $1.74 ($22.11) $5.03 VIII 0.00 $0.00 $9.05 $0.00 $9.05
1/ These percentages assume that 70% of the fruit is produced for the processed market and 30% is produced for the fresh market. In addition, it is assumed that the orchard is 10% pre-production, 25% early production, 50% full production and 15% late 2/ This is the average net return of the eight orchard categories listed in section 1 of this table. The weights are provided by the percent of total trees represented by each category. 3/ In an olympic average, the highest and lowest values are dropped prior to calculating the arithmetic mean. 4/ This is determined by dividing the unadjusted net return value (Table 3 - Line 1) by the soil index factor (Table 3 - Section 4). 5/ The depreciation rate applicable to apple trees assumes that trees are replaced on a 30-year rotation. 6/ "Other" trees refers to peach, cherry, pear, and plum trees. The depreciation rate applicable to "other" trees assumes that trees are replaced on a 20-year rotation. 7/ The orchard index is applicable only in determining the value of the trees. The land index (Table 3 - Section 5) is applied to 8/ The use value of trees and land is determined by adding the appropriate without-risk- land-use-value (see Table 3 - Section5) to the use value of the trees. Table5:8
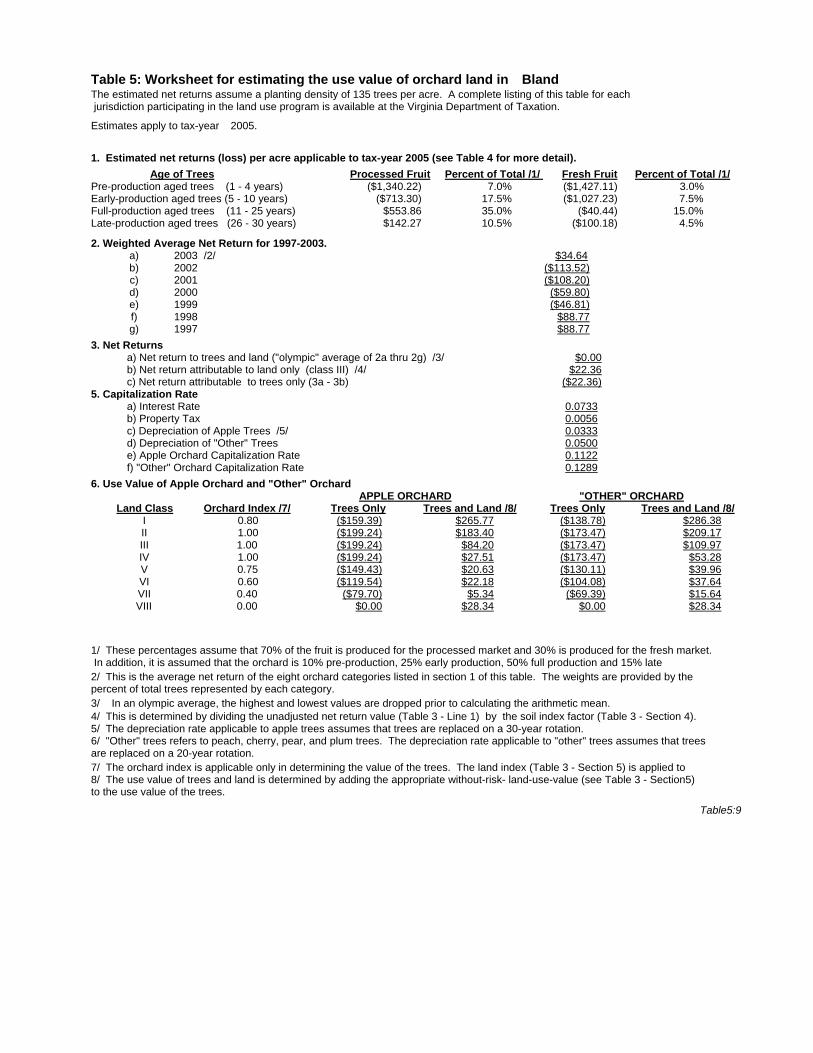
Table 5: Worksheet for estimating the use value of orchard land in Bland The estimated net returns assume a planting density of 135 trees per acre. A complete listing of this table for each jurisdiction participating in the land use program is available at the Virginia Department of Taxation. Estimates apply to tax-year 2005.
1. Estimated net returns (loss) per acre applicable to tax-year 2005 (see Table 4 for more detail). Age of Trees Processed Fru ti Percent of To al /1/ t Fresh Fruit Percent of Total /1/ Pre-production aged trees (1 - 4 years) ($1,340.22) 7.0% ($1,427.11) 3.0% Early-production aged trees (5 - 10 years) ($713.30) 17.5% ($1,027.23) 7.5% Full-production aged trees (11 - 25 years) $553.86 35.0% ($40.44) 15.0% Late-production aged trees (26 - 30 years) $142.27 10.5% ($100.18) 4.5% 2 e a) 2003 /2/ . Weight d Average Net Return for 1997-2003.
$34.64 b) 2002 ($113.52) c) 2001 ($108.20) d) 2000 ($59.80) e) 1999 ($46.81) f) 1998 $88.77 g) 1997 $88.77 3 a) Net return to trees and land ("olympic" average o 2a thru 2g) /3/ . Net Returns
$0.00 f b) Net return attributable to land only (class III) /4/ $22.36 c) Net return attributable to trees only (3a - 3b) ($22.36) 5 a) Interest Rate . Capitalization Rate
0.0733 b) Property Tax 0.0056 c) Depreciation of Apple Trees /5 0.0333 / d) Depreciation of "Other" Trees 0.0500 e) Apple Orchard Capitalization Rate 0.1122 f) "Other" Orchard Capitalization Rate 0.1289 . Use Value of Apple Orchard and "Other" Orchard 6
APPL ORCHARDE "OTH R" ORCHARDE Land Class Orchard In ex /7/d Trees Only Trees and Land /8/ Trees Only Trees and Land /8/ I 0.80 ($159.39) $265.77 ($138.78) $286.38 II 1.00 ($199.24) $183.40 ($173.47) $209.17 III 1.00 ($199.24) $84.20 ($173.47) $109.97 IV 1.00 ($199.24) $27.51 ($173.47) $53.28 V 0.75 ($149.43) $20.63 ($130.11) $39.96 VI 0.60 ($119.54) $22.18 ($104.08) $37.64 VII 0.40 ($79.70) $5.34 ($69.39) $15.64 VIII 0.00 $0.00 $28.34 $0.00 $28.34
1/ These percentages assume that 70% of the fruit is produced for the processed market and 30% is produced for the fresh market. In addition, it is assumed that the orchard is 10% pre-production, 25% early production, 50% full production and 15% late 2/ This is the average net return of the eight orchard categories listed in section 1 of this table. The weights are provided by the percent of total trees represented by each category. 3/ In an olympic average, the highest and lowest values are dropped prior to calculating the arithmetic mean. 4/ This is determined by dividing the unadjusted net return value (Table 3 - Line 1) by the soil index factor (Table 3 - Section 4). 5/ The depreciation rate applicable to apple trees assumes that trees are replaced on a 30-year rotation. 6/ "Other" trees refers to peach, cherry, pear, and plum trees. The depreciation rate applicable to "other" trees assumes that trees are replaced on a 20-year rotation. 7/ The orchard index is applicable only in determining the value of the trees. The land index (Table 3 - Section 5) is applied to 8/ The use value of trees and land is determined by adding the appropriate without-risk- land-use-value (see Table 3 - Section5) to the use value of the trees. Table5:9

Table 5: Worksheet for estimating the use value of orchard land in Botetourt The estimated net returns assume a planting density of 135 trees per acre. A complete listing of this table for each jurisdiction participating in the land use program is available at the Virginia Department of Taxation. Estimates apply to tax-year 2005.
1. Estimated net returns (loss) per acre applicable to tax-year 2005 (see Table 4 for more detail). Age of Trees Processed Fru ti Percent of To al /1/ t Fresh Fruit Percent of Total /1/ Pre-production aged trees (1 - 4 years) ($1,340.22) 7.0% ($1,427.11) 3.0% Early-production aged trees (5 - 10 years) ($713.30) 17.5% ($1,027.23) 7.5% Full-production aged trees (11 - 25 years) $553.86 35.0% ($40.44) 15.0% Late-production aged trees (26 - 30 years) $142.27 10.5% ($100.18) 4.5% 2 e a) 2003 /2/ . Weight d Average Net Return for 1997-2003.
$34.64 b) 2002 ($113.52) c) 2001 ($108.20) d) 2000 ($59.80) e) 1999 ($46.81) f) 1998 $88.77 g) 1997 $88.77 3 a) Net return to trees and land ("olympic" average o 2a thru 2g) /3/ . Net Returns
$0.00 f b) Net return attributable to land only (class III) /4/ $15.33 c) Net return attributable to trees only (3a - 3b) ($15.33) 5 a) Interest Rate . Capitalization Rate
0.0733 b) Property Tax 0.0064 c) Depreciation of Apple Trees /5 0.0333 / d) Depreciation of "Other" Trees 0.0500 e) Apple Orchard Capitalization Rate 0.1131 f) "Other" Orchard Capitalization Rate 0.1297 . Use Value of Apple Orchard and "Other" Orchard 6
APPL ORCHARDE "OTH R" ORCHARDE Land Class Orchard In ex /7/d Trees Only Trees and Land /8/ Trees Only Trees and Land /8/ I 0.80 ($108.51) $180.01 ($94.57) $193.95 II 1.00 ($135.64) $124.03 ($118.21) $141.46 III 1.00 ($135.64) $56.71 ($118.21) $74.14 IV 1.00 ($135.64) $18.24 ($118.21) $35.67 V 0.75 ($101.73) $13.68 ($88.66) $26.75 VI 0.60 ($81.38) $14.79 ($70.93) $25.25 VII 0.40 ($54.25) $3.45 ($47.28) $10.42 VIII 0.00 $0.00 $19.23 $0.00 $19.23
1/ These percentages assume that 70% of the fruit is produced for the processed market and 30% is produced for the fresh market. In addition, it is assumed that the orchard is 10% pre-production, 25% early production, 50% full production and 15% late 2/ This is the average net return of the eight orchard categories listed in section 1 of this table. The weights are provided by the percent of total trees represented by each category. 3/ In an olympic average, the highest and lowest values are dropped prior to calculating the arithmetic mean. 4/ This is determined by dividing the unadjusted net return value (Table 3 - Line 1) by the soil index factor (Table 3 - Section 4). 5/ The depreciation rate applicable to apple trees assumes that trees are replaced on a 30-year rotation. 6/ "Other" trees refers to peach, cherry, pear, and plum trees. The depreciation rate applicable to "other" trees assumes that trees are replaced on a 20-year rotation. 7/ The orchard index is applicable only in determining the value of the trees. The land index (Table 3 - Section 5) is applied to 8/ The use value of trees and land is determined by adding the appropriate without-risk- land-use-value (see Table 3 - Section5) to the use value of the trees. Table5:10

Table 5: Worksheet for estimating the use value of orchard land in Buena Vista 21/ The estimated net returns assume a planting density of 135 trees per acre. A complete listing of this table for each jurisdiction participating in the land use program is available at the Virginia Department of Taxation. Estimates apply to tax-year 2005.
1. Estimated net returns (loss) per acre applicable to tax-year 2005 (see Table 4 for more detail). Age of Trees Processed Fru ti Percent of To al /1/ t Fresh Fruit Percent of Total /1/ Pre-production aged trees (1 - 4 years) ($1,340.22) 7.0% ($1,427.11) 3.0% Early-production aged trees (5 - 10 years) ($713.30) 17.5% ($1,027.23) 7.5% Full-production aged trees (11 - 25 years) $553.86 35.0% ($40.44) 15.0% Late-production aged trees (26 - 30 years) $142.27 10.5% ($100.18) 4.5% 2 e a) 2003 /2/ . Weight d Average Net Return for 1997-2003.
$34.64 b) 2002 ($113.52) c) 2001 ($108.20) d) 2000 ($59.80) e) 1999 ($46.81) f) 1998 $88.77 g) 1997 $88.77 3 a) Net return to trees and land ("olympic" average o 2a thru 2g) /3/ . Net Returns
$0.00 f b) Net return attributable to land only (class III) /4/ $11.10 c) Net return attributable to trees only (3a - 3b) ($11.10) 5 a) Interest Rate . Capitalization Rate
0.0733 b) Property Tax 0.0077 c) Depreciation of Apple Trees /5 0.0333 / d) Depreciation of "Other" Trees 0.0500 e) Apple Orchard Capitalization Rate 0.1143 f) "Other" Orchard Capitalization Rate 0.1310 . Use Value of Apple Orchard and "Other" Orchard 6
APPL ORCHARDE "OTH R" ORCHARDE Land Class Orchard In ex /7/d Trees Only Trees and Land /8/ Trees Only Trees and Land /8/ I 0.80 ($77.65) $127.85 ($67.78) $137.73 II 1.00 ($97.07) $87.89 ($84.72) $100.24 III 1.00 ($97.07) $39.94 ($84.72) $52.29 IV 1.00 ($97.07) $12.54 ($84.72) $24.88 V 0.75 ($72.80) $9.40 ($63.54) $18.66 VI 0.60 ($58.24) $10.26 ($50.83) $17.67 VII 0.40 ($38.83) $2.27 ($33.89) $7.21 VIII 0.00 $0.00 $13.70 $0.00 $13.70
1/ These percentages assume that 70% of the fruit is produced for the processed market and 30% is produced for the fresh market. In addition, it is assumed that the orchard is 10% pre-production, 25% early production, 50% full production and 15% late 2/ This is the average net return of the eight orchard categories listed in section 1 of this table. The weights are provided by the percent of total trees represented by each category. 3/ In an olympic average, the highest and lowest values are dropped prior to calculating the arithmetic mean. 4/ This is determined by dividing the unadjusted net return value (Table 3 - Line 1) by the soil index factor (Table 3 - Section 4). 5/ The depreciation rate applicable to apple trees assumes that trees are replaced on a 30-year rotation. 6/ "Other" trees refers to peach, cherry, pear, and plum trees. The depreciation rate applicable to "other" trees assumes that trees are replaced on a 20-year rotation. 7/ The orchard index is applicable only in determining the value of the trees. The land index (Table 3 - Section 5) is applied to 8/ The use value of trees and land is determined by adding the appropriate without-risk- land-use-value (see Table 3 - Section5) to the use value of the trees. Table5:11

Table 5: Worksheet for estimating the use value of orchard land in Campbell The estimated net returns assume a planting density of 135 trees per acre. A complete listing of this table for each jurisdiction participating in the land use program is available at the Virginia Department of Taxation. Estimates apply to tax-year 2005.
1. Estimated net returns (loss) per acre applicable to tax-year 2005 (see Table 4 for more detail). Age of Trees Processed Fru ti Percent of To al /1/ t Fresh Fruit Percent of Total /1/ Pre-production aged trees (1 - 4 years) ($1,340.22) 7.0% ($1,427.11) 3.0% Early-production aged trees (5 - 10 years) ($713.30) 17.5% ($1,027.23) 7.5% Full-production aged trees (11 - 25 years) $553.86 35.0% ($40.44) 15.0% Late-production aged trees (26 - 30 years) $142.27 10.5% ($100.18) 4.5% 2 e a) 2003 /2/ . Weight d Average Net Return for 1997-2003.
$34.64 b) 2002 ($113.52) c) 2001 ($108.20) d) 2000 ($59.80) e) 1999 ($46.81) f) 1998 $88.77 g) 1997 $88.77 3 a) Net return to trees and land ("olympic" average o 2a thru 2g) /3/ . Net Returns
$0.00 f b) Net return attributable to land only (class III) /4/ $9.97 c) Net return attributable to trees only (3a - 3b) ($9.97) 5 a) Interest Rate . Capitalization Rate
0.0733 b) Property Tax 0.0047 c) Depreciation of Apple Trees /5 0.0333 / d) Depreciation of "Other" Trees 0.0500 e) Apple Orchard Capitalization Rate 0.1113 f) "Other" Orchard Capitalization Rate 0.1280 . Use Value of Apple Orchard and "Other" Orchard 6
APPL ORCHARDE "OTH R" ORCHARDE Land Class Orchard In ex /7/d Trees Only Trees and Land /8/ Trees Only Trees and Land /8/ I 0.80 ($71.67) $120.15 ($62.34) $129.48 II 1.00 ($89.59) $83.05 ($77.93) $94.71 III 1.00 ($89.59) $38.29 ($77.93) $49.96 IV 1.00 ($89.59) $12.71 ($77.93) $24.38 V 0.75 ($67.19) $9.53 ($58.44) $18.28 VI 0.60 ($53.75) $10.19 ($46.76) $17.19 VII 0.40 ($35.84) $2.53 ($31.17) $7.19 VIII 0.00 $0.00 $12.79 $0.00 $12.79
1/ These percentages assume that 70% of the fruit is produced for the processed market and 30% is produced for the fresh market. In addition, it is assumed that the orchard is 10% pre-production, 25% early production, 50% full production and 15% late 2/ This is the average net return of the eight orchard categories listed in section 1 of this table. The weights are provided by the percent of total trees represented by each category. 3/ In an olympic average, the highest and lowest values are dropped prior to calculating the arithmetic mean. 4/ This is determined by dividing the unadjusted net return value (Table 3 - Line 1) by the soil index factor (Table 3 - Section 4). 5/ The depreciation rate applicable to apple trees assumes that trees are replaced on a 30-year rotation. 6/ "Other" trees refers to peach, cherry, pear, and plum trees. The depreciation rate applicable to "other" trees assumes that trees are replaced on a 20-year rotation. 7/ The orchard index is applicable only in determining the value of the trees. The land index (Table 3 - Section 5) is applied to 8/ The use value of trees and land is determined by adding the appropriate without-risk- land-use-value (see Table 3 - Section5) to the use value of the trees. Table5:12

Table 5: Worksheet for estimating the use value of orchard land in Caroline The estimated net returns assume a planting density of 135 trees per acre. A complete listing of this table for each jurisdiction participating in the land use program is available at the Virginia Department of Taxation. Estimates apply to tax-year 2005.
1. Estimated net returns (loss) per acre applicable to tax-year 2005 (see Table 4 for more detail). Age of Trees Processed Fru ti Percent of To al /1/ t Fresh Fruit Percent of Total /1/ Pre-production aged trees (1 - 4 years) ($1,340.22) 7.0% ($1,427.11) 3.0% Early-production aged trees (5 - 10 years) ($713.30) 17.5% ($1,027.23) 7.5% Full-production aged trees (11 - 25 years) $553.86 35.0% ($40.44) 15.0% Late-production aged trees (26 - 30 years) $142.27 10.5% ($100.18) 4.5% 2 e a) 2003 /2/ . Weight d Average Net Return for 1997-2003.
$34.64 b) 2002 ($113.52) c) 2001 ($108.20) d) 2000 ($59.80) e) 1999 ($46.81) f) 1998 $88.77 g) 1997 $88.77 3 a) Net return to trees and land ("olympic" average o 2a thru 2g) /3/ . Net Returns
$0.00 f b) Net return attributable to land only (class III) /4/ $19.53 c) Net return attributable to trees only (3a - 3b) ($19.53) 5 a) Interest Rate . Capitalization Rate
0.0733 b) Property Tax 0.0064 c) Depreciation of Apple Trees /5 0.0333 / d) Depreciation of "Other" Trees 0.0500 e) Apple Orchard Capitalization Rate 0.1130 f) "Other" Orchard Capitalization Rate 0.1297 . Use Value of Apple Orchard and "Other" Orchard 6
APPL ORCHARDE "OTH R" ORCHARDE Land Class Orchard In ex /7/d Trees Only Trees and Land /8/ Trees Only Trees and Land /8/ I 0.80 ($138.21) $229.32 ($120.45) $247.08 II 1.00 ($172.77) $158.01 ($150.57) $180.21 III 1.00 ($172.77) $72.25 ($150.57) $94.45 IV 1.00 ($172.77) $23.25 ($150.57) $45.45 V 0.75 ($129.58) $17.44 ($112.93) $34.09 VI 0.60 ($103.66) $18.85 ($90.34) $32.17 VII 0.40 ($69.11) $4.40 ($60.23) $13.28 VIII 0.00 $0.00 $24.50 $0.00 $24.50
1/ These percentages assume that 70% of the fruit is produced for the processed market and 30% is produced for the fresh market. In addition, it is assumed that the orchard is 10% pre-production, 25% early production, 50% full production and 15% late 2/ This is the average net return of the eight orchard categories listed in section 1 of this table. The weights are provided by the percent of total trees represented by each category. 3/ In an olympic average, the highest and lowest values are dropped prior to calculating the arithmetic mean. 4/ This is determined by dividing the unadjusted net return value (Table 3 - Line 1) by the soil index factor (Table 3 - Section 4). 5/ The depreciation rate applicable to apple trees assumes that trees are replaced on a 30-year rotation. 6/ "Other" trees refers to peach, cherry, pear, and plum trees. The depreciation rate applicable to "other" trees assumes that trees are replaced on a 20-year rotation. 7/ The orchard index is applicable only in determining the value of the trees. The land index (Table 3 - Section 5) is applied to 8/ The use value of trees and land is determined by adding the appropriate without-risk- land-use-value (see Table 3 - Section5) to the use value of the trees. Table5:13

Table 5: Worksheet for estimating the use value of orchard land in Carroll The estimated net returns assume a planting density of 135 trees per acre. A complete listing of this table for each jurisdiction participating in the land use program is available at the Virginia Department of Taxation. Estimates apply to tax-year 2005.
1. Estimated net returns (loss) per acre applicable to tax-year 2005 (see Table 4 for more detail). Age of Trees Processed Fru ti Percent of To al /1/ t Fresh Fruit Percent of Total /1/ Pre-production aged trees (1 - 4 years) ($1,340.22) 7.0% ($1,427.11) 3.0% Early-production aged trees (5 - 10 years) ($713.30) 17.5% ($1,027.23) 7.5% Full-production aged trees (11 - 25 years) $553.86 35.0% ($40.44) 15.0% Late-production aged trees (26 - 30 years) $142.27 10.5% ($100.18) 4.5% 2 e a) 2003 /2/ . Weight d Average Net Return for 1997-2003.
$34.64 b) 2002 ($113.52) c) 2001 ($108.20) d) 2000 ($59.80) e) 1999 ($46.81) f) 1998 $88.77 g) 1997 $88.77 3 a) Net return to trees and land ("olympic" average of 2a thru 2g) /3/ . Net Returns
$0.00 b) Net return attributable to land only (class III) /4/ c) Net return attributable to trees only (3a - 3b) 5 a) Interest Rate . Capitalization Rate
0.0733 b) Property Tax 0.0041 c) Depreciation of Apple Trees /5 0.0333 / d) Depreciation of "Other" Trees 0.0500 e) Apple Orchard Capitalization Rate 0.1107 f) "Other" Orchard Capitalization Rate 0.1274 . Use Value of Apple Orchard and "Other" Orchard 6
APPL ORCHARDE "OTH R" ORCHARDE Land Class Orchard Index /7/ Trees Only Trees and Land /8/ Trees Only Trees and Land /8/ I 0.80 II 1.00 III 1.00 IV 1.00 V 0.75 VI 0.60 VII 0.40 VIII 0.00
1/ These percentages assume that 70% of the fruit is produced for the processed market and 30% is produced for the fresh market. In addition, it is assumed that the orchard is 10% pre-production, 25% early production, 50% full production and 15% late 2/ This is the average net return of the eight orchard categories listed in section 1 of this table. The weights are provided by the percent of total trees represented by each category. 3/ In an olympic average, the highest and lowest values are dropped prior to calculating the arithmetic mean. 4/ This is determined by dividing the unadjusted net return value (Table 3 - Line 1) by the soil index factor (Table 3 - Section 4). 5/ The depreciation rate applicable to apple trees assumes that trees are replaced on a 30-year rotation. 6/ "Other" trees refers to peach, cherry, pear, and plum trees. The depreciation rate applicable to "other" trees assumes that trees are replaced on a 20-year rotation. 7/ The orchard index is applicable only in determining the value of the trees. The land index (Table 3 - Section 5) is applied to 8/ The use value of trees and land is determined by adding the appropriate without-risk- land-use-value (see Table 3 - Section5) to the use value of the trees. Table5:14

Table 5: Worksheet for estimating the use value of orchard land in Chesapeake City The estimated net returns assume a planting density of 135 trees per acre. A complete listing of this table for each jurisdiction participating in the land use program is available at the Virginia Department of Taxation. Estimates apply to tax-year 2005.
1. Estimated net returns (loss) per acre applicable to tax-year 2005 (see Table 4 for more detail). Age of Trees Processed Fru ti Percent of To al /1/ t Fresh Fruit Percent of Total /1/ Pre-production aged trees (1 - 4 years) ($1,340.22) 7.0% ($1,427.11) 3.0% Early-production aged trees (5 - 10 years) ($713.30) 17.5% ($1,027.23) 7.5% Full-production aged trees (11 - 25 years) $553.86 35.0% ($40.44) 15.0% Late-production aged trees (26 - 30 years) $142.27 10.5% ($100.18) 4.5% 2 e a) 2003 /2/ . Weight d Average Net Return for 1997-2003.
$34.64 b) 2002 ($113.52) c) 2001 ($108.20) d) 2000 ($59.80) e) 1999 ($46.81) f) 1998 $88.77 g) 1997 $88.77 3 a) Net return to trees and land ("olympic" average o 2a thru 2g) /3/ . Net Returns
$0.00 f b) Net return attributable to land only (class III) /4/ $25.29 c) Net return attributable to trees only (3a - 3b) ($25.29) 5 a) Interest Rate . Capitalization Rate
0.0733 b) Property Tax 0.0122 c) Depreciation of Apple Trees /5 0.0333 / d) Depreciation of "Other" Trees 0.0500 e) Apple Orchard Capitalization Rate 0.1188 f) "Other" Orchard Capitalization Rate 0.1355 . Use Value of Apple Orchard and "Other" Orchard 6
APPL ORCHARDE "OTH R" ORCHARDE Land Class Orchard In ex /7/d Trees Only Trees and Land /8/ Trees Only Trees and Land /8/ I 0.80 ($170.26) $273.41 ($149.32) $294.35 II 1.00 ($212.82) $186.48 ($186.65) $212.65 III 1.00 ($212.82) $82.96 ($186.65) $109.13 IV 1.00 ($212.82) $23.80 ($186.65) $49.97 V 0.75 ($159.61) $17.85 ($139.98) $37.48 VI 0.60 ($127.69) $20.20 ($111.99) $35.90 VII 0.40 ($85.13) $3.60 ($74.66) $14.07 VIII 0.00 $0.00 $29.58 $0.00 $29.58
1/ These percentages assume that 70% of the fruit is produced for the processed market and 30% is produced for the fresh market. In addition, it is assumed that the orchard is 10% pre-production, 25% early production, 50% full production and 15% late 2/ This is the average net return of the eight orchard categories listed in section 1 of this table. The weights are provided by the percent of total trees represented by each category. 3/ In an olympic average, the highest and lowest values are dropped prior to calculating the arithmetic mean. 4/ This is determined by dividing the unadjusted net return value (Table 3 - Line 1) by the soil index factor (Table 3 - Section 4). 5/ The depreciation rate applicable to apple trees assumes that trees are replaced on a 30-year rotation. 6/ "Other" trees refers to peach, cherry, pear, and plum trees. The depreciation rate applicable to "other" trees assumes that trees are replaced on a 20-year rotation. 7/ The orchard index is applicable only in determining the value of the trees. The land index (Table 3 - Section 5) is applied to 8/ The use value of trees and land is determined by adding the appropriate without-risk- land-use-value (see Table 3 - Section5) to the use value of the trees. Table5:15

Table 5: Worksheet for estimating the use value of orchard land in Chesterfield 17/ The estimated net returns assume a planting density of 135 trees per acre. A complete listing of this table for each jurisdiction participating in the land use program is available at the Virginia Department of Taxation. Estimates apply to tax-year 2005.
1. Estimated net returns (loss) per acre applicable to tax-year 2005 (see Table 4 for more detail). Age of Trees Processed Fru ti Percent of To al /1/ t Fresh Fruit Percent of Total /1/ Pre-production aged trees (1 - 4 years) ($1,340.22) 7.0% ($1,427.11) 3.0% Early-production aged trees (5 - 10 years) ($713.30) 17.5% ($1,027.23) 7.5% Full-production aged trees (11 - 25 years) $553.86 35.0% ($40.44) 15.0% Late-production aged trees (26 - 30 years) $142.27 10.5% ($100.18) 4.5% 2 e a) 2003 /2/ . Weight d Average Net Return for 1997-2003.
$34.64 b) 2002 ($113.52) c) 2001 ($108.20) d) 2000 ($59.80) e) 1999 ($46.81) f) 1998 $88.77 g) 1997 $88.77 3 a) Net return to trees and land ("olympic" average o 2a thru 2g) /3/ . Net Returns
$0.00 f b) Net return attributable to land only (class III) /4/ $23.37 c) Net return attributable to trees only (3a - 3b) ($23.37) 5 a) Interest Rate . Capitalization Rate
0.0733 b) Property Tax 0.0100 c) Depreciation of Apple Trees /5 0.0333 / d) Depreciation of "Other" Trees 0.0500 e) Apple Orchard Capitalization Rate 0.1166 f) "Other" Orchard Capitalization Rate 0.1333 . Use Value of Apple Orchard and "Other" Orchard 6
APPL ORCHARDE "OTH R" ORCHARDE Land Class Orchard In ex /7/d Trees Only Trees and Land /8/ Trees Only Trees and Land /8/ I 0.80 ($160.28) $260.51 ($140.24) $280.55 II 1.00 ($200.35) $178.36 ($175.30) $203.41 III 1.00 ($200.35) $80.18 ($175.30) $105.23 IV 1.00 ($200.35) $24.07 ($175.30) $49.12 V 0.75 ($150.26) $18.05 ($131.47) $36.84 VI 0.60 ($120.21) $20.05 ($105.18) $35.08 VII 0.40 ($80.14) $4.02 ($70.12) $14.04 VIII 0.00 $0.00 $28.05 $0.00 $28.05
1/ These percentages assume that 70% of the fruit is produced for the processed market and 30% is produced for the fresh market. In addition, it is assumed that the orchard is 10% pre-production, 25% early production, 50% full production and 15% late 2/ This is the average net return of the eight orchard categories listed in section 1 of this table. The weights are provided by the percent of total trees represented by each category. 3/ In an olympic average, the highest and lowest values are dropped prior to calculating the arithmetic mean. 4/ This is determined by dividing the unadjusted net return value (Table 3 - Line 1) by the soil index factor (Table 3 - Section 4). 5/ The depreciation rate applicable to apple trees assumes that trees are replaced on a 30-year rotation. 6/ "Other" trees refers to peach, cherry, pear, and plum trees. The depreciation rate applicable to "other" trees assumes that trees are replaced on a 20-year rotation. 7/ The orchard index is applicable only in determining the value of the trees. The land index (Table 3 - Section 5) is applied to 8/ The use value of trees and land is determined by adding the appropriate without-risk- land-use-value (see Table 3 - Section5) to the use value of the trees. Table5:16

Table 5: Worksheet for estimating the use value of orchard land in Clarke The estimated net returns assume a planting density of 135 trees per acre. A complete listing of this table for each jurisdiction participating in the land use program is available at the Virginia Department of Taxation. Estimates apply to tax-year 2005.
1. Estimated net returns (loss) per acre applicable to tax-year 2005 (see Table 4 for more detail). Age of Trees Processed Fru ti Percent of To al /1/ t Fresh Fruit Percent of Total /1/ Pre-production aged trees (1 - 4 years) ($1,340.22) 7.0% ($1,427.11) 3.0% Early-production aged trees (5 - 10 years) ($713.30) 17.5% ($1,027.23) 7.5% Full-production aged trees (11 - 25 years) $553.86 35.0% ($40.44) 15.0% Late-production aged trees (26 - 30 years) $142.27 10.5% ($100.18) 4.5% 2 e a) 2003 /2/ . Weight d Average Net Return for 1997-2003.
$34.64 b) 2002 ($113.52) c) 2001 ($108.20) d) 2000 ($59.80) e) 1999 ($46.81) f) 1998 $88.77 g) 1997 $88.77 3 a) Net return to trees and land ("olympic" average o 2a thru 2g) /3/ . Net Returns
$0.00 f b) Net return attributable to land only (class III) /4/ $15.85 c) Net return attributable to trees only (3a - 3b) ($15.85) 5 a) Interest Rate . Capitalization Rate
0.0733 b) Property Tax 0.0076 c) Depreciation of Apple Trees /5 0.0333 / d) Depreciation of "Other" Trees 0.0500 e) Apple Orchard Capitalization Rate 0.1142 f) "Other" Orchard Capitalization Rate 0.1309 . Use Value of Apple Orchard and "Other" Orchard 6
APPL ORCHARDE "OTH R" ORCHARDE Land Class Orchard In ex /7/d Trees Only Trees and Land /8/ Trees Only Trees and Land /8/ I 0.80 ($111.05) $183.00 ($96.91) $197.15 II 1.00 ($138.82) $125.84 ($121.14) $143.51 III 1.00 ($138.82) $57.22 ($121.14) $74.90 IV 1.00 ($138.82) $18.01 ($121.14) $35.69 V 0.75 ($104.11) $13.51 ($90.85) $26.77 VI 0.60 ($83.29) $14.73 ($72.68) $25.34 VII 0.40 ($55.53) $3.28 ($48.46) $10.36 VIII 0.00 $0.00 $19.60 $0.00 $19.60
1/ These percentages assume that 70% of the fruit is produced for the processed market and 30% is produced for the fresh market. In addition, it is assumed that the orchard is 10% pre-production, 25% early production, 50% full production and 15% late 2/ This is the average net return of the eight orchard categories listed in section 1 of this table. The weights are provided by the percent of total trees represented by each category. 3/ In an olympic average, the highest and lowest values are dropped prior to calculating the arithmetic mean. 4/ This is determined by dividing the unadjusted net return value (Table 3 - Line 1) by the soil index factor (Table 3 - Section 4). 5/ The depreciation rate applicable to apple trees assumes that trees are replaced on a 30-year rotation. 6/ "Other" trees refers to peach, cherry, pear, and plum trees. The depreciation rate applicable to "other" trees assumes that trees are replaced on a 20-year rotation. 7/ The orchard index is applicable only in determining the value of the trees. The land index (Table 3 - Section 5) is applied to 8/ The use value of trees and land is determined by adding the appropriate without-risk- land-use-value (see Table 3 - Section5) to the use value of the trees. Table5:17

Table 5: Worksheet for estimating the use value of orchard land in Culpeper The estimated net returns assume a planting density of 135 trees per acre. A complete listing of this table for each jurisdiction participating in the land use program is available at the Virginia Department of Taxation. Estimates apply to tax-year 2005.
1. Estimated net returns (loss) per acre applicable to tax-year 2005 (see Table 4 for more detail). Age of Trees Processed Fru ti Percent of To al /1/ t Fresh Fruit Percent of Total /1/ Pre-production aged trees (1 - 4 years) ($1,340.22) 7.0% ($1,427.11) 3.0% Early-production aged trees (5 - 10 years) ($713.30) 17.5% ($1,027.23) 7.5% Full-production aged trees (11 - 25 years) $553.86 35.0% ($40.44) 15.0% Late-production aged trees (26 - 30 years) $142.27 10.5% ($100.18) 4.5% 2 e a) 2003 /2/ . Weight d Average Net Return for 1997-2003.
$34.64 b) 2002 ($113.52) c) 2001 ($108.20) d) 2000 ($59.80) e) 1999 ($46.81) f) 1998 $88.77 g) 1997 $88.77 3 a) Net return to trees and land ("olympic" average o 2a thru 2g) /3/ . Net Returns
$0.00 f b) Net return attributable to land only (class III) /4/ $20.96 c) Net return attributable to trees only (3a - 3b) ($20.96) 5 a) Interest Rate . Capitalization Rate
0.0733 b) Property Tax 0.0071 c) Depreciation of Apple Trees /5 0.0333 / d) Depreciation of "Other" Trees 0.0500 e) Apple Orchard Capitalization Rate 0.1137 f) "Other" Orchard Capitalization Rate 0.1304 . Use Value of Apple Orchard and "Other" Orchard 6
APPL ORCHARDE "OTH R" ORCHARDE Land Class Orchard In ex /7/d Trees Only Trees and Land /8/ Trees Only Trees and Land /8/ I 0.80 ($147.45) $243.66 ($128.60) $262.51 II 1.00 ($184.31) $167.69 ($160.75) $191.25 III 1.00 ($184.31) $76.43 ($160.75) $99.99 IV 1.00 ($184.31) $24.28 ($160.75) $47.84 V 0.75 ($138.23) $18.21 ($120.56) $35.88 VI 0.60 ($110.59) $19.78 ($96.45) $33.92 VII 0.40 ($73.73) $4.50 ($64.30) $13.92 VIII 0.00 $0.00 $26.07 $0.00 $26.07
1/ These percentages assume that 70% of the fruit is produced for the processed market and 30% is produced for the fresh market. In addition, it is assumed that the orchard is 10% pre-production, 25% early production, 50% full production and 15% late 2/ This is the average net return of the eight orchard categories listed in section 1 of this table. The weights are provided by the percent of total trees represented by each category. 3/ In an olympic average, the highest and lowest values are dropped prior to calculating the arithmetic mean. 4/ This is determined by dividing the unadjusted net return value (Table 3 - Line 1) by the soil index factor (Table 3 - Section 4). 5/ The depreciation rate applicable to apple trees assumes that trees are replaced on a 30-year rotation. 6/ "Other" trees refers to peach, cherry, pear, and plum trees. The depreciation rate applicable to "other" trees assumes that trees are replaced on a 20-year rotation. 7/ The orchard index is applicable only in determining the value of the trees. The land index (Table 3 - Section 5) is applied to 8/ The use value of trees and land is determined by adding the appropriate without-risk- land-use-value (see Table 3 - Section5) to the use value of the trees. Table5:18

Table 5: Worksheet for estimating the use value of orchard land in Cumberland The estimated net returns assume a planting density of 135 trees per acre. A complete listing of this table for each jurisdiction participating in the land use program is available at the Virginia Department of Taxation. Estimates apply to tax-year 2005.
1. Estimated net returns (loss) per acre applicable to tax-year 2005 (see Table 4 for more detail). Age of Trees Processed Fru ti Percent of To al /1/ t Fresh Fruit Percent of Total /1/ Pre-production aged trees (1 - 4 years) ($1,340.22) 7.0% ($1,427.11) 3.0% Early-production aged trees (5 - 10 years) ($713.30) 17.5% ($1,027.23) 7.5% Full-production aged trees (11 - 25 years) $553.86 35.0% ($40.44) 15.0% Late-production aged trees (26 - 30 years) $142.27 10.5% ($100.18) 4.5% 2 e a) 2003 /2/ . Weight d Average Net Return for 1997-2003.
$34.64 b) 2002 ($113.52) c) 2001 ($108.20) d) 2000 ($59.80) e) 1999 ($46.81) f) 1998 $88.77 g) 1997 $88.77 3 a) Net return to trees and land ("olympic" average o 2a thru 2g) /3/ . Net Returns
$0.00 f b) Net return attributable to land only (class III) /4/ $4.47 c) Net return attributable to trees only (3a - 3b) ($4.47) 5 a) Interest Rate . Capitalization Rate
0.0733 b) Property Tax 0.0047 c) Depreciation of Apple Trees /5 0.0333 / d) Depreciation of "Other" Trees 0.0500 e) Apple Orchard Capitalization Rate 0.1114 f) "Other" Orchard Capitalization Rate 0.1280 . Use Value of Apple Orchard and "Other" Orchard 6
APPL ORCHARDE "OTH R" ORCHARDE Land Class Orchard In ex /7/d Trees Only Trees and Land /8/ Trees Only Trees and Land /8/ I 0.80 ($32.09) $53.79 ($27.92) $57.97 II 1.00 ($40.12) $37.18 ($34.90) $42.40 III 1.00 ($40.12) $17.14 ($34.90) $22.36 IV 1.00 ($40.12) $5.69 ($34.90) $10.91 V 0.75 ($30.09) $4.27 ($26.17) $8.18 VI 0.60 ($24.07) $4.56 ($20.94) $7.69 VII 0.40 ($16.05) $1.13 ($13.96) $3.22 VIII 0.00 $0.00 $5.73 $0.00 $5.73
1/ These percentages assume that 70% of the fruit is produced for the processed market and 30% is produced for the fresh market. In addition, it is assumed that the orchard is 10% pre-production, 25% early production, 50% full production and 15% late 2/ This is the average net return of the eight orchard categories listed in section 1 of this table. The weights are provided by the percent of total trees represented by each category. 3/ In an olympic average, the highest and lowest values are dropped prior to calculating the arithmetic mean. 4/ This is determined by dividing the unadjusted net return value (Table 3 - Line 1) by the soil index factor (Table 3 - Section 4). 5/ The depreciation rate applicable to apple trees assumes that trees are replaced on a 30-year rotation. 6/ "Other" trees refers to peach, cherry, pear, and plum trees. The depreciation rate applicable to "other" trees assumes that trees are replaced on a 20-year rotation. 7/ The orchard index is applicable only in determining the value of the trees. The land index (Table 3 - Section 5) is applied to 8/ The use value of trees and land is determined by adding the appropriate without-risk- land-use-value (see Table 3 - Section5) to the use value of the trees. Table5:19

Table 5: Worksheet for estimating the use value of orchard land in Danville 16/ The estimated net returns assume a planting density of 135 trees per acre. A complete listing of this table for each jurisdiction participating in the land use program is available at the Virginia Department of Taxation. Estimates apply to tax-year 2005.
1. Estimated net returns (loss) per acre applicable to tax-year 2005 (see Table 4 for more detail). Age of Trees Processed Fru ti Percent of To al /1/ t Fresh Fruit Percent of Total /1/ Pre-production aged trees (1 - 4 years) ($1,340.22) 7.0% ($1,427.11) 3.0% Early-production aged trees (5 - 10 years) ($713.30) 17.5% ($1,027.23) 7.5% Full-production aged trees (11 - 25 years) $553.86 35.0% ($40.44) 15.0% Late-production aged trees (26 - 30 years) $142.27 10.5% ($100.18) 4.5% 2 e a) 2003 /2/ . Weight d Average Net Return for 1997-2003.
$34.64 b) 2002 ($113.52) c) 2001 ($108.20) d) 2000 ($59.80) e) 1999 ($46.81) f) 1998 $88.77 g) 1997 $88.77 3 a) Net return to trees and land ("olympic" average o 2a thru 2g) /3/ . Net Returns
$0.00 f b) Net return attributable to land only (class III) /4/ $12.22 c) Net return attributable to trees only (3a - 3b) ($12.22) 5 a) Interest Rate . Capitalization Rate
0.0733 b) Property Tax 0.0065 c) Depreciation of Apple Trees /5 0.0333 / d) Depreciation of "Other" Trees 0.0500 e) Apple Orchard Capitalization Rate 0.1132 f) "Other" Orchard Capitalization Rate 0.1298 . Use Value of Apple Orchard and "Other" Orchard 6
APPL ORCHARDE "OTH R" ORCHARDE Land Class Orchard In ex /7/d Trees Only Trees and Land /8/ Trees Only Trees and Land /8/ I 0.80 ($86.42) $143.28 ($75.32) $154.37 II 1.00 ($108.02) $98.70 ($94.15) $112.57 III 1.00 ($108.02) $45.11 ($94.15) $58.97 IV 1.00 ($108.02) $14.48 ($94.15) $28.35 V 0.75 ($81.02) $10.86 ($70.61) $21.26 VI 0.60 ($64.81) $11.75 ($56.49) $20.07 VII 0.40 ($43.21) $2.73 ($37.66) $8.28 VIII 0.00 $0.00 $15.31 $0.00 $15.31
1/ These percentages assume that 70% of the fruit is produced for the processed market and 30% is produced for the fresh market. In addition, it is assumed that the orchard is 10% pre-production, 25% early production, 50% full production and 15% late 2/ This is the average net return of the eight orchard categories listed in section 1 of this table. The weights are provided by the percent of total trees represented by each category. 3/ In an olympic average, the highest and lowest values are dropped prior to calculating the arithmetic mean. 4/ This is determined by dividing the unadjusted net return value (Table 3 - Line 1) by the soil index factor (Table 3 - Section 4). 5/ The depreciation rate applicable to apple trees assumes that trees are replaced on a 30-year rotation. 6/ "Other" trees refers to peach, cherry, pear, and plum trees. The depreciation rate applicable to "other" trees assumes that trees are replaced on a 20-year rotation. 7/ The orchard index is applicable only in determining the value of the trees. The land index (Table 3 - Section 5) is applied to 8/ The use value of trees and land is determined by adding the appropriate without-risk- land-use-value (see Table 3 - Section5) to the use value of the trees. Table5:20

Table 5: Worksheet for estimating the use value of orchard land in Dinwiddie County, Coastal Plain The estimated net returns assume a planting density of 135 trees per acre. A complete listing of this table for each jurisdiction participating in the land use program is available at the Virginia Department of Taxation. Estimates apply to tax-year 2005.
1. Estimated net returns (loss) per acre applicable to tax-year 2005 (see Table 4 for more detail). Age of Trees Processed Fru ti Percent of To al /1/ t Fresh Fruit Percent of Total /1/ Pre-production aged trees (1 - 4 years) ($1,340.22) 7.0% ($1,427.11) 3.0% Early-production aged trees (5 - 10 years) ($713.30) 17.5% ($1,027.23) 7.5% Full-production aged trees (11 - 25 years) $553.86 35.0% ($40.44) 15.0% Late-production aged trees (26 - 30 years) $142.27 10.5% ($100.18) 4.5% 2 e a) 2003 /2/ . Weight d Average Net Return for 1997-2003.
$34.64 b) 2002 ($113.52) c) 2001 ($108.20) d) 2000 ($59.80) e) 1999 ($46.81) f) 1998 $88.77 g) 1997 $88.77 3 a) Net return to trees and land ("olympic" average o 2a thru 2g) /3/ . Net Returns
$0.00 f b) Net return attributable to land only (class III) /4/ $15.08 c) Net return attributable to trees only (3a - 3b) ($15.08) 5 a) Interest Rate . Capitalization Rate
0.0733 b) Property Tax 0.0066 c) Depreciation of Apple Trees /5 0.0333 / d) Depreciation of "Other" Trees 0.0500 e) Apple Orchard Capitalization Rate 0.1132 f) "Other" Orchard Capitalization Rate 0.1299 . Use Value of Apple Orchard and "Other" Orchard 6
APPL ORCHARDE "OTH R" ORCHARDE Land Class Orchard In ex /7/d Trees Only Trees and Land /8/ Trees Only Trees and Land /8/ I 0.80 ($106.55) $176.59 ($92.88) $190.26 II 1.00 ($133.19) $121.64 ($116.10) $138.73 III 1.00 ($133.19) $55.57 ($116.10) $72.66 IV 1.00 ($133.19) $17.82 ($116.10) $34.91 V 0.75 ($99.89) $13.37 ($87.07) $26.18 VI 0.60 ($79.91) $14.47 ($69.66) $24.72 VII 0.40 ($53.27) $3.35 ($46.44) $10.19 VIII 0.00 $0.00 $18.88 $0.00 $18.88
1/ These percentages assume that 70% of the fruit is produced for the processed market and 30% is produced for the fresh market. In addition, it is assumed that the orchard is 10% pre-production, 25% early production, 50% full production and 15% late 2/ This is the average net return of the eight orchard categories listed in section 1 of this table. The weights are provided by the percent of total trees represented by each category. 3/ In an olympic average, the highest and lowest values are dropped prior to calculating the arithmetic mean. 4/ This is determined by dividing the unadjusted net return value (Table 3 - Line 1) by the soil index factor (Table 3 - Section 4). 5/ The depreciation rate applicable to apple trees assumes that trees are replaced on a 30-year rotation. 6/ "Other" trees refers to peach, cherry, pear, and plum trees. The depreciation rate applicable to "other" trees assumes that trees are replaced on a 20-year rotation. 7/ The orchard index is applicable only in determining the value of the trees. The land index (Table 3 - Section 5) is applied to 8/ The use value of trees and land is determined by adding the appropriate without-risk- land-use-value (see Table 3 - Section5) to the use value of the trees. Table5:21

Table 5: Worksheet for estimating the use value of orchard land in Dinwiddie County, Piedmont 6/ The estimated net returns assume a planting density of 135 trees per acre. A complete listing of this table for each jurisdiction participating in the land use program is available at the Virginia Department of Taxation. Estimates apply to tax-year 2005.
1. Estimated net returns (loss) per acre applicable to tax-year 2005 (see Table 4 for more detail). Age of Trees Processed Fru ti Percent of To al /1/ t Fresh Fruit Percent of Total /1/ Pre-production aged trees (1 - 4 years) ($1,340.22) 7.0% ($1,427.11) 3.0% Early-production aged trees (5 - 10 years) ($713.30) 17.5% ($1,027.23) 7.5% Full-production aged trees (11 - 25 years) $553.86 35.0% ($40.44) 15.0% Late-production aged trees (26 - 30 years) $142.27 10.5% ($100.18) 4.5% 2 e a) 2003 /2/ . Weight d Average Net Return for 1997-2003.
$34.64 b) 2002 ($113.52) c) 2001 ($108.20) d) 2000 ($59.80) e) 1999 ($46.81) f) 1998 $88.77 g) 1997 $88.77 3 a) Net return to trees and land ("olympic" average o 2a thru 2g) /3/ . Net Returns
$0.00 f b) Net return attributable to land only (class III) /4/ $7.83 c) Net return attributable to trees only (3a - 3b) ($7.83) 5 a) Interest Rate . Capitalization Rate
0.0733 b) Property Tax 0.0066 c) Depreciation of Apple Trees /5 0.0333 / d) Depreciation of "Other" Trees 0.0500 e) Apple Orchard Capitalization Rate 0.1132 f) "Other" Orchard Capitalization Rate 0.1299 . Use Value of Apple Orchard and "Other" Orchard 6
APPL ORCHARDE "OTH R" ORCHARDE Land Class Orchard In ex /7/d Trees Only Trees and Land /8/ Trees Only Trees and Land /8/ I 0.80 ($55.32) $91.68 ($48.22) $98.78 II 1.00 ($69.14) $63.15 ($60.27) $72.02 III 1.00 ($69.14) $28.85 ($60.27) $37.72 IV 1.00 ($69.14) $9.25 ($60.27) $18.12 V 0.75 ($51.86) $6.94 ($45.20) $13.59 VI 0.60 ($41.49) $7.51 ($36.16) $12.83 VII 0.40 ($27.66) $1.74 ($24.11) $5.29 VIII 0.00 $0.00 $9.80 $0.00 $9.80
1/ These percentages assume that 70% of the fruit is produced for the processed market and 30% is produced for the fresh market. In addition, it is assumed that the orchard is 10% pre-production, 25% early production, 50% full production and 15% late 2/ This is the average net return of the eight orchard categories listed in section 1 of this table. The weights are provided by the percent of total trees represented by each category. 3/ In an olympic average, the highest and lowest values are dropped prior to calculating the arithmetic mean. 4/ This is determined by dividing the unadjusted net return value (Table 3 - Line 1) by the soil index factor (Table 3 - Section 4). 5/ The depreciation rate applicable to apple trees assumes that trees are replaced on a 30-year rotation. 6/ "Other" trees refers to peach, cherry, pear, and plum trees. The depreciation rate applicable to "other" trees assumes that trees are replaced on a 20-year rotation. 7/ The orchard index is applicable only in determining the value of the trees. The land index (Table 3 - Section 5) is applied to 8/ The use value of trees and land is determined by adding the appropriate without-risk- land-use-value (see Table 3 - Section5) to the use value of the trees. Table5:22

Table 5: Worksheet for estimating the use value of orchard land in Fairfax* 18/ The estimated net returns assume a planting density of 135 trees per acre. A complete listing of this table for each jurisdiction participating in the land use program is available at the Virginia Department of Taxation. Estimates apply to tax-year 2005.
1. Estimated net returns (loss) per acre applicable to tax-year 2005 (see Table 4 for more detail). Age of Trees Processed Fru ti Percent of To al /1/ t Fresh Fruit Percent of Total /1/ Pre-production aged trees (1 - 4 years) ($1,340.22) 7.0% ($1,427.11) 3.0% Early-production aged trees (5 - 10 years) ($713.30) 17.5% ($1,027.23) 7.5% Full-production aged trees (11 - 25 years) $553.86 35.0% ($40.44) 15.0% Late-production aged trees (26 - 30 years) $142.27 10.5% ($100.18) 4.5% 2 e a) 2003 /2/ . Weight d Average Net Return for 1997-2003.
$34.64 b) 2002 ($113.52) c) 2001 ($108.20) d) 2000 ($59.80) e) 1999 ($46.81) f) 1998 $88.77 g) 1997 $88.77 3 a) Net return to trees and land ("olympic" average o 2a thru 2g) /3/ . Net Returns
$0.00 f b) Net return attributable to land only (class III) /4/ $17.53 c) Net return attributable to trees only (3a - 3b) ($17.53) 5 a) Interest Rate . Capitalization Rate
0.0733 b) Property Tax 0.0106 c) Depreciation of Apple Trees /5 0.0333 / d) Depreciation of "Other" Trees 0.0500 e) Apple Orchard Capitalization Rate 0.1172 f) "Other" Orchard Capitalization Rate 0.1339 . Use Value of Apple Orchard and "Other" Orchard 6
APPL ORCHARDE "OTH R" ORCHARDE Land Class Orchard In ex /7/d Trees Only Trees and Land /8/ Trees Only Trees and Land /8/ I 0.80 ($119.62) $193.81 ($104.73) $208.70 II 1.00 ($149.53) $132.56 ($130.91) $151.17 III 1.00 ($149.53) $59.42 ($130.91) $78.04 IV 1.00 ($149.53) $17.63 ($130.91) $36.25 V 0.75 ($112.15) $13.23 ($98.18) $27.19 VI 0.60 ($89.72) $14.76 ($78.55) $25.93 VII 0.40 ($59.81) $2.87 ($52.36) $10.32 VIII 0.00 $0.00 $20.90 $0.00 $20.90
1/ These percentages assume that 70% of the fruit is produced for the processed market and 30% is produced for the fresh market. In addition, it is assumed that the orchard is 10% pre-production, 25% early production, 50% full production and 15% late 2/ This is the average net return of the eight orchard categories listed in section 1 of this table. The weights are provided by the percent of total trees represented by each category. 3/ In an olympic average, the highest and lowest values are dropped prior to calculating the arithmetic mean. 4/ This is determined by dividing the unadjusted net return value (Table 3 - Line 1) by the soil index factor (Table 3 - Section 4). 5/ The depreciation rate applicable to apple trees assumes that trees are replaced on a 30-year rotation. 6/ "Other" trees refers to peach, cherry, pear, and plum trees. The depreciation rate applicable to "other" trees assumes that trees are replaced on a 20-year rotation. 7/ The orchard index is applicable only in determining the value of the trees. The land index (Table 3 - Section 5) is applied to 8/ The use value of trees and land is determined by adding the appropriate without-risk- land-use-value (see Table 3 - Section5) to the use value of the trees. Table5:23

Table 5: Worksheet for estimating the use value of orchard land in Fauquier The estimated net returns assume a planting density of 135 trees per acre. A complete listing of this table for each jurisdiction participating in the land use program is available at the Virginia Department of Taxation. Estimates apply to tax-year 2005.
1. Estimated net returns (loss) per acre applicable to tax-year 2005 (see Table 4 for more detail). Age of Trees Processed Fru ti Percent of To al /1/ t Fresh Fruit Percent of Total /1/ Pre-production aged trees (1 - 4 years) ($1,340.22) 7.0% ($1,427.11) 3.0% Early-production aged trees (5 - 10 years) ($713.30) 17.5% ($1,027.23) 7.5% Full-production aged trees (11 - 25 years) $553.86 35.0% ($40.44) 15.0% Late-production aged trees (26 - 30 years) $142.27 10.5% ($100.18) 4.5% 2 e a) 2003 /2/ . Weight d Average Net Return for 1997-2003.
$34.64 b) 2002 ($113.52) c) 2001 ($108.20) d) 2000 ($59.80) e) 1999 ($46.81) f) 1998 $88.77 g) 1997 $88.77 3 a) Net return to trees and land ("olympic" average o 2a thru 2g) /3/ . Net Returns
$0.00 f b) Net return attributable to land only (class III) /4/ $10.22 c) Net return attributable to trees only (3a - 3b) ($10.22) 5 a) Interest Rate . Capitalization Rate
0.0733 b) Property Tax 0.0090 c) Depreciation of Apple Trees /5 0.0333 / d) Depreciation of "Other" Trees 0.0500 e) Apple Orchard Capitalization Rate 0.1156 f) "Other" Orchard Capitalization Rate 0.1323 . Use Value of Apple Orchard and "Other" Orchard 6
APPL ORCHARDE "OTH R" ORCHARDE Land Class Orchard In ex /7/d Trees Only Trees and Land /8/ Trees Only Trees and Land /8/ I 0.80 ($70.73) $115.61 ($61.81) $124.52 II 1.00 ($88.41) $79.30 ($77.27) $90.44 III 1.00 ($88.41) $35.82 ($77.27) $46.96 IV 1.00 ($88.41) $10.97 ($77.27) $22.11 V 0.75 ($66.31) $8.23 ($57.95) $16.58 VI 0.60 ($53.04) $9.07 ($46.36) $15.75 VII 0.40 ($35.36) $1.90 ($30.91) $6.36 VIII 0.00 $0.00 $12.42 $0.00 $12.42
1/ These percentages assume that 70% of the fruit is produced for the processed market and 30% is produced for the fresh market. In addition, it is assumed that the orchard is 10% pre-production, 25% early production, 50% full production and 15% late 2/ This is the average net return of the eight orchard categories listed in section 1 of this table. The weights are provided by the percent of total trees represented by each category. 3/ In an olympic average, the highest and lowest values are dropped prior to calculating the arithmetic mean. 4/ This is determined by dividing the unadjusted net return value (Table 3 - Line 1) by the soil index factor (Table 3 - Section 4). 5/ The depreciation rate applicable to apple trees assumes that trees are replaced on a 30-year rotation. 6/ "Other" trees refers to peach, cherry, pear, and plum trees. The depreciation rate applicable to "other" trees assumes that trees are replaced on a 20-year rotation. 7/ The orchard index is applicable only in determining the value of the trees. The land index (Table 3 - Section 5) is applied to 8/ The use value of trees and land is determined by adding the appropriate without-risk- land-use-value (see Table 3 - Section5) to the use value of the trees. Table5:24

Table 5: Worksheet for estimating the use value of orchard land in Floyd The estimated net returns assume a planting density of 135 trees per acre. A complete listing of this table for each jurisdiction participating in the land use program is available at the Virginia Department of Taxation. Estimates apply to tax-year 2005.
1. Estimated net returns (loss) per acre applicable to tax-year 2005 (see Table 4 for more detail). Age of Trees Processed Fru ti Percent of To al /1/ t Fresh Fruit Percent of Total /1/ Pre-production aged trees (1 - 4 years) ($1,340.22) 7.0% ($1,427.11) 3.0% Early-production aged trees (5 - 10 years) ($713.30) 17.5% ($1,027.23) 7.5% Full-production aged trees (11 - 25 years) $553.86 35.0% ($40.44) 15.0% Late-production aged trees (26 - 30 years) $142.27 10.5% ($100.18) 4.5% 2 e a) 2003 /2/ . Weight d Average Net Return for 1997-2003.
$34.64 b) 2002 ($113.52) c) 2001 ($108.20) d) 2000 ($59.80) e) 1999 ($46.81) f) 1998 $88.77 g) 1997 $88.77 3 a) Net return to trees and land ("olympic" average o 2a thru 2g) /3/ . Net Returns
$0.00 f b) Net return attributable to land only (class III) /4/ $17.90 c) Net return attributable to trees only (3a - 3b) ($17.90) 5 a) Interest Rate . Capitalization Rate
0.0733 b) Property Tax 0.0053 c) Depreciation of Apple Trees /5 0.0333 / d) Depreciation of "Other" Trees 0.0500 e) Apple Orchard Capitalization Rate 0.1119 f) "Other" Orchard Capitalization Rate 0.1285 . Use Value of Apple Orchard and "Other" Orchard 6
APPL ORCHARDE "OTH R" ORCHARDE Land Class Orchard In ex /7/d Trees Only Trees and Land /8/ Trees Only Trees and Land /8/ I 0.80 ($127.98) $213.82 ($111.39) $230.41 II 1.00 ($159.98) $147.64 ($139.23) $168.39 III 1.00 ($159.98) $67.89 ($139.23) $88.63 IV 1.00 ($159.98) $22.32 ($139.23) $43.06 V 0.75 ($119.98) $16.74 ($104.43) $32.29 VI 0.60 ($95.99) $17.95 ($83.54) $30.39 VII 0.40 ($63.99) $4.37 ($55.69) $12.67 VIII 0.00 $0.00 $22.79 $0.00 $22.79
1/ These percentages assume that 70% of the fruit is produced for the processed market and 30% is produced for the fresh market. In addition, it is assumed that the orchard is 10% pre-production, 25% early production, 50% full production and 15% late 2/ This is the average net return of the eight orchard categories listed in section 1 of this table. The weights are provided by the percent of total trees represented by each category. 3/ In an olympic average, the highest and lowest values are dropped prior to calculating the arithmetic mean. 4/ This is determined by dividing the unadjusted net return value (Table 3 - Line 1) by the soil index factor (Table 3 - Section 4). 5/ The depreciation rate applicable to apple trees assumes that trees are replaced on a 30-year rotation. 6/ "Other" trees refers to peach, cherry, pear, and plum trees. The depreciation rate applicable to "other" trees assumes that trees are replaced on a 20-year rotation. 7/ The orchard index is applicable only in determining the value of the trees. The land index (Table 3 - Section 5) is applied to 8/ The use value of trees and land is determined by adding the appropriate without-risk- land-use-value (see Table 3 - Section5) to the use value of the trees. Table5:25

Table 5: Worksheet for estimating the use value of orchard land in Fluvanna The estimated net returns assume a planting density of 135 trees per acre. A complete listing of this table for each jurisdiction participating in the land use program is available at the Virginia Department of Taxation. Estimates apply to tax-year 2005.
1. Estimated net returns (loss) per acre applicable to tax-year 2005 (see Table 4 for more detail). Age of Trees Processed Fru ti Percent of To al /1/ t Fresh Fruit Percent of Total /1/ Pre-production aged trees (1 - 4 years) ($1,340.22) 7.0% ($1,427.11) 3.0% Early-production aged trees (5 - 10 years) ($713.30) 17.5% ($1,027.23) 7.5% Full-production aged trees (11 - 25 years) $553.86 35.0% ($40.44) 15.0% Late-production aged trees (26 - 30 years) $142.27 10.5% ($100.18) 4.5% 2 e a) 2003 /2/ . Weight d Average Net Return for 1997-2003.
$34.64 b) 2002 ($113.52) c) 2001 ($108.20) d) 2000 ($59.80) e) 1999 ($46.81) f) 1998 $88.77 g) 1997 $88.77 3 a) Net return to trees and land ("olympic" average o 2a thru 2g) /3/ . Net Returns
$0.00 f b) Net return attributable to land only (class III) /4/ $3.91 c) Net return attributable to trees only (3a - 3b) ($3.91) 5 a) Interest Rate . Capitalization Rate
0.0733 b) Property Tax 0.0058 c) Depreciation of Apple Trees /5 0.0333 / d) Depreciation of "Other" Trees 0.0500 e) Apple Orchard Capitalization Rate 0.1124 f) "Other" Orchard Capitalization Rate 0.1290 . Use Value of Apple Orchard and "Other" Orchard 6
APPL ORCHARDE "OTH R" ORCHARDE Land Class Orchard In ex /7/d Trees Only Trees and Land /8/ Trees Only Trees and Land /8/ I 0.80 ($27.81) $46.32 ($24.22) $49.91 II 1.00 ($34.76) $31.96 ($30.27) $36.45 III 1.00 ($34.76) $14.66 ($30.27) $19.15 IV 1.00 ($34.76) $4.78 ($30.27) $9.27 V 0.75 ($26.07) $3.58 ($22.70) $6.95 VI 0.60 ($20.86) $3.85 ($18.16) $6.55 VII 0.40 ($13.90) $0.92 ($12.11) $2.72 VIII 0.00 $0.00 $4.94 $0.00 $4.94
1/ These percentages assume that 70% of the fruit is produced for the processed market and 30% is produced for the fresh market. In addition, it is assumed that the orchard is 10% pre-production, 25% early production, 50% full production and 15% late 2/ This is the average net return of the eight orchard categories listed in section 1 of this table. The weights are provided by the percent of total trees represented by each category. 3/ In an olympic average, the highest and lowest values are dropped prior to calculating the arithmetic mean. 4/ This is determined by dividing the unadjusted net return value (Table 3 - Line 1) by the soil index factor (Table 3 - Section 4). 5/ The depreciation rate applicable to apple trees assumes that trees are replaced on a 30-year rotation. 6/ "Other" trees refers to peach, cherry, pear, and plum trees. The depreciation rate applicable to "other" trees assumes that trees are replaced on a 20-year rotation. 7/ The orchard index is applicable only in determining the value of the trees. The land index (Table 3 - Section 5) is applied to 8/ The use value of trees and land is determined by adding the appropriate without-risk- land-use-value (see Table 3 - Section5) to the use value of the trees. Table5:26

Table 5: Worksheet for estimating the use value of orchard land in Franklin The estimated net returns assume a planting density of 135 trees per acre. A complete listing of this table for each jurisdiction participating in the land use program is available at the Virginia Department of Taxation. Estimates apply to tax-year 2005.
1. Estimated net returns (loss) per acre applicable to tax-year 2005 (see Table 4 for more detail). Age of Trees Processed Fru ti Percent of To al /1/ t Fresh Fruit Percent of Total /1/ Pre-production aged trees (1 - 4 years) ($1,340.22) 7.0% ($1,427.11) 3.0% Early-production aged trees (5 - 10 years) ($713.30) 17.5% ($1,027.23) 7.5% Full-production aged trees (11 - 25 years) $553.86 35.0% ($40.44) 15.0% Late-production aged trees (26 - 30 years) $142.27 10.5% ($100.18) 4.5% 2 e a) 2003 /2/ . Weight d Average Net Return for 1997-2003.
$34.64 b) 2002 ($113.52) c) 2001 ($108.20) d) 2000 ($59.80) e) 1999 ($46.81) f) 1998 $88.77 g) 1997 $88.77 3 a) Net return to trees and land ("olympic" average o 2a thru 2g) /3/ . Net Returns
$0.00 f b) Net return attributable to land only (class III) /4/ $10.86 c) Net return attributable to trees only (3a - 3b) ($10.86) 5 a) Interest Rate . Capitalization Rate
0.0733 b) Property Tax 0.0048 c) Depreciation of Apple Trees /5 0.0333 / d) Depreciation of "Other" Trees 0.0500 e) Apple Orchard Capitalization Rate 0.1114 f) "Other" Orchard Capitalization Rate 0.1281 . Use Value of Apple Orchard and "Other" Orchard 6
APPL ORCHARDE "OTH R" ORCHARDE Land Class Orchard In ex /7/d Trees Only Trees and Land /8/ Trees Only Trees and Land /8/ I 0.80 ($77.97) $130.63 ($67.83) $140.78 II 1.00 ($97.46) $90.28 ($84.78) $102.96 III 1.00 ($97.46) $41.61 ($84.78) $54.29 IV 1.00 ($97.46) $13.79 ($84.78) $26.47 V 0.75 ($73.10) $10.34 ($63.59) $19.86 VI 0.60 ($58.48) $11.06 ($50.87) $18.67 VII 0.40 ($38.99) $2.74 ($33.91) $7.81 VIII 0.00 $0.00 $13.91 $0.00 $13.91
1/ These percentages assume that 70% of the fruit is produced for the processed market and 30% is produced for the fresh market. In addition, it is assumed that the orchard is 10% pre-production, 25% early production, 50% full production and 15% late 2/ This is the average net return of the eight orchard categories listed in section 1 of this table. The weights are provided by the percent of total trees represented by each category. 3/ In an olympic average, the highest and lowest values are dropped prior to calculating the arithmetic mean. 4/ This is determined by dividing the unadjusted net return value (Table 3 - Line 1) by the soil index factor (Table 3 - Section 4). 5/ The depreciation rate applicable to apple trees assumes that trees are replaced on a 30-year rotation. 6/ "Other" trees refers to peach, cherry, pear, and plum trees. The depreciation rate applicable to "other" trees assumes that trees are replaced on a 20-year rotation. 7/ The orchard index is applicable only in determining the value of the trees. The land index (Table 3 - Section 5) is applied to 8/ The use value of trees and land is determined by adding the appropriate without-risk- land-use-value (see Table 3 - Section5) to the use value of the trees. Table5:27

Table 5: Worksheet for estimating the use value of orchard land in Franklin City 20/ The estimated net returns assume a planting density of 135 trees per acre. A complete listing of this table for each jurisdiction participating in the land use program is available at the Virginia Department of Taxation. Estimates apply to tax-year 2005.
1. Estimated net returns (loss) per acre applicable to tax-year 2005 (see Table 4 for more detail). Age of Trees Processed Fru ti Percent of To al /1/ t Fresh Fruit Percent of Total /1/ Pre-production aged trees (1 - 4 years) ($1,340.22) 7.0% ($1,427.11) 3.0% Early-production aged trees (5 - 10 years) ($713.30) 17.5% ($1,027.23) 7.5% Full-production aged trees (11 - 25 years) $553.86 35.0% ($40.44) 15.0% Late-production aged trees (26 - 30 years) $142.27 10.5% ($100.18) 4.5% 2 e a) 2003 /2/ . Weight d Average Net Return for 1997-2003.
$34.64 b) 2002 ($113.52) c) 2001 ($108.20) d) 2000 ($59.80) e) 1999 ($46.81) f) 1998 $88.77 g) 1997 $88.77 3 a) Net return to trees and land ("olympic" average o 2a thru 2g) /3/ . Net Returns
$0.00 f b) Net return attributable to land only (class III) /4/ $24.81 c) Net return attributable to trees only (3a - 3b) ($24.81) 5 a) Interest Rate . Capitalization Rate
0.0733 b) Property Tax 0.0084 c) Depreciation of Apple Trees /5 0.0333 / d) Depreciation of "Other" Trees 0.0500 e) Apple Orchard Capitalization Rate 0.1150 f) "Other" Orchard Capitalization Rate 0.1317 . Use Value of Apple Orchard and "Other" Orchard 6
APPL ORCHARDE "OTH R" ORCHARDE Land Class Orchard In ex /7/d Trees Only Trees and Land /8/ Trees Only Trees and Land /8/ I 0.80 ($172.54) $282.94 ($150.71) $304.77 II 1.00 ($215.68) $194.26 ($188.39) $221.55 III 1.00 ($215.68) $87.98 ($188.39) $115.27 IV 1.00 ($215.68) $27.25 ($188.39) $54.54 V 0.75 ($161.76) $20.44 ($141.29) $40.90 VI 0.60 ($129.41) $22.42 ($113.03) $38.80 VII 0.40 ($86.27) $4.83 ($75.35) $15.74 VIII 0.00 $0.00 $30.37 $0.00 $30.37
1/ These percentages assume that 70% of the fruit is produced for the processed market and 30% is produced for the fresh market. In addition, it is assumed that the orchard is 10% pre-production, 25% early production, 50% full production and 15% late 2/ This is the average net return of the eight orchard categories listed in section 1 of this table. The weights are provided by the percent of total trees represented by each category. 3/ In an olympic average, the highest and lowest values are dropped prior to calculating the arithmetic mean. 4/ This is determined by dividing the unadjusted net return value (Table 3 - Line 1) by the soil index factor (Table 3 - Section 4). 5/ The depreciation rate applicable to apple trees assumes that trees are replaced on a 30-year rotation. 6/ "Other" trees refers to peach, cherry, pear, and plum trees. The depreciation rate applicable to "other" trees assumes that trees are replaced on a 20-year rotation. 7/ The orchard index is applicable only in determining the value of the trees. The land index (Table 3 - Section 5) is applied to 8/ The use value of trees and land is determined by adding the appropriate without-risk- land-use-value (see Table 3 - Section5) to the use value of the trees. Table5:28

Table 5: Worksheet for estimating the use value of orchard land in Frederick The estimated net returns assume a planting density of 135 trees per acre. A complete listing of this table for each jurisdiction participating in the land use program is available at the Virginia Department of Taxation. Estimates apply to tax-year 2005.
1. Estimated net returns (loss) per acre applicable to tax-year 2005 (see Table 4 for more detail). Age of Trees Processed Fru ti Percent of To al /1/ t Fresh Fruit Percent of Total /1/ Pre-production aged trees (1 - 4 years) ($1,340.22) 7.0% ($1,427.11) 3.0% Early-production aged trees (5 - 10 years) ($713.30) 17.5% ($1,027.23) 7.5% Full-production aged trees (11 - 25 years) $553.86 35.0% ($40.44) 15.0% Late-production aged trees (26 - 30 years) $142.27 10.5% ($100.18) 4.5% 2 e a) 2003 /2/ . Weight d Average Net Return for 1997-2003.
$34.64 b) 2002 ($113.52) c) 2001 ($108.20) d) 2000 ($59.80) e) 1999 ($46.81) f) 1998 $88.77 g) 1997 $88.77 3 a) Net return to trees and land ("olympic" average o 2a thru 2g) /3/ . Net Returns
$0.00 f b) Net return attributable to land only (class III) /4/ $5.86 c) Net return attributable to trees only (3a - 3b) ($5.86) 5 a) Interest Rate . Capitalization Rate
0.0733 b) Property Tax 0.0057 c) Depreciation of Apple Trees /5 0.0333 / d) Depreciation of "Other" Trees 0.0500 e) Apple Orchard Capitalization Rate 0.1123 f) "Other" Orchard Capitalization Rate 0.1290 . Use Value of Apple Orchard and "Other" Orchard 6
APPL ORCHARDE "OTH R" ORCHARDE Land Class Orchard In ex /7/d Trees Only Trees and Land /8/ Trees Only Trees and Land /8/ I 0.80 ($41.72) $69.52 ($36.33) $74.91 II 1.00 ($52.15) $47.97 ($45.41) $54.71 III 1.00 ($52.15) $22.01 ($45.41) $28.75 IV 1.00 ($52.15) $7.18 ($45.41) $13.92 V 0.75 ($39.11) $5.39 ($34.06) $10.44 VI 0.60 ($31.29) $5.79 ($27.24) $9.84 VII 0.40 ($20.86) $1.39 ($18.16) $4.08 VIII 0.00 $0.00 $7.42 $0.00 $7.42
1/ These percentages assume that 70% of the fruit is produced for the processed market and 30% is produced for the fresh market. In addition, it is assumed that the orchard is 10% pre-production, 25% early production, 50% full production and 15% late 2/ This is the average net return of the eight orchard categories listed in section 1 of this table. The weights are provided by the percent of total trees represented by each category. 3/ In an olympic average, the highest and lowest values are dropped prior to calculating the arithmetic mean. 4/ This is determined by dividing the unadjusted net return value (Table 3 - Line 1) by the soil index factor (Table 3 - Section 4). 5/ The depreciation rate applicable to apple trees assumes that trees are replaced on a 30-year rotation. 6/ "Other" trees refers to peach, cherry, pear, and plum trees. The depreciation rate applicable to "other" trees assumes that trees are replaced on a 20-year rotation. 7/ The orchard index is applicable only in determining the value of the trees. The land index (Table 3 - Section 5) is applied to 8/ The use value of trees and land is determined by adding the appropriate without-risk- land-use-value (see Table 3 - Section5) to the use value of the trees. Table5:29

Table 5: Worksheet for estimating the use value of orchard land in Fredericksburg 8/ The estimated net returns assume a planting density of 135 trees per acre. A complete listing of this table for each jurisdiction participating in the land use program is available at the Virginia Department of Taxation. Estimates apply to tax-year 2005.
1. Estimated net returns (loss) per acre applicable to tax-year 2005 (see Table 4 for more detail). Age of Trees Processed Fru ti Percent of To al /1/ t Fresh Fruit Percent of Total /1/ Pre-production aged trees (1 - 4 years) ($1,340.22) 7.0% ($1,427.11) 3.0% Early-production aged trees (5 - 10 years) ($713.30) 17.5% ($1,027.23) 7.5% Full-production aged trees (11 - 25 years) $553.86 35.0% ($40.44) 15.0% Late-production aged trees (26 - 30 years) $142.27 10.5% ($100.18) 4.5% 2 e a) 2003 /2/ . Weight d Average Net Return for 1997-2003.
$34.64 b) 2002 ($113.52) c) 2001 ($108.20) d) 2000 ($59.80) e) 1999 ($46.81) f) 1998 $88.77 g) 1997 $88.77 3 a) Net return to trees and land ("olympic" average o 2a thru 2g) /3/ . Net Returns
$0.00 f b) Net return attributable to land only (class III) /4/ $14.33 c) Net return attributable to trees only (3a - 3b) ($14.33) 5 a) Interest Rate . Capitalization Rate
0.0733 b) Property Tax 0.0110 c) Depreciation of Apple Trees /5 0.0333 / d) Depreciation of "Other" Trees 0.0500 e) Apple Orchard Capitalization Rate 0.1176 f) "Other" Orchard Capitalization Rate 0.1343 . Use Value of Apple Orchard and "Other" Orchard 6
APPL ORCHARDE "OTH R" ORCHARDE Land Class Orchard In ex /7/d Trees Only Trees and Land /8/ Trees Only Trees and Land /8/ I 0.80 ($97.46) $157.57 ($85.36) $169.67 II 1.00 ($121.82) $107.70 ($106.70) $122.83 III 1.00 ($121.82) $48.20 ($106.70) $63.32 IV 1.00 ($121.82) $14.19 ($106.70) $29.32 V 0.75 ($91.37) $10.64 ($80.03) $21.99 VI 0.60 ($73.09) $11.92 ($64.02) $20.99 VII 0.40 ($48.73) $2.28 ($42.68) $8.33 VIII 0.00 $0.00 $17.00 $0.00 $17.00
1/ These percentages assume that 70% of the fruit is produced for the processed market and 30% is produced for the fresh market. In addition, it is assumed that the orchard is 10% pre-production, 25% early production, 50% full production and 15% late 2/ This is the average net return of the eight orchard categories listed in section 1 of this table. The weights are provided by the percent of total trees represented by each category. 3/ In an olympic average, the highest and lowest values are dropped prior to calculating the arithmetic mean. 4/ This is determined by dividing the unadjusted net return value (Table 3 - Line 1) by the soil index factor (Table 3 - Section 4). 5/ The depreciation rate applicable to apple trees assumes that trees are replaced on a 30-year rotation. 6/ "Other" trees refers to peach, cherry, pear, and plum trees. The depreciation rate applicable to "other" trees assumes that trees are replaced on a 20-year rotation. 7/ The orchard index is applicable only in determining the value of the trees. The land index (Table 3 - Section 5) is applied to 8/ The use value of trees and land is determined by adding the appropriate without-risk- land-use-value (see Table 3 - Section5) to the use value of the trees. Table5:30

Table 5: Worksheet for estimating the use value of orchard land in Giles The estimated net returns assume a planting density of 135 trees per acre. A complete listing of this table for each jurisdiction participating in the land use program is available at the Virginia Department of Taxation. Estimates apply to tax-year 2005.
1. Estimated net returns (loss) per acre applicable to tax-year 2005 (see Table 4 for more detail). Age of Trees Processed Fru ti Percent of To al /1/ t Fresh Fruit Percent of Total /1/ Pre-production aged trees (1 - 4 years) ($1,340.22) 7.0% ($1,427.11) 3.0% Early-production aged trees (5 - 10 years) ($713.30) 17.5% ($1,027.23) 7.5% Full-production aged trees (11 - 25 years) $553.86 35.0% ($40.44) 15.0% Late-production aged trees (26 - 30 years) $142.27 10.5% ($100.18) 4.5% 2 e a) 2003 /2/ . Weight d Average Net Return for 1997-2003.
$34.64 b) 2002 ($113.52) c) 2001 ($108.20) d) 2000 ($59.80) e) 1999 ($46.81) f) 1998 $88.77 g) 1997 $88.77 3 a) Net return to trees and land ("olympic" average o 2a thru 2g) /3/ . Net Returns
$0.00 f b) Net return attributable to land only (class III) /4/ $13.46 c) Net return attributable to trees only (3a - 3b) ($13.46) 5 a) Interest Rate . Capitalization Rate
0.0733 b) Property Tax 0.0055 c) Depreciation of Apple Trees /5 0.0333 / d) Depreciation of "Other" Trees 0.0500 e) Apple Orchard Capitalization Rate 0.1121 f) "Other" Orchard Capitalization Rate 0.1288 . Use Value of Apple Orchard and "Other" Orchard 6
APPL ORCHARDE "OTH R" ORCHARDE Land Class Orchard In ex /7/d Trees Only Trees and Land /8/ Trees Only Trees and Land /8/ I 0.80 ($96.07) $160.28 ($83.63) $172.72 II 1.00 ($120.08) $110.63 ($104.54) $126.18 III 1.00 ($120.08) $50.82 ($104.54) $66.36 IV 1.00 ($120.08) $16.64 ($104.54) $32.18 V 0.75 ($90.06) $12.48 ($78.40) $24.14 VI 0.60 ($72.05) $13.40 ($62.72) $22.73 VII 0.40 ($48.03) $3.24 ($41.82) $9.45 VIII 0.00 $0.00 $17.09 $0.00 $17.09
1/ These percentages assume that 70% of the fruit is produced for the processed market and 30% is produced for the fresh market. In addition, it is assumed that the orchard is 10% pre-production, 25% early production, 50% full production and 15% late 2/ This is the average net return of the eight orchard categories listed in section 1 of this table. The weights are provided by the percent of total trees represented by each category. 3/ In an olympic average, the highest and lowest values are dropped prior to calculating the arithmetic mean. 4/ This is determined by dividing the unadjusted net return value (Table 3 - Line 1) by the soil index factor (Table 3 - Section 4). 5/ The depreciation rate applicable to apple trees assumes that trees are replaced on a 30-year rotation. 6/ "Other" trees refers to peach, cherry, pear, and plum trees. The depreciation rate applicable to "other" trees assumes that trees are replaced on a 20-year rotation. 7/ The orchard index is applicable only in determining the value of the trees. The land index (Table 3 - Section 5) is applied to 8/ The use value of trees and land is determined by adding the appropriate without-risk- land-use-value (see Table 3 - Section5) to the use value of the trees. Table5:31

Table 5: Worksheet for estimating the use value of orchard land in Gloucester The estimated net returns assume a planting density of 135 trees per acre. A complete listing of this table for each jurisdiction participating in the land use program is available at the Virginia Department of Taxation. Estimates apply to tax-year 2005.
1. Estimated net returns (loss) per acre applicable to tax-year 2005 (see Table 4 for more detail). Age of Trees Processed Fru ti Percent of To al /1/ t Fresh Fruit Percent of Total /1/ Pre-production aged trees (1 - 4 years) ($1,340.22) 7.0% ($1,427.11) 3.0% Early-production aged trees (5 - 10 years) ($713.30) 17.5% ($1,027.23) 7.5% Full-production aged trees (11 - 25 years) $553.86 35.0% ($40.44) 15.0% Late-production aged trees (26 - 30 years) $142.27 10.5% ($100.18) 4.5% 2 e a) 2003 /2/ . Weight d Average Net Return for 1997-2003.
$34.64 b) 2002 ($113.52) c) 2001 ($108.20) d) 2000 ($59.80) e) 1999 ($46.81) f) 1998 $88.77 g) 1997 $88.77 3 a) Net return to trees and land ("olympic" average o 2a thru 2g) /3/ . Net Returns
$0.00 f b) Net return attributable to land only (class III) /4/ $16.90 c) Net return attributable to trees only (3a - 3b) ($16.90) 5 a) Interest Rate . Capitalization Rate
0.0733 b) Property Tax 0.0086 c) Depreciation of Apple Trees /5 0.0333 / d) Depreciation of "Other" Trees 0.0500 e) Apple Orchard Capitalization Rate 0.1152 f) "Other" Orchard Capitalization Rate 0.1319 . Use Value of Apple Orchard and "Other" Orchard 6
APPL ORCHARDE "OTH R" ORCHARDE Land Class Orchard In ex /7/d Trees Only Trees and Land /8/ Trees Only Trees and Land /8/ I 0.80 ($117.33) $192.18 ($102.50) $207.00 II 1.00 ($146.66) $131.90 ($128.13) $150.43 III 1.00 ($146.66) $59.68 ($128.13) $78.21 IV 1.00 ($146.66) $18.41 ($128.13) $36.94 V 0.75 ($109.99) $13.81 ($96.10) $27.71 VI 0.60 ($87.99) $15.17 ($76.88) $26.29 VII 0.40 ($58.66) $3.24 ($51.25) $10.65 VIII 0.00 $0.00 $20.63 $0.00 $20.63
1/ These percentages assume that 70% of the fruit is produced for the processed market and 30% is produced for the fresh market. In addition, it is assumed that the orchard is 10% pre-production, 25% early production, 50% full production and 15% late 2/ This is the average net return of the eight orchard categories listed in section 1 of this table. The weights are provided by the percent of total trees represented by each category. 3/ In an olympic average, the highest and lowest values are dropped prior to calculating the arithmetic mean. 4/ This is determined by dividing the unadjusted net return value (Table 3 - Line 1) by the soil index factor (Table 3 - Section 4). 5/ The depreciation rate applicable to apple trees assumes that trees are replaced on a 30-year rotation. 6/ "Other" trees refers to peach, cherry, pear, and plum trees. The depreciation rate applicable to "other" trees assumes that trees are replaced on a 20-year rotation. 7/ The orchard index is applicable only in determining the value of the trees. The land index (Table 3 - Section 5) is applied to 8/ The use value of trees and land is determined by adding the appropriate without-risk- land-use-value (see Table 3 - Section5) to the use value of the trees. Table5:32

Table 5: Worksheet for estimating the use value of orchard land in Goochland The estimated net returns assume a planting density of 135 trees per acre. A complete listing of this table for each jurisdiction participating in the land use program is available at the Virginia Department of Taxation. Estimates apply to tax-year 2005.
1. Estimated net returns (loss) per acre applicable to tax-year 2005 (see Table 4 for more detail). Age of Trees Processed Fru ti Percent of To al /1/ t Fresh Fruit Percent of Total /1/ Pre-production aged trees (1 - 4 years) ($1,340.22) 7.0% ($1,427.11) 3.0% Early-production aged trees (5 - 10 years) ($713.30) 17.5% ($1,027.23) 7.5% Full-production aged trees (11 - 25 years) $553.86 35.0% ($40.44) 15.0% Late-production aged trees (26 - 30 years) $142.27 10.5% ($100.18) 4.5% 2 e a) 2003 /2/ . Weight d Average Net Return for 1997-2003.
$34.64 b) 2002 ($113.52) c) 2001 ($108.20) d) 2000 ($59.80) e) 1999 ($46.81) f) 1998 $88.77 g) 1997 $88.77 3 a) Net return to trees and land ("olympic" average o 2a thru 2g) /3/ . Net Returns
$0.00 f b) Net return attributable to land only (class III) /4/ $19.23 c) Net return attributable to trees only (3a - 3b) ($19.23) 5 a) Interest Rate . Capitalization Rate
0.0733 b) Property Tax 0.0065 c) Depreciation of Apple Trees /5 0.0333 / d) Depreciation of "Other" Trees 0.0500 e) Apple Orchard Capitalization Rate 0.1132 f) "Other" Orchard Capitalization Rate 0.1298 . Use Value of Apple Orchard and "Other" Orchard 6
APPL ORCHARDE "OTH R" ORCHARDE Land Class Orchard In ex /7/d Trees Only Trees and Land /8/ Trees Only Trees and Land /8/ I 0.80 ($135.92) $225.35 ($118.47) $242.80 II 1.00 ($169.90) $155.24 ($148.09) $177.05 III 1.00 ($169.90) $70.95 ($148.09) $92.76 IV 1.00 ($169.90) $22.78 ($148.09) $44.59 V 0.75 ($127.42) $17.08 ($111.07) $33.44 VI 0.60 ($101.94) $18.48 ($88.85) $31.57 VII 0.40 ($67.96) $4.29 ($59.23) $13.02 VIII 0.00 $0.00 $24.08 $0.00 $24.08
1/ These percentages assume that 70% of the fruit is produced for the processed market and 30% is produced for the fresh market. In addition, it is assumed that the orchard is 10% pre-production, 25% early production, 50% full production and 15% late 2/ This is the average net return of the eight orchard categories listed in section 1 of this table. The weights are provided by the percent of total trees represented by each category. 3/ In an olympic average, the highest and lowest values are dropped prior to calculating the arithmetic mean. 4/ This is determined by dividing the unadjusted net return value (Table 3 - Line 1) by the soil index factor (Table 3 - Section 4). 5/ The depreciation rate applicable to apple trees assumes that trees are replaced on a 30-year rotation. 6/ "Other" trees refers to peach, cherry, pear, and plum trees. The depreciation rate applicable to "other" trees assumes that trees are replaced on a 20-year rotation. 7/ The orchard index is applicable only in determining the value of the trees. The land index (Table 3 - Section 5) is applied to 8/ The use value of trees and land is determined by adding the appropriate without-risk- land-use-value (see Table 3 - Section5) to the use value of the trees. Table5:33

Table 5: Worksheet for estimating the use value of orchard land in Greene The estimated net returns assume a planting density of 135 trees per acre. A complete listing of this table for each jurisdiction participating in the land use program is available at the Virginia Department of Taxation. Estimates apply to tax-year 2005.
1. Estimated net returns (loss) per acre applicable to tax-year 2005 (see Table 4 for more detail). Age of Trees Processed Fru ti Percent of To al /1/ t Fresh Fruit Percent of Total /1/ Pre-production aged trees (1 - 4 years) ($1,340.22) 7.0% ($1,427.11) 3.0% Early-production aged trees (5 - 10 years) ($713.30) 17.5% ($1,027.23) 7.5% Full-production aged trees (11 - 25 years) $553.86 35.0% ($40.44) 15.0% Late-production aged trees (26 - 30 years) $142.27 10.5% ($100.18) 4.5% 2 e a) 2003 /2/ . Weight d Average Net Return for 1997-2003.
$34.64 b) 2002 ($113.52) c) 2001 ($108.20) d) 2000 ($59.80) e) 1999 ($46.81) f) 1998 $88.77 g) 1997 $88.77 3 a) Net return to trees and land ("olympic" average o 2a thru 2g) /3/ . Net Returns
$0.00 f b) Net return attributable to land only (class III) /4/ $10.81 c) Net return attributable to trees only (3a - 3b) ($10.81) 5 a) Interest Rate . Capitalization Rate
0.0733 b) Property Tax 0.0068 c) Depreciation of Apple Trees /5 0.0333 / d) Depreciation of "Other" Trees 0.0500 e) Apple Orchard Capitalization Rate 0.1134 f) "Other" Orchard Capitalization Rate 0.1301 . Use Value of Apple Orchard and "Other" Orchard 6
APPL ORCHARDE "OTH R" ORCHARDE Land Class Orchard In ex /7/d Trees Only Trees and Land /8/ Trees Only Trees and Land /8/ I 0.80 ($76.26) $126.24 ($66.49) $136.01 II 1.00 ($95.32) $86.92 ($83.11) $99.14 III 1.00 ($95.32) $39.68 ($83.11) $51.89 IV 1.00 ($95.32) $12.68 ($83.11) $24.89 V 0.75 ($71.49) $9.51 ($62.33) $18.67 VI 0.60 ($57.19) $10.31 ($49.87) $17.63 VII 0.40 ($38.13) $2.37 ($33.24) $7.26 VIII 0.00 $0.00 $13.50 $0.00 $13.50
1/ These percentages assume that 70% of the fruit is produced for the processed market and 30% is produced for the fresh market. In addition, it is assumed that the orchard is 10% pre-production, 25% early production, 50% full production and 15% late 2/ This is the average net return of the eight orchard categories listed in section 1 of this table. The weights are provided by the percent of total trees represented by each category. 3/ In an olympic average, the highest and lowest values are dropped prior to calculating the arithmetic mean. 4/ This is determined by dividing the unadjusted net return value (Table 3 - Line 1) by the soil index factor (Table 3 - Section 4). 5/ The depreciation rate applicable to apple trees assumes that trees are replaced on a 30-year rotation. 6/ "Other" trees refers to peach, cherry, pear, and plum trees. The depreciation rate applicable to "other" trees assumes that trees are replaced on a 20-year rotation. 7/ The orchard index is applicable only in determining the value of the trees. The land index (Table 3 - Section 5) is applied to 8/ The use value of trees and land is determined by adding the appropriate without-risk- land-use-value (see Table 3 - Section5) to the use value of the trees. Table5:34

Table 5: Worksheet for estimating the use value of orchard land in Halifax The estimated net returns assume a planting density of 135 trees per acre. A complete listing of this table for each jurisdiction participating in the land use program is available at the Virginia Department of Taxation. Estimates apply to tax-year 2005.
1. Estimated net returns (loss) per acre applicable to tax-year 2005 (see Table 4 for more detail). Age of Trees Processed Fru ti Percent of To al /1/ t Fresh Fruit Percent of Total /1/ Pre-production aged trees (1 - 4 years) ($1,340.22) 7.0% ($1,427.11) 3.0% Early-production aged trees (5 - 10 years) ($713.30) 17.5% ($1,027.23) 7.5% Full-production aged trees (11 - 25 years) $553.86 35.0% ($40.44) 15.0% Late-production aged trees (26 - 30 years) $142.27 10.5% ($100.18) 4.5% 2 e a) 2003 /2/ . Weight d Average Net Return for 1997-2003.
$34.64 b) 2002 ($113.52) c) 2001 ($108.20) d) 2000 ($59.80) e) 1999 ($46.81) f) 1998 $88.77 g) 1997 $88.77 3 a) Net return to trees and land ("olympic" average o 2a thru 2g) /3/ . Net Returns
$0.00 f b) Net return attributable to land only (class III) /4/ $18.69 c) Net return attributable to trees only (3a - 3b) ($18.69) 5 a) Interest Rate . Capitalization Rate
0.0733 b) Property Tax 0.0032 c) Depreciation of Apple Trees /5 0.0333 / d) Depreciation of "Other" Trees 0.0500 e) Apple Orchard Capitalization Rate 0.1099 f) "Other" Orchard Capitalization Rate 0.1265 . Use Value of Apple Orchard and "Other" Orchard 6
APPL ORCHARDE "OTH R" ORCHARDE Land Class Orchard In ex /7/d Trees Only Trees and Land /8/ Trees Only Trees and Land /8/ I 0.80 ($136.10) $230.24 ($118.17) $248.17 II 1.00 ($170.12) $159.58 ($147.71) $181.99 III 1.00 ($170.12) $74.10 ($147.71) $96.51 IV 1.00 ($170.12) $25.26 ($147.71) $47.67 V 0.75 ($127.59) $18.94 ($110.79) $35.75 VI 0.60 ($102.07) $20.04 ($88.63) $33.49 VII 0.40 ($68.05) $5.22 ($59.09) $14.18 VIII 0.00 $0.00 $24.42 $0.00 $24.42
1/ These percentages assume that 70% of the fruit is produced for the processed market and 30% is produced for the fresh market. In addition, it is assumed that the orchard is 10% pre-production, 25% early production, 50% full production and 15% late 2/ This is the average net return of the eight orchard categories listed in section 1 of this table. The weights are provided by the percent of total trees represented by each category. 3/ In an olympic average, the highest and lowest values are dropped prior to calculating the arithmetic mean. 4/ This is determined by dividing the unadjusted net return value (Table 3 - Line 1) by the soil index factor (Table 3 - Section 4). 5/ The depreciation rate applicable to apple trees assumes that trees are replaced on a 30-year rotation. 6/ "Other" trees refers to peach, cherry, pear, and plum trees. The depreciation rate applicable to "other" trees assumes that trees are replaced on a 20-year rotation. 7/ The orchard index is applicable only in determining the value of the trees. The land index (Table 3 - Section 5) is applied to 8/ The use value of trees and land is determined by adding the appropriate without-risk- land-use-value (see Table 3 - Section5) to the use value of the trees. Table5:35

Table 5: Worksheet for estimating the use value of orchard land in Hampton 7/ The estimated net returns assume a planting density of 135 trees per acre. A complete listing of this table for each jurisdiction participating in the land use program is available at the Virginia Department of Taxation. Estimates apply to tax-year 2005.
1. Estimated net returns (loss) per acre applicable to tax-year 2005 (see Table 4 for more detail). Age of Trees Processed Fru ti Percent of To al /1/ t Fresh Fruit Percent of Total /1/ Pre-production aged trees (1 - 4 years) ($1,340.22) 7.0% ($1,427.11) 3.0% Early-production aged trees (5 - 10 years) ($713.30) 17.5% ($1,027.23) 7.5% Full-production aged trees (11 - 25 years) $553.86 35.0% ($40.44) 15.0% Late-production aged trees (26 - 30 years) $142.27 10.5% ($100.18) 4.5% 2 e a) 2003 /2/ . Weight d Average Net Return for 1997-2003.
$34.64 b) 2002 ($113.52) c) 2001 ($108.20) d) 2000 ($59.80) e) 1999 ($46.81) f) 1998 $88.77 g) 1997 $88.77 3 a) Net return to trees and land ("olympic" average o 2a thru 2g) /3/ . Net Returns
$0.00 f b) Net return attributable to land only (class III) /4/ $31.25 c) Net return attributable to trees only (3a - 3b) ($31.25) 5 a) Interest Rate . Capitalization Rate
0.0733 b) Property Tax 0.0119 c) Depreciation of Apple Trees /5 0.0333 / d) Depreciation of "Other" Trees 0.0500 e) Apple Orchard Capitalization Rate 0.1185 f) "Other" Orchard Capitalization Rate 0.1352 . Use Value of Apple Orchard and "Other" Orchard 6
APPL ORCHARDE "OTH R" ORCHARDE Land Class Orchard In ex /7/d Trees Only Trees and Land /8/ Trees Only Trees and Land /8/ I 0.80 ($210.90) $339.24 ($184.90) $365.24 II 1.00 ($263.63) $231.50 ($231.13) $264.00 III 1.00 ($263.63) $103.13 ($231.13) $135.63 IV 1.00 ($263.63) $29.78 ($231.13) $62.28 V 0.75 ($197.72) $22.34 ($173.35) $46.71 VI 0.60 ($158.18) $25.20 ($138.68) $44.70 VII 0.40 ($105.45) $4.58 ($92.45) $17.58 VIII 0.00 $0.00 $36.68 $0.00 $36.68
1/ These percentages assume that 70% of the fruit is produced for the processed market and 30% is produced for the fresh market. In addition, it is assumed that the orchard is 10% pre-production, 25% early production, 50% full production and 15% late 2/ This is the average net return of the eight orchard categories listed in section 1 of this table. The weights are provided by the percent of total trees represented by each category. 3/ In an olympic average, the highest and lowest values are dropped prior to calculating the arithmetic mean. 4/ This is determined by dividing the unadjusted net return value (Table 3 - Line 1) by the soil index factor (Table 3 - Section 4). 5/ The depreciation rate applicable to apple trees assumes that trees are replaced on a 30-year rotation. 6/ "Other" trees refers to peach, cherry, pear, and plum trees. The depreciation rate applicable to "other" trees assumes that trees are replaced on a 20-year rotation. 7/ The orchard index is applicable only in determining the value of the trees. The land index (Table 3 - Section 5) is applied to 8/ The use value of trees and land is determined by adding the appropriate without-risk- land-use-value (see Table 3 - Section5) to the use value of the trees. Table5:36

Table 5: Worksheet for estimating the use value of orchard land in Hanover County, Coastal Plain- The estimated net returns assume a planting density of 135 trees per acre. A complete listing of this table for each jurisdiction participating in the land use program is available at the Virginia Department of Taxation. Estimates apply to tax-year 2005.
1. Estimated net returns (loss) per acre applicable to tax-year 2005 (see Table 4 for more detail). Age of Trees Processed Fru ti Percent of To al /1/ t Fresh Fruit Percent of Total /1/ Pre-production aged trees (1 - 4 years) ($1,340.22) 7.0% ($1,427.11) 3.0% Early-production aged trees (5 - 10 years) ($713.30) 17.5% ($1,027.23) 7.5% Full-production aged trees (11 - 25 years) $553.86 35.0% ($40.44) 15.0% Late-production aged trees (26 - 30 years) $142.27 10.5% ($100.18) 4.5% 2 e a) 2003 /2/ . Weight d Average Net Return for 1997-2003.
$34.64 b) 2002 ($113.52) c) 2001 ($108.20) d) 2000 ($59.80) e) 1999 ($46.81) f) 1998 $88.77 g) 1997 $88.77 3 a) Net return to trees and land ("olympic" average o 2a thru 2g) /3/ . Net Returns
$0.00 f b) Net return attributable to land only (class III) /4/ $20.62 c) Net return attributable to trees only (3a - 3b) ($20.62) 5 a) Interest Rate . Capitalization Rate
0.0733 b) Property Tax 0.0065 c) Depreciation of Apple Trees /5 0.0333 / d) Depreciation of "Other" Trees 0.0500 e) Apple Orchard Capitalization Rate 0.1131 f) "Other" Orchard Capitalization Rate 0.1298 . Use Value of Apple Orchard and "Other" Orchard 6
APPL ORCHARDE "OTH R" ORCHARDE Land Class Orchard In ex /7/d Trees Only Trees and Land /8/ Trees Only Trees and Land /8/ I 0.80 ($145.83) $241.85 ($127.10) $260.57 II 1.00 ($182.28) $166.62 ($158.87) $190.03 III 1.00 ($182.28) $76.17 ($158.87) $99.58 IV 1.00 ($182.28) $24.48 ($158.87) $47.89 V 0.75 ($136.71) $18.36 ($119.16) $35.91 VI 0.60 ($109.37) $19.85 ($95.32) $33.90 VII 0.40 ($72.91) $4.62 ($63.55) $13.99 VIII 0.00 $0.00 $25.84 $0.00 $25.84
1/ These percentages assume that 70% of the fruit is produced for the processed market and 30% is produced for the fresh market. In addition, it is assumed that the orchard is 10% pre-production, 25% early production, 50% full production and 15% late 2/ This is the average net return of the eight orchard categories listed in section 1 of this table. The weights are provided by the percent of total trees represented by each category. 3/ In an olympic average, the highest and lowest values are dropped prior to calculating the arithmetic mean. 4/ This is determined by dividing the unadjusted net return value (Table 3 - Line 1) by the soil index factor (Table 3 - Section 4). 5/ The depreciation rate applicable to apple trees assumes that trees are replaced on a 30-year rotation. 6/ "Other" trees refers to peach, cherry, pear, and plum trees. The depreciation rate applicable to "other" trees assumes that trees are replaced on a 20-year rotation. 7/ The orchard index is applicable only in determining the value of the trees. The land index (Table 3 - Section 5) is applied to 8/ The use value of trees and land is determined by adding the appropriate without-risk- land-use-value (see Table 3 - Section5) to the use value of the trees. Table5:37

Table 5: Worksheet for estimating the use value of orchard land in Hanover County, Piedmont- 8/ The estimated net returns assume a planting density of 135 trees per acre. A complete listing of this table for each jurisdiction participating in the land use program is available at the Virginia Department of Taxation. Estimates apply to tax-year 2005.
1. Estimated net returns (loss) per acre applicable to tax-year 2005 (see Table 4 for more detail). Age of Trees Processed Fru ti Percent of To al /1/ t Fresh Fruit Percent of Total /1/ Pre-production aged trees (1 - 4 years) ($1,340.22) 7.0% ($1,427.11) 3.0% Early-production aged trees (5 - 10 years) ($713.30) 17.5% ($1,027.23) 7.5% Full-production aged trees (11 - 25 years) $553.86 35.0% ($40.44) 15.0% Late-production aged trees (26 - 30 years) $142.27 10.5% ($100.18) 4.5% 2 e a) 2003 /2/ . Weight d Average Net Return for 1997-2003.
$34.64 b) 2002 ($113.52) c) 2001 ($108.20) d) 2000 ($59.80) e) 1999 ($46.81) f) 1998 $88.77 g) 1997 $88.77 3 a) Net return to trees and land ("olympic" average o 2a thru 2g) /3/ . Net Returns
$0.00 f b) Net return attributable to land only (class III) /4/ $14.33 c) Net return attributable to trees only (3a - 3b) ($14.33) 5 a) Interest Rate . Capitalization Rate
0.0733 b) Property Tax 0.0065 c) Depreciation of Apple Trees /5 0.0333 / d) Depreciation of "Other" Trees 0.0500 e) Apple Orchard Capitalization Rate 0.1131 f) "Other" Orchard Capitalization Rate 0.1298 . Use Value of Apple Orchard and "Other" Orchard 6
APPL ORCHARDE "OTH R" ORCHARDE Land Class Orchard In ex /7/d Trees Only Trees and Land /8/ Trees Only Trees and Land /8/ I 0.80 ($101.32) $168.03 ($88.31) $181.04 II 1.00 ($126.65) $115.77 ($110.38) $132.03 III 1.00 ($126.65) $52.92 ($110.38) $69.18 IV 1.00 ($126.65) $17.01 ($110.38) $33.27 V 0.75 ($94.99) $12.75 ($82.79) $24.95 VI 0.60 ($75.99) $13.79 ($66.23) $23.55 VII 0.40 ($50.66) $3.21 ($44.15) $9.72 VIII 0.00 $0.00 $17.96 $0.00 $17.96
1/ These percentages assume that 70% of the fruit is produced for the processed market and 30% is produced for the fresh market. In addition, it is assumed that the orchard is 10% pre-production, 25% early production, 50% full production and 15% late 2/ This is the average net return of the eight orchard categories listed in section 1 of this table. The weights are provided by the percent of total trees represented by each category. 3/ In an olympic average, the highest and lowest values are dropped prior to calculating the arithmetic mean. 4/ This is determined by dividing the unadjusted net return value (Table 3 - Line 1) by the soil index factor (Table 3 - Section 4). 5/ The depreciation rate applicable to apple trees assumes that trees are replaced on a 30-year rotation. 6/ "Other" trees refers to peach, cherry, pear, and plum trees. The depreciation rate applicable to "other" trees assumes that trees are replaced on a 20-year rotation. 7/ The orchard index is applicable only in determining the value of the trees. The land index (Table 3 - Section 5) is applied to 8/ The use value of trees and land is determined by adding the appropriate without-risk- land-use-value (see Table 3 - Section5) to the use value of the trees. Table5:38

Table 5: Worksheet for estimating the use value of orchard land in Harrisonburg 13/ The estimated net returns assume a planting density of 135 trees per acre. A complete listing of this table for each jurisdiction participating in the land use program is available at the Virginia Department of Taxation. Estimates apply to tax-year 2005.
1. Estimated net returns (loss) per acre applicable to tax-year 2005 (see Table 4 for more detail). Age of Trees Processed Fru ti Percent of To al /1/ t Fresh Fruit Percent of Total /1/ Pre-production aged trees (1 - 4 years) ($1,340.22) 7.0% ($1,427.11) 3.0% Early-production aged trees (5 - 10 years) ($713.30) 17.5% ($1,027.23) 7.5% Full-production aged trees (11 - 25 years) $553.86 35.0% ($40.44) 15.0% Late-production aged trees (26 - 30 years) $142.27 10.5% ($100.18) 4.5% 2 e a) 2003 /2/ . Weight d Average Net Return for 1997-2003.
$34.64 b) 2002 ($113.52) c) 2001 ($108.20) d) 2000 ($59.80) e) 1999 ($46.81) f) 1998 $88.77 g) 1997 $88.77 3 a) Net return to trees and land ("olympic" average o 2a thru 2g) /3/ . Net Returns
$0.00 f b) Net return attributable to land only (class III) /4/ $32.78 c) Net return attributable to trees only (3a - 3b) ($32.78) 5 a) Interest Rate . Capitalization Rate
0.0733 b) Property Tax 0.0057 c) Depreciation of Apple Trees /5 0.0333 / d) Depreciation of "Other" Trees 0.0500 e) Apple Orchard Capitalization Rate 0.1123 f) "Other" Orchard Capitalization Rate 0.1290 . Use Value of Apple Orchard and "Other" Orchard 6
APPL ORCHARDE "OTH R" ORCHARDE Land Class Orchard In ex /7/d Trees Only Trees and Land /8/ Trees Only Trees and Land /8/ I 0.80 ($233.44) $388.93 ($203.28) $419.09 II 1.00 ($291.80) $268.34 ($254.10) $306.04 III 1.00 ($291.80) $123.11 ($254.10) $160.81 IV 1.00 ($291.80) $40.13 ($254.10) $77.83 V 0.75 ($218.85) $30.10 ($190.58) $58.37 VI 0.60 ($175.08) $32.38 ($152.46) $55.00 VII 0.40 ($116.72) $7.75 ($101.64) $22.83 VIII 0.00 $0.00 $41.49 $0.00 $41.49
1/ These percentages assume that 70% of the fruit is produced for the processed market and 30% is produced for the fresh market. In addition, it is assumed that the orchard is 10% pre-production, 25% early production, 50% full production and 15% late 2/ This is the average net return of the eight orchard categories listed in section 1 of this table. The weights are provided by the percent of total trees represented by each category. 3/ In an olympic average, the highest and lowest values are dropped prior to calculating the arithmetic mean. 4/ This is determined by dividing the unadjusted net return value (Table 3 - Line 1) by the soil index factor (Table 3 - Section 4). 5/ The depreciation rate applicable to apple trees assumes that trees are replaced on a 30-year rotation. 6/ "Other" trees refers to peach, cherry, pear, and plum trees. The depreciation rate applicable to "other" trees assumes that trees are replaced on a 20-year rotation. 7/ The orchard index is applicable only in determining the value of the trees. The land index (Table 3 - Section 5) is applied to 8/ The use value of trees and land is determined by adding the appropriate without-risk- land-use-value (see Table 3 - Section5) to the use value of the trees. Table5:39

Table 5: Worksheet for estimating the use value of orchard land in Henrico County, Coastal Plain The estimated net returns assume a planting density of 135 trees per acre. A complete listing of this table for each jurisdiction participating in the land use program is available at the Virginia Department of Taxation. Estimates apply to tax-year 2005.
1. Estimated net returns (loss) per acre applicable to tax-year 2005 (see Table 4 for more detail). Age of Trees Processed Fru ti Percent of To al /1/ t Fresh Fruit Percent of Total /1/ Pre-production aged trees (1 - 4 years) ($1,340.22) 7.0% ($1,427.11) 3.0% Early-production aged trees (5 - 10 years) ($713.30) 17.5% ($1,027.23) 7.5% Full-production aged trees (11 - 25 years) $553.86 35.0% ($40.44) 15.0% Late-production aged trees (26 - 30 years) $142.27 10.5% ($100.18) 4.5% 2 e a) 2003 /2/ . Weight d Average Net Return for 1997-2003.
$34.64 b) 2002 ($113.52) c) 2001 ($108.20) d) 2000 ($59.80) e) 1999 ($46.81) f) 1998 $88.77 g) 1997 $88.77 3 a) Net return to trees and land ("olympic" average o 2a thru 2g) /3/ . Net Returns
$0.00 f b) Net return attributable to land only (class III) /4/ $20.62 c) Net return attributable to trees only (3a - 3b) ($20.62) 5 a) Interest Rate . Capitalization Rate
0.0733 b) Property Tax 0.0085 c) Depreciation of Apple Trees /5 0.0333 / d) Depreciation of "Other" Trees 0.0500 e) Apple Orchard Capitalization Rate 0.1151 f) "Other" Orchard Capitalization Rate 0.1318 . Use Value of Apple Orchard and "Other" Orchard 6
APPL ORCHARDE "OTH R" ORCHARDE Land Class Orchard In ex /7/d Trees Only Trees and Land /8/ Trees Only Trees and Land /8/ I 0.80 ($143.31) $234.93 ($125.18) $253.06 II 1.00 ($179.13) $161.28 ($156.47) $183.94 III 1.00 ($179.13) $73.03 ($156.47) $95.68 IV 1.00 ($179.13) $22.60 ($156.47) $45.25 V 0.75 ($134.35) $16.95 ($117.36) $33.94 VI 0.60 ($107.48) $18.60 ($93.88) $32.20 VII 0.40 ($71.65) $3.99 ($62.59) $13.06 VIII 0.00 $0.00 $25.22 $0.00 $25.22
1/ These percentages assume that 70% of the fruit is produced for the processed market and 30% is produced for the fresh market. In addition, it is assumed that the orchard is 10% pre-production, 25% early production, 50% full production and 15% late 2/ This is the average net return of the eight orchard categories listed in section 1 of this table. The weights are provided by the percent of total trees represented by each category. 3/ In an olympic average, the highest and lowest values are dropped prior to calculating the arithmetic mean. 4/ This is determined by dividing the unadjusted net return value (Table 3 - Line 1) by the soil index factor (Table 3 - Section 4). 5/ The depreciation rate applicable to apple trees assumes that trees are replaced on a 30-year rotation. 6/ "Other" trees refers to peach, cherry, pear, and plum trees. The depreciation rate applicable to "other" trees assumes that trees are replaced on a 20-year rotation. 7/ The orchard index is applicable only in determining the value of the trees. The land index (Table 3 - Section 5) is applied to 8/ The use value of trees and land is determined by adding the appropriate without-risk- land-use-value (see Table 3 - Section5) to the use value of the trees. Table5:40

Table 5: Worksheet for estimating the use value of orchard land in Henrico County, Piedmont 8/ The estimated net returns assume a planting density of 135 trees per acre. A complete listing of this table for each jurisdiction participating in the land use program is available at the Virginia Department of Taxation. Estimates apply to tax-year 2005.
1. Estimated net returns (loss) per acre applicable to tax-year 2005 (see Table 4 for more detail). Age of Trees Processed Fru ti Percent of To al /1/ t Fresh Fruit Percent of Total /1/ Pre-production aged trees (1 - 4 years) ($1,340.22) 7.0% ($1,427.11) 3.0% Early-production aged trees (5 - 10 years) ($713.30) 17.5% ($1,027.23) 7.5% Full-production aged trees (11 - 25 years) $553.86 35.0% ($40.44) 15.0% Late-production aged trees (26 - 30 years) $142.27 10.5% ($100.18) 4.5% 2 e a) 2003 /2/ . Weight d Average Net Return for 1997-2003.
$34.64 b) 2002 ($113.52) c) 2001 ($108.20) d) 2000 ($59.80) e) 1999 ($46.81) f) 1998 $88.77 g) 1997 $88.77 3 a) Net return to trees and land ("olympic" average o 2a thru 2g) /3/ . Net Returns
$0.00 f b) Net return attributable to land only (class III) /4/ $14.33 c) Net return attributable to trees only (3a - 3b) ($14.33) 5 a) Interest Rate . Capitalization Rate
0.0733 b) Property Tax 0.0085 c) Depreciation of Apple Trees /5 0.0333 / d) Depreciation of "Other" Trees 0.0500 e) Apple Orchard Capitalization Rate 0.1151 f) "Other" Orchard Capitalization Rate 0.1318 . Use Value of Apple Orchard and "Other" Orchard 6
APPL ORCHARDE "OTH R" ORCHARDE Land Class Orchard In ex /7/d Trees Only Trees and Land /8/ Trees Only Trees and Land /8/ I 0.80 ($99.57) $163.23 ($86.97) $175.82 II 1.00 ($124.46) $112.06 ($108.72) $127.80 III 1.00 ($124.46) $50.74 ($108.72) $66.48 IV 1.00 ($124.46) $15.70 ($108.72) $31.44 V 0.75 ($93.34) $11.77 ($81.54) $23.58 VI 0.60 ($74.68) $12.92 ($65.23) $22.37 VII 0.40 ($49.78) $2.78 ($43.49) $9.07 VIII 0.00 $0.00 $17.52 $0.00 $17.52
1/ These percentages assume that 70% of the fruit is produced for the processed market and 30% is produced for the fresh market. In addition, it is assumed that the orchard is 10% pre-production, 25% early production, 50% full production and 15% late 2/ This is the average net return of the eight orchard categories listed in section 1 of this table. The weights are provided by the percent of total trees represented by each category. 3/ In an olympic average, the highest and lowest values are dropped prior to calculating the arithmetic mean. 4/ This is determined by dividing the unadjusted net return value (Table 3 - Line 1) by the soil index factor (Table 3 - Section 4). 5/ The depreciation rate applicable to apple trees assumes that trees are replaced on a 30-year rotation. 6/ "Other" trees refers to peach, cherry, pear, and plum trees. The depreciation rate applicable to "other" trees assumes that trees are replaced on a 20-year rotation. 7/ The orchard index is applicable only in determining the value of the trees. The land index (Table 3 - Section 5) is applied to 8/ The use value of trees and land is determined by adding the appropriate without-risk- land-use-value (see Table 3 - Section5) to the use value of the trees. Table5:41

Table 5: Worksheet for estimating the use value of orchard land in Henry The estimated net returns assume a planting density of 135 trees per acre. A complete listing of this table for each jurisdiction participating in the land use program is available at the Virginia Department of Taxation. Estimates apply to tax-year 2005.
1. Estimated net returns (loss) per acre applicable to tax-year 2005 (see Table 4 for more detail). Age of Trees Processed Fru ti Percent of To al /1/ t Fresh Fruit Percent of Total /1/ Pre-production aged trees (1 - 4 years) ($1,340.22) 7.0% ($1,427.11) 3.0% Early-production aged trees (5 - 10 years) ($713.30) 17.5% ($1,027.23) 7.5% Full-production aged trees (11 - 25 years) $553.86 35.0% ($40.44) 15.0% Late-production aged trees (26 - 30 years) $142.27 10.5% ($100.18) 4.5% 2 e a) 2003 /2/ . Weight d Average Net Return for 1997-2003.
$34.64 b) 2002 ($113.52) c) 2001 ($108.20) d) 2000 ($59.80) e) 1999 ($46.81) f) 1998 $88.77 g) 1997 $88.77 3 a) Net return to trees and land ("olympic" average o 2a thru 2g) /3/ . Net Returns
$0.00 f b) Net return attributable to land only (class III) /4/ $1.06 c) Net return attributable to trees only (3a - 3b) ($1.06) 5 a) Interest Rate . Capitalization Rate
0.0733 b) Property Tax 0.0051 c) Depreciation of Apple Trees /5 0.0333 / d) Depreciation of "Other" Trees 0.0500 e) Apple Orchard Capitalization Rate 0.1117 f) "Other" Orchard Capitalization Rate 0.1283 . Use Value of Apple Orchard and "Other" Orchard 6
APPL ORCHARDE "OTH R" ORCHARDE Land Class Orchard In ex /7/d Trees Only Trees and Land /8/ Trees Only Trees and Land /8/ I 0.80 ($7.62) $12.74 ($6.63) $13.73 II 1.00 ($9.52) $8.80 ($8.28) $10.04 III 1.00 ($9.52) $4.05 ($8.28) $5.29 IV 1.00 ($9.52) $1.34 ($8.28) $2.57 V 0.75 ($7.14) $1.00 ($6.21) $1.93 VI 0.60 ($5.71) $1.07 ($4.97) $1.81 VII 0.40 ($3.81) $0.26 ($3.31) $0.76 VIII 0.00 $0.00 $1.36 $0.00 $1.36
1/ These percentages assume that 70% of the fruit is produced for the processed market and 30% is produced for the fresh market. In addition, it is assumed that the orchard is 10% pre-production, 25% early production, 50% full production and 15% late 2/ This is the average net return of the eight orchard categories listed in section 1 of this table. The weights are provided by the percent of total trees represented by each category. 3/ In an olympic average, the highest and lowest values are dropped prior to calculating the arithmetic mean. 4/ This is determined by dividing the unadjusted net return value (Table 3 - Line 1) by the soil index factor (Table 3 - Section 4). 5/ The depreciation rate applicable to apple trees assumes that trees are replaced on a 30-year rotation. 6/ "Other" trees refers to peach, cherry, pear, and plum trees. The depreciation rate applicable to "other" trees assumes that trees are replaced on a 20-year rotation. 7/ The orchard index is applicable only in determining the value of the trees. The land index (Table 3 - Section 5) is applied to 8/ The use value of trees and land is determined by adding the appropriate without-risk- land-use-value (see Table 3 - Section5) to the use value of the trees. Table5:42

Table 5: Worksheet for estimating the use value of orchard land in Isle Of Wight The estimated net returns assume a planting density of 135 trees per acre. A complete listing of this table for each jurisdiction participating in the land use program is available at the Virginia Department of Taxation. Estimates apply to tax-year 2005.
1. Estimated net returns (loss) per acre applicable to tax-year 2005 (see Table 4 for more detail). Age of Trees Processed Fru ti Percent of To al /1/ t Fresh Fruit Percent of Total /1/ Pre-production aged trees (1 - 4 years) ($1,340.22) 7.0% ($1,427.11) 3.0% Early-production aged trees (5 - 10 years) ($713.30) 17.5% ($1,027.23) 7.5% Full-production aged trees (11 - 25 years) $553.86 35.0% ($40.44) 15.0% Late-production aged trees (26 - 30 years) $142.27 10.5% ($100.18) 4.5% 2 e a) 2003 /2/ . Weight d Average Net Return for 1997-2003.
$34.64 b) 2002 ($113.52) c) 2001 ($108.20) d) 2000 ($59.80) e) 1999 ($46.81) f) 1998 $88.77 g) 1997 $88.77 3 a) Net return to trees and land ("olympic" average o 2a thru 2g) /3/ . Net Returns
$0.00 f b) Net return attributable to land only (class III) /4/ $24.81 c) Net return attributable to trees only (3a - 3b) ($24.81) 5 a) Interest Rate . Capitalization Rate
0.0733 b) Property Tax 0.0067 c) Depreciation of Apple Trees /5 0.0333 / d) Depreciation of "Other" Trees 0.0500 e) Apple Orchard Capitalization Rate 0.1133 f) "Other" Orchard Capitalization Rate 0.1300 . Use Value of Apple Orchard and "Other" Orchard 6
APPL ORCHARDE "OTH R" ORCHARDE Land Class Orchard In ex /7/d Trees Only Trees and Land /8/ Trees Only Trees and Land /8/ I 0.80 ($175.16) $290.12 ($152.70) $312.57 II 1.00 ($218.95) $199.80 ($190.88) $227.87 III 1.00 ($218.95) $91.23 ($190.88) $119.31 IV 1.00 ($218.95) $29.20 ($190.88) $57.27 V 0.75 ($164.21) $21.90 ($143.16) $42.95 VI 0.60 ($131.37) $23.72 ($114.53) $40.56 VII 0.40 ($87.58) $5.48 ($76.35) $16.70 VIII 0.00 $0.00 $31.02 $0.00 $31.02
1/ These percentages assume that 70% of the fruit is produced for the processed market and 30% is produced for the fresh market. In addition, it is assumed that the orchard is 10% pre-production, 25% early production, 50% full production and 15% late 2/ This is the average net return of the eight orchard categories listed in section 1 of this table. The weights are provided by the percent of total trees represented by each category. 3/ In an olympic average, the highest and lowest values are dropped prior to calculating the arithmetic mean. 4/ This is determined by dividing the unadjusted net return value (Table 3 - Line 1) by the soil index factor (Table 3 - Section 4). 5/ The depreciation rate applicable to apple trees assumes that trees are replaced on a 30-year rotation. 6/ "Other" trees refers to peach, cherry, pear, and plum trees. The depreciation rate applicable to "other" trees assumes that trees are replaced on a 20-year rotation. 7/ The orchard index is applicable only in determining the value of the trees. The land index (Table 3 - Section 5) is applied to 8/ The use value of trees and land is determined by adding the appropriate without-risk- land-use-value (see Table 3 - Section5) to the use value of the trees. Table5:43

Table 5: Worksheet for estimating the use value of orchard land in James City The estimated net returns assume a planting density of 135 trees per acre. A complete listing of this table for each jurisdiction participating in the land use program is available at the Virginia Department of Taxation. Estimates apply to tax-year 2005.
1. Estimated net returns (loss) per acre applicable to tax-year 2005 (see Table 4 for more detail). Age of Trees Processed Fru ti Percent of To al /1/ t Fresh Fruit Percent of Total /1/ Pre-production aged trees (1 - 4 years) ($1,340.22) 7.0% ($1,427.11) 3.0% Early-production aged trees (5 - 10 years) ($713.30) 17.5% ($1,027.23) 7.5% Full-production aged trees (11 - 25 years) $553.86 35.0% ($40.44) 15.0% Late-production aged trees (26 - 30 years) $142.27 10.5% ($100.18) 4.5% 2 e a) 2003 /2/ . Weight d Average Net Return for 1997-2003.
$34.64 b) 2002 ($113.52) c) 2001 ($108.20) d) 2000 ($59.80) e) 1999 ($46.81) f) 1998 $88.77 g) 1997 $88.77 3 a) Net return to trees and land ("olympic" average o 2a thru 2g) /3/ . Net Returns
$0.00 f b) Net return attributable to land only (class III) /4/ $31.25 c) Net return attributable to trees only (3a - 3b) ($31.25) 5 a) Interest Rate . Capitalization Rate
0.0733 b) Property Tax 0.0079 c) Depreciation of Apple Trees /5 0.0333 / d) Depreciation of "Other" Trees 0.0500 e) Apple Orchard Capitalization Rate 0.1145 f) "Other" Orchard Capitalization Rate 0.1312 . Use Value of Apple Orchard and "Other" Orchard 6
APPL ORCHARDE "OTH R" ORCHARDE Land Class Orchard In ex /7/d Trees Only Trees and Land /8/ Trees Only Trees and Land /8/ I 0.80 ($218.34) $359.18 ($190.60) $386.92 II 1.00 ($272.93) $246.84 ($238.25) $281.52 III 1.00 ($272.93) $112.09 ($238.25) $146.77 IV 1.00 ($272.93) $35.08 ($238.25) $69.76 V 0.75 ($204.70) $26.31 ($178.69) $52.32 VI 0.60 ($163.76) $28.75 ($142.95) $49.56 VII 0.40 ($109.17) $6.33 ($95.30) $20.21 VIII 0.00 $0.00 $38.50 $0.00 $38.50
1/ These percentages assume that 70% of the fruit is produced for the processed market and 30% is produced for the fresh market. In addition, it is assumed that the orchard is 10% pre-production, 25% early production, 50% full production and 15% late 2/ This is the average net return of the eight orchard categories listed in section 1 of this table. The weights are provided by the percent of total trees represented by each category. 3/ In an olympic average, the highest and lowest values are dropped prior to calculating the arithmetic mean. 4/ This is determined by dividing the unadjusted net return value (Table 3 - Line 1) by the soil index factor (Table 3 - Section 4). 5/ The depreciation rate applicable to apple trees assumes that trees are replaced on a 30-year rotation. 6/ "Other" trees refers to peach, cherry, pear, and plum trees. The depreciation rate applicable to "other" trees assumes that trees are replaced on a 20-year rotation. 7/ The orchard index is applicable only in determining the value of the trees. The land index (Table 3 - Section 5) is applied to 8/ The use value of trees and land is determined by adding the appropriate without-risk- land-use-value (see Table 3 - Section5) to the use value of the trees. Table5:44

Table 5: Worksheet for estimating the use value of orchard land in King George The estimated net returns assume a planting density of 135 trees per acre. A complete listing of this table for each jurisdiction participating in the land use program is available at the Virginia Department of Taxation. Estimates apply to tax-year 2005.
1. Estimated net returns (loss) per acre applicable to tax-year 2005 (see Table 4 for more detail). Age of Trees Processed Fru ti Percent of To al /1/ t Fresh Fruit Percent of Total /1/ Pre-production aged trees (1 - 4 years) ($1,340.22) 7.0% ($1,427.11) 3.0% Early-production aged trees (5 - 10 years) ($713.30) 17.5% ($1,027.23) 7.5% Full-production aged trees (11 - 25 years) $553.86 35.0% ($40.44) 15.0% Late-production aged trees (26 - 30 years) $142.27 10.5% ($100.18) 4.5% 2 e a) 2003 /2/ . Weight d Average Net Return for 1997-2003.
$34.64 b) 2002 ($113.52) c) 2001 ($108.20) d) 2000 ($59.80) e) 1999 ($46.81) f) 1998 $88.77 g) 1997 $88.77 3 a) Net return to trees and land ("olympic" average o 2a thru 2g) /3/ . Net Returns
$0.00 f b) Net return attributable to land only (class III) /4/ $30.92 c) Net return attributable to trees only (3a - 3b) ($30.92) 5 a) Interest Rate . Capitalization Rate
0.0733 b) Property Tax 0.0066 c) Depreciation of Apple Trees /5 0.0333 / d) Depreciation of "Other" Trees 0.0500 e) Apple Orchard Capitalization Rate 0.1132 f) "Other" Orchard Capitalization Rate 0.1298 . Use Value of Apple Orchard and "Other" Orchard 6
APPL ORCHARDE "OTH R" ORCHARDE Land Class Orchard In ex /7/d Trees Only Trees and Land /8/ Trees Only Trees and Land /8/ I 0.80 ($218.59) $362.39 ($190.53) $390.44 II 1.00 ($273.23) $249.64 ($238.16) $284.72 III 1.00 ($273.23) $114.08 ($238.16) $149.16 IV 1.00 ($273.23) $36.62 ($238.16) $71.69 V 0.75 ($204.92) $27.46 ($178.62) $53.77 VI 0.60 ($163.94) $29.72 ($142.89) $50.76 VII 0.40 ($109.29) $6.90 ($95.26) $20.93 VIII 0.00 $0.00 $38.73 $0.00 $38.73
1/ These percentages assume that 70% of the fruit is produced for the processed market and 30% is produced for the fresh market. In addition, it is assumed that the orchard is 10% pre-production, 25% early production, 50% full production and 15% late 2/ This is the average net return of the eight orchard categories listed in section 1 of this table. The weights are provided by the percent of total trees represented by each category. 3/ In an olympic average, the highest and lowest values are dropped prior to calculating the arithmetic mean. 4/ This is determined by dividing the unadjusted net return value (Table 3 - Line 1) by the soil index factor (Table 3 - Section 4). 5/ The depreciation rate applicable to apple trees assumes that trees are replaced on a 30-year rotation. 6/ "Other" trees refers to peach, cherry, pear, and plum trees. The depreciation rate applicable to "other" trees assumes that trees are replaced on a 20-year rotation. 7/ The orchard index is applicable only in determining the value of the trees. The land index (Table 3 - Section 5) is applied to 8/ The use value of trees and land is determined by adding the appropriate without-risk- land-use-value (see Table 3 - Section5) to the use value of the trees. Table5:45

Table 5: Worksheet for estimating the use value of orchard land in King William The estimated net returns assume a planting density of 135 trees per acre. A complete listing of this table for each jurisdiction participating in the land use program is available at the Virginia Department of Taxation. Estimates apply to tax-year 2005.
1. Estimated net returns (loss) per acre applicable to tax-year 2005 (see Table 4 for more detail). Age of Trees Processed Fru ti Percent of To al /1/ t Fresh Fruit Percent of Total /1/ Pre-production aged trees (1 - 4 years) ($1,340.22) 7.0% ($1,427.11) 3.0% Early-production aged trees (5 - 10 years) ($713.30) 17.5% ($1,027.23) 7.5% Full-production aged trees (11 - 25 years) $553.86 35.0% ($40.44) 15.0% Late-production aged trees (26 - 30 years) $142.27 10.5% ($100.18) 4.5% 2 e a) 2003 /2/ . Weight d Average Net Return for 1997-2003.
$34.64 b) 2002 ($113.52) c) 2001 ($108.20) d) 2000 ($59.80) e) 1999 ($46.81) f) 1998 $88.77 g) 1997 $88.77 3 a) Net return to trees and land ("olympic" average o 2a thru 2g) /3/ . Net Returns
$0.00 f b) Net return attributable to land only (class III) /4/ $20.62 c) Net return attributable to trees only (3a - 3b) ($20.62) 5 a) Interest Rate . Capitalization Rate
0.0733 b) Property Tax 0.0066 c) Depreciation of Apple Trees /5 0.0333 / d) Depreciation of "Other" Trees 0.0500 e) Apple Orchard Capitalization Rate 0.1132 f) "Other" Orchard Capitalization Rate 0.1299 . Use Value of Apple Orchard and "Other" Orchard 6
APPL ORCHARDE "OTH R" ORCHARDE Land Class Orchard In ex /7/d Trees Only Trees and Land /8/ Trees Only Trees and Land /8/ I 0.80 ($145.72) $241.56 ($127.02) $260.26 II 1.00 ($182.15) $166.40 ($158.78) $189.78 III 1.00 ($182.15) $76.04 ($158.78) $99.41 IV 1.00 ($182.15) $24.40 ($158.78) $47.78 V 0.75 ($136.62) $18.30 ($119.08) $35.83 VI 0.60 ($109.29) $19.80 ($95.27) $33.83 VII 0.40 ($72.86) $4.60 ($63.51) $13.95 VIII 0.00 $0.00 $25.82 $0.00 $25.82
1/ These percentages assume that 70% of the fruit is produced for the processed market and 30% is produced for the fresh market. In addition, it is assumed that the orchard is 10% pre-production, 25% early production, 50% full production and 15% late 2/ This is the average net return of the eight orchard categories listed in section 1 of this table. The weights are provided by the percent of total trees represented by each category. 3/ In an olympic average, the highest and lowest values are dropped prior to calculating the arithmetic mean. 4/ This is determined by dividing the unadjusted net return value (Table 3 - Line 1) by the soil index factor (Table 3 - Section 4). 5/ The depreciation rate applicable to apple trees assumes that trees are replaced on a 30-year rotation. 6/ "Other" trees refers to peach, cherry, pear, and plum trees. The depreciation rate applicable to "other" trees assumes that trees are replaced on a 20-year rotation. 7/ The orchard index is applicable only in determining the value of the trees. The land index (Table 3 - Section 5) is applied to 8/ The use value of trees and land is determined by adding the appropriate without-risk- land-use-value (see Table 3 - Section5) to the use value of the trees. Table5:46

Table 5: Worksheet for estimating the use value of orchard land in Lancaster The estimated net returns assume a planting density of 135 trees per acre. A complete listing of this table for each jurisdiction participating in the land use program is available at the Virginia Department of Taxation. Estimates apply to tax-year 2005.
1. Estimated net returns (loss) per acre applicable to tax-year 2005 (see Table 4 for more detail). Age of Trees Processed Fru ti Percent of To al /1/ t Fresh Fruit Percent of Total /1/ Pre-production aged trees (1 - 4 years) ($1,340.22) 7.0% ($1,427.11) 3.0% Early-production aged trees (5 - 10 years) ($713.30) 17.5% ($1,027.23) 7.5% Full-production aged trees (11 - 25 years) $553.86 35.0% ($40.44) 15.0% Late-production aged trees (26 - 30 years) $142.27 10.5% ($100.18) 4.5% 2 e a) 2003 /2/ . Weight d Average Net Return for 1997-2003.
$34.64 b) 2002 ($113.52) c) 2001 ($108.20) d) 2000 ($59.80) e) 1999 ($46.81) f) 1998 $88.77 g) 1997 $88.77 3 a) Net return to trees and land ("olympic" average o 2a thru 2g) /3/ . Net Returns
$0.00 f b) Net return attributable to land only (class III) /4/ $30.16 c) Net return attributable to trees only (3a - 3b) ($30.16) 5 a) Interest Rate . Capitalization Rate
0.0733 b) Property Tax 0.0047 c) Depreciation of Apple Trees /5 0.0333 / d) Depreciation of "Other" Trees 0.0500 e) Apple Orchard Capitalization Rate 0.1114 f) "Other" Orchard Capitalization Rate 0.1280 . Use Value of Apple Orchard and "Other" Orchard 6
APPL ORCHARDE "OTH R" ORCHARDE Land Class Orchard In ex /7/d Trees Only Trees and Land /8/ Trees Only Trees and Land /8/ I 0.80 ($216.68) $363.16 ($188.47) $391.37 II 1.00 ($270.85) $251.01 ($235.59) $286.27 III 1.00 ($270.85) $115.71 ($235.59) $150.97 IV 1.00 ($270.85) $38.40 ($235.59) $73.66 V 0.75 ($203.14) $28.80 ($176.69) $55.24 VI 0.60 ($162.51) $30.77 ($141.35) $51.93 VII 0.40 ($108.34) $7.63 ($94.24) $21.73 VIII 0.00 $0.00 $38.66 $0.00 $38.66
1/ These percentages assume that 70% of the fruit is produced for the processed market and 30% is produced for the fresh market. In addition, it is assumed that the orchard is 10% pre-production, 25% early production, 50% full production and 15% late 2/ This is the average net return of the eight orchard categories listed in section 1 of this table. The weights are provided by the percent of total trees represented by each category. 3/ In an olympic average, the highest and lowest values are dropped prior to calculating the arithmetic mean. 4/ This is determined by dividing the unadjusted net return value (Table 3 - Line 1) by the soil index factor (Table 3 - Section 4). 5/ The depreciation rate applicable to apple trees assumes that trees are replaced on a 30-year rotation. 6/ "Other" trees refers to peach, cherry, pear, and plum trees. The depreciation rate applicable to "other" trees assumes that trees are replaced on a 20-year rotation. 7/ The orchard index is applicable only in determining the value of the trees. The land index (Table 3 - Section 5) is applied to 8/ The use value of trees and land is determined by adding the appropriate without-risk- land-use-value (see Table 3 - Section5) to the use value of the trees. Table5:47

Table 5: Worksheet for estimating the use value of orchard land in Loudoun The estimated net returns assume a planting density of 135 trees per acre. A complete listing of this table for each jurisdiction participating in the land use program is available at the Virginia Department of Taxation. Estimates apply to tax-year 2005.
1. Estimated net returns (loss) per acre applicable to tax-year 2005 (see Table 4 for more detail). Age of Trees Processed Fru ti Percent of To al /1/ t Fresh Fruit Percent of Total /1/ Pre-production aged trees (1 - 4 years) ($1,340.22) 7.0% ($1,427.11) 3.0% Early-production aged trees (5 - 10 years) ($713.30) 17.5% ($1,027.23) 7.5% Full-production aged trees (11 - 25 years) $553.86 35.0% ($40.44) 15.0% Late-production aged trees (26 - 30 years) $142.27 10.5% ($100.18) 4.5% 2 e a) 2003 /2/ . Weight d Average Net Return for 1997-2003.
$34.64 b) 2002 ($113.52) c) 2001 ($108.20) d) 2000 ($59.80) e) 1999 ($46.81) f) 1998 $88.77 g) 1997 $88.77 3 a) Net return to trees and land ("olympic" average o 2a thru 2g) /3/ . Net Returns
$0.00 f b) Net return attributable to land only (class III) /4/ $17.53 c) Net return attributable to trees only (3a - 3b) ($17.53) 5 a) Interest Rate . Capitalization Rate
0.0733 b) Property Tax 0.0095 c) Depreciation of Apple Trees /5 0.0333 / d) Depreciation of "Other" Trees 0.0500 e) Apple Orchard Capitalization Rate 0.1161 f) "Other" Orchard Capitalization Rate 0.1328 . Use Value of Apple Orchard and "Other" Orchard 6
APPL ORCHARDE "OTH R" ORCHARDE Land Class Orchard In ex /7/d Trees Only Trees and Land /8/ Trees Only Trees and Land /8/ I 0.80 ($120.73) $196.78 ($105.58) $211.93 II 1.00 ($150.92) $134.85 ($131.98) $153.79 III 1.00 ($150.92) $60.76 ($131.98) $79.70 IV 1.00 ($150.92) $18.42 ($131.98) $37.37 V 0.75 ($113.19) $13.82 ($98.98) $28.02 VI 0.60 ($90.55) $15.29 ($79.19) $26.65 VII 0.40 ($60.37) $3.14 ($52.79) $10.71 VIII 0.00 $0.00 $21.17 $0.00 $21.17
1/ These percentages assume that 70% of the fruit is produced for the processed market and 30% is produced for the fresh market. In addition, it is assumed that the orchard is 10% pre-production, 25% early production, 50% full production and 15% late 2/ This is the average net return of the eight orchard categories listed in section 1 of this table. The weights are provided by the percent of total trees represented by each category. 3/ In an olympic average, the highest and lowest values are dropped prior to calculating the arithmetic mean. 4/ This is determined by dividing the unadjusted net return value (Table 3 - Line 1) by the soil index factor (Table 3 - Section 4). 5/ The depreciation rate applicable to apple trees assumes that trees are replaced on a 30-year rotation. 6/ "Other" trees refers to peach, cherry, pear, and plum trees. The depreciation rate applicable to "other" trees assumes that trees are replaced on a 20-year rotation. 7/ The orchard index is applicable only in determining the value of the trees. The land index (Table 3 - Section 5) is applied to 8/ The use value of trees and land is determined by adding the appropriate without-risk- land-use-value (see Table 3 - Section5) to the use value of the trees. Table5:48

Table 5: Worksheet for estimating the use value of orchard land in Louisa The estimated net returns assume a planting density of 135 trees per acre. A complete listing of this table for each jurisdiction participating in the land use program is available at the Virginia Department of Taxation. Estimates apply to tax-year 2005.
1. Estimated net returns (loss) per acre applicable to tax-year 2005 (see Table 4 for more detail). Age of Trees Processed Fru ti Percent of To al /1/ t Fresh Fruit Percent of Total /1/ Pre-production aged trees (1 - 4 years) ($1,340.22) 7.0% ($1,427.11) 3.0% Early-production aged trees (5 - 10 years) ($713.30) 17.5% ($1,027.23) 7.5% Full-production aged trees (11 - 25 years) $553.86 35.0% ($40.44) 15.0% Late-production aged trees (26 - 30 years) $142.27 10.5% ($100.18) 4.5% 2 e a) 2003 /2/ . Weight d Average Net Return for 1997-2003.
$34.64 b) 2002 ($113.52) c) 2001 ($108.20) d) 2000 ($59.80) e) 1999 ($46.81) f) 1998 $88.77 g) 1997 $88.77 3 a) Net return to trees and land ("olympic" average o 2a thru 2g) /3/ . Net Returns
$0.00 f b) Net return attributable to land only (class III) /4/ $14.02 c) Net return attributable to trees only (3a - 3b) ($14.02) 5 a) Interest Rate . Capitalization Rate
0.0733 b) Property Tax 0.0061 c) Depreciation of Apple Trees /5 0.0333 / d) Depreciation of "Other" Trees 0.0500 e) Apple Orchard Capitalization Rate 0.1127 f) "Other" Orchard Capitalization Rate 0.1294 . Use Value of Apple Orchard and "Other" Orchard 6
APPL ORCHARDE "OTH R" ORCHARDE Land Class Orchard In ex /7/d Trees Only Trees and Land /8/ Trees Only Trees and Land /8/ I 0.80 ($99.48) $165.34 ($86.67) $178.16 II 1.00 ($124.35) $113.99 ($108.33) $130.01 III 1.00 ($124.35) $52.20 ($108.33) $68.22 IV 1.00 ($124.35) $16.89 ($108.33) $32.91 V 0.75 ($93.26) $12.67 ($81.25) $24.68 VI 0.60 ($74.61) $13.67 ($65.00) $23.27 VII 0.40 ($49.74) $3.23 ($43.33) $9.63 VIII 0.00 $0.00 $17.65 $0.00 $17.65
1/ These percentages assume that 70% of the fruit is produced for the processed market and 30% is produced for the fresh market. In addition, it is assumed that the orchard is 10% pre-production, 25% early production, 50% full production and 15% late 2/ This is the average net return of the eight orchard categories listed in section 1 of this table. The weights are provided by the percent of total trees represented by each category. 3/ In an olympic average, the highest and lowest values are dropped prior to calculating the arithmetic mean. 4/ This is determined by dividing the unadjusted net return value (Table 3 - Line 1) by the soil index factor (Table 3 - Section 4). 5/ The depreciation rate applicable to apple trees assumes that trees are replaced on a 30-year rotation. 6/ "Other" trees refers to peach, cherry, pear, and plum trees. The depreciation rate applicable to "other" trees assumes that trees are replaced on a 20-year rotation. 7/ The orchard index is applicable only in determining the value of the trees. The land index (Table 3 - Section 5) is applied to 8/ The use value of trees and land is determined by adding the appropriate without-risk- land-use-value (see Table 3 - Section5) to the use value of the trees. Table5:49

Table 5: Worksheet for estimating the use value of orchard land in Lynchburg 9/ The estimated net returns assume a planting density of 135 trees per acre. A complete listing of this table for each jurisdiction participating in the land use program is available at the Virginia Department of Taxation. Estimates apply to tax-year 2005.
1. Estimated net returns (loss) per acre applicable to tax-year 2005 (see Table 4 for more detail). Age of Trees Processed Fru ti Percent of To al /1/ t Fresh Fruit Percent of Total /1/ Pre-production aged trees (1 - 4 years) ($1,340.22) 7.0% ($1,427.11) 3.0% Early-production aged trees (5 - 10 years) ($713.30) 17.5% ($1,027.23) 7.5% Full-production aged trees (11 - 25 years) $553.86 35.0% ($40.44) 15.0% Late-production aged trees (26 - 30 years) $142.27 10.5% ($100.18) 4.5% 2 e a) 2003 /2/ . Weight d Average Net Return for 1997-2003.
$34.64 b) 2002 ($113.52) c) 2001 ($108.20) d) 2000 ($59.80) e) 1999 ($46.81) f) 1998 $88.77 g) 1997 $88.77 3 a) Net return to trees and land ("olympic" average o 2a thru 2g) /3/ . Net Returns
$0.00 f b) Net return attributable to land only (class III) /4/ $7.10 c) Net return attributable to trees only (3a - 3b) ($7.10) 5 a) Interest Rate . Capitalization Rate
0.0733 b) Property Tax 0.0101 c) Depreciation of Apple Trees /5 0.0333 / d) Depreciation of "Other" Trees 0.0500 e) Apple Orchard Capitalization Rate 0.1167 f) "Other" Orchard Capitalization Rate 0.1334 . Use Value of Apple Orchard and "Other" Orchard 6
APPL ORCHARDE "OTH R" ORCHARDE Land Class Orchard In ex /7/d Trees Only Trees and Land /8/ Trees Only Trees and Land /8/ I 0.80 ($48.69) $79.09 ($42.60) $85.18 II 1.00 ($60.86) $54.14 ($53.25) $61.75 III 1.00 ($60.86) $24.33 ($53.25) $31.93 IV 1.00 ($60.86) $7.29 ($53.25) $14.90 V 0.75 ($45.64) $5.47 ($39.94) $11.17 VI 0.60 ($36.52) $6.08 ($31.95) $10.64 VII 0.40 ($24.34) $1.21 ($21.30) $4.25 VIII 0.00 $0.00 $8.52 $0.00 $8.52
1/ These percentages assume that 70% of the fruit is produced for the processed market and 30% is produced for the fresh market. In addition, it is assumed that the orchard is 10% pre-production, 25% early production, 50% full production and 15% late 2/ This is the average net return of the eight orchard categories listed in section 1 of this table. The weights are provided by the percent of total trees represented by each category. 3/ In an olympic average, the highest and lowest values are dropped prior to calculating the arithmetic mean. 4/ This is determined by dividing the unadjusted net return value (Table 3 - Line 1) by the soil index factor (Table 3 - Section 4). 5/ The depreciation rate applicable to apple trees assumes that trees are replaced on a 30-year rotation. 6/ "Other" trees refers to peach, cherry, pear, and plum trees. The depreciation rate applicable to "other" trees assumes that trees are replaced on a 20-year rotation. 7/ The orchard index is applicable only in determining the value of the trees. The land index (Table 3 - Section 5) is applied to 8/ The use value of trees and land is determined by adding the appropriate without-risk- land-use-value (see Table 3 - Section5) to the use value of the trees. Table5:50

Table 5: Worksheet for estimating the use value of orchard land in Madison The estimated net returns assume a planting density of 135 trees per acre. A complete listing of this table for each jurisdiction participating in the land use program is available at the Virginia Department of Taxation. Estimates apply to tax-year 2005.
1. Estimated net returns (loss) per acre applicable to tax-year 2005 (see Table 4 for more detail). Age of Trees Processed Fru ti Percent of To al /1/ t Fresh Fruit Percent of Total /1/ Pre-production aged trees (1 - 4 years) ($1,340.22) 7.0% ($1,427.11) 3.0% Early-production aged trees (5 - 10 years) ($713.30) 17.5% ($1,027.23) 7.5% Full-production aged trees (11 - 25 years) $553.86 35.0% ($40.44) 15.0% Late-production aged trees (26 - 30 years) $142.27 10.5% ($100.18) 4.5% 2 e a) 2003 /2/ . Weight d Average Net Return for 1997-2003.
$34.64 b) 2002 ($113.52) c) 2001 ($108.20) d) 2000 ($59.80) e) 1999 ($46.81) f) 1998 $88.77 g) 1997 $88.77 3 a) Net return to trees and land ("olympic" average o 2a thru 2g) /3/ . Net Returns
$0.00 f b) Net return attributable to land only (class III) /4/ $30.08 c) Net return attributable to trees only (3a - 3b) ($30.08) 5 a) Interest Rate . Capitalization Rate
0.0733 b) Property Tax 0.0057 c) Depreciation of Apple Trees /5 0.0333 / d) Depreciation of "Other" Trees 0.0500 e) Apple Orchard Capitalization Rate 0.1123 f) "Other" Orchard Capitalization Rate 0.1290 . Use Value of Apple Orchard and "Other" Orchard 6
APPL ORCHARDE "OTH R" ORCHARDE Land Class Orchard In ex /7/d Trees Only Trees and Land /8/ Trees Only Trees and Land /8/ I 0.80 ($214.26) $357.04 ($186.57) $384.73 II 1.00 ($267.83) $246.35 ($233.22) $280.96 III 1.00 ($267.83) $113.04 ($233.22) $147.65 IV 1.00 ($267.83) $36.87 ($233.22) $71.48 V 0.75 ($200.87) $27.65 ($174.91) $53.61 VI 0.60 ($160.70) $29.74 ($139.93) $50.50 VII 0.40 ($107.13) $7.13 ($93.29) $20.97 VIII 0.00 $0.00 $38.09 $0.00 $38.09
1/ These percentages assume that 70% of the fruit is produced for the processed market and 30% is produced for the fresh market. In addition, it is assumed that the orchard is 10% pre-production, 25% early production, 50% full production and 15% late 2/ This is the average net return of the eight orchard categories listed in section 1 of this table. The weights are provided by the percent of total trees represented by each category. 3/ In an olympic average, the highest and lowest values are dropped prior to calculating the arithmetic mean. 4/ This is determined by dividing the unadjusted net return value (Table 3 - Line 1) by the soil index factor (Table 3 - Section 4). 5/ The depreciation rate applicable to apple trees assumes that trees are replaced on a 30-year rotation. 6/ "Other" trees refers to peach, cherry, pear, and plum trees. The depreciation rate applicable to "other" trees assumes that trees are replaced on a 20-year rotation. 7/ The orchard index is applicable only in determining the value of the trees. The land index (Table 3 - Section 5) is applied to 8/ The use value of trees and land is determined by adding the appropriate without-risk- land-use-value (see Table 3 - Section5) to the use value of the trees. Table5:51

Table 5: Worksheet for estimating the use value of orchard land in Manassas 10/ The estimated net returns assume a planting density of 135 trees per acre. A complete listing of this table for each jurisdiction participating in the land use program is available at the Virginia Department of Taxation. Estimates apply to tax-year 2005.
1. Estimated net returns (loss) per acre applicable to tax-year 2005 (see Table 4 for more detail). Age of Trees Processed Fru ti Percent of To al /1/ t Fresh Fruit Percent of Total /1/ Pre-production aged trees (1 - 4 years) ($1,340.22) 7.0% ($1,427.11) 3.0% Early-production aged trees (5 - 10 years) ($713.30) 17.5% ($1,027.23) 7.5% Full-production aged trees (11 - 25 years) $553.86 35.0% ($40.44) 15.0% Late-production aged trees (26 - 30 years) $142.27 10.5% ($100.18) 4.5% 2 e a) 2003 /2/ . Weight d Average Net Return for 1997-2003.
$34.64 b) 2002 ($113.52) c) 2001 ($108.20) d) 2000 ($59.80) e) 1999 ($46.81) f) 1998 $88.77 g) 1997 $88.77 3 a) Net return to trees and land ("olympic" average o 2a thru 2g) /3/ . Net Returns
$0.00 f b) Net return attributable to land only (class III) /4/ $13.98 c) Net return attributable to trees only (3a - 3b) ($13.98) 5 a) Interest Rate . Capitalization Rate
0.0733 b) Property Tax 0.0114 c) Depreciation of Apple Trees /5 0.0333 / d) Depreciation of "Other" Trees 0.0500 e) Apple Orchard Capitalization Rate 0.1180 f) "Other" Orchard Capitalization Rate 0.1347 . Use Value of Apple Orchard and "Other" Orchard 6
APPL ORCHARDE "OTH R" ORCHARDE Land Class Orchard In ex /7/d Trees Only Trees and Land /8/ Trees Only Trees and Land /8/ I 0.80 ($94.78) $152.87 ($83.05) $164.59 II 1.00 ($118.48) $104.41 ($103.82) $119.07 III 1.00 ($118.48) $46.62 ($103.82) $61.28 IV 1.00 ($118.48) $13.60 ($103.82) $28.26 V 0.75 ($88.86) $10.20 ($77.86) $21.20 VI 0.60 ($71.09) $11.46 ($62.29) $20.26 VII 0.40 ($47.39) $2.14 ($41.53) $8.00 VIII 0.00 $0.00 $16.51 $0.00 $16.51
1/ These percentages assume that 70% of the fruit is produced for the processed market and 30% is produced for the fresh market. In addition, it is assumed that the orchard is 10% pre-production, 25% early production, 50% full production and 15% late 2/ This is the average net return of the eight orchard categories listed in section 1 of this table. The weights are provided by the percent of total trees represented by each category. 3/ In an olympic average, the highest and lowest values are dropped prior to calculating the arithmetic mean. 4/ This is determined by dividing the unadjusted net return value (Table 3 - Line 1) by the soil index factor (Table 3 - Section 4). 5/ The depreciation rate applicable to apple trees assumes that trees are replaced on a 30-year rotation. 6/ "Other" trees refers to peach, cherry, pear, and plum trees. The depreciation rate applicable to "other" trees assumes that trees are replaced on a 20-year rotation. 7/ The orchard index is applicable only in determining the value of the trees. The land index (Table 3 - Section 5) is applied to 8/ The use value of trees and land is determined by adding the appropriate without-risk- land-use-value (see Table 3 - Section5) to the use value of the trees. Table5:52

Table 5: Worksheet for estimating the use value of orchard land in Middlesex The estimated net returns assume a planting density of 135 trees per acre. A complete listing of this table for each jurisdiction participating in the land use program is available at the Virginia Department of Taxation. Estimates apply to tax-year 2005.
1. Estimated net returns (loss) per acre applicable to tax-year 2005 (see Table 4 for more detail). Age of Trees Processed Fru ti Percent of To al /1/ t Fresh Fruit Percent of Total /1/ Pre-production aged trees (1 - 4 years) ($1,340.22) 7.0% ($1,427.11) 3.0% Early-production aged trees (5 - 10 years) ($713.30) 17.5% ($1,027.23) 7.5% Full-production aged trees (11 - 25 years) $553.86 35.0% ($40.44) 15.0% Late-production aged trees (26 - 30 years) $142.27 10.5% ($100.18) 4.5% 2 e a) 2003 /2/ . Weight d Average Net Return for 1997-2003.
$34.64 b) 2002 ($113.52) c) 2001 ($108.20) d) 2000 ($59.80) e) 1999 ($46.81) f) 1998 $88.77 g) 1997 $88.77 3 a) Net return to trees and land ("olympic" average o 2a thru 2g) /3/ . Net Returns
$0.00 f b) Net return attributable to land only (class III) /4/ $17.34 c) Net return attributable to trees only (3a - 3b) ($17.34) 5 a) Interest Rate . Capitalization Rate
0.0733 b) Property Tax 0.0047 c) Depreciation of Apple Trees /5 0.0333 / d) Depreciation of "Other" Trees 0.0500 e) Apple Orchard Capitalization Rate 0.1113 f) "Other" Orchard Capitalization Rate 0.1280 . Use Value of Apple Orchard and "Other" Orchard 6
APPL ORCHARDE "OTH R" ORCHARDE Land Class Orchard In ex /7/d Trees Only Trees and Land /8/ Trees Only Trees and Land /8/ I 0.80 ($124.62) $208.95 ($108.38) $225.18 II 1.00 ($155.77) $144.44 ($135.48) $164.73 III 1.00 ($155.77) $66.61 ($135.48) $86.90 IV 1.00 ($155.77) $22.13 ($135.48) $42.42 V 0.75 ($116.83) $16.60 ($101.61) $31.82 VI 0.60 ($93.46) $17.73 ($81.29) $29.90 VII 0.40 ($62.31) $4.40 ($54.19) $12.52 VIII 0.00 $0.00 $22.24 $0.00 $22.24
1/ These percentages assume that 70% of the fruit is produced for the processed market and 30% is produced for the fresh market. In addition, it is assumed that the orchard is 10% pre-production, 25% early production, 50% full production and 15% late 2/ This is the average net return of the eight orchard categories listed in section 1 of this table. The weights are provided by the percent of total trees represented by each category. 3/ In an olympic average, the highest and lowest values are dropped prior to calculating the arithmetic mean. 4/ This is determined by dividing the unadjusted net return value (Table 3 - Line 1) by the soil index factor (Table 3 - Section 4). 5/ The depreciation rate applicable to apple trees assumes that trees are replaced on a 30-year rotation. 6/ "Other" trees refers to peach, cherry, pear, and plum trees. The depreciation rate applicable to "other" trees assumes that trees are replaced on a 20-year rotation. 7/ The orchard index is applicable only in determining the value of the trees. The land index (Table 3 - Section 5) is applied to 8/ The use value of trees and land is determined by adding the appropriate without-risk- land-use-value (see Table 3 - Section5) to the use value of the trees. Table5:53

Table 5: Worksheet for estimating the use value of orchard land in Montgomery The estimated net returns assume a planting density of 135 trees per acre. A complete listing of this table for each jurisdiction participating in the land use program is available at the Virginia Department of Taxation. Estimates apply to tax-year 2005.
1. Estimated net returns (loss) per acre applicable to tax-year 2005 (see Table 4 for more detail). Age of Trees Processed Fru ti Percent of To al /1/ t Fresh Fruit Percent of Total /1/ Pre-production aged trees (1 - 4 years) ($1,340.22) 7.0% ($1,427.11) 3.0% Early-production aged trees (5 - 10 years) ($713.30) 17.5% ($1,027.23) 7.5% Full-production aged trees (11 - 25 years) $553.86 35.0% ($40.44) 15.0% Late-production aged trees (26 - 30 years) $142.27 10.5% ($100.18) 4.5% 2 e a) 2003 /2/ . Weight d Average Net Return for 1997-2003.
$34.64 b) 2002 ($113.52) c) 2001 ($108.20) d) 2000 ($59.80) e) 1999 ($46.81) f) 1998 $88.77 g) 1997 $88.77 3 a) Net return to trees and land ("olympic" average o 2a thru 2g) /3/ . Net Returns
$0.00 f b) Net return attributable to land only (class III) /4/ $21.81 c) Net return attributable to trees only (3a - 3b) ($21.81) 5 a) Interest Rate . Capitalization Rate
0.0733 b) Property Tax 0.0060 c) Depreciation of Apple Trees /5 0.0333 / d) Depreciation of "Other" Trees 0.0500 e) Apple Orchard Capitalization Rate 0.1126 f) "Other" Orchard Capitalization Rate 0.1293 . Use Value of Apple Orchard and "Other" Orchard 6
APPL ORCHARDE "OTH R" ORCHARDE Land Class Orchard In ex /7/d Trees Only Trees and Land /8/ Trees Only Trees and Land /8/ I 0.80 ($154.94) $257.74 ($134.96) $277.72 II 1.00 ($193.67) $177.74 ($168.70) $202.71 III 1.00 ($193.67) $81.45 ($168.70) $106.42 IV 1.00 ($193.67) $26.42 ($168.70) $51.39 V 0.75 ($145.26) $19.82 ($126.53) $38.54 VI 0.60 ($116.20) $21.36 ($101.22) $36.34 VII 0.40 ($77.47) $5.07 ($67.48) $15.05 VIII 0.00 $0.00 $27.51 $0.00 $27.51
1/ These percentages assume that 70% of the fruit is produced for the processed market and 30% is produced for the fresh market. In addition, it is assumed that the orchard is 10% pre-production, 25% early production, 50% full production and 15% late 2/ This is the average net return of the eight orchard categories listed in section 1 of this table. The weights are provided by the percent of total trees represented by each category. 3/ In an olympic average, the highest and lowest values are dropped prior to calculating the arithmetic mean. 4/ This is determined by dividing the unadjusted net return value (Table 3 - Line 1) by the soil index factor (Table 3 - Section 4). 5/ The depreciation rate applicable to apple trees assumes that trees are replaced on a 30-year rotation. 6/ "Other" trees refers to peach, cherry, pear, and plum trees. The depreciation rate applicable to "other" trees assumes that trees are replaced on a 20-year rotation. 7/ The orchard index is applicable only in determining the value of the trees. The land index (Table 3 - Section 5) is applied to 8/ The use value of trees and land is determined by adding the appropriate without-risk- land-use-value (see Table 3 - Section5) to the use value of the trees. Table5:54

Table 5: Worksheet for estimating the use value of orchard land in Nelson The estimated net returns assume a planting density of 135 trees per acre. A complete listing of this table for each jurisdiction participating in the land use program is available at the Virginia Department of Taxation. Estimates apply to tax-year 2005.
1. Estimated net returns (loss) per acre applicable to tax-year 2005 (see Table 4 for more detail). Age of Trees Processed Fru ti Percent of To al /1/ t Fresh Fruit Percent of Total /1/ Pre-production aged trees (1 - 4 years) ($1,340.22) 7.0% ($1,427.11) 3.0% Early-production aged trees (5 - 10 years) ($713.30) 17.5% ($1,027.23) 7.5% Full-production aged trees (11 - 25 years) $553.86 35.0% ($40.44) 15.0% Late-production aged trees (26 - 30 years) $142.27 10.5% ($100.18) 4.5% 2 e a) 2003 /2/ . Weight d Average Net Return for 1997-2003.
$34.64 b) 2002 ($113.52) c) 2001 ($108.20) d) 2000 ($59.80) e) 1999 ($46.81) f) 1998 $88.77 g) 1997 $88.77 3 a) Net return to trees and land ("olympic" average o 2a thru 2g) /3/ . Net Returns
$0.00 f b) Net return attributable to land only (class III) /4/ $3.77 c) Net return attributable to trees only (3a - 3b) ($3.77) 5 a) Interest Rate . Capitalization Rate
0.0733 b) Property Tax 0.0065 c) Depreciation of Apple Trees /5 0.0333 / d) Depreciation of "Other" Trees 0.0500 e) Apple Orchard Capitalization Rate 0.1132 f) "Other" Orchard Capitalization Rate 0.1298 . Use Value of Apple Orchard and "Other" Orchard 6
APPL ORCHARDE "OTH R" ORCHARDE Land Class Orchard In ex /7/d Trees Only Trees and Land /8/ Trees Only Trees and Land /8/ I 0.80 ($26.67) $44.22 ($23.25) $47.64 II 1.00 ($33.34) $30.46 ($29.06) $34.74 III 1.00 ($33.34) $13.92 ($29.06) $18.20 IV 1.00 ($33.34) $4.47 ($29.06) $8.75 V 0.75 ($25.00) $3.35 ($21.79) $6.56 VI 0.60 ($20.00) $3.63 ($17.43) $6.19 VII 0.40 ($13.33) $0.84 ($11.62) $2.55 VIII 0.00 $0.00 $4.73 $0.00 $4.73
1/ These percentages assume that 70% of the fruit is produced for the processed market and 30% is produced for the fresh market. In addition, it is assumed that the orchard is 10% pre-production, 25% early production, 50% full production and 15% late 2/ This is the average net return of the eight orchard categories listed in section 1 of this table. The weights are provided by the percent of total trees represented by each category. 3/ In an olympic average, the highest and lowest values are dropped prior to calculating the arithmetic mean. 4/ This is determined by dividing the unadjusted net return value (Table 3 - Line 1) by the soil index factor (Table 3 - Section 4). 5/ The depreciation rate applicable to apple trees assumes that trees are replaced on a 30-year rotation. 6/ "Other" trees refers to peach, cherry, pear, and plum trees. The depreciation rate applicable to "other" trees assumes that trees are replaced on a 20-year rotation. 7/ The orchard index is applicable only in determining the value of the trees. The land index (Table 3 - Section 5) is applied to 8/ The use value of trees and land is determined by adding the appropriate without-risk- land-use-value (see Table 3 - Section5) to the use value of the trees. Table5:55

Table 5: Worksheet for estimating the use value of orchard land in New Kent* 7/ The estimated net returns assume a planting density of 135 trees per acre. A complete listing of this table for each jurisdiction participating in the land use program is available at the Virginia Department of Taxation. Estimates apply to tax-year 2005.
1. Estimated net returns (loss) per acre applicable to tax-year 2005 (see Table 4 for more detail). Age of Trees Processed Fru ti Percent of To al /1/ t Fresh Fruit Percent of Total /1/ Pre-production aged trees (1 - 4 years) ($1,340.22) 7.0% ($1,427.11) 3.0% Early-production aged trees (5 - 10 years) ($713.30) 17.5% ($1,027.23) 7.5% Full-production aged trees (11 - 25 years) $553.86 35.0% ($40.44) 15.0% Late-production aged trees (26 - 30 years) $142.27 10.5% ($100.18) 4.5% 2 e a) 2003 /2/ . Weight d Average Net Return for 1997-2003.
$34.64 b) 2002 ($113.52) c) 2001 ($108.20) d) 2000 ($59.80) e) 1999 ($46.81) f) 1998 $88.77 g) 1997 $88.77 3 a) Net return to trees and land ("olympic" average o 2a thru 2g) /3/ . Net Returns
$0.00 f b) Net return attributable to land only (class III) /4/ $31.25 c) Net return attributable to trees only (3a - 3b) ($31.25) 5 a) Interest Rate . Capitalization Rate
0.0733 b) Property Tax 0.0070 c) Depreciation of Apple Trees /5 0.0333 / d) Depreciation of "Other" Trees 0.0500 e) Apple Orchard Capitalization Rate 0.1136 f) "Other" Orchard Capitalization Rate 0.1302 . Use Value of Apple Orchard and "Other" Orchard 6
APPL ORCHARDE "OTH R" ORCHARDE Land Class Orchard In ex /7/d Trees Only Trees and Land /8/ Trees Only Trees and Land /8/ I 0.80 ($220.11) $364.03 ($191.94) $392.20 II 1.00 ($275.14) $250.59 ($239.93) $285.80 III 1.00 ($275.14) $114.29 ($239.93) $149.50 IV 1.00 ($275.14) $36.40 ($239.93) $71.61 V 0.75 ($206.35) $27.30 ($179.95) $53.71 VI 0.60 ($165.08) $29.63 ($143.96) $50.76 VII 0.40 ($110.06) $6.77 ($95.97) $20.86 VIII 0.00 $0.00 $38.94 $0.00 $38.94
1/ These percentages assume that 70% of the fruit is produced for the processed market and 30% is produced for the fresh market. In addition, it is assumed that the orchard is 10% pre-production, 25% early production, 50% full production and 15% late 2/ This is the average net return of the eight orchard categories listed in section 1 of this table. The weights are provided by the percent of total trees represented by each category. 3/ In an olympic average, the highest and lowest values are dropped prior to calculating the arithmetic mean. 4/ This is determined by dividing the unadjusted net return value (Table 3 - Line 1) by the soil index factor (Table 3 - Section 4). 5/ The depreciation rate applicable to apple trees assumes that trees are replaced on a 30-year rotation. 6/ "Other" trees refers to peach, cherry, pear, and plum trees. The depreciation rate applicable to "other" trees assumes that trees are replaced on a 20-year rotation. 7/ The orchard index is applicable only in determining the value of the trees. The land index (Table 3 - Section 5) is applied to 8/ The use value of trees and land is determined by adding the appropriate without-risk- land-use-value (see Table 3 - Section5) to the use value of the trees. Table5:56
Agricu
ltural
/Foresta
l Dist
ricts
Only

Table 5: Worksheet for estimating the use value of orchard land in Newport News 7/ The estimated net returns assume a planting density of 135 trees per acre. A complete listing of this table for each jurisdiction participating in the land use program is available at the Virginia Department of Taxation. Estimates apply to tax-year 2005.
1. Estimated net returns (loss) per acre applicable to tax-year 2005 (see Table 4 for more detail). Age of Trees Processed Fru ti Percent of To al /1/ t Fresh Fruit Percent of Total /1/ Pre-production aged trees (1 - 4 years) ($1,340.22) 7.0% ($1,427.11) 3.0% Early-production aged trees (5 - 10 years) ($713.30) 17.5% ($1,027.23) 7.5% Full-production aged trees (11 - 25 years) $553.86 35.0% ($40.44) 15.0% Late-production aged trees (26 - 30 years) $142.27 10.5% ($100.18) 4.5% 2 e a) 2003 /2/ . Weight d Average Net Return for 1997-2003.
$34.64 b) 2002 ($113.52) c) 2001 ($108.20) d) 2000 ($59.80) e) 1999 ($46.81) f) 1998 $88.77 g) 1997 $88.77 3 a) Net return to trees and land ("olympic" average o 2a thru 2g) /3/ . Net Returns
$0.00 f b) Net return attributable to land only (class III) /4/ $31.25 c) Net return attributable to trees only (3a - 3b) ($31.25) 5 a) Interest Rate . Capitalization Rate
0.0733 b) Property Tax 0.0116 c) Depreciation of Apple Trees /5 0.0333 / d) Depreciation of "Other" Trees 0.0500 e) Apple Orchard Capitalization Rate 0.1182 f) "Other" Orchard Capitalization Rate 0.1348 . Use Value of Apple Orchard and "Other" Orchard 6
APPL ORCHARDE "OTH R" ORCHARDE Land Class Orchard In ex /7/d Trees Only Trees and Land /8/ Trees Only Trees and Land /8/ I 0.80 ($211.56) $340.98 ($185.41) $367.13 II 1.00 ($264.45) $232.83 ($231.76) $265.52 III 1.00 ($264.45) $103.91 ($231.76) $136.60 IV 1.00 ($264.45) $30.24 ($231.76) $62.92 V 0.75 ($198.34) $22.68 ($173.82) $47.19 VI 0.60 ($158.67) $25.51 ($139.06) $45.12 VII 0.40 ($105.78) $4.73 ($92.71) $17.80 VIII 0.00 $0.00 $36.84 $0.00 $36.84
1/ These percentages assume that 70% of the fruit is produced for the processed market and 30% is produced for the fresh market. In addition, it is assumed that the orchard is 10% pre-production, 25% early production, 50% full production and 15% late 2/ This is the average net return of the eight orchard categories listed in section 1 of this table. The weights are provided by the percent of total trees represented by each category. 3/ In an olympic average, the highest and lowest values are dropped prior to calculating the arithmetic mean. 4/ This is determined by dividing the unadjusted net return value (Table 3 - Line 1) by the soil index factor (Table 3 - Section 4). 5/ The depreciation rate applicable to apple trees assumes that trees are replaced on a 30-year rotation. 6/ "Other" trees refers to peach, cherry, pear, and plum trees. The depreciation rate applicable to "other" trees assumes that trees are replaced on a 20-year rotation. 7/ The orchard index is applicable only in determining the value of the trees. The land index (Table 3 - Section 5) is applied to 8/ The use value of trees and land is determined by adding the appropriate without-risk- land-use-value (see Table 3 - Section5) to the use value of the trees. Table5:57

Table 5: Worksheet for estimating the use value of orchard land in Northampton The estimated net returns assume a planting density of 135 trees per acre. A complete listing of this table for each jurisdiction participating in the land use program is available at the Virginia Department of Taxation. Estimates apply to tax-year 2005.
1. Estimated net returns (loss) per acre applicable to tax-year 2005 (see Table 4 for more detail). Age of Trees Processed Fru ti Percent of To al /1/ t Fresh Fruit Percent of Total /1/ Pre-production aged trees (1 - 4 years) ($1,340.22) 7.0% ($1,427.11) 3.0% Early-production aged trees (5 - 10 years) ($713.30) 17.5% ($1,027.23) 7.5% Full-production aged trees (11 - 25 years) $553.86 35.0% ($40.44) 15.0% Late-production aged trees (26 - 30 years) $142.27 10.5% ($100.18) 4.5% 2 e a) 2003 /2/ . Weight d Average Net Return for 1997-2003.
$34.64 b) 2002 ($113.52) c) 2001 ($108.20) d) 2000 ($59.80) e) 1999 ($46.81) f) 1998 $88.77 g) 1997 $88.77 3 a) Net return to trees and land ("olympic" average o 2a thru 2g) /3/ . Net Returns
$0.00 f b) Net return attributable to land only (class III) /4/ $46.45 c) Net return attributable to trees only (3a - 3b) ($46.45) 5 a) Interest Rate . Capitalization Rate
0.0733 b) Property Tax 0.0056 c) Depreciation of Apple Trees /5 0.0333 / d) Depreciation of "Other" Trees 0.0500 e) Apple Orchard Capitalization Rate 0.1122 f) "Other" Orchard Capitalization Rate 0.1289 . Use Value of Apple Orchard and "Other" Orchard 6
APPL ORCHARDE "OTH R" ORCHARDE Land Class Orchard In ex /7/d Trees Only Trees and Land /8/ Trees Only Trees and Land /8/ I 0.80 ($331.10) $552.01 ($288.29) $594.83 II 1.00 ($413.88) $380.92 ($360.36) $434.44 III 1.00 ($413.88) $174.86 ($360.36) $228.38 IV 1.00 ($413.88) $57.12 ($360.36) $110.63 V 0.75 ($310.41) $42.84 ($270.27) $82.97 VI 0.60 ($248.33) $46.04 ($216.22) $78.15 VII 0.40 ($165.55) $11.07 ($144.15) $32.48 VIII 0.00 $0.00 $58.87 $0.00 $58.87
1/ These percentages assume that 70% of the fruit is produced for the processed market and 30% is produced for the fresh market. In addition, it is assumed that the orchard is 10% pre-production, 25% early production, 50% full production and 15% late 2/ This is the average net return of the eight orchard categories listed in section 1 of this table. The weights are provided by the percent of total trees represented by each category. 3/ In an olympic average, the highest and lowest values are dropped prior to calculating the arithmetic mean. 4/ This is determined by dividing the unadjusted net return value (Table 3 - Line 1) by the soil index factor (Table 3 - Section 4). 5/ The depreciation rate applicable to apple trees assumes that trees are replaced on a 30-year rotation. 6/ "Other" trees refers to peach, cherry, pear, and plum trees. The depreciation rate applicable to "other" trees assumes that trees are replaced on a 20-year rotation. 7/ The orchard index is applicable only in determining the value of the trees. The land index (Table 3 - Section 5) is applied to 8/ The use value of trees and land is determined by adding the appropriate without-risk- land-use-value (see Table 3 - Section5) to the use value of the trees. Table5:58

Table 5: Worksheet for estimating the use value of orchard land in Northumberland The estimated net returns assume a planting density of 135 trees per acre. A complete listing of this table for each jurisdiction participating in the land use program is available at the Virginia Department of Taxation. Estimates apply to tax-year 2005.
1. Estimated net returns (loss) per acre applicable to tax-year 2005 (see Table 4 for more detail). Age of Trees Processed Fru ti Percent of To al /1/ t Fresh Fruit Percent of Total /1/ Pre-production aged trees (1 - 4 years) ($1,340.22) 7.0% ($1,427.11) 3.0% Early-production aged trees (5 - 10 years) ($713.30) 17.5% ($1,027.23) 7.5% Full-production aged trees (11 - 25 years) $553.86 35.0% ($40.44) 15.0% Late-production aged trees (26 - 30 years) $142.27 10.5% ($100.18) 4.5% 2 e a) 2003 /2/ . Weight d Average Net Return for 1997-2003.
$34.64 b) 2002 ($113.52) c) 2001 ($108.20) d) 2000 ($59.80) e) 1999 ($46.81) f) 1998 $88.77 g) 1997 $88.77 3 a) Net return to trees and land ("olympic" average o 2a thru 2g) /3/ . Net Returns
$0.00 f b) Net return attributable to land only (class III) /4/ $22.62 c) Net return attributable to trees only (3a - 3b) ($22.62) 5 a) Interest Rate . Capitalization Rate
0.0733 b) Property Tax 0.0048 c) Depreciation of Apple Trees /5 0.0333 / d) Depreciation of "Other" Trees 0.0500 e) Apple Orchard Capitalization Rate 0.1114 f) "Other" Orchard Capitalization Rate 0.1281 . Use Value of Apple Orchard and "Other" Orchard 6
APPL ORCHARDE "OTH R" ORCHARDE Land Class Orchard In ex /7/d Trees Only Trees and Land /8/ Trees Only Trees and Land /8/ I 0.80 ($162.36) $271.99 ($141.24) $293.11 II 1.00 ($202.95) $187.96 ($176.55) $214.37 III 1.00 ($202.95) $86.62 ($176.55) $113.02 IV 1.00 ($202.95) $28.70 ($176.55) $55.11 V 0.75 ($152.22) $21.53 ($132.41) $41.33 VI 0.60 ($121.77) $23.01 ($105.93) $38.86 VII 0.40 ($81.18) $5.69 ($70.62) $16.25 VIII 0.00 $0.00 $28.96 $0.00 $28.96
1/ These percentages assume that 70% of the fruit is produced for the processed market and 30% is produced for the fresh market. In addition, it is assumed that the orchard is 10% pre-production, 25% early production, 50% full production and 15% late 2/ This is the average net return of the eight orchard categories listed in section 1 of this table. The weights are provided by the percent of total trees represented by each category. 3/ In an olympic average, the highest and lowest values are dropped prior to calculating the arithmetic mean. 4/ This is determined by dividing the unadjusted net return value (Table 3 - Line 1) by the soil index factor (Table 3 - Section 4). 5/ The depreciation rate applicable to apple trees assumes that trees are replaced on a 30-year rotation. 6/ "Other" trees refers to peach, cherry, pear, and plum trees. The depreciation rate applicable to "other" trees assumes that trees are replaced on a 20-year rotation. 7/ The orchard index is applicable only in determining the value of the trees. The land index (Table 3 - Section 5) is applied to 8/ The use value of trees and land is determined by adding the appropriate without-risk- land-use-value (see Table 3 - Section5) to the use value of the trees. Table5:59

Table 5: Worksheet for estimating the use value of orchard land in Nottoway The estimated net returns assume a planting density of 135 trees per acre. A complete listing of this table for each jurisdiction participating in the land use program is available at the Virginia Department of Taxation. Estimates apply to tax-year 2005.
1. Estimated net returns (loss) per acre applicable to tax-year 2005 (see Table 4 for more detail). Age of Trees Processed Fru ti Percent of To al /1/ t Fresh Fruit Percent of Total /1/ Pre-production aged trees (1 - 4 years) ($1,340.22) 7.0% ($1,427.11) 3.0% Early-production aged trees (5 - 10 years) ($713.30) 17.5% ($1,027.23) 7.5% Full-production aged trees (11 - 25 years) $553.86 35.0% ($40.44) 15.0% Late-production aged trees (26 - 30 years) $142.27 10.5% ($100.18) 4.5% 2 e a) 2003 /2/ . Weight d Average Net Return for 1997-2003.
$34.64 b) 2002 ($113.52) c) 2001 ($108.20) d) 2000 ($59.80) e) 1999 ($46.81) f) 1998 $88.77 g) 1997 $88.77 3 a) Net return to trees and land ("olympic" average o 2a thru 2g) /3/ . Net Returns
$0.00 f b) Net return attributable to land only (class III) /4/ $7.83 c) Net return attributable to trees only (3a - 3b) ($7.83) 5 a) Interest Rate . Capitalization Rate
0.0733 b) Property Tax 0.0050 c) Depreciation of Apple Trees /5 0.0333 / d) Depreciation of "Other" Trees 0.0500 e) Apple Orchard Capitalization Rate 0.1116 f) "Other" Orchard Capitalization Rate 0.1283 . Use Value of Apple Orchard and "Other" Orchard 6
APPL ORCHARDE "OTH R" ORCHARDE Land Class Orchard In ex /7/d Trees Only Trees and Land /8/ Trees Only Trees and Land /8/ I 0.80 ($56.12) $93.92 ($48.83) $101.21 II 1.00 ($70.15) $64.88 ($61.03) $74.00 III 1.00 ($70.15) $29.88 ($61.03) $38.99 IV 1.00 ($70.15) $9.87 ($61.03) $18.99 V 0.75 ($52.61) $7.40 ($45.77) $14.24 VI 0.60 ($42.09) $7.92 ($36.62) $13.39 VII 0.40 ($28.06) $1.95 ($24.41) $5.59 VIII 0.00 $0.00 $10.00 $0.00 $10.00
1/ These percentages assume that 70% of the fruit is produced for the processed market and 30% is produced for the fresh market. In addition, it is assumed that the orchard is 10% pre-production, 25% early production, 50% full production and 15% late 2/ This is the average net return of the eight orchard categories listed in section 1 of this table. The weights are provided by the percent of total trees represented by each category. 3/ In an olympic average, the highest and lowest values are dropped prior to calculating the arithmetic mean. 4/ This is determined by dividing the unadjusted net return value (Table 3 - Line 1) by the soil index factor (Table 3 - Section 4). 5/ The depreciation rate applicable to apple trees assumes that trees are replaced on a 30-year rotation. 6/ "Other" trees refers to peach, cherry, pear, and plum trees. The depreciation rate applicable to "other" trees assumes that trees are replaced on a 20-year rotation. 7/ The orchard index is applicable only in determining the value of the trees. The land index (Table 3 - Section 5) is applied to 8/ The use value of trees and land is determined by adding the appropriate without-risk- land-use-value (see Table 3 - Section5) to the use value of the trees. Table5:60

Table 5: Worksheet for estimating the use value of orchard land in Orange The estimated net returns assume a planting density of 135 trees per acre. A complete listing of this table for each jurisdiction participating in the land use program is available at the Virginia Department of Taxation. Estimates apply to tax-year 2005.
1. Estimated net returns (loss) per acre applicable to tax-year 2005 (see Table 4 for more detail). Age of Trees Processed Fru ti Percent of To al /1/ t Fresh Fruit Percent of Total /1/ Pre-production aged trees (1 - 4 years) ($1,340.22) 7.0% ($1,427.11) 3.0% Early-production aged trees (5 - 10 years) ($713.30) 17.5% ($1,027.23) 7.5% Full-production aged trees (11 - 25 years) $553.86 35.0% ($40.44) 15.0% Late-production aged trees (26 - 30 years) $142.27 10.5% ($100.18) 4.5% 2 e a) 2003 /2/ . Weight d Average Net Return for 1997-2003.
$34.64 b) 2002 ($113.52) c) 2001 ($108.20) d) 2000 ($59.80) e) 1999 ($46.81) f) 1998 $88.77 g) 1997 $88.77 3 a) Net return to trees and land ("olympic" average o 2a thru 2g) /3/ . Net Returns
$0.00 f b) Net return attributable to land only (class III) /4/ $18.18 c) Net return attributable to trees only (3a - 3b) ($18.18) 5 a) Interest Rate . Capitalization Rate
0.0733 b) Property Tax 0.0062 c) Depreciation of Apple Trees /5 0.0333 / d) Depreciation of "Other" Trees 0.0500 e) Apple Orchard Capitalization Rate 0.1128 f) "Other" Orchard Capitalization Rate 0.1295 . Use Value of Apple Orchard and "Other" Orchard 6
APPL ORCHARDE "OTH R" ORCHARDE Land Class Orchard In ex /7/d Trees Only Trees and Land /8/ Trees Only Trees and Land /8/ I 0.80 ($128.87) $214.06 ($112.29) $230.64 II 1.00 ($161.09) $147.55 ($140.36) $168.28 III 1.00 ($161.09) $67.53 ($140.36) $88.26 IV 1.00 ($161.09) $21.81 ($140.36) $42.54 V 0.75 ($120.82) $16.35 ($105.27) $31.90 VI 0.60 ($96.65) $17.66 ($84.22) $30.09 VII 0.40 ($64.44) $4.15 ($56.14) $12.44 VIII 0.00 $0.00 $22.86 $0.00 $22.86
1/ These percentages assume that 70% of the fruit is produced for the processed market and 30% is produced for the fresh market. In addition, it is assumed that the orchard is 10% pre-production, 25% early production, 50% full production and 15% late 2/ This is the average net return of the eight orchard categories listed in section 1 of this table. The weights are provided by the percent of total trees represented by each category. 3/ In an olympic average, the highest and lowest values are dropped prior to calculating the arithmetic mean. 4/ This is determined by dividing the unadjusted net return value (Table 3 - Line 1) by the soil index factor (Table 3 - Section 4). 5/ The depreciation rate applicable to apple trees assumes that trees are replaced on a 30-year rotation. 6/ "Other" trees refers to peach, cherry, pear, and plum trees. The depreciation rate applicable to "other" trees assumes that trees are replaced on a 20-year rotation. 7/ The orchard index is applicable only in determining the value of the trees. The land index (Table 3 - Section 5) is applied to 8/ The use value of trees and land is determined by adding the appropriate without-risk- land-use-value (see Table 3 - Section5) to the use value of the trees. Table5:61

Table 5: Worksheet for estimating the use value of orchard land in Page The estimated net returns assume a planting density of 135 trees per acre. A complete listing of this table for each jurisdiction participating in the land use program is available at the Virginia Department of Taxation. Estimates apply to tax-year 2005.
1. Estimated net returns (loss) per acre applicable to tax-year 2005 (see Table 4 for more detail). Age of Trees Processed Fru ti Percent of To al /1/ t Fresh Fruit Percent of Total /1/ Pre-production aged trees (1 - 4 years) ($1,340.22) 7.0% ($1,427.11) 3.0% Early-production aged trees (5 - 10 years) ($713.30) 17.5% ($1,027.23) 7.5% Full-production aged trees (11 - 25 years) $553.86 35.0% ($40.44) 15.0% Late-production aged trees (26 - 30 years) $142.27 10.5% ($100.18) 4.5% 2 e a) 2003 /2/ . Weight d Average Net Return for 1997-2003.
$34.64 b) 2002 ($113.52) c) 2001 ($108.20) d) 2000 ($59.80) e) 1999 ($46.81) f) 1998 $88.77 g) 1997 $88.77 3 a) Net return to trees and land ("olympic" average o 2a thru 2g) /3/ . Net Returns
$0.00 f b) Net return attributable to land only (class III) /4/ $19.72 c) Net return attributable to trees only (3a - 3b) ($19.72) 5 a) Interest Rate . Capitalization Rate
0.0733 b) Property Tax 0.0053 c) Depreciation of Apple Trees /5 0.0333 / d) Depreciation of "Other" Trees 0.0500 e) Apple Orchard Capitalization Rate 0.1119 f) "Other" Orchard Capitalization Rate 0.1285 . Use Value of Apple Orchard and "Other" Orchard 6
APPL ORCHARDE "OTH R" ORCHARDE Land Class Orchard In ex /7/d Trees Only Trees and Land /8/ Trees Only Trees and Land /8/ I 0.80 ($141.01) $235.61 ($122.73) $253.89 II 1.00 ($176.26) $162.69 ($153.41) $185.55 III 1.00 ($176.26) $74.81 ($153.41) $97.67 IV 1.00 ($176.26) $24.60 ($153.41) $47.45 V 0.75 ($132.20) $18.45 ($115.06) $35.59 VI 0.60 ($105.76) $19.78 ($92.05) $33.49 VII 0.40 ($70.51) $4.82 ($61.36) $13.96 VIII 0.00 $0.00 $25.11 $0.00 $25.11
1/ These percentages assume that 70% of the fruit is produced for the processed market and 30% is produced for the fresh market. In addition, it is assumed that the orchard is 10% pre-production, 25% early production, 50% full production and 15% late 2/ This is the average net return of the eight orchard categories listed in section 1 of this table. The weights are provided by the percent of total trees represented by each category. 3/ In an olympic average, the highest and lowest values are dropped prior to calculating the arithmetic mean. 4/ This is determined by dividing the unadjusted net return value (Table 3 - Line 1) by the soil index factor (Table 3 - Section 4). 5/ The depreciation rate applicable to apple trees assumes that trees are replaced on a 30-year rotation. 6/ "Other" trees refers to peach, cherry, pear, and plum trees. The depreciation rate applicable to "other" trees assumes that trees are replaced on a 20-year rotation. 7/ The orchard index is applicable only in determining the value of the trees. The land index (Table 3 - Section 5) is applied to 8/ The use value of trees and land is determined by adding the appropriate without-risk- land-use-value (see Table 3 - Section5) to the use value of the trees. Table5:62

Table 5: Worksheet for estimating the use value of orchard land in Petersburg 5/ The estimated net returns assume a planting density of 135 trees per acre. A complete listing of this table for each jurisdiction participating in the land use program is available at the Virginia Department of Taxation. Estimates apply to tax-year 2005.
1. Estimated net returns (loss) per acre applicable to tax-year 2005 (see Table 4 for more detail). Age of Trees Processed Fru ti Percent of To al /1/ t Fresh Fruit Percent of Total /1/ Pre-production aged trees (1 - 4 years) ($1,340.22) 7.0% ($1,427.11) 3.0% Early-production aged trees (5 - 10 years) ($713.30) 17.5% ($1,027.23) 7.5% Full-production aged trees (11 - 25 years) $553.86 35.0% ($40.44) 15.0% Late-production aged trees (26 - 30 years) $142.27 10.5% ($100.18) 4.5% 2 e a) 2003 /2/ . Weight d Average Net Return for 1997-2003.
$34.64 b) 2002 ($113.52) c) 2001 ($108.20) d) 2000 ($59.80) e) 1999 ($46.81) f) 1998 $88.77 g) 1997 $88.77 3 a) Net return to trees and land ("olympic" average o 2a thru 2g) /3/ . Net Returns
$0.00 f b) Net return attributable to land only (class III) /4/ $15.08 c) Net return attributable to trees only (3a - 3b) ($15.08) 5 a) Interest Rate . Capitalization Rate
0.0733 b) Property Tax 0.0136 c) Depreciation of Apple Trees /5 0.0333 / d) Depreciation of "Other" Trees 0.0500 e) Apple Orchard Capitalization Rate 0.1202 f) "Other" Orchard Capitalization Rate 0.1369 . Use Value of Apple Orchard and "Other" Orchard 6
APPL ORCHARDE "OTH R" ORCHARDE Land Class Orchard In ex /7/d Trees Only Trees and Land /8/ Trees Only Trees and Land /8/ I 0.80 ($100.37) $160.05 ($88.15) $172.27 II 1.00 ($125.46) $108.91 ($110.18) $124.19 III 1.00 ($125.46) $48.15 ($110.18) $63.43 IV 1.00 ($125.46) $13.43 ($110.18) $28.71 V 0.75 ($94.10) $10.07 ($82.64) $21.53 VI 0.60 ($75.28) $11.53 ($66.11) $20.70 VII 0.40 ($50.19) $1.90 ($44.07) $8.01 VIII 0.00 $0.00 $17.36 $0.00 $17.36
1/ These percentages assume that 70% of the fruit is produced for the processed market and 30% is produced for the fresh market. In addition, it is assumed that the orchard is 10% pre-production, 25% early production, 50% full production and 15% late 2/ This is the average net return of the eight orchard categories listed in section 1 of this table. The weights are provided by the percent of total trees represented by each category. 3/ In an olympic average, the highest and lowest values are dropped prior to calculating the arithmetic mean. 4/ This is determined by dividing the unadjusted net return value (Table 3 - Line 1) by the soil index factor (Table 3 - Section 4). 5/ The depreciation rate applicable to apple trees assumes that trees are replaced on a 30-year rotation. 6/ "Other" trees refers to peach, cherry, pear, and plum trees. The depreciation rate applicable to "other" trees assumes that trees are replaced on a 20-year rotation. 7/ The orchard index is applicable only in determining the value of the trees. The land index (Table 3 - Section 5) is applied to 8/ The use value of trees and land is determined by adding the appropriate without-risk- land-use-value (see Table 3 - Section5) to the use value of the trees. Table5:63

Table 5: Worksheet for estimating the use value of orchard land in Pittsylvania The estimated net returns assume a planting density of 135 trees per acre. A complete listing of this table for each jurisdiction participating in the land use program is available at the Virginia Department of Taxation. Estimates apply to tax-year 2005.
1. Estimated net returns (loss) per acre applicable to tax-year 2005 (see Table 4 for more detail). Age of Trees Processed Fru ti Percent of To al /1/ t Fresh Fruit Percent of Total /1/ Pre-production aged trees (1 - 4 years) ($1,340.22) 7.0% ($1,427.11) 3.0% Early-production aged trees (5 - 10 years) ($713.30) 17.5% ($1,027.23) 7.5% Full-production aged trees (11 - 25 years) $553.86 35.0% ($40.44) 15.0% Late-production aged trees (26 - 30 years) $142.27 10.5% ($100.18) 4.5% 2 e a) 2003 /2/ . Weight d Average Net Return for 1997-2003.
$34.64 b) 2002 ($113.52) c) 2001 ($108.20) d) 2000 ($59.80) e) 1999 ($46.81) f) 1998 $88.77 g) 1997 $88.77 3 a) Net return to trees and land ("olympic" average o 2a thru 2g) /3/ . Net Returns
$0.00 f b) Net return attributable to land only (class III) /4/ $12.22 c) Net return attributable to trees only (3a - 3b) ($12.22) 5 a) Interest Rate . Capitalization Rate
0.0733 b) Property Tax 0.0046 c) Depreciation of Apple Trees /5 0.0333 / d) Depreciation of "Other" Trees 0.0500 e) Apple Orchard Capitalization Rate 0.1112 f) "Other" Orchard Capitalization Rate 0.1279 . Use Value of Apple Orchard and "Other" Orchard 6
APPL ORCHARDE "OTH R" ORCHARDE Land Class Orchard In ex /7/d Trees Only Trees and Land /8/ Trees Only Trees and Land /8/ I 0.80 ($87.95) $147.56 ($76.48) $159.02 II 1.00 ($109.93) $102.02 ($95.60) $116.35 III 1.00 ($109.93) $47.07 ($95.60) $61.40 IV 1.00 ($109.93) $15.67 ($95.60) $30.00 V 0.75 ($82.45) $11.75 ($71.70) $22.50 VI 0.60 ($65.96) $12.54 ($57.36) $21.14 VII 0.40 ($43.97) $3.13 ($38.24) $8.86 VIII 0.00 $0.00 $15.70 $0.00 $15.70
1/ These percentages assume that 70% of the fruit is produced for the processed market and 30% is produced for the fresh market. In addition, it is assumed that the orchard is 10% pre-production, 25% early production, 50% full production and 15% late 2/ This is the average net return of the eight orchard categories listed in section 1 of this table. The weights are provided by the percent of total trees represented by each category. 3/ In an olympic average, the highest and lowest values are dropped prior to calculating the arithmetic mean. 4/ This is determined by dividing the unadjusted net return value (Table 3 - Line 1) by the soil index factor (Table 3 - Section 4). 5/ The depreciation rate applicable to apple trees assumes that trees are replaced on a 30-year rotation. 6/ "Other" trees refers to peach, cherry, pear, and plum trees. The depreciation rate applicable to "other" trees assumes that trees are replaced on a 20-year rotation. 7/ The orchard index is applicable only in determining the value of the trees. The land index (Table 3 - Section 5) is applied to 8/ The use value of trees and land is determined by adding the appropriate without-risk- land-use-value (see Table 3 - Section5) to the use value of the trees. Table5:64

Table 5: Worksheet for estimating the use value of orchard land in Powhatan The estimated net returns assume a planting density of 135 trees per acre. A complete listing of this table for each jurisdiction participating in the land use program is available at the Virginia Department of Taxation. Estimates apply to tax-year 2005.
1. Estimated net returns (loss) per acre applicable to tax-year 2005 (see Table 4 for more detail). Age of Trees Processed Fru ti Percent of To al /1/ t Fresh Fruit Percent of Total /1/ Pre-production aged trees (1 - 4 years) ($1,340.22) 7.0% ($1,427.11) 3.0% Early-production aged trees (5 - 10 years) ($713.30) 17.5% ($1,027.23) 7.5% Full-production aged trees (11 - 25 years) $553.86 35.0% ($40.44) 15.0% Late-production aged trees (26 - 30 years) $142.27 10.5% ($100.18) 4.5% 2 e a) 2003 /2/ . Weight d Average Net Return for 1997-2003.
$34.64 b) 2002 ($113.52) c) 2001 ($108.20) d) 2000 ($59.80) e) 1999 ($46.81) f) 1998 $88.77 g) 1997 $88.77 3 a) Net return to trees and land ("olympic" average o 2a thru 2g) /3/ . Net Returns
$0.00 f b) Net return attributable to land only (class III) /4/ $9.77 c) Net return attributable to trees only (3a - 3b) ($9.77) 5 a) Interest Rate . Capitalization Rate
0.0733 b) Property Tax 0.0071 c) Depreciation of Apple Trees /5 0.0333 / d) Depreciation of "Other" Trees 0.0500 e) Apple Orchard Capitalization Rate 0.1137 f) "Other" Orchard Capitalization Rate 0.1304 . Use Value of Apple Orchard and "Other" Orchard 6
APPL ORCHARDE "OTH R" ORCHARDE Land Class Orchard In ex /7/d Trees Only Trees and Land /8/ Trees Only Trees and Land /8/ I 0.80 ($68.76) $113.65 ($59.97) $122.45 II 1.00 ($85.96) $78.22 ($74.97) $89.21 III 1.00 ($85.96) $35.66 ($74.97) $46.65 IV 1.00 ($85.96) $11.33 ($74.97) $22.32 V 0.75 ($64.47) $8.50 ($56.22) $16.74 VI 0.60 ($51.57) $9.23 ($44.98) $15.83 VII 0.40 ($34.38) $2.10 ($29.99) $6.50 VIII 0.00 $0.00 $12.16 $0.00 $12.16
1/ These percentages assume that 70% of the fruit is produced for the processed market and 30% is produced for the fresh market. In addition, it is assumed that the orchard is 10% pre-production, 25% early production, 50% full production and 15% late 2/ This is the average net return of the eight orchard categories listed in section 1 of this table. The weights are provided by the percent of total trees represented by each category. 3/ In an olympic average, the highest and lowest values are dropped prior to calculating the arithmetic mean. 4/ This is determined by dividing the unadjusted net return value (Table 3 - Line 1) by the soil index factor (Table 3 - Section 4). 5/ The depreciation rate applicable to apple trees assumes that trees are replaced on a 30-year rotation. 6/ "Other" trees refers to peach, cherry, pear, and plum trees. The depreciation rate applicable to "other" trees assumes that trees are replaced on a 20-year rotation. 7/ The orchard index is applicable only in determining the value of the trees. The land index (Table 3 - Section 5) is applied to 8/ The use value of trees and land is determined by adding the appropriate without-risk- land-use-value (see Table 3 - Section5) to the use value of the trees. Table5:65

Table 5: Worksheet for estimating the use value of orchard land in Prince Edward The estimated net returns assume a planting density of 135 trees per acre. A complete listing of this table for each jurisdiction participating in the land use program is available at the Virginia Department of Taxation. Estimates apply to tax-year 2005.
1. Estimated net returns (loss) per acre applicable to tax-year 2005 (see Table 4 for more detail). Age of Trees Processed Fru ti Percent of To al /1/ t Fresh Fruit Percent of Total /1/ Pre-production aged trees (1 - 4 years) ($1,340.22) 7.0% ($1,427.11) 3.0% Early-production aged trees (5 - 10 years) ($713.30) 17.5% ($1,027.23) 7.5% Full-production aged trees (11 - 25 years) $553.86 35.0% ($40.44) 15.0% Late-production aged trees (26 - 30 years) $142.27 10.5% ($100.18) 4.5% 2 e a) 2003 /2/ . Weight d Average Net Return for 1997-2003.
$34.64 b) 2002 ($113.52) c) 2001 ($108.20) d) 2000 ($59.80) e) 1999 ($46.81) f) 1998 $88.77 g) 1997 $88.77 3 a) Net return to trees and land ("olympic" average o 2a thru 2g) /3/ . Net Returns
$0.00 f b) Net return attributable to land only (class III) /4/ $18.72 c) Net return attributable to trees only (3a - 3b) ($18.72) 5 a) Interest Rate . Capitalization Rate
0.0733 b) Property Tax 0.0043 c) Depreciation of Apple Trees /5 0.0333 / d) Depreciation of "Other" Trees 0.0500 e) Apple Orchard Capitalization Rate 0.1109 f) "Other" Orchard Capitalization Rate 0.1276 . Use Value of Apple Orchard and "Other" Orchard 6
APPL ORCHARDE "OTH R" ORCHARDE Land Class Orchard In ex /7/d Trees Only Trees and Land /8/ Trees Only Trees and Land /8/ I 0.80 ($134.97) $226.79 ($117.35) $244.42 II 1.00 ($168.72) $156.87 ($146.68) $178.90 III 1.00 ($168.72) $72.46 ($146.68) $94.49 IV 1.00 ($168.72) $24.22 ($146.68) $46.26 V 0.75 ($126.54) $18.17 ($110.01) $34.69 VI 0.60 ($101.23) $19.36 ($88.01) $32.58 VII 0.40 ($67.49) $4.87 ($58.67) $13.68 VIII 0.00 $0.00 $24.12 $0.00 $24.12
1/ These percentages assume that 70% of the fruit is produced for the processed market and 30% is produced for the fresh market. In addition, it is assumed that the orchard is 10% pre-production, 25% early production, 50% full production and 15% late 2/ This is the average net return of the eight orchard categories listed in section 1 of this table. The weights are provided by the percent of total trees represented by each category. 3/ In an olympic average, the highest and lowest values are dropped prior to calculating the arithmetic mean. 4/ This is determined by dividing the unadjusted net return value (Table 3 - Line 1) by the soil index factor (Table 3 - Section 4). 5/ The depreciation rate applicable to apple trees assumes that trees are replaced on a 30-year rotation. 6/ "Other" trees refers to peach, cherry, pear, and plum trees. The depreciation rate applicable to "other" trees assumes that trees are replaced on a 20-year rotation. 7/ The orchard index is applicable only in determining the value of the trees. The land index (Table 3 - Section 5) is applied to 8/ The use value of trees and land is determined by adding the appropriate without-risk- land-use-value (see Table 3 - Section5) to the use value of the trees. Table5:66

Table 5: Worksheet for estimating the use value of orchard land in Prince George The estimated net returns assume a planting density of 135 trees per acre. A complete listing of this table for each jurisdiction participating in the land use program is available at the Virginia Department of Taxation. Estimates apply to tax-year 2005.
1. Estimated net returns (loss) per acre applicable to tax-year 2005 (see Table 4 for more detail). Age of Trees Processed Fru ti Percent of To al /1/ t Fresh Fruit Percent of Total /1/ Pre-production aged trees (1 - 4 years) ($1,340.22) 7.0% ($1,427.11) 3.0% Early-production aged trees (5 - 10 years) ($713.30) 17.5% ($1,027.23) 7.5% Full-production aged trees (11 - 25 years) $553.86 35.0% ($40.44) 15.0% Late-production aged trees (26 - 30 years) $142.27 10.5% ($100.18) 4.5% 2 e a) 2003 /2/ . Weight d Average Net Return for 1997-2003.
$34.64 b) 2002 ($113.52) c) 2001 ($108.20) d) 2000 ($59.80) e) 1999 ($46.81) f) 1998 $88.77 g) 1997 $88.77 3 a) Net return to trees and land ("olympic" average o 2a thru 2g) /3/ . Net Returns
$0.00 f b) Net return attributable to land only (class III) /4/ $15.08 c) Net return attributable to trees only (3a - 3b) ($15.08) 5 a) Interest Rate . Capitalization Rate
0.0733 b) Property Tax 0.0079 c) Depreciation of Apple Trees /5 0.0333 / d) Depreciation of "Other" Trees 0.0500 e) Apple Orchard Capitalization Rate 0.1145 f) "Other" Orchard Capitalization Rate 0.1312 . Use Value of Apple Orchard and "Other" Orchard 6
APPL ORCHARDE "OTH R" ORCHARDE Land Class Orchard In ex /7/d Trees Only Trees and Land /8/ Trees Only Trees and Land /8/ I 0.80 ($105.35) $173.29 ($91.96) $186.68 II 1.00 ($131.69) $119.09 ($114.95) $135.82 III 1.00 ($131.69) $54.07 ($114.95) $70.81 IV 1.00 ($131.69) $16.92 ($114.95) $33.65 V 0.75 ($98.76) $12.69 ($86.22) $25.24 VI 0.60 ($79.01) $13.87 ($68.97) $23.91 VII 0.40 ($52.67) $3.05 ($45.98) $9.75 VIII 0.00 $0.00 $18.58 $0.00 $18.58
1/ These percentages assume that 70% of the fruit is produced for the processed market and 30% is produced for the fresh market. In addition, it is assumed that the orchard is 10% pre-production, 25% early production, 50% full production and 15% late 2/ This is the average net return of the eight orchard categories listed in section 1 of this table. The weights are provided by the percent of total trees represented by each category. 3/ In an olympic average, the highest and lowest values are dropped prior to calculating the arithmetic mean. 4/ This is determined by dividing the unadjusted net return value (Table 3 - Line 1) by the soil index factor (Table 3 - Section 4). 5/ The depreciation rate applicable to apple trees assumes that trees are replaced on a 30-year rotation. 6/ "Other" trees refers to peach, cherry, pear, and plum trees. The depreciation rate applicable to "other" trees assumes that trees are replaced on a 20-year rotation. 7/ The orchard index is applicable only in determining the value of the trees. The land index (Table 3 - Section 5) is applied to 8/ The use value of trees and land is determined by adding the appropriate without-risk- land-use-value (see Table 3 - Section5) to the use value of the trees. Table5:67

Table 5: Worksheet for estimating the use value of orchard land in Prince William The estimated net returns assume a planting density of 135 trees per acre. A complete listing of this table for each jurisdiction participating in the land use program is available at the Virginia Department of Taxation. Estimates apply to tax-year 2005.
1. Estimated net returns (loss) per acre applicable to tax-year 2005 (see Table 4 for more detail). Age of Trees Processed Fru ti Percent of To al /1/ t Fresh Fruit Percent of Total /1/ Pre-production aged trees (1 - 4 years) ($1,340.22) 7.0% ($1,427.11) 3.0% Early-production aged trees (5 - 10 years) ($713.30) 17.5% ($1,027.23) 7.5% Full-production aged trees (11 - 25 years) $553.86 35.0% ($40.44) 15.0% Late-production aged trees (26 - 30 years) $142.27 10.5% ($100.18) 4.5% 2 e a) 2003 /2/ . Weight d Average Net Return for 1997-2003.
$34.64 b) 2002 ($113.52) c) 2001 ($108.20) d) 2000 ($59.80) e) 1999 ($46.81) f) 1998 $88.77 g) 1997 $88.77 3 a) Net return to trees and land ("olympic" average o 2a thru 2g) /3/ . Net Returns
$0.00 f b) Net return attributable to land only (class III) /4/ $13.98 c) Net return attributable to trees only (3a - 3b) ($13.98) 5 a) Interest Rate . Capitalization Rate
0.0733 b) Property Tax 0.0123 c) Depreciation of Apple Trees /5 0.0333 / d) Depreciation of "Other" Trees 0.0500 e) Apple Orchard Capitalization Rate 0.1189 f) "Other" Orchard Capitalization Rate 0.1356 . Use Value of Apple Orchard and "Other" Orchard 6
APPL ORCHARDE "OTH R" ORCHARDE Land Class Orchard In ex /7/d Trees Only Trees and Land /8/ Trees Only Trees and Land /8/ I 0.80 ($94.06) $150.98 ($82.50) $162.54 II 1.00 ($117.58) $102.96 ($103.13) $117.41 III 1.00 ($117.58) $45.78 ($103.13) $60.23 IV 1.00 ($117.58) $13.11 ($103.13) $27.56 V 0.75 ($88.18) $9.83 ($77.35) $20.67 VI 0.60 ($70.55) $11.13 ($61.88) $19.80 VII 0.40 ($47.03) $1.98 ($41.25) $7.76 VIII 0.00 $0.00 $16.34 $0.00 $16.34
1/ These percentages assume that 70% of the fruit is produced for the processed market and 30% is produced for the fresh market. In addition, it is assumed that the orchard is 10% pre-production, 25% early production, 50% full production and 15% late 2/ This is the average net return of the eight orchard categories listed in section 1 of this table. The weights are provided by the percent of total trees represented by each category. 3/ In an olympic average, the highest and lowest values are dropped prior to calculating the arithmetic mean. 4/ This is determined by dividing the unadjusted net return value (Table 3 - Line 1) by the soil index factor (Table 3 - Section 4). 5/ The depreciation rate applicable to apple trees assumes that trees are replaced on a 30-year rotation. 6/ "Other" trees refers to peach, cherry, pear, and plum trees. The depreciation rate applicable to "other" trees assumes that trees are replaced on a 20-year rotation. 7/ The orchard index is applicable only in determining the value of the trees. The land index (Table 3 - Section 5) is applied to 8/ The use value of trees and land is determined by adding the appropriate without-risk- land-use-value (see Table 3 - Section5) to the use value of the trees. Table5:68

Table 5: Worksheet for estimating the use value of orchard land in Pulaski The estimated net returns assume a planting density of 135 trees per acre. A complete listing of this table for each jurisdiction participating in the land use program is available at the Virginia Department of Taxation. Estimates apply to tax-year 2005.
1. Estimated net returns (loss) per acre applicable to tax-year 2005 (see Table 4 for more detail). Age of Trees Processed Fru ti Percent of To al /1/ t Fresh Fruit Percent of Total /1/ Pre-production aged trees (1 - 4 years) ($1,340.22) 7.0% ($1,427.11) 3.0% Early-production aged trees (5 - 10 years) ($713.30) 17.5% ($1,027.23) 7.5% Full-production aged trees (11 - 25 years) $553.86 35.0% ($40.44) 15.0% Late-production aged trees (26 - 30 years) $142.27 10.5% ($100.18) 4.5% 2 e a) 2003 /2/ . Weight d Average Net Return for 1997-2003.
$34.64 b) 2002 ($113.52) c) 2001 ($108.20) d) 2000 ($59.80) e) 1999 ($46.81) f) 1998 $88.77 g) 1997 $88.77 3 a) Net return to trees and land ("olympic" average o 2a thru 2g) /3/ . Net Returns
$0.00 f b) Net return attributable to land only (class III) /4/ $21.45 c) Net return attributable to trees only (3a - 3b) ($21.45) 5 a) Interest Rate . Capitalization Rate
0.0733 b) Property Tax 0.0055 c) Depreciation of Apple Trees /5 0.0333 / d) Depreciation of "Other" Trees 0.0500 e) Apple Orchard Capitalization Rate 0.1121 f) "Other" Orchard Capitalization Rate 0.1287 . Use Value of Apple Orchard and "Other" Orchard 6
APPL ORCHARDE "OTH R" ORCHARDE Land Class Orchard In ex /7/d Trees Only Trees and Land /8/ Trees Only Trees and Land /8/ I 0.80 ($153.12) $255.52 ($133.30) $275.34 II 1.00 ($191.40) $176.37 ($166.63) $201.15 III 1.00 ($191.40) $81.02 ($166.63) $105.80 IV 1.00 ($191.40) $26.54 ($166.63) $51.32 V 0.75 ($143.55) $19.90 ($124.97) $38.49 VI 0.60 ($114.84) $21.37 ($99.98) $36.24 VII 0.40 ($76.56) $5.17 ($66.65) $15.08 VIII 0.00 $0.00 $27.24 $0.00 $27.24
1/ These percentages assume that 70% of the fruit is produced for the processed market and 30% is produced for the fresh market. In addition, it is assumed that the orchard is 10% pre-production, 25% early production, 50% full production and 15% late 2/ This is the average net return of the eight orchard categories listed in section 1 of this table. The weights are provided by the percent of total trees represented by each category. 3/ In an olympic average, the highest and lowest values are dropped prior to calculating the arithmetic mean. 4/ This is determined by dividing the unadjusted net return value (Table 3 - Line 1) by the soil index factor (Table 3 - Section 4). 5/ The depreciation rate applicable to apple trees assumes that trees are replaced on a 30-year rotation. 6/ "Other" trees refers to peach, cherry, pear, and plum trees. The depreciation rate applicable to "other" trees assumes that trees are replaced on a 20-year rotation. 7/ The orchard index is applicable only in determining the value of the trees. The land index (Table 3 - Section 5) is applied to 8/ The use value of trees and land is determined by adding the appropriate without-risk- land-use-value (see Table 3 - Section5) to the use value of the trees. Table5:69

Table 5: Worksheet for estimating the use value of orchard land in Radford 11/ The estimated net returns assume a planting density of 135 trees per acre. A complete listing of this table for each jurisdiction participating in the land use program is available at the Virginia Department of Taxation. Estimates apply to tax-year 2005.
1. Estimated net returns (loss) per acre applicable to tax-year 2005 (see Table 4 for more detail). Age of Trees Processed Fru ti Percent of To al /1/ t Fresh Fruit Percent of Total /1/ Pre-production aged trees (1 - 4 years) ($1,340.22) 7.0% ($1,427.11) 3.0% Early-production aged trees (5 - 10 years) ($713.30) 17.5% ($1,027.23) 7.5% Full-production aged trees (11 - 25 years) $553.86 35.0% ($40.44) 15.0% Late-production aged trees (26 - 30 years) $142.27 10.5% ($100.18) 4.5% 2 e a) 2003 /2/ . Weight d Average Net Return for 1997-2003.
$34.64 b) 2002 ($113.52) c) 2001 ($108.20) d) 2000 ($59.80) e) 1999 ($46.81) f) 1998 $88.77 g) 1997 $88.77 3 a) Net return to trees and land ("olympic" average o 2a thru 2g) /3/ . Net Returns
$0.00 f b) Net return attributable to land only (class III) /4/ $21.81 c) Net return attributable to trees only (3a - 3b) ($21.81) 5 a) Interest Rate . Capitalization Rate
0.0733 b) Property Tax 0.0059 c) Depreciation of Apple Trees /5 0.0333 / d) Depreciation of "Other" Trees 0.0500 e) Apple Orchard Capitalization Rate 0.1126 f) "Other" Orchard Capitalization Rate 0.1292 . Use Value of Apple Orchard and "Other" Orchard 6
APPL ORCHARDE "OTH R" ORCHARDE Land Class Orchard In ex /7/d Trees Only Trees and Land /8/ Trees Only Trees and Land /8/ I 0.80 ($154.99) $257.89 ($135.00) $277.88 II 1.00 ($193.74) $177.86 ($168.76) $202.84 III 1.00 ($193.74) $81.52 ($168.76) $106.50 IV 1.00 ($193.74) $26.46 ($168.76) $51.45 V 0.75 ($145.31) $19.85 ($126.57) $38.59 VI 0.60 ($116.25) $21.38 ($101.25) $36.38 VII 0.40 ($77.50) $5.08 ($67.50) $15.08 VIII 0.00 $0.00 $27.53 $0.00 $27.53
1/ These percentages assume that 70% of the fruit is produced for the processed market and 30% is produced for the fresh market. In addition, it is assumed that the orchard is 10% pre-production, 25% early production, 50% full production and 15% late 2/ This is the average net return of the eight orchard categories listed in section 1 of this table. The weights are provided by the percent of total trees represented by each category. 3/ In an olympic average, the highest and lowest values are dropped prior to calculating the arithmetic mean. 4/ This is determined by dividing the unadjusted net return value (Table 3 - Line 1) by the soil index factor (Table 3 - Section 4). 5/ The depreciation rate applicable to apple trees assumes that trees are replaced on a 30-year rotation. 6/ "Other" trees refers to peach, cherry, pear, and plum trees. The depreciation rate applicable to "other" trees assumes that trees are replaced on a 20-year rotation. 7/ The orchard index is applicable only in determining the value of the trees. The land index (Table 3 - Section 5) is applied to 8/ The use value of trees and land is determined by adding the appropriate without-risk- land-use-value (see Table 3 - Section5) to the use value of the trees. Table5:70

Table 5: Worksheet for estimating the use value of orchard land in Rappahannock The estimated net returns assume a planting density of 135 trees per acre. A complete listing of this table for each jurisdiction participating in the land use program is available at the Virginia Department of Taxation. Estimates apply to tax-year 2005.
1. Estimated net returns (loss) per acre applicable to tax-year 2005 (see Table 4 for more detail). Age of Trees Processed Fru ti Percent of To al /1/ t Fresh Fruit Percent of Total /1/ Pre-production aged trees (1 - 4 years) ($1,340.22) 7.0% ($1,427.11) 3.0% Early-production aged trees (5 - 10 years) ($713.30) 17.5% ($1,027.23) 7.5% Full-production aged trees (11 - 25 years) $553.86 35.0% ($40.44) 15.0% Late-production aged trees (26 - 30 years) $142.27 10.5% ($100.18) 4.5% 2 e a) 2003 /2/ . Weight d Average Net Return for 1997-2003.
$34.64 b) 2002 ($113.52) c) 2001 ($108.20) d) 2000 ($59.80) e) 1999 ($46.81) f) 1998 $88.77 g) 1997 $88.77 3 a) Net return to trees and land ("olympic" average o 2a thru 2g) /3/ . Net Returns
$0.00 f b) Net return attributable to land only (class III) /4/ $10.43 c) Net return attributable to trees only (3a - 3b) ($10.43) 5 a) Interest Rate . Capitalization Rate
0.0733 b) Property Tax 0.0069 c) Depreciation of Apple Trees /5 0.0333 / d) Depreciation of "Other" Trees 0.0500 e) Apple Orchard Capitalization Rate 0.1135 f) "Other" Orchard Capitalization Rate 0.1302 . Use Value of Apple Orchard and "Other" Orchard 6
APPL ORCHARDE "OTH R" ORCHARDE Land Class Orchard In ex /7/d Trees Only Trees and Land /8/ Trees Only Trees and Land /8/ I 0.80 ($73.47) $121.55 ($64.06) $130.96 II 1.00 ($91.84) $83.68 ($80.08) $95.44 III 1.00 ($91.84) $38.18 ($80.08) $49.93 IV 1.00 ($91.84) $12.17 ($80.08) $23.93 V 0.75 ($68.88) $9.13 ($60.06) $17.95 VI 0.60 ($55.10) $9.90 ($48.05) $16.96 VII 0.40 ($36.73) $2.27 ($32.03) $6.97 VIII 0.00 $0.00 $13.00 $0.00 $13.00
1/ These percentages assume that 70% of the fruit is produced for the processed market and 30% is produced for the fresh market. In addition, it is assumed that the orchard is 10% pre-production, 25% early production, 50% full production and 15% late 2/ This is the average net return of the eight orchard categories listed in section 1 of this table. The weights are provided by the percent of total trees represented by each category. 3/ In an olympic average, the highest and lowest values are dropped prior to calculating the arithmetic mean. 4/ This is determined by dividing the unadjusted net return value (Table 3 - Line 1) by the soil index factor (Table 3 - Section 4). 5/ The depreciation rate applicable to apple trees assumes that trees are replaced on a 30-year rotation. 6/ "Other" trees refers to peach, cherry, pear, and plum trees. The depreciation rate applicable to "other" trees assumes that trees are replaced on a 20-year rotation. 7/ The orchard index is applicable only in determining the value of the trees. The land index (Table 3 - Section 5) is applied to 8/ The use value of trees and land is determined by adding the appropriate without-risk- land-use-value (see Table 3 - Section5) to the use value of the trees. Table5:71

Table 5: Worksheet for estimating the use value of orchard land in Richmond The estimated net returns assume a planting density of 135 trees per acre. A complete listing of this table for each jurisdiction participating in the land use program is available at the Virginia Department of Taxation. Estimates apply to tax-year 2005.
1. Estimated net returns (loss) per acre applicable to tax-year 2005 (see Table 4 for more detail). Age of Trees Processed Fru ti Percent of To al /1/ t Fresh Fruit Percent of Total /1/ Pre-production aged trees (1 - 4 years) ($1,340.22) 7.0% ($1,427.11) 3.0% Early-production aged trees (5 - 10 years) ($713.30) 17.5% ($1,027.23) 7.5% Full-production aged trees (11 - 25 years) $553.86 35.0% ($40.44) 15.0% Late-production aged trees (26 - 30 years) $142.27 10.5% ($100.18) 4.5% 2 e a) 2003 /2/ . Weight d Average Net Return for 1997-2003.
$34.64 b) 2002 ($113.52) c) 2001 ($108.20) d) 2000 ($59.80) e) 1999 ($46.81) f) 1998 $88.77 g) 1997 $88.77 3 a) Net return to trees and land ("olympic" average o 2a thru 2g) /3/ . Net Returns
$0.00 f b) Net return attributable to land only (class III) /4/ $16.62 c) Net return attributable to trees only (3a - 3b) ($16.62) 5 a) Interest Rate . Capitalization Rate
0.0733 b) Property Tax 0.0060 c) Depreciation of Apple Trees /5 0.0333 / d) Depreciation of "Other" Trees 0.0500 e) Apple Orchard Capitalization Rate 0.1126 f) "Other" Orchard Capitalization Rate 0.1292 . Use Value of Apple Orchard and "Other" Orchard 6
APPL ORCHARDE "OTH R" ORCHARDE Land Class Orchard In ex /7/d Trees Only Trees and Land /8/ Trees Only Trees and Land /8/ I 0.80 ($118.11) $196.50 ($102.88) $211.73 II 1.00 ($147.64) $135.51 ($128.60) $154.55 III 1.00 ($147.64) $62.10 ($128.60) $81.14 IV 1.00 ($147.64) $20.15 ($128.60) $39.19 V 0.75 ($110.73) $15.12 ($96.45) $29.39 VI 0.60 ($88.58) $16.29 ($77.16) $27.71 VII 0.40 ($59.05) $3.87 ($51.44) $11.48 VIII 0.00 $0.00 $20.97 $0.00 $20.97
1/ These percentages assume that 70% of the fruit is produced for the processed market and 30% is produced for the fresh market. In addition, it is assumed that the orchard is 10% pre-production, 25% early production, 50% full production and 15% late 2/ This is the average net return of the eight orchard categories listed in section 1 of this table. The weights are provided by the percent of total trees represented by each category. 3/ In an olympic average, the highest and lowest values are dropped prior to calculating the arithmetic mean. 4/ This is determined by dividing the unadjusted net return value (Table 3 - Line 1) by the soil index factor (Table 3 - Section 4). 5/ The depreciation rate applicable to apple trees assumes that trees are replaced on a 30-year rotation. 6/ "Other" trees refers to peach, cherry, pear, and plum trees. The depreciation rate applicable to "other" trees assumes that trees are replaced on a 20-year rotation. 7/ The orchard index is applicable only in determining the value of the trees. The land index (Table 3 - Section 5) is applied to 8/ The use value of trees and land is determined by adding the appropriate without-risk- land-use-value (see Table 3 - Section5) to the use value of the trees. Table5:72

Table 5: Worksheet for estimating the use value of orchard land in Roanoke The estimated net returns assume a planting density of 135 trees per acre. A complete listing of this table for each jurisdiction participating in the land use program is available at the Virginia Department of Taxation. Estimates apply to tax-year 2005.
1. Estimated net returns (loss) per acre applicable to tax-year 2005 (see Table 4 for more detail). Age of Trees Processed Fru ti Percent of To al /1/ t Fresh Fruit Percent of Total /1/ Pre-production aged trees (1 - 4 years) ($1,340.22) 7.0% ($1,427.11) 3.0% Early-production aged trees (5 - 10 years) ($713.30) 17.5% ($1,027.23) 7.5% Full-production aged trees (11 - 25 years) $553.86 35.0% ($40.44) 15.0% Late-production aged trees (26 - 30 years) $142.27 10.5% ($100.18) 4.5% 2 e a) 2003 /2/ . Weight d Average Net Return for 1997-2003.
$34.64 b) 2002 ($113.52) c) 2001 ($108.20) d) 2000 ($59.80) e) 1999 ($46.81) f) 1998 $88.77 g) 1997 $88.77 3 a) Net return to trees and land ("olympic" average o 2a thru 2g) /3/ . Net Returns
$0.00 f b) Net return attributable to land only (class III) /4/ $15.70 c) Net return attributable to trees only (3a - 3b) ($15.70) 5 a) Interest Rate . Capitalization Rate
0.0733 b) Property Tax 0.0102 c) Depreciation of Apple Trees /5 0.0333 / d) Depreciation of "Other" Trees 0.0500 e) Apple Orchard Capitalization Rate 0.1168 f) "Other" Orchard Capitalization Rate 0.1335 . Use Value of Apple Orchard and "Other" Orchard 6
APPL ORCHARDE "OTH R" ORCHARDE Land Class Orchard In ex /7/d Trees Only Trees and Land /8/ Trees Only Trees and Land /8/ I 0.80 ($107.48) $174.48 ($94.06) $187.89 II 1.00 ($134.35) $119.41 ($117.58) $136.18 III 1.00 ($134.35) $53.62 ($117.58) $70.39 IV 1.00 ($134.35) $16.03 ($117.58) $32.80 V 0.75 ($100.76) $12.02 ($88.18) $24.60 VI 0.60 ($80.61) $13.38 ($70.55) $23.44 VII 0.40 ($53.74) $2.65 ($47.03) $9.36 VIII 0.00 $0.00 $18.80 $0.00 $18.80
1/ These percentages assume that 70% of the fruit is produced for the processed market and 30% is produced for the fresh market. In addition, it is assumed that the orchard is 10% pre-production, 25% early production, 50% full production and 15% late 2/ This is the average net return of the eight orchard categories listed in section 1 of this table. The weights are provided by the percent of total trees represented by each category. 3/ In an olympic average, the highest and lowest values are dropped prior to calculating the arithmetic mean. 4/ This is determined by dividing the unadjusted net return value (Table 3 - Line 1) by the soil index factor (Table 3 - Section 4). 5/ The depreciation rate applicable to apple trees assumes that trees are replaced on a 30-year rotation. 6/ "Other" trees refers to peach, cherry, pear, and plum trees. The depreciation rate applicable to "other" trees assumes that trees are replaced on a 20-year rotation. 7/ The orchard index is applicable only in determining the value of the trees. The land index (Table 3 - Section 5) is applied to 8/ The use value of trees and land is determined by adding the appropriate without-risk- land-use-value (see Table 3 - Section5) to the use value of the trees. Table5:73

Table 5: Worksheet for estimating the use value of orchard land in Roanoke City 12/ The estimated net returns assume a planting density of 135 trees per acre. A complete listing of this table for each jurisdiction participating in the land use program is available at the Virginia Department of Taxation. Estimates apply to tax-year 2005.
1. Estimated net returns (loss) per acre applicable to tax-year 2005 (see Table 4 for more detail). Age of Trees Processed Fru ti Percent of To al /1/ t Fresh Fruit Percent of Total /1/ Pre-production aged trees (1 - 4 years) ($1,340.22) 7.0% ($1,427.11) 3.0% Early-production aged trees (5 - 10 years) ($713.30) 17.5% ($1,027.23) 7.5% Full-production aged trees (11 - 25 years) $553.86 35.0% ($40.44) 15.0% Late-production aged trees (26 - 30 years) $142.27 10.5% ($100.18) 4.5% 2 e a) 2003 /2/ . Weight d Average Net Return for 1997-2003.
$34.64 b) 2002 ($113.52) c) 2001 ($108.20) d) 2000 ($59.80) e) 1999 ($46.81) f) 1998 $88.77 g) 1997 $88.77 3 a) Net return to trees and land ("olympic" average o 2a thru 2g) /3/ . Net Returns
$0.00 f b) Net return attributable to land only (class III) /4/ $15.70 c) Net return attributable to trees only (3a - 3b) ($15.70) 5 a) Interest Rate . Capitalization Rate
0.0733 b) Property Tax 0.0113 c) Depreciation of Apple Trees /5 0.0333 / d) Depreciation of "Other" Trees 0.0500 e) Apple Orchard Capitalization Rate 0.1179 f) "Other" Orchard Capitalization Rate 0.1346 . Use Value of Apple Orchard and "Other" Orchard 6
APPL ORCHARDE "OTH R" ORCHARDE Land Class Orchard In ex /7/d Trees Only Trees and Land /8/ Trees Only Trees and Land /8/ I 0.80 ($106.52) $171.93 ($93.33) $185.13 II 1.00 ($133.15) $117.46 ($116.66) $133.95 III 1.00 ($133.15) $52.48 ($116.66) $68.98 IV 1.00 ($133.15) $15.36 ($116.66) $31.85 V 0.75 ($99.86) $11.52 ($87.49) $23.89 VI 0.60 ($79.89) $12.93 ($70.00) $22.82 VII 0.40 ($53.26) $2.43 ($46.66) $9.03 VIII 0.00 $0.00 $18.56 $0.00 $18.56
1/ These percentages assume that 70% of the fruit is produced for the processed market and 30% is produced for the fresh market. In addition, it is assumed that the orchard is 10% pre-production, 25% early production, 50% full production and 15% late 2/ This is the average net return of the eight orchard categories listed in section 1 of this table. The weights are provided by the percent of total trees represented by each category. 3/ In an olympic average, the highest and lowest values are dropped prior to calculating the arithmetic mean. 4/ This is determined by dividing the unadjusted net return value (Table 3 - Line 1) by the soil index factor (Table 3 - Section 4). 5/ The depreciation rate applicable to apple trees assumes that trees are replaced on a 30-year rotation. 6/ "Other" trees refers to peach, cherry, pear, and plum trees. The depreciation rate applicable to "other" trees assumes that trees are replaced on a 20-year rotation. 7/ The orchard index is applicable only in determining the value of the trees. The land index (Table 3 - Section 5) is applied to 8/ The use value of trees and land is determined by adding the appropriate without-risk- land-use-value (see Table 3 - Section5) to the use value of the trees. Table5:74

Table 5: Worksheet for estimating the use value of orchard land in Rockbridge The estimated net returns assume a planting density of 135 trees per acre. A complete listing of this table for each jurisdiction participating in the land use program is available at the Virginia Department of Taxation. Estimates apply to tax-year 2005.
1. Estimated net returns (loss) per acre applicable to tax-year 2005 (see Table 4 for more detail). Age of Trees Processed Fru ti Percent of To al /1/ t Fresh Fruit Percent of Total /1/ Pre-production aged trees (1 - 4 years) ($1,340.22) 7.0% ($1,427.11) 3.0% Early-production aged trees (5 - 10 years) ($713.30) 17.5% ($1,027.23) 7.5% Full-production aged trees (11 - 25 years) $553.86 35.0% ($40.44) 15.0% Late-production aged trees (26 - 30 years) $142.27 10.5% ($100.18) 4.5% 2 e a) 2003 /2/ . Weight d Average Net Return for 1997-2003.
$34.64 b) 2002 ($113.52) c) 2001 ($108.20) d) 2000 ($59.80) e) 1999 ($46.81) f) 1998 $88.77 g) 1997 $88.77 3 a) Net return to trees and land ("olympic" average o 2a thru 2g) /3/ . Net Returns
$0.00 f b) Net return attributable to land only (class III) /4/ $11.10 c) Net return attributable to trees only (3a - 3b) ($11.10) 5 a) Interest Rate . Capitalization Rate
0.0733 b) Property Tax 0.0051 c) Depreciation of Apple Trees /5 0.0333 / d) Depreciation of "Other" Trees 0.0500 e) Apple Orchard Capitalization Rate 0.1117 f) "Other" Orchard Capitalization Rate 0.1284 . Use Value of Apple Orchard and "Other" Orchard 6
APPL ORCHARDE "OTH R" ORCHARDE Land Class Orchard In ex /7/d Trees Only Trees and Land /8/ Trees Only Trees and Land /8/ I 0.80 ($79.50) $132.98 ($69.18) $143.30 II 1.00 ($99.38) $91.86 ($86.47) $104.76 III 1.00 ($99.38) $42.28 ($86.47) $55.18 IV 1.00 ($99.38) $13.95 ($86.47) $26.85 V 0.75 ($74.53) $10.46 ($64.86) $20.14 VI 0.60 ($59.63) $11.20 ($51.88) $18.94 VII 0.40 ($39.75) $2.75 ($34.59) $7.91 VIII 0.00 $0.00 $14.17 $0.00 $14.17
1/ These percentages assume that 70% of the fruit is produced for the processed market and 30% is produced for the fresh market. In addition, it is assumed that the orchard is 10% pre-production, 25% early production, 50% full production and 15% late 2/ This is the average net return of the eight orchard categories listed in section 1 of this table. The weights are provided by the percent of total trees represented by each category. 3/ In an olympic average, the highest and lowest values are dropped prior to calculating the arithmetic mean. 4/ This is determined by dividing the unadjusted net return value (Table 3 - Line 1) by the soil index factor (Table 3 - Section 4). 5/ The depreciation rate applicable to apple trees assumes that trees are replaced on a 30-year rotation. 6/ "Other" trees refers to peach, cherry, pear, and plum trees. The depreciation rate applicable to "other" trees assumes that trees are replaced on a 20-year rotation. 7/ The orchard index is applicable only in determining the value of the trees. The land index (Table 3 - Section 5) is applied to 8/ The use value of trees and land is determined by adding the appropriate without-risk- land-use-value (see Table 3 - Section5) to the use value of the trees. Table5:75

Table 5: Worksheet for estimating the use value of orchard land in Rockingham The estimated net returns assume a planting density of 135 trees per acre. A complete listing of this table for each jurisdiction participating in the land use program is available at the Virginia Department of Taxation. Estimates apply to tax-year 2005.
1. Estimated net returns (loss) per acre applicable to tax-year 2005 (see Table 4 for more detail). Age of Trees Processed Fru ti Percent of To al /1/ t Fresh Fruit Percent of Total /1/ Pre-production aged trees (1 - 4 years) ($1,340.22) 7.0% ($1,427.11) 3.0% Early-production aged trees (5 - 10 years) ($713.30) 17.5% ($1,027.23) 7.5% Full-production aged trees (11 - 25 years) $553.86 35.0% ($40.44) 15.0% Late-production aged trees (26 - 30 years) $142.27 10.5% ($100.18) 4.5% 2 e a) 2003 /2/ . Weight d Average Net Return for 1997-2003.
$34.64 b) 2002 ($113.52) c) 2001 ($108.20) d) 2000 ($59.80) e) 1999 ($46.81) f) 1998 $88.77 g) 1997 $88.77 3 a) Net return to trees and land ("olympic" average o 2a thru 2g) /3/ . Net Returns
$0.00 f b) Net return attributable to land only (class III) /4/ $32.78 c) Net return attributable to trees only (3a - 3b) ($32.78) 5 a) Interest Rate . Capitalization Rate
0.0733 b) Property Tax 0.0061 c) Depreciation of Apple Trees /5 0.0333 / d) Depreciation of "Other" Trees 0.0500 e) Apple Orchard Capitalization Rate 0.1127 f) "Other" Orchard Capitalization Rate 0.1293 . Use Value of Apple Orchard and "Other" Orchard 6
APPL ORCHARDE "OTH R" ORCHARDE Land Class Orchard In ex /7/d Trees Only Trees and Land /8/ Trees Only Trees and Land /8/ I 0.80 ($232.74) $386.97 ($202.75) $416.96 II 1.00 ($290.92) $266.82 ($253.44) $304.30 III 1.00 ($290.92) $122.22 ($253.44) $159.70 IV 1.00 ($290.92) $39.59 ($253.44) $77.08 V 0.75 ($218.19) $29.69 ($190.08) $57.81 VI 0.60 ($174.55) $32.02 ($152.06) $54.51 VII 0.40 ($116.37) $7.57 ($101.37) $22.57 VIII 0.00 $0.00 $41.31 $0.00 $41.31
1/ These percentages assume that 70% of the fruit is produced for the processed market and 30% is produced for the fresh market. In addition, it is assumed that the orchard is 10% pre-production, 25% early production, 50% full production and 15% late 2/ This is the average net return of the eight orchard categories listed in section 1 of this table. The weights are provided by the percent of total trees represented by each category. 3/ In an olympic average, the highest and lowest values are dropped prior to calculating the arithmetic mean. 4/ This is determined by dividing the unadjusted net return value (Table 3 - Line 1) by the soil index factor (Table 3 - Section 4). 5/ The depreciation rate applicable to apple trees assumes that trees are replaced on a 30-year rotation. 6/ "Other" trees refers to peach, cherry, pear, and plum trees. The depreciation rate applicable to "other" trees assumes that trees are replaced on a 20-year rotation. 7/ The orchard index is applicable only in determining the value of the trees. The land index (Table 3 - Section 5) is applied to 8/ The use value of trees and land is determined by adding the appropriate without-risk- land-use-value (see Table 3 - Section5) to the use value of the trees. Table5:76

Table 5: Worksheet for estimating the use value of orchard land in Russell The estimated net returns assume a planting density of 135 trees per acre. A complete listing of this table for each jurisdiction participating in the land use program is available at the Virginia Department of Taxation. Estimates apply to tax-year 2005.
1. Estimated net returns (loss) per acre applicable to tax-year 2005 (see Table 4 for more detail). Age of Trees Processed Fru ti Percent of To al /1/ t Fresh Fruit Percent of Total /1/ Pre-production aged trees (1 - 4 years) ($1,340.22) 7.0% ($1,427.11) 3.0% Early-production aged trees (5 - 10 years) ($713.30) 17.5% ($1,027.23) 7.5% Full-production aged trees (11 - 25 years) $553.86 35.0% ($40.44) 15.0% Late-production aged trees (26 - 30 years) $142.27 10.5% ($100.18) 4.5% 2 e a) 2003 /2/ . Weight d Average Net Return for 1997-2003.
$34.64 b) 2002 ($113.52) c) 2001 ($108.20) d) 2000 ($59.80) e) 1999 ($46.81) f) 1998 $88.77 g) 1997 $88.77 3 a) Net return to trees and land ("olympic" average o 2a thru 2g) /3/ . Net Returns
$0.00 f b) Net return attributable to land only (class III) /4/ $13.47 c) Net return attributable to trees only (3a - 3b) ($13.47) 5 a) Interest Rate . Capitalization Rate
0.0733 b) Property Tax 0.0052 c) Depreciation of Apple Trees /5 0.0333 / d) Depreciation of "Other" Trees 0.0500 e) Apple Orchard Capitalization Rate 0.1118 f) "Other" Orchard Capitalization Rate 0.1285 . Use Value of Apple Orchard and "Other" Orchard 6
APPL ORCHARDE "OTH R" ORCHARDE Land Class Orchard In ex /7/d Trees Only Trees and Land /8/ Trees Only Trees and Land /8/ I 0.80 ($96.40) $161.13 ($83.89) $173.64 II 1.00 ($120.50) $111.28 ($104.86) $126.91 III 1.00 ($120.50) $51.19 ($104.86) $66.82 IV 1.00 ($120.50) $16.85 ($104.86) $32.48 V 0.75 ($90.37) $12.64 ($78.65) $24.36 VI 0.60 ($72.30) $13.54 ($62.92) $22.92 VII 0.40 ($48.20) $3.31 ($41.95) $9.56 VIII 0.00 $0.00 $17.17 $0.00 $17.17
1/ These percentages assume that 70% of the fruit is produced for the processed market and 30% is produced for the fresh market. In addition, it is assumed that the orchard is 10% pre-production, 25% early production, 50% full production and 15% late 2/ This is the average net return of the eight orchard categories listed in section 1 of this table. The weights are provided by the percent of total trees represented by each category. 3/ In an olympic average, the highest and lowest values are dropped prior to calculating the arithmetic mean. 4/ This is determined by dividing the unadjusted net return value (Table 3 - Line 1) by the soil index factor (Table 3 - Section 4). 5/ The depreciation rate applicable to apple trees assumes that trees are replaced on a 30-year rotation. 6/ "Other" trees refers to peach, cherry, pear, and plum trees. The depreciation rate applicable to "other" trees assumes that trees are replaced on a 20-year rotation. 7/ The orchard index is applicable only in determining the value of the trees. The land index (Table 3 - Section 5) is applied to 8/ The use value of trees and land is determined by adding the appropriate without-risk- land-use-value (see Table 3 - Section5) to the use value of the trees. Table5:77

Table 5: Worksheet for estimating the use value of orchard land in Shenandoah The estimated net returns assume a planting density of 135 trees per acre. A complete listing of this table for each jurisdiction participating in the land use program is available at the Virginia Department of Taxation. Estimates apply to tax-year 2005.
1. Estimated net returns (loss) per acre applicable to tax-year 2005 (see Table 4 for more detail). Age of Trees Processed Fru ti Percent of To al /1/ t Fresh Fruit Percent of Total /1/ Pre-production aged trees (1 - 4 years) ($1,340.22) 7.0% ($1,427.11) 3.0% Early-production aged trees (5 - 10 years) ($713.30) 17.5% ($1,027.23) 7.5% Full-production aged trees (11 - 25 years) $553.86 35.0% ($40.44) 15.0% Late-production aged trees (26 - 30 years) $142.27 10.5% ($100.18) 4.5% 2 e a) 2003 /2/ . Weight d Average Net Return for 1997-2003.
$34.64 b) 2002 ($113.52) c) 2001 ($108.20) d) 2000 ($59.80) e) 1999 ($46.81) f) 1998 $88.77 g) 1997 $88.77 3 a) Net return to trees and land ("olympic" average o 2a thru 2g) /3/ . Net Returns
$0.00 f b) Net return attributable to land only (class III) /4/ $13.87 c) Net return attributable to trees only (3a - 3b) ($13.87) 5 a) Interest Rate . Capitalization Rate
0.0733 b) Property Tax 0.0058 c) Depreciation of Apple Trees /5 0.0333 / d) Depreciation of "Other" Trees 0.0500 e) Apple Orchard Capitalization Rate 0.1124 f) "Other" Orchard Capitalization Rate 0.1290 . Use Value of Apple Orchard and "Other" Orchard 6
APPL ORCHARDE "OTH R" ORCHARDE Land Class Orchard In ex /7/d Trees Only Trees and Land /8/ Trees Only Trees and Land /8/ I 0.80 ($98.72) $164.43 ($85.97) $177.18 II 1.00 ($123.40) $113.44 ($107.46) $129.37 III 1.00 ($123.40) $52.04 ($107.46) $67.97 IV 1.00 ($123.40) $16.95 ($107.46) $32.89 V 0.75 ($92.55) $12.71 ($80.59) $24.67 VI 0.60 ($74.04) $13.68 ($64.48) $23.24 VII 0.40 ($49.36) $3.27 ($42.98) $9.65 VIII 0.00 $0.00 $17.54 $0.00 $17.54
1/ These percentages assume that 70% of the fruit is produced for the processed market and 30% is produced for the fresh market. In addition, it is assumed that the orchard is 10% pre-production, 25% early production, 50% full production and 15% late 2/ This is the average net return of the eight orchard categories listed in section 1 of this table. The weights are provided by the percent of total trees represented by each category. 3/ In an olympic average, the highest and lowest values are dropped prior to calculating the arithmetic mean. 4/ This is determined by dividing the unadjusted net return value (Table 3 - Line 1) by the soil index factor (Table 3 - Section 4). 5/ The depreciation rate applicable to apple trees assumes that trees are replaced on a 30-year rotation. 6/ "Other" trees refers to peach, cherry, pear, and plum trees. The depreciation rate applicable to "other" trees assumes that trees are replaced on a 20-year rotation. 7/ The orchard index is applicable only in determining the value of the trees. The land index (Table 3 - Section 5) is applied to 8/ The use value of trees and land is determined by adding the appropriate without-risk- land-use-value (see Table 3 - Section5) to the use value of the trees. Table5:78

Table 5: Worksheet for estimating the use value of orchard land in Smyth The estimated net returns assume a planting density of 135 trees per acre. A complete listing of this table for each jurisdiction participating in the land use program is available at the Virginia Department of Taxation. Estimates apply to tax-year 2005.
1. Estimated net returns (loss) per acre applicable to tax-year 2005 (see Table 4 for more detail). Age of Trees Processed Fru ti Percent of To al /1/ t Fresh Fruit Percent of Total /1/ Pre-production aged trees (1 - 4 years) ($1,340.22) 7.0% ($1,427.11) 3.0% Early-production aged trees (5 - 10 years) ($713.30) 17.5% ($1,027.23) 7.5% Full-production aged trees (11 - 25 years) $553.86 35.0% ($40.44) 15.0% Late-production aged trees (26 - 30 years) $142.27 10.5% ($100.18) 4.5% 2 e a) 2003 /2/ . Weight d Average Net Return for 1997-2003.
$34.64 b) 2002 ($113.52) c) 2001 ($108.20) d) 2000 ($59.80) e) 1999 ($46.81) f) 1998 $88.77 g) 1997 $88.77 3 a) Net return to trees and land ("olympic" average o 2a thru 2g) /3/ . Net Returns
$0.00 f b) Net return attributable to land only (class III) /4/ $26.05 c) Net return attributable to trees only (3a - 3b) ($26.05) 5 a) Interest Rate . Capitalization Rate
0.0733 b) Property Tax 0.0056 c) Depreciation of Apple Trees /5 0.0333 / d) Depreciation of "Other" Trees 0.0500 e) Apple Orchard Capitalization Rate 0.1122 f) "Other" Orchard Capitalization Rate 0.1289 . Use Value of Apple Orchard and "Other" Orchard 6
APPL ORCHARDE "OTH R" ORCHARDE Land Class Orchard In ex /7/d Trees Only Trees and Land /8/ Trees Only Trees and Land /8/ I 0.80 ($185.65) $309.47 ($161.64) $333.47 II 1.00 ($232.06) $213.55 ($202.06) $243.55 III 1.00 ($232.06) $98.02 ($202.06) $128.02 IV 1.00 ($232.06) $32.00 ($202.06) $62.01 V 0.75 ($174.04) $24.00 ($151.54) $46.50 VI 0.60 ($139.23) $25.80 ($121.23) $43.80 VII 0.40 ($92.82) $6.20 ($80.82) $18.20 VIII 0.00 $0.00 $33.01 $0.00 $33.01
1/ These percentages assume that 70% of the fruit is produced for the processed market and 30% is produced for the fresh market. In addition, it is assumed that the orchard is 10% pre-production, 25% early production, 50% full production and 15% late 2/ This is the average net return of the eight orchard categories listed in section 1 of this table. The weights are provided by the percent of total trees represented by each category. 3/ In an olympic average, the highest and lowest values are dropped prior to calculating the arithmetic mean. 4/ This is determined by dividing the unadjusted net return value (Table 3 - Line 1) by the soil index factor (Table 3 - Section 4). 5/ The depreciation rate applicable to apple trees assumes that trees are replaced on a 30-year rotation. 6/ "Other" trees refers to peach, cherry, pear, and plum trees. The depreciation rate applicable to "other" trees assumes that trees are replaced on a 20-year rotation. 7/ The orchard index is applicable only in determining the value of the trees. The land index (Table 3 - Section 5) is applied to 8/ The use value of trees and land is determined by adding the appropriate without-risk- land-use-value (see Table 3 - Section5) to the use value of the trees. Table5:79

Table 5: Worksheet for estimating the use value of orchard land in Spotsylvania The estimated net returns assume a planting density of 135 trees per acre. A complete listing of this table for each jurisdiction participating in the land use program is available at the Virginia Department of Taxation. Estimates apply to tax-year 2005.
1. Estimated net returns (loss) per acre applicable to tax-year 2005 (see Table 4 for more detail). Age of Trees Processed Fru ti Percent of To al /1/ t Fresh Fruit Percent of Total /1/ Pre-production aged trees (1 - 4 years) ($1,340.22) 7.0% ($1,427.11) 3.0% Early-production aged trees (5 - 10 years) ($713.30) 17.5% ($1,027.23) 7.5% Full-production aged trees (11 - 25 years) $553.86 35.0% ($40.44) 15.0% Late-production aged trees (26 - 30 years) $142.27 10.5% ($100.18) 4.5% 2 e a) 2003 /2/ . Weight d Average Net Return for 1997-2003.
$34.64 b) 2002 ($113.52) c) 2001 ($108.20) d) 2000 ($59.80) e) 1999 ($46.81) f) 1998 $88.77 g) 1997 $88.77 3 a) Net return to trees and land ("olympic" average o 2a thru 2g) /3/ . Net Returns
$0.00 f b) Net return attributable to land only (class III) /4/ $14.33 c) Net return attributable to trees only (3a - 3b) ($14.33) 5 a) Interest Rate . Capitalization Rate
0.0733 b) Property Tax 0.0085 c) Depreciation of Apple Trees /5 0.0333 / d) Depreciation of "Other" Trees 0.0500 e) Apple Orchard Capitalization Rate 0.1151 f) "Other" Orchard Capitalization Rate 0.1318 . Use Value of Apple Orchard and "Other" Orchard 6
APPL ORCHARDE "OTH R" ORCHARDE Land Class Orchard In ex /7/d Trees Only Trees and Land /8/ Trees Only Trees and Land /8/ I 0.80 ($99.52) $163.11 ($86.94) $175.70 II 1.00 ($124.41) $111.97 ($108.68) $127.70 III 1.00 ($124.41) $50.69 ($108.68) $66.41 IV 1.00 ($124.41) $15.67 ($108.68) $31.40 V 0.75 ($93.30) $11.75 ($81.51) $23.55 VI 0.60 ($74.64) $12.90 ($65.21) $22.34 VII 0.40 ($49.76) $2.77 ($43.47) $9.06 VIII 0.00 $0.00 $17.51 $0.00 $17.51
1/ These percentages assume that 70% of the fruit is produced for the processed market and 30% is produced for the fresh market. In addition, it is assumed that the orchard is 10% pre-production, 25% early production, 50% full production and 15% late 2/ This is the average net return of the eight orchard categories listed in section 1 of this table. The weights are provided by the percent of total trees represented by each category. 3/ In an olympic average, the highest and lowest values are dropped prior to calculating the arithmetic mean. 4/ This is determined by dividing the unadjusted net return value (Table 3 - Line 1) by the soil index factor (Table 3 - Section 4). 5/ The depreciation rate applicable to apple trees assumes that trees are replaced on a 30-year rotation. 6/ "Other" trees refers to peach, cherry, pear, and plum trees. The depreciation rate applicable to "other" trees assumes that trees are replaced on a 20-year rotation. 7/ The orchard index is applicable only in determining the value of the trees. The land index (Table 3 - Section 5) is applied to 8/ The use value of trees and land is determined by adding the appropriate without-risk- land-use-value (see Table 3 - Section5) to the use value of the trees. Table5:80

Table 5: Worksheet for estimating the use value of orchard land in Stafford The estimated net returns assume a planting density of 135 trees per acre. A complete listing of this table for each jurisdiction participating in the land use program is available at the Virginia Department of Taxation. Estimates apply to tax-year 2005.
1. Estimated net returns (loss) per acre applicable to tax-year 2005 (see Table 4 for more detail). Age of Trees Processed Fru ti Percent of To al /1/ t Fresh Fruit Percent of Total /1/ Pre-production aged trees (1 - 4 years) ($1,340.22) 7.0% ($1,427.11) 3.0% Early-production aged trees (5 - 10 years) ($713.30) 17.5% ($1,027.23) 7.5% Full-production aged trees (11 - 25 years) $553.86 35.0% ($40.44) 15.0% Late-production aged trees (26 - 30 years) $142.27 10.5% ($100.18) 4.5% 2 e a) 2003 /2/ . Weight d Average Net Return for 1997-2003.
$34.64 b) 2002 ($113.52) c) 2001 ($108.20) d) 2000 ($59.80) e) 1999 ($46.81) f) 1998 $88.77 g) 1997 $88.77 3 a) Net return to trees and land ("olympic" average o 2a thru 2g) /3/ . Net Returns
$0.00 f b) Net return attributable to land only (class III) /4/ $14.68 c) Net return attributable to trees only (3a - 3b) ($14.68) 5 a) Interest Rate . Capitalization Rate
0.0733 b) Property Tax 0.0100 c) Depreciation of Apple Trees /5 0.0333 / d) Depreciation of "Other" Trees 0.0500 e) Apple Orchard Capitalization Rate 0.1166 f) "Other" Orchard Capitalization Rate 0.1332 . Use Value of Apple Orchard and "Other" Orchard 6
APPL ORCHARDE "OTH R" ORCHARDE Land Class Orchard In ex /7/d Trees Only Trees and Land /8/ Trees Only Trees and Land /8/ I 0.80 ($100.74) $163.79 ($88.14) $176.39 II 1.00 ($125.92) $112.15 ($110.17) $127.90 III 1.00 ($125.92) $50.43 ($110.17) $66.18 IV 1.00 ($125.92) $15.16 ($110.17) $30.91 V 0.75 ($94.44) $11.37 ($82.63) $23.18 VI 0.60 ($75.55) $12.62 ($66.10) $22.07 VII 0.40 ($50.37) $2.54 ($44.07) $8.84 VIII 0.00 $0.00 $17.63 $0.00 $17.63
1/ These percentages assume that 70% of the fruit is produced for the processed market and 30% is produced for the fresh market. In addition, it is assumed that the orchard is 10% pre-production, 25% early production, 50% full production and 15% late 2/ This is the average net return of the eight orchard categories listed in section 1 of this table. The weights are provided by the percent of total trees represented by each category. 3/ In an olympic average, the highest and lowest values are dropped prior to calculating the arithmetic mean. 4/ This is determined by dividing the unadjusted net return value (Table 3 - Line 1) by the soil index factor (Table 3 - Section 4). 5/ The depreciation rate applicable to apple trees assumes that trees are replaced on a 30-year rotation. 6/ "Other" trees refers to peach, cherry, pear, and plum trees. The depreciation rate applicable to "other" trees assumes that trees are replaced on a 20-year rotation. 7/ The orchard index is applicable only in determining the value of the trees. The land index (Table 3 - Section 5) is applied to 8/ The use value of trees and land is determined by adding the appropriate without-risk- land-use-value (see Table 3 - Section5) to the use value of the trees. Table5:81

Table 5: Worksheet for estimating the use value of orchard land in Staunton 14/ The estimated net returns assume a planting density of 135 trees per acre. A complete listing of this table for each jurisdiction participating in the land use program is available at the Virginia Department of Taxation. Estimates apply to tax-year 2005.
1. Estimated net returns (loss) per acre applicable to tax-year 2005 (see Table 4 for more detail). Age of Trees Processed Fru ti Percent of To al /1/ t Fresh Fruit Percent of Total /1/ Pre-production aged trees (1 - 4 years) ($1,340.22) 7.0% ($1,427.11) 3.0% Early-production aged trees (5 - 10 years) ($713.30) 17.5% ($1,027.23) 7.5% Full-production aged trees (11 - 25 years) $553.86 35.0% ($40.44) 15.0% Late-production aged trees (26 - 30 years) $142.27 10.5% ($100.18) 4.5% 2 e a) 2003 /2/ . Weight d Average Net Return for 1997-2003.
$34.64 b) 2002 ($113.52) c) 2001 ($108.20) d) 2000 ($59.80) e) 1999 ($46.81) f) 1998 $88.77 g) 1997 $88.77 3 a) Net return to trees and land ("olympic" average o 2a thru 2g) /3/ . Net Returns
$0.00 f b) Net return attributable to land only (class III) /4/ $20.77 c) Net return attributable to trees only (3a - 3b) ($20.77) 5 a) Interest Rate . Capitalization Rate
0.0733 b) Property Tax 0.0093 c) Depreciation of Apple Trees /5 0.0333 / d) Depreciation of "Other" Trees 0.0500 e) Apple Orchard Capitalization Rate 0.1159 f) "Other" Orchard Capitalization Rate 0.1326 . Use Value of Apple Orchard and "Other" Orchard 6
APPL ORCHARDE "OTH R" ORCHARDE Land Class Orchard In ex /7/d Trees Only Trees and Land /8/ Trees Only Trees and Land /8/ I 0.80 ($143.38) $234.00 ($125.35) $252.03 II 1.00 ($179.22) $160.42 ($156.69) $182.95 III 1.00 ($179.22) $72.36 ($156.69) $94.90 IV 1.00 ($179.22) $22.05 ($156.69) $44.58 V 0.75 ($134.41) $16.54 ($117.51) $33.44 VI 0.60 ($107.53) $18.26 ($94.01) $31.78 VII 0.40 ($71.69) $3.79 ($62.67) $12.80 VIII 0.00 $0.00 $25.16 $0.00 $25.16
1/ These percentages assume that 70% of the fruit is produced for the processed market and 30% is produced for the fresh market. In addition, it is assumed that the orchard is 10% pre-production, 25% early production, 50% full production and 15% late 2/ This is the average net return of the eight orchard categories listed in section 1 of this table. The weights are provided by the percent of total trees represented by each category. 3/ In an olympic average, the highest and lowest values are dropped prior to calculating the arithmetic mean. 4/ This is determined by dividing the unadjusted net return value (Table 3 - Line 1) by the soil index factor (Table 3 - Section 4). 5/ The depreciation rate applicable to apple trees assumes that trees are replaced on a 30-year rotation. 6/ "Other" trees refers to peach, cherry, pear, and plum trees. The depreciation rate applicable to "other" trees assumes that trees are replaced on a 20-year rotation. 7/ The orchard index is applicable only in determining the value of the trees. The land index (Table 3 - Section 5) is applied to 8/ The use value of trees and land is determined by adding the appropriate without-risk- land-use-value (see Table 3 - Section5) to the use value of the trees. Table5:82

Table 5: Worksheet for estimating the use value of orchard land in Suffolk City The estimated net returns assume a planting density of 135 trees per acre. A complete listing of this table for each jurisdiction participating in the land use program is available at the Virginia Department of Taxation. Estimates apply to tax-year 2005.
1. Estimated net returns (loss) per acre applicable to tax-year 2005 (see Table 4 for more detail). Age of Trees Processed Fru ti Percent of To al /1/ t Fresh Fruit Percent of Total /1/ Pre-production aged trees (1 - 4 years) ($1,340.22) 7.0% ($1,427.11) 3.0% Early-production aged trees (5 - 10 years) ($713.30) 17.5% ($1,027.23) 7.5% Full-production aged trees (11 - 25 years) $553.86 35.0% ($40.44) 15.0% Late-production aged trees (26 - 30 years) $142.27 10.5% ($100.18) 4.5% 2 e a) 2003 /2/ . Weight d Average Net Return for 1997-2003.
$34.64 b) 2002 ($113.52) c) 2001 ($108.20) d) 2000 ($59.80) e) 1999 ($46.81) f) 1998 $88.77 g) 1997 $88.77 3 a) Net return to trees and land ("olympic" average o 2a thru 2g) /3/ . Net Returns
$0.00 f b) Net return attributable to land only (class III) /4/ $28.35 c) Net return attributable to trees only (3a - 3b) ($28.35) 5 a) Interest Rate . Capitalization Rate
0.0733 b) Property Tax 0.0096 c) Depreciation of Apple Trees /5 0.0333 / d) Depreciation of "Other" Trees 0.0500 e) Apple Orchard Capitalization Rate 0.1162 f) "Other" Orchard Capitalization Rate 0.1329 . Use Value of Apple Orchard and "Other" Orchard 6
APPL ORCHARDE "OTH R" ORCHARDE Land Class Orchard In ex /7/d Trees Only Trees and Land /8/ Trees Only Trees and Land /8/ I 0.80 ($195.17) $317.94 ($170.69) $342.42 II 1.00 ($243.96) $217.84 ($213.36) $248.44 III 1.00 ($243.96) $98.11 ($213.36) $128.71 IV 1.00 ($243.96) $29.70 ($213.36) $60.30 V 0.75 ($182.97) $22.27 ($160.02) $45.22 VI 0.60 ($146.38) $24.66 ($128.02) $43.02 VII 0.40 ($97.58) $5.04 ($85.35) $17.28 VIII 0.00 $0.00 $34.21 $0.00 $34.21
1/ These percentages assume that 70% of the fruit is produced for the processed market and 30% is produced for the fresh market. In addition, it is assumed that the orchard is 10% pre-production, 25% early production, 50% full production and 15% late 2/ This is the average net return of the eight orchard categories listed in section 1 of this table. The weights are provided by the percent of total trees represented by each category. 3/ In an olympic average, the highest and lowest values are dropped prior to calculating the arithmetic mean. 4/ This is determined by dividing the unadjusted net return value (Table 3 - Line 1) by the soil index factor (Table 3 - Section 4). 5/ The depreciation rate applicable to apple trees assumes that trees are replaced on a 30-year rotation. 6/ "Other" trees refers to peach, cherry, pear, and plum trees. The depreciation rate applicable to "other" trees assumes that trees are replaced on a 20-year rotation. 7/ The orchard index is applicable only in determining the value of the trees. The land index (Table 3 - Section 5) is applied to 8/ The use value of trees and land is determined by adding the appropriate without-risk- land-use-value (see Table 3 - Section5) to the use value of the trees. Table5:83

Table 5: Worksheet for estimating the use value of orchard land in Tazewell The estimated net returns assume a planting density of 135 trees per acre. A complete listing of this table for each jurisdiction participating in the land use program is available at the Virginia Department of Taxation. Estimates apply to tax-year 2005.
1. Estimated net returns (loss) per acre applicable to tax-year 2005 (see Table 4 for more detail). Age of Trees Processed Fru ti Percent of To al /1/ t Fresh Fruit Percent of Total /1/ Pre-production aged trees (1 - 4 years) ($1,340.22) 7.0% ($1,427.11) 3.0% Early-production aged trees (5 - 10 years) ($713.30) 17.5% ($1,027.23) 7.5% Full-production aged trees (11 - 25 years) $553.86 35.0% ($40.44) 15.0% Late-production aged trees (26 - 30 years) $142.27 10.5% ($100.18) 4.5% 2 e a) 2003 /2/ . Weight d Average Net Return for 1997-2003.
$34.64 b) 2002 ($113.52) c) 2001 ($108.20) d) 2000 ($59.80) e) 1999 ($46.81) f) 1998 $88.77 g) 1997 $88.77 3 a) Net return to trees and land ("olympic" average o 2a thru 2g) /3/ . Net Returns
$0.00 f b) Net return attributable to land only (class III) /4/ $32.64 c) Net return attributable to trees only (3a - 3b) ($32.64) 5 a) Interest Rate . Capitalization Rate
0.0733 b) Property Tax 0.0050 c) Depreciation of Apple Trees /5 0.0333 / d) Depreciation of "Other" Trees 0.0500 e) Apple Orchard Capitalization Rate 0.1116 f) "Other" Orchard Capitalization Rate 0.1283 . Use Value of Apple Orchard and "Other" Orchard 6
APPL ORCHARDE "OTH R" ORCHARDE Land Class Orchard In ex /7/d Trees Only Trees and Land /8/ Trees Only Trees and Land /8/ I 0.80 ($233.89) $391.31 ($203.51) $421.69 II 1.00 ($292.36) $270.32 ($254.39) $308.29 III 1.00 ($292.36) $124.44 ($254.39) $162.41 IV 1.00 ($292.36) $41.08 ($254.39) $79.05 V 0.75 ($219.27) $30.81 ($190.79) $59.29 VI 0.60 ($175.42) $32.98 ($152.63) $55.77 VII 0.40 ($116.95) $8.10 ($101.76) $23.29 VIII 0.00 $0.00 $41.68 $0.00 $41.68
1/ These percentages assume that 70% of the fruit is produced for the processed market and 30% is produced for the fresh market. In addition, it is assumed that the orchard is 10% pre-production, 25% early production, 50% full production and 15% late 2/ This is the average net return of the eight orchard categories listed in section 1 of this table. The weights are provided by the percent of total trees represented by each category. 3/ In an olympic average, the highest and lowest values are dropped prior to calculating the arithmetic mean. 4/ This is determined by dividing the unadjusted net return value (Table 3 - Line 1) by the soil index factor (Table 3 - Section 4). 5/ The depreciation rate applicable to apple trees assumes that trees are replaced on a 30-year rotation. 6/ "Other" trees refers to peach, cherry, pear, and plum trees. The depreciation rate applicable to "other" trees assumes that trees are replaced on a 20-year rotation. 7/ The orchard index is applicable only in determining the value of the trees. The land index (Table 3 - Section 5) is applied to 8/ The use value of trees and land is determined by adding the appropriate without-risk- land-use-value (see Table 3 - Section5) to the use value of the trees. Table5:84

Table 5: Worksheet for estimating the use value of orchard land in Virginia Beach The estimated net returns assume a planting density of 135 trees per acre. A complete listing of this table for each jurisdiction participating in the land use program is available at the Virginia Department of Taxation. Estimates apply to tax-year 2005.
1. Estimated net returns (loss) per acre applicable to tax-year 2005 (see Table 4 for more detail). Age of Trees Processed Fru ti Percent of To al /1/ t Fresh Fruit Percent of Total /1/ Pre-production aged trees (1 - 4 years) ($1,340.22) 7.0% ($1,427.11) 3.0% Early-production aged trees (5 - 10 years) ($713.30) 17.5% ($1,027.23) 7.5% Full-production aged trees (11 - 25 years) $553.86 35.0% ($40.44) 15.0% Late-production aged trees (26 - 30 years) $142.27 10.5% ($100.18) 4.5% 2 e a) 2003 /2/ . Weight d Average Net Return for 1997-2003.
$34.64 b) 2002 ($113.52) c) 2001 ($108.20) d) 2000 ($59.80) e) 1999 ($46.81) f) 1998 $88.77 g) 1997 $88.77 3 a) Net return to trees and land ("olympic" average o 2a thru 2g) /3/ . Net Returns
$0.00 f b) Net return attributable to land only (class III) /4/ $37.15 c) Net return attributable to trees only (3a - 3b) ($37.15) 5 a) Interest Rate . Capitalization Rate
0.0733 b) Property Tax 0.0109 c) Depreciation of Apple Trees /5 0.0333 / d) Depreciation of "Other" Trees 0.0500 e) Apple Orchard Capitalization Rate 0.1175 f) "Other" Orchard Capitalization Rate 0.1342 . Use Value of Apple Orchard and "Other" Orchard 6
APPL ORCHARDE "OTH R" ORCHARDE Land Class Orchard In ex /7/d Trees Only Trees and Land /8/ Trees Only Trees and Land /8/ I 0.80 ($252.98) $409.24 ($221.55) $440.67 II 1.00 ($316.22) $279.77 ($276.94) $319.06 III 1.00 ($316.22) $125.25 ($276.94) $164.54 IV 1.00 ($316.22) $36.96 ($276.94) $76.24 V 0.75 ($237.17) $27.72 ($207.70) $57.18 VI 0.60 ($189.73) $31.00 ($166.16) $54.58 VII 0.40 ($126.49) $5.95 ($110.78) $21.67 VIII 0.00 $0.00 $44.15 $0.00 $44.15
1/ These percentages assume that 70% of the fruit is produced for the processed market and 30% is produced for the fresh market. In addition, it is assumed that the orchard is 10% pre-production, 25% early production, 50% full production and 15% late 2/ This is the average net return of the eight orchard categories listed in section 1 of this table. The weights are provided by the percent of total trees represented by each category. 3/ In an olympic average, the highest and lowest values are dropped prior to calculating the arithmetic mean. 4/ This is determined by dividing the unadjusted net return value (Table 3 - Line 1) by the soil index factor (Table 3 - Section 4). 5/ The depreciation rate applicable to apple trees assumes that trees are replaced on a 30-year rotation. 6/ "Other" trees refers to peach, cherry, pear, and plum trees. The depreciation rate applicable to "other" trees assumes that trees are replaced on a 20-year rotation. 7/ The orchard index is applicable only in determining the value of the trees. The land index (Table 3 - Section 5) is applied to 8/ The use value of trees and land is determined by adding the appropriate without-risk- land-use-value (see Table 3 - Section5) to the use value of the trees. Table5:85

Table 5: Worksheet for estimating the use value of orchard land in Warren The estimated net returns assume a planting density of 135 trees per acre. A complete listing of this table for each jurisdiction participating in the land use program is available at the Virginia Department of Taxation. Estimates apply to tax-year 2005.
1. Estimated net returns (loss) per acre applicable to tax-year 2005 (see Table 4 for more detail). Age of Trees Processed Fru ti Percent of To al /1/ t Fresh Fruit Percent of Total /1/ Pre-production aged trees (1 - 4 years) ($1,340.22) 7.0% ($1,427.11) 3.0% Early-production aged trees (5 - 10 years) ($713.30) 17.5% ($1,027.23) 7.5% Full-production aged trees (11 - 25 years) $553.86 35.0% ($40.44) 15.0% Late-production aged trees (26 - 30 years) $142.27 10.5% ($100.18) 4.5% 2 e a) 2003 /2/ . Weight d Average Net Return for 1997-2003.
$34.64 b) 2002 ($113.52) c) 2001 ($108.20) d) 2000 ($59.80) e) 1999 ($46.81) f) 1998 $88.77 g) 1997 $88.77 3 a) Net return to trees and land ("olympic" average o 2a thru 2g) /3/ . Net Returns
$0.00 f b) Net return attributable to land only (class III) /4/ $3.91 c) Net return attributable to trees only (3a - 3b) ($3.91) 5 a) Interest Rate . Capitalization Rate
0.0733 b) Property Tax 0.0064 c) Depreciation of Apple Trees /5 0.0333 / d) Depreciation of "Other" Trees 0.0500 e) Apple Orchard Capitalization Rate 0.1130 f) "Other" Orchard Capitalization Rate 0.1297 . Use Value of Apple Orchard and "Other" Orchard 6
APPL ORCHARDE "OTH R" ORCHARDE Land Class Orchard In ex /7/d Trees Only Trees and Land /8/ Trees Only Trees and Land /8/ I 0.80 ($27.66) $45.90 ($24.10) $49.45 II 1.00 ($34.57) $31.63 ($30.13) $36.07 III 1.00 ($34.57) $14.46 ($30.13) $18.91 IV 1.00 ($34.57) $4.66 ($30.13) $9.10 V 0.75 ($25.93) $3.49 ($22.60) $6.82 VI 0.60 ($20.74) $3.77 ($18.08) $6.44 VII 0.40 ($13.83) $0.88 ($12.05) $2.66 VIII 0.00 $0.00 $4.90 $0.00 $4.90
1/ These percentages assume that 70% of the fruit is produced for the processed market and 30% is produced for the fresh market. In addition, it is assumed that the orchard is 10% pre-production, 25% early production, 50% full production and 15% late 2/ This is the average net return of the eight orchard categories listed in section 1 of this table. The weights are provided by the percent of total trees represented by each category. 3/ In an olympic average, the highest and lowest values are dropped prior to calculating the arithmetic mean. 4/ This is determined by dividing the unadjusted net return value (Table 3 - Line 1) by the soil index factor (Table 3 - Section 4). 5/ The depreciation rate applicable to apple trees assumes that trees are replaced on a 30-year rotation. 6/ "Other" trees refers to peach, cherry, pear, and plum trees. The depreciation rate applicable to "other" trees assumes that trees are replaced on a 20-year rotation. 7/ The orchard index is applicable only in determining the value of the trees. The land index (Table 3 - Section 5) is applied to 8/ The use value of trees and land is determined by adding the appropriate without-risk- land-use-value (see Table 3 - Section5) to the use value of the trees. Table5:86

Table 5: Worksheet for estimating the use value of orchard land in Washington The estimated net returns assume a planting density of 135 trees per acre. A complete listing of this table for each jurisdiction participating in the land use program is available at the Virginia Department of Taxation. Estimates apply to tax-year 2005.
1. Estimated net returns (loss) per acre applicable to tax-year 2005 (see Table 4 for more detail). Age of Trees Processed Fru ti Percent of To al /1/ t Fresh Fruit Percent of Total /1/ Pre-production aged trees (1 - 4 years) ($1,340.22) 7.0% ($1,427.11) 3.0% Early-production aged trees (5 - 10 years) ($713.30) 17.5% ($1,027.23) 7.5% Full-production aged trees (11 - 25 years) $553.86 35.0% ($40.44) 15.0% Late-production aged trees (26 - 30 years) $142.27 10.5% ($100.18) 4.5% 2 e a) 2003 /2/ . Weight d Average Net Return for 1997-2003.
$34.64 b) 2002 ($113.52) c) 2001 ($108.20) d) 2000 ($59.80) e) 1999 ($46.81) f) 1998 $88.77 g) 1997 $88.77 3 a) Net return to trees and land ("olympic" average o 2a thru 2g) /3/ . Net Returns
$0.00 f b) Net return attributable to land only (class III) /4/ $21.60 c) Net return attributable to trees only (3a - 3b) ($21.60) 5 a) Interest Rate . Capitalization Rate
0.0733 b) Property Tax 0.0056 c) Depreciation of Apple Trees /5 0.0333 / d) Depreciation of "Other" Trees 0.0500 e) Apple Orchard Capitalization Rate 0.1122 f) "Other" Orchard Capitalization Rate 0.1289 . Use Value of Apple Orchard and "Other" Orchard 6
APPL ORCHARDE "OTH R" ORCHARDE Land Class Orchard In ex /7/d Trees Only Trees and Land /8/ Trees Only Trees and Land /8/ I 0.80 ($154.02) $256.79 ($134.10) $276.71 II 1.00 ($192.52) $177.21 ($167.63) $202.10 III 1.00 ($192.52) $81.35 ($167.63) $106.25 IV 1.00 ($192.52) $26.58 ($167.63) $51.47 V 0.75 ($144.39) $19.93 ($125.72) $38.60 VI 0.60 ($115.51) $21.42 ($100.58) $36.36 VII 0.40 ($77.01) $5.15 ($67.05) $15.11 VIII 0.00 $0.00 $27.39 $0.00 $27.39
1/ These percentages assume that 70% of the fruit is produced for the processed market and 30% is produced for the fresh market. In addition, it is assumed that the orchard is 10% pre-production, 25% early production, 50% full production and 15% late 2/ This is the average net return of the eight orchard categories listed in section 1 of this table. The weights are provided by the percent of total trees represented by each category. 3/ In an olympic average, the highest and lowest values are dropped prior to calculating the arithmetic mean. 4/ This is determined by dividing the unadjusted net return value (Table 3 - Line 1) by the soil index factor (Table 3 - Section 4). 5/ The depreciation rate applicable to apple trees assumes that trees are replaced on a 30-year rotation. 6/ "Other" trees refers to peach, cherry, pear, and plum trees. The depreciation rate applicable to "other" trees assumes that trees are replaced on a 20-year rotation. 7/ The orchard index is applicable only in determining the value of the trees. The land index (Table 3 - Section 5) is applied to 8/ The use value of trees and land is determined by adding the appropriate without-risk- land-use-value (see Table 3 - Section5) to the use value of the trees. Table5:87

Table 5: Worksheet for estimating the use value of orchard land in Waynesboro 14/ The estimated net returns assume a planting density of 135 trees per acre. A complete listing of this table for each jurisdiction participating in the land use program is available at the Virginia Department of Taxation. Estimates apply to tax-year 2005.
1. Estimated net returns (loss) per acre applicable to tax-year 2005 (see Table 4 for more detail). Age of Trees Processed Fru ti Percent of To al /1/ t Fresh Fruit Percent of Total /1/ Pre-production aged trees (1 - 4 years) ($1,340.22) 7.0% ($1,427.11) 3.0% Early-production aged trees (5 - 10 years) ($713.30) 17.5% ($1,027.23) 7.5% Full-production aged trees (11 - 25 years) $553.86 35.0% ($40.44) 15.0% Late-production aged trees (26 - 30 years) $142.27 10.5% ($100.18) 4.5% 2 e a) 2003 /2/ . Weight d Average Net Return for 1997-2003.
$34.64 b) 2002 ($113.52) c) 2001 ($108.20) d) 2000 ($59.80) e) 1999 ($46.81) f) 1998 $88.77 g) 1997 $88.77 3 a) Net return to trees and land ("olympic" average o 2a thru 2g) /3/ . Net Returns
$0.00 f b) Net return attributable to land only (class III) /4/ $20.77 c) Net return attributable to trees only (3a - 3b) ($20.77) 5 a) Interest Rate . Capitalization Rate
0.0733 b) Property Tax 0.0086 c) Depreciation of Apple Trees /5 0.0333 / d) Depreciation of "Other" Trees 0.0500 e) Apple Orchard Capitalization Rate 0.1152 f) "Other" Orchard Capitalization Rate 0.1319 . Use Value of Apple Orchard and "Other" Orchard 6
APPL ORCHARDE "OTH R" ORCHARDE Land Class Orchard In ex /7/d Trees Only Trees and Land /8/ Trees Only Trees and Land /8/ I 0.80 ($144.25) $236.35 ($126.01) $254.59 II 1.00 ($180.31) $162.23 ($157.52) $185.02 III 1.00 ($180.31) $73.43 ($157.52) $96.22 IV 1.00 ($180.31) $22.68 ($157.52) $45.47 V 0.75 ($135.23) $17.01 ($118.14) $34.10 VI 0.60 ($108.19) $18.68 ($94.51) $32.36 VII 0.40 ($72.12) $4.00 ($63.01) $13.11 VIII 0.00 $0.00 $25.37 $0.00 $25.37
1/ These percentages assume that 70% of the fruit is produced for the processed market and 30% is produced for the fresh market. In addition, it is assumed that the orchard is 10% pre-production, 25% early production, 50% full production and 15% late 2/ This is the average net return of the eight orchard categories listed in section 1 of this table. The weights are provided by the percent of total trees represented by each category. 3/ In an olympic average, the highest and lowest values are dropped prior to calculating the arithmetic mean. 4/ This is determined by dividing the unadjusted net return value (Table 3 - Line 1) by the soil index factor (Table 3 - Section 4). 5/ The depreciation rate applicable to apple trees assumes that trees are replaced on a 30-year rotation. 6/ "Other" trees refers to peach, cherry, pear, and plum trees. The depreciation rate applicable to "other" trees assumes that trees are replaced on a 20-year rotation. 7/ The orchard index is applicable only in determining the value of the trees. The land index (Table 3 - Section 5) is applied to 8/ The use value of trees and land is determined by adding the appropriate without-risk- land-use-value (see Table 3 - Section5) to the use value of the trees. Table5:88

Table 5: Worksheet for estimating the use value of orchard land in Westmoreland The estimated net returns assume a planting density of 135 trees per acre. A complete listing of this table for each jurisdiction participating in the land use program is available at the Virginia Department of Taxation. Estimates apply to tax-year 2005.
1. Estimated net returns (loss) per acre applicable to tax-year 2005 (see Table 4 for more detail). Age of Trees Processed Fru ti Percent of To al /1/ t Fresh Fruit Percent of Total /1/ Pre-production aged trees (1 - 4 years) ($1,340.22) 7.0% ($1,427.11) 3.0% Early-production aged trees (5 - 10 years) ($713.30) 17.5% ($1,027.23) 7.5% Full-production aged trees (11 - 25 years) $553.86 35.0% ($40.44) 15.0% Late-production aged trees (26 - 30 years) $142.27 10.5% ($100.18) 4.5% 2 e a) 2003 /2/ . Weight d Average Net Return for 1997-2003.
$34.64 b) 2002 ($113.52) c) 2001 ($108.20) d) 2000 ($59.80) e) 1999 ($46.81) f) 1998 $88.77 g) 1997 $88.77 3 a) Net return to trees and land ("olympic" average o 2a thru 2g) /3/ . Net Returns
$0.00 f b) Net return attributable to land only (class III) /4/ $17.47 c) Net return attributable to trees only (3a - 3b) ($17.47) 5 a) Interest Rate . Capitalization Rate
0.0733 b) Property Tax 0.0057 c) Depreciation of Apple Trees /5 0.0333 / d) Depreciation of "Other" Trees 0.0500 e) Apple Orchard Capitalization Rate 0.1123 f) "Other" Orchard Capitalization Rate 0.1289 . Use Value of Apple Orchard and "Other" Orchard 6
APPL ORCHARDE "OTH R" ORCHARDE Land Class Orchard In ex /7/d Trees Only Trees and Land /8/ Trees Only Trees and Land /8/ I 0.80 ($124.49) $207.49 ($108.40) $223.58 II 1.00 ($155.61) $143.17 ($135.50) $163.28 III 1.00 ($155.61) $65.71 ($135.50) $85.82 IV 1.00 ($155.61) $21.44 ($135.50) $41.56 V 0.75 ($116.71) $16.08 ($101.62) $31.17 VI 0.60 ($93.37) $17.29 ($81.30) $29.36 VII 0.40 ($62.25) $4.15 ($54.20) $12.20 VIII 0.00 $0.00 $22.13 $0.00 $22.13
1/ These percentages assume that 70% of the fruit is produced for the processed market and 30% is produced for the fresh market. In addition, it is assumed that the orchard is 10% pre-production, 25% early production, 50% full production and 15% late 2/ This is the average net return of the eight orchard categories listed in section 1 of this table. The weights are provided by the percent of total trees represented by each category. 3/ In an olympic average, the highest and lowest values are dropped prior to calculating the arithmetic mean. 4/ This is determined by dividing the unadjusted net return value (Table 3 - Line 1) by the soil index factor (Table 3 - Section 4). 5/ The depreciation rate applicable to apple trees assumes that trees are replaced on a 30-year rotation. 6/ "Other" trees refers to peach, cherry, pear, and plum trees. The depreciation rate applicable to "other" trees assumes that trees are replaced on a 20-year rotation. 7/ The orchard index is applicable only in determining the value of the trees. The land index (Table 3 - Section 5) is applied to 8/ The use value of trees and land is determined by adding the appropriate without-risk- land-use-value (see Table 3 - Section5) to the use value of the trees. Table5:89

Table 5: Worksheet for estimating the use value of orchard land in Winchester 19/ The estimated net returns assume a planting density of 135 trees per acre. A complete listing of this table for each jurisdiction participating in the land use program is available at the Virginia Department of Taxation. Estimates apply to tax-year 2005.
1. Estimated net returns (loss) per acre applicable to tax-year 2005 (see Table 4 for more detail). Age of Trees Processed Fru ti Percent of To al /1/ t Fresh Fruit Percent of Total /1/ Pre-production aged trees (1 - 4 years) ($1,340.22) 7.0% ($1,427.11) 3.0% Early-production aged trees (5 - 10 years) ($713.30) 17.5% ($1,027.23) 7.5% Full-production aged trees (11 - 25 years) $553.86 35.0% ($40.44) 15.0% Late-production aged trees (26 - 30 years) $142.27 10.5% ($100.18) 4.5% 2 e a) 2003 /2/ . Weight d Average Net Return for 1997-2003.
$34.64 b) 2002 ($113.52) c) 2001 ($108.20) d) 2000 ($59.80) e) 1999 ($46.81) f) 1998 $88.77 g) 1997 $88.77 3 a) Net return to trees and land ("olympic" average o 2a thru 2g) /3/ . Net Returns
$0.00 f b) Net return attributable to land only (class III) /4/ $5.86 c) Net return attributable to trees only (3a - 3b) ($5.86) 5 a) Interest Rate . Capitalization Rate
0.0733 b) Property Tax 0.0058 c) Depreciation of Apple Trees /5 0.0333 / d) Depreciation of "Other" Trees 0.0500 e) Apple Orchard Capitalization Rate 0.1124 f) "Other" Orchard Capitalization Rate 0.1291 . Use Value of Apple Orchard and "Other" Orchard 6
APPL ORCHARDE "OTH R" ORCHARDE Land Class Orchard In ex /7/d Trees Only Trees and Land /8/ Trees Only Trees and Land /8/ I 0.80 ($41.68) $69.42 ($36.30) $74.80 II 1.00 ($52.10) $47.89 ($45.37) $54.62 III 1.00 ($52.10) $21.97 ($45.37) $28.69 IV 1.00 ($52.10) $7.15 ($45.37) $13.88 V 0.75 ($39.08) $5.36 ($34.03) $10.41 VI 0.60 ($31.26) $5.77 ($27.22) $9.81 VII 0.40 ($20.84) $1.38 ($18.15) $4.07 VIII 0.00 $0.00 $7.41 $0.00 $7.41
1/ These percentages assume that 70% of the fruit is produced for the processed market and 30% is produced for the fresh market. In addition, it is assumed that the orchard is 10% pre-production, 25% early production, 50% full production and 15% late 2/ This is the average net return of the eight orchard categories listed in section 1 of this table. The weights are provided by the percent of total trees represented by each category. 3/ In an olympic average, the highest and lowest values are dropped prior to calculating the arithmetic mean. 4/ This is determined by dividing the unadjusted net return value (Table 3 - Line 1) by the soil index factor (Table 3 - Section 4). 5/ The depreciation rate applicable to apple trees assumes that trees are replaced on a 30-year rotation. 6/ "Other" trees refers to peach, cherry, pear, and plum trees. The depreciation rate applicable to "other" trees assumes that trees are replaced on a 20-year rotation. 7/ The orchard index is applicable only in determining the value of the trees. The land index (Table 3 - Section 5) is applied to 8/ The use value of trees and land is determined by adding the appropriate without-risk- land-use-value (see Table 3 - Section5) to the use value of the trees. Table5:90

Table 5: Worksheet for estimating the use value of orchard land in Wise The estimated net returns assume a planting density of 135 trees per acre. A complete listing of this table for each jurisdiction participating in the land use program is available at the Virginia Department of Taxation. Estimates apply to tax-year 2005.
1. Estimated net returns (loss) per acre applicable to tax-year 2005 (see Table 4 for more detail). Age of Trees Processed Fru ti Percent of To al /1/ t Fresh Fruit Percent of Total /1/ Pre-production aged trees (1 - 4 years) ($1,340.22) 7.0% ($1,427.11) 3.0% Early-production aged trees (5 - 10 years) ($713.30) 17.5% ($1,027.23) 7.5% Full-production aged trees (11 - 25 years) $553.86 35.0% ($40.44) 15.0% Late-production aged trees (26 - 30 years) $142.27 10.5% ($100.18) 4.5% 2 e a) 2003 /2/ . Weight d Average Net Return for 1997-2003.
$34.64 b) 2002 ($113.52) c) 2001 ($108.20) d) 2000 ($59.80) e) 1999 ($46.81) f) 1998 $88.77 g) 1997 $88.77 3 a) Net return to trees and land ("olympic" average of 2a thru 2g) /3/ . Net Returns
$0.00 b) Net return attributable to land only (class III) /4/ c) Net return attributable to trees only (3a - 3b) 5 a) Interest Rate . Capitalization Rate
0.0733 b) Property Tax 0.0045 c) Depreciation of Apple Trees /5 0.0333 / d) Depreciation of "Other" Trees 0.0500 e) Apple Orchard Capitalization Rate 0.1111 f) "Other" Orchard Capitalization Rate 0.1277 . Use Value of Apple Orchard and "Other" Orchard 6
APPL ORCHARDE "OTH R" ORCHARDE Land Class Orchard Index /7/ Trees Only Trees and Land /8/ Trees Only Trees and Land /8/ I 0.80 II 1.00 III 1.00 IV 1.00 V 0.75 VI 0.60 VII 0.40 VIII 0.00
1/ These percentages assume that 70% of the fruit is produced for the processed market and 30% is produced for the fresh market. In addition, it is assumed that the orchard is 10% pre-production, 25% early production, 50% full production and 15% late 2/ This is the average net return of the eight orchard categories listed in section 1 of this table. The weights are provided by the percent of total trees represented by each category. 3/ In an olympic average, the highest and lowest values are dropped prior to calculating the arithmetic mean. 4/ This is determined by dividing the unadjusted net return value (Table 3 - Line 1) by the soil index factor (Table 3 - Section 4). 5/ The depreciation rate applicable to apple trees assumes that trees are replaced on a 30-year rotation. 6/ "Other" trees refers to peach, cherry, pear, and plum trees. The depreciation rate applicable to "other" trees assumes that trees are replaced on a 20-year rotation. 7/ The orchard index is applicable only in determining the value of the trees. The land index (Table 3 - Section 5) is applied to 8/ The use value of trees and land is determined by adding the appropriate without-risk- land-use-value (see Table 3 - Section5) to the use value of the trees. Table5:91
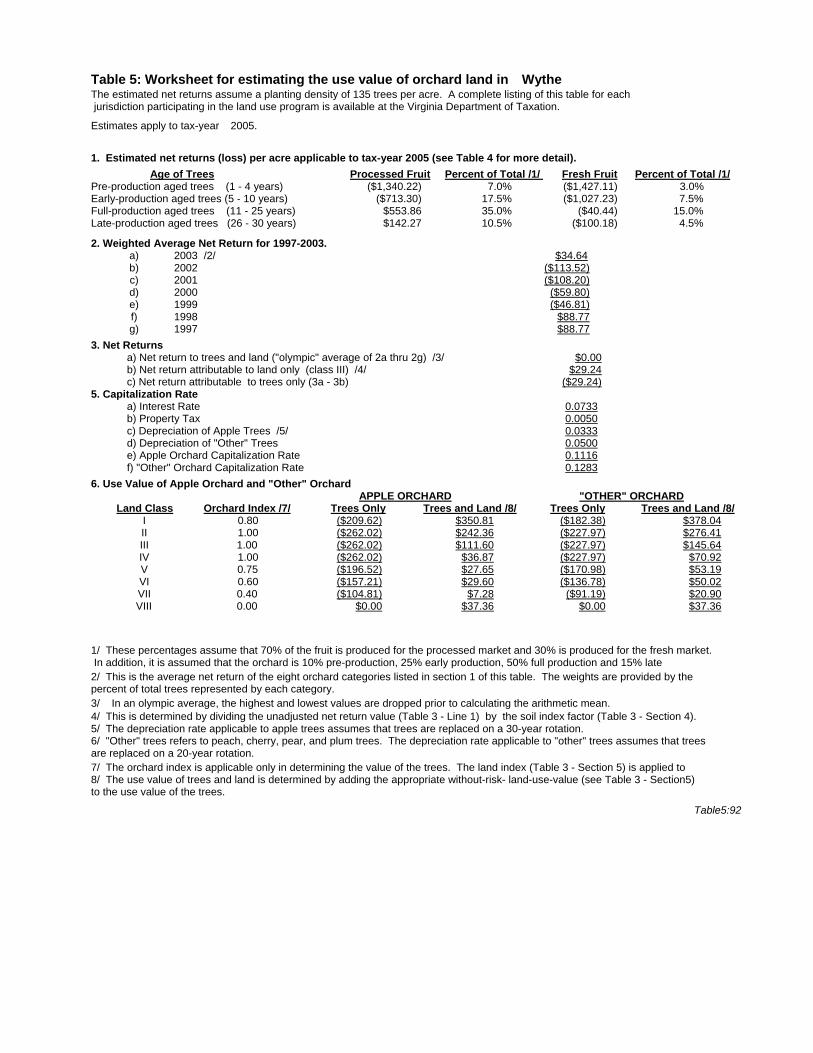
Table 5: Worksheet for estimating the use value of orchard land in Wythe The estimated net returns assume a planting density of 135 trees per acre. A complete listing of this table for each jurisdiction participating in the land use program is available at the Virginia Department of Taxation. Estimates apply to tax-year 2005.
1. Estimated net returns (loss) per acre applicable to tax-year 2005 (see Table 4 for more detail). Age of Trees Processed Fru ti Percent of To al /1/ t Fresh Fruit Percent of Total /1/ Pre-production aged trees (1 - 4 years) ($1,340.22) 7.0% ($1,427.11) 3.0% Early-production aged trees (5 - 10 years) ($713.30) 17.5% ($1,027.23) 7.5% Full-production aged trees (11 - 25 years) $553.86 35.0% ($40.44) 15.0% Late-production aged trees (26 - 30 years) $142.27 10.5% ($100.18) 4.5% 2 e a) 2003 /2/ . Weight d Average Net Return for 1997-2003.
$34.64 b) 2002 ($113.52) c) 2001 ($108.20) d) 2000 ($59.80) e) 1999 ($46.81) f) 1998 $88.77 g) 1997 $88.77 3 a) Net return to trees and land ("olympic" average o 2a thru 2g) /3/ . Net Returns
$0.00 f b) Net return attributable to land only (class III) /4/ $29.24 c) Net return attributable to trees only (3a - 3b) ($29.24) 5 a) Interest Rate . Capitalization Rate
0.0733 b) Property Tax 0.0050 c) Depreciation of Apple Trees /5 0.0333 / d) Depreciation of "Other" Trees 0.0500 e) Apple Orchard Capitalization Rate 0.1116 f) "Other" Orchard Capitalization Rate 0.1283 . Use Value of Apple Orchard and "Other" Orchard 6
APPL ORCHARDE "OTH R" ORCHARDE Land Class Orchard In ex /7/d Trees Only Trees and Land /8/ Trees Only Trees and Land /8/ I 0.80 ($209.62) $350.81 ($182.38) $378.04 II 1.00 ($262.02) $242.36 ($227.97) $276.41 III 1.00 ($262.02) $111.60 ($227.97) $145.64 IV 1.00 ($262.02) $36.87 ($227.97) $70.92 V 0.75 ($196.52) $27.65 ($170.98) $53.19 VI 0.60 ($157.21) $29.60 ($136.78) $50.02 VII 0.40 ($104.81) $7.28 ($91.19) $20.90 VIII 0.00 $0.00 $37.36 $0.00 $37.36
1/ These percentages assume that 70% of the fruit is produced for the processed market and 30% is produced for the fresh market. In addition, it is assumed that the orchard is 10% pre-production, 25% early production, 50% full production and 15% late 2/ This is the average net return of the eight orchard categories listed in section 1 of this table. The weights are provided by the percent of total trees represented by each category. 3/ In an olympic average, the highest and lowest values are dropped prior to calculating the arithmetic mean. 4/ This is determined by dividing the unadjusted net return value (Table 3 - Line 1) by the soil index factor (Table 3 - Section 4). 5/ The depreciation rate applicable to apple trees assumes that trees are replaced on a 30-year rotation. 6/ "Other" trees refers to peach, cherry, pear, and plum trees. The depreciation rate applicable to "other" trees assumes that trees are replaced on a 20-year rotation. 7/ The orchard index is applicable only in determining the value of the trees. The land index (Table 3 - Section 5) is applied to 8/ The use value of trees and land is determined by adding the appropriate without-risk- land-use-value (see Table 3 - Section5) to the use value of the trees. Table5:92

Table 5: Worksheet for estimating the use value of orchard land in York The estimated net returns assume a planting density of 135 trees per acre. A complete listing of this table for each jurisdiction participating in the land use program is available at the Virginia Department of Taxation. Estimates apply to tax-year 2005.
1. Estimated net returns (loss) per acre applicable to tax-year 2005 (see Table 4 for more detail). Age of Trees Processed Fru ti Percent of To al /1/ t Fresh Fruit Percent of Total /1/ Pre-production aged trees (1 - 4 years) ($1,340.22) 7.0% ($1,427.11) 3.0% Early-production aged trees (5 - 10 years) ($713.30) 17.5% ($1,027.23) 7.5% Full-production aged trees (11 - 25 years) $553.86 35.0% ($40.44) 15.0% Late-production aged trees (26 - 30 years) $142.27 10.5% ($100.18) 4.5% 2 e a) 2003 /2/ . Weight d Average Net Return for 1997-2003.
$34.64 b) 2002 ($113.52) c) 2001 ($108.20) d) 2000 ($59.80) e) 1999 ($46.81) f) 1998 $88.77 g) 1997 $88.77 3 a) Net return to trees and land ("olympic" average o 2a thru 2g) /3/ . Net Returns
$0.00 f b) Net return attributable to land only (class III) /4/ $31.25 c) Net return attributable to trees only (3a - 3b) ($31.25) 5 a) Interest Rate . Capitalization Rate
0.0733 b) Property Tax 0.0081 c) Depreciation of Apple Trees /5 0.0333 / d) Depreciation of "Other" Trees 0.0500 e) Apple Orchard Capitalization Rate 0.1147 f) "Other" Orchard Capitalization Rate 0.1314 . Use Value of Apple Orchard and "Other" Orchard 6
APPL ORCHARDE "OTH R" ORCHARDE Land Class Orchard In ex /7/d Trees Only Trees and Land /8/ Trees Only Trees and Land /8/ I 0.80 ($217.94) $358.09 ($190.29) $385.74 II 1.00 ($272.43) $246.00 ($237.87) $280.56 III 1.00 ($272.43) $111.59 ($237.87) $146.15 IV 1.00 ($272.43) $34.79 ($237.87) $69.35 V 0.75 ($204.32) $26.09 ($178.40) $52.01 VI 0.60 ($163.46) $28.55 ($142.72) $49.29 VII 0.40 ($108.97) $6.24 ($95.15) $20.06 VIII 0.00 $0.00 $38.40 $0.00 $38.40
1/ These percentages assume that 70% of the fruit is produced for the processed market and 30% is produced for the fresh market. In addition, it is assumed that the orchard is 10% pre-production, 25% early production, 50% full production and 15% late 2/ This is the average net return of the eight orchard categories listed in section 1 of this table. The weights are provided by the percent of total trees represented by each category. 3/ In an olympic average, the highest and lowest values are dropped prior to calculating the arithmetic mean. 4/ This is determined by dividing the unadjusted net return value (Table 3 - Line 1) by the soil index factor (Table 3 - Section 4). 5/ The depreciation rate applicable to apple trees assumes that trees are replaced on a 30-year rotation. 6/ "Other" trees refers to peach, cherry, pear, and plum trees. The depreciation rate applicable to "other" trees assumes that trees are replaced on a 20-year rotation. 7/ The orchard index is applicable only in determining the value of the trees. The land index (Table 3 - Section 5) is applied to 8/ The use value of trees and land is determined by adding the appropriate without-risk- land-use-value (see Table 3 - Section5) to the use value of the trees. Table5:93