t3c 1 clover - measuring the cosmic microwave background b
TRANSCRIPT
T3C 1
Clover - Measuring the cosmic microwavebackground B-mode polarization
P. K. Grimes4, P. A. R. Ade1, M. D. Audley2, C. Baines3, R. A. Battye3, M. L. Brown2, P. Cabella4, P. G.Calisse1, A. D. Challinor5,6 , P. J. Diamond3, W. D. Duncan7, P. Ferreira4, W. K. Gear1, D. Glowacka2, D. J.
Goldie2, W. F. Grainger1, M. Halpern8, P. Hargrave1, V. Haynes3, G. C. Hilton7, K. D. Irwin7, B. R. Johnson4,M. E. Jones4, A. N. Lasenby2, P. J. Leahy3, J. Leech4, S. Lewis3, B. Maffei3, L. Martinis3, P. Mauskopf1, S. J.Melhuish3, C. E. North1,4, D. O’Dea2, S. M. Parsley1, L. Piccirillo3, G. Pisano3, C. D. Reintsema7, G. Savini1,
R. Sudiwala1, D. Sutton4, A. C. Taylor4, G. Teleberg1, D. Titterington2, V. Tsaneva2, C. Tucker1, R. Watson3, S.Withington2, G. Yassin4, J. Zhang1 and J. Zuntz4.
Abstract—Clover is a UK-led experiment to measure the B-mode polarization of the cosmic microwave background. Theinstruments are currently under construction and deployment tothe Pampa La Bola site in the Atacama Desert is planned for2010. It consists of two 2-m class telescopes feeding backgroundlimited imaging arrays of ~100 dual polarization pixels at eachof 97, 150 and 225 GHz. The waveguide and antenna fed TESbolometers are limited by unavoidable photon noise from theatmosphere, and read-out using NIST’s time domain multiplexingscheme. The entire instrument has been designed for exception-ally low systematic errors in polarization measurements, whichhas necessitated novel designs for the instrument optics, hornarrays, OMTs and detector feeds, as well as careful developmentof the scan strategy, field location and data analysis methods.
The experiment aims to measure the polarization of the CMBwith an angular resolution of 5.5′ − 8′ across1000 deg2 of sky(angular multipole range 20 < l < 1000) to a sensitivity of8µK-arcmin after foreground cleaning. If all systematics are ad-equately controlled this will allow the detection of the primordialB-mode CMB anisotropies down to tensor to scalar ratios of0.03, as well as providing extremely accurate measurements ofthe CMB temperature, E-mode polarization, and B-mode lensingpolarization. Detecting or constraining the level of the primordialB-mode signal will allow constraints to be placed on the energyscale of inflation, providing an unprecedented insight into thephysics of the early Universe.
We describe the current status of the Clover project, includingthe current instrument design and construction status, and thedevelopment of the novel technology involved.
Index Terms—Cosmic Microwave Background, B-mode polar-ization, ground-based telescope, cosmology
I. I NTRODUCTION
PRECISE measurements of the polarization of the cosmicmicrowave background (CMB) can provide constraints on
a number of cosmological parameters, possibly including the
1School of Physics and Astronomy, Cardiff University, UK.2Cavendish Laboratory, University of Cambridge, UK.3School of Physics and Astronomy, University of Manchester, UK.4Astrophysics, Dept. of Physics, University of Oxford, UK.5Institute of Astronomy, University of Cambridge, UK.6DAMTP, University of Cambridge, UK.7National Institute of Standards and Technology, USA.8University of British Columbia, Canada.P. Cabella is now with the University of Rome, Italy.B.R. Johnson is now with the University of California, Berkeley, USA
energy scale of inflation. A measurement of the energy scaleof inflation would tell us about the physics of the Big Bangitself for the first time [1].
CMB polarization fluctuations are usually decomposed intotwo orthogonal modes; a “grad-like” E-mode with electricfield-like parity, and a “curl-like” B-mode with magneticfield-like parity [2]. Primordial density perturbations in theearly universe give rise to both the large scale distribution ofmatter in the universe and to the CMB intensity anisotropies.These density perturbations also generate the purely E-modepolarization fluctuations, or “E-modes” at about 10% of theintensity fluctuations (rms level ~5 µK).
Magnetic field-like polarization fluctuations, or “B-modes”are not generated directly by primordial density perturbations.B-modes can be either generated by gravitational lensingof the primordial CMB intensity and E-mode polarizationfluctuations by matter after decoupling of the CMB (the“B-mode lensing signal”), or by tensor fluctuations at thesurface of last scattering, caused by primordial gravity waves.These primordial B-modes are a key diagnostic of inflationarycosmology theories, with the intensity of the gravity wavefluctuations giving a key insight to the energy scale and formof the inflationary field. As such, the CMB primordial B-modesignal provides a key insight into the physics of the very earlyuniverse, allowing us to probe physics at energy scales around1016 GeV.
Based on the currentΛCDM concordance cosmologymodel, the primordial B-mode signal is expected to be atleast 10-100 times weaker than the E-mode signal. Thereforeits detection and characterization will require novel dedicatedexperiments with at least 1-2 orders of magnitude moresensitivity than current CMB polarization experiments.
A. The Clover project
Clover is a UK-led project that aims to measure the primor-dial B-mode CMB signal, or to constrain its level to a tensor-to-scalar fluctuation ratior < 0.026 in an angular multipolerange of20 < l < 1000 (8′ to 10). This is a factor of 10lower than the current limits, and would confirm or rule out anumber of theories of inflation.
97

T3C 2
Clover will spend two years making polarimetric observa-tions of approximately 1000 square degrees of the sky fromPampa la Bola on the ALMA site in the Atacama Desert,Chile. Clover consists of two ~2 m Compact Range An-tenna telescopes feeding imaging arrays of 96 dual polarizedantenna-coupled Transition Edge Sensor (TES) bolometers ateach of 97, 150 and 225 GHz. The Clover instruments usea number of techniques, including rapid constant elevationscanning, polarization modulation via half-wave plates, andabsorbing ground shields to reduce systematic errors.
The two Clover telescopes are currently being assembledby the Astrophysics group at the University of Oxford, withthe receivers undergoing cryogenic tests in the AstronomicalInstrumentation Group at Cardiff University. The science gradedetectors are currently being fabricated at the Detector PhysicsGroup, Cavendish Laboratories, Cambridge and the 97 GHzarray feed-horns and OMTs are being tested at Universityof Manchester. The two Clover instruments will then beintegrated and tested at Oxford, before shipping to Chile forinstallation and commissioning.
B. Ancillary Science Goals
Clover will also make precise measurements of the CMBintensity and E-mode signals, and will measure the non-primordial B-mode lensing signal. These measurements willprovide tighter constraints on cosmological parameters andwill complement measurements made by Planck and otherinstruments. Clover will also be sensitive to a number ofeffects due to exotic physics in the early universe, particularlyparity violation which results in correlations between the CMBintensity and E-mode signals and the B-mode signal, andB-mode signal from a background population of topologicaldefects such as cosmic strings.
II. I NSTRUMENT DESCRIPTION
A. Instrument requirements
The ambitious science goals of Clover mean that the re-quirements on both sensitivity and control of systematic errorsare extremely stringent [3]. Some of the major requirementsare listed in Table I.
Characterizing the B-mode fluctuation power spectrum for atensor-to-scalar ratio ofr = 0.026 requires mapping a sky areaof ∼ 1000 deg2 to an rms noise of1.4 µK per5.5′ pixel for the150 GHz instrument. To reach the overall sensitivity across thesurvey areas in a reasonable integration time, the system noisemust be comparable or lower than the unavoidable photonnoise from the atmospheric and astronomical background. Thisresults in stringent requirements on the detector noise, theinstrument efficiency and on spillover from the optics.
Separating the CMB polarization signal from the strongestpolarized astrophysical foreground signals (dust [4] and galac-tic synchrotron radiation [5]), requires that observations aremade at three or more frequency bands across the expectedforeground minimum at∼ 100 GHz. The chosen Clover band-passes and the expected atmospheric photon noise and trans-parency are shown in Table II.
Table ISUMMARY OF REQUIREMENTS ON THECLOVER INSTRUMENTS
Instrument Characteristic Requirement
Stokes parameters measured I, Q and U at each pixel
Multipole range 20 < l < 1000
Resolution 8′
Mapped area 1000 deg2
RMS Noise per5.5′ map pixel (Q, U ) 1.4 µK
Instrument noise limit Unavoidable photon noise
Detector NET (97, 150, 225 GHz) 150, 225, 590 µK√
Hz
Detector NEP (97, 150, 225 GHz) 2, 4, 8 × 10⁻¹⁷ W/√
Hz
# FPA pixels (97, 150, 225 GHz) 96, 96, 96
Field of view (97, 150, 225GHz) 4.10, 3.42, 4.81
ResidualQ←→ U rotation (Cross-pol) 0.24 (< 1.4%)
Q, U loss (depolarization) < 10%
ResidualT←→ Q, U mixing < 0.015%
Polarization beam misalignment < 0.2% FWHM
Beam ellipticity < 0.85
Differential beam ellipticity < 0.012
Polarization modulation efficiency > 90%
Absolute calibration < 5%
Table IICLOVER OBSERVING BANDS. MEAN τ AND NEPsky ARE CALCULATED
AT THE ZENITH FOR A 50%QUARTILE ATMOSPHERE[6].
Band Pass Meanτ NEPsky (×10−17 W/√
Hz)
82 − 112 GHz 0.014 1.67
125 − 175 GHz 0.023 3.08
192 − 258 GHz 0.047 5.43
In order to prevent instrumental polarization of the CMBintensity fluctuations from swamping the B-mode polarizationsignal, the instrumental (de-)polarization (Stokes’sI to Q, Umixing) and the beam’s differential eccentricity must be wellcontrolled. To prevent conversion of the E-mode signal intoB-mode signals the residual instrumental cross-polarization(Stokes’sQ to U rotation) after calibration must be below−50 dB. In order to characterize and subtract these systematiceffects, a number of modulation schemes are required.
B. Overall instrument design
The two Clover instruments are polarimetric imaging arrayson dedicated telescopes and mounts, with a 96 pixel focalplane array centered at 97 GHz on one telescope (the LowFrequency Instrument) and a mixed focal plane array of96 pixels centered at each of 150 and 225 GHz on thesecond telescope (the High Frequency Instrument). The chosenfrequency bands are given in Table II.
Each telescope is a∼ 1.5 − 1.8 m compact range antenna(CRA) on an alt-az mount with an additional axis allowingrotation of the whole instrument about the pointing direction
98

T3C 3
Figure 1. CAD drawing of one of the two Clover instruments. The receiveris on the left, with the absorbing ground screen surrounding the optics shownin blue.
of the telescope. The optics are designed to give extremely lowsidelobes (below 1.6% spillover power) and very low cross-polarization across a large, flat focal plane[7]. In order to re-duce the effect of polarized sidelobes from the instrument, thereceiver and optics are surrounded by co-mounted absorbingground screens that provide a constant background load forall sidelobes. An artist’s impression of one of the two Cloverinstruments is shown in fig. 1.
All the pixels consist of profiled corrugated horns, feedingturnstile waveguide OMTs [8] in the low frequency instrument(LF), and circular waveguide probe OMTs [9] integrated intothe detector chips in the 150 and 225 GHz pixels in the highfrequency instrument (HF). The outputs of the OMTs are usedto feed microstrip coupled molybdenum-copper transition edgesensor bolometers [10], via finline-to-microstrip transitions[11] in the low frequency instrument, and directly from thewaveguide probes in the high frequency instrument. Thebolometers are read using time division multiplexed (TDM)SQUID amplifiers developed by NIST and room temperaturemulti-channel electronic (MCE) systems developed by Univer-sity of British Columbia [12], [13].
During CMB observations, the primary modulation of thesky signal is provided by rapidly scanning the instrumentsacross the sky at a constant elevation, to provide a constantatmospheric power contribution, while the sky field driftsthrough the scanning elevation. The telescopes and mountshave been designed for scanning speeds up to10/s across a20 diameter field, although slower scan speeds are likely to bepreferred, to provide seperation between the pixel crossing rateand polarization modulation rate, and to reduce the observingtime overheads associated with turning the telescopes aroundat the end of each scan [14].
Polarization modulation is provided by two methods; firstlya rotating metal mesh half-wave plate is used to provide rapidpolarization modulation at the input to the focal plane arrays.This half-wave plate may be operated either in a continuouslyrotating mode, or with a stepped rotation between scans.
Figure 2. Cross-section through the LF instrument receiver. From the top,the signal from the telescope passes through the AHWP, cryostat windowand filter stack. The focal plane array of horns and OMTs are positioned justbehind the filter stack, with the blocks of 16 detectors mounted on the otherside of the100mK cold plate. The detectors are readout by a TDM SQUIDreadout system mount on the4K stage, which is in turn read by the multi-channel electronics mounted on the right hand side. The cold plate is cooledby the miniature dilution fridge at the centre of the receiver, which is in turncooled by the He7 sorption fridge and pulse tube cooler at the lower left.
Additionally, the entire instrument, including the optics, can berotated about the pointing direction. This modulation is slow,and so is likely to be used between sets of several scans, orbetween observing sessions [15].
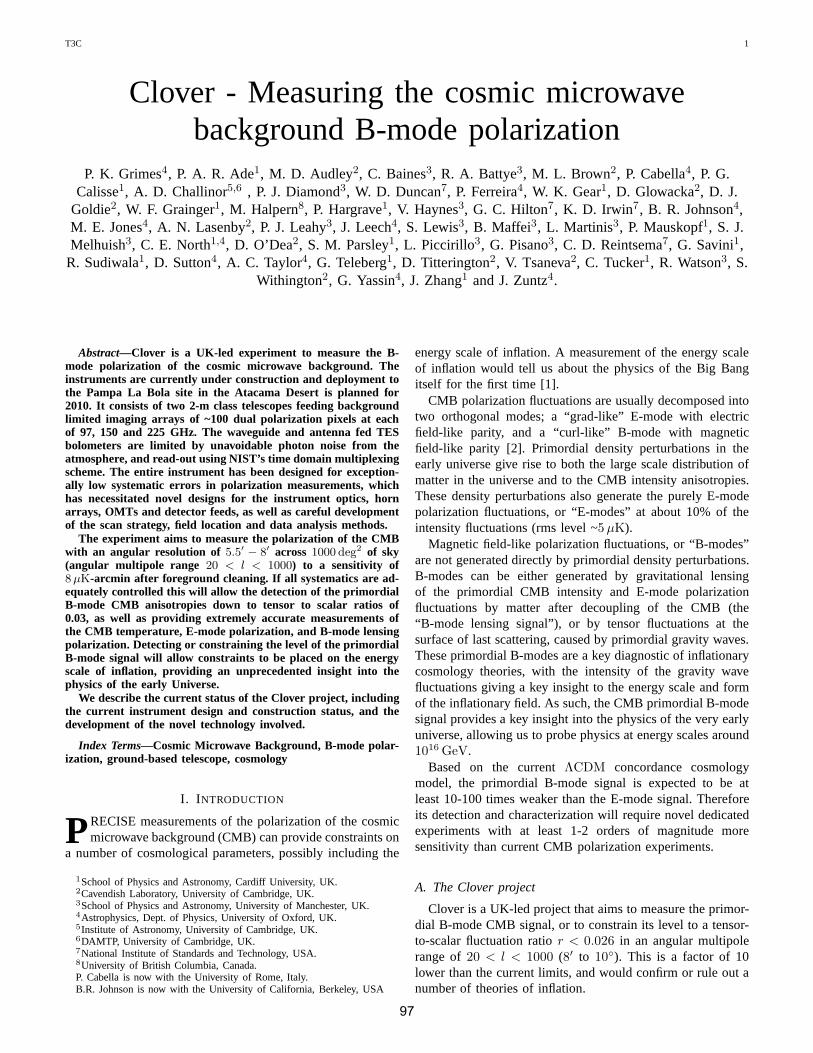
C. Optics
The Clover optics design is based on the compact rangeantenna design described in [7]. This design of antenna hasbeen shown to give excellent cross-polarization performanceacross a large flat focal plane, allowing a large numberof detectors to be fed directly without requiring additionalfocusing optics that may introduce chromatic aberrations orcross-polarization, or the complexity of a curved focal plane.
The key parameters of the design of the optics for thetwo instruments are given in table III. The performance ofboth optical systems has been extensively simulated usingthe GRASP physical optics package to minimize the cross-polarization and spillover performance while retaining thelarge focal plane areas. A summary of the optical performanceresults is given in table IV.
In order to prevent a300 K background seen by spilloversidelobes from overloading the TES bolometers, the totalpower in the sidelobes has to be kept below 1.6%. The residualfar out sidelobes are terminated on a co-mounted absorbingground shield to provide a stable polarization signal back-ground when the telescope is pointed in different directions.The calculated spillover pattern for a pixel at the edge of thefocal plane on the LF instrument is shown in fig. 4.
Each of the Clover mirrors was CNC machined from asingle piece of aluminum. The back of the mirror is light-weighted by machining away most of the backing material,leaving a number of ribs to provide structural strength and
99
T3C 4
Figure 3. Schematic of the Clover CRA optics. Light from the sky is reflectedfrom the parabolic primary mirror to the concave hyperboloidal secondarymirror before being focused on the focal plane, positioned perpendicular tothe incoming wavefront from the sky.
Table IIIPARAMETERS OF THECLOVER OPTICS
Parameter 97 GHz 150, 225 GHz
Projected aperture 1.80m 1.50 m
Effective focal length 2961 mm 2700 mm
F/# 1.64 1.80
Primary/secondary angle 65 65
Feed/secondary angle 25 25
Primary focal length 6350 mm 5790 mm
Primary offset −6778mm −6180mm
Secondary foci distance 8740 mm 7950 mm
Secondary vertex distance −4227mm −3845mm
Secondary eccentricity −2.0674419 −2.0674419
Feed FWHM 14.5 14.4, 9.4
Table IVPERFORMANCE OF THECLOVER OPTICS. IN EACH CASE, THE BEST AND
WORST PERFORMING PIXEL IS SHOWN
Parameter 97 GHz 150 GHz 225 GHz
Beamwidth 7.5′, 7.7′ 5.46′, 5.55′ 5.28′, 5.34′
Beam eccentricity 0.11, 0.21 0.14, 0.27 0.11, 0.19
Cross-polarization −39, −38 dB −43, −41 dB −45, −42 dB
First sidelobes −35, −22 dB −31, −19 dB −44, −26 dB
Far-out sidelobes < −70 dB < −70 dB -
Spillover 1.26, 1.62% 1.85, 2.60% 0.08%, 0.27%
Figure 4. Far out sidelobe pattern calculated by GRASP for an edge pixelon the Clover LF instrument.
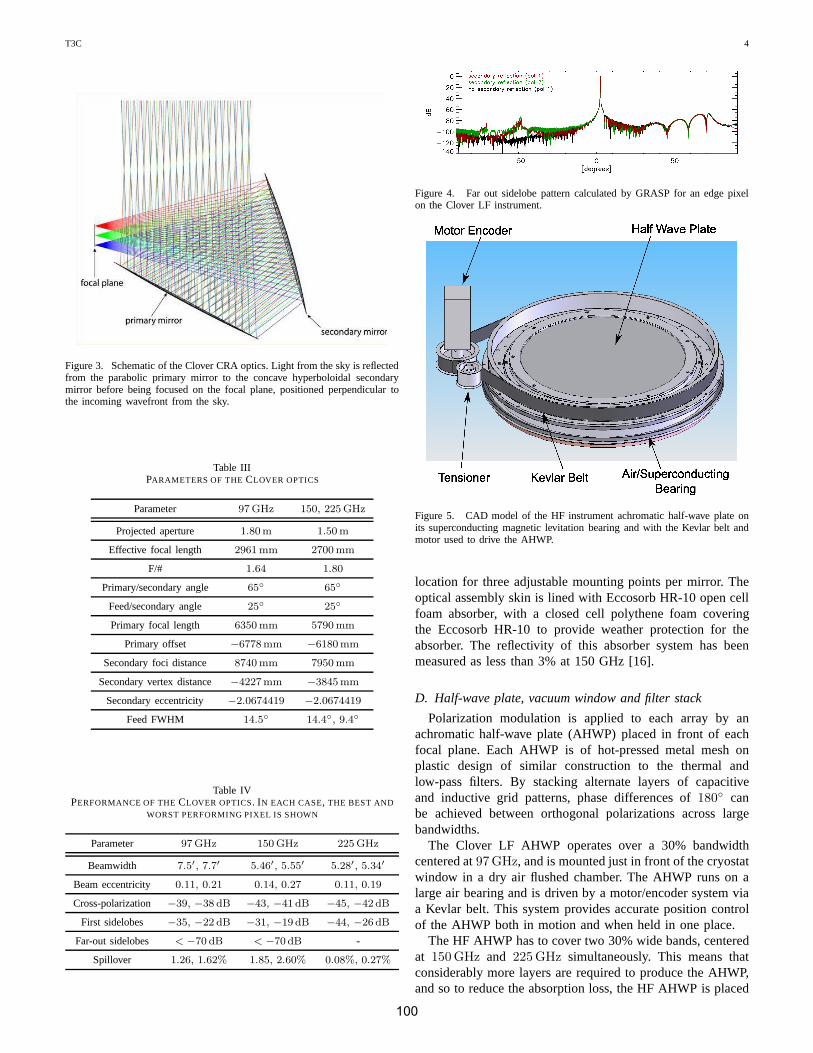
Figure 5. CAD model of the HF instrument achromatic half-wave plateonits superconducting magnetic levitation bearing and with the Kevlar belt andmotor used to drive the AHWP.
location for three adjustable mounting points per mirror. Theoptical assembly skin is lined with Eccosorb HR-10 open cellfoam absorber, with a closed cell polythene foam coveringthe Eccosorb HR-10 to provide weather protection for theabsorber. The reflectivity of this absorber system has beenmeasured as less than 3% at 150 GHz [16].
D. Half-wave plate, vacuum window and filter stack
Polarization modulation is applied to each array by anachromatic half-wave plate (AHWP) placed in front of eachfocal plane. Each AHWP is of hot-pressed metal mesh onplastic design of similar construction to the thermal andlow-pass filters. By stacking alternate layers of capacitiveand inductive grid patterns, phase differences of180 canbe achieved between orthogonal polarizations across largebandwidths.
The Clover LF AHWP operates over a 30% bandwidthcentered at97 GHz, and is mounted just in front of the cryostatwindow in a dry air flushed chamber. The AHWP runs on alarge air bearing and is driven by a motor/encoder system viaa Kevlar belt. This system provides accurate position controlof the AHWP both in motion and when held in one place.
The HF AHWP has to cover two 30% wide bands, centeredat 150 GHz and 225 GHz simultaneously. This means thatconsiderably more layers are required to produce the AHWP,and so to reduce the absorption loss, the HF AHWP is placed
100
T3C 5
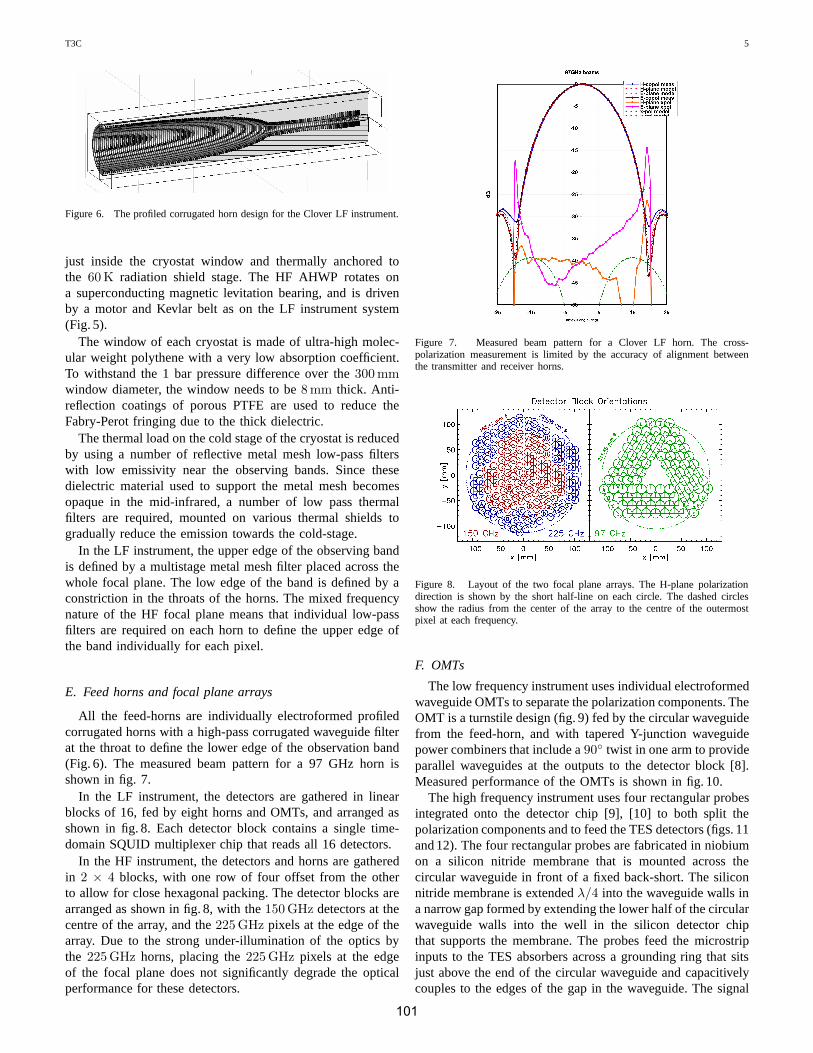
Figure 6. The profiled corrugated horn design for the Clover LF instrument.
just inside the cryostat window and thermally anchored tothe 60 K radiation shield stage. The HF AHWP rotates ona superconducting magnetic levitation bearing, and is drivenby a motor and Kevlar belt as on the LF instrument system(Fig. 5).
The window of each cryostat is made of ultra-high molec-ular weight polythene with a very low absorption coefficient.To withstand the 1 bar pressure difference over the300 mm
window diameter, the window needs to be8 mm thick. Anti-reflection coatings of porous PTFE are used to reduce theFabry-Perot fringing due to the thick dielectric.
The thermal load on the cold stage of the cryostat is reducedby using a number of reflective metal mesh low-pass filterswith low emissivity near the observing bands. Since thesedielectric material used to support the metal mesh becomesopaque in the mid-infrared, a number of low pass thermalfilters are required, mounted on various thermal shields togradually reduce the emission towards the cold-stage.
In the LF instrument, the upper edge of the observing bandis defined by a multistage metal mesh filter placed across thewhole focal plane. The low edge of the band is defined by aconstriction in the throats of the horns. The mixed frequencynature of the HF focal plane means that individual low-passfilters are required on each horn to define the upper edge ofthe band individually for each pixel.
E. Feed horns and focal plane arrays
All the feed-horns are individually electroformed profiledcorrugated horns with a high-pass corrugated waveguide filterat the throat to define the lower edge of the observation band(Fig. 6). The measured beam pattern for a 97 GHz horn isshown in fig. 7.
In the LF instrument, the detectors are gathered in linearblocks of 16, fed by eight horns and OMTs, and arranged asshown in fig. 8. Each detector block contains a single time-domain SQUID multiplexer chip that reads all 16 detectors.
In the HF instrument, the detectors and horns are gatheredin 2 × 4 blocks, with one row of four offset from the otherto allow for close hexagonal packing. The detector blocks arearranged as shown in fig. 8, with the150 GHz detectors at thecentre of the array, and the225 GHz pixels at the edge of thearray. Due to the strong under-illumination of the optics bythe 225 GHz horns, placing the225 GHz pixels at the edgeof the focal plane does not significantly degrade the opticalperformance for these detectors.
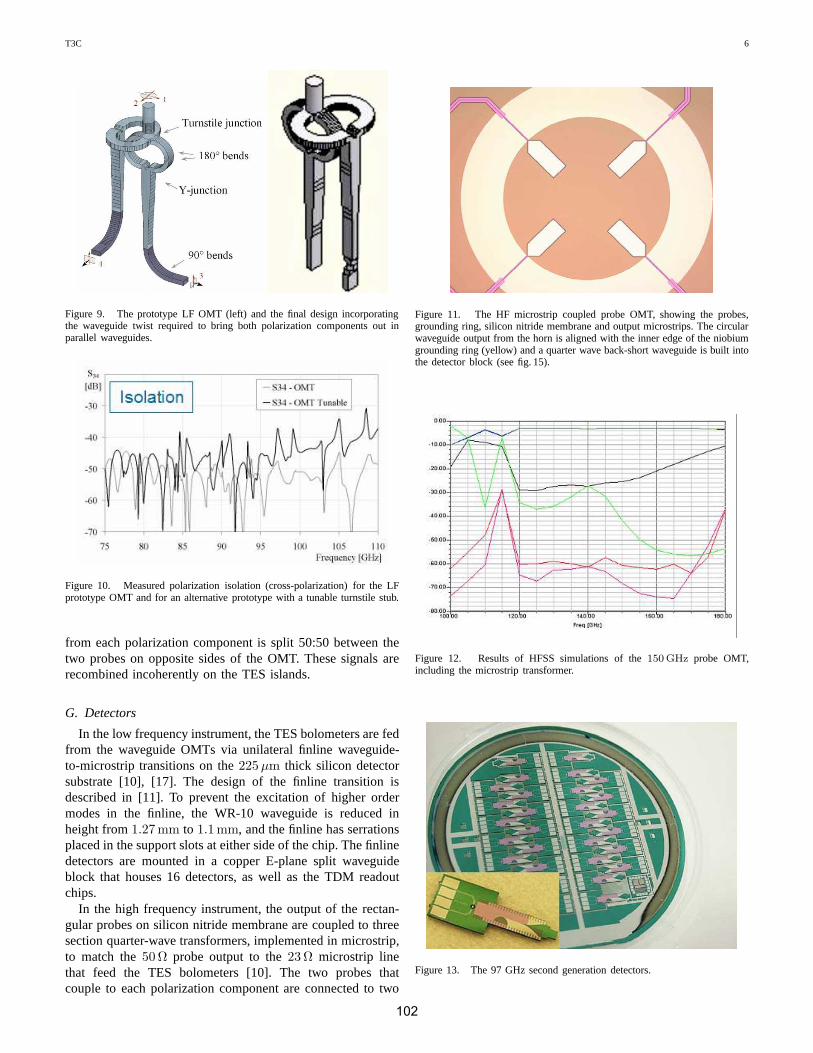
Figure 7. Measured beam pattern for a Clover LF horn. The cross-polarization measurement is limited by the accuracy of alignment betweenthe transmitter and receiver horns.
Figure 8. Layout of the two focal plane arrays. The H-plane polarizationdirection is shown by the short half-line on each circle. The dashed circlesshow the radius from the center of the array to the centre of the outermostpixel at each frequency.
F. OMTs
The low frequency instrument uses individual electroformedwaveguide OMTs to separate the polarization components. TheOMT is a turnstile design (fig. 9) fed by the circular waveguidefrom the feed-horn, and with tapered Y-junction waveguidepower combiners that include a90 twist in one arm to provideparallel waveguides at the outputs to the detector block [8].Measured performance of the OMTs is shown in fig. 10.
The high frequency instrument uses four rectangular probesintegrated onto the detector chip [9], [10] to both split thepolarization components and to feed the TES detectors (figs. 11and 12). The four rectangular probes are fabricated in niobiumon a silicon nitride membrane that is mounted across thecircular waveguide in front of a fixed back-short. The siliconnitride membrane is extendedλ/4 into the waveguide walls ina narrow gap formed by extending the lower half of the circularwaveguide walls into the well in the silicon detector chipthat supports the membrane. The probes feed the microstripinputs to the TES absorbers across a grounding ring that sitsjust above the end of the circular waveguide and capacitivelycouples to the edges of the gap in the waveguide. The signal
101
T3C 6
Figure 9. The prototype LF OMT (left) and the final design incorporatingthe waveguide twist required to bring both polarization components out inparallel waveguides.
Figure 10. Measured polarization isolation (cross-polarization) for the LFprototype OMT and for an alternative prototype with a tunable turnstile stub.
from each polarization component is split 50:50 between thetwo probes on opposite sides of the OMT. These signals arerecombined incoherently on the TES islands.
G. Detectors
In the low frequency instrument, the TES bolometers are fedfrom the waveguide OMTs via unilateral finline waveguide-to-microstrip transitions on the225 µm thick silicon detectorsubstrate [10], [17]. The design of the finline transition isdescribed in [11]. To prevent the excitation of higher ordermodes in the finline, the WR-10 waveguide is reduced inheight from1.27 mm to 1.1 mm, and the finline has serrationsplaced in the support slots at either side of the chip. The finlinedetectors are mounted in a copper E-plane split waveguideblock that houses 16 detectors, as well as the TDM readoutchips.
In the high frequency instrument, the output of the rectan-gular probes on silicon nitride membrane are coupled to threesection quarter-wave transformers, implemented in microstrip,to match the50 Ω probe output to the23 Ω microstrip linethat feed the TES bolometers [10]. The two probes thatcouple to each polarization component are connected to two
Figure 11. The HF microstrip coupled probe OMT, showing the probes,grounding ring, silicon nitride membrane and output microstrips. The circularwaveguide output from the horn is aligned with the inner edge of the niobiumgrounding ring (yellow) and a quarter wave back-short waveguide is built intothe detector block (see fig. 15).
Figure 12. Results of HFSS simulations of the150 GHz probe OMT,including the microstrip transformer.
Figure 13. The 97 GHz second generation detectors.
102
T3C 7
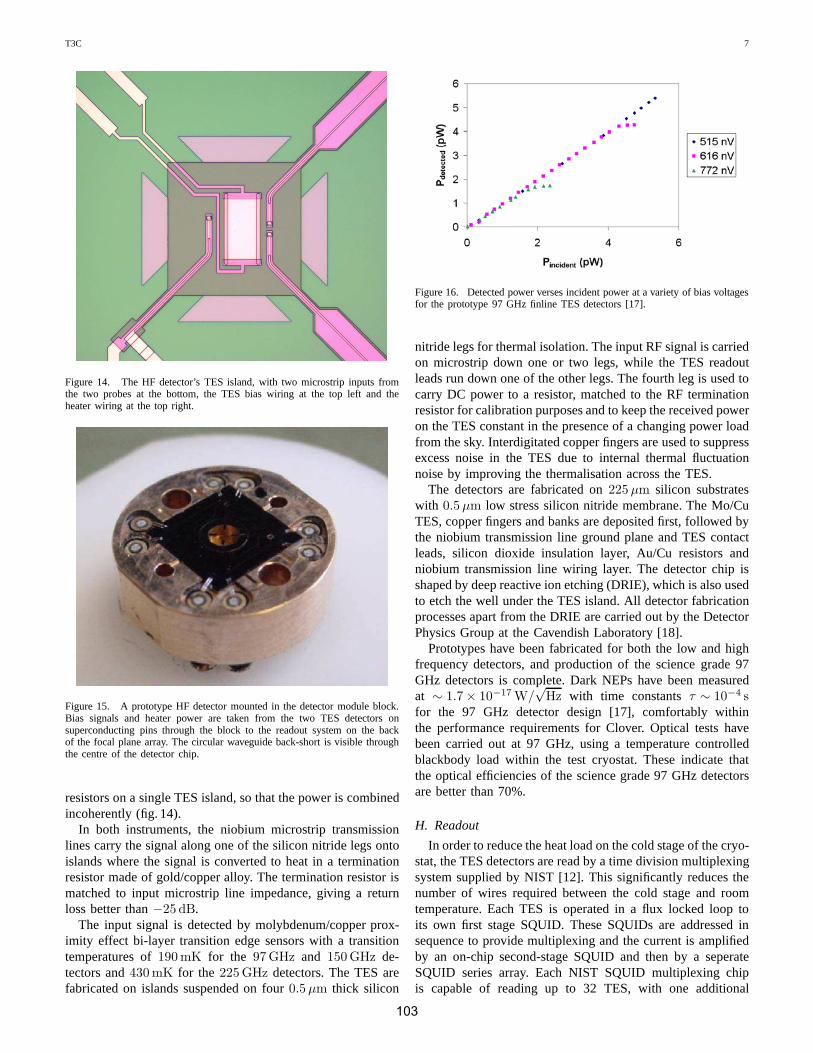
Figure 14. The HF detector’s TES island, with two microstrip inputsfromthe two probes at the bottom, the TES bias wiring at the top left and theheater wiring at the top right.
Figure 15. A prototype HF detector mounted in the detector module block.Bias signals and heater power are taken from the two TES detectors onsuperconducting pins through the block to the readout system on the backof the focal plane array. The circular waveguide back-short is visible throughthe centre of the detector chip.
resistors on a single TES island, so that the power is combinedincoherently (fig. 14).
In both instruments, the niobium microstrip transmissionlines carry the signal along one of the silicon nitride legs ontoislands where the signal is converted to heat in a terminationresistor made of gold/copper alloy. The termination resistor ismatched to input microstrip line impedance, giving a returnloss better than−25 dB.
The input signal is detected by molybdenum/copper prox-imity effect bi-layer transition edge sensors with a transitiontemperatures of190 mK for the 97 GHz and 150 GHz de-tectors and430 mK for the 225 GHz detectors. The TES arefabricated on islands suspended on four0.5 µm thick silicon
Figure 16. Detected power verses incident power at a variety of biasvoltagesfor the prototype 97 GHz finline TES detectors [17].
nitride legs for thermal isolation. The input RF signal is carriedon microstrip down one or two legs, while the TES readoutleads run down one of the other legs. The fourth leg is used tocarry DC power to a resistor, matched to the RF terminationresistor for calibration purposes and to keep the received poweron the TES constant in the presence of a changing power loadfrom the sky. Interdigitated copper fingers are used to suppressexcess noise in the TES due to internal thermal fluctuationnoise by improving the thermalisation across the TES.
The detectors are fabricated on225 µm silicon substrateswith 0.5 µm low stress silicon nitride membrane. The Mo/CuTES, copper fingers and banks are deposited first, followed bythe niobium transmission line ground plane and TES contactleads, silicon dioxide insulation layer, Au/Cu resistors andniobium transmission line wiring layer. The detector chip isshaped by deep reactive ion etching (DRIE), which is also usedto etch the well under the TES island. All detector fabricationprocesses apart from the DRIE are carried out by the DetectorPhysics Group at the Cavendish Laboratory [18].
Prototypes have been fabricated for both the low and highfrequency detectors, and production of the science grade 97GHz detectors is complete. Dark NEPs have been measuredat ∼ 1.7 × 10⁻¹⁷ W/
√Hz with time constantsτ ∼ 10−4 s
for the 97 GHz detector design [17], comfortably withinthe performance requirements for Clover. Optical tests havebeen carried out at 97 GHz, using a temperature controlledblackbody load within the test cryostat. These indicate thatthe optical efficiencies of the science grade 97 GHz detectorsare better than 70%.
H. Readout
In order to reduce the heat load on the cold stage of the cryo-stat, the TES detectors are read by a time division multiplexingsystem supplied by NIST [12]. This significantly reduces thenumber of wires required between the cold stage and roomtemperature. Each TES is operated in a flux locked loop toits own first stage SQUID. These SQUIDs are addressed insequence to provide multiplexing and the current is amplifiedby an on-chip second-stage SQUID and then by a seperateSQUID series array. Each NIST SQUID multiplexing chipis capable of reading up to 32 TES, with one additional
103

T3C 8
Figure 17. Measured noise spectrum for a prototype 97 GHz finline TESdetector [17].
dark channel. In Clover, only 16 TES will be connected toeach multiplexing chip due to packaging constraints. However,this scheme has the important advantages of reduced aliasingnoise and allowing the selection of the most similar firststage SQUIDs on each chip and bypassing failed channels.The output of the SQUID TDM system is read by roomtemperature multichannel electronics supplied by Universityof British Columbia [13].
I. Cryogenics and magnetic shielding
Both Clover’s focal plane arrays are cooled in closed-cyclethree-stage cryostats. A CryoMech PT410 pulse tube cooler,modified for lower vibration operation, provides of1 W ofcooling power at4 K, as well as the50 K stage used to coolthe radiation shields (and AHWP in the HF instrument). Aclosed cycle “He-7”3He/4He sorption fridge is mounted onthe 4 K stage, providing400 µW at 400 mK. On the400 mK
stage a closed cycle miniature dilution refrigerator [19] is usedto provide 3 µW of cooling power at100 mK to the TESdetectors. The temperature of the100 mK stage is activelycontrolled to provide a temperature stability of60 nK/
√Hz
at 100 mK, with a long-term variation of< 3.5 µK over a 24hour duty cycle. Additional temperature stages at3 K, 1.1 K
and700 mK are available for heatsinking various componentsof the sorption and dilution fridges, gas gap heat switches andcables.
A major difficulty with the cryogenics has been the require-ment that the cryostat must be tipped as the telescopes pointaround the sky. By carefully choosing the mounting angles ofthe cryocoolers and limiting the range of allowed boresight andelevation angles, then the angle of the cryocoolers can be keptto within 45 from the vertical, while pointing the telescopeup to60 from the zenith with an adequate range of boresightangles to allow polarization systematics to be detected. Thisrequirement has necessitated the development of novel designsof He-7 sorption coolers and miniature dilution refrigerators.At specific boresight angles, the telescopes can point to thehorizon, allowing sky dips and other calibration observationsto be made.
Figure 18. Pulse tube cooler head (left),4K box, He-7 sorption fridge(centre bottom) and prototype dilution fridge (centre) installed in the CloverLF cryostat.
J. Telescope mounts
Each of the two Clover instruments has its own three-axismount. Both mounts are alt-az mounts with an additional bore-sight rotation axis used to rotate the whole telescope about itspointing direction to allow for the calibration of instrumentalpolarization. Each axis is driven by an extremely compactHarmonic Drive motor/encoder assembly. The mounts areable to maintain a pointing accuracy of20”, with a long-term tracking accuracy of60”, while being able to carry outconstant elevation scans at speeds of up to10 deg/s with turn-around accelerations up to20 deg/s2.
Each mount has an optical pointing telescope mounted onthe optical assembly behind the secondary mirror, for pointingcalibration during commissioning and observations. Thesetelescopes are based on the commercial photographic lensand CCD design used on the BLAST balloon-borne telescope[20], with a change of lens and CCD to accomodate Clover’sresolution and field of view.
K. Site
Clover will be sited at Pampa la Bola, on the edge of theALMA site in the Atacama desert near San Pedro de Atacama,Chile. This4800 m altitude site provides excellent atmospherictransparency and stability at millimeter wavelengths, as wellas the possibility of sharing some infrastructure with a numberof other instruments and observatories on the site.
The latitude of the site (23 S) means that a good proportionof the sky is observable at relatively high elevations, and thuslow air-mass. This allows observing fields to be selected thathave very low levels of foreground contamination, and thatoverlap with surveys undertaken by other CMB instruments.
III. O BSERVATIONS AND DATA ANALYSIS
A. Observing fields, modes and calibration
Contamination from Galactic foregrounds is a major issuefor deep polarization observations of the CMB. In order tomaximize the observing efficiency for Clover, the required
104
T3C 9
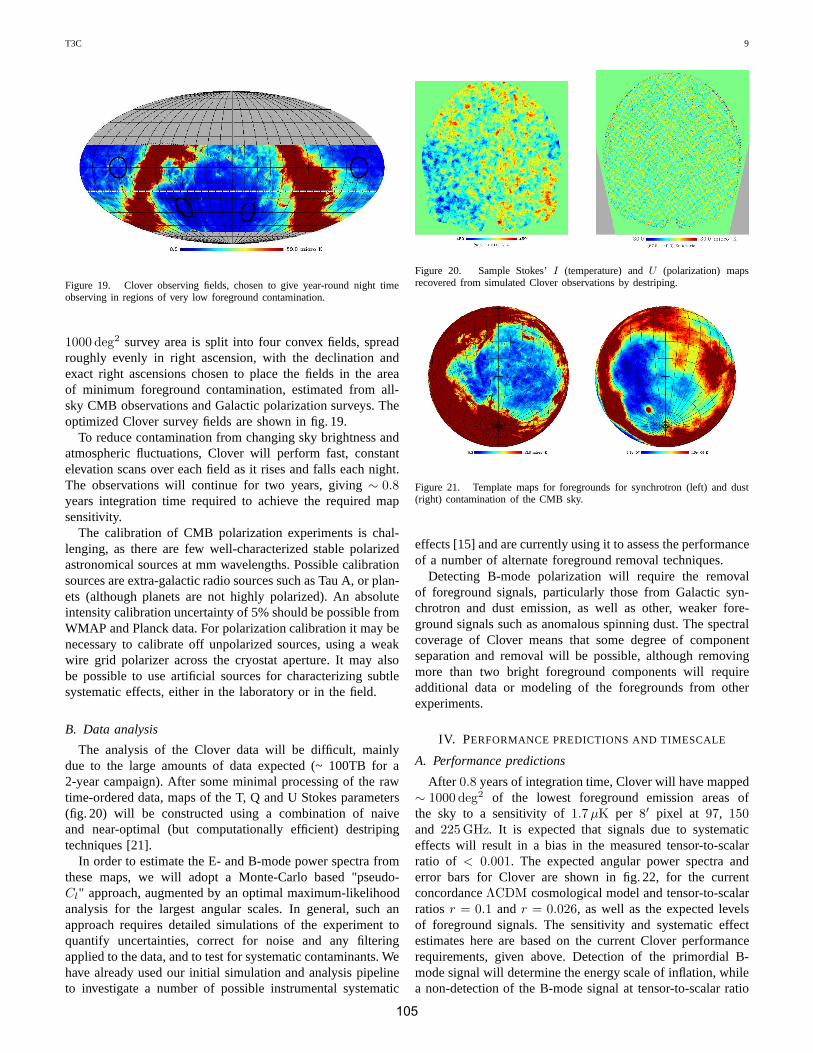
Figure 19. Clover observing fields, chosen to give year-round nighttimeobserving in regions of very low foreground contamination.
1000 deg2 survey area is split into four convex fields, spreadroughly evenly in right ascension, with the declination andexact right ascensions chosen to place the fields in the areaof minimum foreground contamination, estimated from all-sky CMB observations and Galactic polarization surveys. Theoptimized Clover survey fields are shown in fig. 19.
To reduce contamination from changing sky brightness andatmospheric fluctuations, Clover will perform fast, constantelevation scans over each field as it rises and falls each night.The observations will continue for two years, giving∼ 0.8years integration time required to achieve the required mapsensitivity.
The calibration of CMB polarization experiments is chal-lenging, as there are few well-characterized stable polarizedastronomical sources at mm wavelengths. Possible calibrationsources are extra-galactic radio sources such as Tau A, or plan-ets (although planets are not highly polarized). An absoluteintensity calibration uncertainty of 5% should be possible fromWMAP and Planck data. For polarization calibration it may benecessary to calibrate off unpolarized sources, using a weakwire grid polarizer across the cryostat aperture. It may alsobe possible to use artificial sources for characterizing subtlesystematic effects, either in the laboratory or in the field.
B. Data analysis
The analysis of the Clover data will be difficult, mainlydue to the large amounts of data expected (~ 100TB for a2-year campaign). After some minimal processing of the rawtime-ordered data, maps of the T, Q and U Stokes parameters(fig. 20) will be constructed using a combination of naiveand near-optimal (but computationally efficient) destripingtechniques [21].
In order to estimate the E- and B-mode power spectra fromthese maps, we will adopt a Monte-Carlo based "pseudo-Cl" approach, augmented by an optimal maximum-likelihoodanalysis for the largest angular scales. In general, such anapproach requires detailed simulations of the experiment toquantify uncertainties, correct for noise and any filteringapplied to the data, and to test for systematic contaminants. Wehave already used our initial simulation and analysis pipelineto investigate a number of possible instrumental systematic
Figure 20. Sample Stokes’I (temperature) andU (polarization) mapsrecovered from simulated Clover observations by destriping.
Figure 21. Template maps for foregrounds for synchrotron (left) and dust(right) contamination of the CMB sky.
effects [15] and are currently using it to assess the performanceof a number of alternate foreground removal techniques.
Detecting B-mode polarization will require the removalof foreground signals, particularly those from Galactic syn-chrotron and dust emission, as well as other, weaker fore-ground signals such as anomalous spinning dust. The spectralcoverage of Clover means that some degree of componentseparation and removal will be possible, although removingmore than two bright foreground components will requireadditional data or modeling of the foregrounds from otherexperiments.
IV. PERFORMANCE PREDICTIONS AND TIMESCALE
A. Performance predictions
After 0.8 years of integration time, Clover will have mapped∼ 1000 deg2 of the lowest foreground emission areas ofthe sky to a sensitivity of1.7 µK per 8′ pixel at 97, 150
and 225 GHz. It is expected that signals due to systematiceffects will result in a bias in the measured tensor-to-scalarratio of < 0.001. The expected angular power spectra anderror bars for Clover are shown in fig. 22, for the currentconcordanceΛCDM cosmological model and tensor-to-scalarratios r = 0.1 and r = 0.026, as well as the expected levelsof foreground signals. The sensitivity and systematic effectestimates here are based on the current Clover performancerequirements, given above. Detection of the primordial B-mode signal will determine the energy scale of inflation, whilea non-detection of the B-mode signal at tensor-to-scalar ratio
105

T3C 10
r > 0.026 will provide an upper limit on the energy scale ofless than∼ 2 × 10¹⁶ GeV.
Figure 22. Predicted power spectra for Clover after 0.8 years integrationtime, as well as the expected instrumental noise and foreground levels beforesubtraction.
B. Progress and timescale
Both Clover instruments are currently in the componentintegration phase, with the telescopes and mounts being as-sembled and tested in Oxford, the cryostat, cryogenic systemsand quasi-optical components (AHWPs, windows and filters)being assembled and tested in Cardiff and LF feed-horns andOMTs undergoing testing in Manchester. The production andtesting of science grade LF finline detector modules and testingof the TDM readout is ongoing in Cambridge, in parallel withthe final prototyping of the HF probe OMT detectors.
Assembly, integration and testing of the receivers and entireLF instrument is planned during mid to late 2009 in Cardiffand Oxford respectively, before shipping to the Clover site inChile in early 2010 for commissioning. The HF instrument isdue to follow a few months behind the LF instrument. Workon setting up the Clover site infrastructure in Chile is due tostart in the next few months.
REFERENCES
[1] A. Challinor, “Constraining fundamental physics with the cosmic mi-crowave background,”ArXiv e-print, vol. astro-ph/0606548, 2006.
[2] W. Hu and M. White, “A CMB polarisation primer,”New Astronomy,vol. 2, no. 323, 1997.
[3] D. O’Dea, A. Challinor, and B. R. Johnson, “Systematic errors in cosmicmicrowave background polarization measurements,”MNRAS, vol. 376,no. 4, p. 1767, 2007.
[4] D. P. Finkbeiner, M. Davis, and D. J. Schlegel, “Extrapolation of Galac-tic Dust Emission at 100 microns to Cosmic Microwave BackgroundRadiation Frequencies using FIRAS,”ApJ, vol. 524, p. 867, 1999.
[5] G. Giardino, A. J. Banday, K. M. Górski, K. Bennett, J. L. Jonas, andJ. Tauber, “Towards a Model of Full-sky Galactic Synchrotron Intensityand Linear Polarisation: A re-analysis if the Parkes data,”A&A, vol. 387,p. 82, 2002.
[6] A. Otarola, M. Holdaway, L.-E. Nyman, S. Radford, and B. Butler,“Atmospheric transparency at Chajnantor: 1973-2003,”ALMA MemoSeries, vol. 512, 2005.
[7] G. Yassin, P. K. Grimes, and S. B. Sorenson, “Compact optical as-semblies for large-format imaging arrays,” inProceedings of the 16thInt. Symp. on Space THz Tech., (Gothenburg, Sweden), 2005.
[8] G. Pisano, L. Pietranera, K. Isaak, L. Piccirillo, B. Johnson, B. Maffei,and S. Melhuish, “A Broadband WR10 Turnstile Junction OrthomodeTransducer,”IEEE Microwave Compon. Lett., vol. 17, no. 4, p. 286,2007.
[9] P. K. Grimes, O. G. King, G. Yassin, and M. E. Jones, “Compactbroadband planar orthomode transducer,”Electronic Letters, vol. 43,no. 21, p. 1146, 2007.
[10] M. D. Audley, D. M. Glowacka, D. J. Goldie, V. N. Tsaneva, S. With-ington, P. K. Grimes, C. E. North, G. Yassin, L. Piccirillo, G. Pisano,P. A. R. Ade, P. Mauskopf, R. V. Sudiwala, J. Zhang, K. D. Irwin,M. Halpern, and E. Battistelli, “Microstrip-coupled TES bolometers forCLOVER,” in Proceedings of the 19th Int. Symp. on Space THz Tech.,(Groningen), Apr. 2008.
[11] G. Yassin, P. K. Grimes, O. G. King, and C. E. North, “Waveguide-to-planar circuit transition for millimetre-wave detectors,”ElectronicLetters, vol. 44, no. 14, 2008.
[12] C. D. Reintsema, J. Beyer, S. W. Nam, S. Deiker, G. C. Hilton, K. D.Irwin, J. Martinis, J. Ullom, and L. R. Vale, “Prototype system forsuperconducting quantum interference device multiplexing of large-format transition-edge sensor arrays,”Rev. Sci. Instrum., vol. 74, no. 10,p. 4500, 2003.
[13] E. S. Battistelli, M. Amiri, B. Burger, M. Halpern, S. Knotek, M. Ellis,X. Gao, D. Kelly, M. Macintosh, K. Irwin, and C. Reintsema, “Func-tional Description of Read-out Electronics for Time-Domain MultiplexedBolometers for Millimeter and Sub-millimeter Astronomy,”J. LowTemp. Phys., vol. 151, p. 908, May 2008.
[14] C. E. North, B. R. Johnson, P. A. R. Ade, M. D. Audley, C. Baines,R. A. Battye, M. L. Brown, P. Cabella, P. G. Calisse, A. D. Challinor,W. D. Duncan, P. G. Ferreira, W. K. Gear, D. Glowacka, D. J. Goldie,P. K. Grimes, M. Halpern, V. Haynes, G. C. Hilton, K. D. Irwin, M. E.Jones, A. N. Lasenby, P. J. Leahy, J. Leech, B. Maffei, P. Mauskopf,S. J. Melhuish, D. O’Dea, S. M. Parsley, L. Piccirillo, G. Pisano, C. D.Reintsema, G. Savini, R. Sudiwala, D. Sutton, A. C. Taylor, G. Teleberg,D. Titterington, V. Tsaneva, C. Tucker, R. Watson, S. Withington,G. Yassin, and J. Zhang, “Detecting the B-mode Polarisation of theCMB with Clover,” ArXiv e-prints, vol. astro-ph/0805.3690, May 2008.
[15] M. L. Brown, A. Challinor, C. E. North, B. R. Johnson, D. O’Dea,and D. Sutton, “Impact of modulation on CMB B-mode polarizationexperiments,”ArXiv e-print, vol. astro-ph/0809.4032.
[16] K. W. Yoon, P. A. R. Ade, D. Barkats, J. O. Battle, E. M. Bierman,J. J. Bock, J. A. Brevik, H. C. Chiang, A. Crites, C. D. Dowell,L. Duband, G. S. Griffin, E. F. Hivon, W. L. Holzapfel, V. V. Hristov,B. G. Keating, J. M. Kovac, C. L. Kuo, A. E. Lange, E. M. Leitch,P. V. Mason, H. T. Nguyen, N. Ponthieu, Y. D. Takahashi, T. Renbarger,L. C. Weintraub, and D. Woolsey, “The Robinson Gravitational WaveBackground Telescope (BICEP): a bolometric large angular scale CMBpolarimeter,”Proceedings of the SPIE, vol. 6275, July 2006.
[17] M. D. Audley, D. M. Glowacka, D. J. Goldie, V. N. Tsaneva, S. Withing-ton, P. K. Grimes, C. E. North, G. Yassin, L. Piccirillo, P. A. R. Ade, andR. V. Sudiwala, “Performance of microstrip-coupled TES bolometerswith finline transitions,”Proceedings of the SPIE, vol. 7020, p. 70200G,2008.
[18] D. Glowacka, D. Goldie, S. Withington, M. Crane, V. Tsaneva, M. Au-dley, and A. Bunting, “A fabrication process for microstrip-coupled su-perconducting transition edge sensors giving highly reproducible devicecharacteristics,”J. Low Temp. Phys., vol. 151, p. 249.
[19] G. Teleberg, S. T. Chase, and L. Piccirillo, “A Cryogen-Free Minia-ture Dilution Refrigerator for Low-Temperature Detector Applications,”J. Low Temp. Phys., vol. 151, no. 3-4, p. 669, 2008.
[20] E. Pascale, P. A. R. Ade, J. J. Bock, E. L. Chapin, J. Chung, M. J. Devlin,S. Dicker, M. Griffin, J. O. Gundersen, M. Halpern, P. C. Hargrave,D. H. Hughes, J. Klein, C. J. MacTavish, G. Marsden, P. G. Martin,T. G. Martin, P. Mauskopf, C. B. Netterfield, L. Olmi, G. Patanchon,M. Rex, D. Scott, C. Semisch, N. Thomas, M. D. P. Truch, C. Tucker,G. S. Tucker, M. P. Viero, and D. V. Wiebe, “The Balloon-borne LargeAperture Submillimeter Telescope: BLAST,”ApJ, vol. 681, pp. 400–414, July 2008.
[21] D. Sutton, B. R. Johnson, M. L. Brown, P. Cabella, P. G. Ferreira, andK. M. Smith, “Map making in small field modulated CMB polarizationexperiments: approximating the maximum likelihood method,”MNRAS.
106