t3 tank autofrettage hydrogen
TRANSCRIPT

8/10/2019 T3 Tank Autofrettage Hydrogen
http://slidepdf.com/reader/full/t3-tank-autofrettage-hydrogen 1/11
Determination of the autofrettage pressure and estimation
of material failures of a Type III hydrogen pressure vessel
by using finite element analysis
Dae-Sung Son, Jin-Ho Hong, Seung-Hwan Chang*
School of Mechanical Engineering, Chung-Ang University 221, Huksuk-Dong, Dongjak-Gu, Seoul 156-756, Republic of Korea
a r t i c l e i n f o
Article history:
Received 29 February 2012
Received in revised form
11 June 2012
Accepted 13 June 2012
Available online 12 July 2012
Keywords:
Type III hydrogen pressure vessels
Autofrettage pressure
Winding angle
Failure criterion
a b s t r a c t
The autofrettage process of a Type III hydrogen pressure vessel for fuel cell vehicles with
preset winding pattern was simulated by finite element analysis (FEA). For a precise finite
element analysis, the ply based modeling technique was used for the composite layers;
a contour function was derived for the fibers at the dome part to determine the exact
winding angle; and the exact composite thickness was also considered. In order to deter-
mine the most appropriate autofrettage pressure, stress analysis of the pressure vessel
according to its internal pressure was carried out with consideration of the international
regulations about pressure vessel design. The minimum stress ratio, the permanent
volumetric expansion and the generated residual stress were investigated, and the failure
of the pressure vessel under minimum burst pressure was predicted by application of
various failure criteria of anisotropic composites.
Copyright ª 2012, Hydrogen Energy Publications, LLC. Published by Elsevier Ltd. All rightsreserved.
1. Introduction
Hydrogen gas produces no harmful byproducts when it burns,
so it has received much attention as a source of eco-friendly
energy [1,2]. To utilize hydrogen as a fuel source, various
storage methods have been developed. Among these
methods, the most commercialized method has been to
charge hydrogen gas in a pressure vessel at a high pressure.
One of the promising industrial fields to use hydrogen is theautomobile industry. But low energy density of hydrogen gas
has been the main reason for its low competitiveness against
existing fuels such as gasoline; therefore, high capacity
(70 MPa) pressure vessels are in demand for commercializa-
tion of hydrogen gas. To design a high capacity (70 MPa)
pressure vessel, a new material is essential, and fibrous
composites such as the carbon/epoxy composite is considered
one of the promising materials for fabricating Type III and
Type IV pressure vessels [3]. These pressure vessels are made
by the filament winding process, in which the liner is
completely wound by filaments at various winding angles. In
the filament winding process, various design factors such as
the winding pattern greatly affect the vessel performance.
Various algorithms to optimize these design factors were
studied [4e6]. Investigations on the performance of Type III
and Type IV pressure vesselsaccording to the design factors of
the filament winding process were also carried out. Camaraet al. [7] and Biea et al. [8] investigated the fatigue behavior of
composite pressure vessels by using a statistical method and
continuum damage mechanics, and they estimated the
fatigue life of the pressure vessels for various conditions. Liu
et al. [9e11] formulated an estimation method for the property
degradation of composites according to the generated stresses
in pressure vessels and then, applied this estimating method
to FEA to predict the failure-inducing pressure. Hu et al. [12]
* Corresponding author. Tel.: þ82 2 820 5354; fax: þ82 2 814 9476.E-mail address: [email protected] (S.-H. Chang).
Available online at www.sciencedirect.com
j o u r n a l h o m e p a g e : w w w . e l s e v i er . c o m / l o c a t e / he
i n t e r n a t i o n a l j o u r n a l o f h y d r o g e n e n e r g y 3 7 ( 2 0 1 2 ) 1 2 7 7 1 e1 2 7 8 1
0360-3199/$ e see front matter Copyright ª 2012, Hydrogen Energy Publications, LLC. Published by Elsevier Ltd. All rights reserved.
http://dx.doi.org/10.1016/j.ijhydene.2012.06.044

8/10/2019 T3 Tank Autofrettage Hydrogen
http://slidepdf.com/reader/full/t3-tank-autofrettage-hydrogen 2/11
investigated the failure of pressure vesselscausedby cracks in
the liner with consideration of the autofrettage process.
Tomioka et al. [13] investigated the failure strength of a pres-
sure vessel according to the environmental temperature by an
experimental approach. Unlike the Type IV pressure vessels,
the Type III pressure vessel undergoes the autofrettage
process to enhance its fatigue characteristics [14]. The auto-
frettage process generates tensile residual stress in thecomposite layers and compressive residual stress in the liner
because the excessive internal pressure (autofrettage pres-
sure) makes the liner yield. Therefore, when service pressure
is applied to the vessel, a low level tensile stress is generated
in the material, which enhances fatigue strength. The
performance of the autofrettage process is affected by the
radius of the vessel, the composite thickness and modulus,
plastic behavior of the liner, the magnitude of the autofrettage
pressure, and so on [15]. Therefore, the autofrettage pressure
should be determined by considering the shape of the pres-
sure vessel and the winding pattern of the carbon fibers.
In this paper, vessel performance according to the auto-
frettage pressure was investigated with consideration of international regulations to determine the appropriate auto-
frettage pressure for a Type III hydrogen pressure vessel with
a pre-set winding pattern. The important factors for accurate
finite element analysis of the autofrettage process are the
consideration of the anisotropic property of the composites
and the information about the liner’s plastic behavior. Even
a slight variation of these factors may generate a big differ-
ence in the analysis result because of the involvement of non-
linear plastic deformation and the interaction of stress
distributions in the two materials. Therefore, the composite
layer has to be modeled precisely, and the exact non-linear
stressestrain relationship of the liner is needed. In this
paper, the ply based modeling technique [16], which canprovide the exact stress distribution for the composite layer,
and the exact stressestrain relationship for an aluminum
liner were used for the finite element analysis. With this
modeling technique, the stresses in orthotropic directions in
every single composite layer were calculated accurately. The
variable winding angles and composite thickness at the dome
part were also considered through a contour function of the
fibers. To determine the most appropriate autofrettage pres-
sure, four major conditions from the international regulations
on the Type III pressure vessel design were applied.
2. Modeling
2.1. Geometry and material properties of the pressure
vessel
The Type III hydrogen pressure vessel with capacities of
70 MPa and 113 L was investigated and its shape and
geometric details are shown in Fig. 1. It is composed of
a port, an aluminum liner and composite layers. The
aluminum liner was fabricated by deep drawing and ironing
processes so it has a single port, as shown in Fig. 1. At the
opposite part of the port, a knob was formed to support
filaments during the filament winding process. To simulate
the actual service condition of the vessel, the port was filled
with a solid object and a tie condition was imposed on the
interface of the boss and the liner. A simple contact condi-
tion was imposed on the interface between the liner and the
composite layers because these two parts are combined by
filaments in tension and bonded by excessive resins, which
is expected to be very weak [16]. The surface contact func-
tion provided by ABAQUS 6.9-1 was used to define contact
surfaces and impose friction coefficient on the interface. Innormal direction at the interface a hard contact, which is
a general contact condition, was applied and the friction
coefficient of 0.4 [17] was imposed on the interface in
tangential direction. For a precise stress analysis with
reduced computation time, only the small axisymmetric
part (5) of the pressure vessel was modeled by using surface
symmetric condition in the hoop direction. An 8 node 3D
rectangular element (C3R8R) was used for the modeling, and
a layup tool supplied by ABAQUS 6.9-1 was used for the ply
based modeling [16] of the composite laminate. The port and
the liner were made of aluminum (6061-T6), and the ortho-
tropic property of the carbon/epoxy composite laminate
(MR60H-24K/epoxy, Grafil Inc., USA) was used for themodeling of the composite layers. This prepreg had the
same type of carbon fiber and fiber volume fraction (65%) as
the filament winding structure. The material properties
used in the finite element analysis are listed in Table 1.
As mentioned, one of the most important factors for esti-
mating the appropriate autofrettage pressure was the plastic
behavior of the liner. Therefore, the non-linear stressestrain
relationship of an aluminum 6061-T6 [18] was used in the
analysis. The composite laminate was composed of 132
windings (plies) with various winding angles (a hoop winding
(90), high helical windings (80, 75, 65) and helical windings
(30, 25, 23, 21, 18, 15, 13)). The details of the winding
patterns were not specified for company confidentiality.Because of the nature of the filament winding process, the
winding angle (J) contains simultaneously the positive (þJ)
and the negative (J) ply angles with respectto the axial axis,
so the balanced stacking sequence was used in the analysis.
Material degradation of the composite layers due to
temperature rise was not considered in this paper because the
generated temperature during fueling was expected not to
exceed 100 C [19] and the composite layers maintain its
original material property in this temperature condition [20].
2.2. Composite modeling
If a composite laminate is thin enough, the ply basedmodeling and the laminate based modeling techniques give
almost the same results [21]. But for thick composite struc-
tures such as a Type III hydrogen pressure vessel (70 MPa
class), the ply based modeling technique provides much more
precise stress distribution [16]; therefore, the ply based
modeling technique was used for the accurate stress analysis
of the autofrettage process in this study. In the ply based
modeling technique, every single winding layer (ply) of the
pressure vessel was modeled by using the composite layup
tool provided by ABAQUS 6.9-1, and the variations of the
winding angle and thickness at the dome part were also
considered. To apply the variation of the winding angle of the
carbon filaments at thedome part to the finite element model,
i n t e r n a t i o n a l j o u r n a l o f h y d r o g e n e n e r g y 3 7 ( 2 0 1 2 ) 1 2 7 7 1 e1 2 7 8 112772

8/10/2019 T3 Tank Autofrettage Hydrogen
http://slidepdf.com/reader/full/t3-tank-autofrettage-hydrogen 3/11
the fiber angle (a) was defined as the angle between the
meridian line and the fiber, which varies with the angular
position (F) and winding angle (J), as shown in Fig. 2a. It was
assumed that fibers did not slip and they traveled the shortest
path during the winding process. When the distance from an
arbitrary point D on the surface of the dome to thecentral axis
is ri the position of the point D can be expressed by (ricos A, risinA, f (ri)) where the function f (ri) is defined by the dome geom-
etry. The fiber angle (a) between a fiber direction ð F!0
Þ and the
derivative of the meridian line ðV !0
Þ can be expressed by eq. (1).
And the angular position (F) and the length of ri have the
relationship of eq. (2);
a ¼ tan1 ri f 0ðriÞ f ðriÞ ffiffiffiffiffiffiffiffiffiffiffiffiffiffiffiffiffiffiffiffiffiffiffiffiffiffi1 þ f f 0ðriÞg
2q ffiffiffi ffiffi ffiffi ffiffi ffiffi ffiffi ffiffi ffiffi ffiffi ffiffi ffiffi ffiffi ffiffi ffiffi ffiffi ffiffi ffiffi ffiffi ffiffi
ricot2J f f ðriÞg2
q (1)
tan F ¼ f ðriÞ
ri(2)
By combining the eqs. (1) and (2), the fiber angle (a) can be
expressed as a function of the angular position (F) [16].Therefore, once the winding angle (J) is known, the fiber angle
(a) at an arbitrary angular position (F) can be identified. The
variation of the fiber angle of helical windings (80, 75, 65, 30,
25, 23, 21, 18, 15, 13) was calculated, as shown in Fig. 2b.
Thehoop winding (90) was not carried out atthe dome part. To
consider the thickness variation along the angular position,
a prototype of the pressure vessel was cut and the actual
composite thickness of the dome part wasmeasured, as shown
in Fig. 3a. At the dome part, there was no hoop winding, which
occupied a large portion of the winding angles at the cylinder
part, and the fiber density increased along the angular position
(see Fig. 3b); therefore, the total composite thickness at the
dome part increased overall along the angular position. The
initial decrease of the composite thickness was caused by the
absence of hoop winding and the small areal coverage of the
high helical winding fibers (80, 75, 65), which covered around
20 of the angular position, as shown in Fig. 2b.
To estimate a single ply thickness, it was assumed that the
composite thickness variation at the dome part did not
correlate with the winding angle. After considering thecoverage area of each fiber for different winding angles, the
single ply thickness was calculated, as shown in Fig. 3a. To
apply this thickness variation to the finite element model,
additional balanced plies were added to the existing
composite laminate, as shown in Fig. 3b, and this method
helped to simulate the actual winding pattern and the shape
of the dome part. And for realizing a more accurate winding
angle, the local coordinate system of each finite element was
used to align the fiber direction along the actual winding
direction. The additional modeling details are described in the
preliminary study [16].
3. Determination of the autofrettagepressure
3.1. Conditions for determining autofrettage pressure
Among many international regulations on the design of
pressure vessels, the compressed gaseous hydrogen regula-
tion [22], which was proposed by European Integrated
Hydrogen Project e Phase II (EIHP-II), and the ISO 15869:2009
[23] were considered in the determination of the appropriate
autofrettage pressure of a Type III hydrogen pressure vessel.
The important conditions for determining autofrettage pres-
sure are as follows;
Fig. 1 e Finite element model of a Type III hydrogen pressure vessel.
i n t e r n a t i o n a l j o u r n a l o f h y d r o g e n e n e r g y 3 7 ( 2 0 1 2 ) 1 2 7 7 1 e1 2 7 8 1 12773

8/10/2019 T3 Tank Autofrettage Hydrogen
http://slidepdf.com/reader/full/t3-tank-autofrettage-hydrogen 4/11

8/10/2019 T3 Tank Autofrettage Hydrogen
http://slidepdf.com/reader/full/t3-tank-autofrettage-hydrogen 5/11
Narayanaswami et al. [27] proved that the most accurate
failure prediction can be obtained when the inter-stress
strength tensor F12 becomes zero or the value of Hoffman’s
suggestion. Because the value of F12 in Hoffman’s suggestion
depends on the fiber directional strength (Xt, Xc), the value of
F12 becomes very low, almost zero, as shown in Fig. 5. In this
paper, the material failure of the composite part was esti-
mated for the four failure criteria (maximum stress and
strain criteria, Tsai-Wu failure criterion, Hoffman failure
criterion), and the results were compared.
4. Analysis results
4.1. Permanent volumetric expansion
The permanent volume expansion (r) presented in [Condition
2] in the previous chapter is defined as the ratio of the
permanent volume change to the total volume change under
the test pressure condition after the autofrettage process, and
is expressed by the following relation;
Fig. 2e
Determination of fiber angle and areal coverage according to the angular position; (a) schematic diagram for definingthe fiber angle according to dome geometry, (b) variations of fiber angle according to the angular position and helical
winding angle.
i n t e r n a t i o n a l j o u r n a l o f h y d r o g e n e n e r g y 3 7 ( 2 0 1 2 ) 1 2 7 7 1 e1 2 7 8 1 12775

8/10/2019 T3 Tank Autofrettage Hydrogen
http://slidepdf.com/reader/full/t3-tank-autofrettage-hydrogen 6/11

8/10/2019 T3 Tank Autofrettage Hydrogen
http://slidepdf.com/reader/full/t3-tank-autofrettage-hydrogen 7/11
stress at the service pressure. The minimum burst pressure
was 164.5 MPa, which was 2.35 times the service pressure
(70 MPa) as defined in ’EIHP-II’ [22]. The stress ratios decreased
as the autofrettage pressure increased, as shown in Fig. 6b.
This decrease was due to the fact that the fiber stress under
service pressure increased with the autofrettage pressure
because higher autofrettage pressures generated higher levels
of tensile residual stress in the composite layers. But the fiberstress under the minimum burst pressure was seldom
affected by the level of autofrettage pressure because of the
relatively low level of the residual stress compared to the total
fiber stress. When the autofrettage pressures are in the ranges
of 105e107 MPa, the minimum stress ratio becomes higher
than 2.35, which satisfies [Condition 3].
4.3. Failure prediction under the minimum burst
pressure
The Type III hydrogen pressure vessel should be safe under
the minimum burst pressure (164.5 MPa) based on the regu-
lation ([Condition 4]). Therefore, the possibility of any failures
both in the aluminum liner and the composite layers was
investigated by using finite element analysis. The four failure
criteria were used to estimate any material failures in the
composite layers. First, the stresses of the aluminum liner
under various pressure conditions were plotted against the
autofrettage pressure in Fig. 6b. The aluminum liner stresses
decreased as the autofrettage pressure increased under the
service pressure condition but they showed little change
under the minimum burst pressure condition. The maximum
stress (314.9 MPa) generated in the aluminum liner was lower
than the ultimate strength (333.72 MPa) of the aluminum liner,
so the liner will not fracture.
To estimate the failure of the composite layers of the
pressure vessel, the case of 107 MPa autofrettage pressure
amongst 105 MPa, 106 MPa and 107 MPa, which satisfied the
Pressure
Step
Autofrettage
Pressure
Zero
Pressure-1(0MPa)
Service
Pressure(70MPa)
Test
Pressure(105MPa)
Zero
Pressure-2(0MPa)
Pressure
Step
Autofrettage
Pressure
Zero
Pressure(0MPa)
Service
Pressure(70MPa)
Test
Pressure(105MPa)
Minimum Burst
Pressure(164.5MPa)
a
b
Fig. 4 e
Loading histories for determining (a) permanent volumetric expansion, (b) the minimum stress ratio and
material failure.
Fig. 5 e
Comparison of various failure criteria.
i n t e r n a t i o n a l j o u r n a l o f h y d r o g e n e n e r g y 3 7 ( 2 0 1 2 ) 1 2 7 7 1 e1 2 7 8 1 12777
8/10/2019 T3 Tank Autofrettage Hydrogen
http://slidepdf.com/reader/full/t3-tank-autofrettage-hydrogen 8/11
[Condition 3], was investigated. Once the pressure vessel thatexperienced 107 MPa autofrettage pressure remained safe, the
other cases were considered to be theoretically safe because
higher autofrettage pressures generate higher residual
stresses in the composite layer of the pressure vessel. But the
generated fiber stress according to the autofrettage pressure
was almost uniform, as shown in Fig. 6b, so the failure
behavior of the composite layers was expected to be the same
for the other autofrettage pressure conditions.
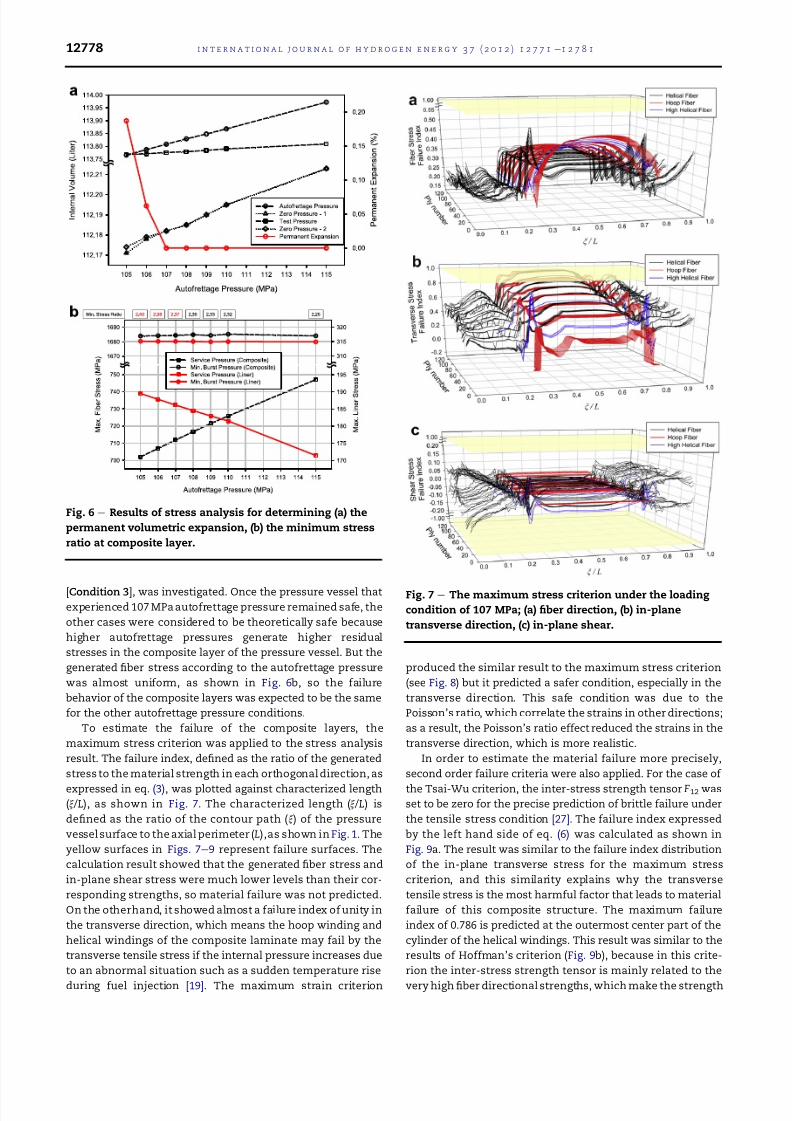
To estimate the failure of the composite layers, the
maximum stress criterion was applied to the stress analysis
result. The failure index, defined as the ratio of the generated
stress to the material strength in each orthogonal direction, as
expressed in eq. (3), was plotted against characterized length(x /L), as shown in Fig. 7. The characterized length (x /L) is
defined as the ratio of the contour path (x) of the pressure
vessel surface to the axial perimeter (L),as shown in Fig. 1. The
yellow surfaces in Figs. 7e9 represent failure surfaces. The
calculation result showed that the generated fiber stress and
in-plane shear stress were much lower levels than their cor-
responding strengths, so material failure was not predicted.
On the otherhand, it showed almost a failure index of unity in
the transverse direction, which means the hoop winding and
helical windings of the composite laminate may fail by the
transverse tensile stress if the internal pressure increases due
to an abnormal situation such as a sudden temperature rise
during fuel injection [19]. The maximum strain criterion
produced the similar result to the maximum stress criterion
(see Fig. 8) but it predicted a safer condition, especially in the
transverse direction. This safe condition was due to the
Poisson’s ratio, which correlate the strains in other directions;
as a result, the Poisson’s ratio effect reduced the strains in the
transverse direction, which is more realistic.
In order to estimate the material failure more precisely,
second order failure criteria were also applied. For the case of
the Tsai-Wu criterion, the inter-stress strength tensor F12 wasset to be zero for the precise prediction of brittle failure under
the tensile stress condition [27]. The failure index expressed
by the left hand side of eq. (6) was calculated as shown in
Fig. 9a. The result was similar to the failure index distribution
of the in-plane transverse stress for the maximum stress
criterion, and this similarity explains why the transverse
tensile stress is the most harmful factor that leads to material
failure of this composite structure. The maximum failure
index of 0.786 is predicted at the outermost center part of the
cylinder of the helical windings. This result was similar to the
results of Hoffman’s criterion (Fig. 9b), because in this crite-
rion the inter-stress strength tensor is mainly related to the
very high fiber directional strengths, which make the strength
Fig. 6 e Results of stress analysis for determining (a) the
permanent volumetric expansion, (b) the minimum stress
ratio at composite layer.
Fig. 7 e The maximum stress criterion under the loading
condition of 107 MPa; (a) fiber direction, (b) in-plane
transverse direction, (c) in-plane shear.
i n t e r n a t i o n a l j o u r n a l o f h y d r o g e n e n e r g y 3 7 ( 2 0 1 2 ) 1 2 7 7 1 e1 2 7 8 112778

8/10/2019 T3 Tank Autofrettage Hydrogen
http://slidepdf.com/reader/full/t3-tank-autofrettage-hydrogen 9/11
tensor very low, comparable to zero. Both of the two criteria
predict a sharp rise of stresses at the border between the dome
and the cylinder parts as shown in Fig. 9. This stress distri-
bution may cause problems under a fatigue loading condition;
therefore, a special design consideration such as winding
pattern changes needs to be taken into account.
The failure analysis of the Type III hydrogen pressure
vessel with an autofrettage pressure of 107 MPa proved the
safety of the vessel without any material failures. It was also
proved that this autofrettage pressure satisfied all the condi-tions of a safe design of a Type III hydrogen pressure vessel.
5. Discussions
In order to determine the autofrettage pressure of a Type III
pressure vessel, the four design conditions should be satisfied
and the generated stresses need to be low for high fatigue life.
First, the range of appropriate autofrettage pressures which
satisfied the four design conditions for the current pressure
vessel with a pre-set winding pattern were estimated
(105 MPae107 MPa). The most appropriate autofrettage pres-
sure should be determined in this range by using the stress
analysis results. First, to enhance the fatigue characteristics,
a low rate of permanent volume expansion was preferable
based on [Condition 2]. Second, as the minimum stress ratio
increased, the composite layers became safer, but it raised
stresses in the liner. The preferable autofrettage pressure
should make the minimum stress ratio exceed the allowable
value of 2.35 slightly, and should minimize the liner’s stress
based on [Condition 3] because fibrous composites have goodfatigue characteristics. As a result, the autofrettage pressure
that guaranteed structural safety and the lowest permanent
volume expansion (see Fig. 6a), made the minimum stress
ratio exceed 2.35, and generated the lowest stress in the liner
was found to be 107 MPa, as shown in Fig. 6b.
A simple contact surface condition rather than a perfect
bonding condition at the interface was used to estimate the
stress distribution of a pressure vessel during autofrettage
process.
Based on the measurement of the bonding strength of
a carbon/epoxy composite-aluminum single lap joint [28] and
preliminary experimental investigation the level of bonding
strength of a carbon/epoxy composite-aluminum single lap joint is below 15 MPa but the analyzed bonding stress of the
Type III hydrogen pressure vessel at the interface is higher
than 17 MPa for the case of perfect bonding condition, which
represents the bonding layer fails during the autofrettage
process. Therefore, the perfect bonding condition is not able
to represent the actual behavior of the interface during the
autofrettage process.
In order to check the effect of the friction coefficient at the
interface the lower level of friction coefficient (0.25) was also
applied and the result was compared with the case of the
higher friction coefficient (0.4) which was used for estimating
the stress distribution of the pressure vessel. The lower level
of friction coefficient (0.25) generated almost the same stress
Fig. 8 e
The maximum strain criterion under the loadingcondition of 107 MPa; (a) fiber direction, (b) in-plane
transverse direction, (c) in-plane shear.
Fig. 9 e The second order failure criteria of orthotropic
materials; (a) Tsai-Wu criterion, (b) Hoffman criterion.
i n t e r n a t i o n a l j o u r n a l o f h y d r o g e n e n e r g y 3 7 ( 2 0 1 2 ) 1 2 7 7 1 e1 2 7 8 1 12779

8/10/2019 T3 Tank Autofrettage Hydrogen
http://slidepdf.com/reader/full/t3-tank-autofrettage-hydrogen 10/11
distribution as the case of 0.4 friction coefficient in all the
materials under the loading history.
It seemed a friction coefficient within moderate range
seldom affected the stress distribution.
On the other hand, for the case of the perfect bonding
condition, it generated higher stress in the liner and the
composite layers under the service condition after the auto-
frettage process. This was caused by the fact that this condi-tion did not allow any relative motion between the composite
layers and the aluminum liner at the interface.As a result, the
perfect bonding condition generated 15 MPa and 20 MPa
higher stresses in the cylinder part and in the dome part of the
liner, respectively than those of the case of surface contact
condition and this may affect the determination of the auto-
frettage pressure.
For more reliable design of the pressure vessel some more
design consideration needs to be investigated.
The temperature dependence on vessel mechanical
performance was not considered in this paper. Based on the
analysis result of temperature rise during the hydrogen
fueling process [19] it was expected that the temperaturewould rise to around 100 C when the pressure vessel was
filling from empty to 70 MPa. The mechanical properties of the
carbon/epoxy composite used in this paper maintains its
original value until the service temperature of 100 C [20],
which represent the calculation results of the material
behavior and the autofrettage pressure are reliable. But the
temperature may rise over 100 C for unexpected circum-
stances, therefore it is needed to investigate the temperature
effect on the behavior of the pressure vessel including the
determination of the autofrettage pressure, which is a part of
our future work.
The stressestrain relationship of the aluminum liner
affects much the determination of the autofrettage pressurebecause of the non-linear behavior of the aluminum liner. If
the yield stress increases by 5% with Young’s modulus
unchanged the liner stress under the service condition after
the autofrettage process will increase by 3.3%. But, if the yield
stress decreases by 5% the liner stress decreases by 10.9%
under the same condition. This represents the exact non-
linear relationship of the stressestrain curve is essential to
determine the appropriate autofrettage pressure. On the other
hand, the variation of Young’s modulus does not affect much
the stress distribution in the liner, which represents the
moderate changes of Young’s modulus does not contribute to
the changes of the autofrettage pressure.
6. Conclusions
In this paper the appropriate autofrettage pressure for a Type
III hydrogen pressure vessel for fuel cell vehicles with a preset
winding pattern was determined by stress analysis with
consideration of the related international regulations.
Because the effect of the level of autofrettage pressure on
stress generation in materials and service life of a vessel is
great, the stress was accurately calculated by finite element
analysis. To calculate the stress distribution accurately in the
composite layers and the aluminum liner according to the
level of autofrettage pressure, the ply based modeling
technique for the composite layers was carried out to model
the pressure vessel. To estimate the changes in stress distri-
butions in the materials ofthe pressure vessel such as those of
the generated residual stresses after the autofrettage process,
which induces yielding of the liner, a non-linear stressestrain
relationship was considered. Moreover, to calculate the exact
winding angle at the dome parts, a contour function was
derived for the fibers, and by using this, the exact arealcoverage of a fiber at a certain winding angle was accurately
estimated. And the thickness variation of the composite
layers at the dome part was also considered by measuring the
actual composite thickness after cutting the vessel prototype.
From the analysis results, it wasfound that as the autofrettage
pressure increased, the permanent volumetric expansion
decreased and the compressive residual stress in a liner
increased, which enhanced the structural performance of the
pressure vessel. To determine the most appropriate auto-
frettage pressure of the Type III hydrogen pressure vessel, the
four conditions ([Condition 1]e[Condition 4]) proposed by
European Integrated Hydrogen Project e Phase II and ISO
15869:2009 were considered. The appropriate autofrettagepressure was determined to be 107 MPa.
The modeling technique and the process to determine the
autofrettage pressure presented in this paper can be utilized
in theoptimal design of a Type III pressure vessel to determine
the optimal winding pattern and liner shape.
Acknowledgments
This research was supported by the Chung-Ang University
Excellent Student Scholarship and partly by the research
program of “Estimation of the material property for FCV Type
III Hydrogen Storage Vessel (70 MPa)” through Ministry of
Knowledge and Economy of Korea.
r e f e r e n c e s
[1] Neelis ML, van der Kooi HJ, Geerlings JJC. Exergetic life cycleanalysis of hydrogen production and storage systems forautomotive applications. Int J Hydrogen Energy 2004;29:537e45.
[2] Aceves SM, Berry GD, Martinez-Frias J, Espinosa-Loza F.
Vehicular storage of hydrogen in insulated pressure vessels.Int J Hydrogen Energy 2006;31:2274e83.
[3] Zheng J, Liu X, Xu P, Liu P, Zhao Y, Yang J. Development of high pressure gaseous hydrogen storage technologies. Int JHydrogen Energy 2012;37:1048e57.
[4] Xu P, Zheng J, Chen H, Liu P. Optimal design of high pressurehydrogen storage vessel using an adaptive genetic algorithm.Int J Hydrogen Energy 2010;35:2840e6.
[5] Kim CU, Hong CS, Kim CG, Kim JY. Optimal design of filament wound type 3 tanks under internal pressure using a modified genetic algorithm. Comp Struct 2005;71:16e25.
[6] Liu P, Xu P, Zheng J. Artificial immune system for optimaldesign of composite hydrogen storage vessel. Comput MatSci 2009;47:261e7.
[7] Camara S, Bunsell AR, Thionnet A, Allen DH. Determination
of lifetime probabilities of carbon fibre composite plates and
i n t e r n a t i o n a l j o u r n a l o f h y d r o g e n e n e r g y 3 7 ( 2 0 1 2 ) 1 2 7 7 1 e1 2 7 8 112780

8/10/2019 T3 Tank Autofrettage Hydrogen
http://slidepdf.com/reader/full/t3-tank-autofrettage-hydrogen 11/11
pressure vessels for hydrogen storage. Int J Hydrogen Energy2011;36:6031e8.
[8] Bie H, Li X, Liu P, Liu Y, Xu P. Fatigue life evaluation of highpressure hydrogen storage vessel. Int J Hydrogen Energy2010;35:2633e6.
[9] Liu PF, Zheng JY. Strength reliability analysis of aluminum-carbon fiber/epoxy composite laminates. J Loss Prev ProcessIndust 2010;23:231e7.
[10] Liu PF, Zheng JY. Recent developments on damage modeling and finite element analysis for composite laminates:a review. Mater Des 2010;31:3825e34.
[11] Liu PF, Zheng JY. Progressive failure analysis of carbon fiber/epoxy composite laminates using continuum damagemechanics. Mater Sci Eng A 2008;485:711e7.
[12] Hu J, Chandrashekhara K. Fracture analysis of hydrogenstorage composite cylinders with liner crack accounting forautofrettage effect. Int J Hydrogen Energy 2009;34:3425e35.
[13] Tomioka J, Kiguchi K, Tamura Y, Mitsuishi H. Influence of temperature on the fatigue strength of compressed-hydrogen tanks for vehicles. Int J Hydrogen Energy 2011;36:2513e9.
[14] Adibi-Asl R, Livieri P. Analytical approach in autofrettagedspherical pressure vessels considering the Bauschinger
effect. J Press Vess-T 2007;129:411e9.[15] Jahromi BH, Ajdari A, Nayeb-Hashemi H, Vaziri A.
Autofrettage of layered and functionally gradedmetaleceramic composite vessels. Comp Struct 2010;92:1813e22.
[16] Son DS, Chang SH. Evaluation of modeling techniques fora type III hydrogen pressure vessel (70 MPa) made of analuminum liner and a thick carbon/epoxy composite for fuelcell vehicles. Int J Hydrogen Energy 2012;37:2353e69.
[17] Schon J. Coefficient of friction for aluminum in contact witha carbon fiber epoxy composite. Tribol Int 2004;37(5):395e404.
[18] Military handbook; December 1998. MIL-HDBK-5H.[19] Kim SC, Lee SH, Yoon KB. Thermal characteristics during
hydrogen fueling process of type IV cylinder. Int J HydrogenEnergy 2010;35:6830e5.
[20] Kang DH, Park SW, Kim SH, Kim CG, Hong CS. Measurement
of material properties of composites under high temperatureusing fiber bragg grating sensors. J Korean Soc Compos Mater2003;16:41e7 [Korean].
[21] Kim CU, Kang JH, Hong CS, Kim CG. Optimal design of filament wound structures under internal pressure based onthe semi-geodesic path algorithm. Comp Struct 2005;67:443e52.
[22] GRPE information group: hydrogen/fuel cell vehicles, draftECE compressed gaseous hydrogen regulation. EIHP II; 2003.
[23] ISO 15869. Gaseous hydrogen and hydrogen blends d landvehicle fuel tanks; 2009.
[24] Lee DG, Suh NP. Axiomatic design and fabrication of composite structures. New York: Oxford University Press;2006.
[25] Pipes RB, Cole BW. On the off-axis strength test for
anisotropic materials. J Comp Mater 1973;7:245e56.[26] Collins BR, Crane RL. A graphical representation of the
failure surface of a composite. J Comp Mater 1971;5:408e13.[27] Narayanaswami R, Adelman HM. Evaluation of the tensor
polynomial and Hoffman strength theories for compositematerials. J Comp Mater 1977;11:366e77.
[28] Park SW, Kim HS, Lee DG. Optimum design of the co-cureddouble lap joint composed of aluminum and carbon epoxycomposite. Comp Struct 2006;75:289e97.
i n t e r n a t i o n a l j o u r n a l o f h y d r o g e n e n e r g y 3 7 ( 2 0 1 2 ) 1 2 7 7 1 e1 2 7 8 1 12781