t l business systems manager - ibmpublib.boulder.ibm.com/tividd/td/bsm/sc32-9086-00/... · shift...
TRANSCRIPT

Tivoli® Business
Systems
Manager
Introducing
the
Consoles
Version
3.1
SC32-9086-00
���


Tivoli® Business
Systems
Manager
Introducing
the
Consoles
Version
3.1
SC32-9086-00
���

Note
Before
using
this
information
and
the
product
it
supports,
read
the
information
in
“Notices”
on
page
87.
First
Edition
(October
2004)
This
edition
applies
to
Version
3,
Release
1
of
Tivoli
Business
Systems
Manager
and
to
all
subsequent
releases
and
modifications
until
otherwise
indicated
in
new
editions.
©
Copyright
International
Business
Machines
Corporation
2004.
All
rights
reserved.
US
Government
Users
Restricted
Rights
–
Use,
duplication
or
disclosure
restricted
by
GSA
ADP
Schedule
Contract
with
IBM
Corp.

Contents
About
this
guide
.
.
.
.
.
.
.
.
.
.
. v
Publications
.
.
.
.
.
.
.
.
.
.
.
.
.
. v
IBM
Tivoli
Business
Systems
Manager
library
.
. v
Related
publications
.
.
.
.
.
.
.
.
.
. vi
Accessing
publications
online
.
.
.
.
.
.
. vi
Ordering
publications
.
.
.
.
.
.
.
.
.
. vii
Accessibility
.
.
.
.
.
.
.
.
.
.
.
.
.
. vii
Tivoli
technical
training
.
.
.
.
.
.
.
.
.
. vii
Support
information
.
.
.
.
.
.
.
.
.
.
. vii
Participating
in
newsgroups
.
.
.
.
.
.
.
. viii
Conventions
used
in
this
guide
.
.
.
.
.
.
. viii
Typeface
conventions
.
.
.
.
.
.
.
.
.
. viii
Operating
system-dependent
variables
and
paths
ix
Terminology
.
.
.
.
.
.
.
.
.
.
.
.
.
. ix
Chapter
1.
Overview
of
the
IBM
Tivoli
Business
Systems
Manager
Consoles
.
. 1
Console
.
.
.
.
.
.
.
.
.
.
.
.
.
.
.
. 2
Web
Console
.
.
.
.
.
.
.
.
.
.
.
.
.
. 2
Executive
Dashboard
.
.
.
.
.
.
.
.
.
.
. 2
Reporting
System
.
.
.
.
.
.
.
.
.
.
.
.
. 2
Understanding
Resources
and
Business
Systems
.
. 2
Resource
Types
.
.
.
.
.
.
.
.
.
.
.
. 2
Chapter
2.
Introducing
the
Console
.
.
. 3
Starting
and
Signing
on
to
the
Console
.
.
.
.
. 3
Opening
a
Workspace
.
.
.
.
.
.
.
.
.
. 6
Understanding
Status
Indicators
.
.
.
.
.
.
.
. 8
Understanding
Resource
Indicators
.
.
.
.
.
.
. 8
Getting
Assistance
While
Using
the
Console
.
.
.
. 9
Getting
Help
for
Error
Messages
.
.
.
.
.
. 10
Setting
Preferences
.
.
.
.
.
.
.
.
.
.
.
. 10
Using
Console
Views
.
.
.
.
.
.
.
.
.
.
. 12
Using
the
Event
Viewer
.
.
.
.
.
.
.
.
. 12
Understanding
View
Behavior
.
.
.
.
.
.
. 13
Using
Tree
View
.
.
.
.
.
.
.
.
.
.
.
. 14
Using
HyperView
.
.
.
.
.
.
.
.
.
.
. 15
Filtering
in
HyperView
.
.
.
.
.
.
.
. 17
Using
Table
View
.
.
.
.
.
.
.
.
.
.
. 17
Sorting
Data
in
Tables
.
.
.
.
.
.
.
.
. 17
Filtering
Data
in
Tables
.
.
.
.
.
.
.
. 18
Changing
the
Order
of
Columns
in
Tables
.
. 18
Using
Topology
View
.
.
.
.
.
.
.
.
.
. 18
Working
with
Resources
in
Topology
Views
18
The
Navigation
Center
.
.
.
.
.
.
.
. 18
Other
Resource
Views
.
.
.
.
.
.
.
.
.
.
. 19
Managed
Resources
View
.
.
.
.
.
.
.
.
. 20
Business
Impact
View
.
.
.
.
.
.
.
.
.
. 21
Working
with
Resource
Properties
.
.
.
.
.
.
. 21
The
Current
State
and
Scheduled
State
of
a
Resource
.
.
.
.
.
.
.
.
.
.
.
.
.
. 22
Exceptions
and
Child
Events
.
.
.
.
.
.
. 22
Using
the
Task
Monitor
.
.
.
.
.
.
.
.
.
. 23
Working
with
Notes
.
.
.
.
.
.
.
.
.
.
. 23
Ownership
Notes
.
.
.
.
.
.
.
.
.
.
. 24
Taking
Ownership
of
Events
.
.
.
.
.
.
. 24
Closing
Ownership
Notes
.
.
.
.
.
.
. 24
Problem
and
Information
Notes
.
.
.
.
.
. 24
Creating
Notes
.
.
.
.
.
.
.
.
.
.
.
. 25
Using
the
Note
Editor
.
.
.
.
.
.
.
.
. 25
Using
the
Notes
View
.
.
.
.
.
.
.
.
.
. 26
Note
Properties
.
.
.
.
.
.
.
.
.
.
.
. 27
Using
the
Event
Viewer
to
Work
with
Notes
.
. 28
Working
with
Problem
Tickets
and
Change
Requests
28
Working
with
Problem
Tickets
.
.
.
.
.
.
. 29
Working
with
Change
Requests
.
.
.
.
.
.
. 29
Signing
Off
the
Console
.
.
.
.
.
.
.
.
.
. 29
Exiting
the
Console
.
.
.
.
.
.
.
.
.
.
.
. 29
Chapter
3.
Introducing
the
Web
Console
.
.
.
.
.
.
.
.
.
.
.
.
.
. 31
Signing
on
to
the
Web
Console
.
.
.
.
.
.
.
. 31
Understanding
Alert
State
Indicators
.
.
.
.
.
. 34
Understanding
Resource
Indicators
.
.
.
.
.
. 34
Getting
Assistance
While
Using
the
Web
Console
.
. 35
Getting
Help
for
Error
Messages
.
.
.
.
.
. 35
Setting
Preferences
.
.
.
.
.
.
.
.
.
.
.
. 35
Working
with
Resources
.
.
.
.
.
.
.
.
.
. 36
Critical
Watch
List
.
.
.
.
.
.
.
.
.
.
. 37
Viewing
Events
.
.
.
.
.
.
.
.
.
.
.
.
. 37
Working
with
Filters
.
.
.
.
.
.
.
.
.
.
. 37
Accessibility
.
.
.
.
.
.
.
.
.
.
.
.
.
. 37
Chapter
4.
Introducing
the
Executive
Dashboard
.
.
.
.
.
.
.
.
.
.
.
.
. 39
Accessing
and
Signing
on
to
the
Dashboard
.
.
. 39
Accessing
the
Flash-based
Dashboard
.
.
.
. 39
Accessing
the
HTML-based
Dashboard
.
.
.
. 39
Signing
On
to
the
Dashboard
.
.
.
.
.
.
. 40
Working
with
the
Flash-based
Version
of
the
Dashboard
.
.
.
.
.
.
.
.
.
.
.
.
.
.
. 40
Icon
Bar
.
.
.
.
.
.
.
.
.
.
.
.
.
.
. 42
Mini
Service
Icons
.
.
.
.
.
.
.
.
.
.
. 43
The
Service
Status
Details
View
.
.
.
.
.
.
. 43
User
Preferences
.
.
.
.
.
.
.
.
.
.
.
. 44
The
Dashboard
Context
Menu
.
.
.
.
.
.
. 45
Working
with
the
HTML
Version
of
the
Dashboard
46
Chapter
5.
Introducing
the
Reporting
System
.
.
.
.
.
.
.
.
.
.
.
.
.
. 49
Reporting
System
Interface
.
.
.
.
.
.
.
.
. 49
Report
Forms
within
the
Reporting
System
.
.
.
. 51
Report
Selection
Criteria
.
.
.
.
.
.
.
.
. 51
The
Report
Templates
.
.
.
.
.
.
.
.
.
.
. 52
Business
System
Availability
Report
.
.
.
.
. 52
Business
System
Event
Count
Report
.
.
.
.
. 52
Business
System
Events
Report
.
.
.
.
.
.
. 53
Business
System
Open
Event
Ownership
Report
54
Business
System
Resource
Summary
Report
.
. 54
©
Copyright
IBM
Corp.
2004
iii
Business
System
Resource
Tree
Report
.
.
.
. 54
CICS
Start/Stop
Time
Analysis
by
Business
System
Report
.
.
.
.
.
.
.
.
.
.
.
. 54
Current
MVS
Messages/Exceptions
Report
.
.
. 54
Business
System
Alert
State
Report
.
.
.
.
. 55
Global
Business
System
Alert
State
Report
.
.
. 55
MVS
Message/Exception
Report
.
.
.
.
.
. 55
New
Resources
Report
.
.
.
.
.
.
.
.
. 56
Physical
Resource
Event
Count
Report
.
.
.
. 56
Physical
Resource
Events
Report
.
.
.
.
.
. 57
Physical
Resource
Open
Event
Ownership
Report
58
Physical
Resource
Tree
Report
.
.
.
.
.
.
. 58
Resource
Business
System
Impact
Report
.
.
. 58
Resource
Class
Events
Report
.
.
.
.
.
.
. 58
Shift
Turnover
Report
.
.
.
.
.
.
.
.
.
. 59
Deleting
a
Menu
Item
.
.
.
.
.
.
.
.
.
.
. 59
Signing
Off
the
Reporting
System
.
.
.
.
.
.
. 60
Appendix
A.
Topology
Views
.
.
.
.
. 61
General
Topology
View
.
.
.
.
.
.
.
.
.
. 61
Business
System
Topology
View
.
.
.
.
.
.
. 61
DB2
Topology
Views
.
.
.
.
.
.
.
.
.
.
. 62
CICS
Topology
Views
.
.
.
.
.
.
.
.
.
.
. 63
IMS
Topology
Views
.
.
.
.
.
.
.
.
.
.
. 63
IP
Topology
Views
.
.
.
.
.
.
.
.
.
.
.
. 64
IP
Backbone
.
.
.
.
.
.
.
.
.
.
.
.
. 64
IP
Subnet
.
.
.
.
.
.
.
.
.
.
.
.
.
. 65
IP
Segment
.
.
.
.
.
.
.
.
.
.
.
.
. 65
Show
in
IP
Backbone
.
.
.
.
.
.
.
.
.
. 65
Appendix
B.
Storage,
DB2,
IMS,
and
CICS
Resources
.
.
.
.
.
.
.
.
.
.
. 67
Storage
Resources
.
.
.
.
.
.
.
.
.
.
.
. 67
DB2
Resources
.
.
.
.
.
.
.
.
.
.
.
.
. 67
Hierarchy
of
DB2
Resources
.
.
.
.
.
.
.
. 68
Issuing
Commands
.
.
.
.
.
.
.
.
.
.
. 68
IMS
Resources
.
.
.
.
.
.
.
.
.
.
.
.
. 69
Hierarchy
of
IMS
Resources
.
.
.
.
.
.
.
. 69
Programs,
Transactions,
Databases,
and
Logs
.
. 69
Issuing
Commands
.
.
.
.
.
.
.
.
.
.
. 70
CICS
Resources
.
.
.
.
.
.
.
.
.
.
.
.
. 70
Transaction
Management
.
.
.
.
.
.
.
.
. 70
Transaction
Status
Window
.
.
.
.
.
.
. 70
File
Management
.
.
.
.
.
.
.
.
.
.
. 70
Viewing
CICS
Resources
.
.
.
.
.
.
.
.
. 71
Appendix
C.
Monitoring
Batch
Processes
.
.
.
.
.
.
.
.
.
.
.
.
. 73
Monitoring
Batch
Processes
.
.
.
.
.
.
.
.
. 73
Batch
Jobs
.
.
.
.
.
.
.
.
.
.
.
.
.
. 73
Non-Key
Jobs
.
.
.
.
.
.
.
.
.
.
.
. 73
Converting
a
Key
Job
to
a
Non-Key
Job
.
.
. 73
The
Batch
Management
Summary
Window
.
.
. 74
High
Level
Batch
Schedule
Set
Monitoring
.
.
. 74
Monitoring
the
Progress
of
a
Batch
Schedule
.
. 74
Extending
Schedules
to
Minimize
Alerts
.
.
.
. 74
Appendix
D.
Accessibility
in
the
Console
.
.
.
.
.
.
.
.
.
.
.
.
.
. 77
General
Shortcut
Keys
.
.
.
.
.
.
.
.
.
.
. 77
Menu
Shortcut
Keys
.
.
.
.
.
.
.
.
.
.
. 79
Console
Menu
Bar
.
.
.
.
.
.
.
.
.
.
. 79
Console
Menu
.
.
.
.
.
.
.
.
.
.
. 79
Edit
Menu
.
.
.
.
.
.
.
.
.
.
.
.
. 80
View
Menu
.
.
.
.
.
.
.
.
.
.
.
. 80
Search
Menu
.
.
.
.
.
.
.
.
.
.
.
. 80
Actions
Menu
.
.
.
.
.
.
.
.
.
.
. 80
Help
Menu
.
.
.
.
.
.
.
.
.
.
.
. 81
Additional
Menu
Shortcut
Keys
for
Topology
Views
81
Search
menu
.
.
.
.
.
.
.
.
.
.
.
.
. 81
View
Menu
.
.
.
.
.
.
.
.
.
.
.
.
. 81
Actions
Menu
.
.
.
.
.
.
.
.
.
.
.
. 81
Support
information
.
.
.
.
.
.
.
.
. 83
Searching
knowledge
bases
.
.
.
.
.
.
.
.
. 83
Search
the
information
center
on
your
local
system
or
network
.
.
.
.
.
.
.
.
.
.
. 83
Search
the
Internet
.
.
.
.
.
.
.
.
.
.
. 83
Obtaining
fixes
.
.
.
.
.
.
.
.
.
.
.
.
. 83
Contacting
IBM
Software
Support
.
.
.
.
.
.
. 84
Determine
the
business
impact
of
your
problem
85
Describe
your
problem
and
gather
background
information
.
.
.
.
.
.
.
.
.
.
.
.
. 85
Submit
your
problem
to
IBM
Software
Support
85
Notices
.
.
.
.
.
.
.
.
.
.
.
.
.
. 87
Trademarks
.
.
.
.
.
.
.
.
.
.
.
.
.
. 88
Index
.
.
.
.
.
.
.
.
.
.
.
.
.
.
. 89
iv
IBM
Tivoli
Business
Systems
Manager:
Introducing
the
Consoles

About
this
guide
IBM®
Tivoli®
Business
Systems
Manager
is
an
enterprise
management
product
that
monitors
the
data
processing
resources
that
are
critical
to
a
business
application.
It
enables
end-to-end
monitoring
of
systems,
subsystems,
applications,
and
other
resources
in
your
enterprise,
from
z/OS®
systems
to
distributed
systems.
Tivoli
Business
Systems
Manager
provides
your
operations
and
support
organizations,
application
owners,
and
management
with
a
view
of
the
system
components
as
they
relate
to
your
overall
business.
Publications
This
section
lists
publications
in
the
Tivoli
Business
Systems
Manager
library
and
related
documents.
It
also
describes
how
to
access
Tivoli
publications
online
and
how
to
order
Tivoli
publications.
IBM
Tivoli
Business
Systems
Manager
library
This
following
publications
are
in
the
IBM
Tivoli
Business
Systems
Manager
library:
v
IBM
Tivoli
Business
Systems
Manager
Planning
Guide,
SC32-9088,
provides
an
introduction
to
the
Tivoli
Business
Systems
Manager
product.
It
also
contains
planning
and
design
information
to
consider
when
implementing
a
Tivoli
Business
Systems
Manager
solution.
This
document
is
written
for
network
planners,
system
designers,
systems
administrators,
and
others
who
are
responsible
for
planning
and
implementing
the
product.
v
IBM
Tivoli
Business
Systems
Manager
Installation
and
Configuration
Guide,
SC32-9089,
provides
the
installation
and
configuration
tasks
necessary
for
the
implementation
of
Tivoli
Business
Systems
Manager.
This
document
is
written
for
system
administrators
and
others
who
are
responsible
for
installing
and
configuring
Tivoli
Business
Systems
Manager.
v
IBM
Tivoli
Business
Systems
Manager
Introducing
the
Consoles,
SC32-9086,
provides
an
introduction
to
the
Tivoli
Business
Systems
Manager
console,
Web
console,
executive
dashboard,
and
the
reporting
system.
This
document
is
written
for
operators
and
administrators.
v
IBM
Tivoli
Business
Systems
Manager
Administrator’s
Guide,
SC32-9085,
describes
administrative
tasks
for
Tivoli
Business
Systems
Manager.
This
document
is
written
for
system
administrators
and
others
who
perform
administrative
tasks
for
Tivoli
Business
Systems
Manager.
v
IBM
Tivoli
Business
Systems
Manager
Problem
and
Change
Management
Integration
Guide,
SC32-9130,
describes
how
to
write
request
processors
to
enable
the
problem,
change,
and
automatic
ticket
integration
function
provided
with
Tivoli
Business
Systems
Manager
to
work
with
problem
and
change
management
applications.
This
document
is
written
for
system
programmers.
v
IBM
Tivoli
Business
Systems
Manager
Command
Reference,
SC32-1243,
describes
the
commands
available
for
use
with
Tivoli
Business
Systems
Manager.
This
document
is
written
for
system
administrators
and
others
who
run
commands
and
scripts
for
Tivoli
Business
Systems
Manager.
©
Copyright
IBM
Corp.
2004
v

v
IBM
Tivoli
Business
Systems
Manager
Message
Reference,
SC32-9087,
describes
the
messages
for
Tivoli
Business
Systems
Manager.
This
document
is
written
for
system
programmers,
network
planners,
operations
managers,
system
designers,
system
administrators,
network
operators,
and
others
who
need
message
information
for
Tivoli
Business
Systems
Manager.
v
IBM
Tivoli
Business
Systems
Manager
Troubleshooting
Guide,
SC32-9084,
describes
troubleshooting
tasks
to
diagnose
problems
with
Tivoli
Business
Systems
Manager.
This
document
is
written
for
system
administrators
and
others
who
perform
diagnostic
tasks
for
Tivoli
Business
Systems
Manager.
v
IBM
Tivoli
Business
Systems
Manager
Release
Notes,
GI11-4029,
describes
what
is
new
for
this
release
of
the
Tivoli
Business
Systems
Manager
product.
v
IBM
Tivoli
Business
Systems
Manager
Guide
for
Warehouse
Pack,
Version
3.1.0.0,
using
Tivoli
Data
Warehouse,
Version
1.2,
SC32-9114,
describes
how
to
use
the
warehouse
enablement
pack
to
extract
data
from
the
Tivoli
Business
Systems
Manager
database
and
load
it
into
the
Tivoli
Data
Warehouse
database,
where
it
can
be
accessed
using
reporting
and
data
analysis
tools.
This
document
is
written
for
administrators
and
others
who
plan
for
and
install
the
warehouse
pack,
use
and
maintain
the
warehouse
pack
and
its
reports,
or
create
new
reports.
An
index
is
provided
for
searching
the
Tivoli
Business
Systems
Manager
library.
If
you
have
Adobe
Acrobat
on
your
system,
you
can
use
the
Search
command
to
locate
specific
text
in
the
library.
For
more
information
about
using
the
index
to
search
the
library,
see
the
online
help
for
Acrobat.
Related
publications
The
Tivoli
Software
Glossary
includes
definitions
for
many
of
the
technical
terms
related
to
Tivoli
software.
The
Tivoli
Software
Glossary
is
available
at
the
following
Tivoli
software
library
Web
site:
http://www.ibm.com/software/tivoli/library/
Access
the
glossary
by
clicking
the
Glossary
link
on
the
left
pane
of
the
Tivoli
software
library
window.
Accessing
publications
online
The
documentation
CD
contains
the
publications
that
are
in
the
product
library.
The
format
of
the
publications
is
and
HTML.
IBM
posts
publications
for
this
and
all
other
Tivoli
products,
as
they
become
available
and
whenever
they
are
updated,
to
the
Tivoli
software
information
center
Web
site.
Access
the
Tivoli
software
information
center
by
first
going
to
the
Tivoli
software
library
at
the
following
Web
address:
http://www.ibm.com/software/tivoli/library/
Scroll
down
and
click
the
Product
manuals
link.
In
the
Tivoli
Technical
Product
Documents
Alphabetical
Listing
window,
click
the
Tivoli
Business
Systems
Manager
link
to
access
the
product
library
at
the
Tivoli
software
information
center.
vi
IBM
Tivoli
Business
Systems
Manager:
Introducing
the
Consoles

Note:
If
you
documents
on
other
than
letter-sized
paper,
set
the
option
in
the
File
→
window
that
allows
Adobe
Reader
to
letter-sized
pages
on
your
local
paper.
Ordering
publications
You
can
order
many
Tivoli
publications
online
at
the
following
Web
site:
http://www.elink.ibmlink.ibm.com/public/applications/publications/cgibin/pbi.cgi
You
can
also
order
by
telephone
by
calling
one
of
these
numbers:
v
In
the
United
States:
800-879-2755
v
In
Canada:
800-426-4968
In
other
countries,
see
the
following
Web
site
for
a
list
of
telephone
numbers:
http://www.ibm.com/software/tivoli/order-lit/
Accessibility
Accessibility
features
help
users
with
a
physical
disability,
such
as
restricted
mobility
or
limited
vision,
to
use
software
products
successfully.
With
this
product,
you
can
use
assistive
technologies
to
hear
and
navigate
the
interface.
You
can
also
use
the
keyboard
instead
of
the
mouse
to
operate
all
features
of
the
graphical
user
interface.
For
information
about
installing
the
Tivoli
Business
Systems
Manager
product
using
the
built-in
screen
reader,
see
the
IBM
Tivoli
Business
Systems
Manager
Installation
and
Configuration
Guide.
For
information
about
the
shortcut
keys
that
can
be
used
with
the
Tivoli
Business
Systems
Manager
console,
see
the
Accessibility
appendix
in
IBM
Tivoli
Business
Systems
Manager
Introducing
the
Consoles.
Tivoli
technical
training
For
Tivoli
technical
training
information,
refer
to
the
following
IBM
Tivoli
Education
Web
site:
http://www.ibm.com/software/tivoli/education
Support
information
If
you
have
a
problem
with
your
IBM
software,
you
want
to
resolve
it
quickly.
IBM
provides
the
following
ways
for
you
to
obtain
the
support
you
need:
v
Searching
knowledge
bases:
You
can
search
across
a
large
collection
of
known
problems
and
workarounds,
Technotes,
and
other
information.
v
Obtaining
fixes:
You
can
locate
the
latest
fixes
that
are
already
available
for
your
product.
v
Contacting
IBM
Software
Support:
If
you
still
cannot
solve
your
problem,
and
you
need
to
work
with
someone
from
IBM,
you
can
use
a
variety
of
ways
to
contact
IBM
Software
Support.
For
more
information
about
these
three
ways
of
resolving
problems,
see
“Support
information”
on
page
83.
About
this
guide
vii

Participating
in
newsgroups
User
groups
provide
software
professionals
with
a
forum
for
communicating
ideas,
technical
expertise,
and
experiences
related
to
the
product.
They
are
located
on
the
Internet
and
are
available
using
standard
news
reader
programs.
These
groups
are
primarily
intended
for
user-to-user
communication
and
are
not
a
replacement
for
formal
support.
To
access
a
newsgroup,
use
the
instructions
appropriate
for
your
browser.
IBM
Tivoli
Business
Systems
Manager:
news://news.software.ibm.com/ibm.software.tivoli.business-systems-manager
IBM
Tivoli
Enterprise
Console®:
news://news.software.ibm.com/ibm.software.tivoli.enterprise-console
IBM
Tivoli
Service
Level
Advisor:
news://news.software.ibm.com/ibm.software.tivoli.service-level-advisor
IBM
Tivoli
Switch
Analyzer:
news://news.software.ibm.com/ibm.software.tivoli.switch-analyzer
IBM
Tivoli
NetView®
for
UNIX®
and
IBM
Tivoli
NetView
for
Windows®:
news://news.software.ibm.com/ibm.software.tivoli.netview-unix-windows
IBM
Tivoli
NetView
for
z/OS:
news://news.software.ibm.com/ibm.software.netview
Conventions
used
in
this
guide
This
guide
uses
several
conventions
for
special
terms
and
actions
and
for
operating
system-dependent
commands
and
paths
Typeface
conventions
This
guide
uses
the
following
typeface
conventions:
Bold
v
Lowercase
commands
and
mixed
case
commands
that
are
otherwise
difficult
to
distinguish
from
surrounding
text
v
Interface
controls
(check
boxes,
push
buttons,
radio
buttons,
spin
buttons,
fields,
folders,
icons,
list
boxes,
items
inside
list
boxes,
multicolumn
lists,
containers,
menu
choices,
menu
names,
tabs,
property
sheets),
labels
(such
as
Tip:,
and
Operating
system
considerations:)
v
Keywords
and
parameters
in
text
Italic
v
Words
defined
in
text
v
Emphasis
of
words
(words
as
words)
v
New
terms
in
text
(except
in
a
definition
list)
viii
IBM
Tivoli
Business
Systems
Manager:
Introducing
the
Consoles

v
Variables
and
values
you
must
provide
Monospace
v
Examples
and
code
examples
v
File
names,
programming
keywords,
and
other
elements
that
are
difficult
to
distinguish
from
surrounding
text
v
Message
text
and
prompts
addressed
to
the
user
v
Text
that
the
user
must
type
v
Values
for
arguments
or
command
options
Operating
system-dependent
variables
and
paths
This
guide
uses
the
UNIX
convention
for
specifying
environment
variables
and
for
directory
notation.
When
using
the
Windows
command
line,
replace
$variable
with
%variable%
for
environment
variables
and
replace
each
forward
slash
(/)
with
a
backslash
(\)
in
directory
paths.
The
names
of
environment
variables
are
not
always
the
same
in
Windows
and
UNIX.
For
example,
%TEMP%
in
Windows
is
equivalent
to
$tmp
in
UNIX.
Note:
If
you
are
using
the
bash
shell
on
a
Windows
system,
you
can
use
the
UNIX
conventions.
Terminology
For
a
list
of
terms
and
definitions
for
Tivoli
and
other
IBM
products,
refer
to
the
IBM
terminology
Web
site:
http://www.ibm.com/ibm/terminology/
For
brevity
and
readability,
the
term
Tivoli
NetView
for
z/OS
refers
to
both
the
Tivoli
NetView
for
z/OS
product
and
the
Tivoli
NetView
for
OS/390®
product.
About
this
guide
ix

x
IBM
Tivoli
Business
Systems
Manager:
Introducing
the
Consoles

Chapter
1.
Overview
of
the
IBM
Tivoli
Business
Systems
Manager
Consoles
The
IBM
Tivoli
Business
Systems
Manager
consoles
are
role-based
user
interfaces
and
your
role
determines
the
consoles
you
access
and
the
functions
that
are
available
to
you
within
a
console.
An
Administrator
sets
up
the
roles
that
determine
how
you
work
with
the
consoles.
If
users
are
assigned
more
than
one
role,
they
will
always
have
the
highest
of
these
roles.
Following
are
the
roles
that
are
used
in
the
consoles.
Restricted
Operator
Users
who
are
defined
to
the
IBM
Tivoli
Business
Systems
Manager
system
to
do
any
action
of
an
operator,
but
restricted
operators
are
limited
to
what
they
can
view,
based
on
what
is
in
their
workspace
or
Critical
Resource
List
(CRL).
Operator
Users
who
are
defined
to
the
IBM
Tivoli
Business
Systems
Manager
system
to
do
any
action
of
an
operator
for
any
business
system,
or
business
system
resource.
Administrator
Users
who
are
defined
to
maintain
the
IBM
Tivoli
Business
Systems
Manager
system.
Administrators
can
do
all
operator
functions,
as
well
as
all
administrator
functions,
except
update
other
users’
CRLs.
Super
Administrator
Users
who
can
update
other
users’
CRLs
and
can
do
all
other
functions
that
are
available
to
operators
and
administrators.
Executive
Users
who
can
display
and
use
an
executive
dashboard
and
the
services
that
are
defined
for
it.
A
user
can
only
view
the
impact
that
is
displayed
on
each
of
the
services.
IT
Executive
Users
who
can
display
and
use
executive
dashboards
and
the
services
that
are
defined
for
them.
They
can
also
display
problem
statements.
The
IT
Executive
can
switch
to
any
other
executive’s
or
IT
executive’s
dashboards.
Report
Operator
Users
who
can
run
the
reports
that
an
administrator
has
configured.
This
role
is
used
for
the
reporting
system
only,
and
it
is
required
to
allow
users
to
log
directly
into
the
reporting
system.
Report
Administrator
Users
who
can
configure
the
reports
that
are
displayed.
This
role
is
used
for
the
reporting
system
only,
and
it
is
required
to
allow
users
to
log
directly
into
the
reporting
system.
This
chapter
provides
a
brief
overview
of
each
console
and
also
gives
an
overview
of
resources
and
alerts.
Overview
information
is
covered
in
these
sections:
v
“Console”
on
page
2
v
“Web
Console”
on
page
2
v
“Executive
Dashboard”
on
page
2
©
Copyright
IBM
Corp.
2004
1

v
“Reporting
System”
v
“Understanding
Resources
and
Business
Systems”
Console
The
IBM
Tivoli
Business
Systems
Manager
console
is
referred
to
as
the
console,
and
it
is
installed
on
users’
computers.
Operators
use
the
console
to
monitor
resources
for
state
changes
and
performance
characteristics
that
reflect
availability.
If
the
availability
of
a
resource
is
threatened,
an
alert
icon
is
placed
next
to
the
resource
or
subsystem.
Notification
of
alerts
and
events
management
are
primary
tasks
of
the
console.
By
observing
views,
you
can
see
whether
the
system,
subsystem,
or
resource
is
available
and
performing
correctly.
Administrators
use
the
console
to
create
and
manage
business
systems
and
to
configure
the
Web
console
and
the
executive
dashboard.
Web
Console
The
Web
console
is
a
Web-based
version
of
the
console
that
is
optimized
for
operator
interaction
with
resources
and
events.
Operators
do
the
same
monitoring
and
problem
determination
that
they
can
do
with
the
regular
console.
Administrators
perform
additional
tasks
such
as
creating
shared
filters.
Executive
Dashboard
The
executive
dashboard
is
Web-based
and
it
gives
executives
a
high-level
view
of
the
services
they
are
responsible
for.
The
executive
dashboard
also
provides
IT
managers
a
view
of
what
the
executive
user
sees.
Reporting
System
The
reporting
system
provides
reports
that
contain
historical
and
operational
data.
The
reporting
system
is
a
Web-based
application
that
can
be
launched
directly
from
a
browser,
or
it
can
be
launched
from
the
console.
Understanding
Resources
and
Business
Systems
A
resource
is
any
object
in
IBM
Tivoli
Business
Systems
Manager,
such
as
an
application,
subsystem,
or
technical
device.
Routers,
server
machines,
and
other
physical
devices
are
resources.
A
physical
resource
is
any
resource
that
is
in
the
physical
tree,
which
is
known
as
the
All
resources
view
in
the
console.
When
the
physical
resource
is
placed
in
a
business
system,
a
business
system
resource
is
created.
Business
systems
consist
of
collections
of
resources
that
are
assembled
for
the
purpose
of
availability
monitoring.
Resource
Types
Each
resource
in
the
database
is
classified
by
type
and
each
resource
type
is
represented
by
an
icon.
You
can
view
resource
types
and
the
icon
that
represents
each
type
in
the
console.
You
can
also
view
exceptions
thresholds
and
child
events
thresholds
for
resource
types
as
well
as
the
properties
of
resource
types.
2
IBM
Tivoli
Business
Systems
Manager:
Introducing
the
Consoles

Chapter
2.
Introducing
the
Console
This
chapter
introduces
the
IBM
Tivoli
Business
Systems
Manager
console
(hereafter
referred
to
as
the
console),
gives
instructions
for
starting
the
console
and
signing
on,
explains
how
to
use
the
console,
and
how
to
close
and
exit
the
console.
The
console
monitors
resources
for
state
changes
and
performance
characteristics
that
reflect
availability.
If
the
availability
of
a
resource
or
resources
is
threatened,
an
alert
icon
is
placed
next
to
the
resource.
Notification
of
alerts
and
events
management
are
the
primary
tasks
of
the
console.
By
observing
views,
you
can
see
whether
the
system,
subsystem,
or
resource
is
available
and
functioning
correctly.
The
console
is
a
role-based
user
interface
and
your
role
determines
what
you
have
access
to.
The
following
roles
are
used
in
the
console:
v
Restricted
Operator
v
Operator
v
Administrator
v
Super
Administrator
Starting
and
Signing
on
to
the
Console
The
console
runs
on
Microsoft®
Windows,
Linux,
Solaris,
and
AIX®
operating
environments.
After
the
console
is
installed,
you
can
start
it
by
following
the
instructions
for
your
operating
environment.
Table
1.
Instructions
for
starting
the
console
Operating
Environment
Instructions
Windows
You
can
start
the
console
one
of
two
ways:
v
If
there
is
an
icon
on
your
desktop,
double-click
it.
v
Select
Start
->
Programs
->
IBM
Tivoli
Business
Systems
Manager
->
IBM
Tivoli
Business
Systems
Manager
console
3.1.
Linux
Click
the
IBM
Tivoli
Business
Systems
Manager
Console
icon.
Solaris
From
the
Application
Manager,
click
the
IBM
Tivoli
Business
Systems
Manager
folder
and
then
click
the
IBM
Tivoli
Business
Systems
Manager
Console
icon.
AIX
From
the
Application
Manager,
click
the
IBM
Tivoli
Business
Systems
Manager
3.1
folder
and
then
click
the
IBM
Tivoli
Business
Systems
Manager
Console
icon.
When
the
sign
on
window
opens
do
the
following
steps.
1.
Type
your
user
name
for
the
system
you
are
signing
on
to.
2.
Type
your
password
for
the
system
you
are
signing
on
to.
3.
The
server
name
you
are
signing
on
to
is
displayed.
You
can
change
this
information
if
you
are
signing
on
to
a
different
server.
4.
Click
OK.
©
Copyright
IBM
Corp.
2004
3

The
console
opens
and
looks
similar
to
the
window
in
Figure
1.
The
person
who
signed
on
in
Figure
1
has
the
role
of
Operator,
as
displayed
in
the
banner
under
the
name,
IBM
Tivoli
Business
Systems
Manager.
Components
that
are
shown
in
Figure
1
are
explained
in
Table
2.
Table
2.
Console
components
Component
Overview
Banner
area
The
area
that
is
located
below
the
title
bar.
This
is
an
optional
area
that
can
be
customized
by
a
console
administrator
to
include
relevant
information
for
a
particular
organization.
For
example,
an
organization
might
want
to
include
the
role
descriptor
for
the
particular
user,
the
company
logo,
and
links
to
Internet
and
intranet
sites.
Figure
1.
IBM
Tivoli
Business
Systems
Manager
console
4
IBM
Tivoli
Business
Systems
Manager:
Introducing
the
Consoles

Table
2.
Console
components
(continued)
Component
Overview
Business
Systems
view
The
area
in
which
business
systems
are
listed.
Business
systems
are
contained
in
folders
in
the
Business
Systems
view.
A
business
system
is
a
representation
of
a
set
of
resources
that
make
up
a
specific
business
system,
application,
vertical
area
of
responsibility,
or
geographic
area.
The
Business
Systems
view
is
located
on
the
left
side
of
the
console.
To
open
a
business
system,
click
it
and
then
press
Enter.
Depending
on
configuration
options
that
are
specified
by
your
administrator,
the
Business
Systems
view
might
not
be
available.
If
the
Business
Systems
view
is
available,
you
can
close
it
by
clicking
the
X
that
is
located
in
the
upper
right
corner
of
the
Business
Systems
view.
To
re-open
the
Business
Systems
view,
go
to
View
–>
Show
–>
Business
Systems
View.
Task
Assistant
The
place
to
go
for
answers
to
your
questions.
The
Task
Assistant
is
represented
by
the
question
mark
on
the
far
right
of
the
menu
bar.
To
open
the
Task
Assistant,
click
the
question
mark.
Workspace
Area
for
displaying
windows.
Contains
the
resources
you
are
monitoring.
Left
status
bar
Located
below
the
Workspace.
Displays
the
user
ID,
the
role
of
the
user,
and
the
console
server
the
user
is
connected
to.
Right
status
bar
Located
below
the
Workspace.
Displays
the
status
of
tasks.
You
can
click
this
area
to
see
a
list
of
tasks.
Select
a
task
in
the
list
to
display
it.
Task
bar
Located
below
the
status
bars.
Displays
open
business
system
windows.
If
you
right-click
a
window
in
the
task
bar,
a
menu
opens
and
you
can
show
or
close
the
business
system.
The
menu
bar
on
the
console
that
is
shown
in
Figure
1
on
page
4
has
a
menu
bar
with
these
menus:
v
Console
v
View
v
Search
v
Windows
v
Help
These
menus
are
explained
in
Table
3,
along
with
some
of
the
actions
you
can
do
from
the
menus.
Table
3.
Available
menus
when
the
console
is
started
Menu
Use
to
perform
these
actions
Console
v
Access
the
Notes
view
v
Manipulate
workspaces
v
Open
resource
types
v
Access
administrator
and
console
preferences
v
Sign
off
the
console
v
Exit
the
console
Chapter
2.
Introducing
the
Console
5

Table
3.
Available
menus
when
the
console
is
started
(continued)
Menu
Use
to
perform
these
actions
View
Show
the
following
items
on
the
console:
v
Banner
v
Toolbar
v
Status
bar
v
Business
Systems
View
Search
Search
for
resources
in
the
database
Windows
Control
the
way
windows
are
displayed
on
the
console.
For
example,
you
can
tile
or
minimize
open
windows.
Help
Access
the
Task
Assistant
to
get
information
about
the
console:
v
Frequently
Asked
Questions
v
Help
topics
v
Search
for
information
that
is
in
the
Task
Assistant
v
Table
of
Contents
for
the
Task
Assistant
v
Index
of
console
messages
v
Keyboard
help
v
Copyright
information
for
the
console
Opening
a
Workspace
Workspaces
are
created
so
you
can
have
multiple
views
open
in
the
same
style
and
position
each
time
you
open
the
console.
You
can
create
workspaces,
name
them,
and
select
a
workspace
to
open
automatically
when
the
console
starts.
You
can
edit
or
delete
workspaces
that
you
create.
Administrators
also
create
workspaces
and
grant
permission
for
specific
operators
to
view
them.
If
this
is
set
in
Administrator
Preferences,
an
operator
can
save
workspaces
that
the
operator
creates,
but
operators
cannot
save
workspaces
created
by
Administrators.
When
you
save
a
workspace,
it
is
saved
in
the
database
so
it
is
available
when
you
sign
on
to
the
console.
To
open
a
Workspace
do
the
following
steps:
1.
Click
Console
->
Open
Workspace.
Doing
this
opens
a
window
similar
to
Figure
2
on
page
7.
6
IBM
Tivoli
Business
Systems
Manager:
Introducing
the
Consoles

2.
Select
a
workspace
to
open
in
the
Open
Workspace
window
and
click
Open.
If
you
want
this
workspace
to
open
each
time
you
log
in
to
the
console,
click
Automatically
open
the
selected
workspace
when
the
console
is
started.
Now
the
console
looks
similar
to
Figure
3.
As
shown
in
Figure
3,
the
person
signed
on
has
the
Operator
role.
Figure
2.
Open
a
Workspace
window
Figure
3.
Console
window
that
shows
an
open
workspace
and
the
Business
Systems
view
Chapter
2.
Introducing
the
Console
7

The
Edit
and
Actions
menus
are
now
displayed
on
the
menu
bar,
and
selections
on
the
other
menus
might
be
different.
Selections
on
the
Edit
and
Actions
menus
are
related
to
the
selected
resource,
and
depending
on
your
role
some
selections
might
not
be
available.
See
Table
4
for
an
explanation
of
some
selections
that
could
be
on
the
Edit
and
Actions
menus.
You
can
also
right-click
a
resource
to
open
a
menu
for
that
resource.
Table
4.
Edit
and
Action
menu
items
Menu
Use
to
perform
these
actions
Edit
v
Copy
v
Paste
v
Delete
Actions
Displays
the
actions
that
are
specific
to
the
currently
selected
resource.
Following
are
some
actions
you
can
do.
v
See
the
business
impact
of
a
resource
failure
v
Take
ownership
of
resources
v
Open
views
that
are
related
to
the
selected
resource
v
Work
with
problem
tickets,
change
requests,
and
notes
v
Open
the
properties
of
the
selected
resource
Understanding
Status
Indicators
The
icons
that
are
located
to
the
left
of
the
resource
names
in
Figure
3
on
page
7
are
called
status
indicators
and
the
icons
that
are
located
to
the
right
of
the
resource
names
are
called
resource
indicators.
The
console
informs
you
of
availability
by
notifying
the
resources
that
represent
systems,
applications,
and
resources.
As
events
that
threaten
availability
occur
within
your
environment,
the
console
displays
a
status
indicator
icon
next
to
that
resource.
Status
indicators
are
described
in
Table
5.
Table
5.
Status
indicators
Status
Indicator
Description
Normal
(green)
informs
you
that
the
resource
is
functioning
as
expected.
This
icon
is
usually
not
displayed
in
views.
You
can
configure
the
green
indicator
to
display
in
Table
views
from
the
Table
View
page
of
Console
Preferences.
Warning
(yellow)
informs
you
that
the
resource
is
functioning
but
its
availability
is
in
jeopardy.
This
could
mean
that
the
system
is
overloaded,
or
it
could
be
part
of
the
standard
operations
of
your
data
center.
Critical
(red)
informs
you
that
the
resource
is
not
available
or
its
availability
is
at
serious
risk.
Understanding
Resource
Indicators
The
console
uses
resource
indicators
for
resources
in
some
views
(tree
and
topology).
In
HyperViews,
Ownership
indicators
are
the
only
indicators
that
are
displayed.
Although
resource
indicators
are
not
displayed
in
table
views,
ownership
is
indicated
in
those
views
with
a
check
mark
in
the
Has
Ownership
column
of
the
table
or
the
table
has
an
Owner
column.
Views
such
as
Tree
views,
HyperViews,
and
Table
views
are
discussed
later
in
this
chapter.
8
IBM
Tivoli
Business
Systems
Manager:
Introducing
the
Consoles

To
configure
which
resource
indicators
are
displayed
do
the
following
steps:
1.
Choose
Console
–>
Preferences
from
the
menu
bar.
2.
Click
a
view.
3.
Make
your
selections
for
displaying
resource
indicators
in
that
view.
For
information
about
displaying
resource
indicators,
refer
to
the
online
help
topic
Resource
Indicators.
Resource
indicators
are
described
in
Table
6.
Table
6.
Resource
indicators
Resource
Indicator
Description
The
resource
has
one
or
more
open
events
that
are
owned.
All
of
the
open
events
for
the
resource
are
owned.
This
is
only
displayed
to
represent
all
events
owned,
not
the
ownership
of
child
events.
For
example,
you
will
generally
not
see
this
icon
on
a
business
system
folder,
but
you
will
see
it
on
business
system
resources.
The
resource
has
an
open
problem
ticket.
The
resource
has
an
open
change
request.
Automation
stopped.
Automation
started.
The
resource
is
in
maintenance
(for
example,
has
a
scheduled
outage);
no
propagation
occurs.
The
resource
is
either
an
executive
dashboard
service
or
an
executive
dashboard
service
resource.
The
resource
is
a
business
system
folder
shortcut.
Whether
or
not
the
business
system
shortcut
icon
is
displayed
is
determined
by
a
setting
in
Console
–>
Administrator
Preferences
–>
View.
For
information
about
business
system
shortcuts,
see
the
information
in
the
Task
Assistant.
This
indicates
a
deleted
source.
If
a
business
system
resource
is
linked
to
a
source
physical
resource
that
is
deleted,
the
business
system
resource
is
overlaid
with
a
deleted
source
indicator.
This
is
also
true
for
a
business
system
shortcut
if
the
source
business
system
is
deleted.
Getting
Assistance
While
Using
the
Console
The
console
uses
the
Task
Assistant
to
display
helpful
information.
To
display
the
Task
Assistant,
click
the
question
mark
icon
that
is
located
in
the
upper
right
corner
of
windows.
The
Task
Assistant
opens
with
information
about
the
window
from
which
you
clicked
the
question
mark.
Once
the
Task
Assistant
is
open
you
can
also
get
information
by
using
the
table
of
contents,
index,
message
index,
or
the
search
function.
If
you
want
the
Task
Assistant
to
open
in
a
browser
for
accessibility
reasons,
you
can
set
a
preference
for
this
by
doing
the
following
steps.
1.
Select
Console
–>
Preferences
–>
General
from
the
menu
bar.
Chapter
2.
Introducing
the
Console
9

2.
Click
Use
a
specific
Web
browser.
3.
Click
Enable
Launching
of
Task
Assistant
in
an
External
Browser.
The
next
time
you
click
the
question
mark,
the
Launch
Accessible
Content
button
is
available
in
the
Task
Assistant.
If
the
button
displays
Browser
Not
Configured,
go
back
to
Console
–>
Preferences
–>
General
and
make
sure
you
enter
a
fully
qualified
file
name.
Console
preferences
are
discussed
in
more
detail
later
in
this
chapter.
Getting
Help
for
Error
Messages
Console
error
messages
have
the
prefix
GTMJC
followed
by
a
message
number.
To
get
information
about
an
error
message,
click
the
question
mark
icon
that
is
located
in
the
upper
right
corner
of
the
error
message
to
display
the
Task
Assistant.
To
view
a
list
of
all
console
messages:
1.
Click
Help
–>
Message
index
or
click
the
Message
Index
icon
in
the
Task
Assistant.
2.
Click
a
message
to
see
its
explanation.
Setting
Preferences
The
console
uses
console
preferences
and
administrator
preferences.
Operators
can
set
console
preferences
if
an
administrator
has
enabled
this
function.
Administrators
set
administrator
preferences.
Figure
4
on
page
11
shows
a
console
that
has
Console
Preferences
open
to
the
General
page
and
also
has
the
Task
Assistant
open.
10
IBM
Tivoli
Business
Systems
Manager:
Introducing
the
Consoles

Figure
5
on
page
12
shows
a
console
that
has
Administrator
Preferences
open
to
the
Configuration
page
and
has
the
Task
Assistant
open.
Figure
4.
Console
Preferences
open
to
the
General
page
Chapter
2.
Introducing
the
Console
11

When
a
customized
view
that
you
save
is
restored
from
a
workspace,
the
preferences
that
you
saved
are
used
instead
of
the
console
preferences
that
had
previously
been
set.
If
no
saved
workspace
exists
for
a
requested
view,
console
preferences
are
used
for
that
view.
To
set
preferences,
Click
Console
->
Preferences
or
Console
–>
Administrator
Preferences
from
the
menu
bar.
Using
Console
Views
This
section
explains
different
views
that
are
available
for
monitoring
business
systems
and
resources.
Following
are
some
things
to
keep
in
mind
about
views.
v
When
you
click
the
tree
icon
,
the
table
icon
,
and
the
HyperView
icon
on
the
toolbar,
you
are
toggling
the
view
in
the
current
workspace
between
Tree
view,
Table
view,
and
HyperView.
You
are
not
seeing
a
view
with
different
resources.
v
When
you
select
Tree,
HyperView,
or
Table
from
the
View
menu,
you
are
toggling
the
view
in
the
current
workspace
between
Tree
view,
Table
view,
and
HyperView.
You
are
not
seeing
a
view
with
different
resources.
v
When
you
use
the
menu
for
a
resource
and
open
a
different
view,
the
console
retrieves
information
from
the
database
and
displays
the
appropriate
view.
Using
the
Event
Viewer
You
can
open
the
event
viewer
from
applicable
views
by
clicking
View
–>
Events.
The
event
viewer
shows
a
list
of
events
for
the
selected
resource
and
its
descendents.
Whenever
you
select
a
different
resource,
the
event
viewer
automatically
refreshes
to
display
the
events
for
the
selected
resource
and
its
Figure
5.
Administrator
Preferences
open
to
the
Configuration
page
12
IBM
Tivoli
Business
Systems
Manager:
Introducing
the
Consoles

descendents.
Whereas
the
resource
view
displays
resource
status
subject
to
propagation,
the
event
viewer
simply
displays
the
events
for
the
selected
resource
and
its
descendents.
From
the
event
viewer
you
can
manage
events
by
taking
ownership
of
them,
transferring
them,
and
closing
them
out,
either
singly
or
in
bulk.
You
can
also
see
the
details
of
events
and
the
properties
of
the
resource
that
the
event
is
associated
with.
You
can
also
open
a
Business
Impact
view.
If
a
resource
that
was
dragged
into
a
business
system
has
an
alert
state
only
because
of
child
events,
the
alert
does
not
carry
over
with
the
resource.
If
the
resource
that
was
dragged
has
messages
or
exceptions
in
addition
to
the
child
events,
the
messages
or
exceptions
might
cause
the
alert
state
to
carry
over
with
the
resource.
Because
of
this,
if
the
event
viewer
is
launched
from
a
Tree
view
or
a
HyperView,
the
status
of
the
resources
in
those
views
could
be
different
from
the
events
shown
in
the
event
viewer.
So,
if
you
drag
and
drop
a
resource
into
a
business
system,
but
do
not
drag
and
drop
any
of
its
descendents,
events
for
the
resource
and
for
ALL
of
its
descendents
are
shown
in
the
event
viewer.
However,
if
you
also
drag
and
drop
any
descendents
of
the
resource,
the
event
viewer
shows
ONLY
events
for
the
resource
and
the
descendents
that
were
dragged
and
dropped.
As
with
other
Table
views
in
the
console,
you
can
set
filters
for
events
in
the
event
viewer.
By
default,
event
viewer
filters
are
set
to
display
only
recent
events
of
some
significance.
For
example,
the
Date
filter
is
set
to
Last
30
minutes,
and
the
Alert
State
is
set
to
Yellow.
Because
the
event
viewer
displays
events
for
the
selected
resource
and
its
descendents,
this
can
adversely
affect
system
performance.
When
working
in
the
event
viewer,
consider
these
guidelines:
v
Filter
for
a
time
frame
that
is
appropriate
to
the
business
system
(examples
are:
3
hours
or
less;
24
hours
or
less.)
v
Set
the
auto-refresh
time
to
no
less
than
1
minute
v
Do
not
auto-refresh
the
view
from
which
the
event
viewer
was
opened,
unless
the
view
is
a
resource-specific
table
view.
For
example,
if
the
event
viewer
is
opened
from
either
a
Tree
view
or
HyperView,
these
views
do
not
need
to
be
refreshed
because
they
already
receive
notifications
without
being
refreshed.
v
Do
not
manually
refresh
the
event
viewer
as
this
causes
both
the
event
viewer
and
the
view
from
which
the
event
viewer
was
opened
to
refresh.
Understanding
View
Behavior
Switching
presentation
style
does
not
change
the
underlying
model
for
the
view,
which
is
based
on
how
the
view
is
initially
invoked.
It
is
this
underlying
model
definition
that
is
saved
in
the
workspace,
and
that
dictates
the
content
when
the
view
is
restored.
For
example
if
you
save
a
Tree
view
that
is
expanded
to
five
levels
and
then
switch
to
the
HyperView
presentation
style,
when
the
view
is
restored
it
preserves
the
HyperView
presentation
style,
but
the
underlying
model
(tree
view)
causes
the
view
to
display
only
the
root
and
the
immediate
children.
HyperView
and
Tree
view
support
expanding
and
collapsing
nodes,
however
this
information
is
not
saved
in
the
workspace
with
a
view.
So
when
the
HyperView
or
Tree
view
is
restored
from
the
workspace,
it
reverts
to
its
initial
display
state.
Chapter
2.
Introducing
the
Console
13

Tree
view
and
HyperView
also
support
changing
the
presentation
style
of
the
view
content.
While
viewing
in
Tree
view,
you
can
click
on
the
toolbar,
or
click
View
->
HyperView
to
switch
the
presentation
style
to
HyperView.
Likewise,
you
can
click
to
switch
a
HyperView
to
the
tree
presentation
style.
In
each
case,
no
database
retrieval
occurs;
the
current
view
content
is
simply
switched
to
the
alternate
presentation
style.
Using
Tree
View
Tree
view
is
the
default
view
that
is
displayed
by
the
console.
Figure
6
illustrates
the
Tree
view.
The
Tree
view
initially
displays
the
root
resource
of
the
tree
and
the
immediate
children
of
the
resource.
You
can
expand
the
nodes
to
increase
the
level
of
descendent
resources
that
is
displayed.
You
can
select
a
resource
by
clicking
it.
Right-click
a
resource
to
open
its
menu
and
select
an
action
to
perform
on
that
resource.
Figure
6
shows
a
Tree
view
with
the
event
viewer
open.
Expanding
a
resource
in
the
tree
view
causes
resource
information
to
be
cached
at
the
client.
Be
aware
that
future
updates
to
these
resources
are
automatically
sent
to
the
client,
potentially
causing
the
view
to
be
refreshed.
For
example
when
a
business
system
is
added,
the
client
receives
a
notification
that
a
business
system
Figure
6.
Tree
View
that
has
the
Event
Viewer
Open
14
IBM
Tivoli
Business
Systems
Manager:
Introducing
the
Consoles

has
been
created.
If
the
parent
business
system
of
the
newly
created
business
system
is
currently
displayed
in
the
tree,
or
has
ever
been
displayed
during
this
session
by
expanding
a
node,
this
parent
business
system
and
its
children
must
be
retrieved
from
the
database.
If
this
parent
business
system
has
many
descendents
that
have
been
expanded
in
the
past,
a
large
number
of
database
calls
could
be
required.
Using
HyperView
HyperView
is
another
way
of
displaying
the
descendents
of
a
resource.
The
term
HyperView
is
used
in
two
distinctly
different
contexts
within
the
console:
v
HyperView
is
a
graphical
presentation
tool
that
is
used
for
displaying
resource
hierarchies.
With
HyperView,
a
large
number
of
resources
can
be
displayed
in
a
relatively
small
space.
v
HyperView
is
a
menu
selection
that
displays
resource
hierarchies
using
the
HyperView
presentation
style.
By
default,
the
HyperView
function
returns
10
generations
of
descendents.
What
you
see
depends
on
the
filtering,
which
the
console
performs
on
the
results
returned
by
the
database
and
the
return
limit
that
is
configured
in
Console
–>
Administrator
Preferences
–>
Configuration.
When
the
database
retrieves
the
descendents,
if
the
return
limit
is
exceeded
while
processing
a
generation,
then
the
incomplete
generation
is
not
returned,
and
the
last
complete
generation
is
returned
and
becomes
the
leaves
on
the
initial
HyperView
display.
This
behavior
is
particularly
noticeable
with
large
generations.
Figure
7
on
page
16
shows
resources
displayed
in
HyperView.
Chapter
2.
Introducing
the
Console
15
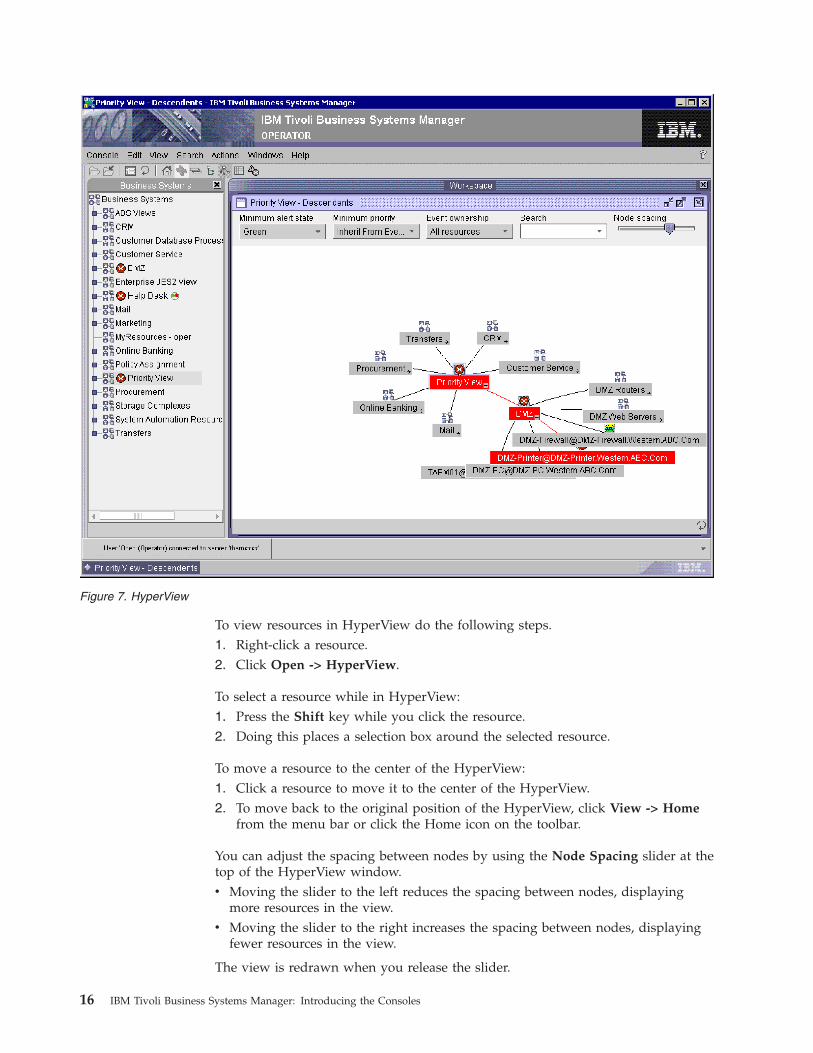
To
view
resources
in
HyperView
do
the
following
steps.
1.
Right-click
a
resource.
2.
Click
Open
->
HyperView.
To
select
a
resource
while
in
HyperView:
1.
Press
the
Shift
key
while
you
click
the
resource.
2.
Doing
this
places
a
selection
box
around
the
selected
resource.
To
move
a
resource
to
the
center
of
the
HyperView:
1.
Click
a
resource
to
move
it
to
the
center
of
the
HyperView.
2.
To
move
back
to
the
original
position
of
the
HyperView,
click
View
->
Home
from
the
menu
bar
or
click
the
Home
icon
on
the
toolbar.
You
can
adjust
the
spacing
between
nodes
by
using
the
Node
Spacing
slider
at
the
top
of
the
HyperView
window.
v
Moving
the
slider
to
the
left
reduces
the
spacing
between
nodes,
displaying
more
resources
in
the
view.
v
Moving
the
slider
to
the
right
increases
the
spacing
between
nodes,
displaying
fewer
resources
in
the
view.
The
view
is
redrawn
when
you
release
the
slider.
Figure
7.
HyperView
16
IBM
Tivoli
Business
Systems
Manager:
Introducing
the
Consoles

In
addition
to
providing
a
different
view
of
your
enterprise,
HyperView
displays
links
between
resources
in
the
color
of
the
alerts
that
propagate
up
the
tree.
Filtering
in
HyperView
A
unique
capability
of
using
HyperViews
is
that
you
can
filter
on
minimum
alert
state,
minimum
priority,
and
event
ownership
to
limit
the
information
in
the
view.
HyperView
also
has
a
unique
search
capability.
When
you
enter
information
in
a
search
field,
such
as
the
name
of
a
resource,
the
results
are
marked
with
pointers
in
the
view.
To
change
display
properties,
such
as
colors,
and
text
and
icon
size,
right-click
the
background.
Using
Table
View
The
Table
view
displays
details
about
resources.
When
you
change
the
view
type
from
Tree
view
to
Table
view
or
from
HyperView
to
Table
view,
all
the
resources
are
displayed
in
rows
with
columns
that
contain
various
attributes
of
the
resources.
Use
Table
views
to
sort
information
and
do
more
extensive
filtering.
Figure
8
shows
a
Table
view.
Sorting
Data
in
Tables
To
sort
data
in
a
particular
column,
move
your
mouse
pointer
over
the
column
header
for
the
respective
column
until
you
see
the
up
and
down
arrow
icons.
Figure
8.
Table
View
Chapter
2.
Introducing
the
Console
17

To
sort
in
ascending
order
click
the
up
arrow.
To
sort
in
descending
order,
click
the
down
arrow.
Once
the
data
is
sorted,
the
icon
that
indicates
how
the
data
is
sorted
is
shown
on
the
respective
column
header.
For
example,
if
the
data
is
sorted
in
ascending
order,
the
up
arrow
is
displayed
on
the
column
header.
If
the
data
is
sorted
in
descending
order,
the
down
arrow
is
displayed
on
the
column
header.
Filtering
Data
in
Tables
You
can
filter
data
in
a
table
to
meet
your
criteria.
To
filter
data
do
the
following
steps.
1.
With
the
cursor
inside
a
table
column
heading,
right-click
to
access
the
table
menu.
2.
From
the
table
menu,
click
Filter
->
Show
Filter
Row.
Once
this
item
is
selected,
the
filters
that
are
set
for
each
column
in
the
table
are
displayed
under
their
respective
column
headers.
These
filters
are
initially
set
to
<no
filter>.
3.
Click
the
filter
for
the
column
in
which
you
want
to
filter
data.
When
you
click
the
filter,
you
are
presented
with
a
window
from
which
you
can
set
the
filter.
After
you
have
set
the
filter,
the
new
setting
replaces
the
previous
one
that
was
under
the
column
header.
Changing
the
Order
of
Columns
in
Tables
To
include
all
the
necessary
information
about
resources,
tables
have
a
number
of
columns.
You
can
change
the
order
of
columns
in
tables
by
clicking
a
column
heading
and
dragging
it
to
where
you
want
it.
Using
Topology
View
Topology
views
display
graphical
representations
of
managed
resources
and
the
relationships
between
resources.
Resources
are
represented
by
icons
and
relationships
are
represented
by
lines
or
arrows
that
might
show
direction.
Any
type
of
relationship
between
two
resources
can
be
represented
in
a
Topology
view.
Working
with
Resources
in
Topology
Views
Because
of
their
graphical
nature,
topology
views
provide
a
more
interactive
presentation
of
resources
than
Tree,
Table,
or
HyperViews.
The
console
provides
a
number
of
Topology
views
that
display
relationships
for
specific
classes
of
resources.
See
Appendix
A,
“Topology
Views,”
on
page
61
for
detailed
information
about
various
Topology
views.
You
can
move
resources
around
in
the
Topology
view
by
dragging
one
or
more
nodes
using
the
left
mouse
button.
Press
Ctrl
while
you
click
the
left
mouse
button
to
select
more
than
one
resource
for
dragging.
The
new
locations
can
be
saved
in
the
workspace.
The
Navigation
Center
The
Topology
Navigation
Center
provides
a
thumbnail
view
of
the
Topology
view
and
it
contains
tools
for
zooming
and
panning
around
the
view.
The
Navigation
Center
depicts
the
current
view
in
the
workspace
and
is
not
displayed
if
the
current
view
is
not
a
Topology
view.
To
specify
preferences
for
the
Navigation
Center,
click
Console
–>
Preferences
–>
Topology
–>
Navigation
Center.
Figure
9
on
page
19
shows
resources
displayed
in
a
Topology
view
with
the
Navigation
Center
open.
18
IBM
Tivoli
Business
Systems
Manager:
Introducing
the
Consoles

Other
Resource
Views
Choices
on
the
Open
menu
as
shown
in
Figure
10
on
page
20
include
other
ways
to
view
resources.
This
section
introduces
the
Managed
Resources
view
and
the
Business
Impact
view.
Figure
9.
Topology
View
Chapter
2.
Introducing
the
Console
19

Managed
Resources
View
Managed
Resources
view
is
a
table
view
that
provides
a
high-level
monitoring
window
to
filter
for
alert
state
events.
The
Managed
Resources
view
provides
pertinent
resource
information
in
a
column
format
with
sorting
capabilities.
When
you
select
a
resource
(a
row
of
information)
in
this
view,
you
can
view
and
perform
operations
relative
to
that
resource.
The
Managed
Resources
view
returns
the
physical
resources
regardless
of
where
it
is
launched.
By
default
it
also
returns
the
physical
children
of
any
resources
in
the
view.
The
only
exception
to
this
is
when
launched
from
a
business
system,
if
the
parent
resource
has
children
in
the
business
system,
only
those
children
are
displayed.
Administrators
should
configure
the
system
to
return
a
maximum
of
10
000
resources
to
accommodate
business
systems
containing
large
numbers
of
resources.
Administrators
can
set
the
maximum
number
of
resources
searched
as
well
as
the
maximum
number
of
resources
returned.
To
set
these
limits,
administrators
use
the
Configuration
page
of
the
Administrator
Preferences
notebook.
The
Task
Assistant
has
information
about
setting
limits.
Whenever
a
new
resource
is
added
in
the
console
database,
there
could
be
a
delay
when
displaying
resources
in
the
Managed
Resources
view.
Figure
10.
Resource
with
its
menu
open
20
IBM
Tivoli
Business
Systems
Manager:
Introducing
the
Consoles

Business
Impact
View
Business
Impact
is
a
HyperView
that
shows
the
impact
of
resource
failures.
The
Business
Impact
view
shows
where
a
selected
resource
is
used.
Administrators
should
configure
the
system
to
return
6
generations,
which
should
be
adequate
to
accommodate
resources
other
than
DB2®
resources
or
IMS™
resources.
For
DB2
and
IMS
resources,
the
view
should
be
configured
to
12,
which
is
the
maximum
number
of
generations
allowed.
To
set
this
limit,
click
Console
–>
Administrator
Preferences
–>
Configuration.
Use
the
Task
Assistant
to
get
information
about
setting
this
limit.
Working
with
Resource
Properties
Each
resource
within
the
console
contains
information
called
properties.
Properties
contain
specific
information
about
a
resource,
such
as
name,
description,
state,
and
threshold
controls.
Properties
information
varies
depending
on
the
resource.
Following
are
some
examples
of
what
you
can
do
when
you
open
the
properties
for
a
resource.
v
View
various
attributes
such
as
name,
description,
current,
and
scheduled
states
v
Look
into
the
cause
of
an
alert,
by
examining
currently
posted
exceptions
and
console
messages
v
View
thresholds
for
propagation
To
open
the
properties
for
a
resource
or
a
resource
type
do
the
following
steps.
1.
Right-click
the
resource
or
resource
type
to
open
its
menu.
2.
Click
Properties.
Figure
11
on
page
22
is
an
example
of
the
properties
notebook
for
a
resource,
opened
to
the
General
page.
Chapter
2.
Introducing
the
Console
21

The
Current
State
and
Scheduled
State
of
a
Resource
Current
state
and
scheduled
state
are
shown
on
the
General
page
of
resource
properties.
The
current
state
of
a
resource
reflects
whether
that
resource
is
currently
available.
The
scheduled
state
of
a
resource
reflects
whether
that
resource
should
be
available
at
the
current
time.
Comparing
the
current
state
of
a
resource
with
its
scheduled
state
is
one
method
of
determining
whether
a
resource
is
available.
While
current
state
is
a
function
of
availability
for
the
resource,
scheduled
state
is
a
function
of
a
resource’s
schedule.
Every
resource
has
a
scheduled
state
property.
This
value
can
be
changed
by
administrators
and
can
be
used
to
indicate
to
users
the
state
that
a
resource
should
be
in.
For
CICS®
regions
it
is
possible
to
create
tasks
that
automatically
update
the
scheduled
state
and
create
exceptions
when
the
state
is
not
appropriate.
Exceptions
and
Child
Events
Using
Properties
pages
for
exceptions
and
child
events
you
can
view
the
number
of
exceptions
received
by
the
resource.
The
Child
Events
properties
page
displays
child
events
that
occur
on
resources.
Child
events,
for
example,
could
be
transactions
within
a
CICS
region
that
have
exceeded
their
thresholds
and
are
tagged
with
alerts.
Each
transaction
that
had
an
alert
generates
an
event
and
passes
that
event
to
its
parent,
the
CICS
resource.
These
events
are
called
child
events,
because
they
originate
from
children
of
a
resource.
Events
are
assigned
a
priority,
based
on
the
priority
assigned
to
the
transaction
itself,
or
based
on
the
incoming
exception
that
caused
the
alert.
Figure
11.
Example
of
the
General
page
of
a
properties
notebook
for
a
resource
22
IBM
Tivoli
Business
Systems
Manager:
Introducing
the
Consoles

Using
the
Task
Monitor
The
Task
Monitor
uses
the
Table
view.
You
can
monitor,
start,
restart,
cancel,
or
remove
tasks
that
are
running.
You
can
open
the
Task
Monitor
at
any
time
during
the
console
session,
however,
at
least
one
task
must
be
running.
A
status
bar
that
is
located
at
the
bottom
of
the
Workspace
displays
the
status
of
tasks.
Click
this
area
to
see
a
list
of
tasks.
You
can
then
select
a
task
in
the
list
to
display
it.
Working
with
Notes
How
you
work
with
notes
is
determined
by
settings
in
Administrator
Preferences
–>
Notes
and
Administrator
Preferences
–>
Take
Ownership.
You
can
use
notes
to:
v
Take
ownership
v
Provide
information
about
a
problem
v
Provide
general
information
about
a
resource
Table
7
describes
the
three
types
of
notes
that
the
console
uses.
Table
7.
Types
of
notes
Use
this
Type
of
Note
To
do
this
Ownership
Take
ownership
of
problem
that
has
caused
a
Red
or
Yellow
alert
Figure
12.
Task
Monitor
Chapter
2.
Introducing
the
Console
23

Table
7.
Types
of
notes
(continued)
Use
this
Type
of
Note
To
do
this
Problem
Provide
information
about
a
problem
that
already
has
an
owner
or
a
problem
whose
severity
does
not
require
event
ownership
Information
Provide
general
information
about
a
resource
Ownership
Notes
Use
Ownership
notes
to
take
ownership
of
events.
You
can
take
ownership
of
events
at
the
event
level
or
at
the
resource
level.
When
you
take
ownership
at
the
resource
level,
you
can
take
ownership
of
all
events
associated
with
a
resource.
When
you
take
ownership
at
the
event
level,
you
can
take
ownership
of
individual
events
or
all
of
the
events
associated
with
a
resource.
Taking
Ownership
of
Events
You
can
take
ownership
of
the
following
events:
v
Any
unowned
critical
(red)
and
warning
(yellow)
exceptions
v
The
most
recent
message
if
more
than
one
message
is
sent
to
a
resource.
To
take
ownership
of
an
event,
do
the
following
steps:
1.
While
you
are
in
a
view,
click
Console
–>
Events
to
open
the
event
viewer.
2.
Right-click
the
event
you
want
to
take
ownership
of
and
then
click
Take
Ownership.
Doing
this
opens
the
Note
Editor.
3.
Complete
the
requested
information
and
click
OK.
To
take
ownership
at
the
resource
level,
do
the
following
steps:
1.
Right-click
a
resource
in
the
view
that
has
at
least
one
event.
2.
Click
Resource
Take
Ownership.
Doing
this
opens
the
Note
Editor.
3.
Complete
the
requested
information
and
click
OK.
Use
the
Task
Assistant
to
get
information
about
using
the
Note
Editor.
Closing
Ownership
Notes
You
can
close
Ownership
notes
from
the
event
viewer
or
from
the
note
properties
window.
When
a
note
is
closed
by
the
user,
all
associated
events
are
closed.
The
system
could
also
close
notes.
An
open
ownership
note
must
be
associated
with
events
that
are
in
either
the
yellow
or
red
state.
An
ownership
note
is
closed
by
the
system
if
all
associated
events
become
green.
As
events
become
green,
those
events
are
automatically
removed
from
the
note.
When
all
events
are
removed
from
a
note,
the
note
is
automatically
closed
by
the
system.
Problem
and
Information
Notes
Problem
and
Information
notes
provide
additional
information
about
console
resources,
problems,
alerts,
or
any
other
subjects.
Problem
notes
provide
additional
information
about
solving
a
problem
that
someone
took
ownership
of,
or
to
act
as
the
primary
source
of
information
regarding
a
problem
whose
severity
did
not
call
for
anyone
to
take
ownership.
24
IBM
Tivoli
Business
Systems
Manager:
Introducing
the
Consoles

Information
notes
are
even
more
general
than
problem
notes.
You
can
use
Information
notes
for
conveying
information
that
is
not
covered
by
Ownership
and
Problem
notes.
Because
Problem
and
Information
notes
are
not
associated
with
events,
they
are
not
automatically
closed.
Creating
Notes
When
you
create
a
note,
the
Note
Editor
dialog
opens.
There
is
an
Events
table
in
the
lower
section
of
the
window
that
provides
a
listing
of
events.
Events
are
listed
in
descending
order
with
exceptions
filtered
to
the
top
of
the
list.
Both
types
of
events
(messages
and
exceptions)
are
listed.
If
the
Note
Editor
is
opened
from
the
resource
to
take
ownership
of
a
problem,
all
events
for
that
resource
are
displayed.
Administrators
can
configure
consoles
(Console
–>
Administrator
Preferences
–>
Notes)
to
initiate
the
creation
of
a
problem
ticket
from
the
Note
Editor
window
when
an
Ownership
note
is
created.
Using
the
Note
Editor
Use
the
Note
Editor
to
take
ownership
of
a
resource
or
an
event,
communicate
problems
to
other
users
about
a
resource,
and
relay
general
information
about
a
resource.
You
can
also
view
the
contents
of
a
note
and
begin
the
process
of
creating
a
problem
ticket.
The
events
table
located
in
the
lower
section
of
the
Note
Editor
provides
a
listing
of
events.
Events
are
listed
in
descending
order
with
exceptions
filtered
to
the
top
of
the
list.
If
you
opened
the
Note
Editor
from
a
resource
to
take
ownership,
all
events
for
that
resource
are
listed.
Figure
13
on
page
26
shows
the
Note
Editor
with
events
that
are
preselected
and
with
the
Task
Assistant
open.
Chapter
2.
Introducing
the
Console
25

You
can
access
the
Note
Editor
by
right-clicking
a
resource
or
an
event
and
clicking
Notes
–>
Create
or
Notes
–>
Find.
Using
the
Notes
View
The
Notes
View
is
a
table
view
that
provides
a
centralized
viewing
facility
and
a
base
for
performing
a
variety
of
tasks
that
are
associated
with
notes.
Administrators
set
options
for
using
the
Notes
View
in
Console
–>
Administrator
Preferences
–>
Notes.
You
can
use
the
table
filters
in
Notes
View
to
selectively
display
notes.
After
changing
the
filters,
refresh
the
view
to
retrieve
new
data
from
the
database.
By
default
the
filters
for
the
Notes
View
are
set
to
display
the
open
notes
for
the
current
user.
Figure
14
on
page
27
is
an
example
of
a
console
opened
to
the
Notes
View.
Figure
13.
Note
Editor
26
IBM
Tivoli
Business
Systems
Manager:
Introducing
the
Consoles

To
access
the
Notes
view,
click
Console
–>
Notes.
You
can
select
a
note
or
notes
and
perform
various
actions,
such
as
transfer
the
note
to
a
different
user
or
add
remarks
to
a
note.
You
can
also
double-click
a
note
to
open
its
properties.
Use
the
Task
Assistant
to
get
additional
information
about
the
Notes
View.
Note
Properties
You
can
change
general
information
for
a
note,
view
its
history,
or
add
remarks
from
the
note
properties
pages.
Administrator
preferences
determine
what
information
you
can
change.
To
open
the
properties
of
a
note,
either
right-click
the
note
and
select
Properties
or
double-click
the
note.
The
History
properties
page
for
a
note
lists
all
actions
that
have
been
taken
against
a
note,
and
you
can
add
remarks
to
a
note
from
the
History
page.
Figure
15
on
page
28
shows
the
General
properties
page
for
a
note.
Figure
14.
Notes
View
Chapter
2.
Introducing
the
Console
27

Using
the
Event
Viewer
to
Work
with
Notes
The
Event
Viewer
displays
information
about
events
(exceptions
and
messages)
that
are
associated
with
either
an
individual
resource
or
all
of
the
resources
within
a
business
system.
Within
the
event
viewer,
operators
can
do
the
following
actions
with
events:
v
Take
ownership
v
Transfer
ownership
v
Close
When
a
new
resource
is
added
in
the
database,
there
could
be
a
delay
when
displaying
events
for
resources.
If
you
drag
and
drop
a
resource
into
a
business
system,
but
do
not
drag
and
drop
any
of
its
descendents,
events
for
the
resource
and
for
ALL
of
its
descendents
are
shown
in
the
event
viewer.
However,
if
you
also
drag
and
drop
any
descendents
of
the
resource,
the
event
viewer
shows
ONLY
events
for
the
resource
and
the
descendents
that
were
dragged
and
dropped.
Working
with
Problem
Tickets
and
Change
Requests
If
your
console
is
set
up
to
work
with
problem
management
and
change
management
systems,
you
can
use
the
console
to
perform
various
tasks
that
are
related
to
problem
tickets
and
change
requests.
A
problem
or
change
system
user
ID
and
password
might
be
required
to
perform
these
tasks.
If
NetView
is
used
to
access
those
systems,
an
additional
user
ID
and
password
might
also
be
required.
Figure
15.
General
Properties
of
a
Note
28
IBM
Tivoli
Business
Systems
Manager:
Introducing
the
Consoles
Working
with
Problem
Tickets
You
can
create,
update,
find,
or
close
problem
tickets
from
within
the
console.
Create
a
problem
ticket
from
the
context
menu
of
a
resource
Creating
a
problem
ticket
from
the
context
menu
of
a
resource
does
not
contain
linked
events
or
ownership
notes.
Creating
a
problem
ticket
from
the
context
menu
of
a
resource
creates
the
problem
ticket
at
the
resource
level.
Create
a
problem
ticket
from
an
Ownership
note
Creating
a
problem
ticket
from
an
Ownership
note
ensures
a
relationship
with
the
linked
event
but
only
through
the
Ownership
note.
The
problem
ticket
creation
can
be
done
at
the
time
the
Ownership
note
is
created
in
the
Note
Editor,
or
it
can
be
done
later
from
the
Note
Properties
window
for
the
ownership
note
(provided
this
is
allowed
by
your
configuration).
Find
a
problem
ticket
You
can
search
for
a
problem
ticket
from
the
context
menu
of
a
selected
resource
or
by
clicking
Find
in
the
Create
Problem
Ticket
window.
Update
or
close
problem
tickets
You
can
update
or
close
problem
tickets
from
the
Problem
Ticket
Properties
window.
You
can
open
this
window
from
the
Find
Problem
Ticket
window,
the
Note
Properties
window
of
a
note
that
has
an
associated
problem
ticket,
or
from
the
Notes
or
Notes
Summary
views.
Working
with
Change
Requests
You
can
create,
update,
find,
and
close
change
requests
from
within
the
console.
Create
a
change
request
Open
the
menu
for
a
resource
and
click
Change
Request
–>
Create.
Find
a
change
request
Open
the
menu
for
a
resource
and
click
Change
Request
–>
Find.
Update
or
close
a
Change
Request
You
can
update
and
close
change
requests
on
the
Properties
page
of
the
Change
Request.
You
can
open
the
properties
of
a
change
request
from
the
Find
Change
Requests
window.
Signing
Off
the
Console
Do
the
following
steps
to
sign
off
the
console
and
then
sign
on
as
a
different
user:
1.
Click
Console
–>
Sign
Off.
2.
The
Sign
On
window
opens
and
you
can
sign
on
using
different
sign
on
information.
Exiting
the
Console
To
close
open
views
and
exit
the
console:
1.
Click
Console
->
Exit.
2.
The
console
closes.
Chapter
2.
Introducing
the
Console
29

30
IBM
Tivoli
Business
Systems
Manager:
Introducing
the
Consoles

Chapter
3.
Introducing
the
Web
Console
This
chapter
introduces
the
IBM
Tivoli
Business
Systems
Manager
Web
console.
Most
of
the
concepts
that
are
introduced
for
the
console
are
available
in
the
Web
console.
Using
the
Web
console,
operators
can
do
the
basic
monitoring
and
problem
determination
tasks
that
they
do
using
the
regular
console
and
administrators
can
do
additional
tasks
such
as
creating
shared
filters.
The
Web
console
provides
a
role-based
Web
interface
that
presents
tasks
that
are
relevant
to
each
role
that
you
are
assigned.
These
tasks
are
organized
in
a
portfolio
that
is
titled
My
Work.
The
following
roles
are
used
in
the
Web
console:
v
Restricted
Operator
v
Operator
v
Administrator
v
Super
Administrator
Signing
on
to
the
Web
Console
The
Web
console
is
configured
to
accept
Secure
Socket
Layer
(SSL)
connections
from
clients.
To
sign
on
to
the
Web
console,
do
the
following
steps:
1.
Open
your
Web
browser.
2.
Type
the
address
that
your
administrator
provided.
The
address
is
probably
similar
to
the
following
example.
In
the
example,
console_server_name
is
the
fully-qualified
name
of
a
computer
where
the
console
server
is
running.
v
If
you
are
using
the
default
port
(9443)
for
the
HTTP
server
port
on
the
computer
where
the
console
server
is
running
the
address
is:
https://console_server_name:9443/TbsmWebConsole
3.
If
you
are
using
Windows
2003
and
Internet
Explorer,
do
the
following
steps:
a.
In
Internet
Explorer,
select
Tools
–>
Internet
Options
–>
Security
Settings.
b.
Make
sure
Meta
Refresh
and
Active
Scripting
are
selected.
When
the
sign
on
window
opens,
do
the
following
steps:
1.
Type
your
user
name.
2.
Type
your
password.
3.
Click
OK.
The
Web
console
opens
and
looks
similar
to
Figure
16
on
page
32
©
Copyright
IBM
Corp.
2004
31

Components
that
are
shown
in
the
window
in
Figure
16
are
explained
in
Table
8.
Table
8.
Console
components
Component
Overview
Banner
area
The
area
that
is
located
below
the
title
bar
and
contains
the
product
name.
You
can
set
your
preference
for
displaying
the
banner
by
clicking
View
Miscellaneous
–>
User
Preferences
–>
Appearance.
My
Work
portfolio
The
area
that
displays
the
way
your
work
is
organized
within
the
Web
console.
The
portfolio
is
located
on
the
left
side
of
the
Web
console
and
is
a
container
for
the
tasks
that
you
are
assigned.
The
portfolio
is
titled
My
Work.
This
portfolio
area
also
shows
recent
filters
you
used.
You
can
toggle
between
displaying
the
portfolio
and
not
displaying
it
by
clicking
the
arrow
button
that
is
located
on
the
title
bar
of
the
portfolio.
task
bar
The
bar
that
is
located
above
the
work
area
and
it
displays
buttons
for
each
open
window.
When
you
click
one
of
these
buttons,
the
associated
window
opens
in
the
work
area.
The
task
bar
also
includes
icons
for
the
following:
v
Show
all
tasks.
Opens
the
Task
Manager,
where
you
can
switch
to
other
tasks
and
close
tasks.
v
Sign
off
of
the
Web
console
Figure
16.
IBM
Tivoli
Systems
Manager
Web
console
32
IBM
Tivoli
Business
Systems
Manager:
Introducing
the
Consoles

Table
8.
Console
components
(continued)
Component
Overview
Task
Assistant
The
place
to
go
for
answers
to
your
questions.
The
Task
Assistant
is
represented
by
the
question
mark
on
the
far
right
of
the
menu
bar.
To
open
the
Task
Assistant,
click
the
question
mark.
When
it
is
open,
the
Task
Assistant
is
displayed
to
the
right
of
the
work
area.
To
close
the
Task
Assistant,
click
the
question
mark.
Work
area
Area
for
displaying
windows.
This
area
does
not
include
the
task
list
or
the
Task
Assistant.
Status
bar
Located
below
the
work
area.
Displays
the
user
ID,
the
role
of
the
user,
and
the
console
server
that
the
user
is
connected
to.
The
portfolio
that
is
shown
in
Figure
16
on
page
32
has
these
actions:
v
View
Business
Systems
v
View
Events
v
View
Resources
v
View
Notes
v
View
Miscellaneous
v
Recent
Filters
These
actions
are
explained
in
Table
9.
Table
9.
Available
actions
when
the
Web
console
is
started
Action
Use
to
view
View
Business
Systems
Business
Systems
List
Launches
the
Business
Systems
view.
Business
Systems
Filters
Launches
the
business
systems
filters
page.
You
can
use
an
existing
filter
to
view
business
systems
or
you
can
create
a
new
filter.
View
Events
Event
Filters
Launches
the
events
filters
page.
You
can
use
an
exiting
filter
to
view
events
or
you
can
create
a
new
filter.
View
Resources
Resource
Filters
Launches
the
resource
filters
page.
You
can
use
an
existing
filter
to
view
resources.
Critical
Watch
List
Launches
the
critical
resources
page.
You
can
add
or
remove
existing
filters
for
monitoring
critical
resources.
Search
All
Resources
Launches
the
search
page
to
use
for
locating
resources
View
Notes
View
my
notes
Launches
your
My
Notes
view,
which
displays
ownership,
problem,
and
information
notes
that
are
assigned
to
you.
Chapter
3.
Introducing
the
Web
Console
33

Table
9.
Available
actions
when
the
Web
console
is
started
(continued)
Action
Use
to
view
View
Miscellaneous
Portfolio
tasks
Launches
a
page
to
use
for
updating
the
tasks
that
are
displayed
in
your
portfolio.
User
preferences
Launches
a
page
to
use
for
establishing
your
preferences
for
using
this
console.
Welcome
window
Launches
the
Web
console
Welcome
window.
Recent
Filters
Displays
filters
that
you
used
recently.
Understanding
Alert
State
Indicators
The
Web
console
indicates
the
alert
states
of
resources
by
displaying
a
color
indicator
that
represents
the
alert
state
of
a
resource.
Alert
state
indicators
are
described
in
Table
10.
Table
10.
Alert
state
indicators
Alert
state
Description
Normal
(green)
informs
you
that
the
resource
is
performing
as
expected.
Warning
(yellow)
informs
you
that
the
resource
is
performing
but
its
availability
is
in
jeopardy.
This
could
mean
that
the
system
is
overloaded,
or
it
could
be
part
of
the
standard
operations
of
your
data
center.
Critical
(red)
informs
you
that
the
resource
is
not
available
or
its
availability
is
at
serious
risk.
Understanding
Resource
Indicators
The
Web
console
uses
resource
indicators
in
views.
Table
11
describes
the
resource
indicators
that
are
used.
Table
11.
Resource
indicators
Resource
Indicator
Description
The
resource
has
one
or
more
open
events
that
are
owned.
All
of
the
open
events
for
the
resource
are
owned.
The
resource
has
an
open
problem
ticket.
The
resource
has
a
scheduled
outage;
no
propagation
occurs.
The
resource
is
a
business
system
folder
shortcut.
Whether
or
not
the
business
system
shortcut
icon
is
displayed
is
determined
by
a
setting
in
Console
–>
Administrator
Preferences
–>
View.
For
information
about
business
system
shortcuts,
see
the
information
in
the
Task
Assistant.
34
IBM
Tivoli
Business
Systems
Manager:
Introducing
the
Consoles

Table
11.
Resource
indicators
(continued)
Resource
Indicator
Description
This
indicates
a
deleted
source.
If
a
business
system
resource
is
linked
to
a
source
physical
resource
that
is
deleted,
the
business
system
resource
is
overlaid
with
a
deleted
source
indicator.
This
is
also
true
for
a
business
system
shortcut
if
the
source
business
system
is
deleted.
Getting
Assistance
While
Using
the
Web
Console
The
Web
console
uses
the
Task
Assistant
to
display
helpful
information.
To
display
the
Task
Assistant,
click
the
question
mark
icon
that
is
located
in
the
upper
right
corner
of
windows.
The
Task
Assistant
opens
with
information
about
the
window
from
which
you
clicked
the
question
mark.
Once
the
Task
Assistant
is
open,
you
can
also
get
information
by
using
the
table
of
contents,
index,
message
index,
and
the
search
function.
To
close
the
Task
Assistant,
click
the
question
mark.
Getting
Help
for
Error
Messages
Web
console
error
messages
have
the
prefix
GTMWC
followed
by
a
message
number.
To
get
information
about
an
error
message,
click
the
question
mark
icon
that
is
located
in
the
upper
right
corner
of
the
error
message
to
display
the
Task
Assistant.
To
view
a
listing
of
all
console
messages:
1.
Click
the
Message
Index
icon
in
the
Task
Assistant.
2.
Expand
the
Message
Index
tree.
3.
Expand
the
GTM
tree.
4.
Click
a
message
to
see
its
explanation.
Setting
Preferences
Although
administrators
set
some
preferences
that
are
used
in
the
Web
console,
you
can
set
the
following
preferences
by
clicking
View
Miscellaneous
–>
User
Preferences.
General
Set
refresh
rates
and
whether
to
display
icons
in
views
Appearance
Set
whether
to
display
the
banner,
use
the
sliding
portfolio,
and
set
a
color
scheme
Maximum
returns
Set
maximum
returns
for
events,
resources,
business
systems,
and
search
results
Problem
ticket
Set
user
IDs
and
passwords
for
accessing
the
system
to
work
with
problem
tickets.
This
is
available
if
your
Web
console
is
configured
by
an
administrator
to
use
a
problem
ticket
system.
Chapter
3.
Introducing
the
Web
Console
35

Figure
17
shows
a
Web
console
that
has
User
Preferences
open
to
the
General
page
and
also
has
the
Task
Assistant
open.
To
set
preferences,
do
the
following
steps:
1.
Click
User
Preferences.
2.
Click
the
page
for
the
preferences
you
want
to
set.
3.
Set
the
preferences
and
click
OK.
Working
with
Resources
You
can
work
with
resources
in
the
following
ways:
v
Business
Systems
List
v
Filters
v
Critical
watch
list
(See
“Critical
Watch
List”
on
page
37.)
You
can
access
business
systems
directly
from
your
My
Work
portfolio
by
clicking
Business
Systems
List.
This
view
provides
top-down
navigation
of
business
systems.
Click
the
Select
Action
menu
to
access
actions
you
can
do
with
the
selected
resource.
Figure
17.
General
User
preferences
for
Problem
Ticket
36
IBM
Tivoli
Business
Systems
Manager:
Introducing
the
Consoles

When
you
use
filters
for
displaying
resources,
you
can
specify
search
criteria
to
narrow
the
resulting
list
of
resources.
The
resource
filter
is
accessible
from
the
portfolio
or
from
a
selected
resource.
See
“Working
with
Filters,”
for
additional
information.
Critical
Watch
List
The
critical
watch
list
is
a
list
of
resources
and
filters
that
are
assigned
to
an
operator
for
management
or
monitoring
tasks.
You
can
add
and
remove
resources
and
filters
to
and
from
this
list.
You
can
access
your
critical
watch
list
from
the
portfolio.
Viewing
Events
Use
an
event
filter
to
find
events.
The
event
filter
is
available
from
the
portfolio
or
from
a
selected
resource.
Using
a
filter,
you
can
specify
search
criteria
to
narrow
the
result
list.
You
can
also
save
and
add
filters
to
your
portfolio.
See
“Working
with
Filters,”
for
additional
information
about
filters.
Working
with
Filters
Filters
are
a
key
component
in
the
Web
console.
You
can
use
filters
to
search
for
resources,
events,
and
business
systems.
Filters
can
be
saved
and
reused.
Administrators
can
give
you
access
to
shared
filters
and
these
shared
filters
are
listed
in
your
filter
list.
Views
generated
by
filters
are
the
predominant
way
to
do
problem
analysis
when
you
are
using
the
Web
console.
Filters
are
tailored
to
the
type
of
resource
you
are
searching
for.
You
can
use
filters
to
locate
resources,
business
system
filters,
and
events.
Open
the
Task
Assistant
to
get
information
about
creating
filters.
Accessibility
You
can
operate
all
features
of
the
Web
console
by
using
the
keyboard
rather
than
the
mouse.
The
keyboard
shortcuts
for
the
Web
version
of
the
console
are
the
standard
keyboard
shortcuts
for
your
Web
browser.
Chapter
3.
Introducing
the
Web
Console
37

38
IBM
Tivoli
Business
Systems
Manager:
Introducing
the
Consoles

Chapter
4.
Introducing
the
Executive
Dashboard
The
executive
dashboard
is
a
Web-based
console
that
administrators
set
up
and
configure
using
the
IBM
Tivoli
Business
Systems
Manager
console.
Your
system
administrator
provides
the
Web
address,
your
user
ID,
and
your
password
for
your
dashboard.
The
executive
dashboard
provides
executives
with
a
view
of
the
following
information:
v
The
services
they
are
responsible
for
v
The
history
for
these
services
v
Status
changes
that
occurred
in
the
services
since
the
last
time
they
were
viewed
The
executive
dashboard
provides
IT
executives
a
view
of
the
following
information:
v
The
executive
dashboard
as
the
executive
sees
it
v
Information
about
why
a
service
is
red
v
Details
about
the
underlying
subservices
Accessing
and
Signing
on
to
the
Dashboard
The
executive
dashboard
is
available
in
two
versions:
v
A
version
that
is
Flash-based
and
is
for
users
who
have
no
more
than
12
services
on
their
dashboard.
Although
you
can
view
information
for
more
than
12
services,
only
8
services
can
be
displayed
in
the
services
area
of
the
dashboard.
You
can
access
up
to
12
services
from
the
icon
bar
on
the
dashboard.
v
An
HTML
version
that
is
for
users
who
have
more
than
12
services
on
their
dashboard,
and
for
users
who
want
to
use
the
accessibility
features
of
their
Web
browser.
Accessing
the
Flash-based
Dashboard
To
access
the
Flash-based
version
of
the
dashboard:
1.
Open
your
Web
browser.
2.
Type
the
address
your
administrator
provided.
The
address
is
probably
similar
to
one
of
the
following
examples.
In
the
examples
below,
console_server_name
is
the
fully-qualified
name
of
a
computer
where
the
console
server
is
running.
v
If
the
default
number
for
the
HTTP
server
port
on
the
computer
where
the
console
server
is
running
is
9080,
the
address
for
the
Flash
version
of
the
executive
dashboard
is
similar
to
the
following:
http://console_server_name:9080/TbsmExecutiveView
v
If
the
HTTP
server
port
is
something
other
than
9080,
the
address
is
similar
to
the
following
(port_number
is
the
server
port
on
the
computer
where
the
console
server
is
running):
http://console_server_name:port_number/TbsmExecutiveView
Accessing
the
HTML-based
Dashboard
To
access
the
HTML
version
of
the
executive
dashboard,
do
the
following
steps:
1.
Open
your
Web
browser.
©
Copyright
IBM
Corp.
2004
39

2.
Type
the
address
your
administrator
provided.
The
address
is
probably
similar
to
one
of
the
following
examples.
In
the
examples
below,
console_server_name
is
the
fully-qualified
name
of
a
computer
where
the
console
server
is
running.
v
If
the
default
number
for
the
HTTP
server
port
on
the
computer
where
the
console
server
is
running
is
9080,
the
address
for
the
HTML
version
of
the
executive
dashboard
is
similar
to
the
following
one:
http://console_server_name:9080/TbsmExecutiveView/ExecutiveViewHTMLServlet
v
If
the
HTTP
server
port
is
something
other
than
9080,
the
address
is
similar
to
the
following
one
(port_number
is
the
server
port
on
the
computer
where
the
console
server
is
running):
http://console_server_name:port_number/TbsmExecutiveView/ExecutiveViewHTMLServlet
Signing
On
to
the
Dashboard
After
you
access
one
of
the
dashboards,
a
window
displays
fields
for
you
to
type
your
user
ID
and
password.
1.
Type
your
user
ID.
2.
Type
your
password.
3.
Click
OK.
Working
with
the
Flash-based
Version
of
the
Dashboard
Figure
18
shows
an
example
of
the
Flash-based
version
of
an
executive
dashboard.
Components
that
are
shown
in
Figure
18
are
explained
in
Table
12.
Table
12.
Executive
dashboard
components
Component
Description
Title
bar
Displays
your
user
ID
and
the
version
of
the
executive
dashboard
that
you
are
using.
The
upper
right
corner
of
the
window
contains
the
Minimize
and
Close
buttons.
Figure
18.
Example
of
Flash-based
version
of
an
executive
dashboard
40
IBM
Tivoli
Business
Systems
Manager:
Introducing
the
Consoles

Table
12.
Executive
dashboard
components
(continued)
Component
Description
Tool
bar
Contains
the
icons
for
functions
such
as
refresh
and
sign
off
.
If
you
are
using
Microsoft
Internet
Explorer,
copy
and
are
also
available.
Services
area
The
main
area
of
the
dashboard.
This
is
where
your
services
are
displayed.
Each
service
is
represented
by
an
object
that
looks
similar
to
this:
Hold
the
mouse
over
the
button
on
the
upper
left
side
of
the
service
to
display
a
menu
for
the
service.
Service
menu
The
options
on
the
Service
menu
on
the
IT
executive
dashboard
are
described
in
“The
Dashboard
Context
Menu”
on
page
45.
The
service
menu
on
the
executive
dashboard
has
these
options:
Go
to
impact
Displays
information
pertaining
to
the
availability
state
of
the
service.
Information
displays
even
if
the
service
is
green.
Secondary
impact
information
is
displayed
if
the
dashboard
service
is
configured
to
support
display
of
this
information.
User
Preferences
Opens
the
User
Preferences
notebook.
You
can
use
this
notebook
to
change
your
settings
for
auditory
and
visual
indicators
and
also
how
status
icons
are
displayed.
For
information
on
the
User
Preferences
notebook,
see
“User
Preferences”
on
page
44.
About
Displays
the
copyright
information
page.
Service
Name
The
name
of
the
service
is
displayed
above
each
executive
dashboard.
Secondary
impact
indicator
In
Figure
18
on
page
40,
this
icon
is
located
in
the
lower
center
of
the
North
East
service
and
it
looks
similar
to
this:
.
(The
secondary
impact
indicator
icon
in
the
lower
center
of
the
North
East
service
indicates
trend
issues
with
this
service
in
the
service
level
agreement.)
Click
this
icon
on
a
service
where
it
is
used
to
view
secondary
impact
information,
such
as
violations
and
trends
in
IBM
Tivoli
Service
Level
Advisor
(ITSLA).
Currently
ITSLA
is
supported
for
secondary
impact
information.
Secondary
impact
information
is
information
that
could
impact
the
resource
but
does
not
play
a
role
in
the
availability
state
or
impact.
Secondary
impact
information
can
be
requested
by
the
executive
and
configured
by
the
system
administrator,
but
showing
this
information
is
optional.
If
you
place
your
cursor
over
the
secondary
impact
indicator
icon
on
a
service,
you
see
summary
information
such
as
service
name
and
availability
status.
The
information
also
indicates
how
many
violations
or
trends
there
are,
if
any,
and
when
the
last
one
occurred.
If
trends
or
violations
exist,
there
is
a
link
to
the
details
of
this
information.
Secondary
impact
indicators
are
described
in
Table
13
on
page
42.
Chapter
4.
Introducing
the
Executive
Dashboard
41

Table
12.
Executive
dashboard
components
(continued)
Component
Description
Icon
bar
Contains
icons
for
navigating,
viewing
status,
and
getting
information.
You
can
navigate
to
any
of
your
executive
dashboard
services
or
to
your
dashboard
home
page
by
selecting
the
appropriate
icon.
You
can
also
get
status
information
for
your
dashboard
services.
Icons
on
the
icon
bar
in
Figure
18
on
page
40
are
described
in
Table
14.
Table
13
describes
secondary
impact
icons
that
could
be
displayed
on
services
when
administrator
preferences
are
set
to
display
these
icons.
Table
13.
Secondary
Impact
Icons
Icon
Description
Indicates
unviewed
violation;
no
trends.
(Red
box
with
no
arrow)
Indicates
unviewed
violation;
viewed
trends.
(Red
box
with
blue
arrow)
Indicates
unviewed
violation;
unviewed
trends.
(Red
box
with
yellow
arrow)
Indicates
no
unviewed
violations;
no
trends.
(White
box
with
no
arrow)
Indicates
no
unviewed
violations;
viewed
trends.
(White
box
with
blue
arrow)
Indicates
no
unviewed
violations;
unviewed
trends.
(White
box
with
yellow
arrow)
Icon
Bar
The
icon
bar
that
is
shown
in
Figure
18
on
page
40
contains
these
icons:
Table
14.
Icons
on
the
icon
bar
Icon
Description
Home
icon
takes
you
to
your
home
page
on
the
dashboard.
Red
status
icon
indicates
that
the
service
is
experiencing
critical
issues.
This
icon
is
called
a
mini
service
icon.
See
“Mini
Service
Icons”
on
page
43
for
additional
information
about
mini
service
icons.
Green
status
icon
indicates
that
the
service
is
functioning
as
expected.
This
icon
is
called
a
mini
service
icon.
See
“Mini
Service
Icons”
on
page
43
for
additional
information
about
mini
service
icons.
Although
a
Yellow
status
icon
is
not
shown
in
Figure
18
on
page
40,
this
icon
indicates
that
a
service
is
experiencing
issues
but
the
issues
are
not
critical.
All
Impacts
icon
displays
the
current
business
impact
information
for
all
services
on
the
executive
dashboard,
or
all
problems
for
the
IT
executive
dashboard.
History
icon
displays
the
amount
of
time
the
service
was
in
Red
or
Yellow
status
over
the
last
24
hours.
Time
your
dashboard
services
were
last
refreshed.
42
IBM
Tivoli
Business
Systems
Manager:
Introducing
the
Consoles

If
a
tooltip
(fly-over
information)
remains
displayed
after
you
move
the
mouse
away
from
an
icon,
you
can
remove
the
tooltip
by
moving
your
mouse
anywhere
on
your
dashboard.
Otherwise,
the
tooltip
is
removed
the
next
time
the
dashboard
refreshes.
Mini
Service
Icons
Mini
service
icons
are
located
on
the
Icon
bar
to
indicate
the
status
of
each
service
that
is
on
the
executive
dashboard.
The
mini
service
icons
are
arranged
in
the
same
order
as
the
executive
dashboard
services,
and
they
provide
a
quick
view
of
the
status
of
the
services.
Clicking
one
of
the
mini
service
icons
displays
the
status
for
that
executive
dashboard
service.
Placing
your
cursor
over
a
mini
service
icon
displays
summary
information
about
the
service
that
it
represents.
This
information
provides
the
service
name,
availability
status,
and
when
the
last
impact
occurred.
The
information
is
for
availability
status
and
does
not
display
secondary
impact
information.
The
Service
Status
Details
View
To
view
the
current
impact
on
a
service,
do
one
of
the
following.
v
Click
the
center
of
any
executive
dashboard
service
in
the
Services
area.
v
Click
a
Mini
Service
Status/Navigation
icon
on
the
bottom
of
the
executive
dashboard.
v
From
a
services
menu,
click:
–
Go
to
impact
if
you
are
an
executive
user
–
Go
to
problem
if
you
are
an
IT
executive
user
Information
for
All
Users
Service
Name
of
the
service
Impact
statement
Displays
the
role
of
the
service
and
the
impact
(red
or
yellow)
Time
of
first
impact
Date
and
time
of
the
first
impact
on
the
service
Time
of
last
impact
Date
and
time
of
last
impact
on
the
service
Problem
ticket
information
Problem
ticket
number
and
date
and
time
If
more
than
one
problem
ticket
is
open,
a
statement
that
multiple
tickets
have
been
opened
is
displayed
instead
of
the
date
and
time
information.
Information
for
IT
Executive
Users
Problem
Name
of
resource.
If
the
resource
is
configured
as
a
service,
the
role
and
impact
of
that
service
is
displayed.
Path
Location
of
the
resource
in
the
business
system
tree
on
the
console
Resource
state
Current
state
of
the
resource
Notes
Date
and
time
the
note
was
created
and
the
subject
of
the
note.
Chapter
4.
Introducing
the
Executive
Dashboard
43
Only
those
ownership
notes
that
are
associated
with
resources
and
events
that
directly
contribute
to
the
non-green
status
of
the
service
are
displayed.
Ownership
notes
that
are
associated
with
the
children
of
a
percentage
based
threshold
(PBT)
folder
are
not
displayed
because
they
do
not
directly
contribute
to
the
status
color
of
a
service.
For
information
about
PBTs,
see
the
percentage
based
thresholds
section
in
the
IBM
Tivoli
Business
Systems
Manager
Administrator’s
Guide.
If
configured
in
Administrator
Preferences
in
the
console,
problem
ticket
numbers,
ownership
note
information,
and
secondary
impact
information
is
displayed
in
the
Details
view.
Display
of
problem
ticket,
ownership
note,
resource
state,
and
secondary
impact
information
is
dependent
on
relevant
information
being
available.
The
time
that
is
displayed
for
an
impact
is
your
local
time.
The
Service
Status
Details
view
replaces
the
home
page
view.
Click
the
Home
icon
to
return
to
the
dashboard
home
page.
User
Preferences
You
can
change
the
order
of
the
services
on
your
dashboard
by
dragging
and
dropping
the
services.
To
change
the
order
of
a
service,
do
the
following
steps:
1.
Click
and
hold
the
mouse
button
in
the
gray
area
that
is
located
on
the
left
side
of
the
service.
The
color
of
this
area
changes
from
gray
to
blue
while
you
are
doing
this.
2.
Drag
the
service
to
the
position
you
want
and
drop
it
on
the
service
that
is
located
where
you
want
the
service
you
are
dragging
to
be.
Dragging
and
dropping
does
not
work
for
sub-services,
nor
does
it
work
in
the
HTML
version
of
the
dashboard.
To
change
user
preferences,
click
User
Preferences
on
the
service
menu
to
open
the
Preferences
notebook.
This
notebook
is
displayed
in
the
Services
area.
After
making
changes
to
your
settings,
click
Save
or
Discard
to
return
to
the
Services
area.
Use
the
following
pages
in
the
notebook
to
change
preferences.
Visual
Indicator
You
can
change
the
following
preferences:
New
Impacts
When
a
new
impact
or
problem
is
received,
this
option
allows
you
to
choose
if
the
executive
dashboard
service
flashes
and
for
how
long.
You
can
specify
if
dashboard
services
on
the
home
page
that
have
a
new
impact
or
problem
should:
v
Never
flash
v
Flash
until
you
view
the
dashboard
service
v
Flash
the
number
of
times
you
specify
(whether
or
not
you
have
viewed
the
dashboard
service)
Refresh
rate
Use
to
adjust
the
frequency
that
your
browser
window
refreshes
for
incoming
status.
You
can
set
the
refresh
time
from
1
to
120
44
IBM
Tivoli
Business
Systems
Manager:
Introducing
the
Consoles

minutes,
but
you
cannot
set
the
refresh
time
lower
than
what
is
specified
in
administrator
preferences
in
the
console.
The
default
value
is
10
minutes
for
executives
and
5
minutes
for
IT
executives.
Auditory
Indicator
Use
to
choose
the
type
of
sound,
if
any,
you
hear
when
a
status
or
secondary
impact
indicator
changes
from
green
to
yellow
or
red.
A
change
in
status
includes:
v
A
yellow
or
red
alert
v
A
new
yellow
or
red
alert
(This
occurs
if
you
do
not
click
the
first
alert
before
a
second
one
occurs.)
v
A
change
in
secondary
impact
information
status
Only
a
single
sound
is
heard
no
matter
how
many
status
changes
occur
with
a
refresh.
Show
Status
icons
Use
to
display
an
alternate
set
of
status
icons.
The
Dashboard
Context
Menu
The
context
menu
presented
to
an
executive
user
and
to
an
IT
executive
user
are
different
because
these
users
have
different
purposes
for
using
the
dashboard.
Executive
users
have
the
following
items
that
are
described
in
Table
12
on
page
40
on
their
context
menu:
v
Go
to
impact
v
User
Preferences
v
About
IT
executives
have
the
following
items
on
services
menus:
Go
to
problem
Shows
information
pertaining
to
the
availability
state
of
the
executive
dashboard
service.
This
displays
even
if
the
service
is
green.
Secondary
impact
information
is
shown
if
the
executive
dashboard
service
is
configured
to
display
this
information.
The
IT
user
selecting
Go
to
problem
sees
more
detail
than
the
executive
who
selects
Go
to
impact.
Open
Service
This
option
is
available
if
services
that
are
direct
children
of
the
service
are
contained
within
the
dashboard
service.
Opens
services
that
are
direct
children
of
the
service.
User
Preferences
Displays
the
User
Preferences
notebook.
You
can
use
this
notebook
to
change
settings
for
auditory
and
visual
indicators
and
also
change
how
status
icons
are
displayed.
For
information
about
the
User
Preferences
notebook,
see
“User
Preferences”
on
page
44.
About
Displays
the
copyright
information
page.
Switch
to
another
user’s
view
Use
to
display
dashboard
services
that
are
defined
for
another
user
(for
example,
the
executive
user).
Enables
IT
users
to
switch
their
dashboard
home
page
to
display
the
dashboard
services
that
are
defined
for
another
user.
This
feature
is
useful
if,
for
example,
the
executive
sees
a
consistent
problem
and
calls
the
IT
executive
to
find
out
what
the
problem
is
or
when
the
issue
might
be
resolved.
The
authorized
IT
user
can
then
view
Chapter
4.
Introducing
the
Executive
Dashboard
45

the
executive
dashboard
services
as
the
executive
sees
them
to
get
additional
information
about
the
issue.
Switch
back
When
viewing
the
executive
dashboard
services
of
another
user,
use
this
option
to
quickly
switch
back
to
your
own
view.
Like
the
Switch
to
another
user’s
view
option,
this
is
only
available
to
the
IT
user,
not
to
the
executive
user.
Working
with
the
HTML
Version
of
the
Dashboard
The
HTML
version
of
the
executive
dashboard
is
a
table
version
of
the
dashboard
and
it
accommodates
dashboards
that
have
any
number
of
services.
Functions
that
are
available
in
the
Flash-based
dashboard
are
also
available
in
the
HTML
dashboard.
In
the
HTML
dashboard,
most
actions
are
accessed
through
the
table
menu.
The
HTML
version
offers
the
following
capabilities
for
accessibility:
screen
reader
Because
it
uses
basic
HTML,
this
version
supports
the
use
of
a
screen
reader
for
evaluating
the
contents
of
the
window.
Also,
you
can
disable
the
automatic
refresh
function
in
the
HTML
executive
dashboard
by
setting
the
refresh
rate
to
zero
(0)
on
the
preferences
page.
Doing
this
ensures
that
unexpected
refreshes
do
not
interrupt
reading
the
current
screen.
keyboard
usage
(instead
of
a
mouse)
You
can
operate
all
features
of
the
executive
dashboard
by
using
the
keyboard
instead
of
the
mouse.
Use
the
tab
keys
to
navigate
from
field
to
field
and
use
the
arrow
keys
to
move
within
fields.
colors
The
HTML
interface
does
not
use
color
as
the
sole
visual
cue
for
status.
There
is
either
an
image
or
a
word
accompanying
colors
used
in
the
interface.
You
can
set
your
monitor
to
high
contrast
mode
and
still
see
and
understand
the
images.
magnification
tools
The
HTML
version
of
the
dashboard
supports
using
magnification
tools
in
the
interface.
Figure
19
on
page
47
shows
an
example
of
an
HTML
version
of
the
executive
dashboard.
46
IBM
Tivoli
Business
Systems
Manager:
Introducing
the
Consoles

The
only
preference
you
can
set
in
the
HTML
version
of
the
dashboard
is
the
refresh
rate.
The
icon
bar
uses
the
same
icons
as
the
Flash-based
dashboard.
See
Table
14
on
page
42
for
a
description
of
these
icons.
One
difference
is
that
the
sign
off
icon
is
located
on
the
icon
bar
of
the
HTML
version
of
the
dashboard.
You
can
click
a
mini
service
icon
on
the
icon
bar
to
access
details
about
the
service.
The
mini
service
icons
are
not
necessarily
displayed
in
the
same
order
that
the
services
are
displayed
in
the
table.
Figure
19.
Example
of
an
HTML
version
of
an
executive
dashboard
Chapter
4.
Introducing
the
Executive
Dashboard
47

48
IBM
Tivoli
Business
Systems
Manager:
Introducing
the
Consoles

Chapter
5.
Introducing
the
Reporting
System
You
can
use
the
console
reporting
system
to
generate
reports
in
real
time
from
historical
availability
data
that
the
console
collects
from
the
system.
The
console
uses
a
Web
browser
to
display
these
reports.
To
use
the
reporting
system,
your
console
preferences
must
indicate
that
you
are
either
using
the
default
Web
browser
or
you
are
using
a
different
Web
browser
and
have
included
its
fully-qualified
file
name.
You
can
access
the
reporting
system
through
a
Web
browser
at
the
following
Web
address:
http://history_server_name/asi/menu/
v
In
the
Web
address,
history_server_name
is
the
name
of
your
history
server.
You
can
also
access
the
reporting
system
directly
from
the
console.
To
access
the
reporting
system
from
the
console
do
one
of
the
following:
v
Select
a
resource
and
then
click
Console
–>
Actions
–>
Open
–>
Reporting
System.
v
Right-click
a
resource
and
then
click
Open
–>
Reporting
System.
If
you
are
prompted
for
your
user
name
and
password,
type
the
requested
information.
When
you
open
the
reporting
system
directly
from
the
console,
the
reporting
system
opens
either
the
Business
System
Events
Report
Selection
page
or
the
Physical
Resource
Events
Selection
page.
Figure
21
on
page
51
shows
an
example
of
the
Business
Systems
Events
Report
Selection
page.
The
Business
System
Events
report,
which
is
described
in
Table
17
on
page
53,
is
the
report
that
you
have
access
to
when
you
open
the
reporting
system
directly
from
the
console.
You
do
not
have
access
to
the
entire
reporting
system
from
the
console.
Reporting
System
Interface
When
you
open
the
reporting
system
directly
from
a
Web
browser
you
have
access
to
the
reporting
system
interface,
which
looks
similar
to
the
window
in
Figure
20
on
page
50.
©
Copyright
IBM
Corp.
2004
49

The
interface
consists
of
the
Report
Template
Index
along
the
left
column
with
reporting
system
information
on
the
right.
This
information
includes
the
name
of
the
default
data
server
and
the
current
date
and
time.
The
Report
Template
index
lists
all
available
report
templates.
Some
reports
are
grouped
into
submenus
within
the
index.
If
the
selected
template
requires
selection
of
a
resource
from
the
All
Resources
view,
the
appropriate
tree
view
is
displayed.
To
select
the
resource
for
reporting,
click
the
link
next
to
the
appropriate
resource.
After
making
your
selections
from
the
various
headings,
click
Submit
to
generate
and
display
the
report
in
the
browser.
The
Report
Template
index
contains
the
following
links:
Historical
Reporting
Contains
the
report
templates
that
are
in
the
database
Menu
Administration
Create,
delete,
and
modify
elements
for
the
organization.
(Administrators
Only)
Export
Report
Export
reports
generated
in
the
reporting
system
to
various
file
formats
Console
administrators
can
edit
the
index
to
reflect
additional
contents
and
reports
as
well
as
links
to
the
corporate
Intranet
or
Internet
site.
Figure
20.
IBM
Tivoli
Business
Systems
Manager
Reporting
System
50
IBM
Tivoli
Business
Systems
Manager:
Introducing
the
Consoles

Report
Forms
within
the
Reporting
System
The
reporting
system
provides
you
with
reports
so
you
can
have
the
data
you
need
to
analyze,
anticipate,
and
avoid
any
future
problem
scenarios.
You
are
required
to
specify
selection
criteria
for
the
report
you
are
requesting.
All
reports
in
the
system
require
that
you
specify
a
time
span.
This
requirement
exists
because
of
the
large
number
of
records
that
are
contained
in
the
database,
possibly
covering
a
year
or
more
of
historical
data.
By
issuing
a
specific
time
span
you
ensure
that
a
reasonable
number
of
reports
are
returned,
that
waiting
time
is
curtailed,
and
that
network
traffic
is
kept
to
a
minimum.
Figure
21
shows
an
example
of
a
Report
Selection
page.
Report
Selection
Criteria
After
you
select
the
report
type
from
the
Report
Template
index,
select
the
filtering
criteria
from
the
report
selection
page.
Drop-down
lists
are
provided
for
some
of
the
selections
when
multiple
choices
are
available.
When
you
complete
all
the
information,
click
Submit
to
generate
the
report.
Figure
21.
Report
Selection
page
Chapter
5.
Introducing
the
Reporting
System
51

The
Report
Templates
This
section
contains
information
about
the
report
templates.
The
following
tables
describe
the
selection
criteria
used
for
report
generation.
Report
templates
that
do
not
contain
selection
criteria
tables
have
predefined
selection
criteria
where
the
report
is
generated
when
you
select
the
template
from
the
Report
Template
Index.
Business
System
Availability
Report
The
Business
System
Availability
Report
provides
the
alert
state
change
information
for
the
business
system.
Maintenance
and
owned
states
are
also
used
for
the
resources
in
maintenance
mode
and
those
having
ownership.
This
report
provides
the
list
for
the
report
starting
business
system
and
its
children.
The
fields
for
the
Business
System
Availability
Report
are
described
in
Table
15.
Table
15.
Fields
in
the
Business
System
Availability
Report
Field
Selection
Criteria
Description
Multiple
Select
Optional
Business
System
Resource
The
business
system
resource
on
which
to
report.
No
No
Enter
Beginning
Date/Time
The
Beginning
date
and
time
for
the
date
and
time
range
of
this
report.
The
default
value
is
7
days
earlier
than
the
current
date
and
time.
Yes
Enter
Ending
Date/Time
The
ending
date
and
time
for
the
date
and
time
range
of
this
report.
The
default
value
is
the
current
date
and
time.
Yes
Alert
State
The
types
of
the
alert
state
used
for
this
report.
Yes
No
Business
System
Event
Count
Report
Use
the
Business
System
Events
Count
report
to
select
any
defined
Business
System
view
and
create
a
report
that
contains
event
count
statistics
that
can
be
sorted
and
grouped
in
many
different
ways.
The
selection
criteria
for
the
report
is
shown
in
Table
16.
Table
16.
Business
System
Event
Count
report
selection
criteria
Field
Selection
Criteria
Description
Multiple
Select
Business
System
Resource
The
Business
System
Resource
that
is
selected
from
the
Business
System
container
No
Alert
State
Alert
state
of
the
selected
resource,
Red,
Yellow,
or
Green
Yes
Priority
The
priority
attribute
of
the
resource
Yes
Time
Period
Option
Various
quick
click
time
periods
such
as
Last
15
minutes,
Yesterday,
and
Today.
Making
a
selecting
in
the
Time
Period
option
creates
the
Beginning
and
Ending
Time/Date
range
for
the
report.
Beginning
Date/Time
The
Beginning
date
and
time
for
the
date/time
range
of
this
report
Ending
Date/Time
The
Ending
date
and
time
for
the
date/time
range
of
this
report
52
IBM
Tivoli
Business
Systems
Manager:
Introducing
the
Consoles

Table
16.
Business
System
Event
Count
report
selection
criteria
(continued)
Field
Selection
Criteria
Description
Multiple
Select
Event
Type
Messages,
Exceptions,
Child
Events
Yes
Summary
Fields
There
are
several
options
provided
for
grouping
the
resulting
counts.
Sort
By
The
resulting
report
can
be
sorted
either
by
the
Summary
Fields,
or
by
descending
event
frequency
(ordered
by
the
summary
field
groups,
which
had
the
highest
event
counts).
Business
System
Events
Report
Use
the
Business
System
Events
report
to
select
any
defined
Business
System
View
and
create
a
report
that
contains
Messages
and
Exceptions
for
any
or
all
of
the
resources
within
that
Business
System
View.
The
selection
criteria
for
the
report
is
as
shown
in
Table
17.
Table
17.
Business
System
Events
report
selection
criteria
Field
Selection
Criteria
Description
Multiple
Select
Business
System
Resource
The
Business
System
Resource
that
is
selected
from
the
Business
System
container
No
Alert
State
Alert
state
of
the
selected
resource,
Red,
Yellow,
or
Green
Yes
Priority
The
priority
attribute
of
the
resource
Yes
Time
Period
Option
Various
quick
click
time
periods
such
as
Last
15
minutes,
Yesterday,
and
Today.
Making
a
selection
in
the
Time
Period
option
creates
the
Beginning
and
Ending
Time/Date
range
for
the
report.
Beginning
Date/Time
The
Beginning
date
and
time
for
the
date/time
range
of
this
report
Ending
Date/Time
The
Ending
date
and
time
for
the
date/time
range
of
this
report
Event
Type
Messages,
Exceptions,
Child
Event
Yes
Show
Machine
/System
When
checked,
the
report
shows
the
appropriate
higher
level
resource
(OS,
System
Name,
etc.)
to
which
the
resource
belongs.
Order
By
Order
the
report
by
specific
fields
Message
Name
Search
Pattern
Allows
entry
of
a
standard
SQL
pattern
including
wildcards
for
searching
the
message
name.
All
searches
are
case
sensitive.
Detail
Search
Pattern
Allows
entry
of
a
standard
SQL
pattern
including
wildcards
for
searching
the
message
detail.
All
searches
are
case
sensitive.
Exclude
Child
Resources
If
this
is
checked,
the
report
does
not
include
events
that
occurred
on
resources
that
are
children
of
the
currently
selected
resources.
Chapter
5.
Introducing
the
Reporting
System
53

Business
System
Open
Event
Ownership
Report
The
Business
System
Open
Event
Ownership
report
uses
an
HTML
tree
to
prompt
for
a
resource
from
the
Business
System
container.
The
resulting
report
shows
all
open
events
against
resources
on
or
below
that
point
in
the
structure
for
which
ownership
is
taken,
but
not
closed.
The
report
shows
who
took
ownership,
when
ownership
was
taken,
notes,
when
the
event
occurred,
and
the
original
text
of
the
event.
The
selection
criteria
for
the
report
is
as
shown
in
Table
18.
Table
18.
Business
System
Open
Event
Ownership
report
selection
criteria
Field
Selection
Criteria
Description
Order
By
The
sort
order
for
the
report.
Business
System
Resource
Summary
Report
The
Business
System
Resource
Summary
report
shows
a
summary
of
all
Business
System
container
resources
that
belong
to
a
specific
Business
System.
You
can
choose
a
specific
Business
System
from
an
HTML
view
of
the
Business
System
container.
Business
System
Resource
Tree
Report
The
Business
System
Resource
Tree
report
is
identical
to
the
Physical
Resource
Tree
report
previously
discussed,
except
that
it
is
for
the
Business
System
container.
You
can
choose
a
specific
resource
from
an
HTML
view
of
the
Business
System
container.
The
report
prints
the
structure
beginning
at
that
point.
CICS
Start/Stop
Time
Analysis
by
Business
System
Report
The
CICS
Start/Stop
Time
Analysis
by
Business
System
report
displays
the
Start
and
Stop
times
for
all
of
the
CICS
Regions
for
a
Business
System
view.
This
provides
an
analysis
of
actual
region
start
and
stop
times
which
can
assist
in
setting
up
schedule
violation
tolerances.
Current
MVS
Messages/Exceptions
Report
Use
the
Current
MVS™
Messages/Exceptions
report
template
to
select
criteria
for
creating
a
report
that
contains
all
of
the
Messages
and
Exceptions
for
any
class
contained
within
an
instance
of
an
MVS
operating
system.
This
can
include
multiple
operating
system
resources.
The
selection
criteria
for
the
report
is
as
shown
in
Table
19.
Table
19.
Current
MVS
Messages/Exceptions
report
selection
criteria
Field
Selection
Criteria
Description
Multiple
Select
OS
The
operating
system
that
the
resources
run
on
Yes
Resource
Type
The
class
of
a
resource,
for
example
CICS,
Batch,
STC
Yes
Resource
Name
The
name
of
a
specific
resource
Can
use
standard
SQL
patterns
with
wildcards.
Alert
State
Alert
state
of
the
selected
resource,
Red,
Yellow,
or
Green
Yes
Priority
The
priority
attribute
of
the
resource
Yes
54
IBM
Tivoli
Business
Systems
Manager:
Introducing
the
Consoles

Table
19.
Current
MVS
Messages/Exceptions
report
selection
criteria
(continued)
Field
Selection
Criteria
Description
Multiple
Select
Time
Period
Option
Various
quick
click
time
periods
such
as
Last
15
minutes,
Yesterday,
and
Today.
Making
a
selection
in
the
Time
Period
option
creates
the
Beginning
and
Ending
Time/Date
range
for
the
report.
Enter
Beginning
Date/Time
The
Beginning
date
and
time
for
the
date/time
range
of
this
report
Enter
Ending
Date/Time
The
Ending
date
and
time
for
the
date/time
range
of
this
report
Event
Type
Console
Messages,
Performance
Monitor
exceptions,
or
both
No.
However,
there
is
an
All
selection.
Detail
Search
Pattern
Allows
entry
of
a
standard
SQL
pattern
including
wildcards
for
searching
the
message
detail.
All
searches
are
case
sensitive.
Business
System
Alert
State
Report
Use
the
Business
System
Alert
State
Report
to
create
a
report
that
displays
all
of
the
resources
with
selected
alert
states
within
the
selected
Business
System.
You
can
select
multiple
alert
states.
The
selection
criteria
for
the
report
is
as
shown
in
Table
20.
Table
20.
Business
System
Alert
State
Report
Field
Selection
Criteria
Description
Multiple
Select
Alert
state
The
types
of
the
alert
state
used
for
this
report
Yes
Global
Business
System
Alert
State
Report
The
Global
Business
System
Alert
State
Report
template
generates
a
report
that
provides
all
of
the
resources
defined
in
the
Enterprise
with
a
specific
Alert
State.
The
only
selection
criteria
Alert
States
are
Red,
Yellow,
or
Green.
Multiple
selections
are
available.
Because
running
this
report
involves
all
of
the
resources
defined
to
the
database,
this
report
is
extremely
costly
to
run,
and
should
be
generated
only
during
emergencies
or
off-peak
periods.
MVS
Message/Exception
Report
The
MVS
Message/Exception
report
provides
a
list
of
console
messages
and
performance
monitor
exceptions
for
console
classes
that
run
within
an
MVS
operating
system
for
a
given
date
range.
The
selection
criteria
for
the
report
is
shown
in
Table
21
on
page
56.
Chapter
5.
Introducing
the
Reporting
System
55

Table
21.
MVS
Message
/
Exception
report
selection
criteria
Field
Selection
Criteria
Description
Multiple
Select
Complex
The
Complex
the
resources
reside
within
No.
However,
there
is
an
All
selection.
OS
The
operating
system
that
the
resources
run
on
No.
However,
there
is
an
All
selection.
Resource
Type
The
class
of
a
resource,
for
example,
CICS,
Batch,
STC,
and
so
on.
No
Resource
Name
The
name
of
a
specific
resource
This
can
use
standard
SQL
wildcard
patterns
to
match
multiple
resource
names.
Alert
State
Alert
state
of
the
selected
resource,
Red,
Yellow,
or
Green
No.
However,
there
is
an
All
selection.
Priority
The
priority
attribute
of
the
resource
No.
However,
there
is
an
All
selection.
Time
Period
Option
Various
quick
click
time
periods
such
as
Last
15
minutes,
Yesterday,
and
Today.
Making
a
selection
in
the
Time
Period
option
creates
the
Beginning
and
Ending
Time/Date
range
for
the
report.
Beginning
Date/Time
The
Beginning
date
and
time
for
the
date/time
range
of
this
report.
Ending
Date/Time
The
Ending
date
and
time
for
the
date/time
range
of
this
report
Event
Type
Console
Messages,
Performance
Monitor
exceptions,
or
both
No.
However,
there
is
an
All
selection.
Detail
Search
Pattern
Allows
entry
of
a
standard
SQL
pattern
including
wildcards
for
searching
the
message
detail.
All
searches
are
case
sensitive.
New
Resources
Report
The
New
Resources
report
shows
all
resources
that
were
added
to
the
All
Resources
view
on
or
after
a
specified
date.
The
report
shows
all
new
resources
on
or
below
that
point
in
the
All
Resources
view.
The
selection
criteria
is
as
shown
in
Table
22.
Table
22.
New
resources
report
selection
criteria
Field
Selection
Criteria
Description
Resources
Created
On
or
After
The
starting
cutoff
date
for
the
report
Physical
Resource
Event
Count
Report
Select
any
resource
in
the
All
Resources
view
and
create
a
report
that
contains
event
count
statistics
that
can
be
sorted
and
grouped
in
many
different
ways.
The
selection
criteria
for
the
report
is
shown
in
Table
23
on
page
57.
56
IBM
Tivoli
Business
Systems
Manager:
Introducing
the
Consoles

Table
23.
Physical
Resource
Event
Count
report
selection
criteria
Field
Selection
Criteria
Description
Multiple
Select
Physical
Resource
The
physical
resource
that
is
selected
from
the
Business
System
container
No
Include
Children
/
This
Resource
Only
This
determines
whether
events
for
the
selected
resource
children
are
shown.
Alert
State
Alert
state
of
the
selected
resource,
Red,
Yellow,
or
Green
Yes
Priority
The
priority
attribute
of
the
resource
Yes
Time
Period
Option
Various
quick
click
time
periods
such
as
Last
15
minutes,
Yesterday,
and
Today.
Making
a
selection
in
the
Time
Period
option
creates
the
Beginning
and
Ending
Time/Date
range
for
the
report.
Beginning
Date/Time
The
Beginning
date
and
time
for
the
date/time
range
of
this
report
Ending
Date/Time
The
Ending
date
and
time
for
the
date/time
range
of
this
report
Event
Type
Messages,
Exceptions,
Child
Events
Yes
Summary
Fields
There
are
several
options
provided
for
grouping
the
resulting
counts.
Sort
By
The
resulting
report
can
be
sorted
either
by
the
Summary
Fields
or
by
descending
event
frequency
(ordered
by
the
summary
field
groups,
which
had
the
highest
event
counts).
Physical
Resource
Events
Report
Select
any
resource
from
the
All
Resources
view
and
create
a
report
that
contains
events
for
that
resource
and
for
all
of
its
child
resources.
The
selection
criteria
for
the
report
is
shown
in
Table
24.
Table
24.
Physical
Resource
Events
report
selection
criteria
Field
Selection
Criteria
Description
Multiple
Select
Physical
Resource
The
Physical
Resource
that
is
selected
from
the
Business
System
container
No
Include
Children
/
This
Resource
Only
This
determines
whether
events
for
the
selected
resource
children
are
shown.
Alert
State
Alert
state
of
the
selected
resource,
Red,
Yellow,
or
Green
Yes
Priority
The
priority
attribute
of
the
resource
Yes
Time
Period
Option
Various
quick
click
time
periods
such
as
Last
15
minutes,
Yesterday,
and
Today.
Making
a
selection
in
the
Time
Period
option
creates
the
Beginning
and
Ending
Time/Date
range
for
the
report.
Beginning
Date/Time
The
Beginning
date
and
time
for
the
date/time
range
of
this
report
Ending
Date/Time
The
Ending
date
and
time
for
the
date/time
range
of
this
report
Event
Type
Messages,
Exceptions,
Child
Events
Yes
Chapter
5.
Introducing
the
Reporting
System
57

Table
24.
Physical
Resource
Events
report
selection
criteria
(continued)
Field
Selection
Criteria
Description
Multiple
Select
Show
Machine/System
When
checked,
the
report
shows
the
appropriate
higher
level
resource
(OS,
System
Name,
etc.)
to
which
the
resource
belongs.
Order
By
Order
the
report
by
specific
fields
Message
Name
Search
Pattern
Allows
entry
of
a
standard
SQL
pattern
including
wildcards
for
searching
the
message
name.
All
searches
are
case
sensitive.
Detail
Search
Pattern
Allows
entry
of
a
standard
SQL
pattern
including
wildcards
for
searching
the
message
detail.
All
searches
are
case
sensitive.
Physical
Resource
Open
Event
Ownership
Report
The
Physical
Resource
Open
Event
Ownership
report
is
identical
to
the
Business
System
Open
Event
Ownership
report
except
that
it
is
run
for
resources
in
the
All
Resources
view.
Physical
Resource
Tree
Report
Use
the
Physical
Resource
Tree
report
to
view
the
entire
All
Resources
view
structure
in
an
indented
format.
An
HTML
tree
view
of
the
All
Resources
view
is
presented
so
you
can
select
a
specific
resource.
The
report
prints
the
structure
beginning
at
that
point.
Resource
Business
System
Impact
Report
Select
any
resource
from
the
All
Resources
view
and
generate
a
report
that
displays
all
of
the
Business
System
views
that
contain
the
selected
resource.
It
uses
the
same
navigational
tool
as
the
Business
System
Resource
Summary
report.
This
report
can
be
quite
useful
in
determining
the
Business
Impact
of
any
resource
within
the
enterprise.
Resource
Class
Events
Report
Select
a
specific
resource
class
and
display
all
of
the
events
for
a
given
date
that
have
affected
resources
of
this
class.
The
selection
criteria
for
the
report
is
as
shown
in
Table
25.
Table
25.
Resource
Class
Events
report
selection
criteria
Field
Selection
Criteria
Description
Multiple
Select
Resource
Type
The
class
of
a
resource,
for
example,
CICS,
Batch,
STC,
and
so
on.
No
Alert
State
Alert
state
of
the
selected
resource,
Red,
Yellow,
or
Green
No.
However,
there
is
an
All
selection.
Priority
The
priority
attribute
of
the
resource
No.
However,
there
is
an
All
selection.
Enter
Beginning
Date/Time
The
Beginning
date
and
time
for
the
date/time
range
of
this
report
Enter
Ending
Date/Time
The
Ending
date
and
time
for
the
date/time
range
of
this
report.
58
IBM
Tivoli
Business
Systems
Manager:
Introducing
the
Consoles

Table
25.
Resource
Class
Events
report
selection
criteria
(continued)
Field
Selection
Criteria
Description
Multiple
Select
Event
Type
Console
Messages,
Performance
Monitor
exceptions,
or
both
No.
However,
there
is
an
All
selection.
Detail
Search
Pattern
Allows
entry
of
a
standard
SQL
pattern
including
wildcards
for
searching
the
message
detail.
All
searches
are
case
sensitive.
Shift
Turnover
Report
The
Shift
Turnover
report
generates
a
list
of
all
owned,
unowned
or
both
owned
and
unowned
events
for
a
period
of
time.
This
time
period
begins
with
the
beginning
date
and
time
minus
the
shift
length
in
hours
and
ends
at
the
beginning
date
and
time.
The
fields
for
the
Shift
Turnover
Report
are
described
in
Table
26.
Table
26.
Fields
in
the
Shift
Turnover
Report
Field
Selection
Criteria
Description
Multiple
Select
Business
System
Resource
The
business
system
resource
that
is
selected
from
the
business
system
container
No
Enter
Beginning
Date/Time
The
Beginning
date
and
time
for
the
date
and
time
range
of
this
report.
The
default
value
is
the
current
date
and
time.
Shift
Length
The
length
of
the
shift
in
hours.
The
default
value
is
8.
Deleting
a
Menu
Item
To
remove
a
menu
item
from
the
Reporting
System,
do
the
following
steps:
1.
From
within
the
Reporting
System,
expand
the
Reporting
System
menu
by
clicking
the
plus
sign
(+)
next
to
its
name.
2.
Expand
the
Menu
Administration
menu
by
clicking
the
+
next
to
its
name.
3.
Expand
the
Remove
Menu
Item
menu
by
clicking
the
+
next
to
its
name.
4.
Click
Remove
Menu
Item.
5.
From
the
Menu
Item
To
Delete
page,
click
the
menu
item
to
delete
by
selecting
the
check
box
next
to
its
name.
6.
Click
Delete
Item.
A
confirmation
message
that
indicates
the
item
is
deleted
is
displayed.
7.
From
the
Menu
Administration
menu,
select
Rebuild
Menu.
8.
A
confirmation
message
is
displayed
that
warns
about
the
unavailability
of
the
menu
if
you
continue
.
9.
Click
Continue
to
rebuild
the
menu.
10.
A
message
indicating
that
the
menu
has
been
rebuilt
is
displayed.
11.
To
refresh
the
menu,
click
the
minus
sign
(-)
next
to
the
Reporting
System
tree
item,
which
is
located
at
the
very
top
of
the
menu
tree.
12.
Navigate
back
to
where
the
deleted
item
was.
It
should
no
longer
be
displayed.
If
it
is
still
there,
you
might
need
to
exit
your
browser
and
reconnect
to
the
Reporting
System.
Chapter
5.
Introducing
the
Reporting
System
59

Signing
Off
the
Reporting
System
To
end
a
reporting
session,
click
Sign
Off,
or
close
the
browser
window.
After
you
sign
off
a
reporting
session,
you
must
log
on
to
reenter
the
system.
For
example,
if
you
view
reports
on
a
Business
System
for
payroll,
which
is
classified
information,
you
would
sign
off
to
secure
the
report
data.
You
could
sign
on
again
to
reenter
the
reporting
system.
60
IBM
Tivoli
Business
Systems
Manager:
Introducing
the
Consoles

Appendix
A.
Topology
Views
This
appendix
provides
information
about
various
Topology
views.
The
console
provides
different
types
of
Topology
views:
General
Topology
View
Available
for
any
physical
or
business
system
resource.
Provides
the
same
information
as
the
Tree
view
or
HyperView,
but
the
Topology
view
is
an
alternative
way
to
display
and
manipulate
resources.
Business
System
View
Available
for
any
business
system
resource.
This
is
a
customized
view
that
shows
how
business
systems
relate
to
each
other.
Specialized
Views
Displays
specific
relationships
for
specific
classes
of
resources.
These
are
only
available
for
the
types
of
resources
to
which
they
apply.
Examples
of
specialized
views
are
CICS
Topology
views
and
IP
Topology
views.
General
Topology
View
The
General
Topology
view
is
available
for
all
managed
resources.
The
resource
for
which
the
view
is
requested
becomes
the
starting
point
for
the
view.
The
relationships
for
which
the
starting
resource
is
the
source
are
included
in
the
view,
along
with
the
resources
needed
to
complete
the
relationships.
This
typically
includes
all
of
the
child
resources
of
the
starting
resource.
After
the
initial
content
of
the
General
Topology
is
displayed,
a
resource
other
than
the
starting
resource
can
be
selected
and
a
More
Detail
request
can
be
issued.
General
Topology
information
for
the
resource
is
then
added
to
the
existing
Topology
view,
using
the
selected
resource
as
the
starting
point
for
the
details
database
request.
After
viewing,
the
details
can
be
undone
and
removed
from
the
view,
or
an
additional
resource
can
be
selected
and
its
details
added
to
the
view.
Thus
the
view
can
become
as
extensive
as
you
want
and
the
data
allows,
as
details
are
selectively
added
or
undone.
General
Topology
also
exists
for
business
systems,
and
the
child
business
system
resources
of
the
starting
resource
are
initially
displayed
in
the
view.
A
More
Detail
request
can
then
be
used
to
bring
in
additional
levels
of
descendent
business
system
resources.
Business
System
Topology
View
The
Business
System
Topology
view
is
intended
to
show
user-defined
links
between
business
system
resources
or
business
system
folders
contained
as
first
level
children
in
the
business
system.
If
there
are
no
children
for
the
selected
business
system,
and
the
selected
business
system
is
not
at
the
top
level
of
the
Business
Systems
tree,
then
the
view
consists
of
the
selected
business
system
and
its
sibling
business
systems.
The
links
are
intended
to
be
used
to
build
pictures
that
accurately
reflect
the
relationships
among
your
business
systems.
These
relationships
play
no
role
in
other
console
functions,
such
as
status
propagation.
The
Business
System
Topology
view
shows
links
that
are
defined
between
business
system
resources,
or
links
that
are
defined
between
physical
resources
from
which
©
Copyright
IBM
Corp.
2004
61

the
business
system
resources
are
created.
What
this
means
is
that
you
can
define
a
link
once
between
physical
resources,
for
example
Machine1
and
Machine2.
For
any
business
system
where
both
Machine1
and
Machine2
are
dragged
to
create
business
system
resources,
the
link
shows
in
the
Business
System
Topology
view
for
the
container
business
system.
Alternatively,
if
a
link
should
only
exist
when
Machine1
and
Machine2
are
dragged
to
a
particular
business
system,
then
a
unique
link
can
be
defined
between
the
business
system
resources
created
from
Machine1
and
Machine2
and
placed
in
the
particular
business
system.
A
link
defined
between
the
business
system
resource
instances
instead
of
the
physical
resources
is
displayed
only
in
the
business
system
topology
that
contains
the
linked
business
system
resource
instances.
If
no
relationships
are
present,
the
view
contains
a
collection
of
disconnected
business
system
resources,
business
system
folders,
and
business
system
folder
shortcuts.
This
same
algorithm
is
applied
when
gathering
links
between
business
system
folders.
Thus,
for
business
system
shortcut
folders,
reusable
links
can
be
defined
between
the
source
business
system
folders
or
the
links
can
be
defined
between
the
shortcut
folders
themselves,
depending
on
your
requirements.
Refer
to
the
tbsmconn.ksh
command
in
the
IBM
Tivoli
Business
Systems
Manager
Command
Reference
for
more
information
on
defining
links.
DB2
Topology
Views
DB2
Topology
views
are
available
for
all
DB2-related
resources.
HyperView
and
Business
Impact
View
only
show
hierarchical
relationships.
DB2
Topology
View
shows
both
hierarchical
and
non-hierarchical
DB2
relationships.
This
is
useful
for
troubleshooting
the
root
cause
of
DB2
problems,
particularly
for
problems
that
involve
communications
across
a
sysplex.
Do
these
steps
to
open
a
DB2
Topology
View:
1.
Right-click
a
resource.
2.
Click
Open
–>
Topology
Views
–>
DB2
Topology.
When
DB2
Topology
View
is
launched,
or
More
Detail
is
clicked
for
a
resource
that
is
already
shown
in
a
DB2
Topology
View,
the
following
is
displayed:
v
The
hierarchical
parent
resources
are
displayed
up
to
the
OS
and
related
sysplex
resource.
This
could
involve
a
different
OS
within
the
same
sysplex.
For
example,
a
DB2
Data
Sharing
Group
is
often
used
by
DB2
subsystems
that
run
on
a
different
OS
within
the
same
sysplex.
v
When
launched
against
OS
resources,
all
hierarchical
children
DB2
subsystems
and
their
child
DB2
Data
Sharing
Groups
are
displayed.
v
When
launched
against
DB2
subsystem
resources,
the
IMS
subsystems
that
have
DB2
EASF
connections,
and
CICS
regions
that
have
DB2
connections
are
displayed.
These
relationships
are
displayed
with
a
solid
line.
Clicking
More
Detail
against
this
relationship
line
displays
the
actual
IMS
DB2
ESAF
resource
or
CICS
Connection
resource.
62
IBM
Tivoli
Business
Systems
Manager:
Introducing
the
Consoles

CICS
Topology
Views
CICS
Topology
views
are
available
for
CICS
regions
and
CICS
to
CICS
connections,
as
well
as
higher
level
CICS
resources
that
contain
the
CICS
regions.
The
CICS
Topology
view
shows
relationships
between
CICS
regions,
as
defined
by
the
CICS
to
CICS
connection
resources
that
are
related
to
each
CICS
region.
Started
from
a
higher
level
container
resource,
the
view
shows
all
contained
CICS
regions
and
the
connections
among
them.
Started
from
a
specific
CICS
region,
the
view
shows
the
selected
region
and
all
directly
connected
regions.
For
each
of
these
views,
More
Detail
can
be
used
on
a
CICS
region
to
bring
in
other
connected
CICS
regions
that
are
not
already
in
the
view.
Started
from
a
CICS
to
CICS
connection
resource,
the
view
contains
the
related
CICS
to
CICS
connection
resource
and
the
CICS
regions
to
which
each
connection
resource
is
associated.
CICS
Topology
view
connections
are
displayed
as
solid
lines
between
two
CICS
regions.
You
can
request
More
Detail
from
one
of
these
connections
and
the
view
is
modified
to
hide
the
connection
and
replace
it
with
the
actual
CICS
to
CICS
connection
resources
that
the
connection
represents.
More
Detail
is
also
supported
on
a
CICS
region
to
show
other
connected
CICS
regions
that
are
not
already
included
in
the
view.
IMS
Topology
Views
IMS
Topology
views
are
available
for
all
IMS-related
resources,
DB2
subsystem
resources,
and
OS
resources.
HyperView
and
Business
Impact
view
show
hierarchical
relationships.
IMS
Topology
view
shows
both
hierarchical
and
non-hierarchical
IMS
relationships.
This
is
useful
for
troubleshooting
the
root
cause
of
IMS
problems,
particularly
for
problems
that
involve
communications
between
IMS
systems
in
a
sysplex.
Do
these
steps
to
open
an
IMS
Topology
View:
1.
Right-click
a
resource.
2.
Click
Open
–>
Topology
Views
–>
IMS
Topology.
When
an
IMS
Topology
view
is
launched
against
a
resource,
or
More
Detail
is
clicked
for
a
resource
that
is
already
shown
in
an
IMS
Topology
view,
the
following
is
displayed:
v
The
hierarchical
parent
resources
are
displayed
up
to
the
OS
and
related
sysplex
resource.
For
IMS
Connect
resources
and
IMS
FDBR
resources,
the
parents
might
involve
different
OS
within
the
same
sysplex.
v
The
related
OS
resources
within
the
same
sysplex.
This
is
useful
for
subsequent
More
Detail
navigation.
v
When
launched
against
OS
resources,
all
hierarchical
children
IMS
subsystems
and
DB2
subsystems
that
use
IMS
are
displayed.
v
When
launched
against
IMS
subsystems
and
OS
resources,
the
high
level
hierarchical
children
(not
low
level
children:
IMPG,
IMTX,
IMDA,
IMAR,
IMPA)
of
the
IMS
subsystem
are
displayed.
This
is
useful
for
subsequent
More
Detail
navigation,
for
example,
seeing
IMS
subsystems
that
are
communicating
by
way
of
CQS.
Appendix
A.
Topology
Views
63

v
When
launched
against
CQS
and
IRLM
resources,
the
related
CQS
xcf
group
and
IRLM
xcf
group
is
displayed.
Clicking
More
Detail
against
a
group
displays
the
related
CQS
and
IRLM
resources
that
communicate
using
this
XCF
group
name.
v
When
launched
against
IMS
Operation
Manager,
IMS
Resource
Manager,
IMS
Structured
Call
Interface,
CQS,
and
IMS
Connect
resources,
the
related
IMSPLEX
group
is
displayed.
Clicking
More
Detail
against
the
IMSPLEX
group
resource
shows
the
IMS
resources
that
communicate
using
this
XCF
group
name.
v
When
launched
against
DB2
subsystem
resources,
the
IMS
subsystem
that
have
DB2
EASF
connections
are
displayed.
This
relationship
is
shown
with
a
solid
line.
Clicking
More
Detail
against
this
relationship
line
displays
the
actual
IMS
DB2
ESAF
resource.
v
The
IMS
database
to
IMS
program
relationship
is
many-to-many.
Most
IMS
databases
are
related
to
less
than
50
IMS
programs,
but
some
IMS
databases
(such
as
a
database
containing
customer
details)
can
be
related
to
thousands
of
IMS
programs.
To
avoid
displaying
so
many
IMS
programs,
when
launched
against
such
an
IMS
database,
a
solid
line
is
displayed
directly
linking
the
IMS
database
with
the
IMS
subsystem.
To
see
the
related
IMS
programs,
click
More
Detail
against
the
solid
relationship
line.
IP
Topology
Views
This
section
describes
the
various
Topology
views
that
are
available
for
IP
resources.
IP
resources
of
interest
for
topology
views
include
IP
networks,
network
locations,
subnets,
segments,
routers,
and
interfaces.
The
following
IP
Topology
views
are
available:
v
IP
Backbone
v
IP
Subnet
v
IP
Segment
v
Show
in
IP
Backbone
IP
Backbone
The
IP
Backbone
Topology
view
shows
links
between
routers,
subnets,
interfaces,
and
network
locations.
The
scope
of
resources
included
in
the
view
is
determined
by
the
IP
network
or
network
location
that
contains
the
resource
for
which
the
IP
Backbone
is
selected.
The
links
from
routers
to
their
interfaces
and
from
the
interfaces
to
the
corresponding
subnet
(through
the
topology
link
that
is
defined
in
the
data
model)
are
the
primary
components
of
the
IP
Backbone
Topology
view.
The
view
also
displays
point–to–point
interfaces,
which
connect
two
routers
without
an
intervening
subnet.
When
a
network
location
is
present,
this
resource
is
displayed
in
the
view
without
all
the
details
of
the
subnets
contained
in
the
network
location.
In
this
case
a
single
link
from
the
interface
to
the
network
location
is
displayed.
If
all
the
subnets
that
connect
to
a
router
(by
way
of
an
interface)
are
contained
in
a
network
location
that
is
also
contained
in
the
view,
then
the
router
is
not
displayed
in
the
view.
Network
locations
are
used
as
aggregations
to
prevent
the
view
from
becoming
so
busy
that
it
is
not
usable.
The
IP
Backbone
can
be
requested
for
a
network
location
to
get
the
backbone
topology
for
the
subnets
and
routers
contained
within
the
network
location.
When
64
IBM
Tivoli
Business
Systems
Manager:
Introducing
the
Consoles

this
view
is
used,
More
Detail
can
be
used
for
a
router
to
bring
in
connected
interfaces
and
subnets,
where
the
subnets
are
not
in
the
network
location
for
which
the
view
was
opened.
Console
Administrator
Preferences
includes
a
check
box
on
the
View
page
where
administrators
can
specify
whether
interfaces
are
displayed
in
the
view
as
connections.
The
interfaces
can
be
shown
as
connections
rather
than
as
nodes
to
reduce
the
number
of
resources
in
the
view,
possibly
making
the
view
less
cluttered
and
more
usable.
IP
Backbone
can
be
selected
from
the
following
classes
of
resources:
IP
Network
In
this
view,
all
contained
network
locations,
subnets,
routers,
and
interfaces
are
candidates
for
the
view.
Network
locations
aggregate
portions
of
the
view.
Network
location
All
subnets,
routers,
interfaces,
and
network
locations
that
descend
from
the
selected
network
location
are
candidates
for
the
view.
Connected
subnets
not
contained
in
this
network
location
can
be
brought
into
the
view
by
using
More
Detail
from
a
router.
Subnet
Parent
relationships
are
traversed
until
the
first
network
location
or
IP
network
resource
is
encountered.
The
view
is
then
created
as
described
for
an
IP
network
or
network
location.
Router
Parent
relationships
are
traversed
until
the
first
network
location
or
IP
network
resource
is
encountered.
The
view
is
then
created
as
described
for
an
IP
network
or
network
location.
IP
Subnet
The
IP
Subnet
Topology
view
focuses
on
the
IP
segments
that
are
contained
in
a
particular
subnet.
This
view
is
only
available
from
an
IP
subnet
resource
and
includes
the
following
information.
v
The
IP
segments
contained
in
the
subnet
v
The
major
networking
devices
contained
in
each
segment
(routers,
switches,
bridges,
and
hubs)
v
The
links
between
the
collected
resources
IP
Segment
The
IP
Segment
Topology
view
shows
all
networking
resources
contained
in
the
segment.
No
links
are
shown,
so
this
view
is
effectively
a
collection
of
the
dependent
resources,
displayed
in
a
Topology
viewer.
This
view
potentially
contains
a
large
volume
of
resources,
so
the
tools
of
the
Topology
viewer
could
be
useful
for
locating
or
working
with
a
particular
networking
resource.
Show
in
IP
Backbone
This
view
is
designed
to
focus
on
the
position
of
a
particular
networking
resource
with
respect
to
the
IP
Backbone.
This
view
is
available
for
all
SNMP
type
resources,
such
as
computers,
network
UNIX,
network
devices,
and
Windows
servers.
This
view
is
formed
as
follows:
Appendix
A.
Topology
Views
65
1.
The
IP
Backbone
is
determined
by
traversing
the
resource
parent
relationships
of
the
selected
resource
until
the
first
network
location
or
IP
network
is
found
2.
The
containment
hierarchy
for
the
selected
resource
is
gathered,
again
using
parent
relationships,
up
to
the
point
where
the
first
ancestor
is
encountered
that
is
included
in
the
backbone
data
that
was
gathered
in
Step
1.
3.
The
parent
resources
from
Step
2
(likely
just
the
containing
segment)
are
connected
to
the
appropriate
backbone
resources
from
Step
1
(likely
just
the
subnet
that
contains
the
containing
segment).
4.
The
selected
resource
is
the
focus
(centered
and
zoomed)
of
the
view.
66
IBM
Tivoli
Business
Systems
Manager:
Introducing
the
Consoles
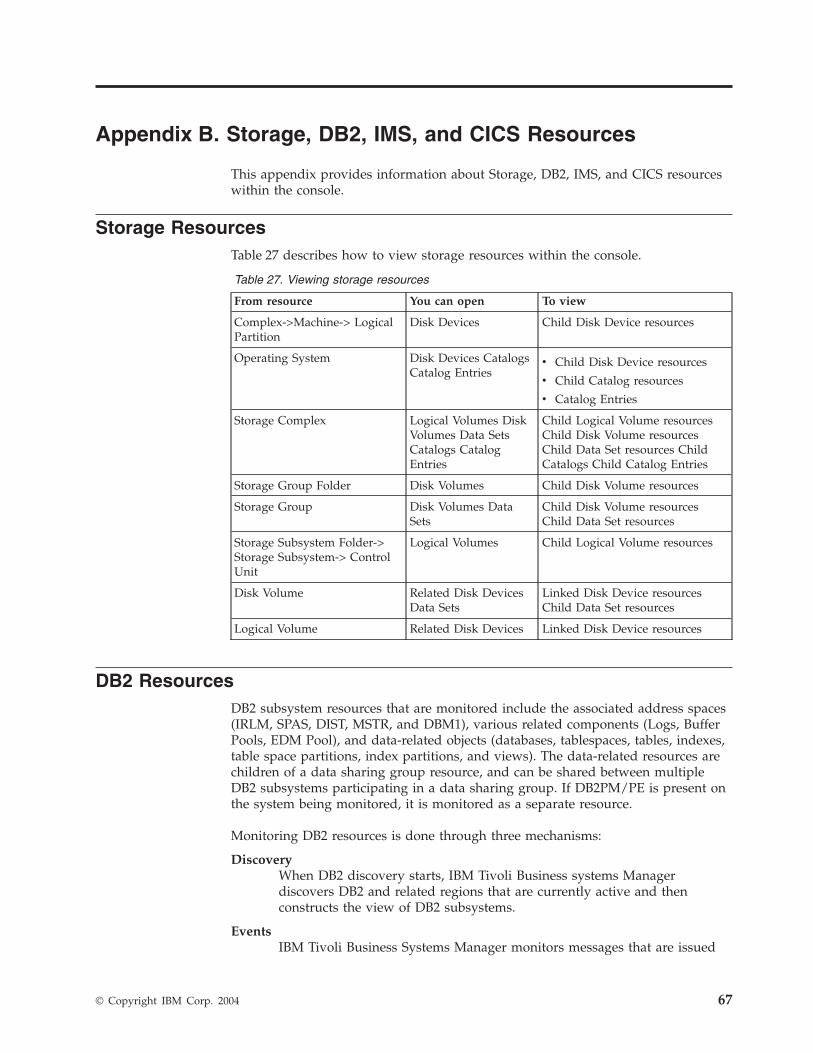
Appendix
B.
Storage,
DB2,
IMS,
and
CICS
Resources
This
appendix
provides
information
about
Storage,
DB2,
IMS,
and
CICS
resources
within
the
console.
Storage
Resources
Table
27
describes
how
to
view
storage
resources
within
the
console.
Table
27.
Viewing
storage
resources
From
resource
You
can
open
To
view
Complex->Machine->
Logical
Partition
Disk
Devices
Child
Disk
Device
resources
Operating
System
Disk
Devices
Catalogs
Catalog
Entries
v
Child
Disk
Device
resources
v
Child
Catalog
resources
v
Catalog
Entries
Storage
Complex
Logical
Volumes
Disk
Volumes
Data
Sets
Catalogs
Catalog
Entries
Child
Logical
Volume
resources
Child
Disk
Volume
resources
Child
Data
Set
resources
Child
Catalogs
Child
Catalog
Entries
Storage
Group
Folder
Disk
Volumes
Child
Disk
Volume
resources
Storage
Group
Disk
Volumes
Data
Sets
Child
Disk
Volume
resources
Child
Data
Set
resources
Storage
Subsystem
Folder->
Storage
Subsystem->
Control
Unit
Logical
Volumes
Child
Logical
Volume
resources
Disk
Volume
Related
Disk
Devices
Data
Sets
Linked
Disk
Device
resources
Child
Data
Set
resources
Logical
Volume
Related
Disk
Devices
Linked
Disk
Device
resources
DB2
Resources
DB2
subsystem
resources
that
are
monitored
include
the
associated
address
spaces
(IRLM,
SPAS,
DIST,
MSTR,
and
DBM1),
various
related
components
(Logs,
Buffer
Pools,
EDM
Pool),
and
data-related
objects
(databases,
tablespaces,
tables,
indexes,
table
space
partitions,
index
partitions,
and
views).
The
data-related
resources
are
children
of
a
data
sharing
group
resource,
and
can
be
shared
between
multiple
DB2
subsystems
participating
in
a
data
sharing
group.
If
DB2PM/PE
is
present
on
the
system
being
monitored,
it
is
monitored
as
a
separate
resource.
Monitoring
DB2
resources
is
done
through
three
mechanisms:
Discovery
When
DB2
discovery
starts,
IBM
Tivoli
Business
systems
Manager
discovers
DB2
and
related
regions
that
are
currently
active
and
then
constructs
the
view
of
DB2
subsystems.
Events
IBM
Tivoli
Business
Systems
Manager
monitors
messages
that
are
issued
©
Copyright
IBM
Corp.
2004
67

by
DB2
and
related
regions.
If
these
messages
indicate
that
a
problem
exists
(or
that
a
problem
no
longer
exists),
this
information
is
sent
to
the
console
as
appropriate.
Polling
Processing
IBM
Tivoli
Business
Systems
Manager
periodically
polls
DB2
region
for
data
resources
(databases,
tablespaces,
tables,
indexes,
tablespace
partitions,
and
index
partitions)
that
are
in
a
restricted
(non-Read/Write)
state.
If
this
polling
process
detects
a
resource
that
is
going
into
a
restricted
state
(or
a
resource
that
was
previously
restricted
and
is
now
Read/Write),
this
information
is
sent
to
the
console
as
appropriate.
Hierarchy
of
DB2
Resources
The
console
arranges
DB2
resources
in
the
following
hierarchy:
DB2
Subsystem
DB2
Master
Address
Space
(MSTR)
IRLM
Region
Stored
Procedures
Address
Space
(SPAS)
Database
Services
(DBM1)
Distributed
Data
Facility
(DIST)
Buffer
Pools
EDM
Pool
DB2
Logs
DB2PM/PE
Data
Sharing
Group
Database
Tablespace
Table
Index
Tablespace
Partition
Index
Partition
DB2
View
Thus
if
a
DB2
Buffer
Pool
goes
into
error,
the
DB2
subsystem
is
also
flagged.
A
data
sharing
group
(and
all
objects
below
it)
can
be
shared
between
multiple
DB2
subsystems.
Thus,
the
same
data
sharing
group
might
be
displayed
on
the
tree
as
belonging
to
more
than
one
DB2
subsystem.
DB2
resources
that
are
below
Data
Sharing
Group
in
the
hierarchy
are
not
displayed
on
the
physical
tree.
Instead,
they
are
represented
on
the
physical
tree
by
aggregate
resources.
Under
each
data
sharing
group,
there
could
be
one
aggregate
resource
for
databases,
one
for
table
spaces,
one
for
indexes,
one
for
table
space
partitions,
and
one
for
index
partitions.
Each
aggregate
resource
can
be
considered
a
parent
of
all
the
occurrences
of
the
corresponding
resource
type
in
that
data
sharing
group.
Issuing
Commands
To
issue
commands
from
DB2
resources,
do
the
following
steps:
1.
Right-click
the
DB2
resource
to
open
the
context
menu.
2.
Click
Commands
->
(the
command
to
issue)
to
open
a
Task
Settings
window.
3.
Click
Start
in
the
Task
Setting
window
to
start
the
command.
You
might
be
prompted
for
a
valid
user
ID
and
password
for
the
NetView
system
on
which
the
command
is
to
be
run.
You
can
view
the
output
from
the
command
in
the
Task
output
section
of
the
Operational
Tasks
window
that
opens.
68
IBM
Tivoli
Business
Systems
Manager:
Introducing
the
Consoles

IMS
Resources
IMS
resources
that
the
console
monitors
are
subsystems
(DBCTL,
DCCTL,
and
TM/DB),
associated
regions
(IRLM,
CQS,
FDBR,
IMS
Connect,
BMP,
MPP,
and
IFP
regions),
and
resources
(programs,
transactions,
databases,
DB2/MQ
esaf
,
and
logs).
Monitoring
IMS
resources
is
performed
through
three
mechanisms:
Discovery
When
IMS
discovery
starts,
IBM
Tivoli
Business
Systems
Manager
discovers
IMS
and
related
regions
that
are
currently
active
and
then
constructs
the
view
of
IMS
subsystems.
Events
IBM
Tivoli
Business
Systems
Manager
monitors
messages
that
are
issued
by
IMS
and
related
regions.
If
these
messages
indicate
that
a
problem
exists
(or
that
a
problem
no
longer
exists),
this
information
is
sent
to
the
console
as
appropriate.
Polling
Processing
IBM
Tivoli
Business
Systems
Manager
periodically
polls
IMS
region
for
such
things
as
databases
in
error
or
the
status
of
the
IMS
Master
Terminal.
If
these
polling
monitors
detect
an
error
(or
a
previous
error
that
no
longer
exists),
this
information
is
sent
to
the
console
as
appropriate.
Hierarchy
of
IMS
Resources
The
console
arranges
IMS
resources
in
the
following
hierarchy:
IMS
Subsystem
(TM/DB,
DBCTL,
or
DCCTL)
IMS
Dependent
Regions
(MPP,
JMP,
IFP,
JBP
or
BMP)
ESAF
Connection
to
DB2
ESAF
Connection
to
MQSeries
IMS
Logs
IMS
FDBR
region¹
IRLM
region²
CQS
region²
IMS
Connect
region¹
IMS
Programs
IMS
Transactions
IMS
Databases
(DL/I,
DEDB,
HALDB)
DEDB
Area
HALDB
Partition
IMS
FDBR
region¹
IRLM
region²
CQS
region²
IMS
Connect
region¹
IMS
SCI
region
IMS
OM
region
IMS
RM
region
Because
it
can
run
on
a
different
z/OS
image
than
the
IMS
subsystem
that
it
is
tracking,
an
FDBR
region
can
appear
as
a
child
of
the
z/OS
image
under
which
it
runs,
and
as
a
child
of
the
IMS
subsystem
it
is
tracking.
IMS
Connect
can
run
on
a
different
z/OS
image
than
the
IMS
subsystem
with
which
they
are
communicating.
It
can
appear
both
as
a
child
of
the
z/OS
image
under
which
it
runs
and
as
a
child
of
every
IMS
subsystem
it
has
a
connection
with.
CQS
and
IRLM
regions
appear
both
as
a
child
of
the
z/OS
image
under
which
they
run,
and
as
a
child
of
every
IMS
to
which
they
have
a
connection.
Programs,
Transactions,
Databases,
and
Logs
Operators
can
monitor
IMS
programs,
transactions,
databases,
and
logs.
These
all
appear
as
Aggregates
on
the
console
within
the
IMS
hierarchy.
Appendix
B.
Storage,
DB2,
IMS,
and
CICS
Resources
69

Issuing
Commands
To
issue
commands
from
IMS
resources,
do
the
following
steps:
1.
Right-click
the
IMS
subsystem
to
open
its
context
menu.
2.
Click
Commands
->
(the
command
to
issue).
3.
Click
Start.
4.
Enter
the
z/OS
user
ID
and
password
when
prompted.
5.
View
the
output
from
the
command
in
the
task
output
section
of
the
Operational
Tasks
window.
CICS
Resources
Operators
can
manage
CICS
resources
such
as
regions,
transactions,
files,
schedules,
connections,
DB2
connections,
corba
servers,
and
jar
files
from
the
console.
Transaction
Management
The
console
collects
status
and
performance
information
on
CICS
transactions
from
three
primary
sources:
v
Exceptions
from
CICS
performance
monitors
and
CPSM
monitoring
v
Transient
Data
Queue
messages
v
Console
messages
Transaction
Status
Window
Transactions
registered
under
a
CICS
region
are
displayed
in
the
Transaction
Status
window.
You
can
filter
for
Alert
State,
Location,
Current
State,
Scheduled
State,
as
well
as
a
specific
Transaction,
Program,
or
Class.
Operators
can
sort
columns
in
ascending
or
descending
order
and
arrange
columns
by
dragging
the
column
headings
left
or
right
and
positioning
them.
File
Management
Files
are
resource
types
within
the
console
and
are
a
critical
resource
for
CICS
regions
which
use
files
for
storage.
File
availability
determines
whether
a
CICS
Region
has
the
necessary
data
to
continue
its
processing.
Available
files
have
only
one
valid
status:
Open\Enabled.
Status
for
unavailable
files
can
be
any
of
the
following:
Closed\Enabled
The
file
is
enabled
and
closed.
Closed\Disabled
The
file
is
disabled
and
closed.
Closed\Unenabled
The
file
is
not
enabled
and
closed.
N/A\N/A
The
file
is
present
within
the
region,
but
its
status
cannot
be
found
or
the
file
is
a
remote
file.
---\
---
The
status
is
not
given
on
the
file.
Operators
can
also
perform
the
following
tasks
using
the
CICS
/
File
Status
window:
v
Change
the
priority
of
a
file
70
IBM
Tivoli
Business
Systems
Manager:
Introducing
the
Consoles

v
Register
or
unregister
a
file
v
View
file
properties
Viewing
CICS
Resources
To
view
information
about
CICS
Corba
Servers,
CICS
Jar
Files,
CICS
to
CICS
Connections,
and
CICS
to
DB2
Connections,
do
the
following
steps:
1.
Right-click
a
CICS
Region
to
open
the
context
menu.
2.
Click
CICSPlex®
Information.
3.
Click
the
resource
you
want
to
view.
Appendix
B.
Storage,
DB2,
IMS,
and
CICS
Resources
71

72
IBM
Tivoli
Business
Systems
Manager:
Introducing
the
Consoles

Appendix
C.
Monitoring
Batch
Processes
This
appendix
provides
information
about
monitoring
batch
processes
within
the
console.
Monitoring
Batch
Processes
Monitoring
batch
processes
within
the
console
provides
quick
determination
of
problems
that
threaten
batch
schedules
from
completing
correctly
and
on
time.
You
can
monitor
batch
jobs
for
start
times
and
duration
as
specified
in
the
scheduling
package,
as
well
as
for
significant
deviations
from
standard
behavior.
You
can
view
current
or
historical
information
on
batch
schedules
and
batch
schedule
jobs.
Batch
Jobs
A
batch
job
is
a
scheduled
program
that
runs
without
user
intervention.
Corporations
use
batch
jobs
to
automate
tasks
that
they
need
to
perform
on
a
regular
basis.
Batch
jobs
usually
run
during
off
peak
hours
when
systems
are
not
being
used
for
online
processing.
(For
example,
systems
can
run
to
update
files,
create
printed
reports,
or
purge
files.)
Batch
jobs
that
need
to
be
processed
on
a
regular
basis
are
incorporated
into
batch
schedules.
Non-Key
Jobs
Non-key
jobs
are
defined
by
name
to
the
batch
schedule,
but
do
not
contain
all
the
attributes
of
key
jobs.
They
are
not
monitored
for
Start
and
Stop
times
but,
like
key
jobs,
they
are
monitored
for
abends.
They
are
not
visually
represented
below
the
batch
schedule
resource
within
a
console
Tree
or
HyperView
(All
Resources
view
or
business
system
views).
They
are
displayed,
however,
in
the
list
representation
of
the
contents
of
a
Batch
Schedule
within
the
Batch
Management
Summary
window.
Since
non-key
jobs
are
not
registered
within
the
console
unless
they
abend,
console
traps
and
performance
threshold
exceptions
are
not
applied
for
those
jobs.
Non-registered
resources
are
resources
that
are
running
within
your
complex
that
you
have
decided
not
to
monitor.
Non-key
batch
jobs
are
handled
differently
from
other
non-registered
resources.
When
a
non-key
job
abends,
Source/390
captures
the
ABEND
message
and
forwards
it
to
the
console
database.
All
abends
for
all
batch
jobs
are
captured
and
forwarded
in
this
manner.
When
Source/390
captures
the
ABEND
message,
it
examines
the
message
to
see
if
it
is
for
one
of
the
registered
jobs
(batch
schedule
key
jobs).
If
not,
it
scans
to
see
which
job
the
message
is
for
and
temporarily
registers
that
job.
This
enables
the
console
to
capture
the
Start
and
Stop
times
for
that
job.
After
the
job
is
completed,
or
a
set
period
of
time
passes
(set
by
a
console
administrator),
the
job
is
unregistered.
This
method
allows
the
console
to
capture
the
important
Start
and
Stop
times
of
a
job
that
has
abended,
providing
a
more
definitive
view
of
the
running
Batch
Schedule.
Key
and
non-key
jobs
apply
to
jobs
within
batch
schedules
only.
Converting
a
Key
Job
to
a
Non-Key
Job
To
convert
a
key
job
to
a
non-key
job,
do
the
following
steps:
1.
Select
the
key
job
from
the
Batch
Management
Summary
window.
2.
Right-click
the
key
job
to
open
the
context
menu.
3.
Click
Convert
to
Non-key
job
on
the
context
menu.
©
Copyright
IBM
Corp.
2004
73

Note:
You
can
change
a
non-key
job
to
a
key
job
using
the
same
method.
Batch
Schedule
key
jobs
inherit
all
of
the
attributes
of
the
Batch
Schedule
jobs.
They
also
contain
the
following
attributes:
Attribute
Name
Description
Estimated
Stop
Time
Estimated
completion
time
for
this
job
if
Current
State
is
active.
Total
Runs
The
number
of
observed
runs.
A
run
is
a
Start
followed
by
a
expected
or
unexpected
termination.
Good
Runs
The
number
of
successful
runs.
A
successful
run
is
a
Start
followed
by
a
expected
termination.
The
Batch
Management
Summary
Window
Use
the
Batch
Management
Summary
window
to
do
the
following
activities:
v
Monitor
batch
schedules
and
batch
schedule
jobs.
v
View
current
information
on
batch
schedules
and
batch
schedule
jobs
within
an
Enterprise,
Complex,
Business
System,
Batch
Schedule
Set,
or
Batch
Schedule.
v
View
historical
schedule
information
pertaining
to
all
batch
schedules
and
jobs
within
an
Enterprise,
Complex,
Business
System,
Batch
Schedule
Set,
or
Batch
Schedule.
The
system
administrator
should
be
the
only
user
of
the
batch
management
summary.
Other
users
should
use
either
dynamically
generated
business
systems
resulting
from
loading
daily
schedule
or
the
managed
resources
view
for
batch
objects.
The
schedule
status
in
the
batch
management
summary
is
a
derived
field
and
does
not
always
reflect
the
true
status
of
the
batch
schedule.
High
Level
Batch
Schedule
Set
Monitoring
Different
levels
of
detail
are
often
required
when
monitoring
any
set
of
resources.
Various
departments,
staff
members,
and
personnel
require
different
views,
often
displaying
different
levels
of
detail,
while
monitoring
exactly
the
same
resources.
There
are
three
levels
of
detail
to
monitor:
v
Batch
schedule
sets
v
Batch
Schedule
v
Individual
batch
jobs
The
highest
level
of
monitoring
for
Batch
Processes
is
to
monitor
the
schedule
sets
only.
The
console
can
control
propagation
enabling
only
specific
or
critical
problems
on
batch
jobs
to
propagate
to
the
level
of
the
batch
schedule
sets.
Monitoring
the
Progress
of
a
Batch
Schedule
Monitoring
the
progress
of
a
Batch
Schedule
focuses
on
monitoring
the
pending
batch
jobs
within
the
schedule.
Pending
Batch
jobs
are
the
jobs
that
have
not
yet
started
and
have
a
current
state
of
Pending.
You
can
observing
pending
jobs
to
see
which
jobs
are
about
to
run
and
their
scheduled
times.
Extending
Schedules
to
Minimize
Alerts
You
can
monitor
batch
schedules
and
batch
schedule
key
jobs
for
interrupted
execution
(abends)
and
schedule
violations.
Schedule
violations
can
be
unexpected
74
IBM
Tivoli
Business
Systems
Manager:
Introducing
the
Consoles

Start
or
Completion
times,
the
duration
of
execution
for
a
key
job,
or
the
entire
batch
schedule.
Each
batch
schedule
or
batch
schedule
key
job
can
have
many
thresholds
or
counters
assigned
to
it.
When
a
key
job
starts
to
process
within
a
batch
schedule,
threshold
rules
are
checked
for
the
Start
time.
If
the
job
starts
before
the
scheduled
time,
a
schedule
violation
occurs
in
the
form
of
an
exception.
The
console
traps
the
exceptions,
and
when
thresholds
are
exceeded,
generates
an
alert.
Because
this
batch
schedule
completes
typically
in
20
minutes,
you
want
to
be
warned
if
you
exceed
that
time.
If
you
exceed
that
time
by
10
minutes,
the
first
threshold
is
exceeded
and
the
Batch
Schedule
is
tagged
with
a
Yellow
alert.
The
Batch
Schedule
is
assigned
a
warning
because,
this
batch
schedule
sometimes
runs
about
45
minutes.
If
the
batch
schedule
is
running
beyond
60
minutes,
you
have
a
Red
High
condition,
which
informs
you
that
the
second
threshold
has
been
exceeded.
The
issue
escalates
by
raising
the
priority
from
High
to
Critical
after
90
minutes.
You
have
a
Red
High
condition
if
the
Batch
Schedule
completes
too
soon
(after
five
minutes).
This
protects
against
an
improbable
early
completion
of
the
Batch
Schedule.
Usually,
if
a
batch
schedule
with
an
assigned
estimated
duration
completes
this
quickly,
it
is
due
to
one
of
its
jobs
abending.
The
console
captures
the
abend
and
the
batch
schedule
receives
an
alert.
However,
if
the
batch
schedule
does
complete
this
quickly,
there
might
be
a
problem
with
the
data
used
by
the
jobs
in
this
batch
schedule.
Appendix
C.
Monitoring
Batch
Processes
75

76
IBM
Tivoli
Business
Systems
Manager:
Introducing
the
Consoles

Appendix
D.
Accessibility
in
the
Console
This
appendix
provides
information
about
how
the
console
is
accessible
to
all
users.
General
Shortcut
Keys
Shortcuts
for
the
console:
Table
28.
Shortcut
keys
for
the
console
Function
Key
Open
the
Task
Assistant
F1
View
the
primary
topic
on
keyboard
shortcuts
in
the
Task
Assistant.
F9
Close
the
window
that
has
focus
within
the
console
Ctrl
+
F4
Select
or
deselect
an
item
in
a
Tree
view
space
bar
Refresh
the
view
that
has
focus
in
the
work
area
F5
Cancel
refresh
Shift
+
F5
Move
between
Business
Systems
view,
workspace,
and
Task
Assistant,
or
between
two
panels
divided
by
a
splitter
bar
(for
example,
a
Tree
view
and
the
Event
view)
F6
Move
focus
to
the
workspace
and
cycle
through
the
views
Ctrl
+
F6
Cycle
from
the
console
through
the
open
dialogs,
going
from
the
first
dialog
that
was
opened
to
the
last
dialog
that
was
opened
and
back
to
the
console
F7
Cycle
from
the
console
through
the
open
dialogs,
going
from
the
last
dialog
that
was
opened
to
the
first
dialog
that
was
opened
and
back
to
the
console
Shift
+
F7
Activate
the
menu
bar
F10
Open
context
menu
for
a
resource
Shift
+
F10
(Does
not
work
in
HyperView
or
Topology
view)
Move
focus
to
the
splitter
bar
and
toggle
between
splitter
bars
if
more
than
one
splitter
bar
is
shown.
F8
Move
a
splitter
bar
to
a
new
position
when
the
splitter
bar
has
focus
To
move
the
bar,
use
the
arrow
keys
or
the
Home
and
End
keys.
To
set
the
new
position,
move
the
focus
to
another
area.
Edit
a
value
for
a
spin
button
that
is
located
in
a
table
F2
(Press
once
to
enable
editing,
then
use
the
up
and
down
arrows
to
spin
to
the
value.
Press
F2
again
to
close
the
spin
button.)
©
Copyright
IBM
Corp.
2004
77

Table
28.
Shortcut
keys
for
the
console
(continued)
Function
Key
Select
an
item
from
a
popup
menu
that
is
located
in
a
table
F2
(Press
once
to
enable
the
popup
menu,
then
use
the
up
and
down
arrows
to
select
the
menu
item.)
Shortcuts
for
dialogs
such
as
the
Resource
Properties
dialog
and
the
Take
Ownership
dialog:
Table
29.
Shortcut
keys
for
dialogs
Function
Key
Move
forward
to
the
next
item
in
the
dialog
Tab
Move
backward
to
the
previous
item
in
the
dialog
Shift
+
Tab
Move
out
of
a
table
or
multi-line
text
area
in
a
dialog
box
and
forward
to
the
next
item
in
the
dialog
box
Ctrl
+
Tab
Move
out
of
a
table
or
multi-line
text
area
in
a
dialog
box
and
backward
to
the
previous
item
in
the
dialog
box
Ctrl
+
Shift
+
Tab
Shortcuts
for
the
Business
Systems
area:
Table
30.
Shortcut
keys
for
the
Business
Systems
area
Function
Key
Move
to
the
item
below
the
current
item
down
arrow
Move
to
the
item
above
the
current
item
up
arrow
Open
a
branch
of
the
current
item
NumPad
+
Close
a
branch
of
the
current
item
NumPad
-
Expand
the
current
item
Shift
+
=
Collapse
the
current
item
Shift
+
-
Scroll
to
the
new
page
of
the
view
that
has
focus
Page
Down
Scroll
to
the
previous
page
of
the
view
that
has
focus
Page
Up
Move
to
the
first
item
in
the
view
that
has
focus
Home
Move
to
the
last
item
in
the
view
that
has
focus
End
Move
to
the
first
row
in
a
table
view
Ctrl
+
Home
Move
to
the
last
row
in
a
table
view
Ctrl
+
End
Open
the
selected
item
as
a
new
view
Enter
Shortcuts
for
sorting
and
filtering
information
in
tables:
Table
31.
Shortcut
keys
for
sorting
and
filtering
information
in
tables
Function
Key
Sort
the
current
column
in
ascending
order
Ctrl
+
S
Sort
the
current
column
in
descending
order
Ctrl
+
Shift
+
S
For
a
single
column
sort,
clear
the
sort
for
the
current
column
Ctrl
+
Q
For
a
multi
column
sort,
clear
the
sort
for
the
current
column
Ctrl
+
J
For
a
multi-column
sort,
clear
all
sorts
Ctrl
+
Q
78
IBM
Tivoli
Business
Systems
Manager:
Introducing
the
Consoles

Table
31.
Shortcut
keys
for
sorting
and
filtering
information
in
tables
(continued)
Function
Key
For
a
multi-column
sort,
edit
the
sort
Ctrl
+
W
Show
the
filter
row
Ctrl
+
R
Hide
the
filter
row
Ctrl
+
Shift
+
R
Edit
the
filter
for
the
current
column
Ctrl
+
E
Apply
the
filter
for
the
current
column
Ctrl
+
Shift
+
U
Remove
the
apply
filter
for
the
current
column
Ctrl
+
U
Clear
all
filters
Ctrl
+
K
Select
all
table
rows
that
are
displayed
Ctrl
+
A
Deselect
all
table
rows
that
are
displayed
Ctrl
+
Shift
+
A
Menu
Shortcut
Keys
This
section
describes
shortcut
keys
for
items
on
the
menu
bar
as
well
as
for
menu
choices.
Console
Menu
Bar
Console
menu
bar
shortcut
keys:
Table
32.
Menu
bar
shortcut
keys
Menu
Key
Console
Alt
+
C
Edit
Alt
+
E
View
Alt
+
V
Search
Alt
+
S
Actions
Alt
+
A
Windows
Alt
+
W
Help
Alt
+
H
Console
Menu
Console
menu
shortcut
keys:
Table
33.
Shortcut
keys
for
the
Console
menu
Menu
Item
Key
New
Business
System
Ctrl
+
N
Task
Monitor
Ctrl
+
T
Notes
Ctrl
+
E
Open
Workspace
Ctrl
+
W
Open
All
Resources
Ctrl
+
U
Open
Resource
Types
Ctrl
+Y
Open
Executive
Dashboard
Lists
Ctrl
+
L
Save
Workspace
Ctrl
+
S
Image
Manager
Ctrl
+
I
Appendix
D.
Accessibility
in
the
Console
79

Table
33.
Shortcut
keys
for
the
Console
menu
(continued)
Menu
Item
Key
Exit
Alt
F4
Edit
Menu
Edit
menu
shortcuts:
Table
34.
Shortcut
keys
for
the
Edit
menu
Menu
Item
Key
Copy
Ctrl
+
C
Paste
Ctrl
+
V
View
Menu
View
menu
shortcuts:
Table
35.
Shortcut
keys
for
the
View
menu
Menu
Item
Key
Refresh
F5
Cancel
Refresh
Shift
+
F5
Events
Ctrl
+
Shift
+
E
Display
Filter
Panel
Ctrl
+
Shift
+
P
Home
Home
Expand
all
Shift
+
=
Collapse
all
Shift
+
-
Search
Menu
Search
menu
shortcuts:
Table
36.
Shortcut
keys
for
the
Search
menu
Menu
Item
Key
Search
All
Resources
F3
Find
Ctrl
+
F
Actions
Menu
Actions
menu
shortcuts:
Table
37.
Shortcut
keys
for
the
Actions
menu
Menu
Item
Key
Open
as
New
View
Ctrl
+
O
Business
Impact
Ctrl
+
B
Properties
Alt
+
Enter
80
IBM
Tivoli
Business
Systems
Manager:
Introducing
the
Consoles

Help
Menu
Help
menu
shortcuts:
Table
38.
Shortcut
keys
for
the
Help
menu
Menu
Item
Key
Open
Task
Assistant/Close
Task
Assistant
F1
Search
Ctrl
+
Shift
+
F
Keyboard
Help
F9
Additional
Menu
Shortcut
Keys
for
Topology
Views
This
section
describes
shortcut
keys
that
are
available
when
you
are
using
Topology
views
Search
menu
Search
menu
shortcut
keys:
Table
39.
Shortcut
keys
for
the
Search
menu
Menu
Item
Key
Find
Ctrl
+
F
(also
available
for
HyperViews)
View
Menu
View
menu
shortcuts:
Table
40.
Shortcut
keys
for
the
View
menu
Menu
Item
Key
Zoom
->
In
NumPad
+
Zoom
->
Out
NumPad
-
Zoom
->
Fit
to
Window
Ctrl
+
Home
Zoom
Fit
Visible
to
Window
Ctrl
+
End
Pan
->
Up
Up
arrow
key
Pan
->
Down
Down
arrow
key
Pan
->
Left
Left
arrow
key
Pan
->
Right
Right
arrow
key
Undo
Detail
Ctrl
+
F12
Actions
Menu
Actions
menu
shortcuts:
Table
41.
Shortcut
keys
for
the
Actions
menu
Menu
Item
Key
Zoom
Selected
Ctrl
+
=
Center
Selected
Alt
+
=
More
Detail
Ctrl
+
F11
Appendix
D.
Accessibility
in
the
Console
81

82
IBM
Tivoli
Business
Systems
Manager:
Introducing
the
Consoles

Support
information
This
section
describes
the
following
options
for
obtaining
support
for
IBM
products:
v
“Searching
knowledge
bases”
v
“Obtaining
fixes”
v
“Contacting
IBM
Software
Support”
on
page
84
Searching
knowledge
bases
If
you
have
a
problem
with
your
IBM
software,
you
want
it
resolved
quickly.
Begin
by
searching
the
available
knowledge
bases
to
determine
whether
the
resolution
to
your
problem
is
already
documented.
Search
the
information
center
on
your
local
system
or
network
IBM
provides
extensive
documentation
that
can
be
installed
on
your
local
computer
or
on
an
intranet
server.
An
index
is
provided
for
searching
the
Tivoli
Business
Systems
Manager
library.
If
you
have
Adobe
Acrobat
on
your
system,
you
can
use
the
Search
command
to
locate
specific
text
in
the
library.
For
more
information
about
using
the
index
to
search
the
library,
see
the
online
help
for
Acrobat.
Search
the
Internet
If
you
cannot
find
an
answer
to
your
question
in
the
information
center,
search
the
Internet
for
the
latest,
most
complete
information
that
might
help
you
resolve
your
problem.
To
search
multiple
Internet
resources
for
your
product,
expand
the
product
folder
in
the
navigation
frame
to
the
left
and
select
Web
search.
From
this
topic,
you
can
search
a
variety
of
resources
including:
v
IBM
technotes
v
IBM
downloads
v
IBM
Redbooks™
v
IBM
developerWorks®
v
Forums
and
newsgroups
v
Obtaining
fixes
A
product
fix
might
be
available
to
resolve
your
problem.
You
can
determine
what
fixes
are
available
for
your
IBM
software
product
by
checking
the
product
support
Web
site:
1.
Go
to
the
IBM
Software
Support
Web
site
(http://www.ibm.com/software/support).
2.
Under
Products
A
-
Z,
click
I.
When
the
list
of
products
is
displayed,
click
IBM
Tivoli
Business
Systems
Manger
for
z/OS.
This
opens
the
product-specific
support
site.
©
Copyright
IBM
Corp.
2004
83

3.
Under
Search
our
support
knowledge
base
for
IBM
Tivoli
Business
Systems
Manger
for
z/OS,
type
your
text
in
the
search
field
and
click
the
Submit
button.
You
can
limit
your
search
by
selecting
Solve
a
problem,
Download,
or
Learn,
or
any
combination.
For
tips
on
refining
your
search,
click
Search
assistance.
4.
When
you
find
the
list
of
fixes,
fix
packs,
or
other
service
updates
that
you
are
looking
for,
click
the
name
of
a
fix
to
read
the
description
and
optionally
download
the
fix.
To
receive
weekly
notifications
about
fixes
and
other
news
about
IBM
products,
follow
these
steps:
1.
From
the
support
page
for
any
IBM
product,
click
My
support
in
the
upper-right
corner
of
the
page.
2.
If
you
have
already
registered,
skip
to
the
next
step.
If
you
have
not
registered,
click
register
in
the
upper-right
corner
of
the
support
page
to
establish
your
user
ID
and
password.
3.
Sign
in
to
My
support.
4.
On
the
My
support
page,
click
Edit
profiles
in
the
left
navigation
pane,
and
scroll
to
Select
Preferences.
Select
a
product
family
and
check
the
appropriate
boxes
for
the
type
of
information
you
want.
5.
Click
Submit.
6.
For
notification
for
other
products,
repeat
Steps
4
and
5.
For
more
information
about
types
of
fixes,
see
the
Software
Support
Handbook
(http://techsupport.services.ibm.com/guides/handbook.html).
Contacting
IBM
Software
Support
IBM
Software
Support
provides
assistance
with
product
defects.
Before
contacting
IBM
Software
Support,
your
company
must
have
an
active
IBM
software
maintenance
contract,
and
you
must
be
authorized
to
submit
problems
to
IBM.
The
type
of
software
maintenance
contract
that
you
need
depends
on
the
type
of
product
you
have:
v
For
IBM
distributed
software
products
(including,
but
not
limited
to,
Tivoli,
Lotus®,
and
Rational®
products,
as
well
as
DB2
and
WebSphere®
products
that
run
on
Windows
or
UNIX
operating
systems),
enroll
in
Passport
Advantage®
in
one
of
the
following
ways:
–
Online:
Go
to
the
Passport
Advantage
Web
page
(http://www.lotus.com/services/passport.nsf/WebDocs/
Passport_Advantage_Home)
and
click
How
to
Enroll
–
By
phone:
For
the
phone
number
to
call
in
your
country,
go
to
the
IBM
Software
Support
Web
site
(http://techsupport.services.ibm.com/guides/contacts.html)
and
click
the
name
of
your
geographic
region.v
For
IBM
eServer™
software
products
(including,
but
not
limited
to,
DB2
and
WebSphere
products
that
run
in
zSeries®,
pSeries®,
and
iSeries™
environments),
you
can
purchase
a
software
maintenance
agreement
by
working
directly
with
an
IBM
sales
representative
or
an
IBM
Business
Partner.
For
more
information
about
support
for
eServer
software
products,
go
to
the
IBM
Technical
Support
Advantage
Web
page
(http://www.ibm.com/servers/eserver/techsupport.html).
If
you
are
not
sure
what
type
of
software
maintenance
contract
you
need,
call
1-800-IBMSERV
(1-800-426-7378)
in
the
United
States
or,
from
other
countries,
go
to
84
IBM
Tivoli
Business
Systems
Manager:
Introducing
the
Consoles

the
contacts
page
of
the
IBM
Software
Support
Handbook
on
the
Web
(http://techsupport.services.ibm.com/guides/contacts.html)
and
click
the
name
of
your
geographic
region
for
phone
numbers
of
people
who
provide
support
for
your
location.
Follow
the
steps
in
this
topic
to
contact
IBM
Software
Support:
1.
Determine
the
business
impact
of
your
problem.
2.
Describe
your
problem
and
gather
background
information.
3.
Submit
your
problem
to
IBM
Software
Support.
Determine
the
business
impact
of
your
problem
When
you
report
a
problem
to
IBM,
you
are
asked
to
supply
a
severity
level.
Therefore,
you
need
to
understand
and
assess
the
business
impact
of
the
problem
you
are
reporting.
Use
the
following
criteria:
Severity
1
Critical
business
impact:
You
are
unable
to
use
the
program,
resulting
in
a
critical
impact
on
operations.
This
condition
requires
an
immediate
solution.
Severity
2
Significant
business
impact:
The
program
is
usable
but
is
severely
limited.
Severity
3
Some
business
impact:
The
program
is
usable
with
less
significant
features
(not
critical
to
operations)
unavailable.
Severity
4
Minimal
business
impact:
The
problem
causes
little
impact
on
operations,
or
a
reasonable
circumvention
to
the
problem
has
been
implemented.
Describe
your
problem
and
gather
background
information
When
explaining
a
problem
to
IBM,
be
as
specific
as
possible.
Include
all
relevant
background
information
so
that
IBM
Software
Support
specialists
can
help
you
solve
the
problem
efficiently.
To
save
time,
know
the
answers
to
these
questions:
v
What
software
versions
were
you
running
when
the
problem
occurred?
v
Do
you
have
logs,
traces,
and
messages
that
are
related
to
the
problem
symptoms?
IBM
Software
Support
is
likely
to
ask
for
this
information.
v
Can
the
problem
be
re-created?
If
so,
what
steps
led
to
the
failure?
v
Have
any
changes
been
made
to
the
system?
(For
example,
hardware,
operating
system,
networking
software,
and
so
on.)
v
Are
you
currently
using
a
workaround
for
this
problem?
If
so,
please
be
prepared
to
explain
it
when
you
report
the
problem.
Submit
your
problem
to
IBM
Software
Support
You
can
submit
your
problem
in
one
of
two
ways:
v
Online:
Go
to
the
″Submit
and
track
problems″
page
on
the
IBM
Software
Support
site
(http://www.ibm.com/software/support/probsub.html).
Enter
your
information
into
the
appropriate
problem
submission
tool.
v
By
phone:
For
the
phone
number
to
call
in
your
country,
go
to
the
contacts
page
of
the
IBM
Software
Support
Handbook
on
the
Web
(techsupport.services.ibm.com/guides/contacts.html)
and
click
the
name
of
your
geographic
region.
If
the
problem
you
submit
is
for
a
software
defect
or
for
missing
or
inaccurate
documentation,
IBM
Software
Support
creates
an
Authorized
Program
Analysis
Support
information
85

Report
(APAR).
The
APAR
describes
the
problem
in
detail.
Whenever
possible,
IBM
Software
Support
provides
a
workaround
for
you
to
implement
until
the
APAR
is
resolved
and
a
fix
is
delivered.
IBM
publishes
resolved
APARs
on
the
IBM
product
support
Web
pages
daily,
so
that
other
users
who
experience
the
same
problem
can
benefit
from
the
same
resolutions.
For
more
information
about
problem
resolution,
see
Searching
knowledge
bases
and
Obtaining
fixes.
86
IBM
Tivoli
Business
Systems
Manager:
Introducing
the
Consoles

Notices
This
information
was
developed
for
products
and
services
offered
in
the
U.S.A.
IBM
may
not
offer
the
products,
services,
or
features
discussed
in
this
document
in
other
countries.
Consult
your
local
IBM
representative
for
information
on
the
products
and
services
currently
available
in
your
area.
Any
reference
to
an
IBM
product,
program,
or
service
is
not
intended
to
state
or
imply
that
only
that
IBM
product,
program,
or
service
may
be
used.
Any
functionally
equivalent
product,
program,
or
service
that
does
not
infringe
any
IBM
intellectual
property
right
may
be
used
instead.
However,
it
is
the
user’s
responsibility
to
evaluate
and
verify
the
operation
of
any
non-IBM
product,
program,
or
service.
IBM
may
have
patents
or
pending
patent
applications
covering
subject
matter
described
in
this
document.
The
furnishing
of
this
document
does
not
give
you
any
license
to
these
patents.You
can
send
license
inquiries,
in
writing,
to:
IBM
Director
of
Licensing
IBM
Corporation
North
Castle
Drive
Armonk,
NY
10504-1785
U.S.A.
For
license
inquiries
regarding
double-byte
(DBCS)
information,
contact
the
IBM
Intellectual
Property
Department
in
your
country
or
send
inquiries,
in
writing,
to:
IBM
World
Trade
Asia
Corporation
Licensing
2-31
Roppongi
3-chome,
Minato-ku
Tokyo
106,
Japan
The
following
paragraph
does
not
apply
to
the
United
Kingdom
or
any
other
country
where
such
provisions
are
inconsistent
with
local
law:
INTERNATIONAL
BUSINESS
MACHINES
CORPORATION
PROVIDES
THIS
PUBLICATION
″AS
IS″
WITHOUT
WARRANTY
OF
ANY
KIND,
EITHER
EXPRESS
OR
IMPLIED,
INCLUDING,
BUT
NOT
LIMITED
TO,
THE
IMPLIED
WARRANTIES
OF
NON-INFRINGEMENT,
MERCHANTABILITY
OR
FITNESS
FOR
A
PARTICULAR
PURPOSE.
Some
states
do
not
allow
disclaimer
of
express
or
implied
warranties
in
certain
transactions,
therefore,
this
statement
might
not
apply
to
you.
This
information
could
include
technical
inaccuracies
or
typographical
errors.
Changes
are
periodically
made
to
the
information
herein;
these
changes
will
be
incorporated
in
new
editions
of
the
publication.
IBM
may
make
improvements
and/or
changes
in
the
product(s)
and/or
the
program(s)
described
in
this
publication
at
any
time
without
notice.
Any
references
in
this
information
to
non-IBM
Web
sites
are
provided
for
convenience
only
and
do
not
in
any
manner
serve
as
an
endorsement
of
those
Web
sites.
The
materials
at
those
Web
sites
are
not
part
of
the
materials
for
this
IBM
product
and
use
of
those
Web
sites
is
at
your
own
risk.
©
Copyright
IBM
Corp.
2004
87

IBM
may
use
or
distribute
any
of
the
information
you
supply
in
any
way
it
believes
appropriate
without
incurring
any
obligation
to
you.
Licensees
of
this
program
who
wish
to
have
information
about
it
for
the
purpose
of
enabling:
(i)
the
exchange
of
information
between
independently
created
programs
and
other
programs
(including
this
one)
and
(ii)
the
mutual
use
of
the
information
which
has
been
exchanged,
should
contact:
IBM
Corporation
2Z4A/101
11400
Burnet
Road
Austin,
TX
78758
U.S.A.
Such
information
may
be
available,
subject
to
appropriate
terms
and
conditions,
including
in
some
cases
payment
of
a
fee.
The
licensed
program
described
in
this
document
and
all
licensed
material
available
for
it
are
provided
by
IBM
under
terms
of
the
IBM
Customer
Agreement,
IBM
International
Program
License
Agreement
or
any
equivalent
agreement
between
us.
Information
concerning
non-IBM
products
was
obtained
from
the
suppliers
of
those
products,
their
published
announcements
or
other
publicly
available
sources.
IBM
has
not
tested
those
products
and
cannot
confirm
the
accuracy
of
performance,
compatibility
or
any
other
claims
related
to
non-IBM
products.
Questions
on
the
capabilities
of
non-IBM
products
should
be
addressed
to
the
suppliers
of
those
products.
Trademarks
IBM,
the
IBM
logo,
AIX,
CICS,
CICSPlex,
DB2,
developerWorks,
eServer,
IMS,
iSeries,
Lotus,
MVS,
NetView,
OS/390,
Passport
Advantage,
pSeries,
Rational,
Redbooks,
Tivoli,
the
Tivoli
logo,
Tivoli
Enterprise
Console,
WebSphere,
z/OS,
and
zSeries
are
trademarks
of
International
Business
Machines
Corporation
in
the
United
States,
other
countries,
or
both.
Linux
is
a
trademark
of
Linus
Torvalds
in
the
United
States,
other
countries,
or
both.
Microsoft,
Windows,
and
the
Windows
logo
are
trademarks
of
Microsoft
Corporation
in
the
United
States,
other
countries,
or
both.
UNIX
is
a
registered
trademark
of
The
Open
Group
in
the
United
States
and
other
countries.
Other
company,
product,
and
service
names
may
be
trademarks
or
service
marks
of
others.
88
IBM
Tivoli
Business
Systems
Manager:
Introducing
the
Consoles

Index
Aaccess
Flash-based
dashboard
39
access
HTML
dashboard
39
accessibility
vii
dashboard
46
HTML
screen
reader
46
in
console
77
task
assistant
9
Web
console
37
Acrobat
Search
command
(for
library
search)
vi,
83
actionview
business
system
33
actions
menu
8
active
scripting
31
administrator
1,
3,
31
administrator
preferences,
set
12
administrator,
report
1
administrator,
super
1
alertbatch
74
alert
filtering
21
alert
state
indicator
34
alert
state
report
55
alert
state
report,
global
55
alert,
take
ownership
24
alert,
yellow
8,
34
all
resources
view
2
auditory
indicator
45
auto
abend
indicator
9
auto
start
indicator
9
availability
report
52
Bbanner
area
4,
32
batchprocess
73
batch
job
73
batch
management
summary
74
batch
processmonitor
74
batch
schedule
74
batch
schedule
sethigh
level
74
bookssee
publications
v,
vi
business
impact
view
21
business
system
resource
impact
report
58
business
system
shortcut
indicator
9,
34
business
system
view
12
business
systems
view
5
Cchange
request
29
change
request
indicator
9
child
events
22
CICSclosed\disabled
70
closed\enabled
70
closed\unenabled
70
view
71
CICS
file
management
70
CICS
resource
70
CICS
start/stop
time
report
54
CICS
transaction
management
70
closed
status
24
column
order
18
commandsissue
DB2
68
issue,
IMS
69
console
5
overview
2
console
menu
5
console
preferences,
set
10,
12
console,
exit
29
console,
sign
off
29
console,
sign
on
3
console,
start
3
console,
Web
31
contest
menuexecutive
dashboard
45
conventionstypeface
viii
create
information
note
25
create
note
25
create
problem
note
25
critical
status
8,
34
critical
watch
list
33,
37
current
MVS
messages/exceptions
report
54
current
state
21,
22
customer
supportsee
Software
Support
84
Ddashboard
executive
39
HTML
46
HTML
screen
reader
46
IT
executive
39
sign
on
40
user
preferences
44
dashboard,
Flash-based
40
DB2
resource
67
deleted
source
indicator
9,
35
directory
names,
notation
ix
discoveryDB2
67
IMS
69
display
properties
36
Eedit
menu
8
educationsee
Tivoli
technical
training
vii
environment
variables,
notation
ix
error
message,
get
help
35
error
message,
getting
help
for
10
event
count
report
52
event
viewer
12
event
viewer,
notes
28
events
report
53
events,
view
37
exceptions
22
executive
1
executive
dashboard
39
context
menu
45
magnification
46
overview
2
service
status
details
43
sign
on
39
user
preferences
44
executive
dashboard
indicator
9
executive,
IT
1
exit
console
29
Ffile
managementCICS
70
filter
row,
show
18
filter,
HyperView
17
filter,
table
view
18
filters
37
filters,
recent
34
find
6,
33
find
resource
6,
33
fixes,
obtaining
83
Flash-based
dashboard
39,
40
Flash-based
dashboard,
access
39
full
ownership
indicator
9,
34
Ggeneral
shortcut
keys
77
green
status
34
green
status
indicator
8
Hhelp
6
help
menu
6
help,
see
task
assistant
5,
33
high
level
batch
schedule
set
74
HTMLdashboard
46
HTML
dashboard
39
access
39
HyperView
15
©
Copyright
IBM
Corp.
2004
89

Iicon
secondary
impact
42
icon
bar
42
impactnew
44
IMS
resource
69
in
maintenance
indicator
9,
34
index
for
searching
the
library
vi,
83
index,
message
35
index,
report
50
indicatoralert
state
34
indicator,
auto
abend
9
indicator,
auto
start
9
indicator,
business
system
shortcut
9,
34
indicator,
change
request
9
indicator,
deleted
source
9,
35
indicator,
executive
dashboard
9
indicator,
full
ownership
9,
34
indicator,
in
maintenance
9,
34
indicator,
ownership
9,
34
indicator,
problem
ticket
9,
34
indicator,
resource
8,
34
indicator,
status
8
information
centers,
searching
to
find
software
problem
resolution
83
information
note
23,
24
information
note,
create
25
Internet,
searching
to
find
software
problem
resolution
83
IP
backbone
65
IP
backbone
topology
64
IP
network
65
IP
segment
65
IP
subnet
65
IT
executive
1
IT
executive
dashboard
39
Jjob,
batch
73
Kkey
job
to
non-key
jobconvert
73
keyboard
accessibilitydashboard
46
keyboard
shortcut
keys
77
knowledge
bases,
searching
to
find
software
problem
resolution
83
Llibrary
search
(Acrobat
Search
command)
vi,
83
Mmanaged
resources
view
20
manualssee
publications
v,
vi
menu
6
actions
8
menu
(continued)console
5
edit
8
view
6
menu
bar
5
menu
shortcuts
79
menu,
search
6
menu,
service
41
message
index
35
meta
refresh
31
mini
service
icon
42,
43
more
detail,
topology
61
MVS
messages
and
exceptions
report
55
my
notes,
view
33
my
work
portfolio
32
Nnavigation
center
18
network
location
65
new
impacts
44
new
resources
report
56
newsgroups
viii
non-key
job
73
notationenvironment
variables
ix
path
names
ix
typeface
ix
noteclose
24
note
editor
25
note
properties
27
note,
create
25
note,
information
23,
24
note,
ownership
23,
24
note,
problem
23,
24
notes
23
notes
view
26
notes
view,
access
27
Oonline
publicationsaccessing
vi
open
event
ownership
report
54
open
workspace
6
operator
1,
3,
31
operator,
report
1
operator,
restricted
1
ordering
publications
vii
overviewconsole
2
executive
dashboard
2
reporting
system
2
Web
console
2
overview,
Tivoli
Business
Systems
Manager
console
1
ownership
indicator
9,
34
ownership
note
23,
24
Ppath
names,
notation
ix
physical
resource
events
report
57
physical
resource
open
event
count
report
56
physical
resource
open
event
ownership
report
58
physical
resource
tree
report
58
physical
resource,
definition
2
pollingDB2
68
IMS
69
port,
server
31
portfolio
32
portfolio
task
34
preferencesdashboard
44,
47
set
35
user
34
preferences,
administrator
12
preferences,
console
10,
12
preferences,
user
41
problem
determinationdescribing
problem
for
IBM
Software
Support
85
determining
business
impact
for
IBM
Software
Support
85
submitting
problem
to
IBM
Software
Support
85
problem
note
23,
24
problem
note,
create
25
problem
ticket
29
problem
ticket
indicator
9,
34
problem,
availability
34
process,
batch
73
properties
21
description
21
state
21
properties,
note
27
publications
v
accessing
online
vi
ordering
vii
Rrecent
filters
34
red
status
indicator
34
refresh
rate
44
reportalert
state
55
availability
52
business
system
resource
impact
58
CICS
start/stop
time
54
current
MVS
messages/exceptions
54
event
count
52
events
53
global
business
system
alert
state
55
historical
50
MVS
messages
and
exceptions
55
new
resources
56
open
event
ownership
54
physical
resource
events
57
physical
resource
open
event
count
56
physical
resource
open
event
ownership
58
physical
resource
tree
58
resource
class
events
58
resource
summary
54
resource
tree
54
select
51
90
IBM
Tivoli
Business
Systems
Manager:
Introducing
the
Consoles
report
(continued)shift
turnover
59
report
administrator
1
report
operator
1
report
template
index
50
report
templates
52
reporting
system
49
access
49
overview
2
sign
off
60
resourceDB2
67
IMS
69
resource
class
events
report
58
resource
indicator
8
resource
indicators
34
resource
properties
21
resource
summary
report
54
resource
tree
report
54
resource
type
2
resource,
definition
2
resource,
find
6,
33
resource,
storage
67
resources,
Web
console
36
restricted
operator
1,
3,
31
roleadministrator
1
executive
1
IT
executive
1
operator
1
report
administrator
1
report
operator
1
restricted
operator
1
super
administrator
1
roles
3,
31
router
65
Sscheduled
state
22
screen
readerHTML
dashboard
46
search
33
search
command,
Acrobat
(for
library
search)
vi,
83
search
menu
6
secondary
impact
icon
42
secondary
status
indicator
41
server
port
31
service
iconmini
43
service
menu
41
service
status
details
43
shift
turnover
report
59
shortcut
keysactions
menu
80
business
system
area
78
console
menu
79
console
menu
bar
79
edit
menu
80
filtering
in
tables
78
for
dialogs
78
general
77
help
menu
81
menu
79
search
menu
80
sorting
in
tables
78
shortcut
keys
(continued)topology
views
81
view
menu
80
show
filter
row
18
sign
off
console
29
sign
off,
reporting
system
60
sign
ondashboard
40
executive
dashboard
39
sign
on,
console
3
Software
Supportcontacting
84
describing
problem
for
IBM
Software
Support
85
determining
business
impact
for
IBM
Software
Support
85
submitting
problem
to
IBM
Software
Support
85
sort
data
17
sound
45
start
console
3
state,
current
21,
22
state,
scheduled
21,
22
status
bar
5,
33
status
iconsdisplay
45
status
indicator
8,
34
status
indicator,
green
8
status
indicator,
red
8
status
indicator,
yellow
8
status,
closed
24
status,
critical
8,
34
status,
red
34
status,
warning
8,
34
status,
yellow
8,
34
storage
resource
67
subnet
65
super
administrator
1,
3,
31
system
closed
24
Ttable
view
17
take
ownership
24
task
assistant
5,
9,
33,
35
accessibility
9
task
bar
5,
32
task
monitor
23
templatesreport
52
threshold
controls
21
timelocal
44
title
barexecutive
dashboard
40
Tivoli
Business
Systems
Manager
consoleoverview
1
Tivoli
Software
Information
Center
vi
Tivoli
technical
training
vii
tool
barexecutive
dashboard
41
topologybusiness
system
view
61
CICS
63
DB2
62
general
61
IMS
63
topology
(continued)IP
64
IP
backbone
64
more
detail
61,
62,
63
specialized
views
61
topology
view
18
topology
views
61
training,
Tivoli
technical
vii
transaction
management,
CICS
70
transaction
statusCICS
70
tree
view
14
type,
resource
2
typeface
conventions
viii
Uuser
preferences
34,
35,
41,
44
Vvariables,
notation
for
ix
viewHyperView
15
miscellaneous
34
my
notes
33
service
status
details
43
table
17
view
behavior
13
view
events
33
view
menu
6
view
resource
33
view,
business
impact
21
view,
business
system
12
view,
managed
resources
20
view,
notes
26
view,
topology
18
view,
tree
14
visual
indicator
44
Wwarning
status
8,
34
Web
console
31
overview
2
view
business
systems
33
Web
console
actionview
events
33
Web
console,
sign
on
31
windows
6
windows
menu
6
workspace
5
workspace,
open
6
Yyellow
status
8,
34
yellow
status
indicator
34
Index
91

92
IBM
Tivoli
Business
Systems
Manager:
Introducing
the
Consoles


����
Printed
in
USA
SC32-9086-00