t he m ost r enewable -...
TRANSCRIPT

T H E M O S T R E L I A B L E R E N E W A B L E
Q1 2017 Earnings Call May 11, 2017
1
FORWARD-LOOKING STATEMENTS
We would like to remind you that the information provided during this call, and in this presentation, may contain forward-looking statements relating to current expectations, estimates, forecasts and projections about future events that are forward-looking as
defined in the Private Securities Litigation Reform Act of 1995. These forward-looking statements generally relate to the company’s plans, objectives and expectations for future operations and are based on management’s current estimates and projections of
future results or trends. Actual future results may differ materially from those projected as a result of certain risks and uncertainties. Such statements are based on management's expectations as of May 11, 2017 and involve many risks and uncertainties that could
cause actual results to differ materially from those expressed or implied in these forward-looking statements. Important factors that could cause actual results to differ materially from the company's expectations are set in our most recent Form 10-K filed with the
SEC at www.sec.gov.
During the call, and in this presentation, we will present non-GAAP financial measures such as EBITDA, adjusted EBITDA, and adjusted Net Income. Reconciliation to the most directly comparable GAAP measures and management’s reasons for presenting
such information is set forth in the press release that was issued last night. Because these measures are not calculated in accordance with U.S. GAAP, it should not be considered in isolation from our financial statements prepared in accordance with
GAAP. All share numbers have been adjusted for the 1-for-6 share consolidation in November 2016.
The company does not assume the obligation to update any forward-looking statement.All financial information presented in U.S. dollars unless otherwise indicated.
2

DENNIS GILLES, CEO
AGENDA
INTRODUCTION: DENNIS GILLES, CEO
FINANCIAL SUMMARY: KERRY HAWKLEY, CFO
OPS/DEVELOPMENT UPDATE: DOUGLAS GLASPEY, PRESIDENT & COO
SUMMARY & GUIDANCE: DENNIS GILLES, CEO
EXPLPLCEPPLAPLLLENT PIPELINE OF DEVELOPMENT PROJECTS LPLQ&A
3

INCREASED OUTPUT AT RAFT RIVER
ANNOUNCED CEO UPDATE AND FORMATION OF EXECUTIVE COMMITTEE
18TH QUARTER OF POSITIVE CASH FLOW FROM OPERATIONS & EBITDA
INCREASED EBITDA AND NET INCOME ATTRIBUTABLE TO USG, YOY
MAJOR HIGHLIGHTS
EXPANDED THE BOARD OF DIRECTORS TO EIGHT MEMBERS
COMPANY REAFFIRMS FULL-YEAR 2017 GUIDANCE4

F I N A N C I A LS U M M A R Y
5

BALANCE SHEET
March 31, 2017 December 31, 2016
TOTAL ASSETS $240,499,848 $243,424,332
TOTAL LIABILITIES $109,624,343 $111,866,294
NET STOCKHOLDERS’ EQUITY $105,754,262 $104,978,048
NON-CONTROLLING INTERESTS $25,121,243 $26,579,990
SHARES OUTSTANDING 19,039,435 18,970,445
6

STATEMENT OF OPERATIONS
($M) Q1 2017 Q1 2016REVENUE 8.44 8.50
PLANT OPERATING EXPENSES 4.58 3.98CORPORATE ADMINISTRATION 0.30 0.35PROFESSIONAL AND MGMT. FEES 0.15 1.06
INTEREST EXPENSE 1.19 0.93
NET INCOME BEFORE TAXES 1.26 1.28
INCOME TAX EXPENSE 0.14 0.09
NET INCOME ATTRIBUTABLE TO USG 0.26 0.15
7

STATEMENT OF CASH FLOWS
3 Months Ending March 31
2017 2016BEGINNING CASH BALANCE $15,287,144 $8,654,375
CASH GENERATED BY OPERATIONS $2,941,228 $5,003,699
INVESTING ACTIVITIES ($780,276) ($1,612,056)
FINANCING ACTIVITIES ($4,379,118) ($4,614,416)
ENDING CASH BALANCE $13,068,978 $7,431,602
8

O P E R AT I N GPOWER PLANTS
9

Fleet-wide Total 3 Months Ending Mar. 312017 2016
AVAILABILITY*
MEGAWATT HOURS
93.7%
89,613
98.9%
93,788
10
*excluding planned maintenance hours
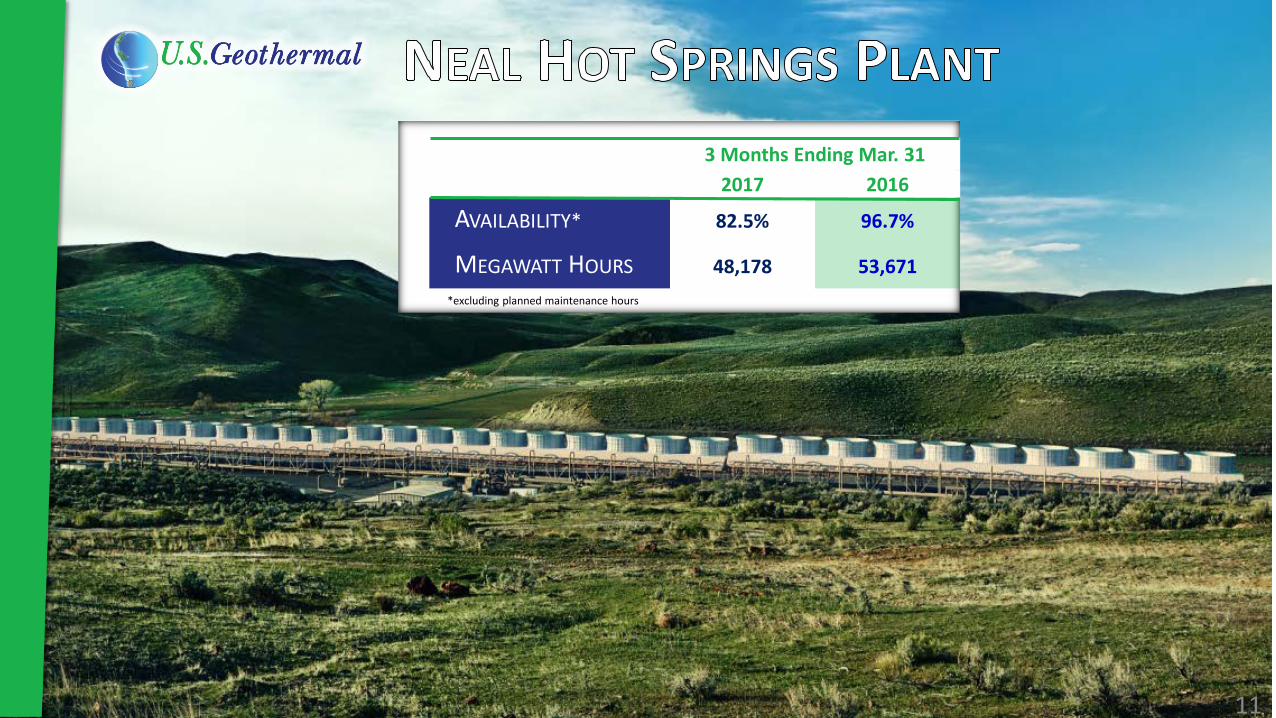
3 Months Ending Mar. 312017 2016
AVAILABILITY* 82.5% 96.7%
MEGAWATT HOURS 48,178 53,671
11
*excluding planned maintenance hours

3 Months Ending Mar. 312017 2016
AVAILABILITY* 98.6% 99.4%
MEGAWATT HOURS 19,501 20,433
12
*excluding planned maintenance hours

3 Months Ending Mar. 312017 2016
AVAILABILITY* 100% 100%
MEGAWATT HOURS 21,934 19,684
13
*excluding planned maintenance hours

G R O W T HU P D AT E
San Emidio II Project
San Emidio I in background14

EXPAND OPERATING PROJECTS
• Converted idle injection well RRG-5 to production in Q1 = .71 MW net increase
• Upgrade injection pump late Q2 – early Q3 • Target generation increase 1.5 to 2 MW for
this phase of work• Review further wellfield modifications in Q3• 3MW annual average available under PPA• Increase revenue by $1.0 - $1.8 million/year
TOTAL OF UP TO 6 MW FROM EXPANDING EXISTING PROJECTS
RAFT RIVER: NEAL HOT SPRINGS:• Hybrid Cooling for summer months• Water from 2 wells = 250 gpm, enough for 1
unit.• Pursuing surface water rights for additional
water• Pilot unit for treatment of injection brine
continuing• 3 MW annual average available under PPA• Increase revenue by $2.5 – $3.0 million/year• Target Phase 1 complete: Q4-2017 with
startup in Q2-2018
15

DEVELOPMENT PROJECTS
• Turbine/generator supply contract being negotiated.
• Engineering and construction contractors selected.
• Transmission right of way under negotiation
• Advancing PPA negotiations
WGP GEYSERS SAN EMIDIO II• Preparing to start
deepening 3 wells in Q2• New resource report issued
expanding resource P90 @ 18.8 MW, P50 @ 47 MW
• Submitted application to BLM for up to 45 megawatt facility
• Transmission path under study with LGIA to be submitted before October
• Submitted EOI to German Development Fund for drilling grant
• Preparing USTDA grant application for feasibility study
• Plan to drill and test deeper resource in 2017
• RFP for power expected in 2017
EL CEIBILLO
16

STRONG Q1 PERFORMANCE
RELIABLE AND PREDICTABLE ANNUAL PERFORMANCE
NEW - $0.71 M PROPERTY TAX IMPACT TO GROSS PROFIT
KEY HIGHLIGHTS
EXTRAORDINARY MECHANICAL CHALLENGES - $0.83 M IMPACT
17
FINANCIAL SUMMARY
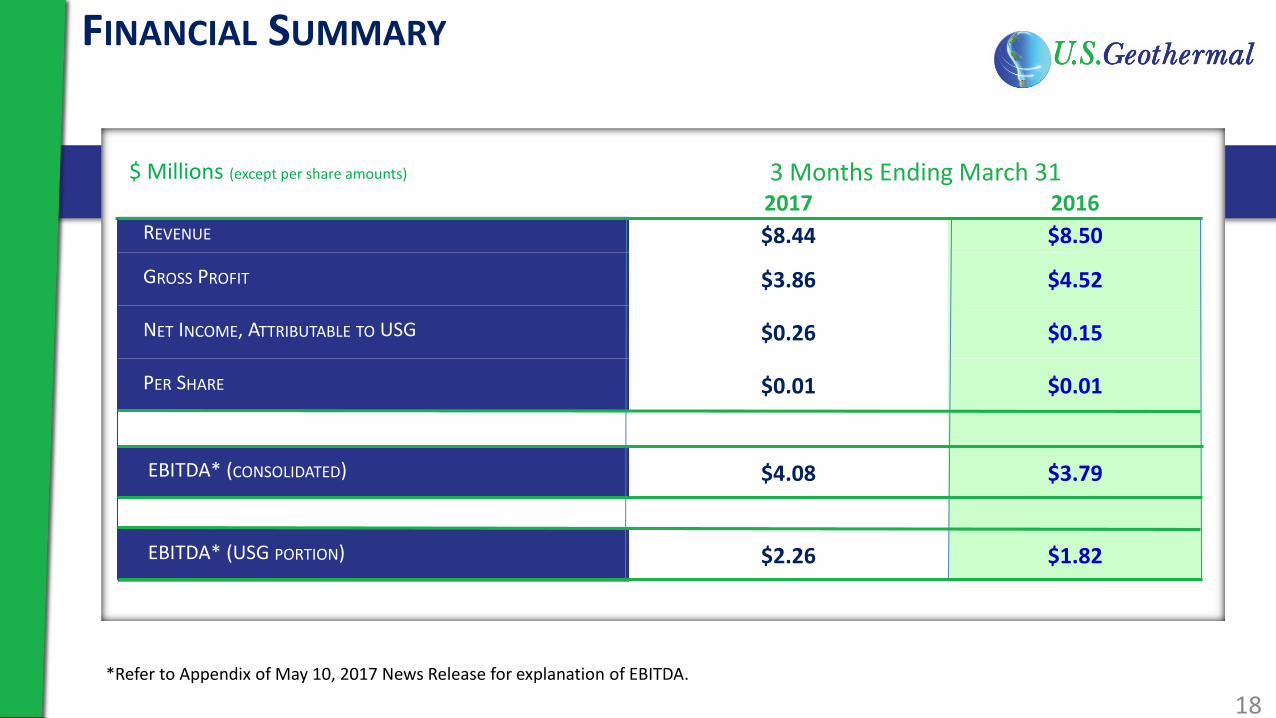
*Refer to Appendix of May 10, 2017 News Release for explanation of EBITDA.
3 Months Ending March 312017 2016
REVENUE $8.44 $8.50
GROSS PROFIT $3.86 $4.52
NET INCOME, ATTRIBUTABLE TO USG $0.26 $0.15
PER SHARE $0.01 $0.01
EBITDA* (CONSOLIDATED) $4.08 $3.79
EBITDA* (USG PORTION) $2.26 $1.82
18
$ Millions (except per share amounts)

CONSOLIDATED FINANCIAL SUMMARY AND 2017 GUIDANCE
*Adjusted to exclude discretionary exploration costs, non-cash stock compensation, write-off of discontinued development projects and other large non-recurring items**As Adjusted reflects Net Income before Tax and other large non-recurring items and is provided to support year over comparisons. Refer to Appendix of May 10, 2017 News Release for definition of Net Income, As Adjusted and Adjusted EBITDA.
RELIABLE AND PREDICTABLE PERFORMANCE
$ Millions 2014 2015 2016 2017 2017CONSOLIDATED
GUIDANCE(AS OF 1/23/17)
USG PORTIONGUIDANCE
(AS OF 1/23/17)
REVENUE 31.0 31.2 31.5 30-34 18-22
EBITDAADJUSTED* 17.2 17.6 17.1 15-19 9-12
EBITDA 14.9 16.4 15.0 14-18 8-10
NET INCOME, ASADJUSTED** 4.6 6.3 5.2 4-8 1-4
19

MARKET EVOLUTION
20
Community Choice Aggregators
Large Industrials
New Buyer Examples
Previous Buyer Examples
Public Utilities

POTENTIAL DEMAND GROWTH FOR RENEWABLES- PENDING LEGISLATION
21
Nevada• Proposed bill AB 206 would expand the current Nevada RPS from
target of 25% by 2025 to 30% by 2020, 50% by 2030, and 80% by 2040
California• Proposed bill SB-584 would expand the current California RPS from
50% by 2030 to 50% by 2025, and 100% by 2045
• Proposed bill AB-920 would mandate that a minimum of 20% of all renewable energy procured would come from baseload renewable energy

MARKET EVOLUTION – CCAS AND LARGE INDUSTRIALS
OUTLOOK FOR POWER PURCHASE AGREEMENTS
OUTLOOK FOR RENEWABLE ENERGY DEMAND INCREASING
ADDITIONAL HIGHLIGHTS
115 MW ADVANCE STAGE DEVELOPMENT & EXPANSION PROJECTS
R Q & A LPL
22

T H E M O S T R E L I A B L E R E N E W A B L E
NYSE MKT:HTM
WGP Geysers Project23