t he driving force in refractories - rhi magnesita › wp-content › uploads › 2019 › 04 ›...
TRANSCRIPT
Annual Report 2018
The driving force in refractories
RH
IMagnesita - The driving force in refractories - A
nnual Report 20
18
RHI Magnesita (the “Company” or “Group”) is quoted with a premium listing on the London Stock Exchange (symbol: RHIM) and is a constituent of the FTSE 250 index. For more information please visit: www.rhimagnesita.com
CONTENTS
02Strategic Report
102Financial Statements
04 Key financial and operating highlights06 RHI Magnesita at a glance08 Chairman’s statement10 Market overview14 Our business -
how we create value16 Our value chain explained18 Our strategic priorities20 CEO’s review22 Innovation26 Operational review34 Key performance indicators36 Financial review42 Risks, viability & internal controls48 Sustainability
104 Consolidated Statement of Financial Position
105 Consolidated Statement of Profit and Loss
106 Consolidated Statement of Comprehensive Income
107 Consolidated Statement of Cash Flows
108 Consolidated Statement of Changes in Equity
110 Notes to the Consolidated Financial Statements 2018
195 Independent Auditor’s Report
Other information203 Alternative performance
measures (“APMs”)204 Shareholder information
58Governance
60 Board of Directors64 Executive Management Team66 Chairman’s introduction to
Corporate Governance 67 Corporate Governance Report76 Nomination Committee Report78 Audit & Compliance
Committee Report80 Remuneration Committee Report84 Directors’ Remuneration Policy92 Annual Report on Remuneration
Our mission At RHI Magnesita, innovation takes place in extreme conditions. It is the materials, robotics, sensors, Big Data and machine learning that is transforming industry across the world. It is also the everyday problem-solving of all of our people, making processes quicker, products more cost-effective, and solutions and services more beneficial for our customers.
Our culture themes determine all our actions
¥Act customer-focused and innovatively ¥Have open decision-making in a respectful environment ¥Operate cross-functionally, collaboratively and pragmatically across the global organisation ¥Be performance driven and accountable
We are RHI Magnesita.The driving force.RHI Magnesita is the leading global supplier of high-grade refractory products, systems and solutions. With its high level of geographic diversification, focus on innovation and a vertically integrated value chain, from raw materials to refractory products and full performance-based solutions, RHI Magnesita serves customers around the world.
0 1
A N N U A L R E P O R T 2 0 1 8R H I M A G N E S I TA
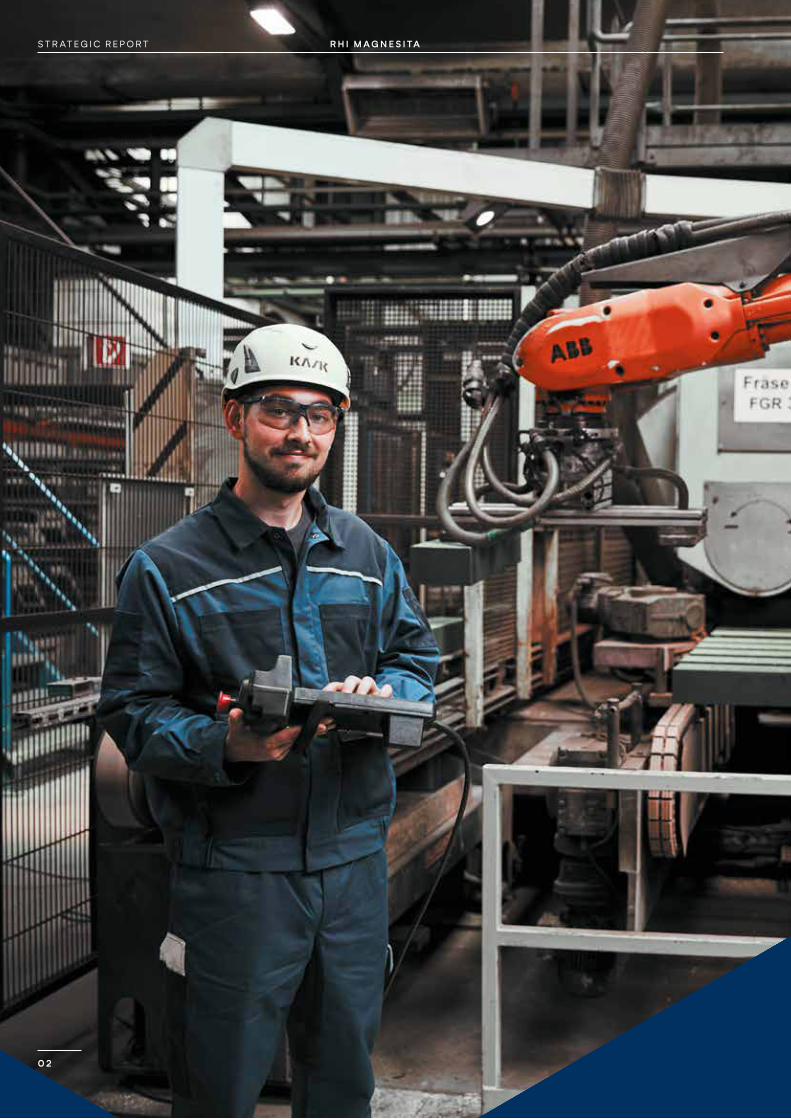
R H I M A G N E S I TAS T R AT E G I C R E P O R T
0 2
02Strategic Report
04 Key financial and operating highlights06 RHI Magnesita at a glance08 Chairman’s statement10 Market overview14 Our business -
how we create value16 Our value chain explained18 Our strategic priorities20 CEO’s review22 Innovation26 Operational review34 Key performance indicators36 Financial review42 Risks, viability & internal controls48 Sustainability
0 3
A N N U A L R E P O R T 2 0 1 8R H I M A G N E S I TA
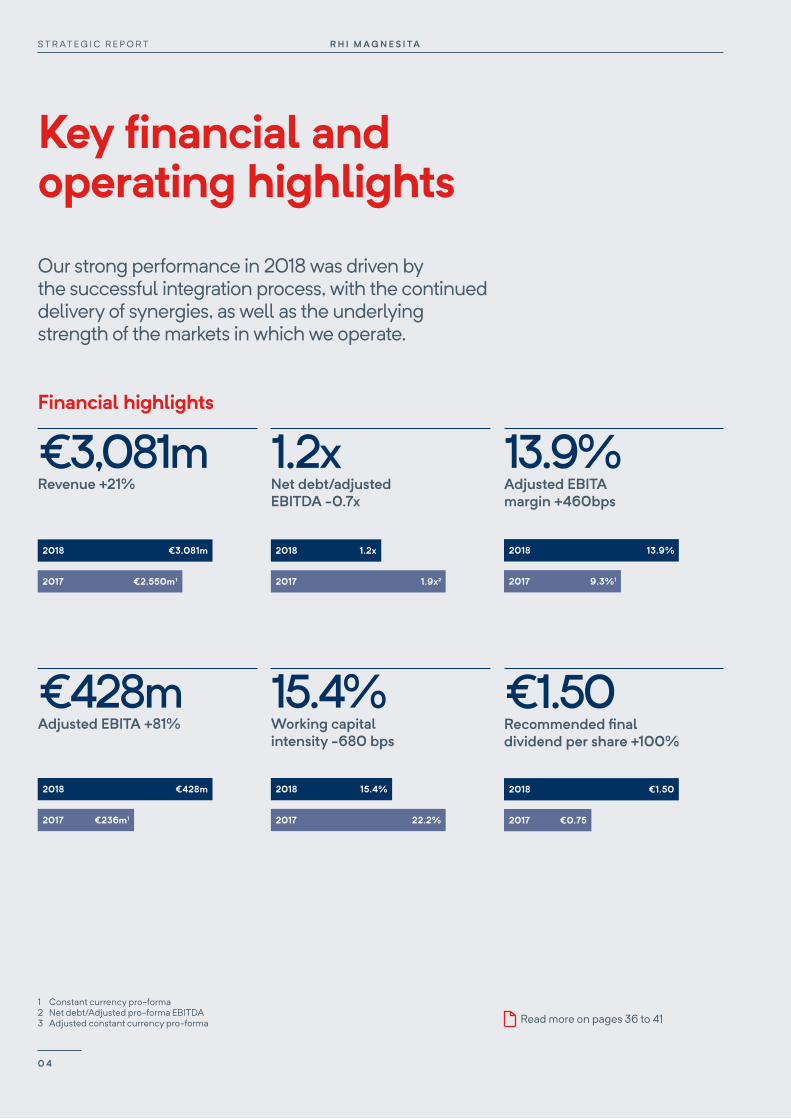
Key financial and operating highlights
Our strong performance in 2018 was driven by the successful integration process, with the continued delivery of synergies, as well as the underlying strength of the markets in which we operate.
1 Constant currency pro-forma 2 Net debt/Adjusted pro-forma EBITDA3 Adjusted constant currency pro-forma
€3,081mRevenue +21%
€428mAdjusted EBITA +81%
13.9%Adjusted EBITA margin +460bps
1.2xNet debt/adjusted EBITDA -0.7x
15.4%Working capital intensity -680 bps
€1.50Recommended final dividend per share +100%
2018
2017
€3,081m
€2,550m¹
2018
2017
13.9%
9.3%1
2018
2017
1.2x
1.9x2
2018
2017
€1.50
€0.75
2018
2017
15.4%
22.2%
2018
2017
€428m
€236m1
Financial highlights
Read more on pages 36 to 41
R H I M A G N E S I TAS T R AT E G I C R E P O R T
0 4
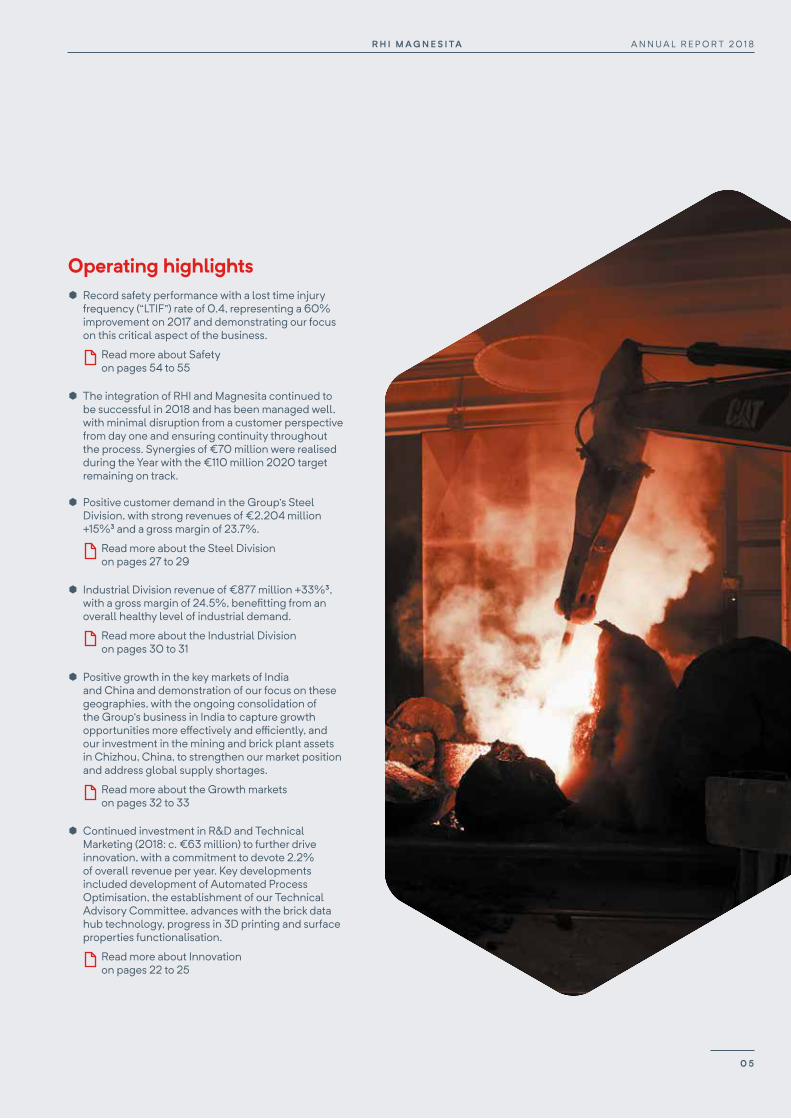
Operating highlights ¥ Record safety performance with a lost time injury
frequency (“LTIF”) rate of 0.4, representing a 60% improvement on 2017 and demonstrating our focus on this critical aspect of the business.
Read more about Safety on pages 54 to 55
¥ The integration of RHI and Magnesita continued to be successful in 2018 and has been managed well, with minimal disruption from a customer perspective from day one and ensuring continuity throughout the process. Synergies of €70 million were realised during the Year with the €110 million 2020 target remaining on track.
¥ Positive customer demand in the Group’s Steel Division, with strong revenues of €2,204 million +15%3 and a gross margin of 23.7%.
Read more about the Steel Division on pages 27 to 29
¥ Industrial Division revenue of €877 million +33%3, with a gross margin of 24.5%, benefitting from an overall healthy level of industrial demand.
Read more about the Industrial Division on pages 30 to 31
¥ Positive growth in the key markets of India and China and demonstration of our focus on these geographies, with the ongoing consolidation of the Group’s business in India to capture growth opportunities more effectively and efficiently, and our investment in the mining and brick plant assets in Chizhou, China, to strengthen our market position and address global supply shortages.
Read more about the Growth markets on pages 32 to 33
¥ Continued investment in R&D and Technical Marketing (2018: c. €63 million) to further drive innovation, with a commitment to devote 2.2% of overall revenue per year. Key developments included development of Automated Process Optimisation, the establishment of our Technical Advisory Committee, advances with the brick data hub technology, progress in 3D printing and surface properties functionalisation.
Read more about Innovation on pages 22 to 25
0 5
A N N U A L R E P O R T 2 0 1 8R H I M A G N E S I TA
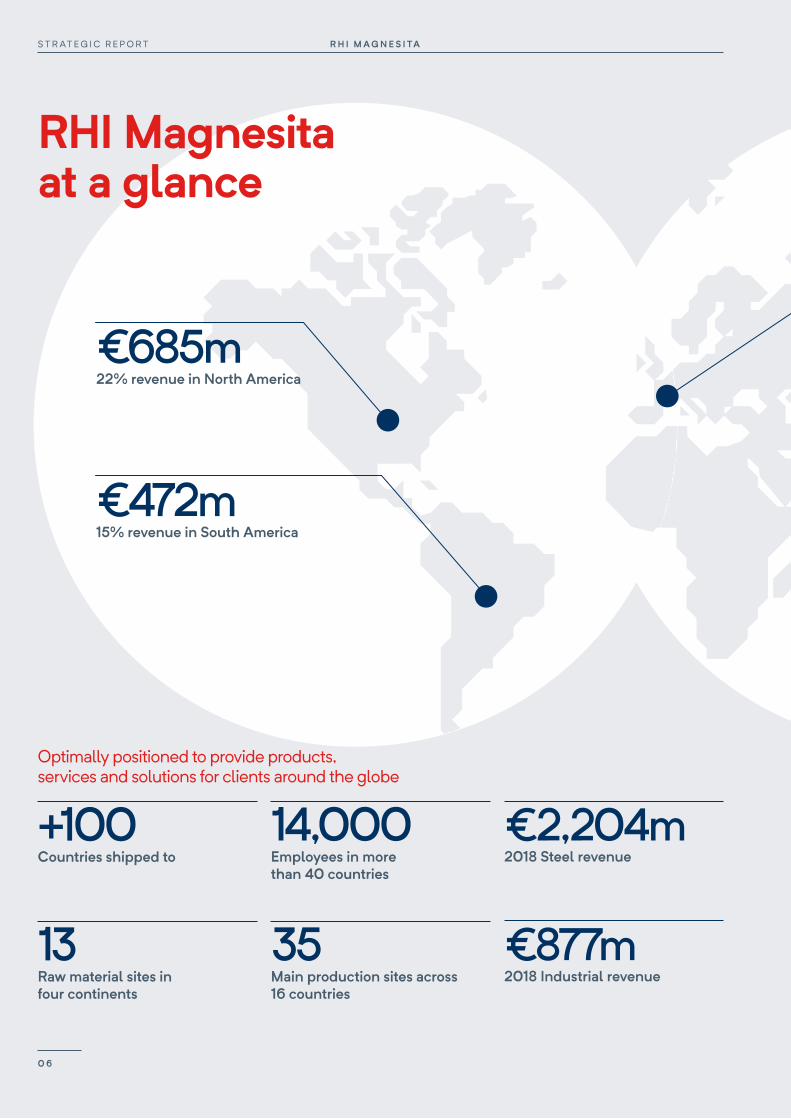
+100Countries shipped to
14,000Employees in more than 40 countries
13Raw material sites in four continents
35Main production sites across 16 countries
€2,204m2018 Steel revenue
RHI Magnesita at a glance
€877m2018 Industrial revenue
€685m22% revenue in North America
€472m15% revenue in South America
Optimally positioned to provide products, services and solutions for clients around the globe
R H I M A G N E S I TAS T R AT E G I C R E P O R T
0 6

Compelling investment caseClear strategy and strong competitive position
¥ 15% global market share (30% ex-China); leadership in Americas, Europe and Middle East with broad value-added solution offering
¥ Opportunity to develop and further leverage technology across regions and portfolio
¥ Growth in key markets of India and China ¥ Highest level of vertical integration in the
industry with unique mineral sources and 50%+ self-sufficiency in all raw materials
Rapid deleveraging and strong cash generation
¥ Strong cash flow from operating business supported by synergies and organic growth opportunities
¥ Rapid deleveraging since merger; net debt to EBITDA reduced to 1.2x
¥ Capital flexibility to pursue both growth and shareholder returns
Significant synergy delivery and potential ¥ €70 million synergies in 2018 and €110 million
in synergies to be achieved by 2020 ¥ Additional “below the line” opportunities in
working capital and tax ¥ Cost saving potential beyond synergies from
further initiatives
Refractory products are used in all the world’s high-temperature industrial processes, exceeding 1,200°C in a wide range of industries including steel, cement, non-ferrous metals and glass.As global leader, we aim to use our resources, innovation, worldwide presence and expertise to drive change in the refractory industry for the benefit of our customers and all our stakeholders.
SteelOur Steel Division provides its customers with a broad range of customised solutions and comprehensive packages for steel production, consisting of refractories (basic and non-basic mixes and bricks), machinery, flow control systems, and our solutions offering.
Read more on pages 27 to 29
IndustrialOur Industrial Division provides refractory solutions for the cement, lime, non-ferrous metals and glass industries as well as the environment, energy and chemicals (“EEC”) sector, providing a wide range of services required by the complex demands of its customers.
Read more on pages 30 to 31
€608m20% revenue in Asia Pacific
€437m14% revenue in MEA CIS
€880m29% revenue in Europe
0 7
A N N U A L R E P O R T 2 0 1 8R H I M A G N E S I TA

Chairman’s statement
My letter in the 2017 Annual Report was written only two months after your Company was listed on the Premium Segment of the London Stock Exchange. I remarked then that the formation of RHI Magnesita was transformative, not only in itself, but in the global refractory industry in which it operates. I also highlighted the importance of 2018 - the Company’s first full year - in using its competitive advantage to set the pace of innovation and progress in our industry and to deliver the best for both our customers and our shareholders.
I trust that our 2018 Annual Report outlines the strong start we have made in our first full year since the formation of RHI Magnesita, and that our all-round progress demonstrates that the Group has made a very good start and is on track in its development, enabling us to continue delivering on our strategy.
Our cultureThe importance of culture, particularly in the context of a merger, cannot be overstated, and 2018 has seen the Company make considerable strides forward in terms of further defining, developing and embedding our cultural values. As part of these efforts, over 2,200 employees worldwide have now undergone training to become “culture champions”.
In 2018, employee surveys were carried out which, I am delighted to note, demonstrate that we are on the right path in terms of living our values. Feedback received via this survey is a valuable tool for the Board and leadership team as we continue to shape our future.
Our strategic prioritiesIn 2018, we further refined our strategic priorities and have identified four pillars which will support the Company’s long-term growth and sustainability.
HERBERT CORDTCHAIRMAN
€1.502018 dividend per share proposed
R H I M A G N E S I TAS T R AT E G I C R E P O R T
0 8
nature of the business, but we also have certain targets in place to further improve the balance of nationalities.
Board and Management team appointments The Board has been further strengthened by the proposed appointment of two Non-Executive Directors - Fiona Paulus and Janet Ashdown. In April, our new CFO, Ian Botha, will be joining the Executive Management Team (“EMT”) and Board. The composition of the EMT was complemented during the Year by the appointment of Jacqueline Knox as General Counsel & Company Secretary and post-Year end, Gustavo Franco as Chief Sales Officer (“CSO”). Finally, the Group has also established a dedicated Investor Relations team in London.
Read more about the Board and Management on pages 60 to 65
Returns to shareholdersUnderpinned by the strong performance of the business and its strong annual cash generation, the Board has considered the long-term dividend policy in the context of its capital allocation strategy.
For 2018, the Board has recommended a final dividend of €1.50 per share for the full financial year, equating to an increase of 100% over the previous year. This represents a dividend cover of 3.5x adjusted earnings per share.
Going forward, the Board’s dividend policy will be to progressively increase ordinary dividends and to target a dividend cover of less than 3.0x adjusted earnings over the medium term. Dividends will be paid on a semi-annual basis with one third of the prior year’s full year dividend being paid at the interim.
Thank youOn behalf of the Board, I would like to express our sincere gratitude to our people for their continued efforts to create value for all our stakeholders.
HERBERT CORDTCHAIRMAN
These are: people, business model, markets and competitiveness and they are covered in detail on pages 18 and 19.
Focus on sustainability The Group joined the UN Global Compact in 2018, signalling our ongoing focus on sustainability. In light of the world’s fast-growing population, climate change pressures and resource scarcity, we must ensure the long-term sustainability of our business and communities in which we operate, while working within the constraints of the planet.
From climate change and pollution to gender diversity and safety, we are addressing the topics that are most material to us and our stakeholders. We have established our first set of sustainability targets and report on our progress on pages 48 to 57.
We are working to drive progress in our business in the areas of environment, human rights, labour and anti-corruption, as well as supporting societal goals. To this end, we have set up new governance structures, targets and programmes. Our new Board-level Sustainability Committee will oversee the Group’s approach, ensuring that we meet our commitments to the UN Global Compact.
The importance of diversityDiversity is vital to business success in the 21st century and a diverse workforce, leadership team and Board support an invaluable broadening of thought and opinion. Our initial focus is to build gender diversity, with a target to achieve a minimum of 33% of female representation on our Board and senior leadership team. I am delighted by the proposed appointment of two new female directors to our Board.
Whilst we have seen encouraging progress in the gender diversity of our Board and senior leadership, we have more work to do in order to achieve our targets. Diversity goes beyond gender, of course, and we will work on other aspects to build the diversity of our Company with regards to skills, age and nationality, which is vital to our long-term success. Our Company already enjoys significant diversity of backgrounds, given the global
Key governance actions in 2018
¥ Establishment of the Corporate Sustainability Committee
¥ Development of an enhanced Board and Board Committee structure
¥ Achieving a greater level of female representation on the Board and EMT
For more, see page 66
0 9
A N N U A L R E P O R T 2 0 1 8R H I M A G N E S I TA
Demand for our refractory solutions is based on those industries requiring advanced heat-resistant materials for their production processes; being predominantly steel, cement/lime, non-ferrous metals, glass and the EEC industries.
In the long term, demand for refractories is driven by the production volumes of these industries and, therefore, demand for their end products is the central driver of our business.
Our key demand drivers are underpinned by technology and innovationA shift in customer demand towards more integrated offerings is observable, with an intensifying demand for a breadth of products covering the full refractory portfolio, as well as an increased requirement for overarching services and solutions.
Industrial processes are becoming more digitalised and reliant on technology, presenting a significant opportunity for innovation to derive benefit from this trend.
Increasing pressure from environmental regulations creates the demand for efficient products and processes that can minimise negative impacts. Forward thinking R&D capacity is vital to offer solutions to these issues.
There is a mounting focus amongst our customers on quality; this in turn requires innovation and advancements in refractory products and processes.
Our strategy RHI Magnesita has a significant opportunity to redefine the customer model and solutions offering beyond conventional refractory products and services, towards integrated systems that cover machinery, robotics, automation, sensors, connectivity, Big Data, Artificial Intelligence (“AI”) and digitalisation.
One of the fundamental drivers of our business model and strategy bases itself on our internal expertise in innovative technologies and digitalisation, enabling us to provide inventive solutions and industry-leading services to our customers. Our overall R&D capabilities for the full refractories portfolio are at the forefront of the industry and we are committed to the development of products and services which enable energy and cost efficiency.
These are all key areas of focus which underpin our goal of providing value-driving, customer-focused business models which will enhance our competitiveness and further consolidate our position in the industry.
Read more about Innovation on pages 22 to 25
Market overview
R H I M A G N E S I TAS T R AT E G I C R E P O R T
1 0
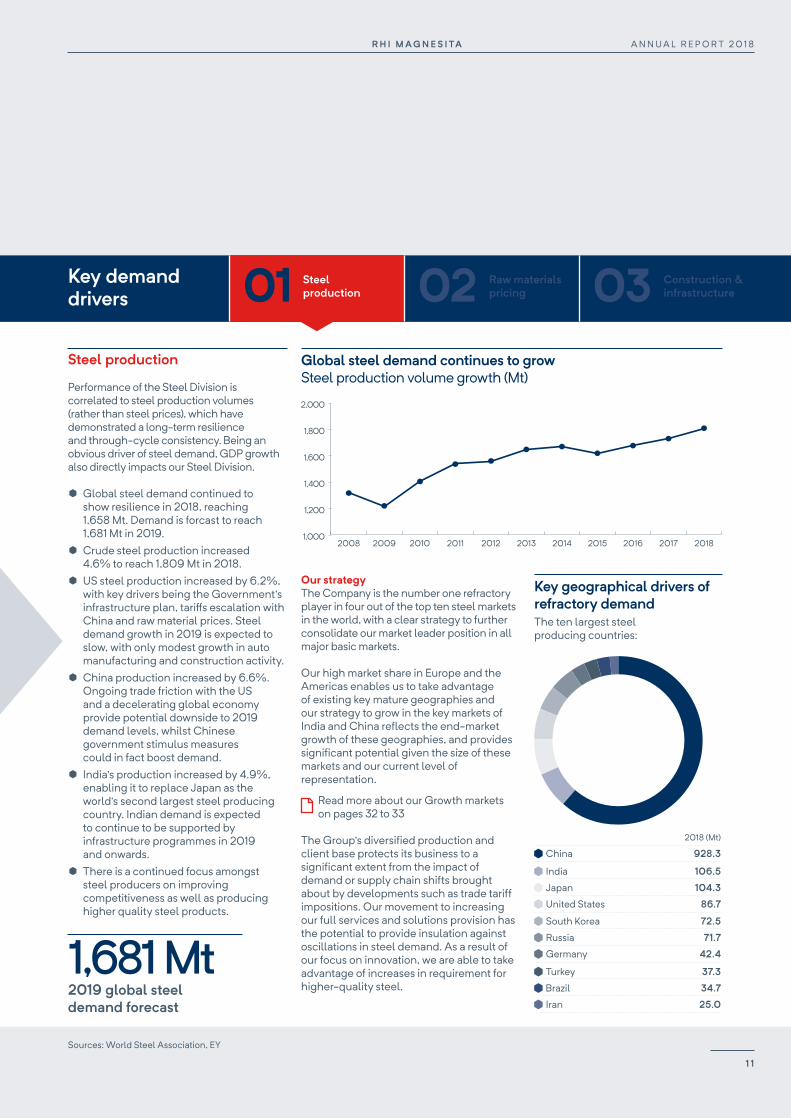
Steel production
Performance of the Steel Division is correlated to steel production volumes (rather than steel prices), which have demonstrated a long-term resilience and through-cycle consistency. Being an obvious driver of steel demand, GDP growth also directly impacts our Steel Division.
¥ Global steel demand continued to show resilience in 2018, reaching 1,658 Mt. Demand is forcast to reach 1,681 Mt in 2019.
¥ Crude steel production increased 4.6% to reach 1,809 Mt in 2018.
¥ US steel production increased by 6.2%, with key drivers being the Government’s infrastructure plan, tariffs escalation with China and raw material prices. Steel demand growth in 2019 is expected to slow, with only modest growth in auto manufacturing and construction activity.
¥ China production increased by 6.6%. Ongoing trade friction with the US and a decelerating global economy provide potential downside to 2019 demand levels, whilst Chinese government stimulus measures could in fact boost demand.
¥ India’s production increased by 4.9%, enabling it to replace Japan as the world’s second largest steel producing country. Indian demand is expected to continue to be supported by infrastructure programmes in 2019 and onwards.
¥ There is a continued focus amongst steel producers on improving competitiveness as well as producing higher quality steel products.
Our strategy The Company is the number one refractory player in four out of the top ten steel markets in the world, with a clear strategy to further consolidate our market leader position in all major basic markets.
Our high market share in Europe and the Americas enables us to take advantage of existing key mature geographies and our strategy to grow in the key markets of India and China reflects the end-market growth of these geographies, and provides significant potential given the size of these markets and our current level of representation.
Read more about our Growth markets on pages 32 to 33
The Group’s diversified production and client base protects its business to a significant extent from the impact of demand or supply chain shifts brought about by developments such as trade tariff impositions. Our movement to increasing our full services and solutions provision has the potential to provide insulation against oscillations in steel demand. As a result of our focus on innovation, we are able to take advantage of increases in requirement for higher-quality steel.
Key geographical drivers of refractory demandThe ten largest steel producing countries:
Global steel demand continues to grow Steel production volume growth (Mt)
1,000
1,200
1,400
1,600
1,800
2,000
20182017201620152014201320122011201020092008Steel production volume
Key demand drivers 01 02 03Steel
productionRaw materials pricing
Construction & infrastructure
1,681 Mt2019 global steel demand forecast
Sources: World Steel Association, EY
India
Japan
South Korea
United States
Russia
China
Turkey
Brazil
Iran
Germany
106.5
104.3
72.5
86.7
71.7
928.3
2018 (Mt)
37.3
34.7
25.0
42.4
1 1
A N N U A L R E P O R T 2 0 1 8R H I M A G N E S I TA
Key demand drivers
Market overviewcontinued
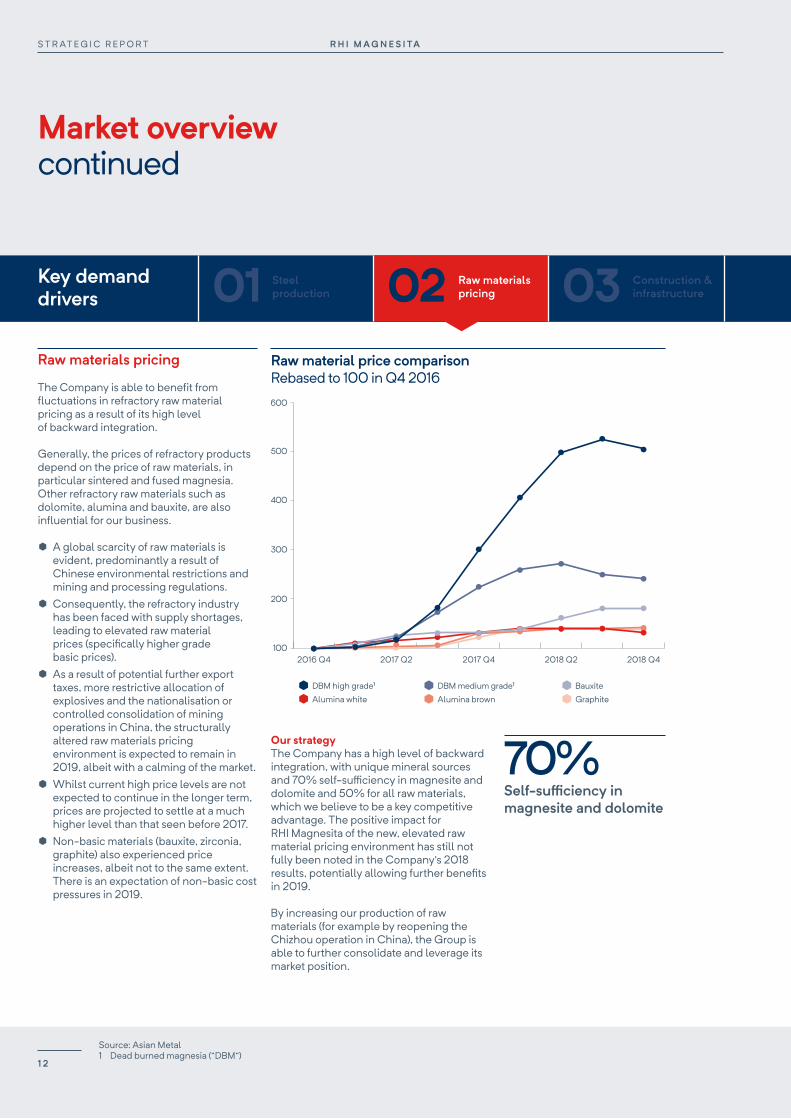
Raw materials pricing
The Company is able to benefit from fluctuations in refractory raw material pricing as a result of its high level of backward integration.
Generally, the prices of refractory products depend on the price of raw materials, in particular sintered and fused magnesia. Other refractory raw materials such as dolomite, alumina and bauxite, are also influential for our business.
¥ A global scarcity of raw materials is evident, predominantly a result of Chinese environmental restrictions and mining and processing regulations.
¥ Consequently, the refractory industry has been faced with supply shortages, leading to elevated raw material prices (specifically higher grade basic prices).
¥ As a result of potential further export taxes, more restrictive allocation of explosives and the nationalisation or controlled consolidation of mining operations in China, the structurally altered raw materials pricing environment is expected to remain in 2019, albeit with a calming of the market.
¥ Whilst current high price levels are not expected to continue in the longer term, prices are projected to settle at a much higher level than that seen before 2017.
¥ Non-basic materials (bauxite, zirconia, graphite) also experienced price increases, albeit not to the same extent. There is an expectation of non-basic cost pressures in 2019.
Our strategy The Company has a high level of backward integration, with unique mineral sources and 70% self-sufficiency in magnesite and dolomite and 50% for all raw materials, which we believe to be a key competitive advantage. The positive impact for RHI Magnesita of the new, elevated raw material pricing environment has still not fully been noted in the Company’s 2018 results, potentially allowing further benefits in 2019.
By increasing our production of raw materials (for example by reopening the Chizhou operation in China), the Group is able to further consolidate and leverage its market position.
Raw material price comparisonRebased to 100 in Q4 2016
70%Self-sufficiency in magnesite and dolomite
100
200
300
400
500
600
2018 Q42018 Q22017 Q42017 Q22016 Q4
Alumina white
DBM high grade1
Alumina brown
DBM medium grade1
Graphite
Bauxite
Source: Asian Metal1 Dead burned magnesia (“DBM”)
01 02 03Steel production
Raw materials pricing
Construction & infrastructure
R H I M A G N E S I TAS T R AT E G I C R E P O R T
1 2
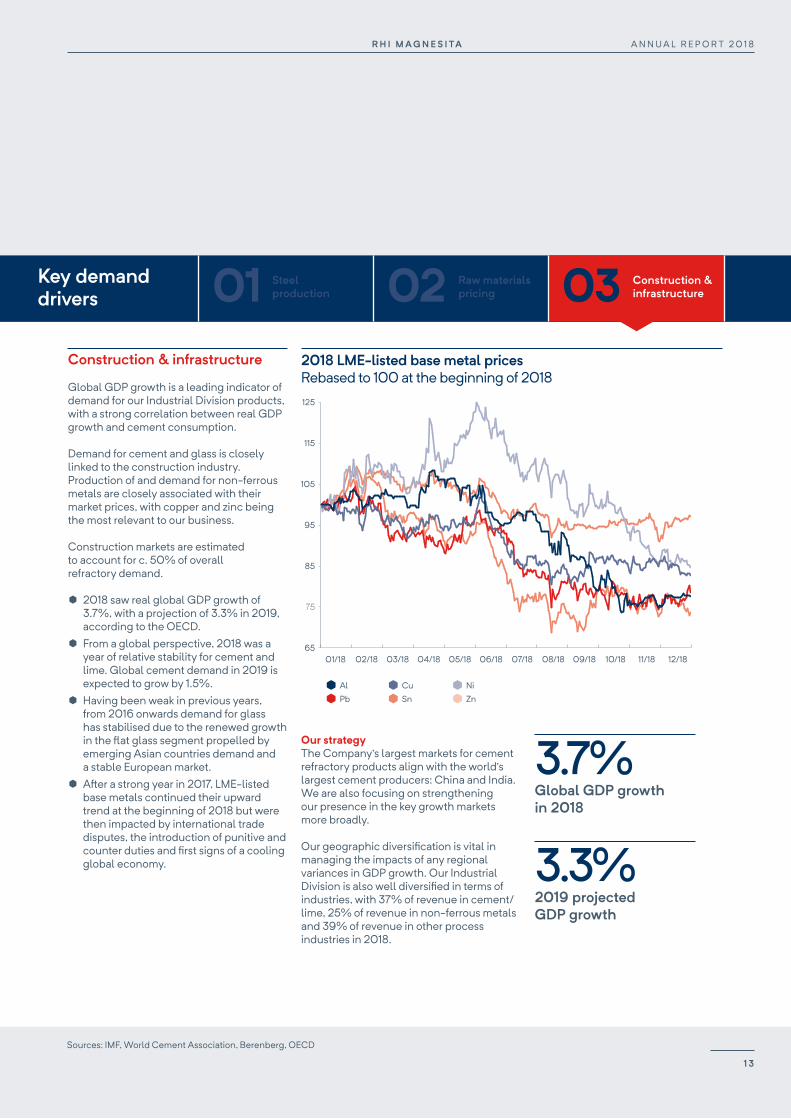
2018 LME-listed base metal pricesRebased to 100 at the beginning of 2018
Key demand drivers
65
75
85
95
105
115
125
Pb
Al
Sn
Cu
Zn
Ni
12/1808/18 09/18 10/18 11/1807/1806/1805/1804/1803/1802/1801/18
Construction & infrastructure
Global GDP growth is a leading indicator of demand for our Industrial Division products, with a strong correlation between real GDP growth and cement consumption.
Demand for cement and glass is closely linked to the construction industry. Production of and demand for non-ferrous metals are closely associated with their market prices, with copper and zinc being the most relevant to our business.
Construction markets are estimated to account for c. 50% of overall refractory demand.
¥ 2018 saw real global GDP growth of 3.7%, with a projection of 3.3% in 2019, according to the OECD.
¥ From a global perspective, 2018 was a year of relative stability for cement and lime. Global cement demand in 2019 is expected to grow by 1.5%.
¥ Having been weak in previous years, from 2016 onwards demand for glass has stabilised due to the renewed growth in the flat glass segment propelled by emerging Asian countries demand and a stable European market.
¥ After a strong year in 2017, LME-listed base metals continued their upward trend at the beginning of 2018 but were then impacted by international trade disputes, the introduction of punitive and counter duties and first signs of a cooling global economy.
Our strategy The Company’s largest markets for cement refractory products align with the world’s largest cement producers: China and India. We are also focusing on strengthening our presence in the key growth markets more broadly.
Our geographic diversification is vital in managing the impacts of any regional variances in GDP growth. Our Industrial Division is also well diversified in terms of industries, with 37% of revenue in cement/lime, 25% of revenue in non-ferrous metals and 39% of revenue in other process industries in 2018.
3.7%Global GDP growth in 2018
3.3%2019 projected GDP growth
Sources: IMF, World Cement Association, Berenberg, OECD
01 02 03Steel production
Raw materials pricing
Construction & infrastructure
1 3
A N N U A L R E P O R T 2 0 1 8R H I M A G N E S I TA
Our business - how we create value
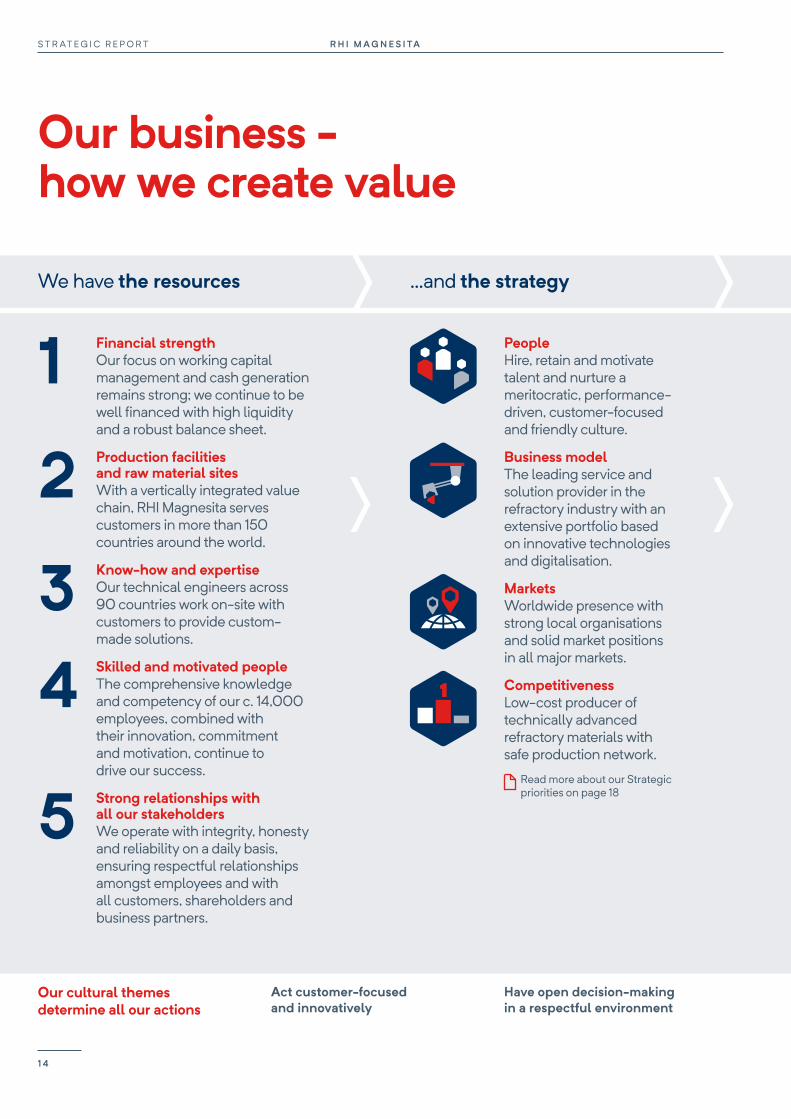
We have the resources
Act customer-focused and innovatively
Have open decision-making in a respectful environment
...and the strategy
1 Financial strengthOur focus on working capital management and cash generation remains strong; we continue to be well financed with high liquidity and a robust balance sheet.
2 Production facilities and raw material sitesWith a vertically integrated value chain, RHI Magnesita serves customers in more than 150 countries around the world.
3 Know-how and expertiseOur technical engineers across 90 countries work on-site with customers to provide custom-made solutions.
4 Skilled and motivated peopleThe comprehensive knowledge and competency of our c. 14,000 employees, combined with their innovation, commitment and motivation, continue to drive our success.
5 Strong relationships with all our stakeholdersWe operate with integrity, honesty and reliability on a daily basis, ensuring respectful relationships amongst employees and with all customers, shareholders and business partners.
PeopleHire, retain and motivate talent and nurture a meritocratic, performance- driven, customer-focused and friendly culture.
Business modelThe leading service and solution provider in the refractory industry with an extensive portfolio based on innovative technologies and digitalisation.
MarketsWorldwide presence with strong local organisations and solid market positions in all major markets.
CompetitivenessLow-cost producer of technically advanced refractory materials with safe production network.
Read more about our Strategic priorities on page 18
Our cultural themes determine all our actions
R H I M A G N E S I TAS T R AT E G I C R E P O R T
1 4
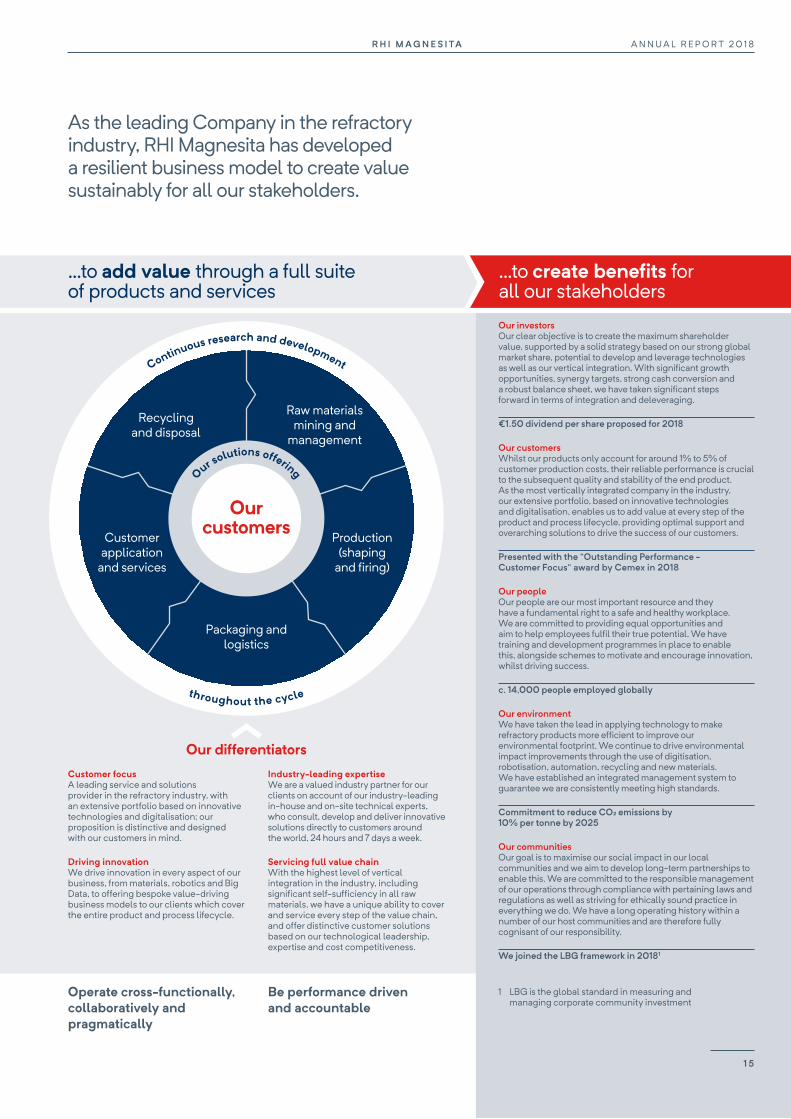
...to add value through a full suite of products and services
...to create benefits for all our stakeholdersOur investors Our clear objective is to create the maximum shareholder value, supported by a solid strategy based on our strong global market share, potential to develop and leverage technologies as well as our vertical integration. With significant growth opportunities, synergy targets, strong cash conversion and a robust balance sheet, we have taken significant steps forward in terms of integration and deleveraging.
€1.50 dividend per share proposed for 2018
Our customers Whilst our products only account for around 1% to 5% of customer production costs, their reliable performance is crucial to the subsequent quality and stability of the end product. As the most vertically integrated company in the industry, our extensive portfolio, based on innovative technologies and digitalisation, enables us to add value at every step of the product and process lifecycle, providing optimal support and overarching solutions to drive the success of our customers.
Presented with the “Outstanding Performance - Customer Focus” award by Cemex in 2018
Our people Our people are our most important resource and they have a fundamental right to a safe and healthy workplace. We are committed to providing equal opportunities and aim to help employees fulfil their true potential. We have training and development programmes in place to enable this, alongside schemes to motivate and encourage innovation, whilst driving success.
c. 14,000 people employed globally
Our environment We have taken the lead in applying technology to make refractory products more efficient to improve our environmental footprint. We continue to drive environmental impact improvements through the use of digitisation, robotisation, automation, recycling and new materials. We have established an integrated management system to guarantee we are consistently meeting high standards.
Commitment to reduce CO2 emissions by 10% per tonne by 2025
Our communities Our goal is to maximise our social impact in our local communities and we aim to develop long-term partnerships to enable this. We are committed to the responsible management of our operations through compliance with pertaining laws and regulations as well as striving for ethically sound practice in everything we do. We have a long operating history within a number of our host communities and are therefore fully cognisant of our responsibility.
We joined the LBG framework in 20181
Operate cross-functionally, collaboratively and pragmatically
Be performance driven and accountable
As the leading Company in the refractory industry, RHI Magnesita has developed a resilient business model to create value sustainably for all our stakeholders.
Continuous research and development
Our differentiatorsCustomer focusA leading service and solutions provider in the refractory industry, with an extensive portfolio based on innovative technologies and digitalisation; our proposition is distinctive and designed with our customers in mind.
Driving innovationWe drive innovation in every aspect of our business, from materials, robotics and Big Data, to offering bespoke value-driving business models to our clients which cover the entire product and process lifecycle.
Industry-leading expertiseWe are a valued industry partner for our clients on account of our industry-leading in-house and on-site technical experts, who consult, develop and deliver innovative solutions directly to customers around the world, 24 hours and 7 days a week.
Servicing full value chainWith the highest level of vertical integration in the industry, including significant self-sufficiency in all raw materials, we have a unique ability to cover and service every step of the value chain, and offer distinctive customer solutions based on our technological leadership, expertise and cost competitiveness.
Raw materials mining and
management
Packaging and logistics
Customer application
and services
Recycling and disposal
Production(shaping
and firing)
Our customers
Our solutions offering
throughout the cycle
1 LBG is the global standard in measuring and managing corporate community investment
1 5
A N N U A L R E P O R T 2 0 1 8R H I M A G N E S I TA
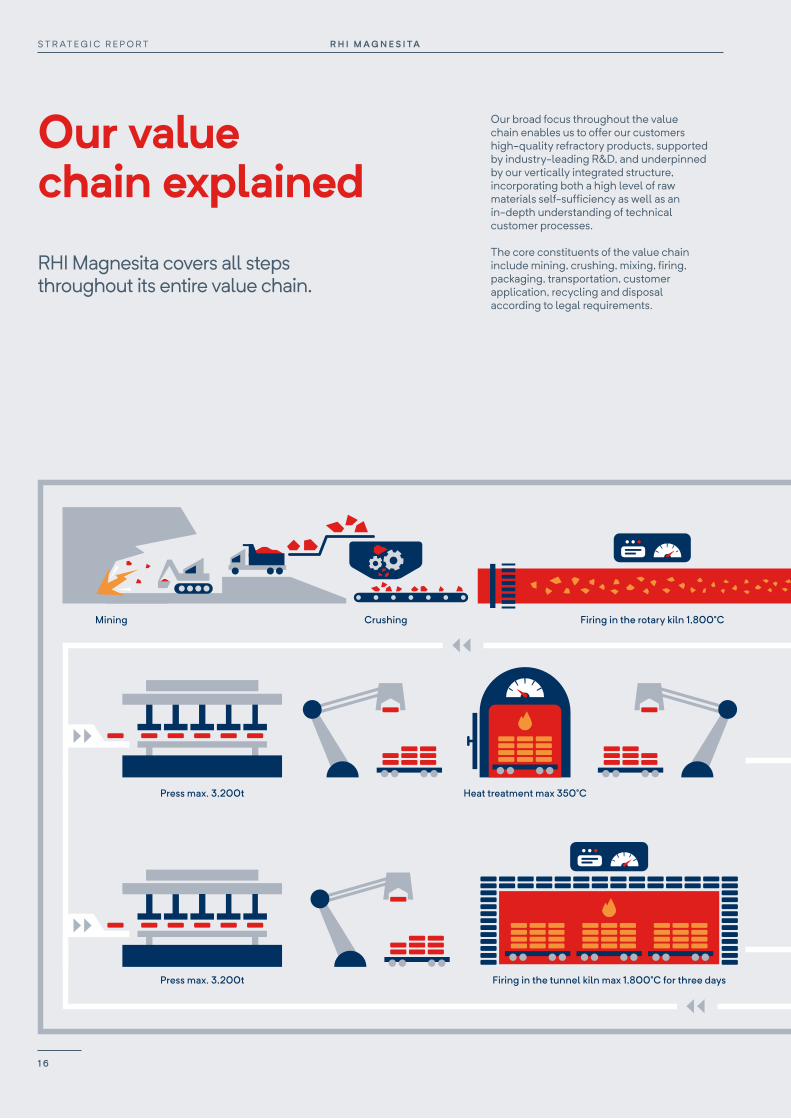
Mining Firing in the rotary kiln 1,800°CCrushing Mixing Packaging
LOGISTICS
UNSHAPED REFRACTORYPRODUCTS
Heat treatment max 350°CPress max. 3,200t
Press max. 3,200t
Quality assurance
Quality assuranceFiring in the tunnel kiln max 1,800°C for three days
Use: pig iron isturned into steel
Removal
CUSTOMERS: STEELINDUSTRY EXAMPLE
Installation in a LD converter
FIRED REFRACTORYPRODUCTS
Packaging
Packaging
UNFIRED REFRACTORYPRODUCTS
CONTINUOUS RESEARCH & DEVELOPMENT THROUGHOUT THE CYCLE
DisposalRecycling
Our broad focus throughout the value chain enables us to offer our customers high-quality refractory products, supported by industry-leading R&D, and underpinned by our vertically integrated structure, incorporating both a high level of raw materials self-sufficiency as well as an in-depth understanding of technical customer processes.
The core constituents of the value chain include mining, crushing, mixing, firing, packaging, transportation, customer application, recycling and disposal according to legal requirements.
RHI Magnesita covers all steps throughout its entire value chain.
Our value chain explained
R H I M A G N E S I TAS T R AT E G I C R E P O R T
1 6

Mining Firing in the rotary kiln 1,800°CCrushing Mixing Packaging
LOGISTICS
UNSHAPED REFRACTORYPRODUCTS
Heat treatment max 350°CPress max. 3,200t
Press max. 3,200t
Quality assurance
Quality assuranceFiring in the tunnel kiln max 1,800°C for three days
Use: pig iron isturned into steel
Removal
CUSTOMERS: STEELINDUSTRY EXAMPLE
Installation in a LD converter
FIRED REFRACTORYPRODUCTS
Packaging
Packaging
UNFIRED REFRACTORYPRODUCTS
CONTINUOUS RESEARCH & DEVELOPMENT THROUGHOUT THE CYCLE
DisposalRecycling
One of the basic materials for refractory products is magnesite, a mineral that we mine in both underground and surface mines. The magnesite ore is crushed and fired at 1,800°C in special kilns. In the burning process, the CO2 contained in the magnesite is released and, importantly, the material’s density is increased. The bricks and mixes are then mixed with binding agents, packaged and shipped as repair materials and speciality/technical additives are introduced to enhance performance capabilities or pressed in different sizes and shapes, employing a pressure of up to 3,200 tonnes. Depending on the application, the refractory bricks are subsequently either subjected to heat treatment at up to 350°C or fired at up to 1,800°C in tunnel kilns for three days. Unfired products are primarily used in the steel industry, whilst the main applications of fired products are in the cement, non-ferrous metals, process and mineral industries.
A key constituent of the Company’s ability to add value to our customers lies in our solutions offering, in which the refractory products are installed by our experienced employees. After their use in the customer’s production process, worn refractory linings are broken out and, if possible, reused as secondary raw materials. RHI Magnesita is therefore instrumental in the entire cycle from raw material production to recycling of finished products.
1 7
A N N U A L R E P O R T 2 0 1 8R H I M A G N E S I TA
Our strategic priorities
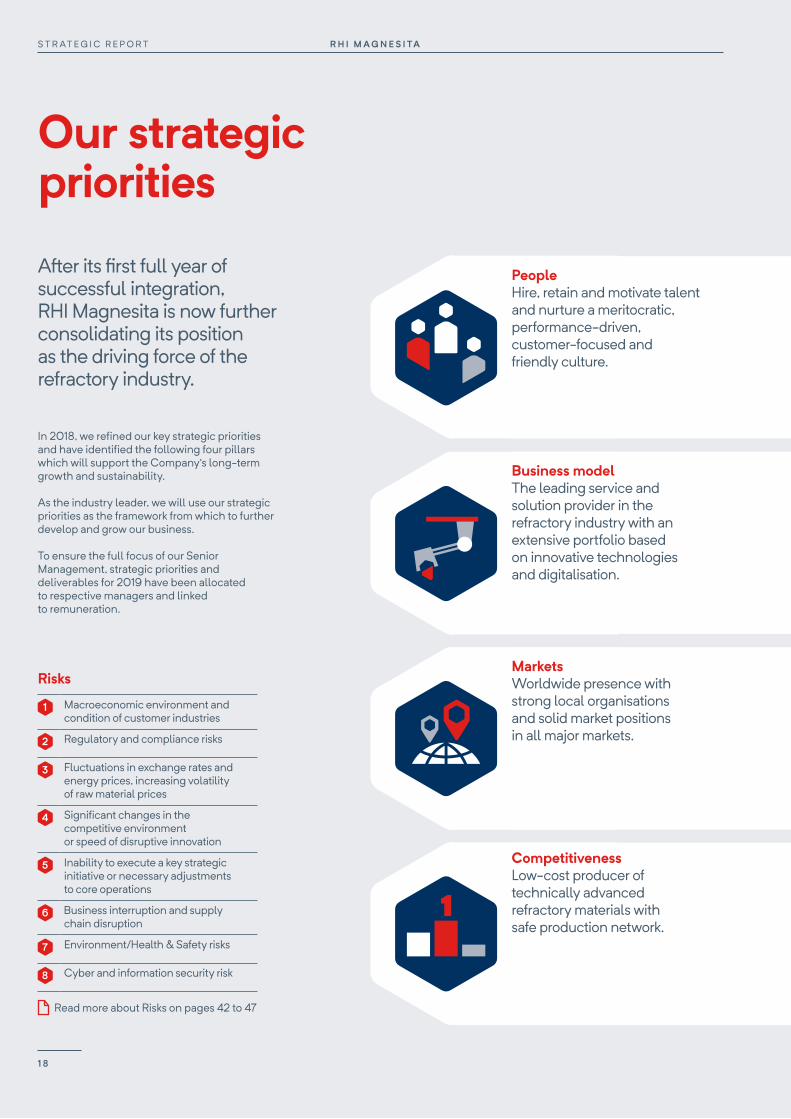
After its first full year of successful integration, RHI Magnesita is now further consolidating its position as the driving force of the refractory industry.
In 2018, we refined our key strategic priorities and have identified the following four pillars which will support the Company’s long-term growth and sustainability.
As the industry leader, we will use our strategic priorities as the framework from which to further develop and grow our business.
To ensure the full focus of our Senior Management, strategic priorities and deliverables for 2019 have been allocated to respective managers and linked to remuneration.
Risks
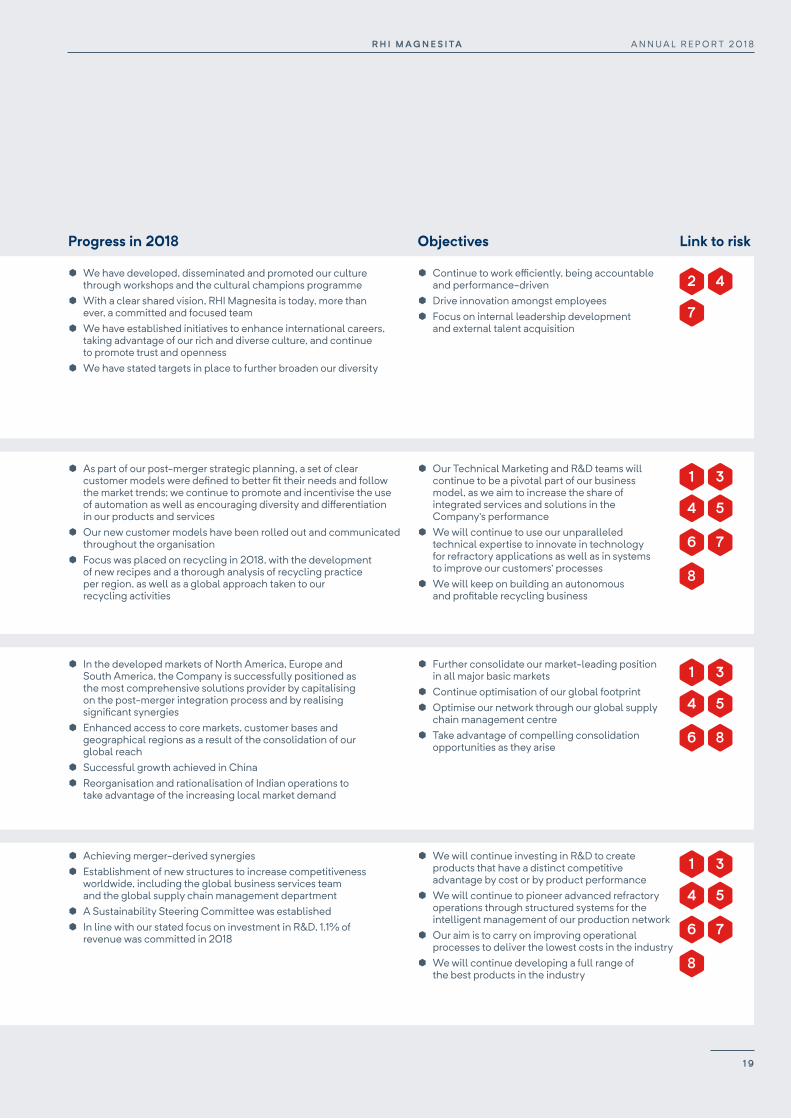
Progress in 2018 Objectives Link to risk
PeopleHire, retain and motivate talent and nurture a meritocratic, performance-driven, customer-focused and friendly culture.
¥ We have developed, disseminated and promoted our culture
through workshops and the cultural champions programme ¥ With a clear shared vision, RHI Magnesita is today, more than
ever, a committed and focused team ¥ We have established initiatives to enhance international careers,
taking advantage of our rich and diverse culture, and continue to promote trust and openness
¥ We have stated targets in place to further broaden our diversity
¥ Continue to work efficiently, being accountable and performance-driven
¥ Drive innovation amongst employees ¥ Focus on internal leadership development
and external talent acquisition
2
4
7
Business modelThe leading service and solution provider in the refractory industry with an extensive portfolio based on innovative technologies and digitalisation.
¥ As part of our post-merger strategic planning, a set of clear customer models were defined to better fit their needs and follow the market trends; we continue to promote and incentivise the use of automation as well as encouraging diversity and differentiation in our products and services
¥ Our new customer models have been rolled out and communicated throughout the organisation
¥ Focus was placed on recycling in 2018, with the development of new recipes and a thorough analysis of recycling practice per region, as well as a global approach taken to our recycling activities
¥ Our Technical Marketing and R&D teams will continue to be a pivotal part of our business model, as we aim to increase the share of integrated services and solutions in the Company’s performance
¥ We will continue to use our unparalleled technical expertise to innovate in technology for refractory applications as well as in systems to improve our customers’ processes
¥ We will keep on building an autonomous and profitable recycling business
1
3
4
5
6
7
8
MarketsWorldwide presence with strong local organisations and solid market positions in all major markets.
¥ In the developed markets of North America, Europe and South America, the Company is successfully positioned as the most comprehensive solutions provider by capitalising on the post-merger integration process and by realising significant synergies
¥ Enhanced access to core markets, customer bases and geographical regions as a result of the consolidation of our global reach
¥ Successful growth achieved in China ¥ Reorganisation and rationalisation of Indian operations to
take advantage of the increasing local market demand
¥ Further consolidate our market-leading position in all major basic markets
¥ Continue optimisation of our global footprint ¥ Optimise our network through our global supply
chain management centre ¥ Take advantage of compelling consolidation
opportunities as they arise
1
3
4
5
6
8
CompetitivenessLow-cost producer of technically advanced refractory materials with safe production network.
¥ Achieving merger-derived synergies ¥ Establishment of new structures to increase competitiveness
worldwide, including the global business services team and the global supply chain management department
¥ A Sustainability Steering Committee was established ¥ In line with our stated focus on investment in R&D, 1.1% of
revenue was committed in 2018
¥ We will continue investing in R&D to create products that have a distinct competitive advantage by cost or by product performance
¥ We will continue to pioneer advanced refractory operations through structured systems for the intelligent management of our production network
¥ Our aim is to carry on improving operational processes to deliver the lowest costs in the industry
¥ We will continue developing a full range of the best products in the industry
1
3
4
5
6
7
8
1 Macroeconomic environment and condition of customer industries
2 Regulatory and compliance risks
3 Fluctuations in exchange rates and energy prices, increasing volatility of raw material prices
4 Significant changes in the competitive environment or speed of disruptive innovation
5 Inability to execute a key strategic initiative or necessary adjustments to core operations
6 Business interruption and supply chain disruption
7 Environment/Health & Safety risks
8 Cyber and information security risk
Read more about Risks on pages 42 to 47
R H I M A G N E S I TAS T R AT E G I C R E P O R T
1 8
Progress in 2018 Objectives Link to risk
PeopleHire, retain and motivate talent and nurture a meritocratic, performance-driven, customer-focused and friendly culture.
¥ We have developed, disseminated and promoted our culture
through workshops and the cultural champions programme ¥ With a clear shared vision, RHI Magnesita is today, more than
ever, a committed and focused team ¥ We have established initiatives to enhance international careers,
taking advantage of our rich and diverse culture, and continue to promote trust and openness
¥ We have stated targets in place to further broaden our diversity
¥ Continue to work efficiently, being accountable and performance-driven
¥ Drive innovation amongst employees ¥ Focus on internal leadership development
and external talent acquisition
2
4
7
Business modelThe leading service and solution provider in the refractory industry with an extensive portfolio based on innovative technologies and digitalisation.
¥ As part of our post-merger strategic planning, a set of clear customer models were defined to better fit their needs and follow the market trends; we continue to promote and incentivise the use of automation as well as encouraging diversity and differentiation in our products and services
¥ Our new customer models have been rolled out and communicated throughout the organisation
¥ Focus was placed on recycling in 2018, with the development of new recipes and a thorough analysis of recycling practice per region, as well as a global approach taken to our recycling activities
¥ Our Technical Marketing and R&D teams will continue to be a pivotal part of our business model, as we aim to increase the share of integrated services and solutions in the Company’s performance
¥ We will continue to use our unparalleled technical expertise to innovate in technology for refractory applications as well as in systems to improve our customers’ processes
¥ We will keep on building an autonomous and profitable recycling business
1
3
4
5
6
7
8
MarketsWorldwide presence with strong local organisations and solid market positions in all major markets.
¥ In the developed markets of North America, Europe and South America, the Company is successfully positioned as the most comprehensive solutions provider by capitalising on the post-merger integration process and by realising significant synergies
¥ Enhanced access to core markets, customer bases and geographical regions as a result of the consolidation of our global reach
¥ Successful growth achieved in China ¥ Reorganisation and rationalisation of Indian operations to
take advantage of the increasing local market demand
¥ Further consolidate our market-leading position in all major basic markets
¥ Continue optimisation of our global footprint ¥ Optimise our network through our global supply
chain management centre ¥ Take advantage of compelling consolidation
opportunities as they arise
1
3
4
5
6
8
CompetitivenessLow-cost producer of technically advanced refractory materials with safe production network.
¥ Achieving merger-derived synergies ¥ Establishment of new structures to increase competitiveness
worldwide, including the global business services team and the global supply chain management department
¥ A Sustainability Steering Committee was established ¥ In line with our stated focus on investment in R&D, 1.1% of
revenue was committed in 2018
¥ We will continue investing in R&D to create products that have a distinct competitive advantage by cost or by product performance
¥ We will continue to pioneer advanced refractory operations through structured systems for the intelligent management of our production network
¥ Our aim is to carry on improving operational processes to deliver the lowest costs in the industry
¥ We will continue developing a full range of the best products in the industry
1
3
4
5
6
7
8
1 9
A N N U A L R E P O R T 2 0 1 8R H I M A G N E S I TA
CEO’s review
STEFAN BORGASCEO
and a gross margin of 23.7%. The Industrial Division reported revenue of €877 million, with a gross margin of 24.5%, benefitting from an overall healthy level of industrial demand.
In addition to capturing a significant proportion of this growth by virtue of the vertically integrated model, the Group has benefitted from its successful integration process, with the realisation of synergies and network optimisation supporting a significant step up in operating margins. Disappointingly, the Group experienced some operational and supply chain challenges in its European business during H2 which partially offset some of the margin gains. The root cause of these issues has been identified and improvement plans are in place. Management is confident that they will be substantially resolved in the current year.
Overall, the Group’s integrated model continues to derive benefit from a structurally changed pricing environment. However, it is our ability to protect margin improvements, regardless of the pricing environment, that really matters. This can already be demonstrated in our results and will be further underpinned by the Company’s solid growth strategy.
The Group has continued its successful integration during 2018, achieving synergies of €70 million, with a further €20 million expected in the current year, and remains on track to deliver €110 million during the financial year 2020. The combination of top-line growth, synergy implementation and our vertically integrated model has led to an adjusted EBITA margin of 13.9%, representing a 460 basis points improvement on 2017.
Read more in the Financial review on pages 36 to 41
Q How has the Group’s financial position evolved?
A The Company’s financial position continues to strengthen, with growth in operational cash flow generation, materially improved working capital intensity and a reduction in annualised interest expense, as a result of the refinancing carried out in 2018. This has enabled the Group to significantly reduce net debt to 1.2x adjusted EBITDA. A long-term dividend policy has also been approved with a 2018 final dividend of €1.50 per share recommended.
Read more in the Chairman’s statement on pages 8 to 9
Q Looking back at 2018, what has the Company achieved?
A This was our first full financial year as a new company and I am delighted by the significant amount that we have achieved. Underpinned by the strength of the markets in which we operate, we have reported very strong financial results, successfully delivered on our integration plans and benefitted from the synergies of the combination. Previous competitors have become colleagues and we are now working together to build the future of RHI Magnesita.
In 2018, RHI Magnesita has continued to consolidate its position as the driving force of the refractory industry and we have made good progress in setting the business on the right path to achieving its full potential. The Group achieved very strong results in its first full year, following the combination of RHI and Magnesita in 2017, with revenue growth of 21%, and an increase in adjusted EBITA of 81%. The growth in revenues, which exceeded that of the underlying steel and industrial markets, demonstrates the continuing demand for the Group’s breadth of technology, services and products. Positive customer demand was noted in the Steel Division in 2018, with strong revenues of €2,204 million
We expect to deliver modest organic revenue growth, continued synergy generation and further optimisation initiatives. In addition to this we expect further growth potential from acquisitions. We remain focused on driving margin improvement opportunities and strong cash flow generation, which will provide the foundation to support our capital allocation and dividend policy.
R H I M A G N E S I TAS T R AT E G I C R E P O R T
2 0
Q How is the Company maintaining its leadership position in terms of innovation
One of the fundamental drivers of our business model and strategy bases itself on our internal expertise in innovative technologies and digitalisation. The Group continues to drive innovation, with significant opportunities in the fields of automation, robotics and recycling, and aims to devote 2.2% of total revenues per year to R&D and Technical Marketing. Investment in R&D and Technical Marketing in 2018 was c. €63 million, representing 2% of revenues, marginally lower than the target as a result of foreign exchange movements and the merger combination process.
Read more about innovation on pages 22 to 25
Q How are you integrating sustainability into the business?
A Our intense focus on safety has already shown significant results, with a 60% improvement in our LTIF rate in 2018 to reach 0.4. However, we will not be complacent; nothing less than zero accidents is acceptable and therefore our focus on this important area will persist.
Read about our commitment to safety on pages 54 to 55
We are also working hard to reduce our environmental impacts, particularly given the urgency of climate change. In 2018, we made significant progress in recycling and I am excited to note that we will soon establish our first dedicated recycling facility.
Read about our commitment to the environment on pages 52 to 53
Our people are our most important asset and therefore their continuous development and motivation is vital to the future success of the business. We work hard to foster an environment in which our employees can follow their passions, innovate and progress. They are accountable for their targets and rewarded for performance. In 2018, we implemented a performance management system with the aim of encouraging our employees to reach their full potential. Diversity and inclusion are critical to the future success of our workforce and our Chairman discusses this further on page 9.
Read about our people on pages 54 to 57
Demonstrating our focus on sustainability the Group joined the UN Global Compact in 2018, showing its commitment to this important initiative.
Read about our commitment to sustainability on pages 48 to 57
Q How is the Company positioning itself to achieve growth?
A As we adapt our business model to a changing world, we are aiming for a much higher share of sales in our solutions offering, leveraging the Company’s innovative technologies and digitalisation, thereby creating additional value for our customers. We place great importance on developing and delivering higher quality products and services, which will in turn also enable our customers to improve the quality of their operations and products.
As the number one refractory player in four out of the top ten steel markets, in addition to maintaining our leadership positions in the Americas, Europe and the Middle East, we intend to grow our share in key under-penetrated geographies. We have seen significant success during the Year with our dedicated, local strategies for the Chinese and Indian markets, resulting in high levels of growth and market share gains. We will look to accelerate these in 2019, as well as applying focus to additional important steel markets where the Group has a limited presence.
Read more about the growth markets of India and China on pages 32 to 33
With “People” being one of the Group’s four strategic pillars, guaranteeing we have the optimal team to deliver on the Company’s ambitious growth plans is central to our ongoing success.
Following the merger, the organisational structure of the business was redesigned and restructured to ensure that it accurately reflects our strategy. This has been a significant area of focus during the Year and we have made important changes to consolidate and optimise our workforce, whilst upgrading the level of skills and expertise throughout the Group.
Q What are your expectations for the future growth of the business?
A Through the cycle, the Group expects nominal organic growth of c. 1-3% per year. Following the progress made in the integration process, as well as the much strengthened balance sheet and continued strong cash generation, we intend to initiate a number of targeted capital investment programmes to support the Group’s medium term objectives. In addition to approximately €110 million of annual maintenance capital investment, we intend to deploy approximately €65 million of additional capital investment in 2019 to support growth, increase raw material capacity and improve efficiency. Of this, approximately half relates to the Group’s dolomite expansion project in Chizhou, China and the remainder on smaller projects in York (US) and India.
Q Do you have a vision for the future?
A As the world’s population grows, there will be new cities, infrastructure and industries - all of which require steel, cement and glass, and consequently refractories. At the same time, refractories are important in initiatives to reduce pollution and mitigate the impacts of climate change (by providing smarter infrastructure and cleaner power) and lift people out of poverty (by enabling, for example, the construction of housing).
Whilst recognising that our innovation, products and solutions are integral to almost every aspect of modern life, and therefore to the facilitation of global development, we take our commitment to sustainability seriously in terms of responsibly managing the economic, environmental and social impacts of our business.
Q What is your business outlook for 2019?
A 2018 has been a year of tremendous progress and transformation, creating the leading company in the global refractories industry, successfully delivering on our integration plans and benefitting from the synergies of the combination. More broadly, we continue to navigate well the challenges of the integration process and have set the business on the right path to support its ongoing strategic development.
We are expecting a more stable raw material market in 2019. Whilst pricing may ease from the current high levels, a new higher base looks likely to be maintained throughout the year on account of the structurally changed environment, especially in China.
Whilst some uncertainties exist in the macroeconomic outlook for 2019, robust customer markets in the medium term (albeit with some uncertainty in the short term) and positive trends in raw material pricing support our expectation to deliver modest organic revenue growth, with improved operating margins from 2018 levels, driven by continued synergy generation and further optimisation initiatives, in addition to further growth potential from acquisitions. We remain focused on driving margin improvement opportunities and strong cash flow generation, which will provide the foundation to support our capital allocation and dividend policy.
I would like to thank our employees, shareholders and customers for your continued support in what has been a critical year in the Company’s development.
2 1
A N N U A L R E P O R T 2 0 1 8R H I M A G N E S I TA

Innovation
Taking innovation to 1,200°C and beyond We are committed to innovation in every aspect of our business. We aim to use data to develop pioneering products, new business models including our solutions offering, and efficient, inventive processes that will add real value to our customers.
The Company’s technology leadership is built on the ambition, dedication and creativity of our employees. Innovation management gives structure to this creativity and ensures that ideas are converted to marketable products, services and new business models.
R&D underpins the Group’s strategy to be the top service and solution provider in the refractory industry with an extensive portfolio based on innovative technologies and digitalisation.
The Group expenditure on R&D and Technical Marketing in 2018 was c. €63 million.
Research and developmentIn 2018, R&D focused on integrating teams, capturing synergies on G&A, production network and cross selling, and leveraging the innovation efforts, including the launch of the Technical Advisory Committee (“TAC”) (see further detail below) and involvement with Open Innovation platforms, to further extending our technical network.
Innovation managementThe improvement and further development of manufacturing processes is one of the main topics of innovation management at RHI Magnesita.
2.2%Annual commitment to R&D and Technical Marketing1
1 As a percentage of overall revenue
R H I M A G N E S I TAS T R AT E G I C R E P O R T
2 2
w
The Company’s clear objective is the identification, development and utilisation of new, high-performance production technologies and services that lead to a significant improvement in efficiency and enable the manufacturing of products with superior material properties and/or functionalities. Through this approach the Company not only creates the basis for patentable, innovative processes, but also sets new standards in the field of refractories.
The ongoing advancements due to digitisation and the increasing degree of automation have a significant contribution to the development of existing production processes and services. Through analysis, evaluation and prioritisation of existing technologies, innovation management ensures their quick and seamless integration. Trends such as Big Data, connectivity, AI and predictive maintenance are only a few aspects which open up new opportunities for the Company. The clear objective is to align the Group’s activities to new trends and to implement new business and service models that fulfil the demands of the Company’s stakeholders.
Our R&D capabilities Our industry-leading R&D team is at the centre of the Company’s ability to innovate. The Research and Development division consists of two R&D hubs, located in Leoben (Austria) and Contagem (Brasil), and three R&D centres in York (USA), Dalian (China) and Bhiwadi/Visakhapatnam (India). The R&D team is diverse in nature with 15 different nationalities being represented. It comprises more than 250 people, approximately a quarter of which are female. Demonstrating the level of expertise of our team, 98 people within the global R&D team hold Master’s and PhDs.
R&D developments€33 million, before subsidies and including opex and capex, was committed to R&D in 2018, representing 1.1% of total Group revenue. We aim to commit 1.2% of Group revenue to R&D and innovative technologies development on an annual basis. The minor reduction in 2018 was due to the effect of foreign exchange movements and also the merger combination process.
Key developments in the R&D sphere during the Year included:
¥ Establishment of the TAC: see case study below
¥ Automated Process Optimisation (“APO”): APO is being used to foster a greater understanding of the correlation between steel production parameters, maintenance and refractory by analysing data on a central master computer, using AI methods. Further development of APO technology has been applied to RH degassers (a secondary refining system that removes dissolved gases such as hydrogen present in molten steel to enable the production of high-grade steel) and combined with the Agellis
Furnace safe solution (an infrared monitoring of furnace shells that minimises the risk of liquid steel breakout and maximises the operational furnace availability while at the same time increasing safety)
¥ Brick data hub: This initiative aims to collect data from every stage of the process from tunnel kiln to brick destruction. New cameras have been installed on-site and the interface between cameras and databases has been prepared
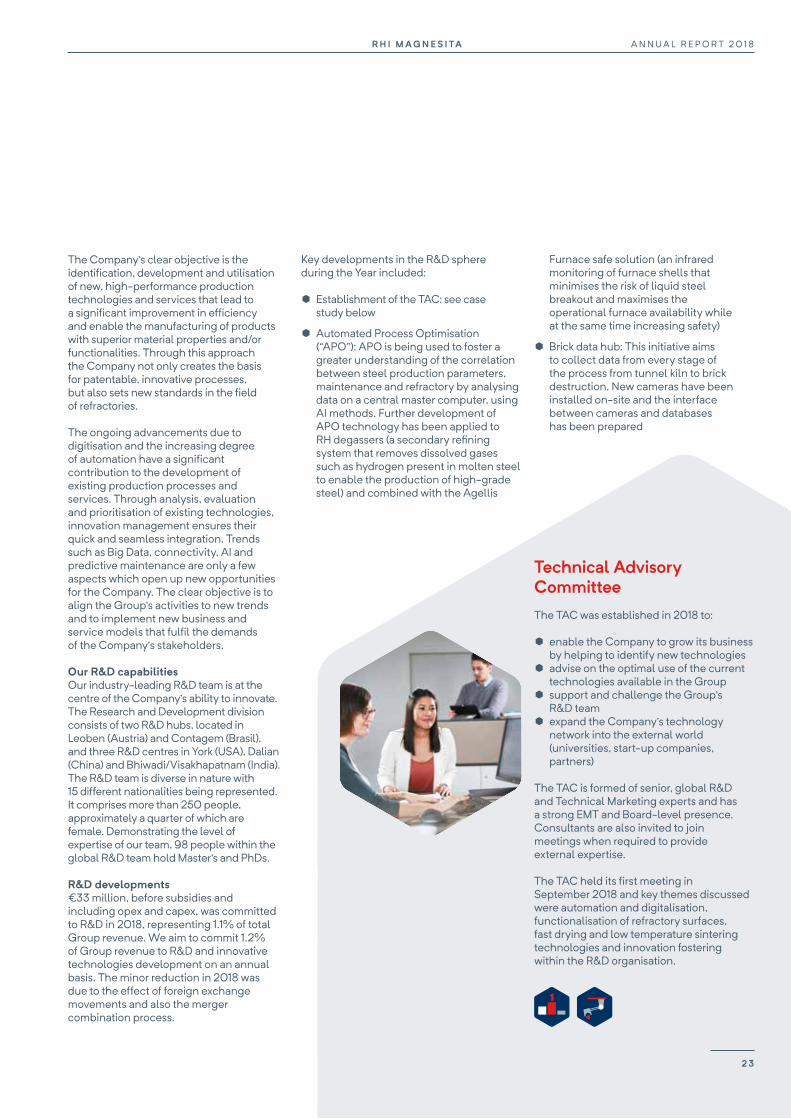
Technical Advisory CommitteeThe TAC was established in 2018 to:
¥ enable the Company to grow its business by helping to identify new technologies
¥ advise on the optimal use of the current technologies available in the Group
¥ support and challenge the Group’s R&D team
¥ expand the Company’s technology network into the external world (universities, start-up companies, partners)
The TAC is formed of senior, global R&D and Technical Marketing experts and has a strong EMT and Board-level presence. Consultants are also invited to join meetings when required to provide external expertise.
The TAC held its first meeting in September 2018 and key themes discussed were automation and digitalisation, functionalisation of refractory surfaces, fast drying and low temperature sintering technologies and innovation fostering within the R&D organisation.
2 3
A N N U A L R E P O R T 2 0 1 8R H I M A G N E S I TA
Innovationcontinued
The trademark portfolio has been optimised and reduced to match the needs of the market.
Our partnerships RHI Magnesita has active programmes with the following leading institutions:
¥ University of Leoben; ¥ Johannes Kepler University; ¥ Joanneum Research; ¥ University of Graz and the Graz
University of Technology; ¥ Vienna University of Technology; ¥ Federal University of São Carlos in Brazil; ¥ Slovak Academy of Sciences; ¥ McGill University in Canada; and ¥ Fraunhofer-Gesellschaft in Germany.
RHI Magnesita also worked closely with technology leaders in the steel industry such as:
¥ Voestalpine Stahl Donawitz; ¥ Voestalpine Stahl Linz; ¥ Böhler Edelstahl; and ¥ Primetals Technologies at competence
centres promoted by the Austrian Research Promotion Agency.
Fundamental research A key focus of fundamental research is to gain a better understanding of the corrosion and erosion mechanisms of our products within different customer processes. We carry out this research, often in collaboration with scientific cooperation partners and within the framework of subsidised competence centres, with the use of simulation and modelling methods. The aim of these is to analyse flow conditions of liquid steel from the steel ladle through the tundish to solidification in the mould. Methods used include the finite element method (“FEM”), computational fluid dynamics (“CFD”), the discrete element method (“DEM”), thermochemical simulations and water modelling. The simulation and modelling then enables us to offer our customers tailored refractory solutions which are based on the research carried out and therefore take the client’s process and specific environment into account.
¥ 3D printing: 3D printed refractory components will be produced on a pilot scale in 2019 and sent for application testing
¥ Surface properties functionalisation: Several technologies which are aimed at functionalising refractory grains have been investigated, leading to the development of a new refractory formulation with improved properties (mainly corrosion resistance, flexibility (modulus of elasticity) and in some cases thermal conductivity)
Intellectual property: patents and trademarksGiven the industry-leading R&D capabilities of the Group, we place great importance on protecting its intellectual property.
The Company safeguards and protects its new products, systems and technologies via the effective use of trademarks and patents. We continuously examine the patentability of product developments, new raw materials, systems and technologies in order to provide targeted intellectual property protection for the Group’s new refractory solutions, thus strategically supporting the Company’s market position as a global leader in the refractory industry.
Seven priority patent applications were filed in 2018; providing a competitive advantage for the Company. They included patent applications concerning the geometries of refractory components, automation and advanced refractory raw materials. The Group’s patent portfolio comprised 148 patent families with 1,723 patents and patent applications at the end of the Year.
A new Group-wide patent evaluation process has recently been rolled out in line with the Company’s strategy. The well-established patent monitoring process is used to analyse competitors’ patent activities in the market and to further secure legal compliance.
Significant achievements in 2018 include the patenting of the IBOS Ladle Bottom solution in its primary market - the US - as well as the granting of a European patent for the APO System.
Innovation: enabling customers to meet their goalsAgainst a backdrop of the ever-increasing focus on environmental, health and safety issues, there is growing demand in the steel industry for zero-emission refractory bricks. Our R&D team has been working to discover ways of reducing the environmental impact of the refractory process for years and one of the latest developments is the zero-emission magnesia carbon brick, which undergoes a specific treatment process to eliminate emissions.
The success of this product has been proven in various customer trials and its ability to provide significant benefit for the customer has been demonstrated. One long-standing customer was required by its host Government to significantly reduce its emissions and therefore underwent a variety of trials with alternative refractory products, with either limited success or a significant increase in costs noted, to achieve this goal. The ladle lining concept was then altered to enable the use of our zero-emission bricks. In utilising RHI Magnesita’s innovative products and services, the customer was able to reduce its environmental impact by eliminating emissions and, critically, to avoid any adverse regulatory impacts.
R H I M A G N E S I TAS T R AT E G I C R E P O R T
2 4
In 2018 in excess of 100 simulation projects were carried out for both internal and external customers, with some specific examples being a CFD simulation of a tap hole cooler design and a FEA simulation of a new brick suspension system for non-ferrous metals electric arc furnace (“EAF”) roofs.
New product and production method development Innovative raw materials and production processes provide the basis for new products. The Company has test plants in Leoben and Contagem which are used to develop new fused raw materials, based on phase-theory considerations and thermochemical calculations. These are then further developed prior to undergoing series production at our facilities. In addition to classic oxidic raw materials, research also deals with non-oxidic raw materials, which have turned out to be promising.
Some of these new raw materials are currently under investigation in order to highlight their potential in terms of improving thermo-mechanical properties as well as corrosion resistance of selected refractory formulations.
Existing product optimisation and process improvements The Company uses Big Data methods to analyse and enhance existing production processes. As an example of this, AI is used to analyse and understand relevant information and develop the basis of a refractory wear model. AI methods are also used to foster a greater understanding of the correlation between steel production parameters, maintenance and refractory.
In order to optimise our products and adapt them to specific customer requirements, used refractory materials are taken from a variety of customer aggregates and thoroughly studied at our R&D centres. Based on this analysis, the Company is able to develop optimised products and techniques with the aim of enhancing product performance and lowering customer costs.
As an example, a new development has been launched aimed at coating refractory grains in order to improve the thermochemical corrosion and mechanical strength of refractory bricks, which are exposed to highly demanding environments. Bricks produced with this new technology are currently undergoing further testing in industrial kilns.
The close interdisciplinary cooperation between material development, design development in the simulation department and production process development
enables further improvements of the properties of existing products and optimal adaptation to customer needs. Examining raw material alternatives to existing products in order to secure raw material availability and to optimise the customer’s total cost of ownership is one of the fundamental activities of R&D.
TrainingAn important part of the R&D process, and a key part of the Company’s ability to add value to its clients, is to provide training and knowledge sharing with our customers. At the Training Centre in Leoben, Austria, the Company holds seminars attended by customers to help familiarise them with our refractory products and lining techniques. The participants can learn about and practice handling refractory products on a full-scale model of a cement rotary kiln using modern lining machinery.
Digitalisation Digitalisation is a key focus for the Company as well as providing one of the Group’s leading competitive advantages. In 2018, further digitalisation and automation initiatives across the Group’s entire value chain were carried out and remain on track.
Radenthein, which is the Company’s first digital pilot plant, enables the Group to apply the power of digital analytics and AI.
Demonstrating the importance we place on this area, in 2018, we appointed a Digital Strategy Manager to establish our global digital agenda, data/digital strategy and governance process.
We have also developed a Supply Chain Management (“SCM”) 4.0 team and have initiated the SCM transformation process. This includes projects which are focused on digitalisation and AI to drive optimisation of our entire supply chain.
Product portfolioFollowing the merger, we commenced a full analysis and review of the Group’s product portfolio with the aim of unifying, streamlining and optimising. As a result of this process, we saw a significant reduction of active brands and carried out a streamlining of recipes.
Several successful product roll-outs were achieved during the Year, including “Q-mixes”, which were developed to ensure short delivery times in spite of high plant loads. Another benefit of these mixes exists in reducing our consumption of dead burned magnesia, enabling the Group to further optimise its supply chain.
The development and optimisation of reduced- and zero-emission bricks continued successfully, with the creation of new recipes as well as the further optimisation of existing recipes to meet ever-increasing environmental, health & safety requirements. In slide gate mechanics, the successful roll-out of the “S-Gate” continued with a major focus on South America in 2018, thereby securing the Company’s patent-protected technology leadership in slide gate mechanics and ceramics.
In 2019, product roll-outs will continue with examples including the introduction of EAF hearth ramming mixes, produced in Contagem (Brazil), and doloma-based bricks, produced in Chizhou (China).
Technical Marketing trainingWe use innovative training methods to disseminate knowledge of our product portfolio both quickly and cost-efficiently amongst our sales team. These processes are supported by our dedicated “Academy” department, within the Technical Marketing organisation, as well as our e-learning capabilities.
RecyclingThe recycling of used refractory products is a key strategic initiative for the Group on the basis of the various benefits it carries. Firstly, it enables us to secure a supply of raw materials and therefore reduces the requirement for their cost-intensive procurement but also it enables a significant reduction in energy consumption and CO2 emissions. In addition to this, by recycling spent refractories, we can reduce the volume of waste generated as well as cutting disposal costs. By applying alternative treatment methods, the Company is aiming to increase the portion of Secondary Raw Materials (“SRM”) that can be recovered from the spent refractories.
The Company uses over 100,000 tonnes of recycled materials on an annual basis and the development of products allowing a higher SRM content is a priority for us. 2018 saw significant focus on the development of our recycling strategy and capabilities and, as part of this, the team was enhanced during the Year. Our R&D function developed recipes during the Year which allowed significantly higher rates of recycling, while still maintaining the same functional performance in the final customer application.
In 2019 we will continue to work in close collaboration with our customers to increase the percentage of SRM in products, whilst retaining or even improving their performance.
2 5
A N N U A L R E P O R T 2 0 1 8R H I M A G N E S I TA
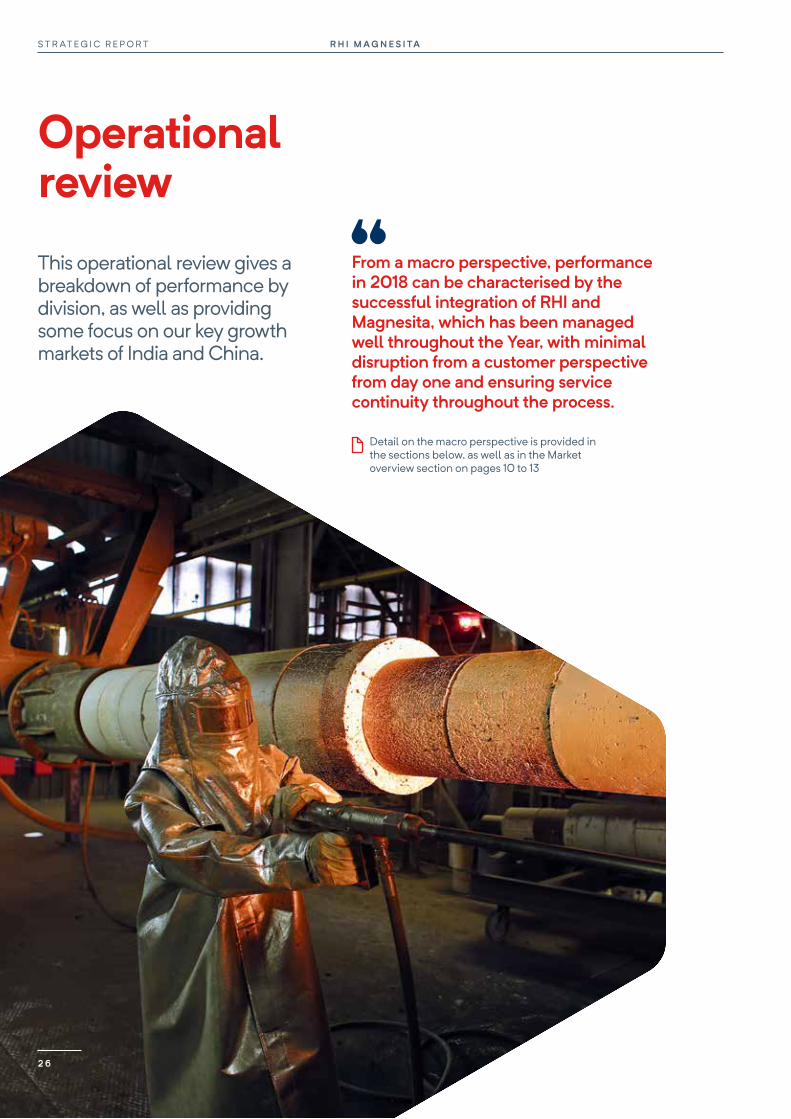
Operational reviewThis operational review gives a breakdown of performance by division, as well as providing some focus on our key growth markets of India and China.
From a macro perspective, performance in 2018 can be characterised by the successful integration of RHI and Magnesita, which has been managed well throughout the Year, with minimal disruption from a customer perspective from day one and ensuring service continuity throughout the process.
Detail on the macro perspective is provided in the sections below, as well as in the Market overview section on pages 10 to 13
R H I M A G N E S I TAS T R AT E G I C R E P O R T
2 6
previous year2. Gross profit for the Steel Division was €522.4 million, representing a gross margin of 23.7% (2017: 23.1%3). Whilst overall there was a gross margin improvement in 2018, a deterioration was noted in H2 as a result of some operational and supply chain issues. The root cause of these issues has been identified and improvement plans are in place. We are confident that they will substantially be resolved in the current year.
EuropeThe Group realised a good level of organic growth, with revenue of €631.5 million, in spite of the subdued level of steel production in Europe and notwithstanding the plant production challenges encountered during the Year, which can be characterised by raw material shortages and long lead times (especially in dolomite). This increase was driven by product portfolio optimisation with a favourable pricing impact, and also influenced by our ability to pass on cost increases. The Company successfully mitigated long lead times and production/shipping delays (as a result of unplanned ex China orders) by close interdepartmental and customer cooperation. Furthermore, coordinated inventory measures were taken to reduce excessive stock and thereby free up capital employed without impacting customer satisfaction with our supply reliability.
Steel production in the EU decreased by 0.3% to 168.1 Mt. Steel consumption levelled in H2 2018, according to the European Steel Association (“Eurofer”), showing a 2.2% increase at closing when compared to 2017. High overall levels of steel consumption and stock building across the steel distribution chain drove stable demand during the Year amidst tensions over US tariffs on European steel and serious discussions on safeguards and tariff barriers in response to steel imports in the region, especially from China and other Asian producers.
As with North America, we see potential positive benefits in Europe from the reopening of the Chizhou plant and expect 2019 to present a more stable year in this region.
Steel Division
Our Steel Division provides customers with a broad range of customised refractory solutions and services required in steel production. These include basic and non-basic mixes and bricks, as well as machinery, flow control systems and our solutions offering.
Refractory products used in the steel industry are considered as consumable products and therefore their service life generally does not exceed one year. They can therefore be classified as a maintenance investment, with their demand being correlated to output.
According to the World Steel Association, global crude steel production increased by 4.6% to 1,808.6 Mt in 2018 (+2.5% excluding China), with increases noted in all regions except the EU, providing a positive customer demand backdrop for the Group’s Steel Division.
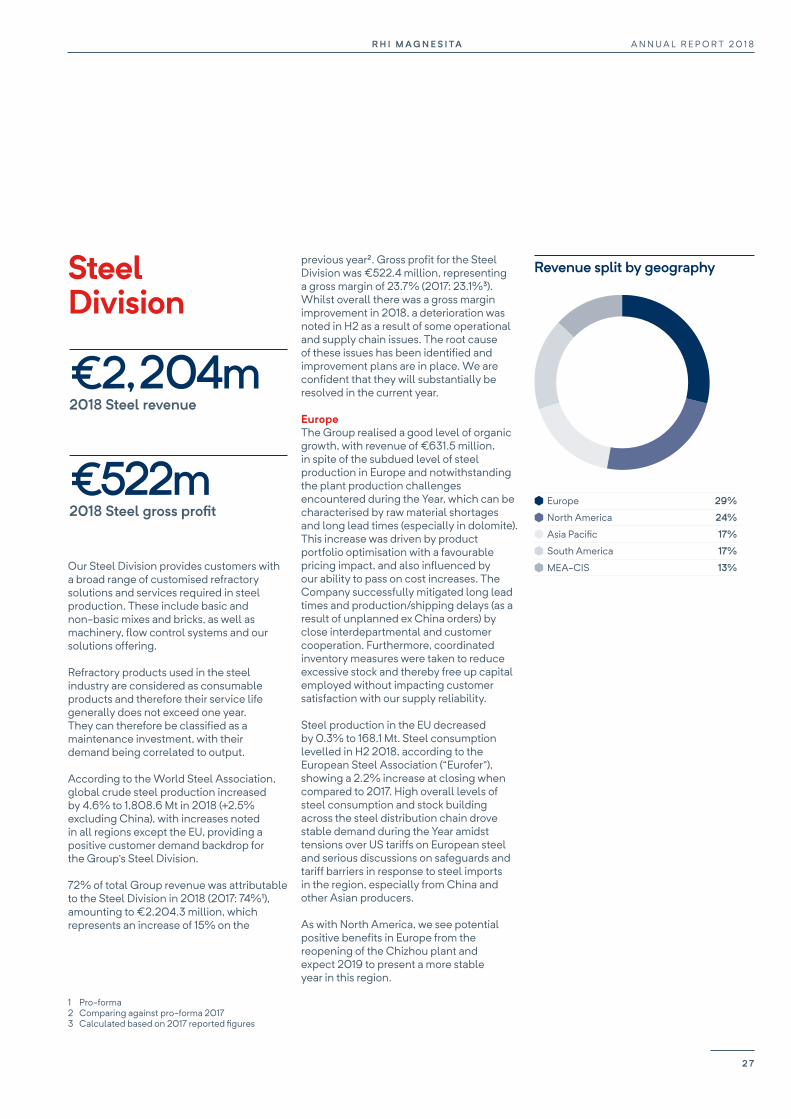
72% of total Group revenue was attributable to the Steel Division in 2018 (2017: 74%1), amounting to €2,204.3 million, which represents an increase of 15% on the
Revenue split by geography
1 Pro-forma2 Comparing against pro-forma 20173 Calculated based on 2017 reported figures
North America 24%
Europe 29%
Asia Pacific 17%
South America 17%
MEA-CIS 13%
€522m2018 Steel gross profit
€2,204m2018 Steel revenue
2 7
A N N U A L R E P O R T 2 0 1 8R H I M A G N E S I TA
Operational reviewcontinued
North AmericaStrong revenue of €534.6 million was recorded in 2018, with particularly strong performance in North America due to crude steel production rising in the US and Mexico, but also due to the Group’s focus on key strategic initiatives, an enhanced portfolio of products, and market price adjustments, which outpaced the cost development.
Given the limited raw material sourcing options in North America, resulting in a high reliance on imported goods and raw materials, this region inevitably saw challenges in 2018. Customer sentiment was impacted by supply concerns on account of raw material developments in China, which significantly increased prices. There were specific challenges in 2018 to fulfil demand for dolomite-based shaped products, which was impacted by production capacities and increased steel pour.
The Group was able to derive benefit from its strong market position in North America, driven by its very competitive product and service offering across the full refractory portfolio, and also from its high level of backward integration for imported products from Europe and South America.
North America demonstrated strong growth in 2018, particularly when considering the maturity of the market, with steel production increasing by 4.1% to 120.5 Mt. The US saw a particularly high year-on-year increase of +6.2% to 86.7 Mt, with key drivers being the Government’s infrastructure plan, the tariffs escalation with China and raw material prices.
In March 2018, 25% tariffs were imposed on steel imports, leading to an increase in US steel prices and steel customers announcing new investments (as well as the recommencement of previously halted operations). However, as the Year-end approached, prices began to fall back to similar levels seen prior to the tariff implementation. A 10% tariff was also implemented on imported Chinese goods in September 2018, which will rise to 25% absent any future developments.
Capacity utilisation in the US (a key indicator for the industry) passed the 80%1 reference point and a number of steel producers initiated investments to ramp up production capabilities and upgrade facilities as the economy gained momentum.
Looking forward to 2019, we are encouraged by customer green- and brownfield projects as well as the positive impact of increased steel pour from those operations which were restarted during the Year. We also anticipate being in a position to derive some of the latent benefit from increases in Chinese raw material pricing that was not yet fully felt during 2018.
The reopening of the Chizhou plant in China is expected to free up dolomite capacity in North American plants from the end of 2019 onwards, enabling additional deliveries to customers in the region.
Middle East & Africa (“MEA”), CIS & Asia PacificThe Group succeeded in outperforming the market in India, China and Asia Pacific in 2018, which itself saw strong steel growth in all regions. Revenue reported for MEA and CIS in 2018 was €286.1 million, with €385.7 million in Asia Pacific, positively impacted by price increases, with the strongest improvements being seen in MEA. The Group contended with the issue of a limited level of backward integration in a majority of these regions during the Year; however, with a steadier raw material supply flow expected in 2019, a further improvement in performance is anticipated.
1 The American Iron and Steel Institute
R H I M A G N E S I TAS T R AT E G I C R E P O R T
2 8
Steel production in Asia grew by 5.6% to 1,271.1 Mt. China increased by 6.6%, with its share of global production rising from 50.3% to 51.3%. India’s production increased by 4.9%, overtaking Japan as the world’s second largest steel producing country. The Middle East saw a significant increase in steel production of 11.7% to 38.5 Mt. Turkey decreased slightly to 37.3 Mt. Egypt, Morocco and Algeria increased steel production by 9.3% to 9.8 Mt2.
Steel production in the CIS remained largely flat; +0.3% to 101.3 Mt. Ukraine production decreased by 1.1% to 21.1 Mt, continuing to be impacted by political instability and resultant lower business activity.
The impact of lower steel prices and higher iron ore production costs at the start of 2019 is already being noted. There is an increased risk to steel producers in these regions on the basis of a growing preference for steel imports from Russia, Ukraine and China as opposed to utilising local steel production. It is specifically likely that regional EAF plants may suffer.
South AmericaThe Group’s market position in South America is strong, with a focus on the solutions model, benefitting from long-standing customer relationships and driving value for these customers. Revenue, which amounted to €366.3 million in 2018, was negatively impacted by country-wide industrial action of truck drivers in Brazil in May as well as the political situation in Venezuela, which has largely halted steel production in the country. However, profitability was increased in 2018 as a result of improved product mix, better technical results in performance contracts as well as merger-related synergies. The Company encountered some challenges with its stand-alone installation model in 2018 which negatively impacted on margins but we expect to generate positive gains in 2019, with a strong focus on a turnaround of this area.
2018 saw average growth in steel production, given the maturity of the market, with an increase of 1.3% in Latin America to reach 44.3 Mt. Brazil showed a steady pace in its economic recovery with steel production reaching 34.7 Mt in 2018 (+1.1% year-on-year). The domestic apparent consumption of steel products in Brazil was 20.6 Mt, an increase of 7.3% over the previous year. Despite the positive performance of the Brazilian steel industry in 2018, domestic sales and apparent consumption still remain below the levels reached in 2013. Factors affecting steel consumption in South America include political uncertainty latent in Brazil and Colombia due to the electoral cycle, the financial crisis in Argentina and the continuing uncertainty in Venezuela regarding the resumption of steel production.
The country-wide truckers’ strike in Brazil, which occurred in May, hindered further growth in steel sales in the domestic market in 2018 and the US decision to restrict the market to steel imports (Section 232), triggered protectionist escalation on the part of the other countries, jeopardising growth in export volumes.
Apparent steel consumption is forecast to rise by 6.2% to 22.4Mt1 on the basis of optimistic expectations of the new Brazilian Government measures. Whilst our internal expectations take into account a certain level of conservatism, this still has the potential to drive further steel production increases in 2019.
We will continue to reinforce the commercial strategy of our solution-oriented business in South America, with a focus on supporting the recovery of the steel industry.
Strong steel revenues in 2018 of €2,204 million were underpinned by positive customer demand.
1 Brazil Steel Institute2 According to CRU statistics
2 9
A N N U A L R E P O R T 2 0 1 8R H I M A G N E S I TA

Operational reviewcontinued
with a revenue of €877.1 million (2017: €658 million). Gross profit for the Industrial Division was €214.5 million, representing a gross margin of 24.5% (2017: 22.5%1).
Cement/LimeCement/Lime in 2018 amounted to €321.3 million, driven by price increases and portfolio optimisation. This segment constituted 37% of Industrial Division revenue in 2018 and 10% of overall Group revenue.
The Company saw a successful turnaround of its Cement/Lime business during the Year, with positive effects from the renegotiation of contract terms being noted Magnesite and dolomite raw material availability remained tight in 2018, with Chinese DBM maintaining high price levels. In H1, cement continued to be impacted by long-term contracts and a very high order level from 2017. Long lead times, mainly in Europe, also led to delayed margin improvements. However, the Company took positive actions to mitigate these issues, shortening the impact of price increases by reducing contracts and price validity, and concentrating on the most profitable business areas. From H2 onwards, price increases were then evident in improving margins.
2018 was a year of steady refractory market growth and relative stability for cement and lime from a global market perspective, with some significant variances on a regional basis. China, the world’s largest cement producer, continued its focus on environmental improvements and consequently on reducing mainly outdated cement capacities. Other countries, such as Brazil and those in the near Middle East, can be characterised by their challenging economic environments, whereas Eastern Europe, Central Asia and North America all benefited from significant increases in demand.
Industrial Division
The Industrial Division provides refractory solutions for the cement, lime, non-ferrous metals and glass industries as well as the EEC sectors.
Refractory products for the cement industries tend to be consumables, with a replacement period of up to a year. Similar to those used in the steel industry, they are considered as maintenance investment, with demand being correlated to output.
In the non-ferrous metals, lime, glass as well as the EEC industries, the service life of refractory products is generally longer. Refractory investment in these industries is therefore more project-oriented and subject to longer replacement cycles, leading to more volatile demand than that seen in the steel and cement/lime industries.
With GDP growth in 2018 of 3.7% (of which c. 3% is relevant to the business), the Group was able to derive benefit from a healthy overall industrial demand environment. Sales to the Industrial Division accounted for 28% of total Group revenue (2017: 26%),
Industrial Division revenue2
1 Calculated on a statutory basis 2 Percentages equal over 100% due to rounding
The market demand for lime has been very stable. However, as a result of fewer projects in vertical shaft kilns - one of our key market areas - we saw lower volume and revenue compared to 2017. Nevertheless, we note an encouraging projects pipeline and positive current trend in early 2019. An additional focus on rotary kilns is also expected to lead to market growth, mainly in North America.
After the turnaround seen in this business in 2018, further upside is anticipated in 2019 driven by our ability to fully capture the positive effects of our backward integration.
Non-ferrous metalsRevenue contribution from the non-ferrous metals business represented 7% of the Group’s overall revenue in 2018 and 25% of the Industrial Division, with strong revenue of €217.2 million in 2018, outpacing the market, which itself retained positive dynamics. The business unit performed well during the Year and saw the benefit of a number of projects with long-standing customers.
Non-ferrous metals 25%
Cement/Lime 37%
Other process industries 39%
€877m2018 Industrial revenue
€215m2018 Industrial gross profit
R H I M A G N E S I TAS T R AT E G I C R E P O R T
3 0
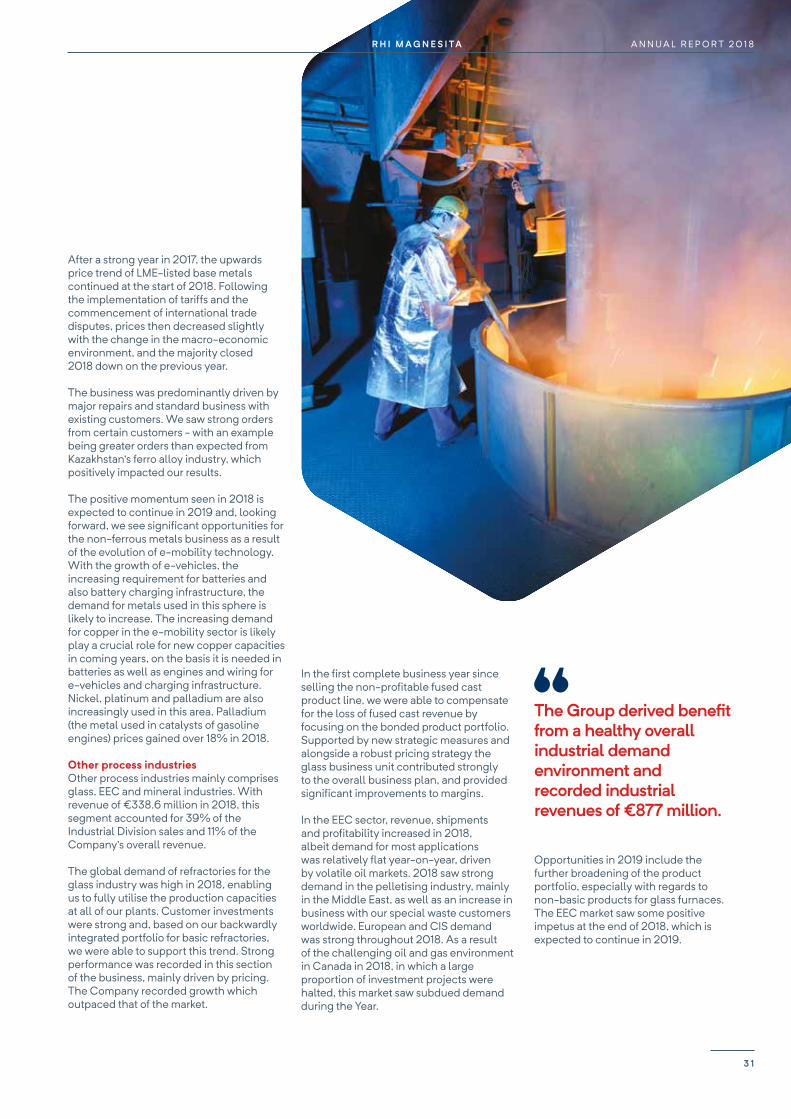
After a strong year in 2017, the upwards price trend of LME-listed base metals continued at the start of 2018. Following the implementation of tariffs and the commencement of international trade disputes, prices then decreased slightly with the change in the macro-economic environment, and the majority closed 2018 down on the previous year.
The business was predominantly driven by major repairs and standard business with existing customers. We saw strong orders from certain customers - with an example being greater orders than expected from Kazakhstan’s ferro alloy industry, which positively impacted our results.
The positive momentum seen in 2018 is expected to continue in 2019 and, looking forward, we see significant opportunities for the non-ferrous metals business as a result of the evolution of e-mobility technology. With the growth of e-vehicles, the increasing requirement for batteries and also battery charging infrastructure, the demand for metals used in this sphere is likely to increase. The increasing demand for copper in the e-mobility sector is likely play a crucial role for new copper capacities in coming years, on the basis it is needed in batteries as well as engines and wiring for e-vehicles and charging infrastructure. Nickel, platinum and palladium are also increasingly used in this area. Palladium (the metal used in catalysts of gasoline engines) prices gained over 18% in 2018.
Other process industriesOther process industries mainly comprises glass, EEC and mineral industries. With revenue of €338.6 million in 2018, this segment accounted for 39% of the Industrial Division sales and 11% of the Company’s overall revenue.
The global demand of refractories for the glass industry was high in 2018, enabling us to fully utilise the production capacities at all of our plants. Customer investments were strong and, based on our backwardly integrated portfolio for basic refractories, we were able to support this trend. Strong performance was recorded in this section of the business, mainly driven by pricing. The Company recorded growth which outpaced that of the market.
The Group derived benefit from a healthy overall industrial demand environment and recorded industrial revenues of €877 million.
In the first complete business year since selling the non-profitable fused cast product line, we were able to compensate for the loss of fused cast revenue by focusing on the bonded product portfolio. Supported by new strategic measures and alongside a robust pricing strategy the glass business unit contributed strongly to the overall business plan, and provided significant improvements to margins.
In the EEC sector, revenue, shipments and profitability increased in 2018, albeit demand for most applications was relatively flat year-on-year, driven by volatile oil markets. 2018 saw strong demand in the pelletising industry, mainly in the Middle East, as well as an increase in business with our special waste customers worldwide. European and CIS demand was strong throughout 2018. As a result of the challenging oil and gas environment in Canada in 2018, in which a large proportion of investment projects were halted, this market saw subdued demand during the Year.
Opportunities in 2019 include the further broadening of the product portfolio, especially with regards to non-basic products for glass furnaces. The EEC market saw some positive impetus at the end of 2018, which is expected to continue in 2019.
3 1
A N N U A L R E P O R T 2 0 1 8R H I M A G N E S I TA
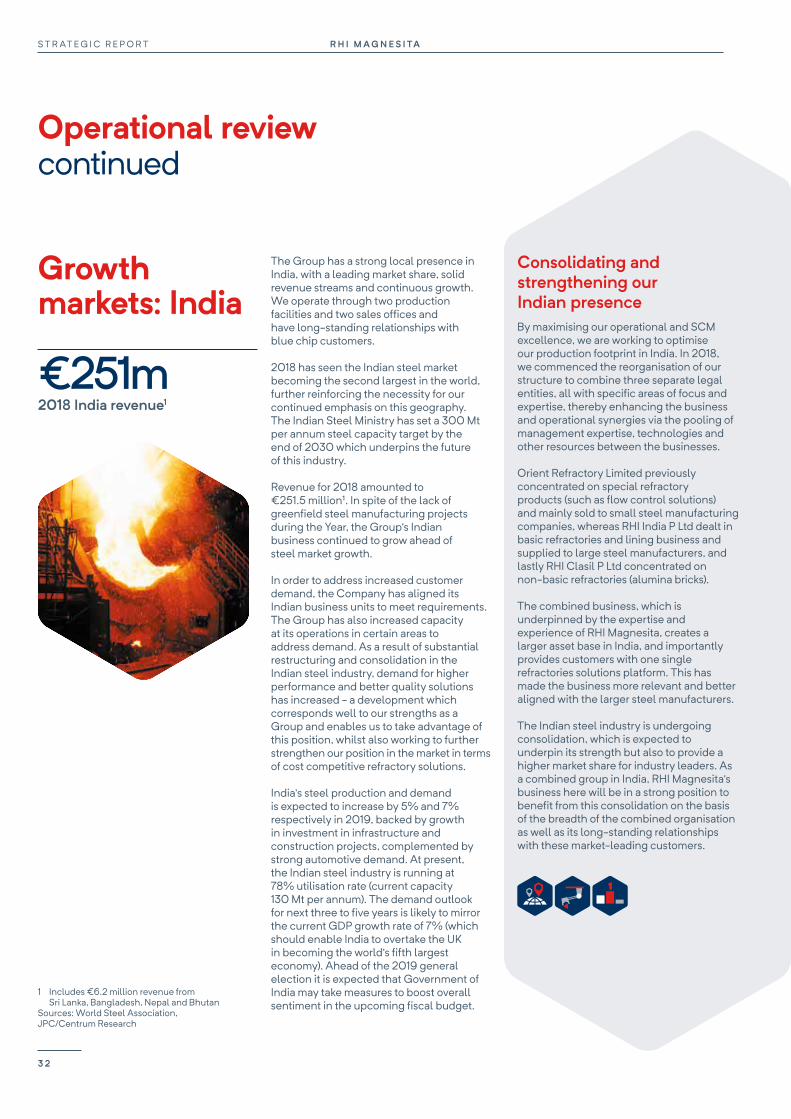
Operational reviewcontinued
Growth markets: India
The Group has a strong local presence in India, with a leading market share, solid revenue streams and continuous growth. We operate through two production facilities and two sales offices and have long-standing relationships with blue chip customers.
2018 has seen the Indian steel market becoming the second largest in the world, further reinforcing the necessity for our continued emphasis on this geography. The Indian Steel Ministry has set a 300 Mt per annum steel capacity target by the end of 2030 which underpins the future of this industry.
Revenue for 2018 amounted to €251.5 million1. In spite of the lack of greenfield steel manufacturing projects during the Year, the Group’s Indian business continued to grow ahead of steel market growth.
In order to address increased customer demand, the Company has aligned its Indian business units to meet requirements. The Group has also increased capacity at its operations in certain areas to address demand. As a result of substantial restructuring and consolidation in the Indian steel industry, demand for higher performance and better quality solutions has increased - a development which corresponds well to our strengths as a Group and enables us to take advantage of this position, whilst also working to further strengthen our position in the market in terms of cost competitive refractory solutions.
India’s steel production and demand is expected to increase by 5% and 7% respectively in 2019, backed by growth in investment in infrastructure and construction projects, complemented by strong automotive demand. At present, the Indian steel industry is running at 78% utilisation rate (current capacity 130 Mt per annum). The demand outlook for next three to five years is likely to mirror the current GDP growth rate of 7% (which should enable India to overtake the UK in becoming the world’s fifth largest economy). Ahead of the 2019 general election it is expected that Government of India may take measures to boost overall sentiment in the upcoming fiscal budget.
Consolidating and strengthening our Indian presenceBy maximising our operational and SCM excellence, we are working to optimise our production footprint in India. In 2018, we commenced the reorganisation of our structure to combine three separate legal entities, all with specific areas of focus and expertise, thereby enhancing the business and operational synergies via the pooling of management expertise, technologies and other resources between the businesses.
Orient Refractory Limited previously concentrated on special refractory products (such as flow control solutions) and mainly sold to small steel manufacturing companies, whereas RHI India P Ltd dealt in basic refractories and lining business and supplied to large steel manufacturers, and lastly RHI Clasil P Ltd concentrated on non-basic refractories (alumina bricks).
The combined business, which is underpinned by the expertise and experience of RHI Magnesita, creates a larger asset base in India, and importantly provides customers with one single refractories solutions platform. This has made the business more relevant and better aligned with the larger steel manufacturers.
The Indian steel industry is undergoing consolidation, which is expected to underpin its strength but also to provide a higher market share for industry leaders. As a combined group in India, RHI Magnesita’s business here will be in a strong position to benefit from this consolidation on the basis of the breadth of the combined organisation as well as its long-standing relationships with these market-leading customers.
1 Includes €6.2 million revenue from Sri Lanka, Bangladesh, Nepal and Bhutan
Sources: World Steel Association, JPC/Centrum Research
€251m2018 India revenue1
R H I M A G N E S I TAS T R AT E G I C R E P O R T
3 2
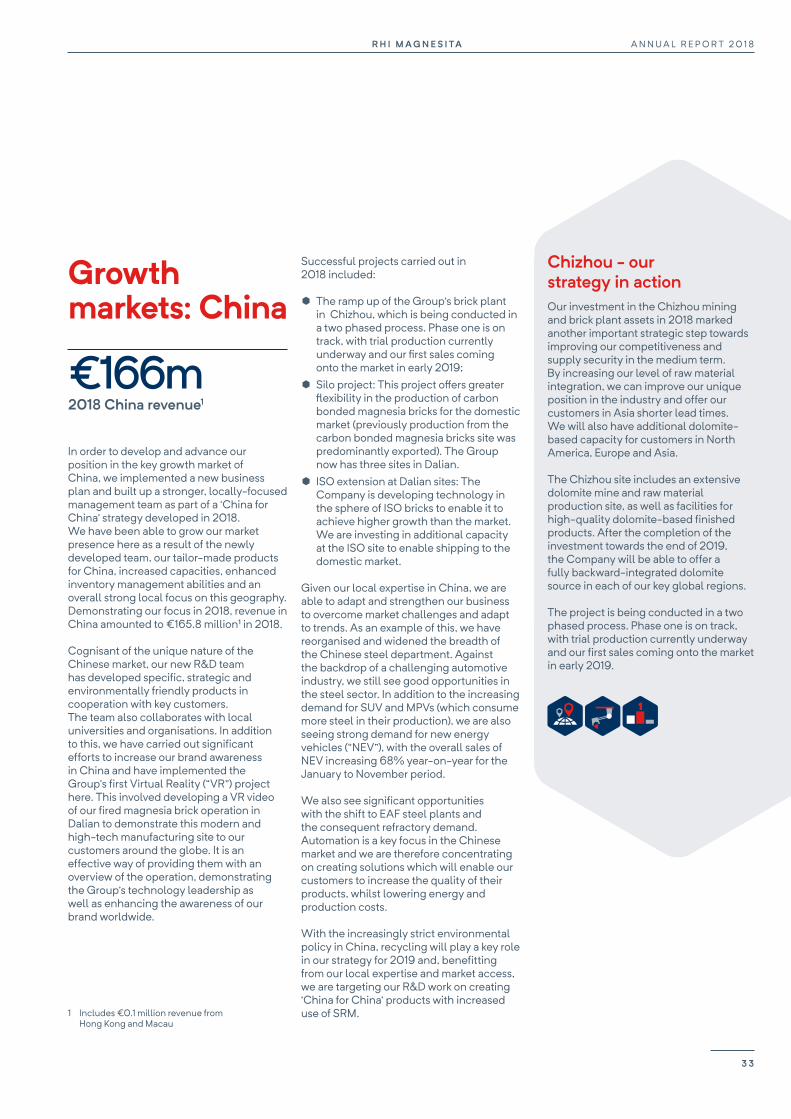
Growth markets: China
In order to develop and advance our position in the key growth market of China, we implemented a new business plan and built up a stronger, locally-focused management team as part of a ‘China for China’ strategy developed in 2018. We have been able to grow our market presence here as a result of the newly developed team, our tailor-made products for China, increased capacities, enhanced inventory management abilities and an overall strong local focus on this geography. Demonstrating our focus in 2018, revenue in China amounted to €165.8 million1 in 2018.
Cognisant of the unique nature of the Chinese market, our new R&D team has developed specific, strategic and environmentally friendly products in cooperation with key customers. The team also collaborates with local universities and organisations. In addition to this, we have carried out significant efforts to increase our brand awareness in China and have implemented the Group’s first Virtual Reality (“VR”) project here. This involved developing a VR video of our fired magnesia brick operation in Dalian to demonstrate this modern and high-tech manufacturing site to our customers around the globe. It is an effective way of providing them with an overview of the operation, demonstrating the Group’s technology leadership as well as enhancing the awareness of our brand worldwide.
Successful projects carried out in 2018 included:
¥ The ramp up of the Group’s brick plant in Chizhou, which is being conducted in a two phased process. Phase one is on track, with trial production currently underway and our first sales coming onto the market in early 2019;
¥ Silo project: This project offers greater flexibility in the production of carbon bonded magnesia bricks for the domestic market (previously production from the carbon bonded magnesia bricks site was predominantly exported). The Group now has three sites in Dalian.
¥ ISO extension at Dalian sites: The Company is developing technology in the sphere of ISO bricks to enable it to achieve higher growth than the market. We are investing in additional capacity at the ISO site to enable shipping to the domestic market.
Given our local expertise in China, we are able to adapt and strengthen our business to overcome market challenges and adapt to trends. As an example of this, we have reorganised and widened the breadth of the Chinese steel department. Against the backdrop of a challenging automotive industry, we still see good opportunities in the steel sector. In addition to the increasing demand for SUV and MPVs (which consume more steel in their production), we are also seeing strong demand for new energy vehicles (“NEV”), with the overall sales of NEV increasing 68% year-on-year for the January to November period.
We also see significant opportunities with the shift to EAF steel plants and the consequent refractory demand. Automation is a key focus in the Chinese market and we are therefore concentrating on creating solutions which will enable our customers to increase the quality of their products, whilst lowering energy and production costs.
With the increasingly strict environmental policy in China, recycling will play a key role in our strategy for 2019 and, benefitting from our local expertise and market access, we are targeting our R&D work on creating ‘China for China’ products with increased use of SRM.
Chizhou - our strategy in actionOur investment in the Chizhou mining and brick plant assets in 2018 marked another important strategic step towards improving our competitiveness and supply security in the medium term. By increasing our level of raw material integration, we can improve our unique position in the industry and offer our customers in Asia shorter lead times. We will also have additional dolomite-based capacity for customers in North America, Europe and Asia.
The Chizhou site includes an extensive dolomite mine and raw material production site, as well as facilities for high-quality dolomite-based finished products. After the completion of the investment towards the end of 2019, the Company will be able to offer a fully backward-integrated dolomite source in each of our key global regions.
The project is being conducted in a two phased process. Phase one is on track, with trial production currently underway and our first sales coming onto the market in early 2019.
1 Includes €0.1 million revenue from Hong Kong and Macau
€166m2018 China revenue1
3 3
A N N U A L R E P O R T 2 0 1 8R H I M A G N E S I TA

Key performance indicators
The Board and Management have identified the following indicators which it believes to reflect the financial and non-financial performance of the business.
Safety: LTIF R&D & Technical Marketing spend Voluntary employee turnover Gender diversity in leadership
2018
2017
0.4
1.1
2018
2017
€63m
n/a
2018
2017
12.5%
n/a
2018
2017
12%
8%
KPI relevance KPI relevance KPI relevance KPI relevance
Safety is paramount to the successful running of our business and therefore sits at the core of everything we do. LTIF is the main safety KPI we use to measure the safety performance of the Company. Directors’ remuneration is directly linked to safety objectives.
This demonstrates our commitment to driving innovation and to being the leading provider of services and solutions within the refractories industries. Excellence in R&D and strong Technical Marketing capabilities are key contributors to our competitiveness. The Company aims to invest 2.2% per annum of revenue in R&D and Technical Marketing going forward.
Voluntary employee turnover is considered to be one way of measuring the Group’s success in retaining its people.
Diversity is important in terms of maintaining the Group’s competitiveness and economic success and gender diversity is a key component of this. The Company has a target to increase women on our Board and in senior leadership to 33%.
How it is measured How it is measured How it is measured How it is measured
The number of accidents resulting in lost time of more than eight hours per 200,000 working hours, determined on a monthly basis.
Annual spend on research and development, before subsidies and including opex and capex.
The percentage of employees who voluntarily left the Company during the Year and were replaced by new employees.
Number of women as a percentage of all those in leadership positions (CEO, EMT and EMT direct reports).
2018 performance 2018 performance 2018 performance 2018 performance
LTIF reached an all-time low of 0.4 in 2018, with improvements in all regions. This represents a 60% reduction compared to 2017, far exceeding our 20% target.
Read more about Safety on pages 54 to 55
€63 million was committed to R&D and Technical Marketing in 2018, equating to 2% of revenues, marginally lower than the target as a result of foreign exchange movements and the merger combination process (including restructuring of departments).
Read more about Innovation on pages 22 to 25
Voluntary employee turnover of 12.5% for 2018 was high as a result of the integration following the merger in 2017.
Read more about our People on pages 54 to 57
Female representation at leadership level was greatly enhanced in 2018, increasing to 12% and demonstrating our focus on this area. Diversity at Board level was also significantly improved, with the nomination of two new female Non-Executive Directors to the Board.
Read more about Diversity on pages 56 to 57
Revenue growth Adjusted EBITA margin Adjusted EPS Leverage
2018
2017
21%
11%¹
2018
2017
13.9%
9.3%²
2018
2017
€5.31
n/a
2018
2017
1.2x
1.9x
KPI relevance KPI relevance KPI relevance KPI relevance
This demonstrates the organic growth of the business. By increasing our global refractory market share, continually enhancing our product and service offering, the Company is focused on achieving revenue growth and aims to outperform the refractories market on an annual basis.
Margin expansion provides a measure of profitability and demonstrates the successful execution of the integration and the Company’s corporate strategy. Synergy targets, which impact EBITA margin performance, are included in Directors’ remuneration.
Reflecting the income statement in a clear way and taking the equity structure into account, the Board believes adjusted EPS to be one of the indicators which demonstrate value being created for its shareholders.
A suitable leverage provides the business with headroom for compelling investment opportunities but also enables distribution to shareholders. Directors’ remuneration is directly linked to free cash flow generation, which impacts Group leverage. The Board has defined a long-term leverage target range of 0.5 to 1.5x across the cycle.
How it is measured How it is measured How it is measured How it is measured
Year-on-year percentage improvement; based on pro-forma revenue at a constant currency.
Adjusted EBITA divided by revenue. Earnings per share, excluding items such as FX effect, merger-related costs, re-financing costs and other financial income and expenses.
Net debt to adjusted EBITDA.
2018 performance 2018 performance 2018 performance 2018 performance
Revenue for 2018 amounted to €3,081 million, 21% higher than last year’s pro-forma revenue at constant currency. The significant growth in revenue is underpinned by strong growth in the Group’s Steel and Industrial Division’s results, as well as the favourable market environment.
Based on an adjusted EBITA of €428.1 million, the 460bps improvement in margin was predominantly driven by the significant increase in revenue growth, higher efficiency in operations (leading to better gross margins), the implementation of synergy benefits and also due to the high fixed cost dilution in SG&A.
Adjusted EPS of €5.31 reflected solid performance of the business as well as the achievement of synergies. A comparable adjusted figure is not available for 2017.
Net debt at Year-end amounted to €638.9 million and the Company’s leverage was 0.7x lower than in 2017 as a result of the improved cash generation in 2018.
Read more in our Financial review on pages 36 to 41
R H I M A G N E S I TAS T R AT E G I C R E P O R T
3 4
Link to strategy
Markets Competitiveness People
Safety: LTIF R&D & Technical Marketing spend Voluntary employee turnover Gender diversity in leadership
2018
2017
0.4
1.1
2018
2017
€63m
n/a
2018
2017
12.5%
n/a
2018
2017
12%
8%
KPI relevance KPI relevance KPI relevance KPI relevance
Safety is paramount to the successful running of our business and therefore sits at the core of everything we do. LTIF is the main safety KPI we use to measure the safety performance of the Company. Directors’ remuneration is directly linked to safety objectives.
This demonstrates our commitment to driving innovation and to being the leading provider of services and solutions within the refractories industries. Excellence in R&D and strong Technical Marketing capabilities are key contributors to our competitiveness. The Company aims to invest 2.2% per annum of revenue in R&D and Technical Marketing going forward.
Voluntary employee turnover is considered to be one way of measuring the Group’s success in retaining its people.
Diversity is important in terms of maintaining the Group’s competitiveness and economic success and gender diversity is a key component of this. The Company has a target to increase women on our Board and in senior leadership to 33%.
How it is measured How it is measured How it is measured How it is measured
The number of accidents resulting in lost time of more than eight hours per 200,000 working hours, determined on a monthly basis.
Annual spend on research and development, before subsidies and including opex and capex.
The percentage of employees who voluntarily left the Company during the Year and were replaced by new employees.
Number of women as a percentage of all those in leadership positions (CEO, EMT and EMT direct reports).
2018 performance 2018 performance 2018 performance 2018 performance
LTIF reached an all-time low of 0.4 in 2018, with improvements in all regions. This represents a 60% reduction compared to 2017, far exceeding our 20% target.
Read more about Safety on pages 54 to 55
€63 million was committed to R&D and Technical Marketing in 2018, equating to 2% of revenues, marginally lower than the target as a result of foreign exchange movements and the merger combination process (including restructuring of departments).
Read more about Innovation on pages 22 to 25
Voluntary employee turnover of 12.5% for 2018 was high as a result of the integration following the merger in 2017.
Read more about our People on pages 54 to 57
Female representation at leadership level was greatly enhanced in 2018, increasing to 12% and demonstrating our focus on this area. Diversity at Board level was also significantly improved, with the nomination of two new female Non-Executive Directors to the Board.
Read more about Diversity on pages 56 to 57
Revenue growth Adjusted EBITA margin Adjusted EPS Leverage
2018
2017
21%
11%¹
2018
2017
13.9%
9.3%²
2018
2017
€5.31
n/a
2018
2017
1.2x
1.9x
KPI relevance KPI relevance KPI relevance KPI relevance
This demonstrates the organic growth of the business. By increasing our global refractory market share, continually enhancing our product and service offering, the Company is focused on achieving revenue growth and aims to outperform the refractories market on an annual basis.
Margin expansion provides a measure of profitability and demonstrates the successful execution of the integration and the Company’s corporate strategy. Synergy targets, which impact EBITA margin performance, are included in Directors’ remuneration.
Reflecting the income statement in a clear way and taking the equity structure into account, the Board believes adjusted EPS to be one of the indicators which demonstrate value being created for its shareholders.
A suitable leverage provides the business with headroom for compelling investment opportunities but also enables distribution to shareholders. Directors’ remuneration is directly linked to free cash flow generation, which impacts Group leverage. The Board has defined a long-term leverage target range of 0.5 to 1.5x across the cycle.
How it is measured How it is measured How it is measured How it is measured
Year-on-year percentage improvement; based on pro-forma revenue at a constant currency.
Adjusted EBITA divided by revenue. Earnings per share, excluding items such as FX effect, merger-related costs, re-financing costs and other financial income and expenses.
Net debt to adjusted EBITDA.
2018 performance 2018 performance 2018 performance 2018 performance
Revenue for 2018 amounted to €3,081 million, 21% higher than last year’s pro-forma revenue at constant currency. The significant growth in revenue is underpinned by strong growth in the Group’s Steel and Industrial Division’s results, as well as the favourable market environment.
Based on an adjusted EBITA of €428.1 million, the 460bps improvement in margin was predominantly driven by the significant increase in revenue growth, higher efficiency in operations (leading to better gross margins), the implementation of synergy benefits and also due to the high fixed cost dilution in SG&A.
Adjusted EPS of €5.31 reflected solid performance of the business as well as the achievement of synergies. A comparable adjusted figure is not available for 2017.
Net debt at Year-end amounted to €638.9 million and the Company’s leverage was 0.7x lower than in 2017 as a result of the improved cash generation in 2018.
1 Compared with the adjusted pro-forma revenue of €2,409 million in 20162 On an adjusted, pro-forma, constant currency basis
These KPIs, which relate to the four underlying strategic pillars of the Group, as demonstrated in the key, are monitored and link to the Company’s risk management process. Some of the KPIs are also used as measures for short- and long-term incentives. The Group intends to report on Economic Profit as a KPI from 2019 to measure the creation of long-term value. The Company will also look to further develop reporting of non-financial KPIs in 2019.
Business model
Read more about our Alternative Performance Measures on our website www.rhimagnesita.com
3 5
A N N U A L R E P O R T 2 0 1 8R H I M A G N E S I TA
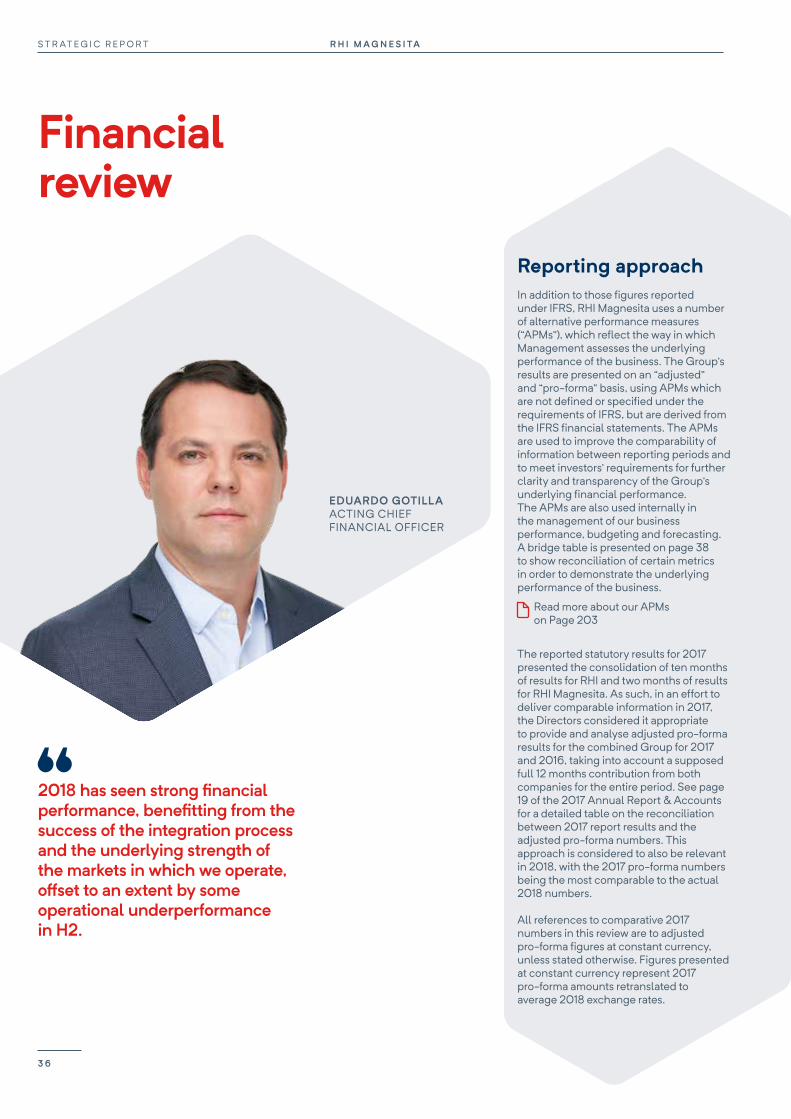
Financialreview
EDUARDO GOTILLAACTING CHIEF FINANCIAL OFFICER
Reporting approachIn addition to those figures reported under IFRS, RHI Magnesita uses a number of alternative performance measures (“APMs”), which reflect the way in which Management assesses the underlying performance of the business. The Group’s results are presented on an “adjusted” and “pro-forma” basis, using APMs which are not defined or specified under the requirements of IFRS, but are derived from the IFRS financial statements. The APMs are used to improve the comparability of information between reporting periods and to meet investors’ requirements for further clarity and transparency of the Group’s underlying financial performance. The APMs are also used internally in the management of our business performance, budgeting and forecasting. A bridge table is presented on page 38 to show reconciliation of certain metrics in order to demonstrate the underlying performance of the business.
Read more about our APMs on Page 203
The reported statutory results for 2017 presented the consolidation of ten months of results for RHI and two months of results for RHI Magnesita. As such, in an effort to deliver comparable information in 2017, the Directors considered it appropriate to provide and analyse adjusted pro-forma results for the combined Group for 2017 and 2016, taking into account a supposed full 12 months contribution from both companies for the entire period. See page 19 of the 2017 Annual Report & Accounts for a detailed table on the reconciliation between 2017 report results and the adjusted pro-forma numbers. This approach is considered to also be relevant in 2018, with the 2017 pro-forma numbers being the most comparable to the actual 2018 numbers.
All references to comparative 2017 numbers in this review are to adjusted pro-forma figures at constant currency, unless stated otherwise. Figures presented at constant currency represent 2017 pro-forma amounts retranslated to average 2018 exchange rates.
2018 has seen strong financial performance, benefitting from the success of the integration process and the underlying strength of the markets in which we operate, offset to an extent by some operational underperformance in H2.
R H I M A G N E S I TAS T R AT E G I C R E P O R T
3 6
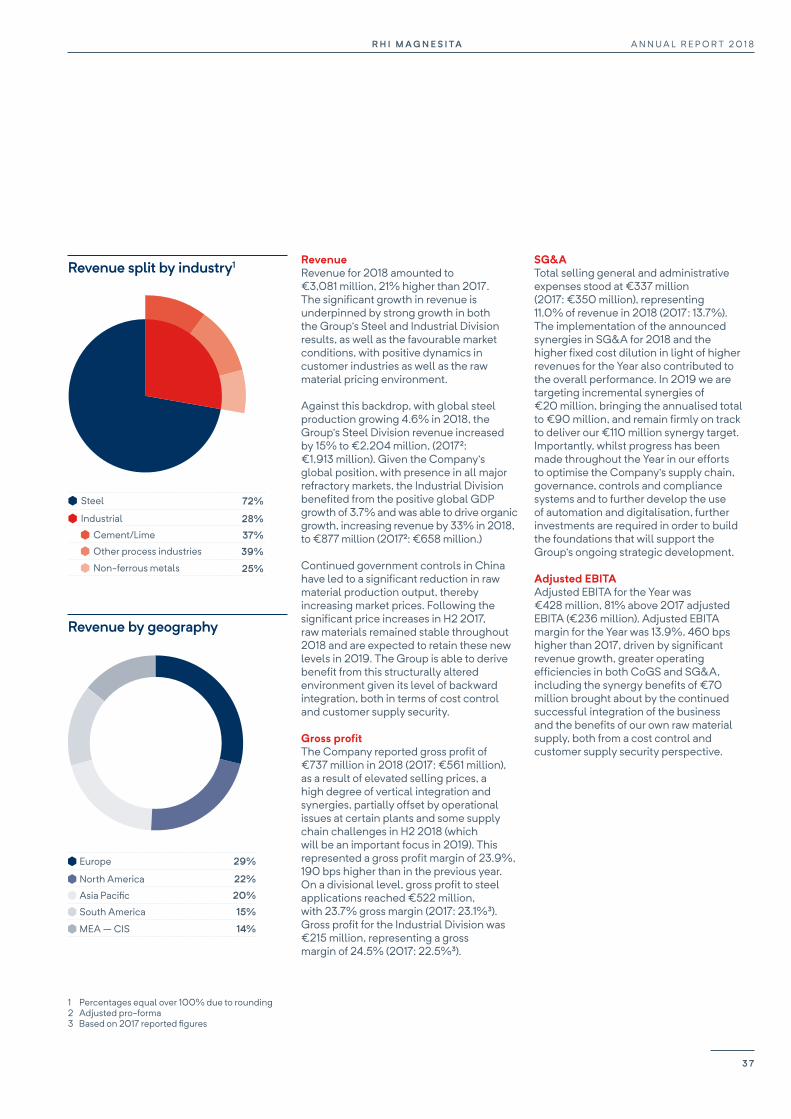
RevenueRevenue for 2018 amounted to €3,081 million, 21% higher than 2017. The significant growth in revenue is underpinned by strong growth in both the Group’s Steel and Industrial Division results, as well as the favourable market conditions, with positive dynamics in customer industries as well as the raw material pricing environment.
Against this backdrop, with global steel production growing 4.6% in 2018, the Group’s Steel Division revenue increased by 15% to €2,204 million, (20172: €1,913 million). Given the Company’s global position, with presence in all major refractory markets, the Industrial Division benefited from the positive global GDP growth of 3.7% and was able to drive organic growth, increasing revenue by 33% in 2018, to €877 million (20172: €658 million.)
Continued government controls in China have led to a significant reduction in raw material production output, thereby increasing market prices. Following the significant price increases in H2 2017, raw materials remained stable throughout 2018 and are expected to retain these new levels in 2019. The Group is able to derive benefit from this structurally altered environment given its level of backward integration, both in terms of cost control and customer supply security.
Gross profitThe Company reported gross profit of €737 million in 2018 (2017: €561 million), as a result of elevated selling prices, a high degree of vertical integration and synergies, partially offset by operational issues at certain plants and some supply chain challenges in H2 2018 (which will be an important focus in 2019). This represented a gross profit margin of 23.9%, 190 bps higher than in the previous year. On a divisional level, gross profit to steel applications reached €522 million, with 23.7% gross margin (2017: 23.1%3). Gross profit for the Industrial Division was €215 million, representing a gross margin of 24.5% (2017: 22.5%3).
SG&ATotal selling general and administrative expenses stood at €337 million (2017: €350 million), representing 11.0% of revenue in 2018 (2017: 13.7%). The implementation of the announced synergies in SG&A for 2018 and the higher fixed cost dilution in light of higher revenues for the Year also contributed to the overall performance. In 2019 we are targeting incremental synergies of €20 million, bringing the annualised total to €90 million, and remain firmly on track to deliver our €110 million synergy target. Importantly, whilst progress has been made throughout the Year in our efforts to optimise the Company’s supply chain, governance, controls and compliance systems and to further develop the use of automation and digitalisation, further investments are required in order to build the foundations that will support the Group’s ongoing strategic development.
Adjusted EBITAAdjusted EBITA for the Year was €428 million, 81% above 2017 adjusted EBITA (€236 million). Adjusted EBITA margin for the Year was 13.9%, 460 bps higher than 2017, driven by significant revenue growth, greater operating efficiencies in both CoGS and SG&A, including the synergy benefits of €70 million brought about by the continued successful integration of the business and the benefits of our own raw material supply, both from a cost control and customer supply security perspective.
1 Percentages equal over 100% due to rounding2 Adjusted pro-forma3 Based on 2017 reported figures
Revenue split by industry1
Revenue by geography
Industrial
Cement/Lime
Non-ferrous metals
Other process industries
Steel
28%
37%
25%
39%
72%
North America 22%
Asia Pacific
MEA – CIS
20%
14%
South America 15%
Europe 29%
3 7
A N N U A L R E P O R T 2 0 1 8R H I M A G N E S I TA
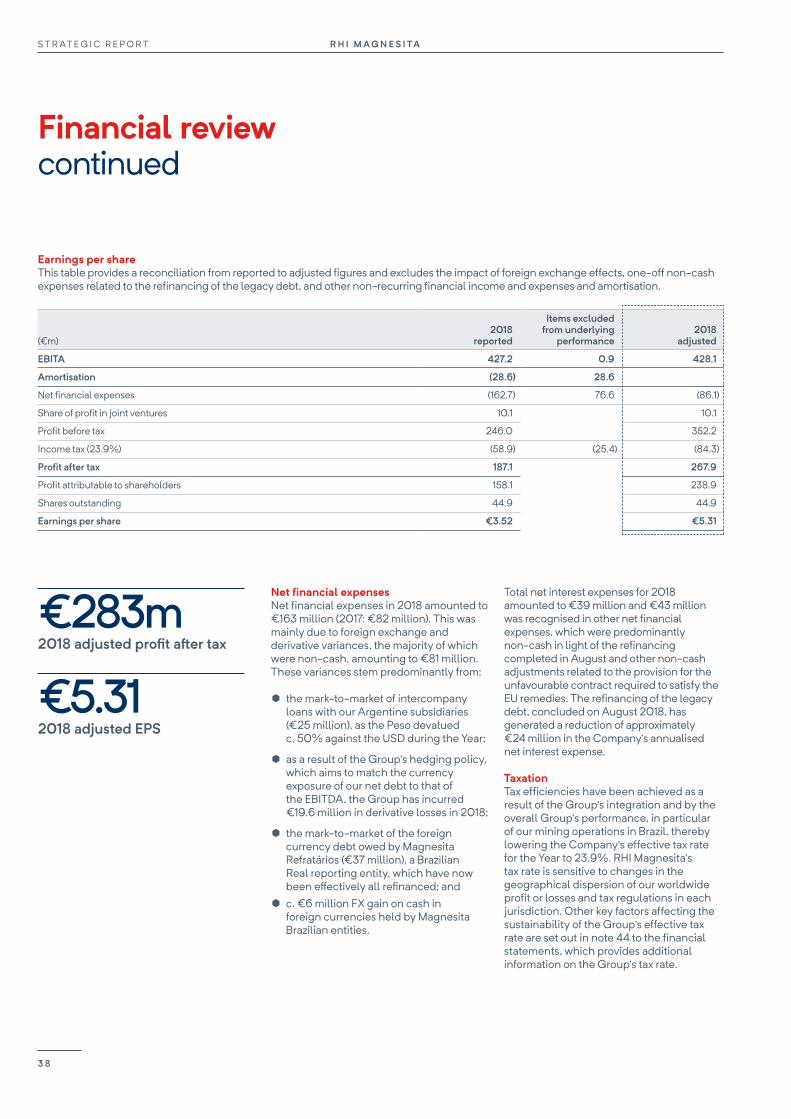
Net financial expensesNet financial expenses in 2018 amounted to €163 million (2017: €82 million). This was mainly due to foreign exchange and derivative variances, the majority of which were non-cash, amounting to €81 million. These variances stem predominantly from:
¥ the mark-to-market of intercompany loans with our Argentine subsidiaries (€25 million), as the Peso devalued c. 50% against the USD during the Year;
¥ as a result of the Group’s hedging policy, which aims to match the currency exposure of our net debt to that of the EBITDA, the Group has incurred €19.6 million in derivative losses in 2018;
¥ the mark-to-market of the foreign currency debt owed by Magnesita Refratários (€37 million), a Brazilian Real reporting entity, which have now been effectively all refinanced; and
¥ c. €6 million FX gain on cash in foreign currencies held by Magnesita Brazilian entities.
Total net interest expenses for 2018 amounted to €39 million and €43 million was recognised in other net financial expenses, which were predominantly non-cash in light of the refinancing completed in August and other non-cash adjustments related to the provision for the unfavourable contract required to satisfy the EU remedies. The refinancing of the legacy debt, concluded on August 2018, has generated a reduction of approximately €24 million in the Company’s annualised net interest expense.
TaxationTax efficiencies have been achieved as a result of the Group’s integration and by the overall Group’s performance, in particular of our mining operations in Brazil, thereby lowering the Company’s effective tax rate for the Year to 23.9%. RHI Magnesita’s tax rate is sensitive to changes in the geographical dispersion of our worldwide profit or losses and tax regulations in each jurisdiction. Other key factors affecting the sustainability of the Group’s effective tax rate are set out in note 44 to the financial statements, which provides additional information on the Group’s tax rate.
Earnings per shareThis table provides a reconciliation from reported to adjusted figures and excludes the impact of foreign exchange effects, one-off non-cash expenses related to the refinancing of the legacy debt, and other non-recurring financial income and expenses and amortisation.
(€m)2018
reported
Items excluded from underlying
performance2018
adjusted
EBITA 427.2 0.9 428.1
Amortisation (28.6) 28.6
Net financial expenses (162.7) 76.6 (86.1)
Share of profit in joint ventures 10.1 10.1
Profit before tax 246.0 352.2
Income tax (23.9%) (58.9) (25.4) (84.3)
Profit after tax 187.1 267.9
Profit attributable to shareholders 158.1 238.9
Shares outstanding 44.9 44.9
Earnings per share €3.52 €5.31
€283m2018 adjusted profit after tax
€5.312018 adjusted EPS
Financial review continued
R H I M A G N E S I TAS T R AT E G I C R E P O R T
3 8

Purchasing Price Allocation (“PPA”)As announced on the Q3 trading update, the Group completed the PPA in relation to the merger between RHI and Magnesita. The process reviewed the fair value of fixed and intangible assets as a result of the merger, causing depreciation and amortisation to increase by €37 million and €11 million respectively in 2018.
Profit after tax and earnings per shareOn a reported basis, the Company recorded a net profit of €187 million and earnings per share (“EPS”) of €3.52 per share in 2018 (2017: €10.8 million net loss and €0.43 loss per share respectively).
Adjusted earnings per share for 2018 were €5.31, which is stated after excluding the following items, which predominantly relate to the acquisition of Magnesita SA and related refinancing and foreign exchange effects:
¥ Other income and expenses (€0.9 million);
¥ Amortisation (€28.6 million); and ¥ Net financial expenses (€76.6 million):
Impact of foreign exchange movements on certain of the Group’s non-Euro denominated debt balance of €81 million, as detailed in the “Net Financial Expenses” section above, excluding the €19.6 million in derivative losses; One-off non-cash expenses related to the refinancing of the legacy debt (€10.6 million); Other non-recurring financial income and expenses (€4.4 million).
These are represented in the table on page 38.
Cash flowCash flow from operations amounted to €462 million in 2018 (2017: €255 million), with the 81% increase being driven by the strong operating performance of the Group as well as efficiencies in working capital (with a 670bps year-on-year improvement in working capital intensity) as well as an overall higher profit for the Year.
Cash outflow from financing activities amounted to €245 million in 2018 as the Group focused on improving the debt amortisation profile and reducing recurring interest expense payments. As part of the previously announced debt restructuring programme to substitute the legacy debt, prepayments of the perpetual bond and certain short-term facilities were made during the Year, generating significant interest expense savings. As a result, the Company was able to negotiate more flexible covenants and term out its debt amortisation schedule, such that more than 70% of the Group’s maturities are due on or after 2022.
Operating and free cash flowThe below table demonstrates the underlying operating and free cash flow generation of the business.
2018€m
Adjusted EBITA 428.1
Working capital 48.7
Changes in other assets/liabilities (40.9)
Capex (122.6)
Depreciation 124.8
Operating free cash flow1 438.2
Cash Tax (67.9)
Net interest expense (62.8)
Restructuring and transaction costs (52.2)
Dividend payout (34.7)
Free cash flow 220.5
Capital expenditureCash flow from investing activities registered an outflow of €101 million and capital expenditure for 2018 stood at €123 million (2017: €72 million). The multiple of capital expenditure to depreciation was 0.98x (2017: 1.09x) in line with RHI Magnesita’s capital allocation policy and investment profile. Maintenance capex is guided at around €110 million in 2019 and beyond. The Group will continue to invest in its strategic priorities aligned with its newly defined capital allocation policy.
Working capitalWorking capital intensity in 2018 saw significant improvements when compared to 2017 pro-forma figures, both in absolute terms and as a percentage of revenue. Cash flow generation from working capital in 2018 amounted to €48.7 million, driven primarily by improvements on accounts payable and accounts receivable as a consequence of improving our terms with both clients and suppliers and factoring initiatives. The overall positive impact on the balance sheet was partially offset by the higher inventory consumption in 2018, as a result of increased sales volumes and higher raw material costs. Working capital as an absolute value stood at €511 million at the end of 2018. As a percentage of revenue, it was 15.4% at Year end (calculated using last three months annualised revenue), 680bps lower than the previous year (22.2%2).
Net debtNet debt at Year-end amounted to €639 million, comprising total debt of €1,166 million, cash and cash equivalents of €491 million and marketable securities of €36 million. This compared to net debt of €751 million in 2017. In line with the Company’s commitment to deleverage, net debt/EBITDA stood at 1.2x, 0.7x lower than in 2017 1 as result of the improved cash generation in 2018, despite the outflows related to our restructuring costs and the payout to Magnesita’s minority shareholders. See further detail on ongoing leverage target range on page 40.
1 Operating free cash flow is presented to reflect net cash inflow from operating activities before certain items such as restructuring costs. See APMs for further detail
2 Based on 2017 adjusted pro-forma last six months annualised revenue
3 9
A N N U A L R E P O R T 2 0 1 8R H I M A G N E S I TA

Integrated Tender OfferAs previously announced, RHI Magnesita launched an Integrated Tender Offer (“ITO“) to the minority shareholders of Magnesita in November 2018. At the end of the first close of the ITO on 10 December 2018 RHI Magnesita owned 85.2% of Magnesita and had issued a total of 3,518,008 new RHI Magnesita shares, along with €85.2 million of cash consideration. As at the final close of the ITO, on 10 March 2019, RHI Magnesita owned 97.5% of Magnesita and had issued a total of 4,657,408 new RHI Magnesita shares, along with a total €115.4 million of cash consideration.
Successful delivery of synergiesThe integration of the two companies led to significant cost saving synergies via procurement and supply chain management as well as SG&A efficiencies; all of which exceeded initial expectations. In August 2018, the Company announced an increased synergy target of €110 million (from €70 million) to be realised by 2020 and synergy benefits of at least €60 million in 2018. In 2018, synergies of €70 million were achieved.
Returns to shareholdersUnderpinned by the strong performance of the business and given its strong annual cash generation, the Board has considered the long-term dividend policy in the context of its capital allocation strategy.
For 2018, the Board has recommended a final dividend of €1.50 per share for the full financial year, equating to an increase of 100% over the previous year. This represents a dividend cover of 3.5x adjusted earnings per share.
Going forward, the Board’s dividend policy will be to progressively increase ordinary dividends and to target a dividend cover of less than 3.0x adjusted earnings over the medium term. Dividends will be paid on a semi-annual basis with one third of the prior year’s full year dividend being paid at the interim.
Future growth plansThrough the cycle, the Group expects organic growth to exceed the broader refractories industry. In the short term this expectation is supported by further market share gains, the continued investment in R&D and the opportunities in the growth markets of China and India. In the medium to long term, this expectation will also be driven by new business models and solutions. We anticipate that this nominal organic growth should average 1-3% per year through the cycle.
Alongside the organic growth opportunities, there will be further growth from acquisitions. Over time, we expect acquisitions to deliver average growth at levels similar to the organic growth.
Capital allocation policySince the merger, RHI Magnesita has made good progress in terms of integration and in the execution of its corporate strategy as well as delivering on the targeted synergies. This has led to leverage continuing to reduce significantly, reaching 1.2x net debt to adjusted EBITDA at Year-end.
The Board’s capital allocation objective remains to support the long-term Group strategy, providing flexibility for both organic and inorganic investment opportunities and increasing shareholder returns over time. These opportunities will be considered against a framework of strategic fit, risk profile and rates of return, in the context of acquisitions synergy potential and balance sheet strength.
Going forward, the Group intends to target leverage of between 0.5x and 1.5x net debt to adjusted EBITDA. Should a highly attractive acquisition opportunity present itself, the Group will consider exceeding 1.5x leverage for larger acquisitions, but with the intention to de-lever quickly and back to the target leverage range within 24 months. If the Group leverage is consistently below 0.5x the Group will consider additional shareholder returns, such as share buybacks and special dividends, taking into account the opportunities available to the Group.
3.5xdividend cover of proposed dividend
1.2xnet debt to adjusted EBITDA
As a result of our ongoing focus on cash generation, the business has strongly de-levered through the Year providing a solid financial position from which to commence a progressive dividend policy.
Financial reviewcontinued
R H I M A G N E S I TAS T R AT E G I C R E P O R T
4 0
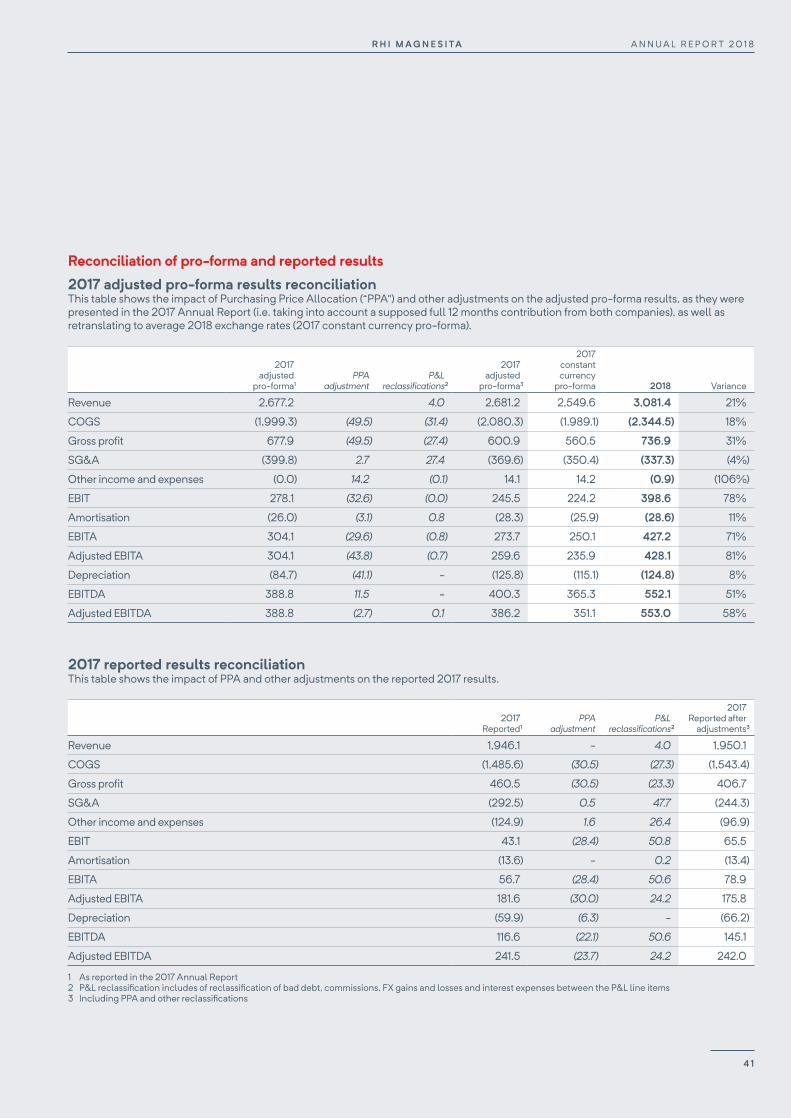
Reconciliation of pro-forma and reported results2017 adjusted pro-forma results reconciliationThis table shows the impact of Purchasing Price Allocation (“PPA”) and other adjustments on the adjusted pro-forma results, as they were presented in the 2017 Annual Report (i.e. taking into account a supposed full 12 months contribution from both companies), as well as retranslating to average 2018 exchange rates (2017 constant currency pro-forma).
2017adjusted
pro-forma1PPA
adjustmentP&L
reclassifications2
2017adjusted
pro-forma3
2017constant currency
pro-forma 2018 Variance
Revenue 2,677.2 4.0 2,681.2 2,549.6 3,081.4 21%
COGS (1,999.3) (49.5) (31.4) (2,080.3) (1,989.1) (2,344.5) 18%
Gross profit 677.9 (49.5) (27.4) 600.9 560.5 736.9 31%
SG&A (399.8) 2.7 27.4 (369.6) (350.4) (337.3) (4%)
Other income and expenses (0.0) 14.2 (0.1) 14.1 14.2 (0.9) (106%)
EBIT 278.1 (32.6) (0.0) 245.5 224.2 398.6 78%
Amortisation (26.0) (3.1) 0.8 (28.3) (25.9) (28.6) 11%
EBITA 304.1 (29.6) (0.8) 273.7 250.1 427.2 71%
Adjusted EBITA 304.1 (43.8) (0.7) 259.6 235.9 428.1 81%
Depreciation (84.7) (41.1) - (125.8) (115.1) (124.8) 8%
EBITDA 388.8 11.5 - 400.3 365.3 552.1 51%
Adjusted EBITDA 388.8 (2.7) 0.1 386.2 351.1 553.0 58%
2017 reported results reconciliationThis table shows the impact of PPA and other adjustments on the reported 2017 results.
2017Reported1
PPAadjustment
P&L reclassifications2
2017 Reported after
adjustments3
Revenue 1,946.1 - 4.0 1,950.1
COGS (1,485.6) (30.5) (27.3) (1,543.4)
Gross profit 460.5 (30.5) (23.3) 406.7
SG&A (292.5) 0.5 47.7 (244.3)
Other income and expenses (124.9) 1.6 26.4 (96.9)
EBIT 43.1 (28.4) 50.8 65.5
Amortisation (13.6) - 0.2 (13.4)
EBITA 56.7 (28.4) 50.6 78.9
Adjusted EBITA 181.6 (30.0) 24.2 175.8
Depreciation (59.9) (6.3) - (66.2)
EBITDA 116.6 (22.1) 50.6 145.1
Adjusted EBITDA 241.5 (23.7) 24.2 242.0
1 As reported in the 2017 Annual Report2 P&L reclassification includes of reclassification of bad debt, commissions, FX gains and losses and interest expenses between the P&L line items3 Including PPA and other reclassifications
4 1
A N N U A L R E P O R T 2 0 1 8R H I M A G N E S I TA

Risks, viability & internal controls
RisksRisk management frameworkThis framework is based on an explicit discussion about the nature and extent of the risks acceptable to the Group (“risk appetite”) and it relies on a formally defined identification and assessment process. The risk appetite and policy is defined by the Board. Due to the far-reaching implications of this risk appetite on behaviours and decision-making, it has been discussed thoroughly by management and designed carefully. Communication of the risk appetite and risk management framework at all levels of the organisation is considered important. The next steps for the further development of the risk framework, including the cascading of the approved risk policy throughout the organisation, have been agreed by the Board.
Development of the risk identification and assessment processThe roll-out of the bottom-up risks identification and assessment process was completed in 2018. All functional and operational managers involved in this process received training on the structures and methods within the Group’s risk management process, as well as on the usage of the reporting software.
In addition to this bottom-up process aimed at ensuring that all material operational risk issues are adequately monitored and escalated, strategic risks were discussed with senior executives in the course of the strategy definition and mid-term planning process. The further integration of risk management processes in the existing governance structures have been decided.
In order to further embed risk considerations into decision-making, the Risk Management function was integrated with the Investment Planning function at the beginning of 2019.
Risk mitigation All risks considered to be unacceptable on account of their nature or their potential financial or qualitative impacts are mitigated by appropriate strategies. The implementation and effectiveness of the defined mitigation measures are reviewed continuously and additional actions are defined if necessary.
For this purpose, the impacts of risks are considered before and after the implementation of those mitigation measures.
Our principal risksThe risks identified in the following are those the Board considers to be principal to the business and which may have a significant impact on the results of the Group and on its ability to achieve its strategic objectives. They may occur independently from each other or in combination. In cases where they occur in combination their impact may be reinforced. This is not an exhaustive list of risks faced by the Company but encompasses those considered to be most material.
Given 2018 was the first full financial year following the merger, it has been considered more appropriate to report on risk change throughout the Year in 2019. However, the principal risks were reviewed during the Year and amended to reflect the current situation, with risks related to the merger having been removed and the addition of significant changes in the competitive environment or speed of disruptive innovation, inability to execute a key strategic initiative or necessary adjustments to core operations and cyber and Information Security risk.
A risk appetite rating has been applied to each risk, ranking from averse to minimal, cautious and flexible.
We assess our principal risks in terms of their potential impact on our ability to deliver our strategic objectives, their likelihood to occur and their potential velocity. Those risks and their assessments are reviewed regularly by the Board.
Management “In-Control” StatementThe Board and EMT are responsible for ensuring the Company has adequate risk management and internal control systems in place.
The core design of the internal control systems is based on extensive work conducted as part of the merger activity.
The Group has developed a formal Risk Management framework with the objective of systematically identifying, assessing and controlling uncertainties and risks related to existing operations and future development areas.
Group risk chart
Key to principal risks Macroeconomic environment and
condition of customer industries Regulatory and compliance risks Fluctuations in exchange rates and
energy prices, increasing volatility of raw material prices
Significant changes in the competitive environment or speed of disruptive innovation (new)
Inability to execute a key strategic initiative or necessary adjustments to core operations (new)
Business interruption and supply chain disruption
Environment, Health & Safety risks Cyber and information security risk (new)
1
2 3
4
5
6
7 8
Velocity: Rapid - within 3 months Moderate - within 12 months Slow - > 12 months
rare
minor low moderate high critical
unlikely
likely
very likely
possible
Like
lihoo
d
Impact
48
7
1
2
3
5
6
R H I M A G N E S I TAS T R AT E G I C R E P O R T
4 2

During 2017, the risk management and internal control systems of both RHI and Magnesita were reviewed by the EMT and independently by third-party experts. The respective reports, issued in October 2017, indicated no material deficiencies and were reviewed by and extensively discussed with the Board. These reports continue to act as a guide for the evolution and strengthening of internal controls to reflect the integrated Company. The key internal control measures during 2018 included reviews of financial performance and key control weakness at each Board meeting, monthly and quarterly EMT review and challenge of operational financial performance, zero-based business planning process, establishing enhanced capabilities within the Group Finance function, aligning the financial reporting processes within the integrated Company, continued deployment of the corporate culture and values, reinforcement of the Code of Conduct, assessment of leadership capabilities, enhancing the whistle-blowing process and strengthening the Internal Audit, Compliance and Legal functions. All key changes in the internal control systems were reviewed by the EMT. Each leader is accountable for the effectiveness of the internal controls within their area of responsibility. Measures are applied in each functional area to assess the effectiveness of internal controls and any identified issues are escalated. Control weaknesses identified by management and those identified through the quality management system reviews, risk management activity and internal audit reports are escalated to the EMT and the Audit Committee for review and resolution.
In 2018 a bottom-up risk identification and assessment process was conducted. This process is based on the direct and full integration of all functional and operational managers, uniform structures and methods as well as the use of specialised software and makes sure that material risks can be discussed and monitored adequately by the EMT and the Directors. The Audit Committee was informed about the outcome of this process and steps to improve the effectiveness were defined. In addition, the risk appetite was discussed and approved by the Audit Committee and the Board.
During 2019, the focus will be on increasing the awareness on all hierarchical levels about the defined risk appetite. This includes creating a more tangible definition of the risk appetite which will be aligned with the Audit Committee in the first half of 2019 and then applied to the design of the relevant internal controls.
The Directors have assessed the viability of the Group over a three year period to December 2021, the period covered by the latest business plan, taking account of the Group’s current position, individual asset performance forecasts and the potential impact of the principal risks disclosed on pages 45 to 47.
The business plan considers the Group’s cash flow, capital commitments, financial resources, debt covenants and other key financial risks. It is based on the 2019 Budget and projections for the following years. The growth assumptions underlying the Group’s projections are based on drivers such as steel production, GDP growth as well as strategic measures. Steel production and GDP growth have been sourced from external sources including CRU and IMF.
On 27 November 2018, the 2019 Budget was presented to the Board of Directors where the underlying growth, profitability, cash flow, working capital development and potential risks to the business were discussed. Based on the 2019 Budget, it is expected that all relevant KPIs will improve when compared to 2018 with leverage projected to be below 1x.
Based on the Group’s 2018 financial results and the projections for 2019, projections for subsequent years have also been extrapolated.
Based on the risk analysis conducted in 2018, several stress overlays have been defined and the financial impact on the business plan has been calculated. The following stress overlays were presented to the Audit Committee on 21 January 2019 and are considered to be the principal risks related to the Group’s business:
¥ Volume decrease due to severe market changes
¥ Price decrease for Chinese raw materials
¥ Loss of market share ¥ Failure to implement a key
strategic initiative ¥ Execution risk in regard to profitability
and capital allocation ¥ Financing risk - loss of ability to factor
and execute purchasing programme
The overlay of losing market share combined with significant price pressure on Basic products has been identified as the most severe. The results of this overlay showed increasing leverage and additional cash demand. The Board believes that by implementing capex and opex saving programmes as well as financing activities, this risk could be sufficiently mitigated. The Group’s current financing facilities provide flexibility including a covenant leverage of 3.5x. None of the stress overlays demonstrated a leverage of greater than 3.5x.
The Directors believe that the Group is well-placed to manage its principal risks successfully. In making this statement the Directors have considered the resilience of the Group, taking account of its current position, the risk appetite, the principal risks facing the business in severe but reasonable scenarios, and the effectiveness of any mitigating actions.
Based on this assessment, the Directors have a reasonable expectation that the Group and Company will be able to continue in operation and meet its liabilities as they fall due over the period to December 2021. The Directors have determined that the three year period to December 2021 is an appropriate period having regard to the Group’s business model, strategy, principal risks and uncertainties, and viability.
The Directors believe that the above-mentioned business plan and the conducted risk analysis provide evidence of the viability of the business over the next three years and no material risk that could endanger the viability or continuity of the business.
Viability statement
4 3
A N N U A L R E P O R T 2 0 1 8R H I M A G N E S I TA

Risks, viability & internal controlscontinued
Internal control systemThe Board is ultimately responsible for maintaining effective corporate governance, which includes the Group’s risk management approach, the Group’s system of internal controls and the Group’s internal audit approach.
The Board reviews the effectiveness of the system of internal financial, operational and compliance controls and the risk management framework. The Board examines whether the system of internal controls operated effectively throughout the Year and will make recommendations when appropriate.
These systems are based on the three lines of defence model, supported by an internal control guideline reflecting the responsibility for risk management and internal controls at all management levels.
The Group’s risk management framework is designed to enable the application of the Group’s risk appetite. This typically seeks to avoid or mitigate risks rather than to eliminate completely the risks associated with the accomplishment of the Group’s strategic objectives. It provides reasonable assurance but not absolute assurance against material misstatement or loss.
The Group has in place a specific risk management approach and an internal control framework in relation to its financial reporting process and the process of preparing the financial statements. These systems include policies and procedures to ensure that adequate accounting records are maintained and transactions are recorded accurately and fairly to permit the preparation of financial statements in accordance with the applicable accounting standards. For the accounting process, an accounting handbook is available that addresses all the internal control issues into the accounting process.
As part of the ongoing integration activity the Audit Committee oversaw, in 2018, a review of the capability of the Finance leadership team. Following this review, a number of organisation changes were made to both align the Finance leadership team more closely to the requirements of the integrated business and enhance capability. Work continued in 2018 to harmonise systems and processes within the Finance internal control framework.
The Group has an internal audit function, with a reporting line to the Chair, Audit Committee and a secondary reporting line, for day-to-day operational matters, to the CFO. The internal audit function provides assurance to the Audit Committee and the Board on the design and effectiveness of the internal control framework.
The internal audit function conducts its activities in a risk-based manner, developing an annual internal audit plan, based on the results of the risk assessment of various business units and strategic priorities.
The Audit Committee conducts an annual assessment of the effectiveness and capability of internal audit. During 2018 the Audit Committee concluded that, to meet the challenges and risk profile of the Company, the capability of internal audit required strengthening. A newly created role in the integrated Company, Group Head of Internal Audit was filled in September 2018 and the two legacy internal audit functions combined into a new single global function. Additional internal audit resource will be in place in Americas, Europe and Asia in 2019. A fresh approach to compiling the internal audit programme has led to the Audit Committee approving a more comprehensive annual internal audit plan for 2019 with a greater focus on strategic risks, global business processes, IT and business transformation.
During 2018, the internal audit function conducted 17 planned internal audits and 20 special investigations, reporting the most relevant observations and recommendations to the Audit Committee.
In 2018, the Group has not identified any individual material failings in its internal risk management and control system; however the reports by management and internal audit facilitated consideration by the Audit Committee and appropriate management responses on the following key control framework challenges in 2018:
¥ Improving awareness and controls relating to externally originated email-based fraud attempts
¥ Extending the coverage of compliance training
¥ Continuing the development of the whistle-blowing reporting process
¥ Improving the control framework for the Services Business in South America
¥ Improving the consistency and execution of stock management controls
¥ Addressing the wider challenge to design and execute a consistent and appropriate internal control framework in an empowered, entrepreneurial, dynamic, global corporate culture still completing integration activities
Although the Board considers the Company’s risk management and internal control process are appropriate and effective to give reasonable, but not absolute assurance against material misstatement or loss, given the recent merger and decentralised nature of the Group, the need for continued focus on enhancing the internal control environment remains.
R H I M A G N E S I TAS T R AT E G I C R E P O R T
4 4

Appetite
Principal risk Example of risksAction taken by management
1. Macroeconomic environment and condition of customer industries
Link to strategy
Link to appetite
Changes in the global economic environment and adverse political developments may have an impact on the Group’s revenue and profitability.
The demand for refractory products is directly influenced by steel production, the investment climate, metal and energy prices and the production methods used by customers.
Due to the Group’s cost structure, fluctuations in sales volumes have an impact on the utilisation of the production capacities, and consequently on the Group’s profitability.
¥ Decreasing investment in infrastructure (steel, cement demand) leading to lower refractory consumption
¥ Customer focus on low cost products
¥ Decreasing fixed costs coverage
¥ Diversification in terms of geographies and industries
¥ Optimisation of the production network through complexity reduction and efficiency increases
¥ Achieving lowest cost G&A services
¥ Monitoring of economic market drivers
2. Regulatory and compliance risks
Link to strategy
Link to appetite
We strive to establish a culture of compliance throughout the organisation. Nevertheless, like many other corporations which operate internationally, we are confronted with increasing regulatory complexity and are exposed to regulatory and compliance risks which may result in financial losses or operational restrictions.
In addition to this, sudden regulatory changes could impact the profitability of our operations and our need for investment.
¥ Failure to act in accordance with our “Code of Conduct”
¥ Violation of anti-corruption law by employees or third-party representatives
¥ Violation of data privacy regulations
¥ Code of conduct and compliance policies and procedures
¥ Internal control system, in particular in exposed processes
¥ Ethical values supported by strong corporate culture
¥ Mid-term investment planning
3. Fluctuations in exchange rates and energy prices, increasing volatility of raw material prices
Link to strategy
Link to appetite
Due to the Group’s global sales and production activities, revenue and profitability may be impacted by currency fluctuations.
The Group relies on external supply of energy and raw materials for its production activities. Fluctuations in demand and/or supply from global markets (especially from China) have a significant impact on the prices and hence on the production costs of refractory products.
¥ Increasing volatility of revenue and profit
¥ Loss of competitiveness of operations outside China
¥ Increasing price pressure and loss of margin
¥ Active balance sheet and exposure management
¥ Improvement of energy efficiency
¥ High level of vertical integration
¥ Securing higher level of raw material supply including secondary raw materials
Cautious FlexibleMinimalAverse
Link to strategy
Markets Competitiveness People Business model
Appetite
Cautious FlexibleMinimalAverse
4 5
A N N U A L R E P O R T 2 0 1 8R H I M A G N E S I TA
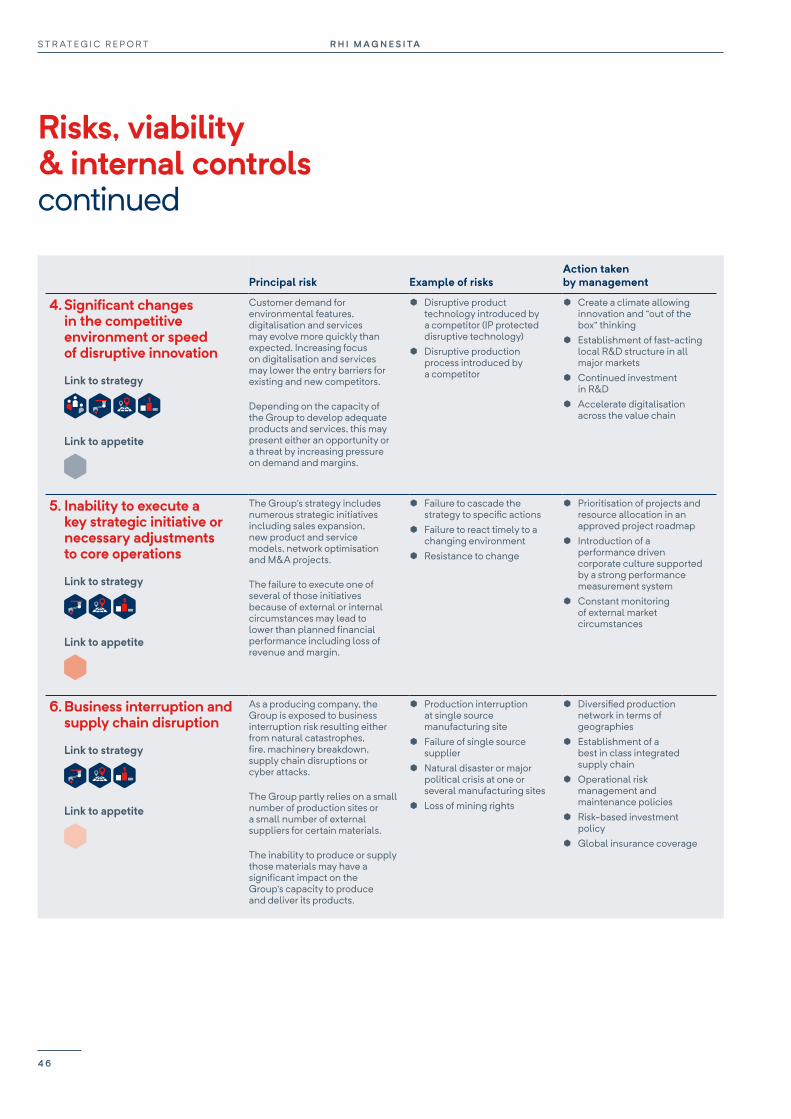
Risks, viability & internal controlscontinued
Principal risk Example of risksAction taken by management
4. Significant changes in the competitive environment or speed of disruptive innovation
Link to strategy
Link to appetite
Customer demand for environmental features, digitalisation and services may evolve more quickly than expected. Increasing focus on digitalisation and services may lower the entry barriers for existing and new competitors.
Depending on the capacity of the Group to develop adequate products and services, this may present either an opportunity or a threat by increasing pressure on demand and margins.
¥ Disruptive product technology introduced by a competitor (IP protected disruptive technology)
¥ Disruptive production process introduced by a competitor
¥ Create a climate allowing innovation and “out of the box” thinking
¥ Establishment of fast-acting local R&D structure in all major markets
¥ Continued investment in R&D
¥ Accelerate digitalisation across the value chain
5. Inability to execute a key strategic initiative or necessary adjustments to core operations
Link to strategy
Link to appetite
The Group’s strategy includes numerous strategic initiatives including sales expansion, new product and service models, network optimisation and M&A projects.
The failure to execute one of several of those initiatives because of external or internal circumstances may lead to lower than planned financial performance including loss of revenue and margin.
¥ Failure to cascade the strategy to specific actions
¥ Failure to react timely to a changing environment
¥ Resistance to change
¥ Prioritisation of projects and resource allocation in an approved project roadmap
¥ Introduction of a performance driven corporate culture supported by a strong performance measurement system
¥ Constant monitoring of external market circumstances
6. Business interruption and supply chain disruption
Link to strategy
Link to appetite
As a producing company, the Group is exposed to business interruption risk resulting either from natural catastrophes, fire, machinery breakdown, supply chain disruptions or cyber attacks.
The Group partly relies on a small number of production sites or a small number of external suppliers for certain materials.
The inability to produce or supply those materials may have a significant impact on the Group’s capacity to produce and deliver its products.
¥ Production interruption at single source manufacturing site
¥ Failure of single source supplier
¥ Natural disaster or major political crisis at one or several manufacturing sites
¥ Loss of mining rights
¥ Diversified production network in terms of geographies
¥ Establishment of a best in class integrated supply chain
¥ Operational risk management and maintenance policies
¥ Risk-based investment policy
¥ Global insurance coverage
R H I M A G N E S I TAS T R AT E G I C R E P O R T
4 6
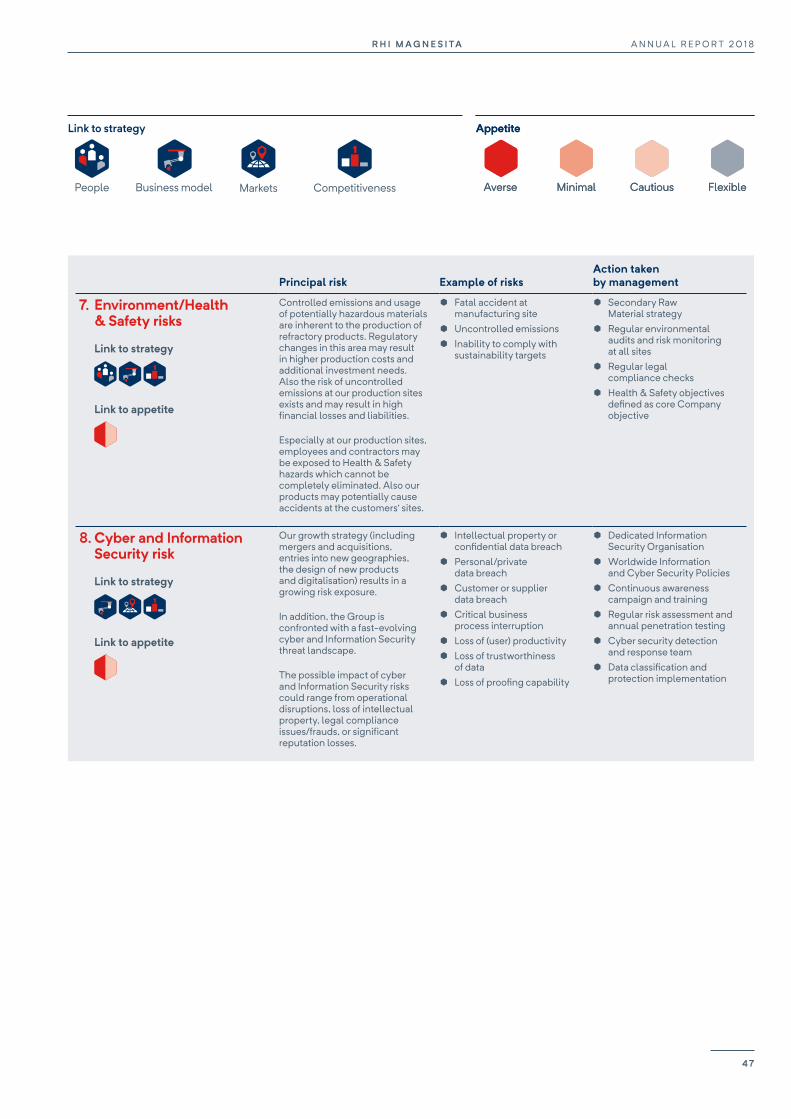
Principal risk Example of risksAction taken by management
7. Environment/Health & Safety risks
Link to strategy
Link to appetite
Controlled emissions and usage of potentially hazardous materials are inherent to the production of refractory products. Regulatory changes in this area may result in higher production costs and additional investment needs. Also the risk of uncontrolled emissions at our production sites exists and may result in high financial losses and liabilities.
Especially at our production sites, employees and contractors may be exposed to Health & Safety hazards which cannot be completely eliminated. Also our products may potentially cause accidents at the customers’ sites.
¥ Fatal accident at manufacturing site
¥ Uncontrolled emissions ¥ Inability to comply with
sustainability targets
¥ Secondary Raw Material strategy
¥ Regular environmental audits and risk monitoring at all sites
¥ Regular legal compliance checks
¥ Health & Safety objectives defined as core Company objective
8. Cyber and Information Security risk
Link to strategy
Link to appetite
Our growth strategy (including mergers and acquisitions, entries into new geographies, the design of new products and digitalisation) results in a growing risk exposure.
In addition, the Group is confronted with a fast-evolving cyber and Information Security threat landscape.
The possible impact of cyber and Information Security risks could range from operational disruptions, loss of intellectual property, legal compliance issues/frauds, or significant reputation losses.
¥ Intellectual property or confidential data breach
¥ Personal/private data breach
¥ Customer or supplier data breach
¥ Critical business process interruption
¥ Loss of (user) productivity ¥ Loss of trustworthiness
of data ¥ Loss of proofing capability
¥ Dedicated Information Security Organisation
¥ Worldwide Information and Cyber Security Policies
¥ Continuous awareness campaign and training
¥ Regular risk assessment and annual penetration testing
¥ Cyber security detection and response team
¥ Data classification and protection implementation
Link to strategy
Markets Competitiveness People Business model
Appetite
Cautious FlexibleMinimalAverse
Appetite
Cautious FlexibleMinimalAverse
4 7
A N N U A L R E P O R T 2 0 1 8R H I M A G N E S I TA
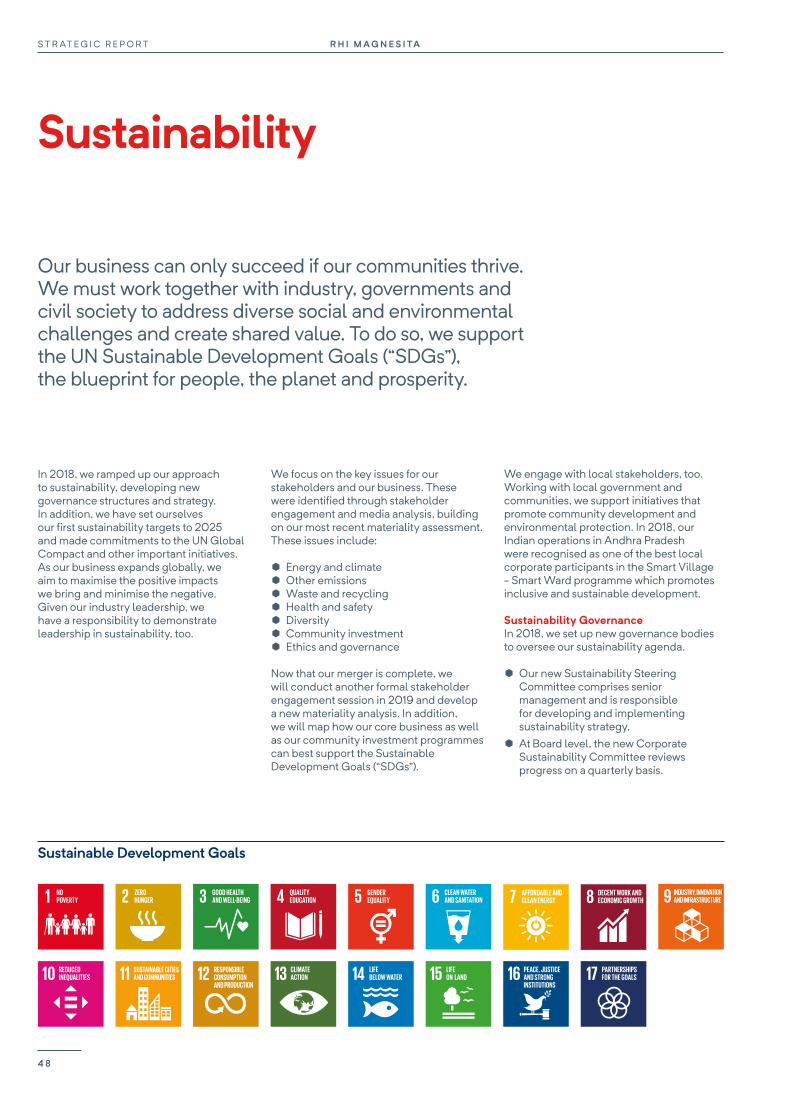
Sustainability
Our business can only succeed if our communities thrive. We must work together with industry, governments and civil society to address diverse social and environmental challenges and create shared value. To do so, we support the UN Sustainable Development Goals (“SDGs”), the blueprint for people, the planet and prosperity.
In 2018, we ramped up our approach to sustainability, developing new governance structures and strategy. In addition, we have set ourselves our first sustainability targets to 2025 and made commitments to the UN Global Compact and other important initiatives. As our business expands globally, we aim to maximise the positive impacts we bring and minimise the negative. Given our industry leadership, we have a responsibility to demonstrate leadership in sustainability, too.
We focus on the key issues for our stakeholders and our business. These were identified through stakeholder engagement and media analysis, building on our most recent materiality assessment. These issues include:
¥ Energy and climate ¥ Other emissions ¥ Waste and recycling ¥ Health and safety ¥ Diversity ¥ Community investment ¥ Ethics and governance
Now that our merger is complete, we will conduct another formal stakeholder engagement session in 2019 and develop a new materiality analysis. In addition, we will map how our core business as well as our community investment programmes can best support the Sustainable Development Goals (“SDGs”).
We engage with local stakeholders, too. Working with local government and communities, we support initiatives that promote community development and environmental protection. In 2018, our Indian operations in Andhra Pradesh were recognised as one of the best local corporate participants in the Smart Village - Smart Ward programme which promotes inclusive and sustainable development.
Sustainability GovernanceIn 2018, we set up new governance bodies to oversee our sustainability agenda.
¥ Our new Sustainability Steering Committee comprises senior management and is responsible for developing and implementing sustainability strategy.
¥ At Board level, the new Corporate Sustainability Committee reviews progress on a quarterly basis.
Sustainable Development Goals
R H I M A G N E S I TAS T R AT E G I C R E P O R T
4 8
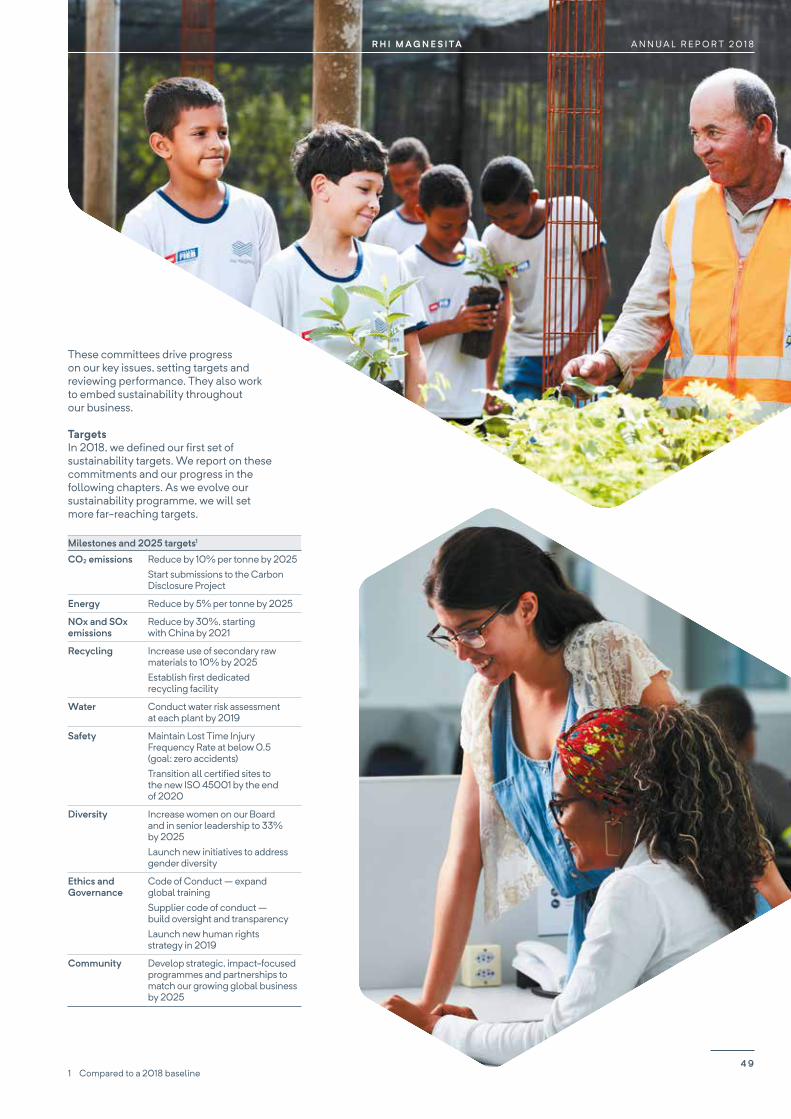
These committees drive progress on our key issues, setting targets and reviewing performance. They also work to embed sustainability throughout our business.
TargetsIn 2018, we defined our first set of sustainability targets. We report on these commitments and our progress in the following chapters. As we evolve our sustainability programme, we will set more far-reaching targets.
Milestones and 2025 targets1
CO2 emissions Reduce by 10% per tonne by 2025 Start submissions to the Carbon Disclosure Project
Energy Reduce by 5% per tonne by 2025
NOx and SOx emissions
Reduce by 30%, starting with China by 2021
Recycling Increase use of secondary raw materials to 10% by 2025Establish first dedicated recycling facility
Water Conduct water risk assessment at each plant by 2019
Safety Maintain Lost Time Injury Frequency Rate at below 0.5 (goal: zero accidents)Transition all certified sites to the new ISO 45001 by the end of 2020
Diversity Increase women on our Board and in senior leadership to 33% by 2025Launch new initiatives to address gender diversity
Ethics and Governance
Code of Conduct – expand global training Supplier code of conduct – build oversight and transparencyLaunch new human rights strategy in 2019
Community Develop strategic, impact-focused programmes and partnerships to match our growing global business by 2025
1 Compared to a 2018 baseline4 9
A N N U A L R E P O R T 2 0 1 8R H I M A G N E S I TA

Integrated management systemThe Company has developed an integrated management system which covers environment (ISO 14001), occupational health and safety (OHSAS 18001) and quality (ISO 9001). Following the merger, we have integrated all existing systems throughout the Group and will transition to the new ISO 45001 by the end of 2020.
In 2018, a major focus of our quality management programme was customer satisfaction. We expanded the KPIs and tools we use in our drive to meet and exceed customer expectations.
External initiativesIn 2018, RHI Magnesita signed the UN Global Compact, the world’s largest corporate sustainability movement, signalling our commitment to support the UN Sustainable Development Goals. In addition, we pledged to integrate the principles of the Global Compact in the areas of human rights, labour rights, environment and anti-corruption into our business strategy and operations.
On our journey, we are also guided by other initiatives. During 2018, for example, we joined Transparency International, the global anti-corruption movement, and the LBG network, the global standard for measuring and managing corpowrate community investment. We made our first submission on gender diversity in our Company to the Hampton-Alexander Review in 2018 and will start submitting environmental data to the Carbon Disclosure Project (“CDP”).
ReportingWe report on our material issues. The information in this Annual Report and on our website comprise our GRI report. This report was prepared in accordance with the GRI Standards: Core option. A GRI Content Index is available on our website. This report also serves as our Communication on Progress (CoP) to the UN Global Compact, which we self-assess as Active.
Lastly, the report complies with legislation in the UK and the Netherlands implementing the EU Non-Financial Reporting Directive.
Ethics and compliance RHI Magnesita has a zero-tolerance approach to corruption. Our Code of Conduct makes this explicit, defining how we expect employees and Directors to conduct business.
More than 2,000 employees received Code of Conduct training in 2018, mostly in South America and India. In 2019, we will expand training to China and Asia Pacific. Suppliers to RHI Magnesita are required to sign our Supplier Code of Conduct and we are working to increase oversight and transparency in this area.
An independently operated whistleblowing system allows individuals to have confidential and anonymous two-way conversations about concerns they might have. Contact details are publicised throughout our operations. In 2019, we will publish a new anti-corruption policy and our Corporate Audit will adopt an anti-corruption focus.
External initiatives
Sustainability
R H I M A G N E S I TAS T R AT E G I C R E P O R T
5 0
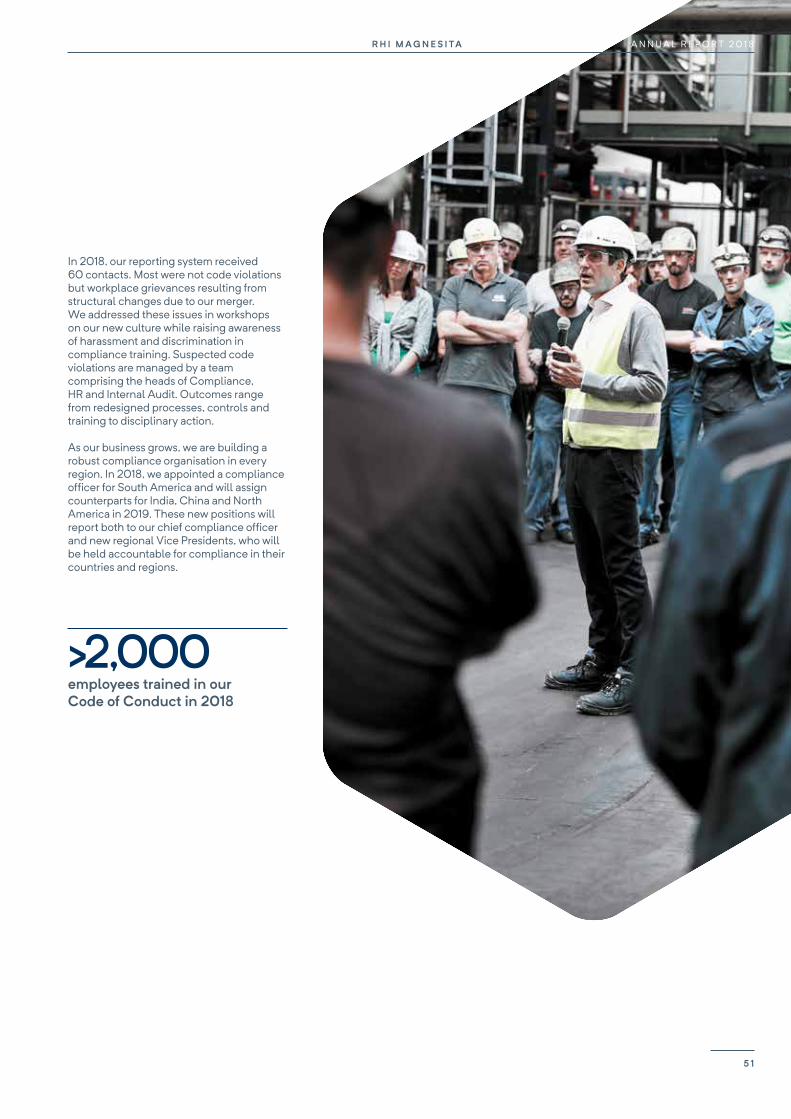
In 2018, our reporting system received 60 contacts. Most were not code violations but workplace grievances resulting from structural changes due to our merger. We addressed these issues in workshops on our new culture while raising awareness of harassment and discrimination in compliance training. Suspected code violations are managed by a team comprising the heads of Compliance, HR and Internal Audit. Outcomes range from redesigned processes, controls and training to disciplinary action.
As our business grows, we are building a robust compliance organisation in every region. In 2018, we appointed a compliance officer for South America and will assign counterparts for India, China and North America in 2019. These new positions will report both to our chief compliance officer and new regional Vice Presidents, who will be held accountable for compliance in their countries and regions.
>2,000 employees trained in our Code of Conduct in 2018
5 1
R H I M A G N E S I TA A N N U A L R E P O R T 2 0 1 8
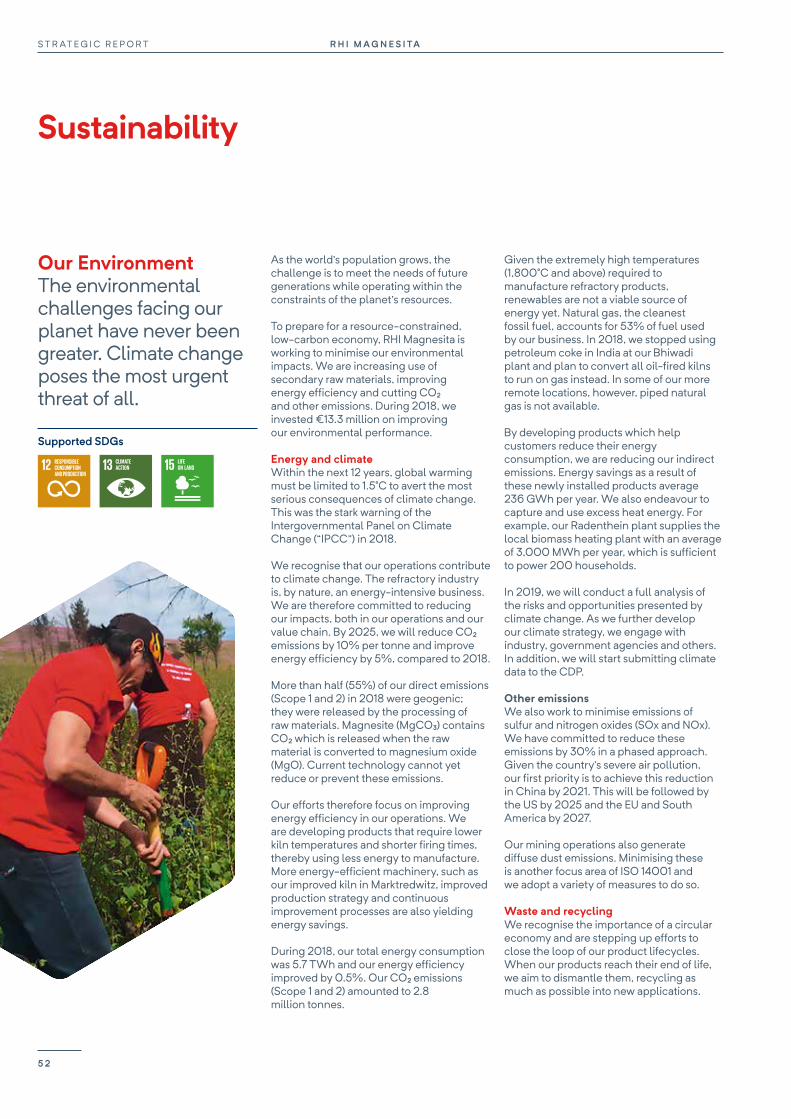
Our EnvironmentThe environmental challenges facing our planet have never been greater. Climate change poses the most urgent threat of all.
Supported SDGs
As the world’s population grows, the challenge is to meet the needs of future generations while operating within the constraints of the planet’s resources.
To prepare for a resource-constrained, low-carbon economy, RHI Magnesita is working to minimise our environmental impacts. We are increasing use of secondary raw materials, improving energy efficiency and cutting CO2 and other emissions. During 2018, we invested €13.3 million on improving our environmental performance.
Energy and climate Within the next 12 years, global warming must be limited to 1.5°C to avert the most serious consequences of climate change. This was the stark warning of the Intergovernmental Panel on Climate Change (“IPCC”) in 2018.
We recognise that our operations contribute to climate change. The refractory industry is, by nature, an energy-intensive business. We are therefore committed to reducing our impacts, both in our operations and our value chain. By 2025, we will reduce CO2 emissions by 10% per tonne and improve energy efficiency by 5%, compared to 2018.
More than half (55%) of our direct emissions (Scope 1 and 2) in 2018 were geogenic; they were released by the processing of raw materials. Magnesite (MgCO3) contains CO2 which is released when the raw material is converted to magnesium oxide (MgO). Current technology cannot yet reduce or prevent these emissions.
Our efforts therefore focus on improving energy efficiency in our operations. We are developing products that require lower kiln temperatures and shorter firing times, thereby using less energy to manufacture. More energy-efficient machinery, such as our improved kiln in Marktredwitz, improved production strategy and continuous improvement processes are also yielding energy savings.
During 2018, our total energy consumption was 5.7 TWh and our energy efficiency improved by 0.5%. Our CO2 emissions (Scope 1 and 2) amounted to 2.8 million tonnes.
Given the extremely high temperatures (1,800°C and above) required to manufacture refractory products, renewables are not a viable source of energy yet. Natural gas, the cleanest fossil fuel, accounts for 53% of fuel used by our business. In 2018, we stopped using petroleum coke in India at our Bhiwadi plant and plan to convert all oil-fired kilns to run on gas instead. In some of our more remote locations, however, piped natural gas is not available.
By developing products which help customers reduce their energy consumption, we are reducing our indirect emissions. Energy savings as a result of these newly installed products average 236 GWh per year. We also endeavour to capture and use excess heat energy. For example, our Radenthein plant supplies the local biomass heating plant with an average of 3,000 MWh per year, which is sufficient to power 200 households.
In 2019, we will conduct a full analysis of the risks and opportunities presented by climate change. As we further develop our climate strategy, we engage with industry, government agencies and others. In addition, we will start submitting climate data to the CDP.
Other emissionsWe also work to minimise emissions of sulfur and nitrogen oxides (SOx and NOx). We have committed to reduce these emissions by 30% in a phased approach. Given the country’s severe air pollution, our first priority is to achieve this reduction in China by 2021. This will be followed by the US by 2025 and the EU and South America by 2027.
Our mining operations also generate diffuse dust emissions. Minimising these is another focus area of ISO 14001 and we adopt a variety of measures to do so.
Waste and recycling
We recognise the importance of a circular economy and are stepping up efforts to close the loop of our product lifecycles. When our products reach their end of life, we aim to dismantle them, recycling as much as possible into new applications.
Sustainability
R H I M A G N E S I TAS T R AT E G I C R E P O R T
5 2
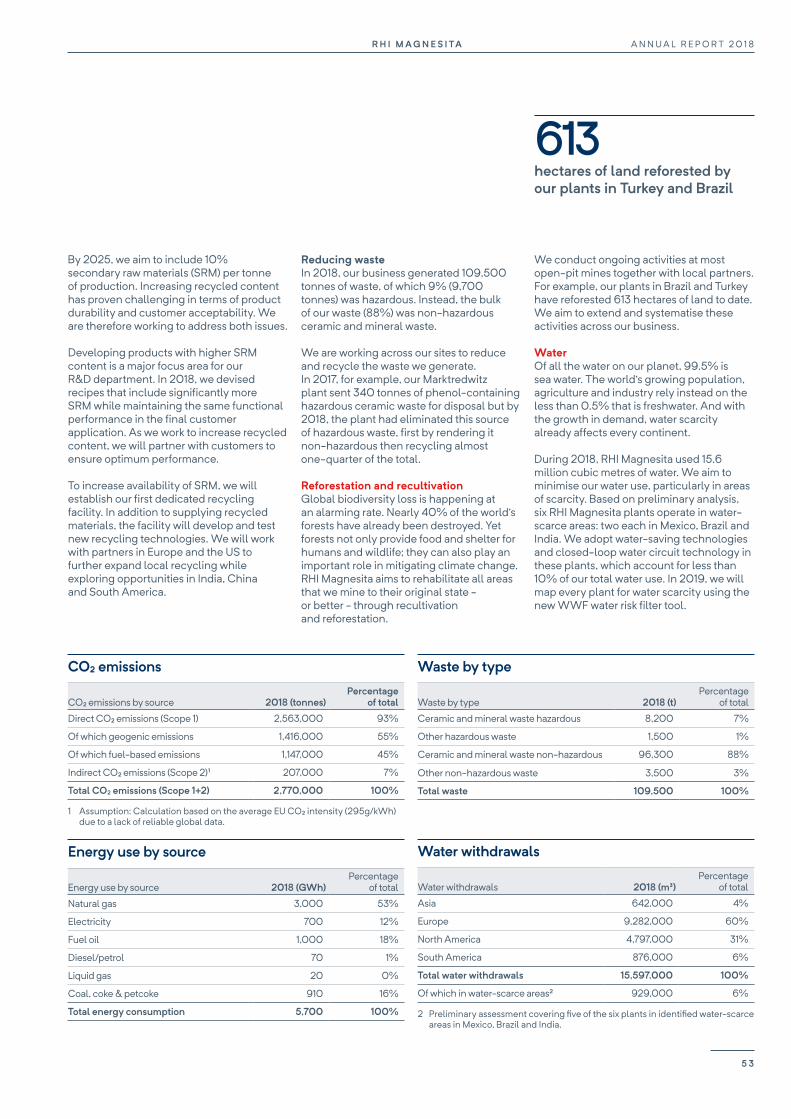
Reducing wasteIn 2018, our business generated 109,500 tonnes of waste, of which 9% (9,700 tonnes) was hazardous. Instead, the bulk of our waste (88%) was non-hazardous ceramic and mineral waste.
We are working across our sites to reduce and recycle the waste we generate. In 2017, for example, our Marktredwitz plant sent 340 tonnes of phenol-containing hazardous ceramic waste for disposal but by 2018, the plant had eliminated this source of hazardous waste, first by rendering it non-hazardous then recycling almost one-quarter of the total.
Reforestation and recultivationGlobal biodiversity loss is happening at an alarming rate. Nearly 40% of the world’s forests have already been destroyed. Yet forests not only provide food and shelter for humans and wildlife; they can also play an important role in mitigating climate change. RHI Magnesita aims to rehabilitate all areas that we mine to their original state - or better - through recultivation and reforestation.
By 2025, we aim to include 10% secondary raw materials (SRM) per tonne of production. Increasing recycled content has proven challenging in terms of product durability and customer acceptability. We are therefore working to address both issues.
Developing products with higher SRM content is a major focus area for our R&D department. In 2018, we devised recipes that include significantly more SRM while maintaining the same functional performance in the final customer application. As we work to increase recycled content, we will partner with customers to ensure optimum performance.
To increase availability of SRM, we will establish our first dedicated recycling facility. In addition to supplying recycled materials, the facility will develop and test new recycling technologies. We will work with partners in Europe and the US to further expand local recycling while exploring opportunities in India, China and South America.
CO2 emissions
CO2 emissions by source 2018 (tonnes)Percentage
of total
Direct CO2 emissions (Scope 1) 2,563,000 93%
Of which geogenic emissions 1,416,000 55%
Of which fuel-based emissions 1,147,000 45%
Indirect CO2 emissions (Scope 2)1 207,000 7%
Total CO2 emissions (Scope 1+2) 2,770,000 100%
1 Assumption: Calculation based on the average EU CO2 intensity (295g/kWh) due to a lack of reliable global data.
Energy use by source
Energy use by source 2018 (GWh)Percentage
of total
Natural gas 3,000 53%
Electricity 700 12%
Fuel oil 1,000 18%
Diesel/petrol 70 1%
Liquid gas 20 0%
Coal, coke & petcoke 910 16%
Total energy consumption 5,700 100%
We conduct ongoing activities at most open-pit mines together with local partners. For example, our plants in Brazil and Turkey have reforested 613 hectares of land to date. We aim to extend and systematise these activities across our business.
WaterOf all the water on our planet, 99.5% is sea water. The world’s growing population, agriculture and industry rely instead on the less than 0.5% that is freshwater. And with the growth in demand, water scarcity already affects every continent.
During 2018, RHI Magnesita used 15.6 million cubic metres of water. We aim to minimise our water use, particularly in areas of scarcity. Based on preliminary analysis, six RHI Magnesita plants operate in water- scarce areas: two each in Mexico, Brazil and India. We adopt water-saving technologies and closed-loop water circuit technology in these plants, which account for less than 10% of our total water use. In 2019, we will map every plant for water scarcity using the new WWF water risk filter tool.
Waste by type
Waste by type 2018 (t)Percentage
of total
Ceramic and mineral waste hazardous 8,200 7%
Other hazardous waste 1,500 1%
Ceramic and mineral waste non-hazardous 96,300 88%
Other non-hazardous waste 3,500 3%
Total waste 109,500 100%
Water withdrawals
Water withdrawals 2018 (m³)Percentage
of total
Asia 642,000 4%
Europe 9,282,000 60%
North America 4,797,000 31%
South America 876,000 6%
Total water withdrawals 15,597,000 100%
Of which in water-scarce areas2 929,000 6%
2 Preliminary assessment covering five of the six plants in identified water-scarce areas in Mexico, Brazil and India.
613 hectares of land reforested by our plants in Turkey and Brazil
5 3
A N N U A L R E P O R T 2 0 1 8R H I M A G N E S I TA
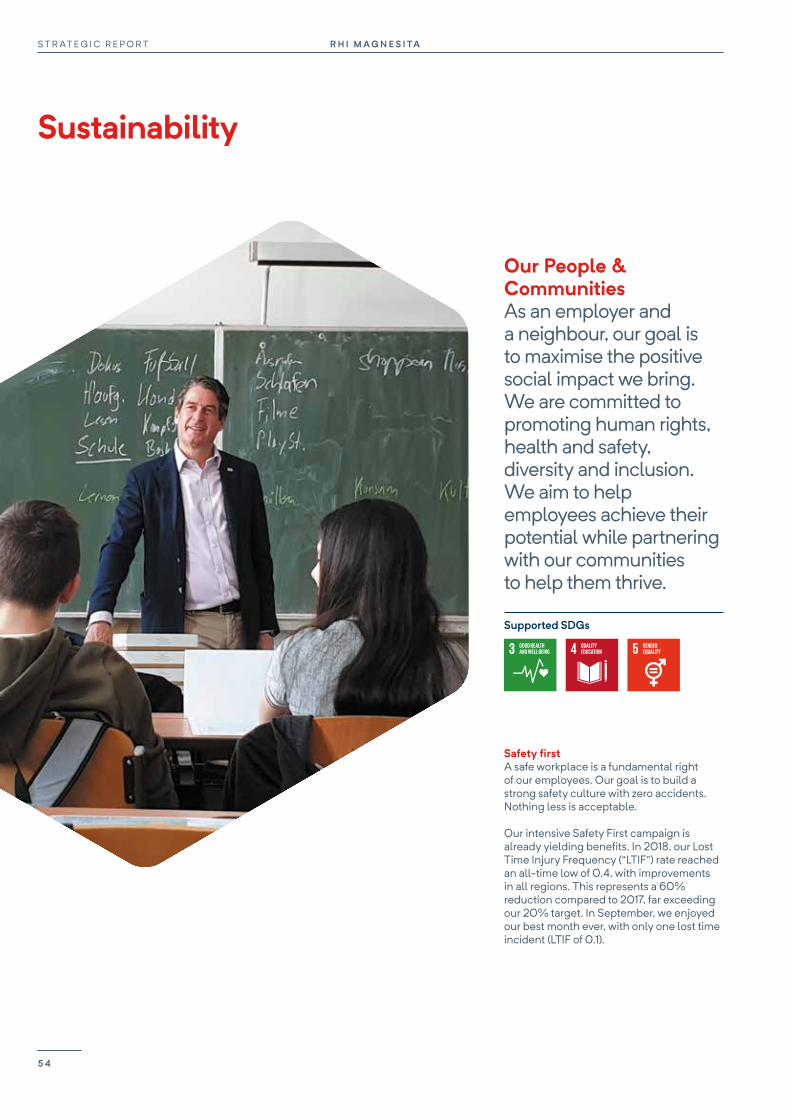
Our People & CommunitiesAs an employer and a neighbour, our goal is to maximise the positive social impact we bring. We are committed to promoting human rights, health and safety, diversity and inclusion. We aim to help employees achieve their potential while partnering with our communities to help them thrive.
Supported SDGs
Safety first
A safe workplace is a fundamental right of our employees. Our goal is to build a strong safety culture with zero accidents. Nothing less is acceptable.
Our intensive Safety First campaign is already yielding benefits. In 2018, our Lost Time Injury Frequency (“LTIF”) rate reached an all-time low of 0.4, with improvements in all regions. This represents a 60% reduction compared to 2017, far exceeding our 20% target. In September, we enjoyed our best month ever, with only one lost time incident (LTIF of 0.1).
Sustainability
R H I M A G N E S I TAS T R AT E G I C R E P O R T
5 4

60% reduction in lost time injury frequency in 2018
2,200“Culture Champions” trained
Yet we will not become complacent. Safety is the responsibility of each and every RHI Magnesita employee. To underline this, our CEO begins every quarterly update to employees with an update on safety performance. Following the merger, we have worked to ensure our corporate safety programme is being implemented consistently across our operations.
Behaviour-based safety is a major focus. Since approximately 80% of accidents are due to unsafe actions by individuals, we began observation audits to identify at-risk behaviours.
This led to fewer accidents and the programme is now being rolled out across our business. Another factor in our improved performance was the new target for reporting and mitigating at least one near miss or unsafe situation per person. We exceeded this target in 2018, achieving 1.48 across our business.
In addition, we are implementing programmes that address specific job roles and safety risks, such as Safety Leadership Training for front-line leaders and our Hand & Finger safety programme. We also continue to roll-out Quickcheck, which raises awareness of hidden hazards.
To date, 22 sites have been certified to OHSAS 18001 as part of our integrated management system. We will transition all certified sites to the new ISO 45001 by the end of 2020.
Engaging employeesAs we merged two former competitors to form RHI Magnesita, we have focused on building a new corporate culture. We engaged employees in the process through internal communications, workshops, team-building activities and pulse surveys. To date, more than 2,200 employees were trained to help bring our new culture to life.
At the heart of our corporate culture are four themes:
¥ We assign accountability and reward performance
¥ We collaborate globally and cross-functionally
¥ We communicate directly and openly, in a friendly and constructive way
¥ Customers are at the centre of everything we do
Health and Safety: Lost time injury frequencyrate per 200,000 hours worked and lost days due to accidents
0
8
16
24
32
40
201820172016Lost days
Lost
day
s
Lost time injury frequency rate
Lost
tim
e in
jury
freq
uenc
y ra
te
0.0
0.5
1.0
1.5
2.0
We are implementing these themes in the way we run our business. New systems for performance management and variable payment help drive accountability and incentivise performance.
Our most recent survey found that one year on from the merger, 76% of employees are excited about RHI Magnesita’s future while 56% of employees believe that we are already living our new culture.
Feedback on team spirit and relationships with new colleagues was positive, but employees said that cross-functional collaboration needs to improve. One-fifth of respondents say that work across organisational units is not yet as effective as it should be. We will continue to listen to employees’ concerns and develop programmes in response.
5 5
A N N U A L R E P O R T 2 0 1 8R H I M A G N E S I TA
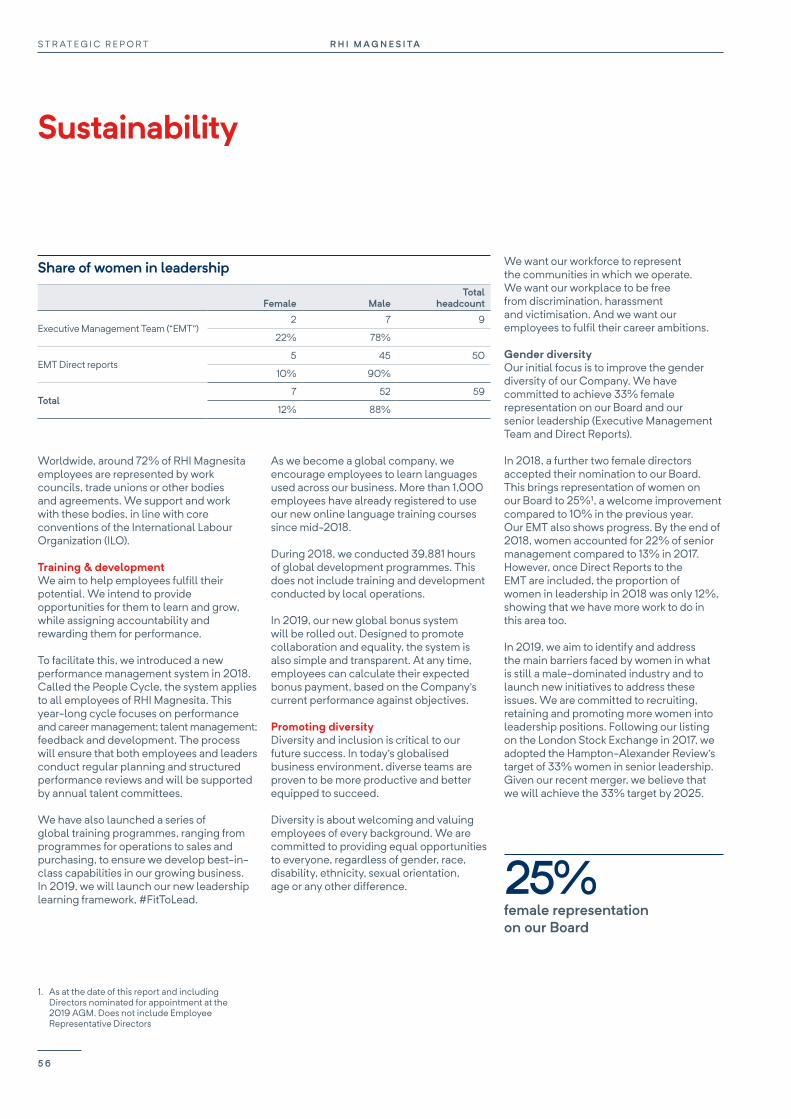
As we become a global company, we encourage employees to learn languages used across our business. More than 1,000 employees have already registered to use our new online language training courses since mid-2018.
During 2018, we conducted 39,881 hours of global development programmes. This does not include training and development conducted by local operations.
In 2019, our new global bonus system will be rolled out. Designed to promote collaboration and equality, the system is also simple and transparent. At any time, employees can calculate their expected bonus payment, based on the Company’s current performance against objectives.
Promoting diversityDiversity and inclusion is critical to our future success. In today’s globalised business environment, diverse teams are proven to be more productive and better equipped to succeed.
Diversity is about welcoming and valuing employees of every background. We are committed to providing equal opportunities to everyone, regardless of gender, race, disability, ethnicity, sexual orientation, age or any other difference.
We want our workforce to represent the communities in which we operate. We want our workplace to be free from discrimination, harassment and victimisation. And we want our employees to fulfil their career ambitions.
Gender diversityOur initial focus is to improve the gender diversity of our Company. We have committed to achieve 33% female representation on our Board and our senior leadership (Executive Management Team and Direct Reports).
In 2018, a further two female directors accepted their nomination to our Board. This brings representation of women on our Board to 25%1, a welcome improvement compared to 10% in the previous year. Our EMT also shows progress. By the end of 2018, women accounted for 22% of senior management compared to 13% in 2017. However, once Direct Reports to the EMT are included, the proportion of women in leadership in 2018 was only 12%, showing that we have more work to do in this area too.
In 2019, we aim to identify and address the main barriers faced by women in what is still a male-dominated industry and to launch new initiatives to address these issues. We are committed to recruiting, retaining and promoting more women into leadership positions. Following our listing on the London Stock Exchange in 2017, we adopted the Hampton-Alexander Review’s target of 33% women in senior leadership. Given our recent merger, we believe that we will achieve the 33% target by 2025.
Share of women in leadership
Female MaleTotal
headcount
Executive Management Team (“EMT”) 2 7 9
22% 78%
EMT Direct reports5 45 50
10% 90%
Total7 52 59
12% 88%
Worldwide, around 72% of RHI Magnesita employees are represented by work councils, trade unions or other bodies and agreements. We support and work with these bodies, in line with core conventions of the International Labour Organization (ILO).
Training & developmentWe aim to help employees fulfill their potential. We intend to provide opportunities for them to learn and grow, while assigning accountability and rewarding them for performance.
To facilitate this, we introduced a new performance management system in 2018. Called the People Cycle, the system applies to all employees of RHI Magnesita. This year-long cycle focuses on performance and career management; talent management; feedback and development. The process will ensure that both employees and leaders conduct regular planning and structured performance reviews and will be supported by annual talent committees.
We have also launched a series of global training programmes, ranging from programmes for operations to sales and purchasing, to ensure we develop best-in-class capabilities in our growing business. In 2019, we will launch our new leadership learning framework, #FitToLead.
Sustainability
25%female representation on our Board
1. As at the date of this report and including Directors nominated for appointment at the 2019 AGM. Does not include Employee Representative Directors
R H I M A G N E S I TAS T R AT E G I C R E P O R T
5 6
Although women represent 23% of all white-collar positions in our Company, they occupy only 2% of blue-collar positions. As a result, women represent only 11% of our total workforce.
In addition, we will research and develop other aspects of diversity to ensure that the increasingly global nature of our Company is reflected in our leadership.
Human rightsRHI Magnesita is committed to respecting internationally recognised human rights in line with the UN Universal Declaration of Human Rights and the UN Guiding Principles on Business and Human Rights. Joining the UN Global Compact underlines our commitment to human rights in our business, supply chain and beyond.
We are ramping up our approach to human rights. An introduction to human rights was included in anti-corruption training provided in 2018 to more than 2,000 employees. We will launch a new human rights strategy in 2019.
In addition, we will focus on our suppliers. Our suppliers must sign a Supplier Code of Conduct that includes human rights provisions and we are developing a more rigorous means of supplier assessment.
We report on the measures RHI Magnesita has taken to prevent modern slavery and human trafficking in our business and our supply chain. Statements in accordance with the UK Modern Slavery Act 2015 and the California Transparency in Supply Chains Act are available on our website.
Investing in communitiesRHI Magnesita aims to invest in local communities wherever we operate. To date, our projects have been highly local in scope. As we take our support to the next level, we are investing more, focusing on impact and aligning the themes with the Sustainable Development Goals (“SDGs”). To maximise the impact of our contributions, in 2018 we joined the LBG network. The LBG framework is the global standard for measuring, benchmarking and reporting on corporate community investment.
While our operations choose projects and partners at a local level, the overarching themes that we will support are:
¥ Education, especially science technology, engineering and maths (“STEM”) subjects, with a focus on girls and disadvantaged groups
¥ Youth development, especially skills training and enterprise education
¥ Environmental protection, especially forests, climate and water
These themes contribute to the SDGs we can best support.
We are keen to develop long-term partnerships, developing programmes that could become scalable. During 2018, we developed two new partnerships in Austria and will launch our first projects in early 2019.
Firstly, we are partnering with Teach For Austria, an NGO which aims to create a more level playing field in educational opportunities. More than any other EU country, Austrian children’s educational success depends on parental income, status and education level. To kick off our partnership, both our CEO and our Chairman will teach a class during Teach For Austria Week. During the first year of our partnership, we will support the teaching of 250 children. Our second new partnership is with Wissenfabrik (Knowledge Factory), which aims to encourage more boys and girls into STEM fields. In 2019, our employees will start volunteering in schools to support STEM-related classes.
Existing programmes in other countries are also gaining traction. In Brazil, for example, we support the Digital Inclusion project which helps local residents near our plant. This community space offers digital training to the local community, especially disenfranchised groups. To date, 2,000 people have taken courses at the centre.
Employee volunteers actively support these and other projects we support. In 2019, we will roll-out a global volunteering policy to encourage employee participation in our community projects.
Improving safetyTo improve behavioural safety, our Bonnybridge plant in Scotland uses an innovative programme based on football’s penalty cards. In addition to issuing red and yellow cards for safety hazards, the plant also hands out green cards for positive safety behaviours. The immediacy and transparency of the programme have proved popular and the plant has reached its preventive rate target ahead of schedule. The programme received our internal Culture Award and is now being trialled in other parts of our business.
Investing in communities
5 7
A N N U A L R E P O R T 2 0 1 8R H I M A G N E S I TA
58Governance
60 Board of Directors64 Executive Management Team66 Chairman’s introduction to
Corporate Governance 67 Corporate Governance Report76 Nomination Committee Report78 Audit & Compliance
Committee Report80 Remuneration Committee Report84 Directors’ Remuneration Policy92 Annual Report on Remuneration
R H I M A G N E S I TAG O V E R N A N C E
5 8

A N N U A L R E P O R T 2 0 1 8R H I M A G N E S I TA
5 9

5 86
9
13 14
10 11 12
43
7
21
Board of Directors
R H I M A G N E S I TAG O V E R N A N C E
6 0

1. Herbert CordtChairman Appointment date: October 2017 Nationality: Austrian
Herbert was Chairman of the Supervisory Board of RHI from 2010 until 2017 as well as Vice-Chairman from 2007 to 2010. He was a member of the Advisory Board at Delta Partners, Dubai from 2013 to 2015 as well as Watermill Group Boston, a position he has held since 2013. Herbert was a senior advisor at Citigroup in London from 1999 to 2014. Since 1992, he has been Managing Partner at CORDT & PARTNER Management- und Finanzierungsconsulting GesmbH. He was Managing Director at GASKOKS - Österreichische Warenhandelsgesellschaft mbH from 1991 to 1992. From 1979 to 1984, he was Vice Governor at Österreichische Postsparkasse. From 1984 to 1991 Herbert was a member of the Executive Board of Österreichische Länderbank, the second largest commercial bank in Austria. He worked as chief economic adviser for the Federal Minister of Finance of Austria from 1975 to 1979. Additionally, since 2015 he has been a member of the Board of Advisors for the MSFS Program, School of Foreign Service at Georgetown University, Washington D.C. Herbert obtained a Doctorate in Law from the University of Vienna, graduated from the Diplomatic Academy of Vienna (Diplomatische Akademie Wien) and received a Master’s Degree of Science in Foreign Service from Georgetown University Washington D.C.
External appointments: Member of the advisory board of Delta Partners, Dubai, Citigroup Germany and Austria, Watermill Group Boston, Georgetown University, School of Foreign Service, MSFS Program, Cooper & Turner, UK, The Plastics Group Inc, USA, Quality Metalcraft Inc, USA and Experi-Metal Inc, USA. Managing partner of CORDT & PARTNER Management- und Finanzierungsconsulting GesmbH.
Board members by gender1
2. Stefan BorgasChief Executive Officer Appointment date: October 2017 Nationality: German
Stefan was Chief Executive Officer at RHI from December 2016 until October 2017. From 2012 to 2016, he was president and Chief Executive Officer at Israel Chemicals Ltd. Between 2004 and 2012, he was Chief Executive Officer at Lonza Group. Before this, he worked at BASF Group, where he held various management positions from 1998 to 2004. Stefan was elected as President of the World Refractories Association in January 2018. Stefan has a business administration degree from the University Saarbrücken and an MBA from the University of St. Gallen-HSG.
External appointments: Stefan is the owner of SB Industry LLC.
Ian Botha Chief Financial Officer Appointment date: April 2019 Nationality: South African
Ian, currently CFO of Anglo American Platinum, has been nominated as new Chief Financial Officer and Finance Director for appointment in the 2019 Annual General Meeting. Ian will join our Company on 1 April 2019. Ian has enjoyed a highly successful international career with Anglo American in the related mining and metals industry. He brings with him significant experience in finance and accounting, investor relations and governance, as well as his excellent business acumen and track record in financial and performance improvements.
Octavio Lopes Chief Financial Officer from October 2017 to September 2018. Nationality: Brazilian
Octavio stood down from the Board on 31 December 2018. Prior to the merger, he held roles at Magnesita including Chairman from July 2016 and Chief Executive Officer from 2012 to 2016,
3. David A. SchlaffNon-Executive Director (Non-Independent) Appointment date: October 2017 Nationality: Austrian
From 2004 to 2007, David was a member of the management team at LH Financial Services Corporation. Previously he worked for Forstmann-Leff Associates Inc. David was a member of the Supervisory Board at RHI from 2010 until 2017. Between 2007 and 2011, he was also a member of the Board of Advisors at Latrobe Specialty Steel Company. From 2010 to 2011, he was a member of the Supervisory Council at A/S Ventspils Nafta. He holds a Bachelor’s Degree in Business Administration from the Interdisciplinary Center Herzliya in Israel.
External appointments: Chief Investment Officer at M-Tel Holding GmbH since 2008.
4. Stanislaus Prinz zu Sayn-Wittgenstein Non-Executive Director (Non-Independent) Appointment date: October 2017 Nationality: German
Stanislaus was Chief Executive Officer and Chief Restructuring Officer at Energieservice Westfalen Weser GmbH in 2015. From 2013 to 2015, he was Chief Financial Officer and Deputy Chief Executive Officer at Westfalen Weser Energie GmbH & Co KG and member of the Supervisory Boards of Stadtwerke Lage GmbH and Stadtwerke Hessisch-Oldendorf GmbH. Between 2004 and 2012 Stanislaus held numerous management positions within the EON group. Previously, he was Managing Director at GMD Gesellschaft für medizinische Datenverarbeitung mbH and Director at the Deutsche Bank AG, Investment Banking Division. He was a member of the Supervisory Board of RHI between 2001 and 2017. Between
Chairman Executive Directors Non-Independent Non-Executive Directors
Board Committee members
N Nomination Committee
A Audit & Compliance Committee
S Corporate Sustainability Committee
R Remuneration Committee
Chair of Committee
N
1. As at the date of this report and including Directors nominated for appointment at the 2019 AGM Does not include Employee Representative Directors
Male
Female
75%
25%
A N N U A L R E P O R T 2 0 1 8R H I M A G N E S I TA
6 1
5. James LengDeputy Chairman and Senior Independent Director Appointment date: October 2017 Nationality: British
James was previously Chairman of Corus Group plc (2001 to 2008), Chairman of HSBC Bank plc (2010 to 2013) and Chairman of Nomura European Holdings plc (2015 to 2017). Other directorships have included AON plc, Alstom SA, Pilkington plc, Hanson plc, IMI plc, TNK-BP and lead Non-Executive Director at the UK’s Ministry of Justice. In the early part of 2009, he was a Director and Chairman designate of Rio Tinto. In an executive capacity James was Chief Executive Officer of two publicly listed companies: from 1995 to 2001 at Laporte PLC, and prior to that at Low & Bonar PLC. His early career was spent at John Waddington plc, where he was Managing Director of a number of their subsidiaries.
External appointments: n/a
6. Celia BaxterIndependent Non-Executive Director Appointment date: October 2017 Nationality: British
Celia was Director of Group Human Resources for Bunzl plc from 2003 to 2016. Previously she served as Head of Human Resources of Enterprise Oil plc, having been Director of Group Human Resources at Tate & Lyle plc. In 1988 she joined KPMG Peat Marwick as a Human Resources consultant. She started her professional career in 1982 at the Ford Motor Company where she held several management positions. She holds a PhD and BSc in botany from the University of Reading.
External appointments: Non-Executive Director at Bekaert SA and a Non- Executive Director and Remuneration Chair of Senior PLC. Partner of HR Tech LLP.
7. Andrew HostyIndependent Non-Executive Director Appointment date: October 2017 Nationality: British
Andrew was Chief Executive of the Sir Henry Royce Institute for Advanced Materials from 2016 to 2018. Previously, he was Chief Operating Officer at Morgan Advanced Materials plc, an appointment he held from February 2013 until January 2016. He also held a number of senior positions within Morgan Advanced Materials plc, including as Chief Executive Officer of Morgan Ceramics. He was previously a Non-Executive Director of Fiberweb plc and past President of the British Ceramics Confederation. He is a fellow of the Royal Academy of Engineering, and holds a PhD from the Faculty of Engineering at the University of Sheffield and a BSc in materials science.
External appointments: Andrew is senior independent director of James Cropper plc, Non-Executive Director of Consort Medical plc, mOm Incubators Ltd and Rights and Issues Investment Trust plc.
8. John RamsayIndependent Non-Executive Director Appointment date: October 2017 Nationality: British
John served as Chief Financial Officer of Syngenta AG from 2007 to 2016 and was also Interim Chief Executive Officer from October 2015 to June 2016. Prior to this, John served as Group Financial Controller of Syngenta from 2000 to 2007 and as the Finance Head of Asia Pacific for Zeneca Agrochemicals from 1993 to 1999. Earlier in his career he was a Financial Controller of ICI Malaysia and regional controller for Latin America. Before joining ICI in 1984, he worked in audit and tax at KPMG. He is a Chartered Accountant and also holds an Honours Degree in accounting.
External appointments: John has been a member of the Supervisory Board at Koninklijke DSM N.V. since May 2017. John is also a Non-Executive Director of G4S plc.
2000 and 2002, he was a member of the supervisory board of Didier Werke AG. Stanislaus holds a Master’s Degree in Business Administration from MIT Sloan School of Management and studied Business Administration and Economics at Université de Fribourg and is a Chartered Financial Analyst.
External appointments: Member of the Supervisory Board of Endurance Capital AG since 2016.
Fersen Lambranho Non-Executive Director (Non-Independent) of the Company with from October 2017 to January 2019.
Fersen stood down from the Board on 21 January 2019.
Independent Non-Executive Directors
R S
R
N A
A
N
Board of Directorscontinued
Non-Independent Non-Executive Directors
R H I M A G N E S I TAG O V E R N A N C E
6 2

Creditanstalt-Bankverein in London and New York. Between 1983 and 1985, he held the position of Secretary to the Federal Minister for Trade and Industry of Austria. From 1977 to 1983, he worked in corporate finance and export finance at Creditanstalt- Bankverein. Karl holds a Master and Doctorate Degree from the Vienna University of Economics and Business
External appointments: Karl is a member of the management board of Custos Privatstiftung and a member of the supervisory board of Siemens Aktiengesellschaft Österreich, SIGNA Development Selection AG, SIGNA Prime Selection AG, SIGMA Kreditbank AG.
11. Janet AshdownJanet has been nominated as Non-Executive Director for appointment in the 2019 Annual General Meeting. Janet had a distinguished career working for BP plc for over 30 years, holding a number of international positions. Until the end of 2012, Janet was Chief Executive Officer of Harvest Energy Ltd. Janet also has a wide range of board and committee experience as a non-executive director.
External appointments: Janet is non-executive director of the UK’s Nuclear Decommissioning Authority, SIG plc, Victrex plc and she is Senior Independent Non-Executive Director at Marshalls plc and Chair of the Remuneration Committee.
12. Fiona PaulusFiona has been nominated as Non-Executive Director for appointment in the 2019 Annual General Meeting. Fiona has over 37 years’ global investment banking experience, having held senior management roles with a number of leading international investment banks based in London, Europe and North America. Fiona has specialised in the past 15 years in the energy & resources sectors where she has advised and financed companies on all types of strategic & risk management initiative. Since January 2018, Fiona has been Managing Director at Redcliffe Advice, an investing and consulting business.
External appointments: n/a
9. Wolfgang RuttenstorferIndependent Non-Executive Director Appointment date: October 2017 Nationality: Austrian
Wolfgang had served as a member of the Supervisory Board of RHI AG from 2012 to 2017. Following the sickness related absence of the CEO, he acted as the Interim Chief Executive Officer of RHI AG from 26 June 2016 until 30 November 2016. He started his professional career in 1976 at OMV, becoming Chief Executive Officer and Chairman of the Management Board between 2002 and 2011. He served as Secretary of State in the Austrian Federal Ministry of Finance between 1997 and 1999. He was a member of the Administrative Board of Roche Holding from 2007 to 2011. From 2010 to 2014 he was Chairman of the Supervisory Board at Vienna Insurance Group as well as a member of the Supervisory Board at Telekom Austria. He was Chairman of the Supervisory Board at CA Immobilien Anlagen AG from 2009 to 2016 and at Telekom Austria from 2015 to 2018. He graduated from the Vienna University of Economics.
External appointments: Wolfgang is a member of the management board of CollPlant Holdings Ltd. and a member of the supervisory board of Flughafen Wien Aktiengesellschaft, NIS a.d. Naftna industrija Srbije, Novi Sad and Erne Fittings GmbH.
10. Karl SeveldaIndependent Non-Executive Director Appointment date: October 2017 Nationality: Austrian
Karl was Chief Executive Officer from June 2013 to March 2017 and Deputy Chief Executive Officer from 2010 to 2013 at Raiffeisen Bank International AG. Previously, he joined Raiffeisen Zentralbank Österreich AG in 1998, where he was a member of the Management Board, and responsible for corporate customers and corporate, trade and export finance worldwide until 2010. From 1986 to 1997, he held several senior management positions at Creditanstalt-Bankverein. In 1985 he worked at
13. Franz Reiter
Director/Employee representative since November 2017. Nationality: Austrian
Franz has been with the Group since 1977 and is Chairman of the Group Works Council at Veitsch-Radex GmbH.
14. Michael Schwarz Director/Employee representative since December 2017. Nationality: German
Michael has been with the Group since 1983 and is a member of the workers council at Didier Werke A.G.
Employee Representative Directors
R S
A
S
A N N U A L R E P O R T 2 0 1 8R H I M A G N E S I TA
6 3
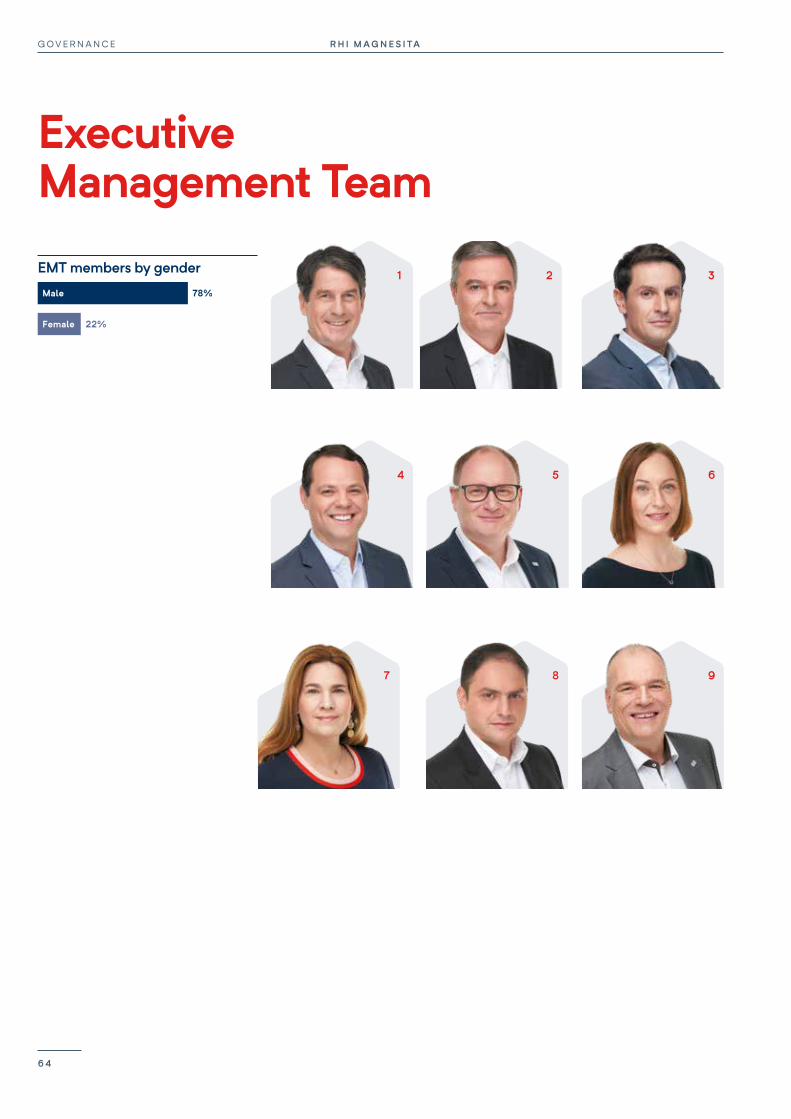
Executive Management Team
4 5
7 98
6
1 2 3EMT members by gender
Male
Female
78%
22%
R H I M A G N E S I TAG O V E R N A N C E
6 4
Eduardo served as CFO at Magnesita from 2014 to 2017. Eduardo has held diverse finance positions in mostly private equity led companies with experience in corporate finance, tax, capital strategy, turnaround, performance management and investor relations. Eduardo has also served as a Board member for BB Previdência, one of Brazil’s largest multi-sponsored pension funds, from 2013 - 2017.
5. Thomas JakowiakExecutive Vice President Integration ManagementAfter studying applied geosciences at the University of Leoben, Thomas started his professional career as a sales engineer with R&A Rost GmbH in Vienna. In the year 2000, he joined the RHI Group and was soon put in charge of the sales management for the business unit in the Asia Pacific region. Since 2005, he has been the Head of the Cement/Lime business unit and was appointed to the Management Board of RHI AG as CSO of the Industrial Division at the beginning of the year 2016.
6. Jacqueline KnoxExecutive Vice President, General Counsel & Company SecretaryJacqueline has served as General Counsel since December 2018. She came to RHI Magnesita from VEON, an international telecommunications and technology business, where she was Associate General Counsel M&A. Between 2011 and 2014, Jacqueline was General Counsel and Company Secretary of Ophir Energy plc, a FTSE listed upstream oil and gas business. She has also held positions with the law firms of Herbert Smith Freehills in London and Minter Ellison in Brisbane, Australia. Having worked across different industries and multiple regions, she brings broad international experience and a strong background in legal, compliance and corporate governance. Jacqueline holds a dual degree in law and international relations (BA/LLB Hons) from the University of Queensland. She is qualified to practise in the UK and in Queensland, Australia and is a dual British & Australian citizen.
7. Simone OremovicExecutive Vice President People and Culture ManagementSimone is Executive Vice President People and Culture Management at RHI Magnesita since November 2017. Simone has 20 years of experience in Human Resources. Before
1. Stefan BorgasChief Executive OfficerSee biography on page 61.
2. Luis Rodolfo BittencourtChief Technology OfficerLuis has been working for Magnesita for 32 years. He held several positions in his career on the refractory and mining activities starting as Raw Material Research Engineer and becoming Raw Material Research Manager, Mining/Geology Manager, Technical Purchasing Manager, Plant Manager, Quality Control Manager, R&D Director, Minerals VP, and R&D VP. He is currently President of Magnesita Refratários in Brazil and the Brazilian Refractory Producers Association, and the Latin America Refractory Association. He holds a Bachelor’s degree in mining engineering from the Federal University of Minas Gerais- Brazil, a Master’s degree in Metallurgical Engineering from the University of Utah (USA), and a PhD degree on Ceramic Engineering from the University of Missouri (USA).
3. Gustavo FrancoChief Sales OfficerGustavo was appointed Chief Sales Officer in January 2019. He joined Magnesita in 2001 as a Technical Marketing Engineer after finishing his bachelor of Mechanical Engineering, and has since then developed his career in the refractory industry. He soon became Sales Manager, Regional Sales Manager, Sales Director, Sales & Marketing VP for South America, then for North America and finally Globally, being based in three continents in the course of six years. He was part of the Executive Committee of Magnesita Refratarios from 2015 to 2017. Since the merger of RHI Magnesita he has been the Senior VP of Process Industries and Minerals. In 2018 he completed the Senior Executive Programme with the London Business School.
4. Eduardo GotillaActing Chief Financial OfficerEduardo assumed the role of acting CFO of RHI Magnesita on 21 September 2017 after a brief period as the VP of Corporate Finance and Investor Relations, where he played a pivotal role in the integration of the finance organisation into RHI Magnesita, and also successfully led the refinancing of the Company and its repositioning as a leading company amongst other global industrial companies in the FTSE 350. Previously
joining RHI Magnesita, she started her career in HR at General Electric and worked in different operational and corporate roles. Her main focus was on leadership and talent management as well as HR process. She is a certified Six Sigma Master Black belt. After GE she moved to Telekom Austria Group as HR Director and then to IBM Austria. From 2013 to 2017 she was a member of the Management Board of Baxter AG responsible for global HR of the plasma production sites. Simone has a degree from the European Business School (Paris) and of the Economic University of Vienna.
8. Luiz RossatoExecutive Vice President Corporate DevelopmentLuiz Rossato was appointed Executive Vice President and Head of Corporate Development in October 2017. Luiz joined Magnesita Refratarios in 2008 and was the Vice President of Legal, M&A and Institutional Relations, as well as responsible for Corporate Communication, being a member of the Executive Committee of Magnesita Refratários from 2012 until 2017. He graduated in law at Mackenzie Presbyterian University, in Brazil. He worked in renowned law firms in Brazil, including Mattos Filho, Veiga Filho, Marrey Jr. and Quiroga Advogados. He was also a corporate lawyer and company secretary at Abyara Real Estate Planning until the beginning of 2008. In 2012 Luiz received the General Counsel of the Year - Latin America Award by the International Law Office - ILO, and in 2013 he attended the Advanced Management Program at Wharton University in the United States.
9. Gerd SchubertChief Operations OfficerAfter completing his doctorate in mineral engineering at RWTH Aachen, Gerd started his career at Degussa AG, where he held several positions including manager of a Brazilian plant, technical director and plant group manager. Following the acquisition by Ferro Corporation, he managed the production and technology divisions as Global Operations and Restructuring Director. In early 2014, he took over the function of COO at the Pfleiderer Group and was appointed to the Management Board of RHI AG as COO/CTO in January 2017.
A N N U A L R E P O R T 2 0 1 8R H I M A G N E S I TA
6 5

Chairman’s introduction to Corporate Governance
Dear ShareholdersIn this introductory letter I would like to draw your attention to the initiatives we have taken during 2018, our first full financial year as a new Company, as well as actions we plan for the future as part of our commitment to applying the highest Corporate Governance standards to our business.
As you will be aware, on the basis that RHI Magnesita N.V. is registered in the Netherlands and listed on the London Stock Exchange it adheres to both the Dutch and UK Corporate Governance Codes to the full extent possible, and this report sets out how we have applied the principles and provisions of both these codes.
Notable Corporate Governance matters which we have addressed during the past 12 months include the establishment of a new Board Committee, the Corporate Sustainability Committee, the development of an enhanced Board and Board Committee structure and achieving a greater level of female representation on the Board and EMT. In addition, the forthcoming Annual General Meeting (“AGM”) will include a proposal to appointment two new Independent Directors (in addition to a new Chief Financial Officer) resulting in the Board having a majority of independent directors, on a strict independence test basis (excluding the two employee representative directors). It is important for me to add that all my Board colleagues bring a diverse and varied perspective to our Board debates.
Towards the end of the Year, we conducted our first Board Review and Evaluation. This was the first year of a three year programme aimed at examining our structure and effectiveness.
The Board has considered the uncertain regulatory environment that resulted from the United Kingdom’s decision to withdraw from the European Union. Due to these uncertainties the Board has decided that it is prudent for the Company to apply for a secondary listing on a regulated market in the European Union. While the Group is a global business and has a strong presence in many jurisdictions, it has its head office in Vienna and was historically listed on the Vienna Stock Exchange. The Board has therefore decided that the most logical secondary listing location for the Company is Vienna. The Company will continue to have a Premium Listing and be admitted to trading on the London Stock Exchange, which will remain its primary listing venue.
In conclusion, I would like to thank all my Board colleagues, our CEO Stefan Borgas, his executive team and indeed all our employees in the countries in which we operate all around the world for their unwavering commitment, especially given all the challenges that can be encountered following the merger of two businesses. The reality of creating a new company in the form of RHI Magnesita could not have been achieved without this strong effort from the entire team.
I am more convinced than ever that we can do more than meet the future - we can shape it.
HERBERT CORDTCHAIRMAN
I now wish to summarise the work of our current standing committees.
The Nomination Committee has had a very active and successful year. Their work included the search for and success in attracting Ian Botha as our new CFO, who joins on 1 April 2019. The Committee also led a rigorous search for two new Non-Executive Directors, Janet Ashdown (who will chair our Corporate Sustainability Committee) and Fiona Paulus. The establishment of this new committee also delivers on our promise given at the time of the listing. These appointments will be put to shareholders for their approval at the AGM to be held on 6 June 2019. Finally, the Board agreed the appointment of Jacqueline Knox as General Counsel and Company Secretary.
The Remuneration Committee, under Celia Baxter’s stewardship, has embraced the amended Financial Reporting Council’s Corporate Governance Code to reflect the changes in new Terms of Reference aligning our approach to reward with the core elements of culture, purpose and values, whilst not forgetting the remuneration of the broader workforce.
The Audit & Compliance Committee has also delivered on a very full agenda in 2018. As Committee Chairman, John Ramsay led the work of the Committee with meticulous attention to detail across a range of complex issues, including the work necessary for the Purchase Price Allocation related to the merger.
I am more convinced than ever that we can do more than meet the future - we can shape it.
R H I M A G N E S I TAG O V E R N A N C E
6 6
Corporate Governance ReportIntroductionRHI Magnesita N.V. (the “Company” or “RHI Magnesita”) was incorporated as a public company (naamloze vennootschap) under the laws of the Netherlands, under the name RHI-MAG N.V., on 20 June 2017. The articles of association of the Company (the “Articles of Association”) were most recently amended with effect as of 26 October 2017, amending, among other amendments, the name of the Company into RHI Magnesita N.V.
The Strategic Report, together with the Corporate Governance Report, constitutes the report of the Directors within the meaning of Section 2:391 of the Dutch Civil Code (the “DCC”) and has been approved and signed by the Board of RHI Magnesita (the “Board”).
The Board is committed to achieving the highest standards of Corporate Governance. The unique position of being registered in the Netherlands and listed in London requires the Company to take due regard of both the Dutch Corporate Governance Code (“DCGC” or the “Dutch Corporate Governance Code”) and the UK Corporate Governance Code (“UKCGC” or the “UK Corporate Governance Code”).
The Board welcomed the Financial Reporting Council’s update to the UKCGC during 2018 and in particular supports the developments around culture, diversity, stakeholder engagement and better alignment of reward structures to management and the broader workforce.
Deviations from the UK Corporate Governance Code in 2018As disclosed in last year’s report, the Company did not comply with the following provision of the UK Corporate Governance Code in 2018:
Code Provision A.3.1The chairman of the Board (the “Chairman”) is not considered to be independent for the purposes of the UKCGC because he has served on the Board of RHI AG (“RHI”), prior to the merger, for more than nine years, which constitutes non-compliance with Code provision A.3.1. The Board believes that Mr. Cordt continues to demonstrate integrity and independence of character and judgement, and that his experience as Chairman of RHI AG’s supervisory board is valuable to the Company and therefore warrants his position as Chairman.
Board and management structureThe Company has a one-tier Board structure, which consists of both executive Directors (the “Executive Directors”) and Non-Executive Directors ( collectively the “Directors”). As at the date of this annual report (the “Annual Report”), the provisions of Dutch law that are commonly referred to as the “large company regime” (structuurregime) do not apply to the Company.
The Board has established three committees: an audit and compliance committee (the “Audit and Compliance Committee” or “Audit Committee”), a remuneration committee (the “Remuneration Committee”) and a nomination committee (the “Nomination Committee”) to ensure a strong governance framework for decision-making. During the Year the Board also developed Terms of Reference for a Corporate Sustainability Committee to review safety, health, environmental, community and other corporate responsibility matters. In 2018 a Technical Advisory Committee (“TAC”) was established; the TAC is represented at Board level by Andrew Hosty and Stefan Borgas and other members include Luis Rodolfo Bittencourt (CTO) and Luiz Rossato (Corporate Strategy) as well as senior, global R&D and Technical Marketing specialists.
Compliance with the Dutch Corporate Governance Code and the UK Corporate Governance CodeThe Board has applied the principles of, complies and intends to continue to comply with the requirements of, both the DCGC and the UKCGC to the fullest extent possible, except for a limited number of deviations set out below.
Deviations from the Dutch Corporate Governance Code in 2018As disclosed in last year’s report, the Company did not comply with the following provision of the DCGC in 2018:
Best practice provision 2.2.2 of the DCGCThe Board is non-compliant with best practice provision 2.2.2 of the DCGC which recommends that, in case of a one-tier board, a non-executive director should be appointed for a period of four years.
Code provision B.2.3 of the UKCGC recommends that non-executive directors should be appointed for specified terms, with the offer of any term beyond six years subject to particularly rigorous review and take into account the need for progressive refreshing of the board, while provision B.7.1 of the UKCGC recommends that directors should seek re-election on an annual basis. The general meeting of the Company (the “General Meeting”) appoints the non-executive Directors of the Company (the “Non-Executive Directors”) (other than Employee Representative Directors (as defined below)) for a term of approximately three years, subject to performance and annual re-election, with an expectation that the Board will then consider extending tenure for a further three year period. All Directors (other than Employee Representative Directors) will seek re-election on an annual basis.
A N N U A L R E P O R T 2 0 1 8R H I M A G N E S I TA
6 7
A summary of the role and responsibilities of each Committee is shown on pages 72 to 73.
The BoardPowers, responsibilities and functioningThe Board is collectively responsible for and has the power to conduct the general affairs of the Company. This role includes being collectively responsible for the long-term success of the Company, and for its leadership, strategy, values, standards, control and management.
Pursuant to the Articles of Association, the Board may, if it elects to do so, assign duties and powers to individual Directors and/or committees that are composed of two or more Directors, with the day-to-day management of the Company entrusted to the Executive Directors. The Non-Executive Directors have the task of supervising the performance of duties by the Executive Directors as well as the general course of affairs of the Company and the business connected with it. In addition, both Executive Directors and Non-Executive Directors must perform such duties as are assigned to them pursuant to the Articles of Association and the Board rules adopted by the Board (the “Board Rules”) or a resolution of the Board. Each Director has a duty towards the Company to properly perform the duties assigned to him or her. Furthermore, each Director has a duty to act in the corporate interests of the Company and its business. Under Dutch law, corporate interest extends to the interests of all stakeholders of the Company, such as shareholders, creditors, employees and other stakeholders.
Pursuant to the Articles of Association, Directors other than the Employee Representative Directors will be appointed by the General Meeting. The Board may make a nomination for such appointments by the General Meeting. The Executive Directors shall not take part in discussions or decision-making by the Board relating to nominations for the appointment of Directors. A resolution to appoint a Director nominated by the Board may be adopted by the General Meeting by an absolute majority of votes cast, irrespective of the represented capital. A resolution to appoint the Director other than in accordance with a nomination by the Board may be adopted by the General Meeting by an absolute majority of votes cast representing more than one-third of the Company’s issued capital.
Pursuant to an agreement between the Company and Alumina Holdings LLC (“Alumina”), and its successor Alumina II Holdings S.A.R.L, the vehicle through which GP Investments, Ltd holds its entitlement in the Company, Alumina is entitled to nominate one person for appointment as a Non-Executive Director.
Non-Executive Directors (other than Employee Representative Directors) will be nominated for a term of three years, subject to satisfactory performance and annual re-appointment at the Annual General Meeting. This approach is consistent with Code provision B.7.1 of the UK Corporate Governance Code which recommends that Directors should seek re-election on an annual basis. Employee Representative Directors are appointed for a term of not more than four years. The term of office for each Director (other than Employee Representative Directors) will end on the day of the Annual General Meeting in the year following appointment. Pursuant to the Articles of Association, Directors may be re-appointed for an unlimited number of terms but it is anticipated that the Non-Executive Directors (other than Employee Representative Directors) may be offered a second term of three years, at the expiry of which they will not ordinarily be considered for re-appointment.
The Board as a whole is entitled to represent the Company. Additionally, the Chief Executive Officer of the Company (“CEO”) and the Chairman, acting individually, and two Executive Directors, acting jointly, are also authorised to represent the Company. In addition, pursuant to the Articles of Association, the Board may appoint officers who are authorised to represent the Company within the limits of the specific powers delegated to them.
Composition, appointment, term and dismissalThe Articles of Association provide that the Board shall consist of one or more Executive Directors and three or more Non-Executive Directors with a maximum of 19 Directors in total.
The majority of the Directors shall be Non-Executive Directors and one-third of the Non-Executive Directors (rounded upwards) (the “Employee Representative Directors”) shall be appointed in accordance with the reference terms (referentievoorschriften) as referred to in Section 2:333k (12)(13) of the DCC. The exact number of Executive Directors and Non-Executive Directors shall be determined by the General Meeting.
The General Meeting is authorised to resolve to amend the Articles of Association, on the proposal of the Board. The General Meeting may designate one Executive Director as CEO and one Executive Director as CFO and may grant other titles to Executive Directors, in each case for a term to be determined by the General Meeting, which shall not be longer than the term of office of the relevant person to the Board. An Executive Director can have more than one title. Furthermore, the General Meeting shall designate one Non-Executive Director as the Chairman and one or more Non-Executive Directors as deputy chairman/deputy chairmen (the “Deputy Chairman” or the “Deputy Chairmen”), in each case for a term to be determined by the General Meeting which shall not be longer than the term of office of the relevant person to the Board. The General Meeting will also decide whether a Director is appointed as an Executive Director or as a Non-Executive Director.
Corporate Governance Reportcontinued
R H I M A G N E S I TAG O V E R N A N C E
6 8
The General Meeting has the power to suspend or remove a Director at any time, by means of a resolution for suspension or removal. The Directors may be suspended or removed by the General Meeting upon a proposal by the Board. A resolution to suspend or remove a Director requires adoption by at least an absolute majority of the votes cast, if adopted upon a proposal by the Board. A resolution by the General Meeting to suspend or remove a Director other than upon such proposal requires adoption by an absolute majority of the votes cast representing more than one-third of the Company’s issued capital. Executive Directors may also be suspended by the Board. The Executive Directors shall not participate in the discussion or decision-making process of the Board in relation to the making of any proposal for suspension and removal of any Director.
Any suspension may be extended one or more times, but may not last longer than three months in aggregate. If, at the end of such period, no decision has been taken on termination of the suspension or on removal of the relevant Director, the suspension shall end. A suspension can be ended by the General Meeting at any time.
The UKCGC requires that, excluding the Chairman, at least half of the Board should comprise of Non-Executive Directors determined to be independent.
The Board has considered the independence of the Non-Executive Directors, including potential conflicts of interest, and the table on page 70 sets out those Directors considered independent in character and judgement. Each of these Directors has also confirmed that there is no reason why they should not continue to be considered independent.
Board diversityThe Board recognises the benefits that the experience of a diverse Board can bring. The Company aims to ensure that the Board represents a balance in terms of diversity, with criteria that include, background, age, gender, education, nationality, skills, expertise and experience. The Board pursues a policy of having at least 30% of the seats on the Board held by men and at least 30% of the seats on the Board held by women, in accordance with the “balanced composition” requirement under Dutch law. In addition to this, the Board has a target to achieve a minimum of 33% female representation on our Board and senior leadership team. 50% of our Board Committees are chaired by women, when taking the nomination of the new Non-Executive Directors for appointment at the 2019 AGM into account.
As set out in the report of the Nomination Committee, the Board is very glad to have nominated two female candidates for appointment at the 2019 Annual General Meeting towards achieving “balanced composition” required under Dutch law. The Board is committed to encouraging diversity and will continue to pursue its programme in this regard.
The Chairman’s other significant commitments are set out in the table below:
Name of company Function
Delta Partners, DubaiMember of the advisory board
Watermill Group Boston
Member of the advisory board
Georgetown University, School of Foreign Service, MSFS Program
Member of the advisory board
CORDT & PARTNER Management- und Finanzierungsconsulting GesmbH Managing partner
Citigroup Germany and Austria
Guest member of the advisory board
As the senior independent director (the “Senior Independent Director”), James Leng’s role is to provide a sounding board for the Chairman and to serve as an intermediary for the other Directors where necessary. He is also available to shareholders if they have concerns that the normal channels of communication through the CEO and/or the Chairman have failed to resolve or for which contact with them is inappropriate.
During the year Octavio Lopes stood down as CFO and resigned as an Executive Director on 31 December 2018. In addition, Fersen Lambranho resigned as a Non-Executive Director on 21 January 2019.
The Board has nominated Ian Botha for appointment as Executive Director with the title of CFO who, together with nominations of both Janet Ashdown and Fiona Paulus as independent Non-Executive Directors, will be considered at the Annual General Meeting to be held in June 2019.
A N N U A L R E P O R T 2 0 1 8R H I M A G N E S I TA
6 9

Corporate Governance Reportcontinued
At the date of this Annual Report, the Board is composed as follows:
Name PositionYear of
birthDate of
appointmentExpiry/
reappointment date
Herbert Cordt Non-Independent Non-Executive Director, Chairman1 1947 20 June 2017 2019 AGM
Stefan Borgas Executive Director (CEO) 1964 20 June 2017 2019 AGM
David A. Schlaff Non-Independent Non-Executive Director1 1978 6 October 2017 2019 AGM
Stanislaus Prinz zu Sayn-Wittgenstein Non-Independent Non-Executive Director1 1965 6 October 2017 2019 AGM
Celia Baxter Independent Non-Executive Director2, 3 1958 6 October 2017 2019 AGM
Andrew Hosty Independent Non-Executive Director2, 3 1965 6 October 2017 2019 AGM
James Leng Independent Non-Executive Director2, 3
Deputy Chairman and Senior Independent Director1945 6 October 2017 2019 AGM
John Ramsay Independent Non-Executive Director2, 3 1957 6 October 2017 2019 AGM
Wolfgang Ruttenstorfer Independent Non-Executive Director2, 4 1950 20 June 2017 2019 AGM
Karl Sevelda Independent Non-Executive Director2, 3 1950 6 October 2017 2019 AGM
Franz Reiter Employee Representative Director 1962 13 November 20175 n/a
Michael Schwartz Employee Representative Director 1966 8 December 20175 n/a
1 Non-independent within the meaning of the UK Corporate Governance Code but independent within the meaning of the Dutch Corporate Governance Code due to a difference in independence requirements under the respective codes
2 Independent within the meaning of the UK Corporate Governance Code3 Independent within the meaning of the Dutch Corporate Governance Code4 Mr. Ruttenstorfer is, as a result of having undertaken a management board role for RHI on a temporary basis between June and November 2016, not considered
to be independent within the meaning of the Dutch Corporate Governance Code. Notwithstanding this historic role, the Board considers Mr. Ruttenstorfer to be independent for the purposes of the UK Corporate Governance Code
5 Delegation date
R H I M A G N E S I TAG O V E R N A N C E
7 0
Meetings and decision-making of the BoardThe Board commits to meet six times a year or additionally as often as deemed necessary by the Chairman or the Deputy-Chairman. Board papers are circulated in advance of meetings to allow Directors sufficient time to consider their content prior to the meeting.
In accordance with Dutch law, an Executive Director may not be allocated the tasks of: (i) serving as Chairman; (ii) participating in the adoption of resolutions (including any deliberations in respect of such resolutions) related to the remuneration of Executive Directors; or (iii) nominating Directors for appointment. Tasks that have not been specifically allocated to a specific Director fall within the power of the Board as a whole. The Directors share responsibility for all decisions and acts of the Board and for the acts of each individual member of the Board regardless of the allocation of tasks.
The Board has adopted Board Rules in accordance with the Articles of Association. The Board Rules describe, inter alia, the procedure of holding meetings and decision-making by the Board, and the Board’s operating procedures.
Pursuant to the Articles of Association and the Board Rules, resolutions can be adopted without holding a meeting if the proposal is submitted to all Directors, each of them consents in writing and none of them has objected to this manner of adopting resolutions.
Conflict of interests and time commitmentDutch law provides that a Director may not participate in the discussions and decision-making by the Board if such Director has a direct or indirect personal interest conflicting with the interests of the Company or the business connected with it. Pursuant to the Articles of Association, this prohibition does not apply if all Directors have such a conflict of interest. A conflict of interest only exists if in the situation at hand the Director is deemed to be unable to serve the interests of the Company and the business connected with it with the required level of integrity and objectivity.
Attendance at Board meetings in 2018 (shown over a total number of meetings held):
Attended
Herbert Cordt 10/10
Stefan Borgas 10/10
Octavio Lopes 10/10
Fersen Lambranho 10/10
David A. Schlaff 9/10
Stanislaus Prinz zu Sayn-Wittgenstein 10/10
Celia Baxter 8/10
Andrew Hosty 9/10
James Leng 10/10
John Ramsay 10/10
Wolfgang Ruttenstorfer 10/10
Karl Sevelda 9/10
Franz Reiter 8/10
Michael Schwartz 8/10
Pursuant to the Articles of Association and the Board Rules, the Board has adopted procedures under which each Director is required to declare the nature and extent of any personal conflict of interest to the other Directors.
All transactions in which there are conflicts of interest with Directors will be agreed on terms that are customary in the sector concerned and disclosed in the Annual Report.
The existence of a personal conflict (or a potential conflict) of interest does not affect the authority to represent the Company, as described under “The Board - Powers, responsibilities and functioning” on page 68.
On appointment, and each subsequent year, Non-Executive Directors are required to confirm in writing that they have sufficient time to devote to the Company’s affairs. In addition, they are required to seek prior approval from the Chairman before taking on any additional external commitments that may affect their time available to devote to the Company, and the Board is advised of any changes. The Board is satisfied that all Non-Executive Directors are contributing effectively to the operation of the Board.
Company SecretaryJacqueline KnoxJacqueline Knox replaced Robert K Moorhouse as Group Company Secretary with effect as of 1 December 2018.
The Company Secretary advises the Board and ensures good information flows and comprehensive practical support is provided to the Directors. She maintains the Corporate Governance Framework and organises Directors’ induction and training. The Company Secretary communicates with shareholders as appropriate and ensures due regard is paid to their interests. Both appointment and removal of the Company Secretary is a matter for the Board as whole.
A N N U A L R E P O R T 2 0 1 8R H I M A G N E S I TA
7 1
Corporate Governance Reportcontinued
Performance of the Board, its Committees and the DirectorsDuring late 2018 the Chairman of the Board and the Deputy Chairman introduced a review of the Board’s effectiveness, its Committees and individual Directors. The evaluation was facilitated externally and considered further at the meeting of the Board in January 2019. As at the date of this report, the Board is developing a series of recommendations and is committed to future annual reviews being facilitated externally at least once every three years.
Read about the evaluation on page 77
CommitteesAudit and Compliance CommitteeThe Terms of Reference of the Audit and Compliance Committee, available in full on the Company’s website, are summarised below:
¥ monitoring the integrity of the Company’s financial statements, including its annual and half-yearly reports, preliminary announcements and any other formal statements relating to its financial performance;
¥ reviewing of and reporting to the Board on significant financial reporting issues and judgements which those statements contain having regard to any matters communicated to it by the internal or external auditor;
¥ reviewing the Company’s internal financial control systems and risk management that identify, assess, manage and monitor financial risks, and its other internal control and risk management systems;
¥ monitoring and assessing the compliance with recommendations and observations from internal and external auditors such as management letters and management’s responses;
¥ monitoring the role and functioning of the internal audit function and review of the Audit and Compliance Committee effectiveness; review of compliance, whistle-blowing and anti-fraud framework; and
¥ within the terms of the agreed policy, determine with agreement of the Board the total individual remuneration package of the Chairman, each Executive Director, and other designated senior executives including bonuses, incentive payments and share options or other share awards;
¥ approve the design of, and determine targets for, any performance-related pay plans operated by the Company and recommend to the Board for approval the total annual payments made under such plans;
¥ review the design of all share incentive plans for approval by the Board and shareholders. For any such plans, determine each year whether awards will be made and, if so, the overall amount of such awards, the individual awards to Executive Directors, and other designated senior executives and the performance targets to be used;
¥ determine the policy for, and scope of, retirement arrangements for each Executive Director and other designated senior executives;
¥ ensure that contractual terms on termination, and any payments made, are fair to the individual and the Company, that failure is not rewarded and that the duty to mitigate loss is recognised;
¥ oversee any major changes in employee benefits structures throughout the Group;
¥ reviewing the performance of any retained advisers and the effectiveness of the Remuneration Committee; and
¥ preparing the Remuneration Report.
The Remuneration Committee consists of at least three members, all of whom are Non-Executive Directors who meet the independence requirements of the UKCGC and DCGC.
¥ maintaining relations with the external auditor, including, in particular, their independence, remuneration and any non-audit services carried out by them for the Company.
All members of the Audit and Compliance Committee are independent Non-Executive Directors from a UKCGC standpoint, with at least one of whom having recent and relevant financial experience and with competence in accounting and/or auditing. The Audit and Compliance Committee as a whole has competence relevant to the sector in which the Company operates. Members of the Audit and Compliance Committee are appointed by the Board on the recommendation of the Nomination Committee in consultation with the Chairman of the Audit and Compliance Committee.
The Audit and Compliance Committee consists of John Ramsay (Chairman), Andrew Hosty and Wolfgang Ruttenstorfer. The composition of the Audit and Compliance Committee is compliant with the UKCGC and the DCGC.
Attendance at Audit and Compliance Committee meetings in 2018 (shown over a total number of meetings held):
Attended
John Ramsay 16/16
Andrew Hosty 15/16
Wolfgang Ruttenstorfer 16/16
The Company confirms that it complied with the provisions of the Competition and Markets Authority’s Order for the financial year under review.
Remuneration CommitteeThe Terms of Reference of the Remuneration Committee, available in full on the Company’s website are summarised below:
¥ determine and agree with the Board the framework or broad policy for the remuneration of the Chairman of the Board, the Executive Directors and other members of the executive management as it is designated to consider, to be proposed by the Board for approval at the General Meeting;
R H I M A G N E S I TAG O V E R N A N C E
7 2
Members of the Remuneration Committee are appointed by the Board, on the recommendation of the Nomination Committee in consultation with the Chairman of the Remuneration Committee. The Remuneration Committee consists of Celia Baxter (Chairperson), James Leng and Karl Sevelda. The composition of the Remuneration Committee is compliant with the UKCGC and the DCGC.
Attendance at Remuneration Committee meetings in 2018 (shown over a total number of meetings held):
Attended
Celia Baxter 6/6
James Leng 6/6
Karl Sevelda 6/6
The Committee has appointed Korn Ferry as consultants to provide advice on the development of the Remuneration Policy and the development of the annual bonus and Performance Share plan and ad hoc remuneration matters. Korn Ferry also provided executive search services to the Company in 2018.
Nomination CommitteeThe Terms of Reference of the Nomination Committee, available in full on the Company’s website are summarised below:
¥ reviewing the structure, size, functioning and composition of the Board, the diversity policy and degree of achievement, succession planning, and making recommendations to the Board with regard to any changes;
¥ keeping under review succession plans for senior management appointments, including in relation to the Executive Directors, and the Company’s policy and process in relation to the recruitment of candidates for these roles;
¥ making proposals for (re)appointments of Directors; and
¥ making recommendations concerning membership of the Audit and Remuneration Committees and any other Board Company as appropriate, in consultation with the Chairman of those committees.
reporting and controls; and corporate governance. The executive management assist the Board with its responsibilities concerning the strategy of the Company; make strategy recommendations to the Board; is accountable for implementing the Board’s decisions; and is responsible for directing and overseeing the operations of the Company.
Outline of anti-takeover measuresNo anti-takeover measures have been implemented.
Share capital and major shareholdingsAt the date hereof, the Company is aware of the following persons holding directly or indirectly at least 3% of the issued and outstanding shares in the capital of the Company:
ShareholderNumber of
shares %
MSP Stiftung1 14,076,021 28.45
GP Investments IV Ltd2 4,258,905 8.61
E. Prinzessin zu Sayn-Wittgenstein-Berleburg3 2,088,461 4.22
K.A. Winterstein4 2,088,461 4.22
W. Winterstein5 1,590,000 3.21
Notes:1 Information obtained from the Issuer: Held
directly by MSP Stiftung and through a subsidiary. MSP Stiftung is a foundation under Liechtenstein law, whose founder is Mag. Martin Schlaff
2 Information obtained from the Issuer: Held through GP Capital Partners IV, L.P., Grafita Holdings, Inc and Alumina II Holdings S.À.R.L.
3 The interest is held through Chestnut Beteiligungsgesellschaft mbH (“Chestnut“). Ms. Sayn-Wittgenstein made an agreement with Mr. Winterstein which allows Chestnut to exercise the voting rights of Silver Beteiligungsgesellschaft mbH (“Silver“) in the Issuer. Ms. Sayn-Wittgenstein and Mr. Winterstein share a family relationship
4 The interest is held through Silver. Ms. Sayn-Wittgenstein made an agreement with Mr. Winterstein which allows Chestnut to exercise the voting rights of Silver in the Issuer. Ms. Sayn-Wittgenstein and Mr. Winterstein share a family relationship
5 Held directly and through FEWI Beteiligungsgesellschaft mbH
The Nomination Committee consists of at least three members, a majority of whom are independent Non-Executive Directors. Members of the Nomination Committee are appointed by the Board, on the recommendation of the Nomination Committee in consultation with the Chairman of the Nomination Committee. The Nomination Committee consists of Herbert Cordt (Chairman), James Leng and Celia Baxter.
The composition of the Nomination Committee is compliant with the UKCGC and DCGC.
Attendance at Nomination Committee meetings in 2018 (shown over a total number of meetings held):
Attended
Herbert Cordt 8/8
James Leng 8/8
Celia Baxter 8/8
Executive Management TeamAt the date of this Annual Report, the Executive Management Team of the Company is composed as follows:
¥ Stefan Borgas, CEO; ¥ Eduardo Gotilla, Acting CFO; ¥ Gerd Schubert, COO; ¥ Gustavo Franco, CSO; ¥ Luis Bittencourt, CTO; ¥ Thomas Jakowiak, Executive VP
Integration Management; ¥ Luiz Rossato, Executive VP Corporate
Development; ¥ Simone Oremovic, Executive VP People
and Culture Management; and ¥ Jacqueline Knox, Executive VP General
Counsel & Company Secretary.
There is a clear division of responsibilities between those reserved for the Board and those delegated to the Executive Management Team. The types of decisions reserved for the Board include, among other items, overall responsibility for strategy and management; major acquisitions and investments; structure and capital; financial
A N N U A L R E P O R T 2 0 1 8R H I M A G N E S I TA
7 3

Corporate Governance Reportcontinued
and Head of Investor Relations hold meetings with institutional investors as well as regular briefings with analysts throughout the year. The Company hosts results presentations, webcasts, investor roadshows, one-to-one meetings and site visits. The Company also uses RNS announcements, the Annual Report and presentations as a way of disseminating information.
The Company’s major shareholders are encouraged to meet with the Chairman and the Senior Independent Director to discuss any matters they may wish to raise.
The Board receive regular updates on the Company’s major shareholders and receive reports on shareholder feedback. The Non-Executive Directors are invited to attend the Company’s results presentations.
Corporate governance declarationThe DCGC requires companies to publish a statement concerning their approach to corporate governance and compliance with the DCGC. This is referred to in article 2a of the decree on requirements for annual reports (Besluit inhoud bestuursverslag) of 23 December 2004, as most recently amended on 1 January 2018 (the “Decree”).
The information required to be included in this corporate governance statement as described in articles 3, 3a and 3b of the Decree, forms part of the Annual Report, which is available on the Company’s website. The information required to be included in this corporate governance statement as described in sections 3, 3a and 3b of the Decree can be found in the following chapters, sections and pages of the Annual Report and are deemed to be included and repeated in this statement:
¥ the information concerning compliance with the Dutch Corporate Governance Code, as required by section three of the Decree, can be found on page 67:
¥ the information concerning the Company’s main features of the internal risk management and control systems relating to the financial reporting process, as required by section 3a sub a of the Decree, can be found on pages 42 and 43:
There are no restrictions on voting rights and no holders of any securities with special control rights.
Shares may be issued pursuant to a resolution of the General Meeting or of the Board, if and insofar as the Board has been designated for that purpose by a resolution of the General Meeting. The General Meeting shall, for as long as any such designation of the Board for this purpose is in force, no longer have authority to resolve upon the issuance of shares. A designation of the Board can be made for a fixed period, not exceeding five years, and may be extended, each time for a period not exceeding five years. A designation must specify the number of shares which may be issued. This can be expressed in a percentage of the issued capital. Unless the designation provides otherwise, it may not be withdrawn. Within eight days after a resolution of the General Meeting to issue shares or to designate the Board as the body of the Company authorised to issue shares or, if allowed, to withdraw such designation, the Company shall deposit the full wording of the resolution at the Dutch Trade Register. Within eight days after the end of each calendar quarter, the Company shall notify each issuance of shares in the relevant calendar quarter to the Dutch Trade Register, stating the number of shares issued. A resolution to issue shares shall stipulate the price and the other conditions of issue.
Transactions with majority shareholdersThere have been no transactions between the Company and MSP Stiftung within the meaning of best practice provision 2.7.5 of the DCGC. Since there are no other legal or natural persons who hold at least 10% of the shares in the capital of the Company, no declaration in accordance with best practice provision 2.7.5 of the DCGC has to be published.
Communications with shareholders and other stakeholdersCommunication with the Company’s investors is a priority for the Board and there is focus on proactively maintaining an open dialogue with shareholders as well as providing accurate and complete information in a timely and consistent way. The Company runs an extensive investor relations programme, and the CEO, CFO
CultureThe combination of RHI and Magnesita in 2017 was a blend of two companies with complementary yet variant corporate cultures. The development of a new joint corporate culture and the definition of common principles continued to be a high priority in 2018. Key cultural themes serve as guiding principles and underpin the vision and strategy of the Company and for all employees. In the course of 2018 a group of employees, our “culture champions”, supported the implementation of this new culture together with the integration plan throughout the Group.
The following key cultural themes determine the actions of RHI Magnesita:
¥ act customer-focused and innovatively
¥ have open decision-making in a respectful environment
¥ operate cross-functionally, collaboratively and pragmatically across the global organisation
¥ be performance-driven and accountable.
RHI Magnesita is also committed to responsible management and its activities are based on integrity, honesty, reliability and respectful contact with employees and business partners. The Code of Conduct, the Compliance Helpline as well as additional policies and procedures of our comprehensive compliance programme are essential tools to embed the corporate culture and values as well as the fundamental legal and ethical rules RHI Magnesita stands for.
R H I M A G N E S I TAG O V E R N A N C E
74
¥ the information regarding the functioning of the General Meeting and its main authorities and the rights of the Company’s shareholders and holders of certificates of shares and how they can be exercised, as required by section 3a sub b of the Decree, can be found on page 74:
¥ the information regarding the composition and functioning of the Board and its Committees, as required by section 3a sub c of the Decree, can be found on pages 68 to 73:
¥ the diversity policy with regard to the composition of the Board and their Committees is referenced on page 77; and
¥ the information concerning the disclosure of the information required by the Decree on Section 10 EU Takeover Directive, as required by section 3b of the Decree, may be found on page 73.
Listing Rules informationFor the purposes of LR 9.8.4C R, the information required to be disclosed by LR 9.8.4 R is set out in the table below.
1 Interest capitalised n/a
2 Publication of unaudited financial information n/a
4 Details of long-term incentive schemes
80-101, 181-182
5 Waiver of emoluments by a Director n/a
6 Waiver of future emoluments by a Director n/a
7 Non pre-emptive issues of equity for cash n/a
8 Item (7) in relation to major subsidiary undertakings n/a
9 Parent participation in a placing by a listed subsidiary n/a
10 Contracts of significance n/a
11 Provision of services by a controlling shareholder n/a
12 Shareholder waiver of dividends n/a
13 Shareholder waiver of future dividends n/a
14 Agreements with controlling shareholders n/a
With reference to section 5.25c paragraph 2c of the Dutch Act on Financial Supervision, each of the Directors, whose names and functions are listed in the Governance section, confirm that, to the best of their knowledge:
¥ the Company’s financial statements and the consolidated financial statements, which have been prepared in accordance with IFRS as adopted by the European Union and the relevant provisions of the Dutch Civil Code, give a true and fair view of the assets, liabilities, financial position and profit or loss of the Group;
¥ the Annual Report gives a true and fair view on the situation on the balance sheet date, the development and performance of the business and the position of the Company and the Group companies of which the financial information is included in the Annual Report and includes a description of the principal risks and uncertainties that the Company faces; and
¥ having taken all matters considered by the Board and brought to the attention of the Board during the financial year into account, the Directors consider that the Annual Report, taken as a whole is fair, balanced and understandable. The Directors believe that the disclosures set out in the Annual Report provide the information necessary for shareholders to assess the Company’s position, performance, business model and strategy.
After conducting a review of management analysis, the Directors have reasonable expectation that the Group has adequate resources to continue in operational existence for the foreseeable future. For this reason, the Directors consider it appropriate to adopt the going-concern basis in preparing the Annual Report.
Directors are also required to provide a broader assessment of viability over a longer period which can be found on page 43 (the “Viability Statement”) of the integrated report and accounts.
The financial statements on pages 102 to 194 were approved by the Board on 26 March 2019 and signed on its behalf by Herbert Cordt and Stefan Borgas.
Statement of Directors’ responsibilitiesThe Directors are responsible for preparing the Company’s Annual Report. The Company’s Annual Report comprises the Strategic Report, the Governance Report, the Consolidated Financial Statements, the Company’s Financial Statements and some other information. The Directors are responsible for preparing the Annual Report in accordance with applicable law and regulations. The Directors are required by law to prepare the Annual Report for each financial year. The Directors have prepared the Annual Report in accordance with International Financial Reporting Standards (“IFRS”) as adopted by the European Union and the relevant provisions of the Dutch Civil Code. The Directors must not approve the Annual Report unless they are satisfied that it gives a true and fair view of the state of affairs of the Group and the Company and of the profit or loss of the Group for that period. In preparing the Annual Report, the Directors are required to:
(a) select suitable accounting policies and then apply them consistently;
(b) make judgements and accounting estimates that are reasonable and prudent;
(c) state whether applicable IFRS as adopted by the European Union and the relevant provisions of the Dutch Civil Code have been followed, subject to any material departures disclosed and explained in the Annual Report; and
(d) prepare the Annual Report on the going concern basis, unless it is inappropriate to presume that the Company will continue in business.
The Directors are responsible for keeping adequate accounting records that are sufficient to show and explain the Company’s transactions and disclose, with reasonable accuracy at any time, the financial position of the Company and the Group and enable them to ensure that the Annual Report complies with applicable law and, as regards the consolidated financial statements, Article four of the IAS Regulation. They are also responsible for safeguarding the assets of the Company and the Group and hence for taking reasonable steps for the prevention and detection of fraud and other irregularities.
A N N U A L R E P O R T 2 0 1 8R H I M A G N E S I TA
7 5
Nomination Committee ReportMembers
Herbert Cordt (Chairman)
James Leng
Celia Baxter
Committee purpose and responsibilitiesThe Nomination Committee reviews the structure, size and composition of the Board and its Committees. A summary of the principal elements of its Terms of Reference are set out in the Corporate Governance Report on page 73. At the heart of its work is an ongoing assessment of the Board’s collective skills, knowledge, competencies and experience whilst paying particular attention to independence and diversity. In spite of its long industrial heritage, in many ways RHI Magnesita is still a young company, and the Committee has been dedicated to ensuring that the Board has the competencies and depth of skills to meet the demands of a growing global business.
2018 was a year of intense activity for the Committee, whose members met on eight occasions. In addition, considerable time was spent on the work associated with its programme which is summarised in the ‘Activities’ section below.
Committee composition, skills and experienceThe Corporate Governance Report on pages 67 to 75, details the Nomination Committee members; Herbert Cordt, James Leng and Celia Baxter. Details of their skills and the experience of Committee members can be found on pages 61 to 63.
Dependent on the specific nature of the issue being considered by the Committee, other members of the Board and Executive Management Team attend meetings of the Committee and during the year, attendees included the Chairman of the Audit Committee, the Chief Executive and Head of Human Resources.
In November 2018 the Company was pleased to announce that Janet Ashdown and Fiona Paulus had accepted their nomination as Independent Non-Executive Directors. Details of their skills and experience are set out on page 63. These appointments will be put to shareholders for approval at the AGM to be held on 6 June 2019. A detailed induction programme has been developed for them which include in-depth meetings with key members of the Executive Management Team, site visits, and detailed presentations on other key matters including R&D, supply chain and major product ranges.
These appointments demonstrate the Board’s commitment to further enhance its composition in terms of independence, skills and experience as well as building a balanced and diverse structure.
External search firm, Egon Zehnder, was used in connection with the appointment of the new Independent Non-Executive Directors.
Corporate Sustainability CommitteeThe nominations of Janet Ashdown and Fiona Paulus have enabled the Company to comply with the undertaking included in its listing prospectus to establish a Corporate Sustainability Committee.
Janet Ashdown will Chair the Committee and Fiona Paulus and Andrew Hosty will be the other committee members. Terms of Reference for the Committee include, amongst other matters, the monitoring of corporate sustainability goals and targets, policies, standards, processes and procedures. The Committee will also review and report on all accidents, incidents and compliance with legal and regulatory environmental standards and requirements. A Corporate Sustainability Committee report will be included in the 2019 Annual Report and Accounts.
General Counsel & Company SecretaryDuring the Year the Nomination Committee also played a key role, together with the CEO, in the search for a new Company Secretary who would also be General Counsel and a member of the Executive Management Team. External headhunters supported the process and the Company was pleased to announce that on 1 December 2018 Jacqueline Knox joined the Company.
Activities during the YearIn 2018 the Committee considered a number of Board matters including executive and non- executive appointments, Board diversity and independence and the establishment of a Corporate Sustainability Committee. In addition, the Committee also led the process of formulating a Board review programme and a related action programme focused on improving the Board’s effectiveness.
Chief Financial Officer (“CFO”)In June 2018 the Company’s CFO and Executive Director, Octavio Lopes, informed the Board of his intention to leave by the end of 2018 and return to Brazil. The Nomination Committee instigated a comprehensive recruitment programme to identify his successor, established key candidate criteria and engaged consultants to assist with the search both internally and internationally for this strategically important appointment. A diverse pool of candidates was identified and interviewed, including candidates with successful track records at UK listed companies, operational exposure to international, capital intensive industries, M&A and the ability to act as a commercial partner to the management team and Board. A cultural fit complementary to the Company was also required.
In September 2018, the Company was pleased to announce Ian Botha, the CFO of Anglo American Platinum, as its new CFO and Finance Director for appointment at the 2019 Annual General Meeting. Until Ian Botha commences in April 2019, Eduardo Gotilla, the VP of Corporate Finance and Investor Relations is fulfilling the position of acting CFO.
Non-Executive DirectorsThe Nomination Committee led the search and selection for two new Non-Executive Independent Directors to further strengthen the Board and specifically support the establishment of the Corporate Sustainability Committee.
R H I M A G N E S I TAG O V E R N A N C E
7 6

DiversityAs highlighted above, the Nomination Committee supports the Board in pursuing its diversity agenda. Although the Board currently enjoys a rich mix of nationalities, gender, skills, experience and expertise, the Board recognises that it could go further in placing greater emphasis ensuring that its membership reflects diversity in the broadest sense.
All new appointments are made on merit and are underpinned by the specific skills and experience which candidates can bring to the overall Board composition. Subject to the appointment of Janet Ashdown and Fiona Paulus, female representation on the Board will stand at 25%, with half of the Board Committees chaired by women. In addition, approaching a quarter of the Executive Management Team is now female.
Board Evaluation The Company engaged the services of Lintstock, a corporate governance advisory specialist, to assist the Board conduct a review of its performance. The Company has no other relationship with Lintstock.
The first stage of this review involved Lintstock engaging with the Chairman and Senior Independent Director to set the context for the evaluation and to tailor the survey content to the specific circumstances of RHI Magnesita. All Board members were then invited to complete an online survey addressing the performance of the Board and its Committees. In order to promote an open and frank exchange of views appropriate arrangement were made to ensure the anonymity of the respondents.
The Board received a presentation from Lintstock of the Review’s output at its meeting in November 2018. This was followed at the January Board meeting with a discussion between Directors of potential action points, which Linstock facilitated.
As a result of the Review, the Board will - amongst other things - develop plans for: evolving its composition, its engagement with investors and employees, making improvements to the materials it receives, and the allocation of time at its regular meetings.
The review was weighted to ensure that core areas of the Board’s and Committee performance were addressed, with particular focus on the following:
¥ the evolution of the Board’s size and composition, independent Director representation and plans for Director rotation, including the attributes the Board should prioritise when seeking new appointments;
¥ the performance of the Executive Management Team, its key members and their succession;
¥ the Board’s engagement with key stakeholders, including investors and employees, and Board site visits in providing insight into the business;
¥ the continued development and understanding of the UK listed environment, the handling of conflicts of interest, and any areas in which Directors would benefit from receiving further training and support;
¥ the Board’s Committee structure, the performance of each of the Committees over the past year and the effectiveness with which the Committees report back to the Board;
¥ the quality of the Board’s strategy session, as well as the top strategic issues that face RHI Magnesita over a three to five year period; and
¥ the Board’s oversight of risk management and the quality of reporting and metrics provided in this area.
A N N U A L R E P O R T 2 0 1 8R H I M A G N E S I TA
7 7
Audit & Compliance Committee ReportMembers
John Ramsay (Chairman)
Wolfgang Ruttenstorfer
Andrew Hosty
The Audit Committee advises the Board in relation to the financial reporting process and its other responsibilities and prepares resolutions of the Board in relation thereto.
The Audit committee comprises three members, all of whom are independent Non-Executive Directors. Appointments to the Committee are made by the Board. The Board has satisfied itself that the Committee’s membership includes Directors with recent and relevant financial experience.
Meetings attendanceThe Committee meets as required, but not less than three times a year. Other Directors, including the CFO, attend Audit Committee meetings. The Chairman of the Committee has had regular private discussions with the external auditor and the CFO during the Year.
During 2018 the Committee met five times and conducted 11 calls. The Committee has also met three times and had two calls since the end of the financial year, and prior to the signing of this Annual Report. The frequency of meetings and calls was high as a result of 2018 being the first year after the merger.
John Ramsay, as Chairman, and Wolfgang Ruttenstorfer have attended all Audit Committee meetings and calls in 2018. Andrew Hosty attended all Committee meetings and 10 calls. The external auditors attended three Committee meetings and three calls during the Year.
Committee activitiesThe main activities of the Committee included the following:
¥ The critical review of the significant financial reporting issues in connection with the preparation of the Company’s financial and related formal statements, with the assistance of reports received from management and the external auditor;
¥ An assessment of the scope and effectiveness of the systems established to identify, assess, manage and monitor financial and non-financial risks;
¥ Monitoring and reviewing the plans, work and effectiveness of the internal audit function, including any actions taken following any significant failures in internal controls;
¥ Review of the 2017 and 2018 Annual Report;
¥ Review of the quarterly trading updates; ¥ Review of the interim financial
statements; ¥ Review of the external auditor, its terms
of engagement, findings of its work and at the end of the audit process reviewing its effectiveness;
¥ Review of the independence and objectivity of the external auditor;
¥ Review of treasury guidelines; ¥ Review of financing options.
Responsibilities of the Audit CommitteeThe responsibilities of the Audit Committee focus on supervising the activities of the Board with respect to:
¥ Supervising and monitoring the effect of internal risk management and control systems, including supervision of the enforcement of the relevant legislation and regulations, and supervision the effects of code of conduct;
¥ Supervising the recording, management and submission of financial information by the Company (including choices of accounting policies, application and assessment of the effects of new rules, information regarding the handling of estimated items in the financial statements, forecasts, work of the internal auditor and the external auditor);
¥ Supervising the compliance with recommendations and observations of the internal auditor and the external auditor;
¥ Supervising the functioning of the internal audit department and controllers, and in particular, codetermining the plan of action for the internal audit department and taking note of the findings and considerations of the internal audit department;
¥ Supervising the policy of the Company on tax planning;
¥ Supervising the financing of the Company;
¥ Supervising the applications of information and communication technology;
¥ Supervising the relationship with the external auditor, including in particular, assessing its independence, remuneration and non-audit related work for the Company;
R H I M A G N E S I TAG O V E R N A N C E
7 8

¥ Determining the involvement of the external auditor in respect of the contents and publication of financial reporting by the Company (other than the Annual Accounts), and acknowledging irregularities in respect of the content of the financial reporting as may be reported by the external auditor;
¥ Recommending the appointment of an external auditor by the General Meeting; and
¥ Approving the Annual Accounts.
The Audit Committee furthermore maintains regular contact with and supervises the external auditor.
External auditorThe Company’s external auditor, PricewaterhouseCoopers (“PwC”), was appointed at the Annual General Meeting held on 7 June 2018.
The external auditor reports to the Committee on the actions taken to comply with professional and regulatory requirements and with best practice designed to ensure its independence. TheCommittee reviews and approves requests for non-audit services on a case by case basis.
During the Year, the Committee reviewed the effectiveness of PwC as an external auditor. The evaluation took the form of a survey comprising a range of questions covering quality and efficiency of audit. This was completed by senior finance managers of the RHI Magnesita Group. The results of this survey and review were assessed by the Committee and discussed with PwC. The Committee recommended that PwC should be proposed for reappointment at the upcoming Annual General Meeting.
RHI AG carried out an auditor tendering process in 2016; given that the tender occurred shortly before the merger, the Audit Committee has considered it unnecessary thus far for RHI Magnesita to re-tender. The external auditors are appointed for one year, with re-appointment being required at the Annual General Meeting.
Audit Committee evaluationAn internal evaluation of the performance of the Audit Committee has been undertaken. This review concluded that the Audit Committee has been operating effectively based on the subject matters covered, the nature of the Committee meetings, thoroughness of approach and the business understanding, skills and experience of the Committee members.
Assessment of the finance leadership teamThe Committee directly assessed the capability of the finance leadership team. The Committee reviewed presentations from each finance leader outlining the vision for their respective areas within finance. The Committee also reviewed the overall strategy to implement and transition to shared service centres supported by IT integration activities, which commenced in Europe and will continue in the Americas in 2019. The Committee concluded that the changes made to the Finance organisation and leadership team have enhanced its capabilities.
Corporate reporting reviewDuring the Year, the Company’s 2017 financial statements were subject to a routine review by the Dutch Financial Market Authority (“AFM”). The Corporate Reporting Review team had questions related to the preliminary purchase price allocation of Magnesita, impairment test and financial instruments disclosures. The review did not result in any material findings that would require revision of the 2017 financial statements.
Purchase price allocation of MagnesitaThe Company completed the purchase price allocation of Magnesita within 12 months from the acquisition date as required by IFRS. Deloitte has been appointed as a principal advisor for the project, additional specialists have been engaged for mining rights and fixed assets. PwC scrutinised the final purchase price allocation during the interim audit and completed the review without any findings.
Internal auditThe annual assessment of the effectiveness and capability of internal audit identified a need to strengthen the internal audit function. A new role of Group Head of Internal Audit was established and the two legacy internal audit functions integrated into a single global team with enhanced coverage. Additional internal audit resources will be put into place in Americas, Europe and Asia in 2019.
Internal controlDuring the Year there have been several internal and external activities focused on the control environment of the Company. These have included:
¥ The full year audit of the 12 months ended 31 December 2018 of RHI Magnesita N.V. performed by PwC for the purpose of this Annual Report and Accounts;
¥ Review of Magnesita’s updated preliminary purchase price allocation disclosed in the interim Accounts as of 30 June 2018 performed by PwC;
¥ Review of Magnesita’s final purchase price allocation performed by PwC;
¥ The internal audit function has performed reviews at a number of the Group’s sites during the Year;
¥ Bottom-up identification and assessment of risks performed by the risk management department.
¥ The statutory audits have not resulted in any significant control issues being brought to the attention of the Committee that would require material adjustment to the accounts.
A N N U A L R E P O R T 2 0 1 8R H I M A G N E S I TA
7 9
Members
Celia Baxter (Chairman)
James Leng
Karl Sevelda
I am pleased to present the Report of the Remuneration Committee for the financial year ended 31 December 2018, providing a summary of the Committee’s work during the Year, as well as the context for the decisions made.
This was the first full year of operation for RHI Magnesita, following the combination of the businesses of RHI and Magnesita, under a new Dutch holding company and admission to the London Stock Exchange in October 2017. Being Dutch incorporated and registered, whilst listed on the London Stock Exchange, RHI Magnesita is required to comply with both UK and Dutch reporting requirements and their respective Corporate Governance Codes. Our Remuneration Report is therefore made on this basis and recognising transparency of reporting, certain additional voluntary disclosures are also made.
We were pleased that at the 2018 Annual General Meeting (“AGM”) all the resolutions relating to the Directors’ Remuneration Policy, the Annual Statement and Report on Remuneration and the new long-term incentive plan (‘LTIP’) were approved by more than 99% of our voting shareholders. The Directors’ Remuneration Policy, which is intended to operate until 2021, was as previously disclosed retrospectively applied from 1 January 2018. The new LTIP became operative following the 2018 AGM.
This all-round performance gives the context for the Committee’s decisions during the Year.
Incentive outcomes for the YearAs set out in the Annual Report of Remuneration, remuneration outcomes for the Year were as follows:
Annual Bonus Plan: Awards for the year for the CEO with 88.0% of maximum and for the CFO 98.7% as maximum reflect the strong all-round performance of the Company during the year. The operating EBIT increased by 62.4%. The Company generated €383.8 million of free cash flow and the synergy targets were exceeded. Further details of our performance against 2018 bonus targets can be seen on page 95.
Performance Share Plan: There were no long-term incentives subsisting at the time of Admission. The CEO in 2017 received a phantom share award as part of his previous remuneration package. This vested prior to Admission and will be paid in three equal tranches in 2018, 2019 and 2020. The first Performance Shares under the new long-term incentive plan were awarded in 2018 and are not due to vest, subject to performance, until 2021.
The Committee is satisfied that the above outcome of the incentive plans was a fair reflection of the performance of the Company over the relevant period. The above annual bonus plan outcome was as calculated against quantitative performance conditions, the Committee did not use its discretion to modify the outcome, as it was considered that the Plan operated as intended.
Remuneration is closely aligned with our strategyOur Remuneration Policy continues to be closely aligned to and supportive of our strategy. The objective of combining two companies to form RHI Magnesita was to capture the strengths of each entity leading to an enlarged portfolio of products and services, greater proximity to customers through a broader geographical footprint, technology leadership, as well as more effective raw material integration. Another material benefit of this is the capturing of synergies and efficiencies, leading to immediate earnings improvements. Our remuneration policy and practices are in line with these objectives, with bonus plans that incentivise growth, cash flow generation and the achievement of synergy targets and strategic projects. Our LTIP rewards the creation of shareholder value and earnings growth.
Before the combination of the two companies, Magnesita used Economic Profit Growth as a key performance indicator (‘KPI’). Prior to the completion of the Integrated Tender Offer to the minority shareholders of Magnesita, it was difficult to introduce this KPI to the combined business. However, this will now be implemented as a KPI from 2019 to measure the creation of long-term value. Economic Profit Growth has therefore been included as one of the KPIs in the 2019 LTIP in place of EBIT.
RHI Magnesita’s performance during 2018As laid out in the Chairman’s Statement and the Chief Executive Officer’s Review, RHI Magnesita delivered strong all round performance during the Year under review:
¥ Group revenue increased by 21% ¥ Adjusted EBITA increase of 81% ¥ Adjusted EBITA margin increased to
13.9% demonstrating a 460 basis points improvement on 2017
¥ Integration plans and increased synergy targets were met, achieving savings of €70 million
¥ Healthy cash generation and leverage to 1.2 x net debt to adjusted EBITA.
Remuneration Committee Report
R H I M A G N E S I TAG O V E R N A N C E
8 0
Key Committee activities during 2018In addition to the responsibilities of the Committee (which are described in summary on page 73), the Committee spent time on the following matters during the Year:
Further development of the Remuneration Report2018 represents the first full year of remuneration reporting for the Company, with the 2017 report only covering the period from the date of Admission (27 October 2017 to 31 December 2017), therefore it should be noted that 2018 remuneration information is being compared against a significantly shorter period of 2017. The 2019 remuneration report will be the first where year-on-year comparators are for the same time period.
Remuneration issues related to the change of the CFOThe Committee considered the impact on remuneration of the past CFO, Octavio Lopes, leaving the business on 31 December 2018. No payments were made for loss of office. Details of Octavio Lopes’ remuneration are laid out on page 94 and 99.
In order to secure the recruitment of Ian Botha as a Director and CFO, an appropriate remuneration package was developed which is in line with the Company’s new remuneration policy. The new CFO’s remuneration package incorporates a lower fixed remuneration but higher variable performance-based pay than his predecessor, who had retained his legacy 2017 remuneration package for 2018. Ian Botha was recruited from Anglo American and held a variety of long-term incentives that will lapse when he leaves Anglo American. To secure his appointment and in line with the Company’s remuneration policy, the Committee offered share-based remuneration to mirror the forfeited long-term incentives of his previous employer but taking account of the potential vesting. Full details of the new CFO’s remuneration package can be found on page 100.
Policy amendmentFor ease of reference we have included again the Remuneration Policy within the Annual Report on pages 84 to 91. This policy which was approved by shareholders at the 2018 AGM, included a number of legacy items, relating in particular to the past CFO’s remuneration, that were not in line with UK market practice. As we stated last year it was our wish to bring Executive Directors’ remuneration packages within the new remuneration strategy and we also acknowledged that this may only be fully achieved when new appointments were made. The recruitment of a new CFO will allow us to remove some of these legacy elements from our Remuneration Policy which we have highlighted within the Policy. This will be done formally when the Remuneration Policy is put to shareholders for approval again in 2021.
Implementation of the Remuneration Policy for 2019The base salary of the CEO was increased by 3.5% with effect from 1 January 2019. This compares with an average of 4% for the majority of Austrian-based employees. The new CFO’s salary is lower than his predecessor.
The bonus targets for 2019 are based 75% on Group financial metrics (35% Operating EBIT measured on a constant currency basis; 30% Free Cash Flow; 10% Synergy targets) and 25% on key strategic goals of the business, which are critical to the future profitability of the Group. Although the Committee retained the same Group financial metrics, the weighting of each of the metrics was adjusted to reflect the current business priorities. The performance targets for the annual bonus are considered by the Board to be commercially sensitive and will be disclosed retrospectively in the 2019 Remuneration Report provided they are not considered to be commercially sensitive at that time.
Review of new UK codes and regulations relating to remunerationThe Committee reviewed and considered the impact of the 2018 UK Corporate Governance Code (“the 2018 Code”) and new regulation on RHI Magnesita’s remuneration practices. Many areas introduced were already part of RHI Magnesita’s practices, for example, workforce remuneration as a whole is taken into consideration, holding periods are in place on RHI Magnesita’s LTIP, the Committee has the ability to exercise discretion on remuneration plan outcomes and comprehensive malus and clawback provisions are in place. Also, a number of Employee Directors sit on the Board and this gives the Committee direct engagement with the views of the wider workforce.
Last year in line with Dutch Regulations and market practice we disclosed the pay ratio of the CEO to the average salary of all employees in the Group as 50:1. Similarly, on page 91 this year’s ratio of 52:1 is calculated on the same basis. RHI Magnesita only has 104 employees in the UK and falls below the required threshold for UK pay ratio reporting requirements. As UK employees represent less than 1% of RHI Magnesita’s employees, the Committee is comfortable that the basis of calculation comparing with all employees is appropriate.
The UK gender pay gap reporting requirement came into effect in April 2018 for companies employing more than 250 people in the UK and as described above, RHI Magnesita’s UK employees represent less than 1% of its employees. The Board and leadership team recognises that inclusion and diversity in all forms are essential ingredients in creating diversity of thought, experience and skills within the Company (read more on the Company’s approach to diversity on page 56). The Committee will consider the best way of monitoring gender pay over the coming year.
The scope of the Terms of Reference of the Committee has been revised to determine and set remuneration for senior management as well as the executive directors and the Chairman. During 2019, the Committee will develop a formal policy for post-employment shareholding requirements.
A N N U A L R E P O R T 2 0 1 8R H I M A G N E S I TA
8 1
Remuneration Committee Reportcontinued
The CEO and CFO will be granted a long-term incentive Performance Share award in 2019 with the potential to receive in 2022, if performance targets are met, shares with a market value at the date of grant (in 2019) of 200% and 150% of salary respectively. The performance targets that will determine vesting of the share awards. will be based as in 2018, on one-third on adjusted earnings per share (“EPS”) targets, one-third on relative Total Shareholder Return (“TSR”) and the other third in 2019 will be based on Economic Profit Growth. As mentioned above, from 2019 Economic Profit Growth will be used as a KPI for managing the long-term value of the Company, having been used for a number of years by Magnesita as a key management tool for the business.
Cascade of policyThe principles of the Executive Directors’ Remuneration Policy, including participation in the Group’s LTIP through the grant of Performance Share awards, have been cascaded to the Executive Management Board and senior management across the Company. In addition, bonus structures throughout the Company have been revised to reflect those of the executive and senior management to give a clear line of sight of objectives, to support the building of the new organisational culture and to incentivise appropriate behaviours and the success of our workforce.
ConclusionThis is the Committee’s first full year of operation. We have worked diligently to develop an appropriate Remuneration Policy which we will continue to review and refine. Furthermore, we believe that the Directors’ Remuneration Policy and its implementation for 2019 as well as the remuneration outcomes for 2018 remain strongly aligned to the Company’s business strategy and long-term shareholder interests.
At the 2019 AGM an advisory shareholder resolution to approve this Annual Statement and the Annual Report on Remuneration will be presented to shareholders and we look forward to your continued support.
CELIA BAXTERCHAIRMAN OF THE REMUNERATION COMMITTEE
R H I M A G N E S I TAG O V E R N A N C E
8 2
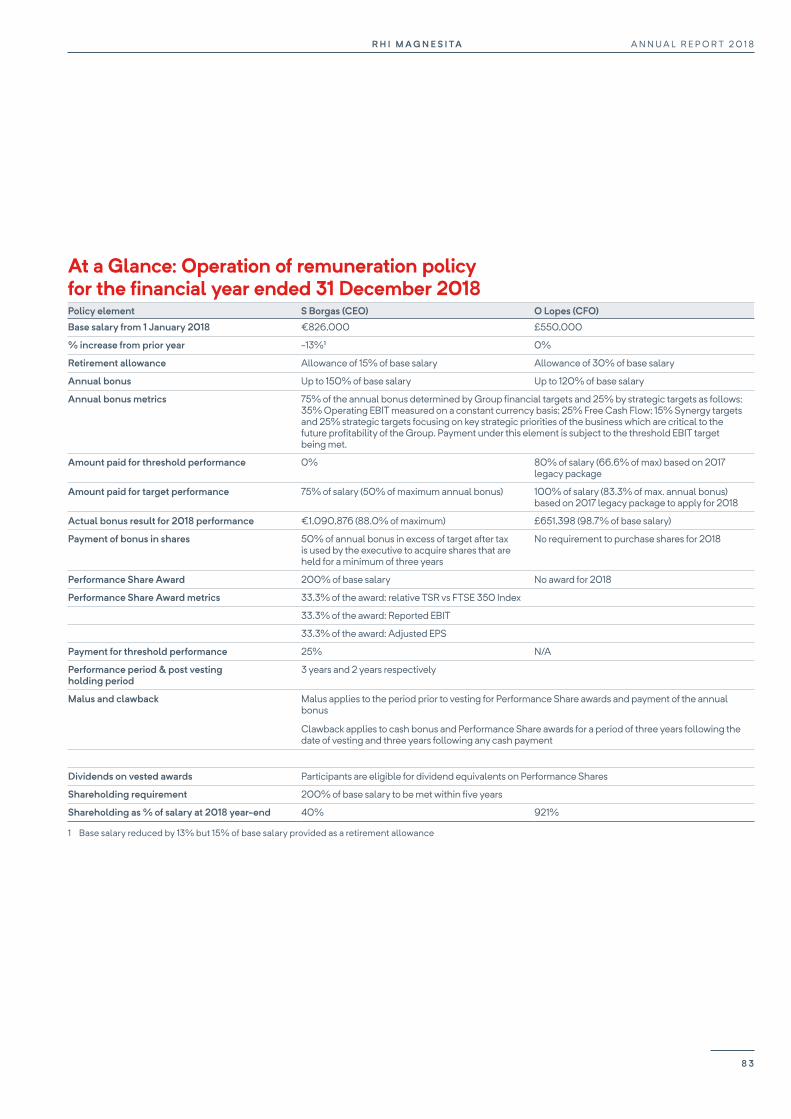
At a Glance: Operation of remuneration policy for the financial year ended 31 December 2018Policy element S Borgas (CEO) O Lopes (CFO)
Base salary from 1 January 2018 €826,000 £550,000
% increase from prior year -13%1 0%
Retirement allowance Allowance of 15% of base salary Allowance of 30% of base salary
Annual bonus Up to 150% of base salary Up to 120% of base salary
Annual bonus metrics 75% of the annual bonus determined by Group financial targets and 25% by strategic targets as follows: 35% Operating EBIT measured on a constant currency basis; 25% Free Cash Flow; 15% Synergy targets and 25% strategic targets focusing on key strategic priorities of the business which are critical to the future profitability of the Group. Payment under this element is subject to the threshold EBIT target being met.
Amount paid for threshold performance 0% 80% of salary (66.6% of max) based on 2017 legacy package
Amount paid for target performance 75% of salary (50% of maximum annual bonus) 100% of salary (83.3% of max. annual bonus) based on 2017 legacy package to apply for 2018
Actual bonus result for 2018 performance €1,090,876 (88.0% of maximum) £651,398 (98.7% of base salary)
Payment of bonus in shares 50% of annual bonus in excess of target after tax is used by the executive to acquire shares that are held for a minimum of three years
No requirement to purchase shares for 2018
Performance Share Award 200% of base salary No award for 2018
Performance Share Award metrics 33.3% of the award: relative TSR vs FTSE 350 Index
33.3% of the award: Reported EBIT
33.3% of the award: Adjusted EPS
Payment for threshold performance 25% N/A
Performance period & post vesting holding period
3 years and 2 years respectively
Malus and clawback Malus applies to the period prior to vesting for Performance Share awards and payment of the annual bonus
Clawback applies to cash bonus and Performance Share awards for a period of three years following the date of vesting and three years following any cash payment
Dividends on vested awards Participants are eligible for dividend equivalents on Performance Shares
Shareholding requirement 200% of base salary to be met within five years
Shareholding as % of salary at 2018 year-end 40% 921%
1 Base salary reduced by 13% but 15% of base salary provided as a retirement allowance
A N N U A L R E P O R T 2 0 1 8R H I M A G N E S I TA
8 3
The Remuneration Policy, which complies with UK and Dutch governance, was approved by shareholders in 2018.
This Directors’ Remuneration Policy was approved by over 99% of voting shareholders at the June 2018 AGM and became effective from 1 January 2018. Other than in the event of exceptional circumstances, the Committee does not intend to revert to shareholders with a new Remuneration Policy before the end of the three year period at the 2021 AGM.
Policy overviewThe Remuneration Committee has responsibility for determining the remuneration for the Chairman and Executive Directors.
The aim of the Company’s remuneration strategy is to provide a level of fixed pay that, together with incentives, will attract, retain and motivate high-calibre, high-performing executives, aligning them to the long-term performance of the Company and its long-term share performance while rewarding them for creating and delivering shareholder value.
The remuneration policy has been structured in line with market practice for UK-listed companies, while taking into account the legacy issues and Dutch law.
The remuneration policy was put in place when the Company listed in 2017 replicated the Executive Directors’ existing remuneration arrangements created by RHI and Magnesita for the CEO and CFO respectively. This enabled the continuation of the Executive Directors’ remuneration structure prior to listing while a new policy was developed by the Remuneration Committee to bring to the Company’s first AGM in June 2018 for approval.
Certain aspects of this new policy are only applicable to our past CFO, Octavio Lopes, reflecting the historic structure of his remuneration and legacy contract. However, Octavio Lopes left the Company on 31 December 2018 and these aspects of the Policy are therefore no longer applicable and will be removed when the Policy is brought to shareholders for approval in 2021 and are noted below for ease of reference. The new CFO’s remuneration is in line with the ongoing new Remuneration Policy.
The remuneration policy for Executive and Non-Executive DirectorsFor ease of reference we have included on pages 84 to 91 the remuneration policy for the Executive Directors and Non-Executive Directors. We have emboldened sections of the Policy that related to the legacy arrangements for our past CFO who left the business on 31 December 2018 and which are not applicable going forward.
Directors’ Remuneration Policy
R H I M A G N E S I TAG O V E R N A N C E
8 4
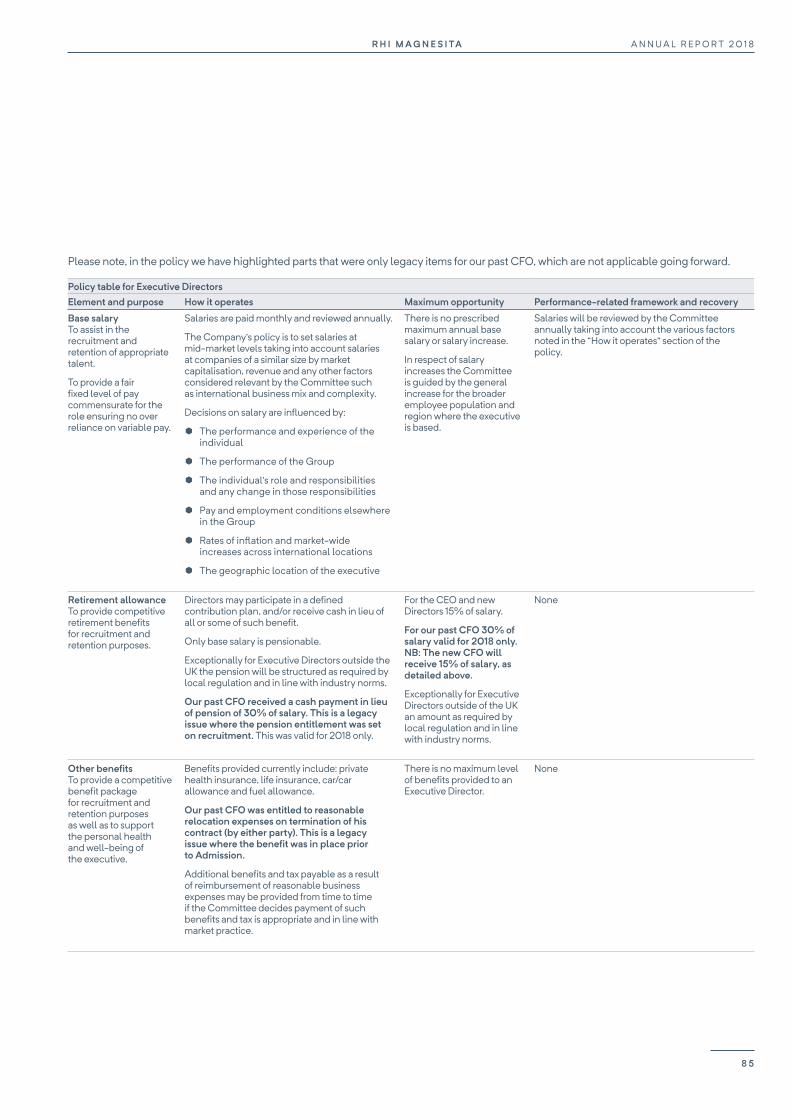
Please note, in the policy we have highlighted parts that were only legacy items for our past CFO, which are not applicable going forward.
Policy table for Executive DirectorsElement and purpose How it operates Maximum opportunity Performance-related framework and recovery
Base salaryTo assist in the recruitment and retention of appropriate talent.
To provide a fair fixed level of pay commensurate for the role ensuring no over reliance on variable pay.
Salaries are paid monthly and reviewed annually.
The Company’s policy is to set salaries at mid-market levels taking into account salaries at companies of a similar size by market capitalisation, revenue and any other factors considered relevant by the Committee such as international business mix and complexity.
Decisions on salary are influenced by:
¥ The performance and experience of the individual
¥ The performance of the Group
¥ The individual’s role and responsibilities and any change in those responsibilities
¥ Pay and employment conditions elsewhere in the Group
¥ Rates of inflation and market-wide increases across international locations
¥ The geographic location of the executive
There is no prescribed maximum annual base salary or salary increase.
In respect of salary increases the Committee is guided by the general increase for the broader employee population and region where the executive is based.
Salaries will be reviewed by the Committee annually taking into account the various factors noted in the “How it operates” section of the policy.
Retirement allowanceTo provide competitive retirement benefits for recruitment and retention purposes.
Directors may participate in a defined contribution plan, and/or receive cash in lieu of all or some of such benefit.
Only base salary is pensionable.
Exceptionally for Executive Directors outside the UK the pension will be structured as required by local regulation and in line with industry norms.
Our past CFO received a cash payment in lieu of pension of 30% of salary. This is a legacy issue where the pension entitlement was set on recruitment. This was valid for 2018 only.
For the CEO and new Directors 15% of salary.
For our past CFO 30% of salary valid for 2018 only. NB: The new CFO will receive 15% of salary, as detailed above.
Exceptionally for Executive Directors outside of the UK an amount as required by local regulation and in line with industry norms.
None
Other benefitsTo provide a competitive benefit package for recruitment and retention purposes as well as to support the personal health and well-being of the executive.
Benefits provided currently include: private health insurance, life insurance, car/car allowance and fuel allowance.
Our past CFO was entitled to reasonable relocation expenses on termination of his contract (by either party). This is a legacy issue where the benefit was in place prior to Admission.
Additional benefits and tax payable as a result of reimbursement of reasonable business expenses may be provided from time to time if the Committee decides payment of such benefits and tax is appropriate and in line with market practice.
There is no maximum level of benefits provided to an Executive Director.
None
A N N U A L R E P O R T 2 0 1 8R H I M A G N E S I TA
8 5

Directors’ Remuneration Policycontinued
Policy table for Executive DirectorsElement and purpose How it operates Maximum opportunity Performance-related framework and recovery
Annual bonusTo provide focus on the short-term performance of the Company and to provide a reward for achieving short-term personal, strategic and financial Company performance.
To provide a mechanism for alignment with longer-term performance and shareholder alignment.
The requirement for Executive Directors to acquire shares with their bonus aligns them to the “development of the market price of the shares” in the Company as provided in the Dutch Corporate Governance Code.
The annual bonus is based on the Group’s performance as set and assessed by the Committee on an annual basis.
The annual bonus is paid in cash and the Executive Directors (except for our past CFO in respect of his 2018 annual bonus) are required to acquire shares in the Company with 50% of the amount paid in excess of target (after tax) which will be held for a minimum period of three years.
Up to 150% of base salary maximum potential opportunity.
Target potential opportunity is 50% of maximum opportunity.
For 2018 the CFO’s target potential opportunity was 100% of salary which is 83.3% of maximum (on the basis that his maximum potential opportunity was 120% of salary), and threshold potential opportunity was 66.6% of maximum (being 80% of salary).
Details of the performance targets set for the year under review and performance against them will normally be provided each year in the Annual Report on Remuneration. If, for reasons of commercial sensitivity, the targets cannot be disclosed then they will be disclosed in the following year.
Performance normally measured over a one year period.
Targets will be based on the Group’s annual financial and non-financial performance for the particular performance year. At least 70% of the bonus will be subject to financial performance metrics.
The Committee may scale back the bonus that is payable if it considers the outcome to be reasonably unacceptable or if it is not representative of the underlying performance of the Company and/or there have been regulatory, environmental or health and safety issues that the Committee considers are of such severity that a scale back of the bonus is appropriate.
For the financial targets, not more than 25% of the maximum potential bonus opportunity will be payable for achieving threshold performance rising on a graduated scale to 100% for maximum performance. Threshold performance being the level of performance required for the bonus to start paying.
In relation to strategic targets the structure of the target will vary based on the nature of the target set and it will not always be practicable to set targets using a graduated scale. Vesting may therefore take place in full if specific criteria are met in full.
Payments under the annual bonus plan may be subject to clawback/malus for a period of three years from payment in the event of a material misstatement of the Company’s financial results, an error in calculating the level of grant or level of vesting or payment, a failure of risk management including the liquidation of the Group, if the participant has been guilty of fraud or gross misconduct or the Company has been brought into disrepute. The clawback/malus provisions as set out above do not limit Article 2:135 of the Dutch Civil Code.
R H I M A G N E S I TAG O V E R N A N C E
8 6
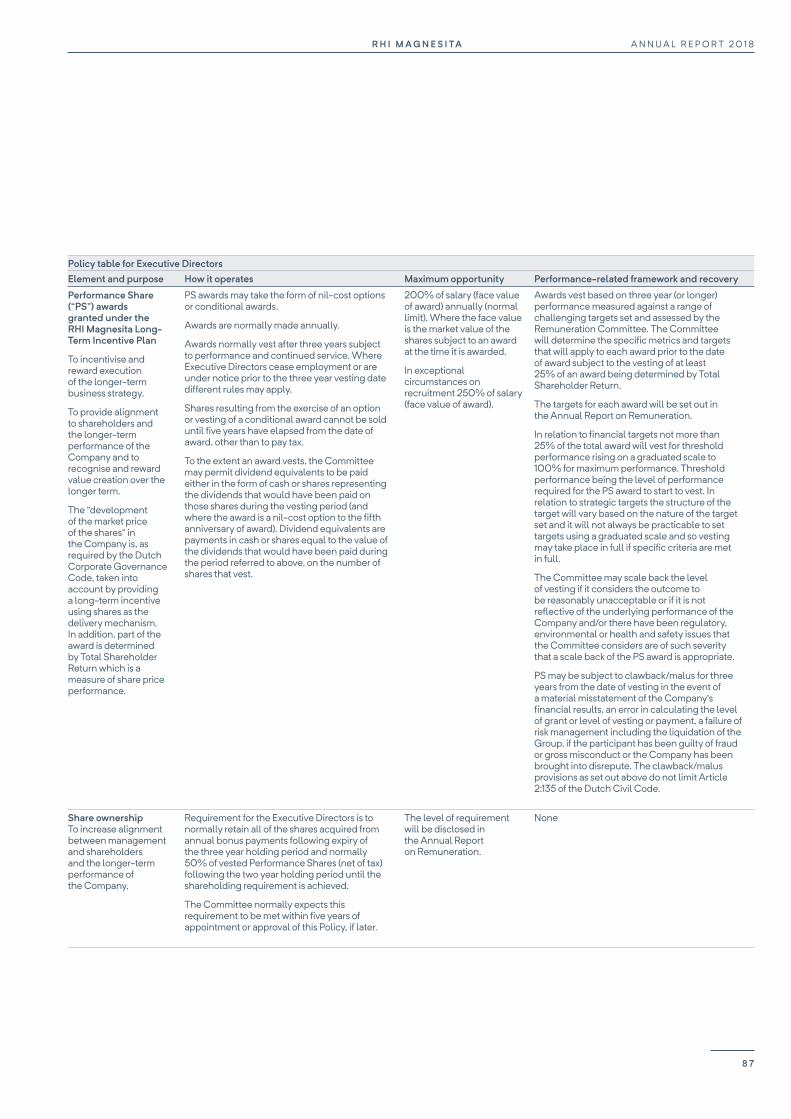
Policy table for Executive DirectorsElement and purpose How it operates Maximum opportunity Performance-related framework and recovery
Performance Share (“PS”) awards granted under the RHI Magnesita Long-Term Incentive Plan
To incentivise and reward execution of the longer-term business strategy.
To provide alignment to shareholders and the longer-term performance of the Company and to recognise and reward value creation over the longer term.
The “development of the market price of the shares” in the Company is, as required by the Dutch Corporate Governance Code, taken into account by providing a long-term incentive using shares as the delivery mechanism. In addition, part of the award is determined by Total Shareholder Return which is a measure of share price performance.
PS awards may take the form of nil-cost options or conditional awards.
Awards are normally made annually.
Awards normally vest after three years subject to performance and continued service. Where Executive Directors cease employment or are under notice prior to the three year vesting date different rules may apply.
Shares resulting from the exercise of an option or vesting of a conditional award cannot be sold until five years have elapsed from the date of award, other than to pay tax.
To the extent an award vests, the Committee may permit dividend equivalents to be paid either in the form of cash or shares representing the dividends that would have been paid on those shares during the vesting period (and where the award is a nil-cost option to the fifth anniversary of award). Dividend equivalents are payments in cash or shares equal to the value of the dividends that would have been paid during the period referred to above, on the number of shares that vest.
200% of salary (face value of award) annually (normal limit). Where the face value is the market value of the shares subject to an award at the time it is awarded.
In exceptional circumstances on recruitment 250% of salary (face value of award).
Awards vest based on three year (or longer) performance measured against a range of challenging targets set and assessed by the Remuneration Committee. The Committee will determine the specific metrics and targets that will apply to each award prior to the date of award subject to the vesting of at least 25% of an award being determined by Total Shareholder Return.
The targets for each award will be set out in the Annual Report on Remuneration.
In relation to financial targets not more than 25% of the total award will vest for threshold performance rising on a graduated scale to 100% for maximum performance. Threshold performance being the level of performance required for the PS award to start to vest. In relation to strategic targets the structure of the target will vary based on the nature of the target set and it will not always be practicable to set targets using a graduated scale and so vesting may take place in full if specific criteria are met in full.
The Committee may scale back the level of vesting if it considers the outcome to be reasonably unacceptable or if it is not reflective of the underlying performance of the Company and/or there have been regulatory, environmental or health and safety issues that the Committee considers are of such severity that a scale back of the PS award is appropriate.
PS may be subject to clawback/malus for three years from the date of vesting in the event of a material misstatement of the Company’s financial results, an error in calculating the level of grant or level of vesting or payment, a failure of risk management including the liquidation of the Group, if the participant has been guilty of fraud or gross misconduct or the Company has been brought into disrepute. The clawback/malus provisions as set out above do not limit Article 2:135 of the Dutch Civil Code.
Share ownershipTo increase alignment between management and shareholders and the longer-term performance of the Company.
Requirement for the Executive Directors is to normally retain all of the shares acquired from annual bonus payments following expiry of the three year holding period and normally 50% of vested Performance Shares (net of tax) following the two year holding period until the shareholding requirement is achieved.
The Committee normally expects this requirement to be met within five years of appointment or approval of this Policy, if later.
The level of requirement will be disclosed in the Annual Report on Remuneration.
None
A N N U A L R E P O R T 2 0 1 8R H I M A G N E S I TA
8 7
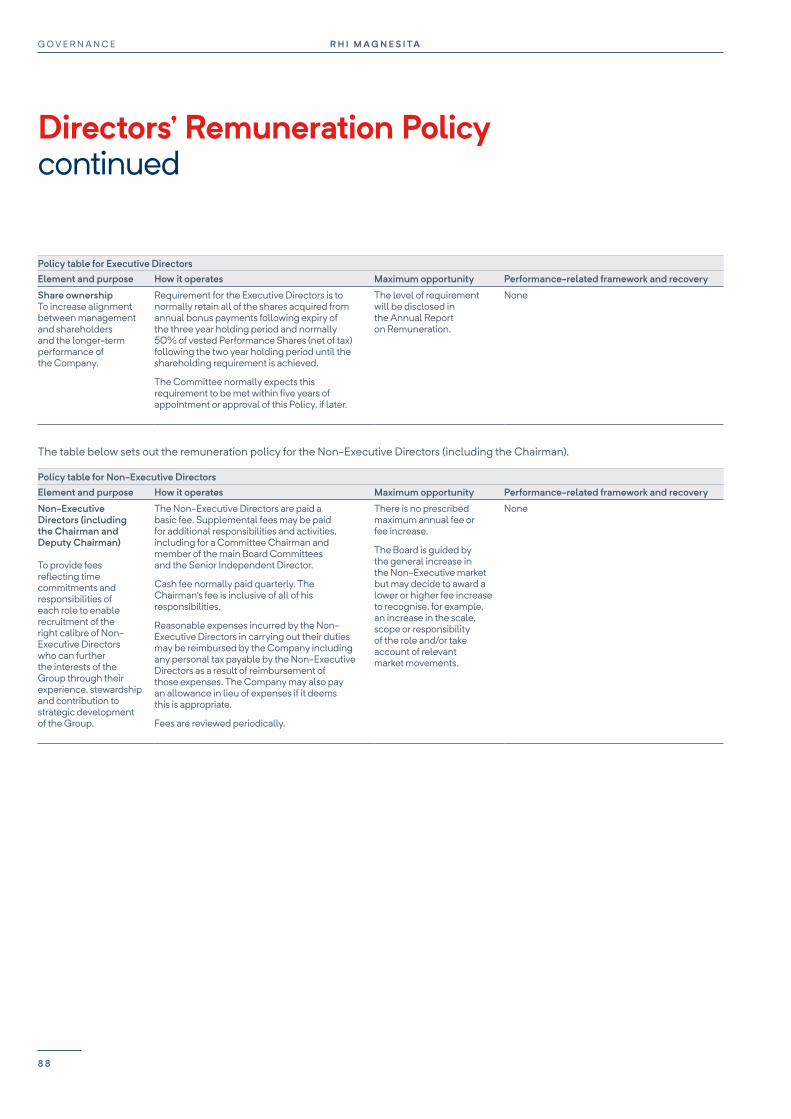
Policy table for Executive DirectorsElement and purpose How it operates Maximum opportunity Performance-related framework and recovery
Share ownershipTo increase alignment between management and shareholders and the longer-term performance of the Company.
Requirement for the Executive Directors is to normally retain all of the shares acquired from annual bonus payments following expiry of the three year holding period and normally 50% of vested Performance Shares (net of tax) following the two year holding period until the shareholding requirement is achieved.
The Committee normally expects this requirement to be met within five years of appointment or approval of this Policy, if later.
The level of requirement will be disclosed in the Annual Report on Remuneration.
None
The table below sets out the remuneration policy for the Non-Executive Directors (including the Chairman).
Policy table for Non-Executive DirectorsElement and purpose How it operates Maximum opportunity Performance-related framework and recovery
Non-Executive Directors (including the Chairman and Deputy Chairman)
To provide fees reflecting time commitments and responsibilities of each role to enable recruitment of the right calibre of Non-Executive Directors who can further the interests of the Group through their experience, stewardship and contribution to strategic development of the Group.
The Non-Executive Directors are paid a basic fee. Supplemental fees may be paid for additional responsibilities and activities, including for a Committee Chairman and member of the main Board Committees and the Senior Independent Director.
Cash fee normally paid quarterly. The Chairman’s fee is inclusive of all of his responsibilities.
Reasonable expenses incurred by the Non-Executive Directors in carrying out their duties may be reimbursed by the Company including any personal tax payable by the Non-Executive Directors as a result of reimbursement of those expenses. The Company may also pay an allowance in lieu of expenses if it deems this is appropriate.
Fees are reviewed periodically.
There is no prescribed maximum annual fee or fee increase.
The Board is guided by the general increase in the Non-Executive market but may decide to award a lower or higher fee increase to recognise, for example, an increase in the scale, scope or responsibility of the role and/or take account of relevant market movements.
None
Directors’ Remuneration Policycontinued
R H I M A G N E S I TAG O V E R N A N C E
8 8

Performance criteria and discretionsSelection of criteriaThe Committee assesses annually at the beginning of the relevant performance period which performance measures, or combination and weighting of performance measures, are most appropriate for both annual bonus and any Performance Share awarded to reflect the Company’s strategic initiatives for the performance period. The Committee has the discretion to change the performance measures for awards granted in future years based upon the strategic plans of the Company. The Committee sets what it considers are demanding targets for variable pay in the context of the Company’s trading environment and strategic objectives and considering the Company’s internal financial planning, and market forecasts. Any non-financial goals will be well defined.
Discretions retained by the CommitteeThe Committee operates the Group’s variable pay plans according to their respective rules. In administering these plans, the Committee may apply certain operational discretions. These include the following:
¥ determining the extent of vesting based on the assessment of performance;
¥ determining the status of leavers and, where relevant, the extent of vesting;
¥ determining the extent of vesting of PS awards under share based plans in the event of a change of control;
¥ making appropriate adjustments required in certain circumstances (e.g. rights issues, corporate restructuring events, variation of capital and special dividends); and
¥ adjusting existing targets if events occur that cause the Committee to determine that the targets set are no longer appropriate and that amendment is required so the relevant award can achieve its original intended purpose, provided that the new targets are not materially less difficult to satisfy.
The Company may also pay outplacement costs, legal costs and other reasonable relevant costs associated with termination and may settle any claim or potential claim relating to the termination.
Treatment of variable pay awards on terminationAnnual bonuses and PS awards are non-contractual and are dealt with in accordance with the rules of the relevant plans except that if Octavio Lopes’ contract is terminated by the Company before payment is made of his 2017 bonus then he shall remain entitled to that bonus to be paid on the same date of payment as for the other executives of the Company.
At the discretion of the Committee, in certain circumstances, for example, to incentivise short-term retention and completion of key business deliverables, and where poor performance is not relevant to the cessation, a pro-rata bonus may become payable at the normal payment date for the period of employment with financial performance targets based on full year performance. Where the Committee decides to make a payment, the rationale will be fully disclosed in the Annual Report on Remuneration.
The default treatment for share-based awards is that any unvested award will lapse on termination of employment or, in certain circumstances on the executive giving notice. However, under the rules of the long-term incentive plan under which PS awards will be made, in certain prescribed circumstances, such as death, injury, ill-health, retirement with the Company’s agreement, redundancy, leaving the Group because the employer company or business leaves the Group or where the Committee determines otherwise, awards are eligible to vest subject to the performance conditions being met over the normal performance period (or a shorter period where the participant has died) and with the award being reduced (unless the Committee considers, in exceptional circumstances, a different treatment is appropriate) by an amount to reflect the proportion of the performance period not actually served.
The Committee also retains discretion to make non-significant changes to the Policy without reverting to shareholders (for example, for regulatory, tax, legislative or administrative purposes).
Executive Directors’ service contracts and payments for loss of officeService contracts and letters of appointment are available for inspection at the Company’s registered office.
Service contracts and loss of officeIt is the Company’s policy that notice periods for Executive Directors will not exceed 12 months and the service contracts for Executive Directors, Mr Borgas and Mr Botha, are terminable by either the Company or the Executive Director on 12 months’ notice.
The Committee’s policy in relation to termination of service contracts is to deal with each case on its merits having regard to the circumstances of the individual, the termination of employment, any legal advice received and what is in the best interests of the Company and its shareholders. An Executive Director’s service contract may be terminated early (other than for cause) by payment in lieu of salary in equal monthly instalments over the notice period. The Company may include pension contributions and benefits within the payment in lieu of notice if this is deemed appropriate or is specifically provided for in the service contract. Unless a contract specifically provides otherwise, all payments would discontinue or reduce to the extent that alternative employment is obtained. There are no enhanced provisions on a change of control and there are no specific severance arrangements.
An Executive Director’s service contract may be terminated without notice for certain events such as gross misconduct in which case no payments or compensation beyond sums accrued to the date of termination will be paid.
A N N U A L R E P O R T 2 0 1 8R H I M A G N E S I TA
8 9

Approach to recruitment and promotionsThe recruitment package for a new Director would be set in accordance with the terms of the Company’s approved remuneration policy.
On recruitment, salary may be set below the normal market rate, with phased increases as the Director gains experience.
Annual bonus opportunity will reflect the period of service for the year.
The normal annual PS award limit is 200% of salary face value in a financial year (face value being the market value of the shares subject to an award at the time it is awarded). A higher limit of 250% of salary (face value) is included in the recruitment policy for use in exceptional circumstances for the Company to be able to attract and secure the right candidate if required. A PS award may be made shortly after an appointment if the usual annual award date has passed.
On an internal appointment, any variable pay element awarded in respect of their prior role will normally be allowed to continue according to its terms.
The policy enables the Committee to include those benefits it deems appropriate for an Executive Director. On recruitment, this may include benefits such as relocation, housing or schooling expenses. In arriving at a benefits package the Committee’s prevailing consideration will be to pay only what is considered necessary and appropriate taking into account the importance of securing the right candidate for the job and acting in the best interests of the Company’s shareholders and limiting certain benefits to a specified period where possible.
How the views of shareholders and employees are taken into accountThe Committee formally consults directly with employees on executive pay via the Employee Representatives appointed to the Board. In addition, the Committee takes due account of the overall approach to remuneration and the remuneration structures for employees in the Group when setting pay for the Executive Directors, for example consideration is given to Group-wide increases when determining any Executive Director salary increases. The Committee receives periodic updates from the CEO and Human Resources Director function of the Group which includes employee feedback received on remuneration practices across the Group. The Committee recognises the importance of employee communication and this was a major consideration in the appointment of the Employee Representatives to the Board.
Two of the Company’s major shareholders act as directors on the Board and thus regular consultation on all elements of remuneration is ongoing. In addition, the Committee consulted with other key shareholders and took guidance from shareholder representative bodies on the terms of the remuneration policy and the new LTIP which was brought to shareholders at the 2018 AGM. The resolutions put to the AGM relating to remuneration all received more than 99% support from voting shareholders. This, plus any feedback received from time to time, as well as guidance from shareholder representative bodies more generally will be considered as part of the Company’s annual review of remuneration policy and implementation of that policy.
Remuneration comparison measurement was considered as part of the Committee’s formulation of policy in terms of considering remuneration data for companies of a comparable size and complexity to the Company. This was only one of many factors considered by the Committee.
On recruitment, the Company may compensate for incentive pay (or benefit arrangements) foregone from a previous employer. Replacement share awards would be made under the Company’s long-term incentive plan and any subsequently adopted share plans using the separate specific limit for these purposes of 250% of salary (face value) or as necessary and as permitted under the Listing Rules. The new awards would take account of the structure of awards being forfeited (cash or shares), quantum foregone, the extent to which performance conditions apply, the likelihood of meeting any existing performance conditions and the time left to vesting.
Policy for Executive Directors on external appointmentsSubject to Board approval, Executive Directors may accept external non-executive positions and retain the fees payable for such appointments.
Non-Executive DirectorsLetters of appointment and policy on recruitmentAll Non-Executive Directors have letters of appointment for a fixed period of three years, subject to reappointment each year at the AGM. No additional compensation is payable on termination, with fees being payable to the date of termination. The appointments are terminable by either party on three months’ written notice.
On appointment of a new Non-Executive Director, the fee arrangement will be set in accordance with the approved remuneration policy in force at that time.
Legacy arrangementsIn approving this Directors’ Remuneration Policy, authority is given to the Company to honour any commitments entered in to with Directors, which were fully disclosed in the Admission document. Details of any such payments will be set out in the Annual Report on Remuneration as they arise.
Directors’ Remuneration Policycontinued
R H I M A G N E S I TAG O V E R N A N C E
9 0

The Committee has taken note of the views of the Executive Directors with regard to the amount and structure of their remuneration and the provisions of 3.1.2 of the Dutch Corporate Governance Code (matters that should be taken into consideration when formulating the remuneration policy) have been brought to their attention.
How the Executive Directors’ Remuneration Policy relates to the wider GroupThe policy described above applies specifically to the Company’s Executive and Non-Executive Directors. The Committee is aware of and provides feedback on the wider Group remuneration structures. The Company’s policy is for the Executive Directors’ remuneration policy and structure to be cascaded as far as practicable to the senior management team and for the overriding principles to be taken into account for the Group-wide policy.
Base salaries for the whole Group are operated under broadly the same policy as for the Executive Directors. The key difference between the Executive Directors’ policy and the wider Group’s policy is that the Executive Directors’ packages (and the senior management team to a lesser extent) are weighted more to variable pay. Performance Share awards are reserved for those identified as having the greatest potential to influence Group level performance which, given the cost of operating such a plan, the Committee considers is the right approach and in the best interests of the Company and its shareholders.
Remuneration scenarios for Executive DirectorsThe Executive Director remuneration policy provides that a significant proportion of remuneration is determined by Group performance. The graph below illustrates how the total pay opportunities vary under three different performance scenarios: minimum, target and maximum. We have also shown an assumed share price appreciation of 50% for the Performance Share award during the performance period under the maximum payment scenario.
AssumptionsMinimum: Fixed pay only (base salary, pension and benefits). Target: Fixed pay plus 50% of 2019 maximum annual bonus opportunity for the CEO and CFO with 50% vesting of the 2019 PS award. Maximum: Fixed pay plus maximum annual bonus opportunity and 100% vesting of 2019 PS award with an assumed share price appreciation of 50% for the Performance Share award during the performance period.
As required under the Dutch Corporate Code, scenario analyses have been carried out as part of the formulation of the policy and to establish that the policy results in appropriate and fair levels of remuneration including that the level and ratio of fixed to variable pay does not encourage inappropriate risk taking or over-reliance on variable pay while ensuring there is sufficient alignment to investors and the long-term performance of the Company and development of the market value of the shares of the Company.
Pay ratiosThe Dutch Corporate Governance Code recommends that from the financial year 2018, and the UK Directors’ Reporting Regulations require that from 2019, that the Committee report pay ratios including changes from the prior year as part of its determination of executive pay. Last year RHI Magnesita reported the pay ratio of the CEO to the average salary of all the employees using a methodology which was in line with Dutch market practice. The ratio was calculated using the CEO’s Single Total Figure of remuneration shown on page 94 and the total employee remuneration figure (for the entire RHI Magnesita Group) shown in the accounts on page 99. The total employee remuneration figure is for all employees in all Group companies and includes countries with significantly lower levels of pay than Europe and the United States. RHI Magnesita only has around 104 employees in the UK and falls below the required threshold for UK pay ratio reporting requirements. As UK employees represent less than 1% of RHI Magnesita’s employees, the Committee considers that the above approach is appropriate in the circumstances and therefore the ratio has been calculated on the same basis this year, as shown below.
2018 2017*
CEO pay ratio 52 : 1 50 : 1
* As RHI Magnesita was admitted to trading on 27 October 2017, the 2017 CEO pay ratio is based on the period 27 October to 31 December 2017
New CFO1
€000CEO€000
Minimum
Target
Maximum
€1,011
€2,507
€3,576
100%
36% 24% 12%
100% 26% 34%
100%
Long-term incentives
Share price appreciation 50%
Annual bonusFixed pay
Minimum
Target
Maximum
€581
Long-term incentives
€1,767
€2,081
Share price appreciation 50%
Annual bonusFixed pay
100%
30% 31% 15%
100% 25% 42%
100%
1 This reflects annual remuneration of the new CFO joining the business on 1 April 2019
A N N U A L R E P O R T 2 0 1 8R H I M A G N E S I TA
9 1

As a Dutch incorporated and registered and UK listed company RHI Magnesita is required to comply with both UK and Dutch reporting requirements including the UK and Dutch Corporate Governance Codes.
The following section provides details of how the Company’s Directors were paid during the financial year to 31 December 2018.
Remuneration Committee membershipCelia Baxter is the Chairman of the Committee and James Leng and Karl Sevelda members of the Committee. They are all Independent Non-Executive Directors within the meaning of the UK and Dutch Corporate Governance Codes. The Company Secretary is the Secretary to the Committee.
Other individuals, such as the Chief Executive Officer, the Human Resources Director and external professional advisers may be invited to attend for all or part of any meeting as and when appropriate and necessary. No individual is present when their own remuneration is discussed.
The Committee meets at least three times a year and at such other times as the Chairman of the Committee shall require or as the Board may direct. The Committee has formal terms of reference that can be viewed on the Company’s website.
AdvisersKorn Ferry Hay Group (“KF”), signatories to the UK Remuneration Consultants Group’s Code of Conduct (Code of Conduct), were appointed by the Committee in 2017 having submitted a proposal which demonstrated their skills and experience in executive remuneration. KF provides advice to the Committee on matters relating to executive remuneration.
In 2018 KF also provided executive search services to the Company. The Committee was satisfied that the advice provided by KF was objective and independent having noted their commitment to the Code of Conduct. KF’s fees in respect of the 2018 financial year were £109,597 KF’s fees were charged on the basis of the firm’s standard terms of business for advice provided. Linklaters drafted the LTIP Rules and their fees in respect of the 2018 financial year were £33,600. Linklaters also provided general legal advice to the Company.
The Board has also determined to provide certain additional voluntary disclosures recognising the importance of transparency of reporting. This Annual Report is compiled on this basis.
The remuneration arrangements for the Executive Directors contribute to long-term value creation:
¥ By providing a fair and appropriate level of fixed remuneration that does not result in over-reliance on variable pay and undue risk taking, thereby encouraging the executives to focus on sustained long-term value creation.
¥ By providing a balance of short- and long-term incentives to ensure there is focus on short term objectives that will over time build to create long-term value creation as well as long-term goals.
¥ By requiring executives to acquire and retain shares in the Company.
¥ By offering long-term incentives where the reward is delivered in shares which aligns executives to shareholder interests and value as well as the performance of the Company over the longer term.
¥ By requiring performance measures in our long-term incentive to be measured over the longer term and for shares to be held post vesting for a further two year period.
¥ By incorporating metrics focused on long-term shareholder value, such as total shareholder return.
A scenario analysis has been carried out as part of the formulation and implementation of the policy and is referred to in more detail in the policy section of this report. The Committee typically reviews, on at least an annual basis, the impact of different performance scenarios on the potential opportunity and payouts to be received by Executive Directors and the alignment of these with the returns that might be received by shareholders.
The pay ratio of the CEO to the average employee within the Company is provided on page 91 of the policy section of this report.
Annual Report on Remuneration
R H I M A G N E S I TAG O V E R N A N C E
9 2
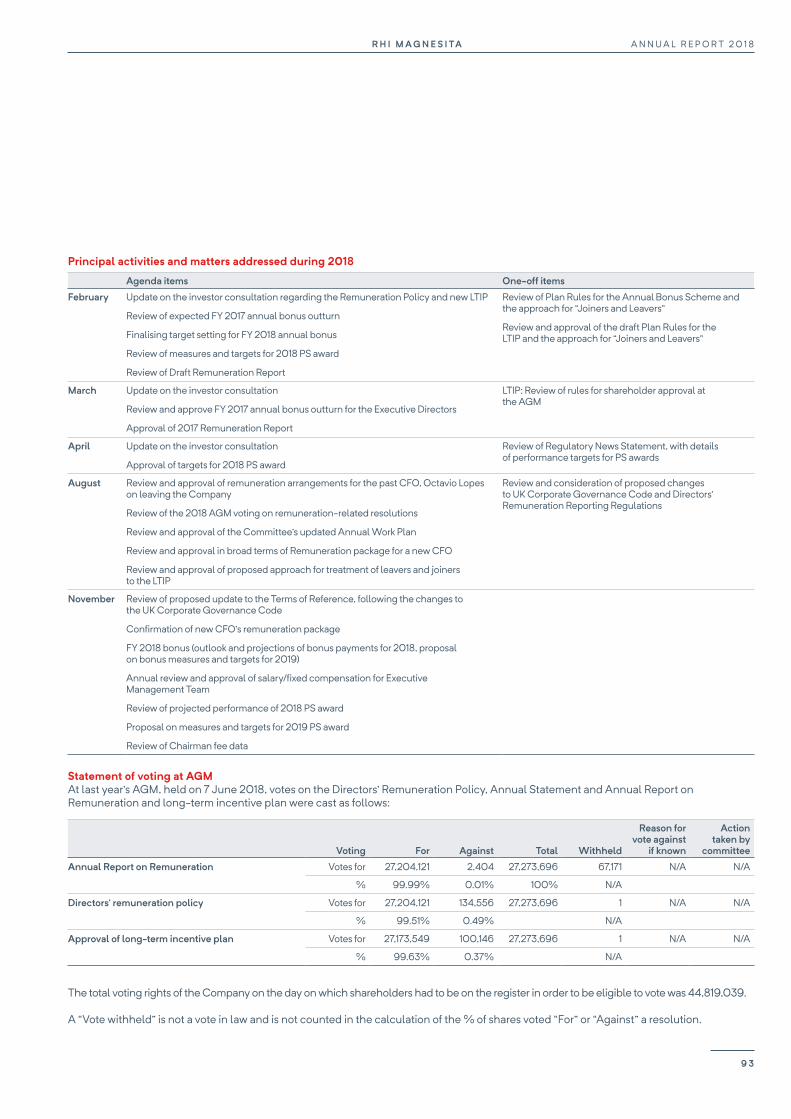
Principal activities and matters addressed during 2018
Agenda items One-off items
February Update on the investor consultation regarding the Remuneration Policy and new LTIP
Review of expected FY 2017 annual bonus outturn
Finalising target setting for FY 2018 annual bonus
Review of measures and targets for 2018 PS award
Review of Draft Remuneration Report
Review of Plan Rules for the Annual Bonus Scheme and the approach for “Joiners and Leavers”
Review and approval of the draft Plan Rules for the LTIP and the approach for “Joiners and Leavers”
March Update on the investor consultation
Review and approve FY 2017 annual bonus outturn for the Executive Directors
Approval of 2017 Remuneration Report
LTIP: Review of rules for shareholder approval at the AGM
April Update on the investor consultation
Approval of targets for 2018 PS award
Review of Regulatory News Statement, with details of performance targets for PS awards
August Review and approval of remuneration arrangements for the past CFO, Octavio Lopes on leaving the Company
Review of the 2018 AGM voting on remuneration-related resolutions
Review and approval of the Committee’s updated Annual Work Plan
Review and approval in broad terms of Remuneration package for a new CFO
Review and approval of proposed approach for treatment of leavers and joiners to the LTIP
Review and consideration of proposed changes to UK Corporate Governance Code and Directors’ Remuneration Reporting Regulations
November Review of proposed update to the Terms of Reference, following the changes to the UK Corporate Governance Code
Confirmation of new CFO’s remuneration package
FY 2018 bonus (outlook and projections of bonus payments for 2018, proposal on bonus measures and targets for 2019)
Annual review and approval of salary/fixed compensation for Executive Management Team
Review of projected performance of 2018 PS award
Proposal on measures and targets for 2019 PS award
Review of Chairman fee data
Statement of voting at AGMAt last year’s AGM, held on 7 June 2018, votes on the Directors’ Remuneration Policy, Annual Statement and Annual Report on Remuneration and long-term incentive plan were cast as follows:
Voting For Against Total Withheld
Reason for vote against
if known
Action taken by
committee
Annual Report on Remuneration Votes for 27,204,121 2,404 27,273,696 67,171 N/A N/A
% 99.99% 0.01% 100% N/A
Directors’ remuneration policy Votes for 27,204,121 134,556 27,273,696 1 N/A N/A
% 99.51% 0.49% N/A
Approval of long-term incentive plan Votes for 27,173,549 100,146 27,273,696 1 N/A N/A
% 99.63% 0.37% N/A
The total voting rights of the Company on the day on which shareholders had to be on the register in order to be eligible to vote was 44,819,039.
A “Vote withheld” is not a vote in law and is not counted in the calculation of the % of shares voted “For” or “Against” a resolution.
A N N U A L R E P O R T 2 0 1 8R H I M A G N E S I TA
9 3
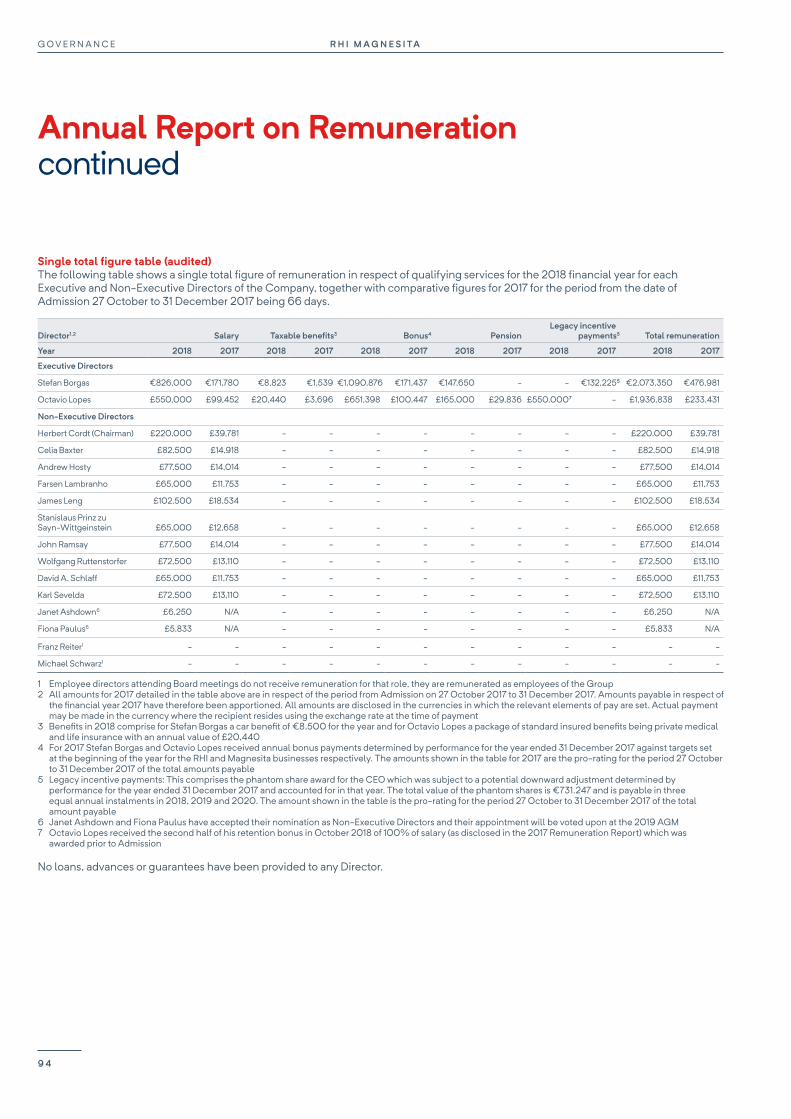
Single total figure table (audited)The following table shows a single total figure of remuneration in respect of qualifying services for the 2018 financial year for each Executive and Non-Executive Directors of the Company, together with comparative figures for 2017 for the period from the date of Admission 27 October to 31 December 2017 being 66 days.
Director1,2 Salary Taxable benefits3 Bonus4 PensionLegacy incentive
payments5 Total remuneration
Year 2018 2017 2018 2017 2018 2017 2018 2017 2018 2017 2018 2017
Executive Directors
Stefan Borgas €826,000 €171,780 €8,823 €1,539 €1,090,876 €171,437 €147,650 - - €132,2255 €2,073,350 €476,981
Octavio Lopes £550,000 £99,452 £20,440 £3,696 £651,398 £100,447 £165,000 £29,836 £550,0007 - £1,936,838 £233,431
Non-Executive Directors
Herbert Cordt (Chairman) £220,000 £39,781 - - - - - - - - £220,000 £39,781
Celia Baxter £82,500 £14,918 - - - - - - - - £82,500 £14,918
Andrew Hosty £77,500 £14,014 - - - - - - - - £77,500 £14,014
Farsen Lambranho £65,000 £11,753 - - - - - - - - £65,000 £11,753
James Leng £102,500 £18,534 - - - - - - - - £102,500 £18,534
Stanislaus Prinz zu Sayn-Wittgeinstein £65,000 £12,658 - - - - - - - - £65,000 £12,658
John Ramsay £77,500 £14,014 - - - - - - - - £77,500 £14,014
Wolfgang Ruttenstorfer £72,500 £13,110 - - - - - - - - £72,500 £13,110
David A. Schlaff £65,000 £11,753 - - - - - - - - £65,000 £11,753
Karl Sevelda £72,500 £13,110 - - - - - - - - £72,500 £13,110
Janet Ashdown6 £6,250 N/A - - - - - - - - £6,250 N/A
Fiona Paulus6 £5,833 N/A - - - - - - - - £5,833 N/A
Franz Reiter1 - - - - - - - - - - - -
Michael Schwarz1 - - - - - - - - - - - -
1 Employee directors attending Board meetings do not receive remuneration for that role, they are remunerated as employees of the Group2 All amounts for 2017 detailed in the table above are in respect of the period from Admission on 27 October 2017 to 31 December 2017. Amounts payable in respect of
the financial year 2017 have therefore been apportioned. All amounts are disclosed in the currencies in which the relevant elements of pay are set. Actual payment may be made in the currency where the recipient resides using the exchange rate at the time of payment
3 Benefits in 2018 comprise for Stefan Borgas a car benefit of €8,500 for the year and for Octavio Lopes a package of standard insured benefits being private medical and life insurance with an annual value of £20,440
4 For 2017 Stefan Borgas and Octavio Lopes received annual bonus payments determined by performance for the year ended 31 December 2017 against targets set at the beginning of the year for the RHI and Magnesita businesses respectively. The amounts shown in the table for 2017 are the pro-rating for the period 27 October to 31 December 2017 of the total amounts payable
5 Legacy incentive payments: This comprises the phantom share award for the CEO which was subject to a potential downward adjustment determined by performance for the year ended 31 December 2017 and accounted for in that year. The total value of the phantom shares is €731.247 and is payable in three equal annual instalments in 2018, 2019 and 2020. The amount shown in the table is the pro-rating for the period 27 October to 31 December 2017 of the total amount payable
6 Janet Ashdown and Fiona Paulus have accepted their nomination as Non-Executive Directors and their appointment will be voted upon at the 2019 AGM7 Octavio Lopes received the second half of his retention bonus in October 2018 of 100% of salary (as disclosed in the 2017 Remuneration Report) which was
awarded prior to Admission
No loans, advances or guarantees have been provided to any Director.
Annual Report on Remunerationcontinued
R H I M A G N E S I TAG O V E R N A N C E
9 4
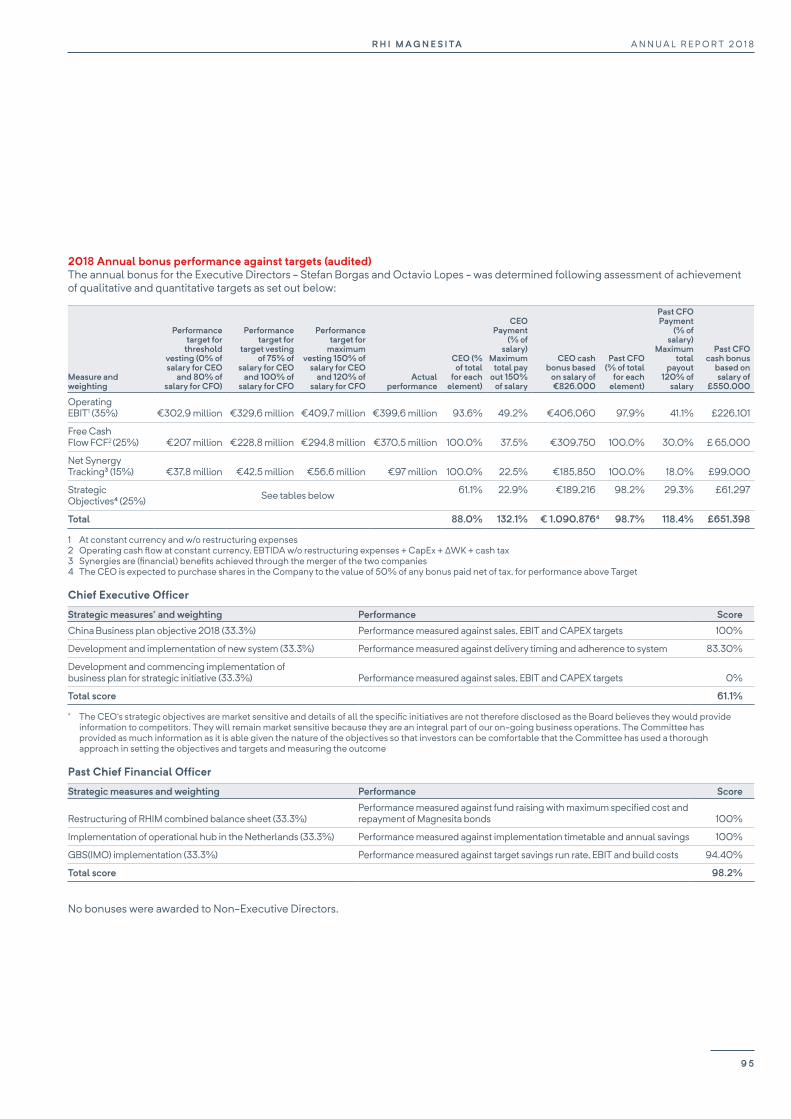
2018 Annual bonus performance against targets (audited)The annual bonus for the Executive Directors - Stefan Borgas and Octavio Lopes - was determined following assessment of achievement of qualitative and quantitative targets as set out below:
Measure and weighting
Performance target for
threshold vesting (0% of salary for CEO
and 80% of salary for CFO)
Performance target for
target vesting of 75% of
salary for CEO and 100% of
salary for CFO
Performance target for
maximum vesting 150% of
salary for CEO and 120% of
salary for CFOActual
performance
CEO (% of total
for each element)
CEO Payment
(% of salary)
Maximum total pay
out 150% of salary
CEO cash bonus based
on salary of €826.000
Past CFO (% of total
for each element)
Past CFO Payment
(% of salary)
Maximum total
payout 120% of
salary
Past CFO cash bonus
based on salary of
£550.000
Operating EBIT1 (35%) €302,9 million €329,6 million €409,7 million €399,6 million 93.6% 49.2% €406,060 97.9% 41.1% £226,101
Free Cash Flow FCF2 (25%) €207 million €228,8 million €294,8 million €370,5 million 100.0% 37.5% €309,750 100.0% 30.0% £ 65,000
Net Synergy Tracking3 (15%) €37,8 million €42,5 million €56,6 million €97 million 100.0% 22.5% €185,850 100.0% 18.0% £99,000
Strategic Objectives4 (25%) See tables below 61.1% 22.9% €189,216 98.2% 29.3% £61,297
Total 88.0% 132.1% € 1,090,8764 98.7% 118.4% £651,398
1 At constant currency and w/o restructuring expenses2 Operating cash flow at constant currency. EBTIDA w/o restructuring expenses + CapEx + ΔWK + cash tax3 Synergies are (financial) benefits achieved through the merger of the two companies4 The CEO is expected to purchase shares in the Company to the value of 50% of any bonus paid net of tax, for performance above Target
Chief Executive Officer
Strategic measures* and weighting Performance Score
China Business plan objective 2018 (33.3%) Performance measured against sales, EBIT and CAPEX targets 100%
Development and implementation of new system (33.3%) Performance measured against delivery timing and adherence to system 83.30%
Development and commencing implementation of business plan for strategic initiative (33.3%) Performance measured against sales, EBIT and CAPEX targets 0%
Total score 61.1%
* The CEO’s strategic objectives are market sensitive and details of all the specific initiatives are not therefore disclosed as the Board believes they would provide information to competitors. They will remain market sensitive because they are an integral part of our on-going business operations. The Committee has provided as much information as it is able given the nature of the objectives so that investors can be comfortable that the Committee has used a thorough approach in setting the objectives and targets and measuring the outcome
Past Chief Financial Officer
Strategic measures and weighting Performance Score
Restructuring of RHIM combined balance sheet (33.3%)Performance measured against fund raising with maximum specified cost and repayment of Magnesita bonds 100%
Implementation of operational hub in the Netherlands (33.3%) Performance measured against implementation timetable and annual savings 100%
GBS(IMO) implementation (33.3%) Performance measured against target savings run rate, EBIT and build costs 94.40%
Total score 98.2%
No bonuses were awarded to Non-Executive Directors.
A N N U A L R E P O R T 2 0 1 8R H I M A G N E S I TA
9 5
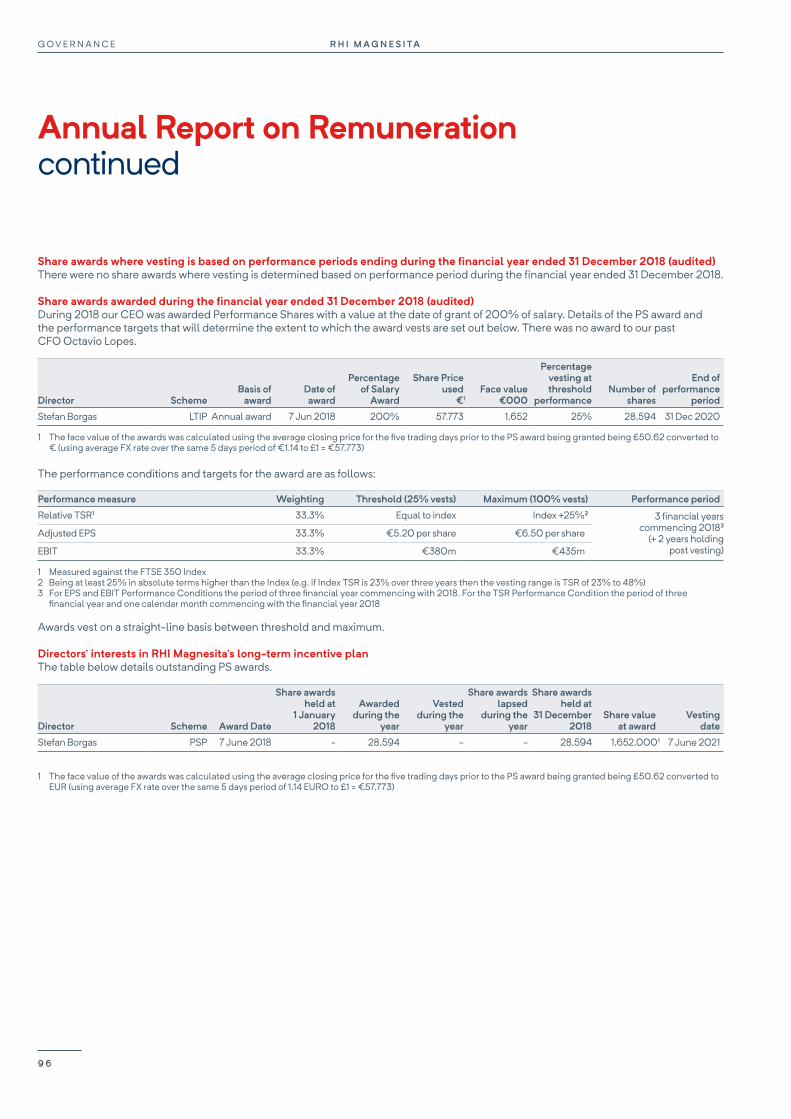
Share awards where vesting is based on performance periods ending during the financial year ended 31 December 2018 (audited)There were no share awards where vesting is determined based on performance period during the financial year ended 31 December 2018.
Share awards awarded during the financial year ended 31 December 2018 (audited)During 2018 our CEO was awarded Performance Shares with a value at the date of grant of 200% of salary. Details of the PS award and the performance targets that will determine the extent to which the award vests are set out below. There was no award to our past CFO Octavio Lopes.
Director SchemeBasis of
awardDate of award
Percentage of Salary
Award
Share Priceused
€1Face value
€000
Percentage vesting at threshold
performanceNumber of
shares
End of performance
period
Stefan Borgas LTIP Annual award 7 Jun 2018 200% 57.773 1,652 25% 28,594 31 Dec 2020
1 The face value of the awards was calculated using the average closing price for the five trading days prior to the PS award being granted being £50.62 converted to € (using average FX rate over the same 5 days period of €1.14 to £1 = €57.773)
The performance conditions and targets for the award are as follows:
Performance measure Weighting Threshold (25% vests) Maximum (100% vests) Performance period
Relative TSR1 33.3% Equal to index Index +25%2 3 financial years commencing 20183
(+ 2 years holding post vesting)
Adjusted EPS 33.3% €5.20 per share €6.50 per share
EBIT 33.3% €380m €435m
1 Measured against the FTSE 350 Index2 Being at least 25% in absolute terms higher than the Index (e.g. if Index TSR is 23% over three years then the vesting range is TSR of 23% to 48%)3 For EPS and EBIT Performance Conditions the period of three financial year commencing with 2018. For the TSR Performance Condition the period of three
financial year and one calendar month commencing with the financial year 2018
Awards vest on a straight-line basis between threshold and maximum.
Directors’ interests in RHI Magnesita’s long-term incentive planThe table below details outstanding PS awards.
Director Scheme Award Date
Share awards held at
1 January 2018
Awarded during the
year
Vested during the
year
Share awards lapsed
during the year
Share awards held at
31 December 2018
Share value at award
Vestingdate
Stefan Borgas PSP 7 June 2018 - 28,594 - - 28,594 1,652,0001 7 June 2021
1 The face value of the awards was calculated using the average closing price for the five trading days prior to the PS award being granted being £50.62 converted to EUR (using average FX rate over the same 5 days period of 1.14 EURO to £1 = €57.773)
Annual Report on Remunerationcontinued
R H I M A G N E S I TAG O V E R N A N C E
9 6
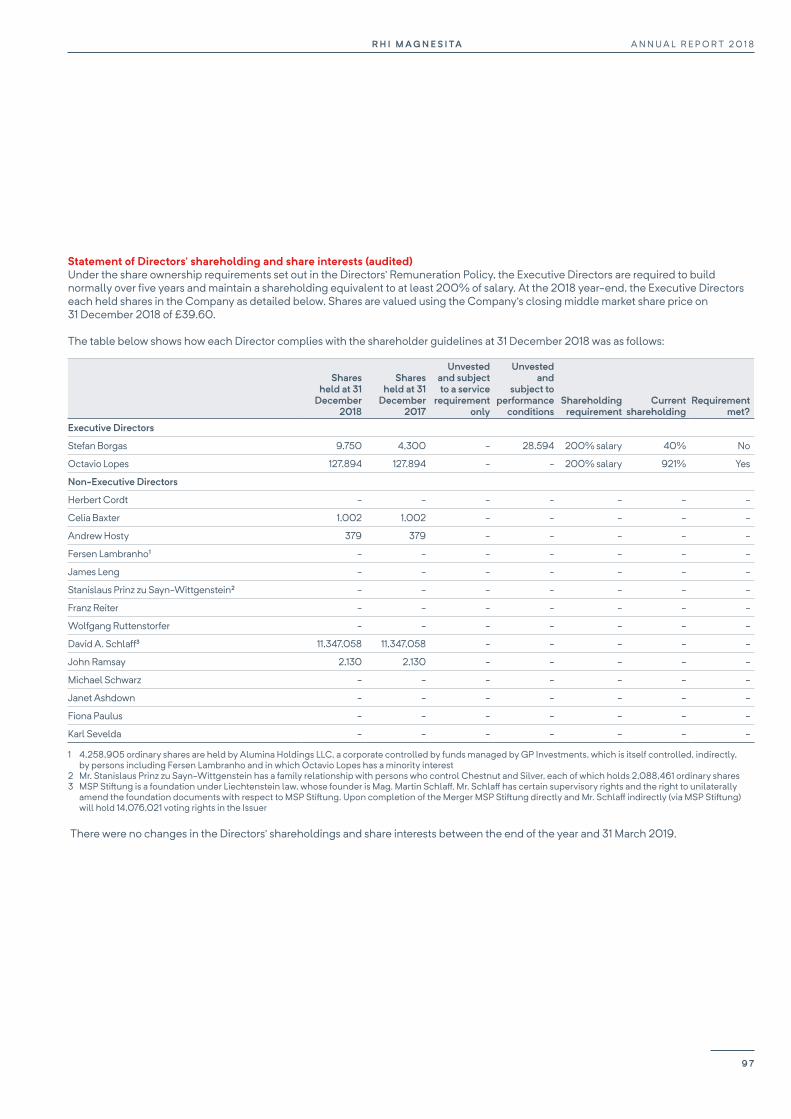
Statement of Directors’ shareholding and share interests (audited)Under the share ownership requirements set out in the Directors’ Remuneration Policy, the Executive Directors are required to build normally over five years and maintain a shareholding equivalent to at least 200% of salary. At the 2018 year-end, the Executive Directors each held shares in the Company as detailed below. Shares are valued using the Company’s closing middle market share price on 31 December 2018 of £39.60.
The table below shows how each Director complies with the shareholder guidelines at 31 December 2018 was as follows:
Shares held at 31
December 2018
Shares held at 31
December 2017
Unvested and subject to a service
requirement only
Unvested and
subject to performance
conditionsShareholding
requirementCurrent
shareholdingRequirement
met?
Executive Directors
Stefan Borgas 9,750 4,300 - 28,594 200% salary 40% No
Octavio Lopes 127,894 127,894 - - 200% salary 921% Yes
Non-Executive Directors
Herbert Cordt - - - - - - -
Celia Baxter 1,002 1,002 - - - - -
Andrew Hosty 379 379 - - - - -
Fersen Lambranho1 - - - - - - -
James Leng - - - - - - -
Stanislaus Prinz zu Sayn-Wittgenstein2 - - - - - - -
Franz Reiter - - - - - - -
Wolfgang Ruttenstorfer - - - - - - -
David A. Schlaff3 11,347,058 11,347,058 - - - - -
John Ramsay 2,130 2,130 - - - - -
Michael Schwarz - - - - - - -
Janet Ashdown - - - - - - -
Fiona Paulus - - - - - - -
Karl Sevelda - - - - - - -
1 4,258,905 ordinary shares are held by Alumina Holdings LLC, a corporate controlled by funds managed by GP Investments, which is itself controlled, indirectly, by persons including Fersen Lambranho and in which Octavio Lopes has a minority interest
2 Mr. Stanislaus Prinz zu Sayn-Wittgenstein has a family relationship with persons who control Chestnut and Silver, each of which holds 2,088,461 ordinary shares3 MSP Stiftung is a foundation under Liechtenstein law, whose founder is Mag. Martin Schlaff. Mr. Schlaff has certain supervisory rights and the right to unilaterally
amend the foundation documents with respect to MSP Stiftung. Upon completion of the Merger MSP Stiftung directly and Mr. Schlaff indirectly (via MSP Stiftung) will hold 14,076,021 voting rights in the Issuer
There were no changes in the Directors’ shareholdings and share interests between the end of the year and 31 March 2019.
A N N U A L R E P O R T 2 0 1 8R H I M A G N E S I TA
9 7
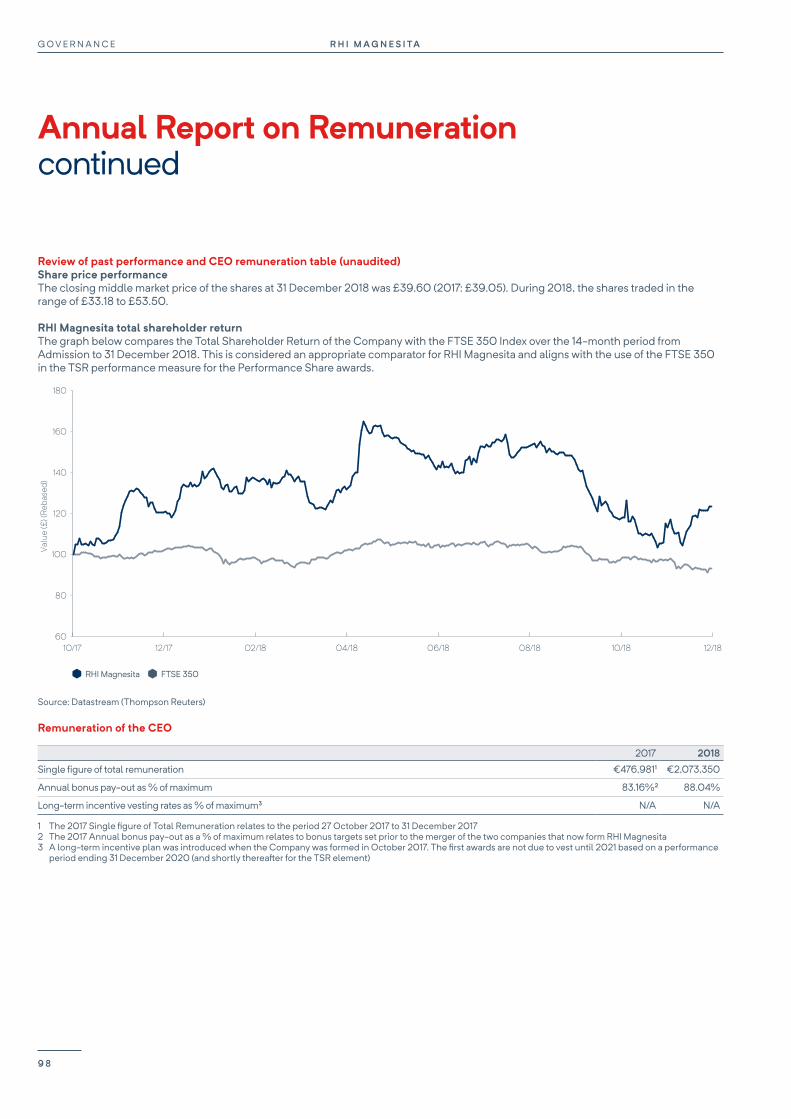
Review of past performance and CEO remuneration table (unaudited)Share price performanceThe closing middle market price of the shares at 31 December 2018 was £39.60 (2017: £39.05). During 2018, the shares traded in the range of £33.18 to £53.50.
RHI Magnesita total shareholder returnThe graph below compares the Total Shareholder Return of the Company with the FTSE 350 Index over the 14-month period from Admission to 31 December 2018. This is considered an appropriate comparator for RHI Magnesita and aligns with the use of the FTSE 350 in the TSR performance measure for the Performance Share awards.
RHI Magnesita FTSE 350
12/1808/18 10/1806/1804/1802/1812/1710/1760
80
100
120
140
160
180
Valu
e (£
) (Re
base
d)
Source: Datastream (Thompson Reuters)
Remuneration of the CEO
2017 2018
Single figure of total remuneration €476,9811 €2,073,350
Annual bonus pay-out as % of maximum 83.16%2 88.04%
Long-term incentive vesting rates as % of maximum3 N/A N/A
1 The 2017 Single figure of Total Remuneration relates to the period 27 October 2017 to 31 December 20172 The 2017 Annual bonus pay-out as a % of maximum relates to bonus targets set prior to the merger of the two companies that now form RHI Magnesita3 A long-term incentive plan was introduced when the Company was formed in October 2017. The first awards are not due to vest until 2021 based on a performance
period ending 31 December 2020 (and shortly thereafter for the TSR element)
Annual Report on Remunerationcontinued
R H I M A G N E S I TAG O V E R N A N C E
9 8
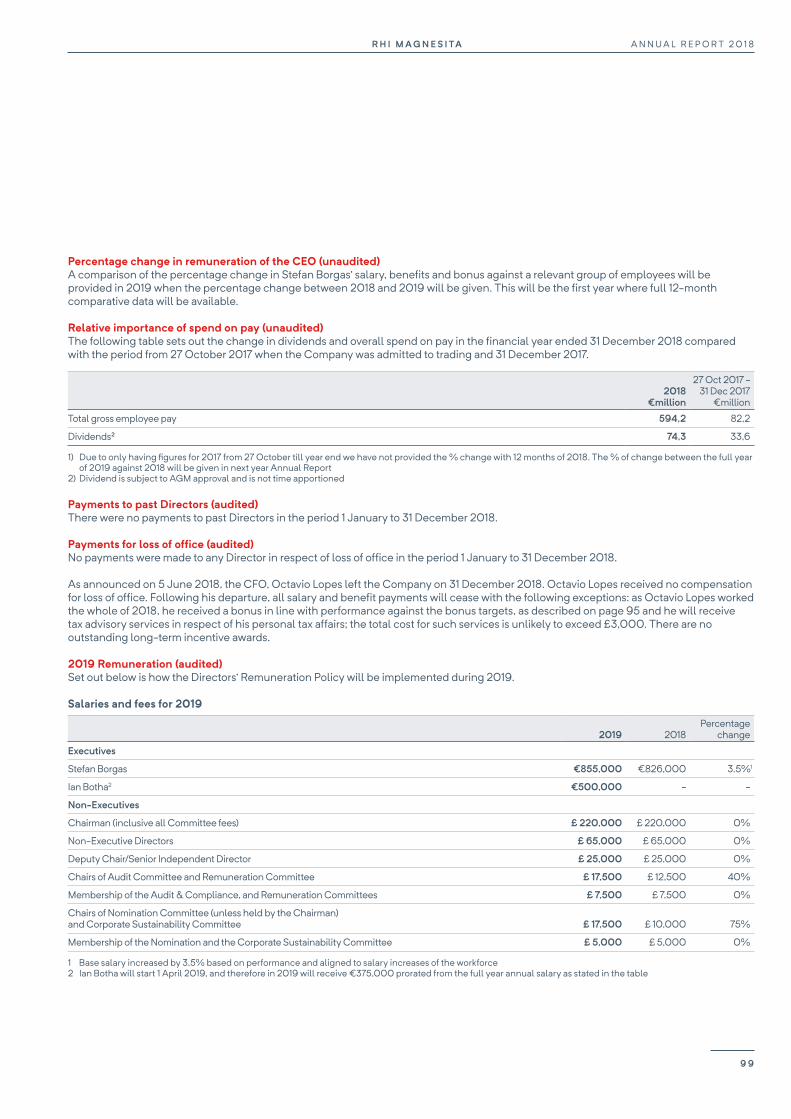
Percentage change in remuneration of the CEO (unaudited)A comparison of the percentage change in Stefan Borgas’ salary, benefits and bonus against a relevant group of employees will be provided in 2019 when the percentage change between 2018 and 2019 will be given. This will be the first year where full 12-month comparative data will be available.
Relative importance of spend on pay (unaudited)The following table sets out the change in dividends and overall spend on pay in the financial year ended 31 December 2018 compared with the period from 27 October 2017 when the Company was admitted to trading and 31 December 2017.
2018€million
27 Oct 2017 - 31 Dec 2017
€million
Total gross employee pay 594,2 82,2
Dividends2 74,3 33,6
1) Due to only having figures for 2017 from 27 October till year end we have not provided the % change with 12 months of 2018. The % of change between the full year of 2019 against 2018 will be given in next year Annual Report
2) Dividend is subject to AGM approval and is not time apportioned
Payments to past Directors (audited)There were no payments to past Directors in the period 1 January to 31 December 2018.
Payments for loss of office (audited)No payments were made to any Director in respect of loss of office in the period 1 January to 31 December 2018.
As announced on 5 June 2018, the CFO, Octavio Lopes left the Company on 31 December 2018. Octavio Lopes received no compensation for loss of office. Following his departure, all salary and benefit payments will cease with the following exceptions: as Octavio Lopes worked the whole of 2018, he received a bonus in line with performance against the bonus targets, as described on page 95 and he will receive tax advisory services in respect of his personal tax affairs; the total cost for such services is unlikely to exceed £3,000. There are no outstanding long-term incentive awards.
2019 Remuneration (audited)Set out below is how the Directors’ Remuneration Policy will be implemented during 2019.
Salaries and fees for 2019
2019 2018Percentage
change
Executives
Stefan Borgas €855,000 €826,000 3.5%1
Ian Botha2 €500,000 - -
Non-Executives
Chairman (inclusive all Committee fees) £ 220,000 £ 220,000 0%
Non-Executive Directors £ 65,000 £ 65,000 0%
Deputy Chair/Senior Independent Director £ 25,000 £ 25,000 0%
Chairs of Audit Committee and Remuneration Committee £ 17,500 £ 12,500 40%
Membership of the Audit & Compliance, and Remuneration Committees £ 7,500 £ 7,500 0%
Chairs of Nomination Committee (unless held by the Chairman) and Corporate Sustainability Committee £ 17,500 £ 10,000 75%
Membership of the Nomination and the Corporate Sustainability Committee £ 5,000 £ 5,000 0%
1 Base salary increased by 3,5% based on performance and aligned to salary increases of the workforce2 Ian Botha will start 1 April 2019, and therefore in 2019 will receive €375,000 prorated from the full year annual salary as stated in the table
A N N U A L R E P O R T 2 0 1 8R H I M A G N E S I TA
9 9
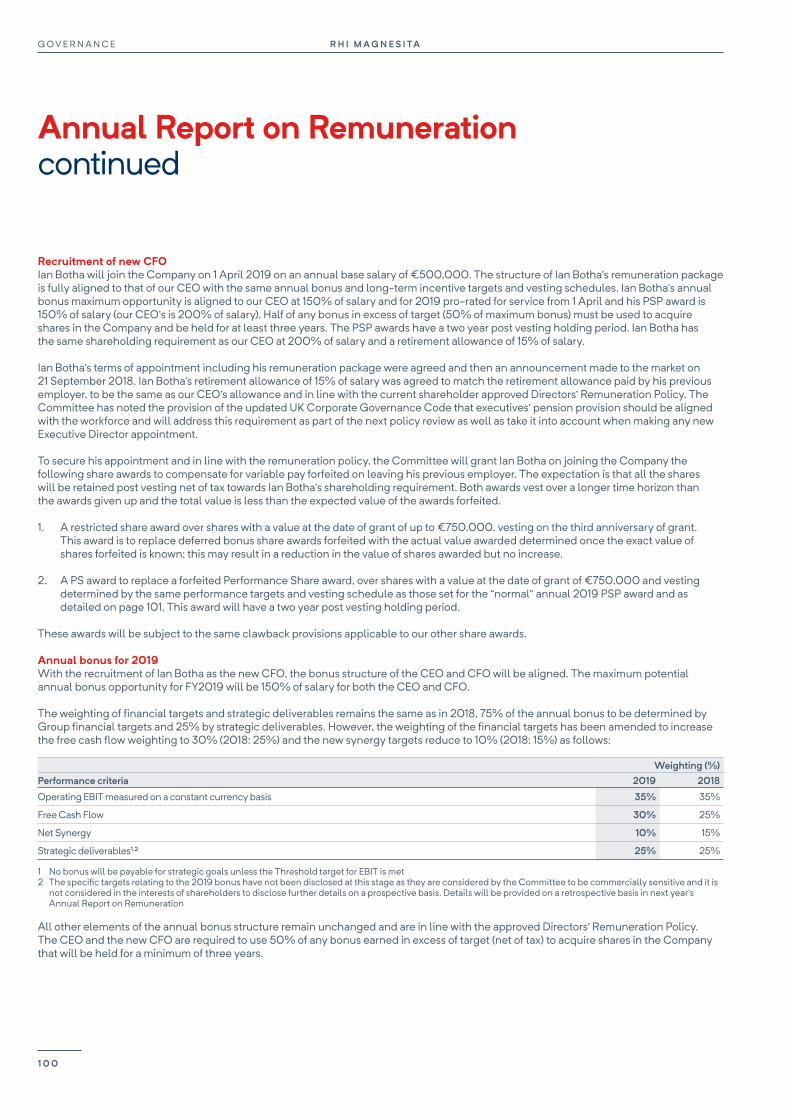
Recruitment of new CFOIan Botha will join the Company on 1 April 2019 on an annual base salary of €500,000. The structure of Ian Botha’s remuneration package is fully aligned to that of our CEO with the same annual bonus and long-term incentive targets and vesting schedules. Ian Botha’s annual bonus maximum opportunity is aligned to our CEO at 150% of salary and for 2019 pro-rated for service from 1 April and his PSP award is 150% of salary (our CEO’s is 200% of salary). Half of any bonus in excess of target (50% of maximum bonus) must be used to acquire shares in the Company and be held for at least three years. The PSP awards have a two year post vesting holding period. Ian Botha has the same shareholding requirement as our CEO at 200% of salary and a retirement allowance of 15% of salary.
Ian Botha’s terms of appointment including his remuneration package were agreed and then an announcement made to the market on 21 September 2018. Ian Botha’s retirement allowance of 15% of salary was agreed to match the retirement allowance paid by his previous employer, to be the same as our CEO’s allowance and in line with the current shareholder approved Directors’ Remuneration Policy. The Committee has noted the provision of the updated UK Corporate Governance Code that executives’ pension provision should be aligned with the workforce and will address this requirement as part of the next policy review as well as take it into account when making any new Executive Director appointment.
To secure his appointment and in line with the remuneration policy, the Committee will grant Ian Botha on joining the Company the following share awards to compensate for variable pay forfeited on leaving his previous employer. The expectation is that all the shares will be retained post vesting net of tax towards Ian Botha’s shareholding requirement. Both awards vest over a longer time horizon than the awards given up and the total value is less than the expected value of the awards forfeited.
1. A restricted share award over shares with a value at the date of grant of up to €750,000, vesting on the third anniversary of grant. This award is to replace deferred bonus share awards forfeited with the actual value awarded determined once the exact value of shares forfeited is known; this may result in a reduction in the value of shares awarded but no increase.
2. A PS award to replace a forfeited Performance Share award, over shares with a value at the date of grant of €750,000 and vesting determined by the same performance targets and vesting schedule as those set for the “normal” annual 2019 PSP award and as detailed on page 101. This award will have a two year post vesting holding period.
These awards will be subject to the same clawback provisions applicable to our other share awards.
Annual bonus for 2019With the recruitment of Ian Botha as the new CFO, the bonus structure of the CEO and CFO will be aligned. The maximum potential annual bonus opportunity for FY2019 will be 150% of salary for both the CEO and CFO.
The weighting of financial targets and strategic deliverables remains the same as in 2018, 75% of the annual bonus to be determined by Group financial targets and 25% by strategic deliverables. However, the weighting of the financial targets has been amended to increase the free cash flow weighting to 30% (2018: 25%) and the new synergy targets reduce to 10% (2018: 15%) as follows:
Weighting (%)Performance criteria 2019 2018
Operating EBIT measured on a constant currency basis 35% 35%
Free Cash Flow 30% 25%
Net Synergy 10% 15%
Strategic deliverables1,2 25% 25%
1 No bonus will be payable for strategic goals unless the Threshold target for EBIT is met2 The specific targets relating to the 2019 bonus have not been disclosed at this stage as they are considered by the Committee to be commercially sensitive and it is
not considered in the interests of shareholders to disclose further details on a prospective basis. Details will be provided on a retrospective basis in next year’s Annual Report on Remuneration
All other elements of the annual bonus structure remain unchanged and are in line with the approved Directors’ Remuneration Policy. The CEO and the new CFO are required to use 50% of any bonus earned in excess of target (net of tax) to acquire shares in the Company that will be held for a minimum of three years.
Annual Report on Remunerationcontinued
R H I M A G N E S I TAG O V E R N A N C E
1 0 0

2019 LTIP awardsOur CEO will be granted a PS award over shares with a value at grant of 200% and our new CFO 150% of salary. The performance measures and targets for the 2019 awards are set out below.
Our 2018 LTIP awards were subject to relative TSR, adjusted EPS and EBIT targets. For 2019 the Committee has replaced the EBIT metric with Economic Profit Growth. Economic Profit Growth was a key performance indicator (KPI) of the Magnesita business prior to the Combination (of RHI and Magnesita) and has been introduced as a KPI for the combined businesses from 2019 onwards in order to manage and measure the long-term value of the Company. The Committee therefore consider it important to include Economic Profit Growth as one of the performance measures for the 2019 LTIP. The Committee has changed the measurement of TSR from the percentage growth against the FTSE 350 index to reviewing its performance against a relevant group of FTSE 350 companies. This change of measurement is seen to be no less challenging than the previous measurement. Shares resulting from the exercise of a Performance Share award cannot be sold until five years have elapsed from the date of award, other than to pay tax. Awards will be subject to clawback and malus provisions.
Performance measure Weighting Threshold (25% vesting) Maximum (100% vesting) Performance period
Relative TSR1 ranking 33.30% 50th percentile 75th percentile 2019 to 2021
(+ 2 year holding period post vesting)
Adjusted EPS 33.30% €7.8 per share €9.0 per share
Economic profit growth 33.30% €600m €670m
1 Measured against the FTSE 350, excluding sectors with limited direct relevance to RHI Magnesita2 Being at least 25% in absolute terms higher than the Index (e.g. if Index TSR is 23% over three years then the vesting range is TSR of 23% to 48%)
Awards vest on a straight-line basis between threshold and maximum.
Terminology for Performance Share awardsThe RHI Magnesita long-term incentive plan (the Plan) was approved by shareholders at the AGM 2018. After approval Performance Share awards may be granted under the Plan. The grant of an award is when participants are told they will receive shares provided performance targets are met. Participants do not receive shares at the time an award is granted. Performance targets are set at the time the award is granted and measured over a performance period of three financial years. At the end of the performance period the performance targets are tested against performance. An award will vest if the performance targets are met. If the performance targets are only met in part then only part of the award will vest. When the award vests the participant receives shares in the Company. If therefore a participant is granted an award over 100 shares but the performance targets are only met in part and only 50% of the award vests, the participant will receive 50 shares. Once an award vests the Executive Directors must retain the vested shares for a further two years (subject to the sale of sufficient shares to meet any tax payable on vesting).
This Report was reviewed and approved by the Board on 26 March 2019 and signed on its behalf by order of the Board.
CELIA BAXTERCHAIRMAN OF THE REMUNERATION COMMITTEE
A N N U A L R E P O R T 2 0 1 8R H I M A G N E S I TA
1 0 1

R H I M A G N E S I TAF I N A N C I A L S TAT E M E N T S
1 0 2
R H I M A G N E S I TAF I N A N C I A L S TAT E M E N T S
1 0 2
102Financial statements
104 Consolidated Statement of Financial Position
105 Consolidated Statement of Profit and Loss
106 Consolidated Statement of Comprehensive Income
107 Consolidated Statement of Cash Flows
108 Consolidated Statement of Changes in Equity
110 Notes to the Consolidated Financial Statements 2018
195 Independent Auditor’s Report
Other information203 Alternative performance
measures (“APMs”)204 Shareholder information
A N N U A L R E P O R T 2 0 1 8R H I M A G N E S I TA
1 0 3
A N N U A L R E P O R T 2 0 1 8R H I M A G N E S I TA
1 0 3

F I N A N C I A L S TAT E M E N T S R H I M AG N E S I TA
102
in € million Notes 31.12.2018 31.12.20171)
ASSETS
Non-current assets Goodwill (11) 117.4 120.2
Other intangible assets (12) 334.4 373.0
Property, plant and equipment (13) 1,094.8 1,141.7
Investments in joint ventures and associates (14) 21.8 21.4
Other non-current financial assets (15) 18.0 25.1
Other non-current assets (16) 34.3 24.2
Deferred tax assets (17) 171.1 140.1
1,791.8 1,845.7 Current assets Inventories (18) 717.8 654.5
Trade and other current receivables (19) 481.2 522.6
Income tax receivables (20) 18.4 13.5
Other current financial assets (21) 38.6 34.1
Cash and cash equivalents (22) 491.2 442.4
1,747.2 1,667.1 3,539.0 3,512.8
EQUITY AND LIABILITIES
Equity Share capital (23) 48.3 44.8
Group reserves (24) 752.2 574.0
Equity attributable to shareholders of RHI Magnesita N.V. 800.5 618.8
Non-controlling interests (25) 84.8 226.9
885.3 845.7 Non-current liabilities Borrowings (26) 844.8 983.8
Other non-current financial liabilities (27) 49.5 55.5
Deferred tax liabilities (17) 78.4 64.7
Provisions for pensions (28) 304.3 308.7
Other personnel provisions (29) 78.5 82.5
Other non-current provisions (30) 109.2 115.7
Other non-current liabilities (31) 10.3 9.0
1,475.0 1,619.9 Current liabilities Borrowings (26) 321.6 241.8
Other current financial liabilities (27) 15.0 17.4
Trade payables and other current liabilities (32) 756.9 678.2
Income tax liabilities (33) 32.2 16.1
Current provisions (34) 53.0 93.7
1,178.7 1,047.2 3,539.0 3,512.8
1 Adjusted to reflect the effects of the final purchase price allocation of Magnesita.
Consolidated Statement of Financial Position as of 31.12.2018
R H I M A G N E S I TAF I N A N C I A L S TAT E M E N T S
1 0 4
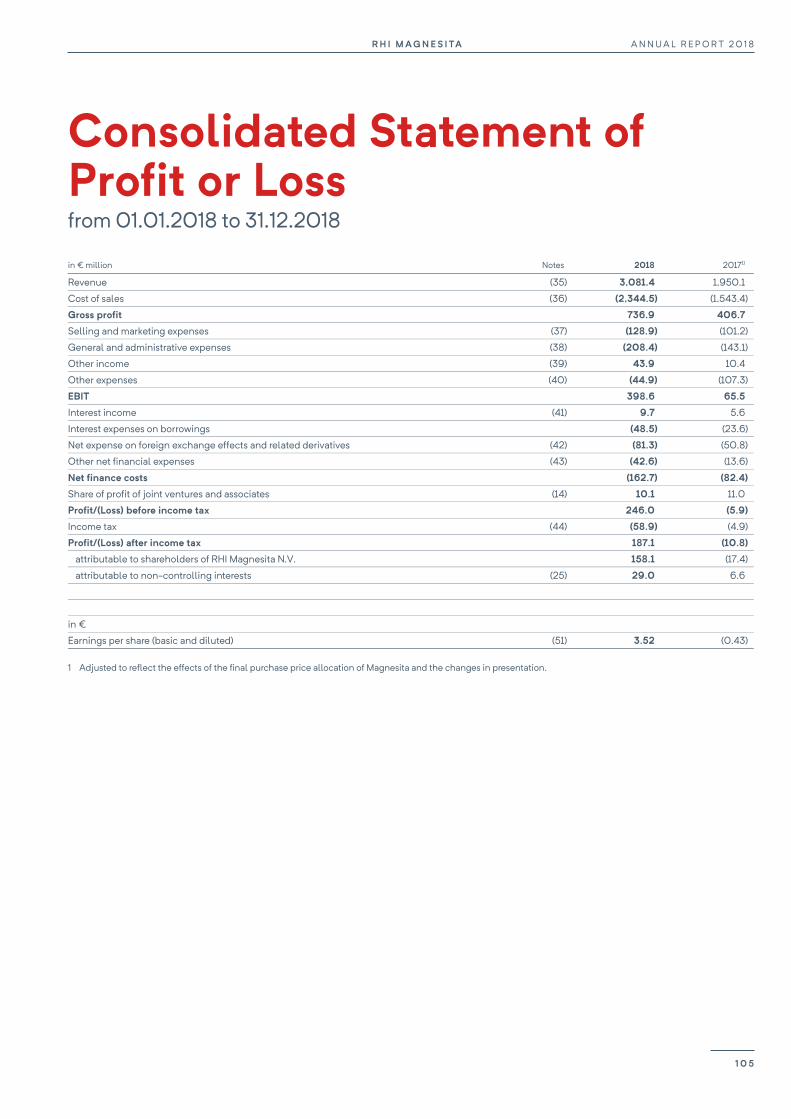
R H I M AG N E S I TA A N N U A L R E P O R T 2 0 1 8
103
in € million Notes 2018 20171)
Revenue (35) 3,081.4 1,950.1
Cost of sales (36) (2,344.5) (1,543.4)
Gross profit 736.9 406.7
Selling and marketing expenses (37) (128.9) (101.2)
General and administrative expenses (38) (208.4) (143.1)
Other income (39) 43.9 10.4
Other expenses (40) (44.9) (107.3)
EBIT 398.6 65.5
Interest income (41) 9.7 5.6
Interest expenses on borrowings (48.5) (23.6)
Net expense on foreign exchange effects and related derivatives (42) (81.3) (50.8)
Other net financial expenses (43) (42.6) (13.6)
Net finance costs (162.7) (82.4)
Share of profit of joint ventures and associates (14) 10.1 11.0
Profit/(Loss) before income tax 246.0 (5.9)
Income tax (44) (58.9) (4.9)
Profit/(Loss) after income tax 187.1 (10.8)
attributable to shareholders of RHI Magnesita N.V. 158.1 (17.4)
attributable to non-controlling interests (25) 29.0 6.6
in €
Earnings per share (basic and diluted) (51) 3.52 (0.43)
1 Adjusted to reflect the effects of the final purchase price allocation of Magnesita and the changes in presentation.
Consolidated Statement of Profit or Loss from 01.01.2018 to 31.12.2018
A N N U A L R E P O R T 2 0 1 8R H I M A G N E S I TA
1 0 5
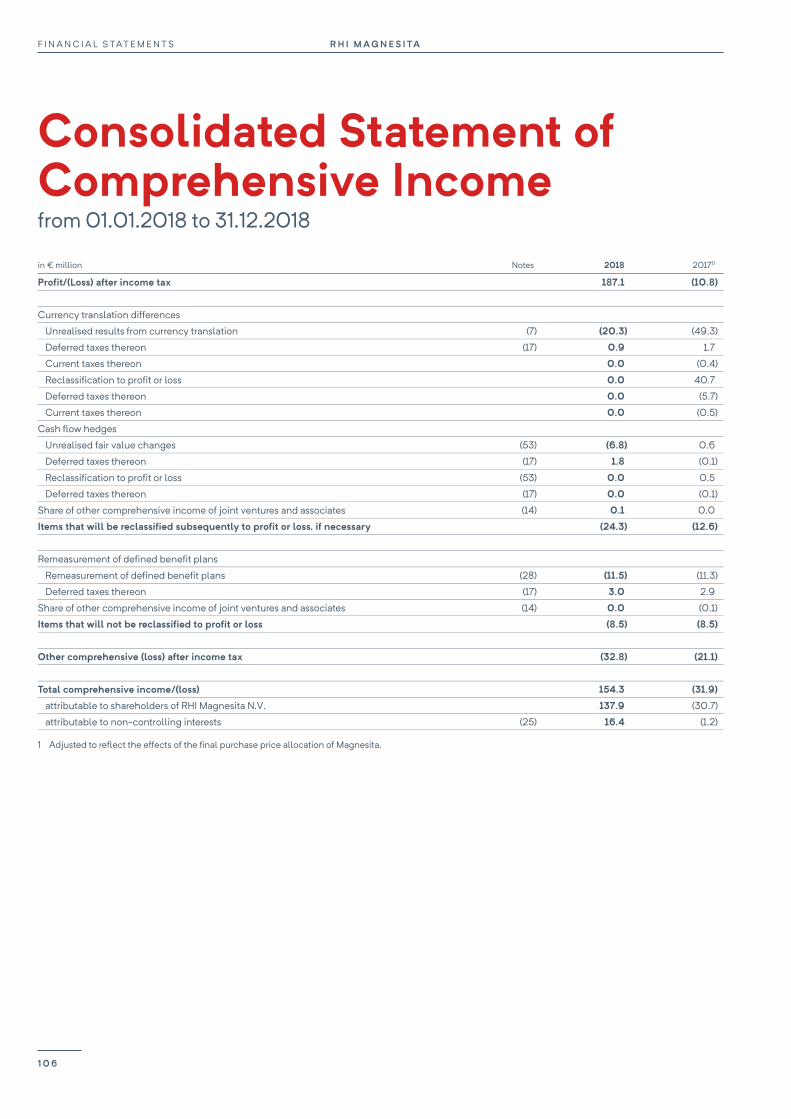
F I N A N C I A L S TAT E M E N T S R H I M AG N E S I TA
104
in € million Notes 2018 20171)
Profit/(Loss) after income tax 187.1 (10.8)
Currency translation differences
Unrealised results from currency translation (7) (20.3) (49.3)
Deferred taxes thereon (17) 0.9 1.7
Current taxes thereon 0.0 (0.4)
Reclassification to profit or loss 0.0 40.7
Deferred taxes thereon 0.0 (5.7)
Current taxes thereon 0.0 (0.5)
Cash flow hedges
Unrealised fair value changes (53) (6.8) 0.6
Deferred taxes thereon (17) 1.8 (0.1)
Reclassification to profit or loss (53) 0.0 0.5
Deferred taxes thereon (17) 0.0 (0.1)
Share of other comprehensive income of joint ventures and associates (14) 0.1 0.0
Items that will be reclassified subsequently to profit or loss, if necessary (24.3) (12.6)
Remeasurement of defined benefit plans
Remeasurement of defined benefit plans (28) (11.5) (11.3)
Deferred taxes thereon (17) 3.0 2.9
Share of other comprehensive income of joint ventures and associates (14) 0.0 (0.1)
Items that will not be reclassified to profit or loss (8.5) (8.5)
Other comprehensive (loss) after income tax (32.8) (21.1)
Total comprehensive income/(loss) 154.3 (31.9)
attributable to shareholders of RHI Magnesita N.V. 137.9 (30.7)
attributable to non-controlling interests (25) 16.4 (1.2)
1 Adjusted to reflect the effects of the final purchase price allocation of Magnesita.
Consolidated Statement of Comprehensive Income from 01.01.2018 to 31.12.2018
R H I M A G N E S I TAF I N A N C I A L S TAT E M E N T S
1 0 6
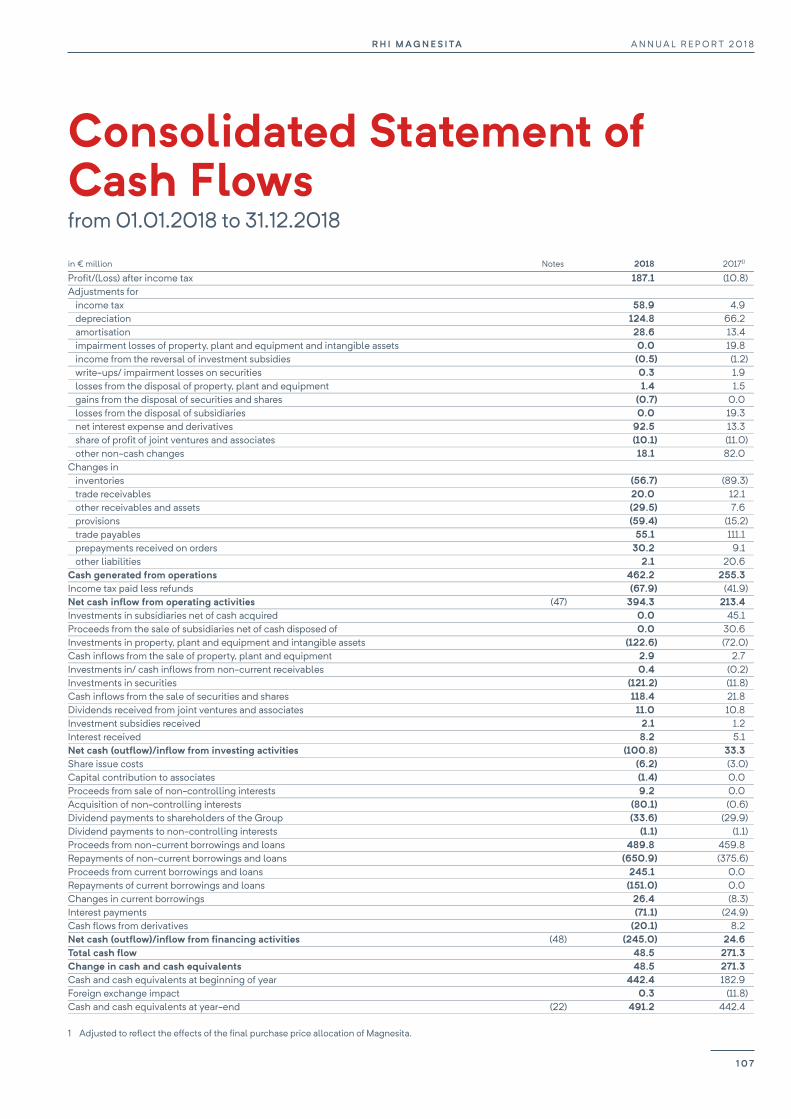
R H I M AG N E S I TA A N N U A L R E P O R T 2 0 1 8
105
in € million Notes 2018 20171)
Profit/(Loss) after income tax 187.1 (10.8) Adjustments for
income tax 58.9 4.9 depreciation 124.8 66.2 amortisation 28.6 13.4 impairment losses of property, plant and equipment and intangible assets 0.0 19.8 income from the reversal of investment subsidies (0.5) (1.2) write-ups/ impairment losses on securities 0.3 1.9 losses from the disposal of property, plant and equipment 1.4 1.5 gains from the disposal of securities and shares (0.7) 0.0 losses from the disposal of subsidiaries 0.0 19.3 net interest expense and derivatives 92.5 13.3 share of profit of joint ventures and associates (10.1) (11.0) other non-cash changes 18.1 82.0
Changes in inventories (56.7) (89.3) trade receivables 20.0 12.1 other receivables and assets (29.5) 7.6 provisions (59.4) (15.2) trade payables 55.1 111.1 prepayments received on orders 30.2 9.1 other liabilities 2.1 20.6
Cash generated from operations 462.2 255.3 Income tax paid less refunds (67.9) (41.9) Net cash inflow from operating activities (47) 394.3 213.4 Investments in subsidiaries net of cash acquired 0.0 45.1 Proceeds from the sale of subsidiaries net of cash disposed of 0.0 30.6 Investments in property, plant and equipment and intangible assets (122.6) (72.0) Cash inflows from the sale of property, plant and equipment 2.9 2.7 Investments in/ cash inflows from non-current receivables 0.4 (0.2) Investments in securities (121.2) (11.8) Cash inflows from the sale of securities and shares 118.4 21.8 Dividends received from joint ventures and associates 11.0 10.8 Investment subsidies received 2.1 1.2 Interest received 8.2 5.1 Net cash (outflow)/inflow from investing activities (100.8) 33.3 Share issue costs (6.2) (3.0) Capital contribution to associates (1.4) 0.0 Proceeds from sale of non-controlling interests 9.2 0.0 Acquisition of non-controlling interests (80.1) (0.6) Dividend payments to shareholders of the Group (33.6) (29.9) Dividend payments to non-controlling interests (1.1) (1.1) Proceeds from non-current borrowings and loans 489.8 459.8 Repayments of non-current borrowings and loans (650.9) (375.6) Proceeds from current borrowings and loans 245.1 0.0 Repayments of current borrowings and loans (151.0) 0.0 Changes in current borrowings 26.4 (8.3) Interest payments (71.1) (24.9) Cash flows from derivatives (20.1) 8.2 Net cash (outflow)/inflow from financing activities (48) (245.0) 24.6 Total cash flow 48.5 271.3 Change in cash and cash equivalents 48.5 271.3 Cash and cash equivalents at beginning of year 442.4 182.9 Foreign exchange impact 0.3 (11.8) Cash and cash equivalents at year-end (22) 491.2 442.4 1 Adjusted to reflect the effects of the final purchase price allocation of Magnesita.
Consolidated Statement of Cash Flows from 01.01.2018 to 31.12.2018
A N N U A L R E P O R T 2 0 1 8R H I M A G N E S I TA
1 0 7

F I N A N C I A L S TAT E M E N T S R H I M AG N E S I TA
106
in € million Share
capital
Additional paid-in capital Mandatory reserve
Notes (23) (24) (24)
31.12.20171) 44.8 165.7 288.7 Effects of initial application of IFRS 15 (net of tax)
Effects of initial application of IFRS 9 (net of tax)
01.01.2018 44.8 165.7 288.7 Profit after income tax - - -
Currency translation differences - - -
Market valuation of cash flow hedges - - - Remeasurement of defined benefit plans - - -
Share of other comprehensive income of joint ventures and associates - - -
Other comprehensive income after income tax - - - Total comprehensive income - - - Dividends - - -
Issue of ordinary shares related to the mandatory tender offer of Magnesita 3.5 139.8 - Sale of non-controlling interests without loss of control - - -
Acquisition in non-controlling interests without change of control - - -
Share-based payments - - -
Transactions with shareholders 3.5 139.8 - 31.12.2018 48.3 305.5 288.7
1 Adjusted to reflect the effects of the final purchase price allocation of Magnesita.
in € million Share
capital
Additional paid-in capital Mandatory reserve
Notes (23) (24) (24)
01.01.2017 289.4 38.3 - Profit after income tax - - -
Currency translation differences - - -
Cash flow hedges - - - Remeasurement of defined benefit plans - - -
Share of other comprehensive income of joint ventures - - -
Other comprehensive income after income tax - - - Total comprehensive income - - - Dividends - - -
Issue of ordinary shares related to business combinations 5.0 174.5 - Share issue costs, net of tax - (8.8) -
Change in non-controlling interests due to addition to consolidated companies - - -
Transactions with shareholders 5.0 165.7 - Disposal of defined benefit plans - - -
Downstream merger from RHI AG to RHI Magnesita N.V. (249.6) (38.3) 288.7
Reclassifications (249.6) (38.3) 288.7 31.12.20171) 44.8 165.7 288.7
Consolidated Statement of Changes in Equity from 01.01.2018 to 31.12.2018
R H I M A G N E S I TAF I N A N C I A L S TAT E M E N T S
1 0 8
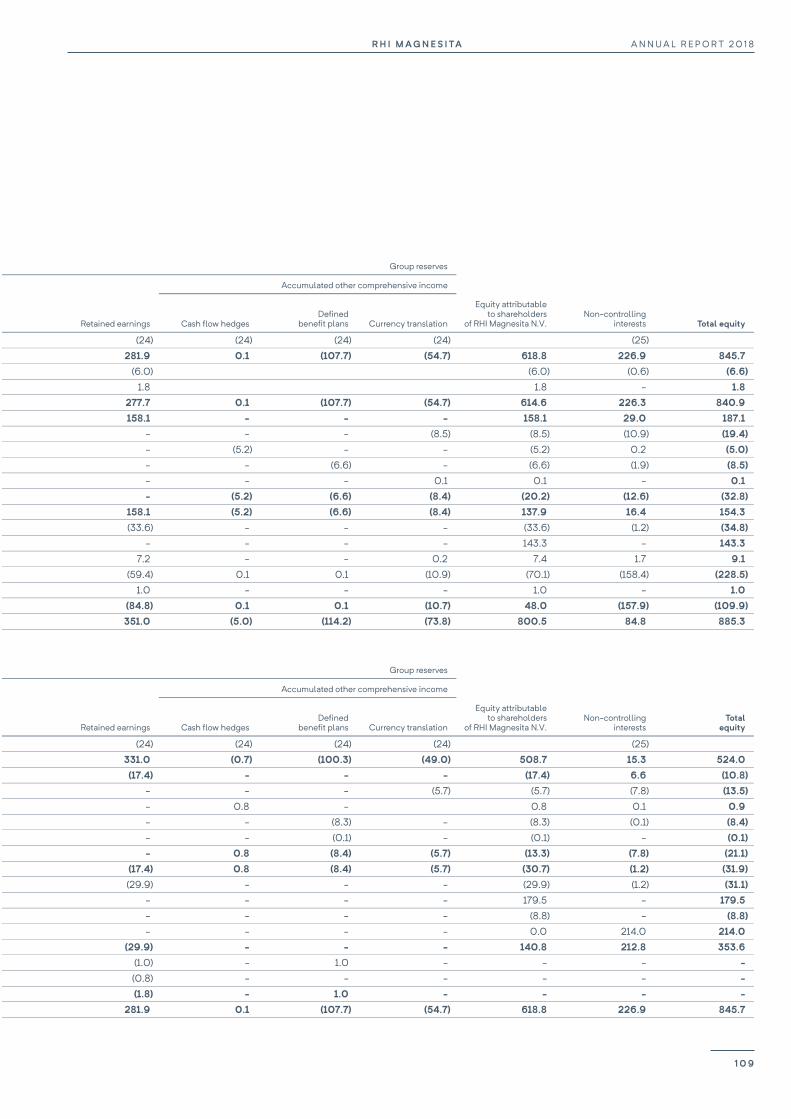
R H I M AG N E S I TA A N N U A L R E P O R T 2 0 1 8
107
Group reserves
Accumulated other comprehensive income
Retained earnings Cash flow hedges Defined
benefit plans Currency translation
Equity attributable to shareholders
of RHI Magnesita N.V. Non-controlling
interests Total equity
(24) (24) (24) (24) (25) 281.9 0.1 (107.7) (54.7) 618.8 226.9 845.7 (6.0) (6.0) (0.6) (6.6) 1.8 1.8 - 1.8 277.7 0.1 (107.7) (54.7) 614.6 226.3 840.9 158.1 - - - 158.1 29.0 187.1 - - - (8.5) (8.5) (10.9) (19.4) - (5.2) - - (5.2) 0.2 (5.0) - - (6.6) - (6.6) (1.9) (8.5) - - - 0.1 0.1 - 0.1 - (5.2) (6.6) (8.4) (20.2) (12.6) (32.8) 158.1 (5.2) (6.6) (8.4) 137.9 16.4 154.3 (33.6) - - - (33.6) (1.2) (34.8) - - - - 143.3 - 143.3 7.2 - - 0.2 7.4 1.7 9.1 (59.4) 0.1 0.1 (10.9) (70.1) (158.4) (228.5) 1.0 - - - 1.0 - 1.0 (84.8) 0.1 0.1 (10.7) 48.0 (157.9) (109.9) 351.0 (5.0) (114.2) (73.8) 800.5 84.8 885.3
Group reserves
Accumulated other comprehensive income
Retained earnings Cash flow hedges Defined
benefit plans Currency translation
Equity attributable to shareholders
of RHI Magnesita N.V. Non-controlling
interests Total
equity
(24) (24) (24) (24) (25) 331.0 (0.7) (100.3) (49.0) 508.7 15.3 524.0 (17.4) - - - (17.4) 6.6 (10.8) - - - (5.7) (5.7) (7.8) (13.5) - 0.8 - 0.8 0.1 0.9 - - (8.3) - (8.3) (0.1) (8.4) - - (0.1) - (0.1) - (0.1) - 0.8 (8.4) (5.7) (13.3) (7.8) (21.1) (17.4) 0.8 (8.4) (5.7) (30.7) (1.2) (31.9) (29.9) - - - (29.9) (1.2) (31.1) - - - - 179.5 - 179.5 - - - - (8.8) - (8.8) - - - - 0.0 214.0 214.0 (29.9) - - - 140.8 212.8 353.6 (1.0) - 1.0 - - - - (0.8) - - - - - - (1.8) - 1.0 - - - - 281.9 0.1 (107.7) (54.7) 618.8 226.9 845.7
A N N U A L R E P O R T 2 0 1 8R H I M A G N E S I TA
1 0 9
F I N A N C I A L S TAT E M E N T S R H I M AG N E S I TA
108
1. General RHI Magnesita N.V. (the “Company”), a public company with limited liability under Dutch law is registered with the Dutch Trade Register of the Chamber of Commerce under the number 68991665 and has its corporate seat in Arnhem, Netherlands. The administrative seat and registered office is located at Kranichberggasse 6, 1120 Vienna, Austria.
The Company and its subsidiaries, associates and joint ventures (the “Group”) is a global industrial group whose core activities comprise of the development and production, sale, installation and maintenance of high-grade refractory products and systems used in industrial high-temperature processes exceeding 1,200°C. The Group supplies customers in the steel, cement, lime, glass and nonferrous metals industries. In addition, the Group’s products are used in the environment (waste incineration), energy (refractory construction) and chem-icals (petrochemicals) sectors.
The shares of RHI Magnesita N.V. are listed on the Main Market of the London Stock Exchange and are included in the FTSE 250 Index.
RHI Magnesita N.V. was incorporated on 20 June 2017 and became the ultimate parent of the RHI Magnesita Group as of 26 October 2017, after completing the corporate restructuring of RHI AG. Until then, RHI AG was the ultimate parent of the Group. This restructuring represented a common control transaction that had no impact on the Consolidated Financial Statements, except for the reclassification of individual equity components.
The financial year of RHI Magnesita N.V. and the Group corresponds to the calendar year. If the financial years of subsidiaries included in the Consolidated Financial Statements do not end on 31 December due to local legal requirements, a special set of financial statements are prepared for the purpose of consolidation. The reporting date of the Indian subsidiaries is 31 March.
The Consolidated Financial Statements for the period from 1 January to 31 December 2018 were drawn up in accordance with all Interna-tional Financial Reporting Standards (IFRSs) mandatory at the time of preparation as adopted by the European Union (EU). The presenta-tion in the Consolidated Statement of Financial Position distinguishes between current and non-current assets and liabilities. Assets and liabilities are classified as current if they are due within one year or within a longer normal business cycle or if the Company does not have an unconditional right to defer settlement of the liability for at least 12 months after the reporting date. Inventories as well as trade receiv-ables and trade payables are generally presented as current items. Deferred tax assets and liabilities as well as assets and provisions for pensions and termination benefits are generally presented as non-current items.
The Consolidated Statement of Profit or Loss is drawn up in accordance with the cost of sales method. Under this method, revenue is offset against the expenses incurred to generate it, which are allocated to the functions production, sales and administration.
With the exception of specific items such as derivative financial instruments and plan assets for defined benefit obligations, the Consoli-dated Financial Statements are prepared on a historical cost basis.
The preparation of the Consolidated Financial Statements in agreement with generally accepted accounting principles under IFRS, as adopted by the EU, requires the use of estimates and assumptions that influence the amount and presentation of assets and liabilities recognised as well as the disclosure of contingent assets and liabilities as of the reporting date and the recognition of income and ex-penses during the reporting period. Although these estimates reflect the best knowledge of the management based on experience from comparable transactions, the actual values recognised at a later date may differ from these estimates.
All amounts in the Notes and tables are shown in € million, unless indicated otherwise. For computational reasons, rounding differences may occur.
The Annual Report was authorised for issue on 26 March 2019 and is subject to adoption at the Annual General Meeting of shareholders on 6 June 2019.
Notes to the Consolidated Financial Statements 2018
PRINCIPLES AND METHODS
R H I M A G N E S I TAF I N A N C I A L S TAT E M E N T S
1 1 0
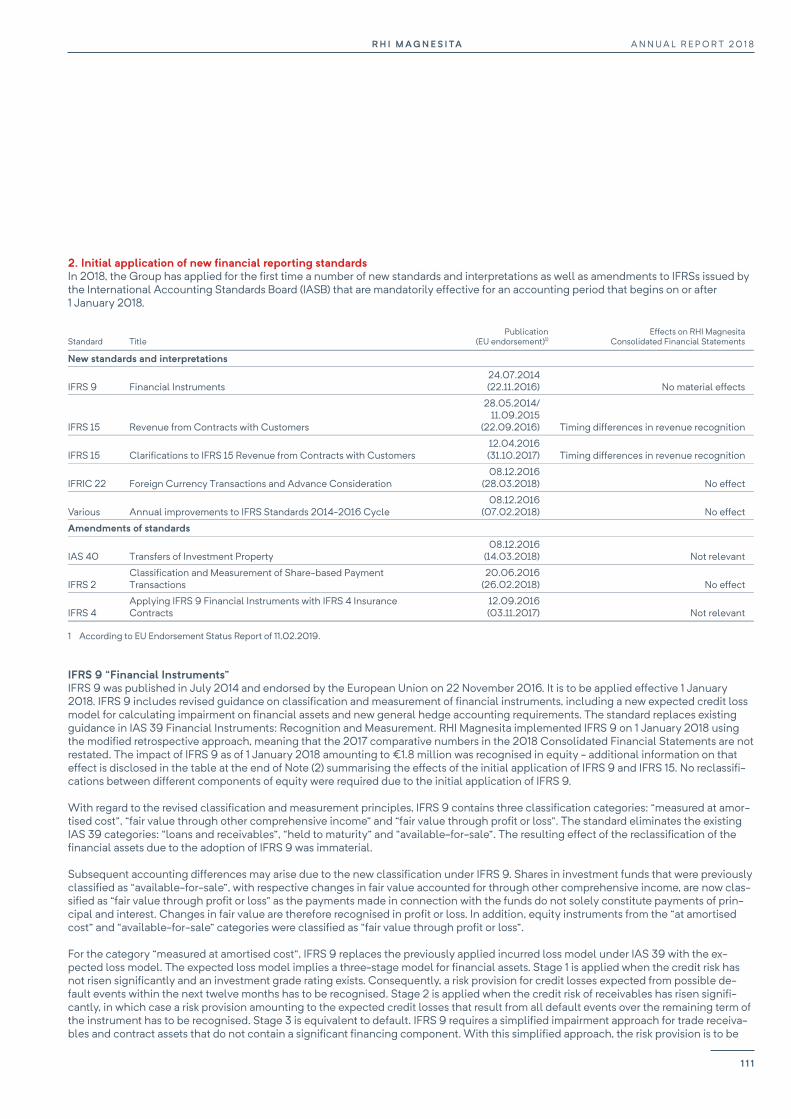
R H I M AG N E S I TA A N N U A L R E P O R T 2 0 1 8
109
2. Initial application of new financial reporting standards In 2018, the Group has applied for the first time a number of new standards and interpretations as well as amendments to IFRSs issued by the International Accounting Standards Board (IASB) that are mandatorily effective for an accounting period that begins on or after 1 January 2018.
Standard Title Publication
(EU endorsement)1)Effects on RHI Magnesita
Consolidated Financial Statements
New standards and interpretations
IFRS 9 Financial Instruments 24.07.2014 (22.11.2016) No material effects
IFRS 15 Revenue from Contracts with Customers
28.05.2014/ 11.09.2015
(22.09.2016) Timing differences in revenue recognition
IFRS 15 Clarifications to IFRS 15 Revenue from Contracts with Customers 12.04.2016 (31.10.2017) Timing differences in revenue recognition
IFRIC 22 Foreign Currency Transactions and Advance Consideration 08.12.2016
(28.03.2018) No effect
Various Annual improvements to IFRS Standards 2014-2016 Cycle 08.12.2016
(07.02.2018) No effect
Amendments of standards
IAS 40 Transfers of Investment Property 08.12.2016
(14.03.2018) Not relevant
IFRS 2 Classification and Measurement of Share-based Payment Transactions
20.06.2016 (26.02.2018) No effect
IFRS 4 Applying IFRS 9 Financial Instruments with IFRS 4 Insurance Contracts
12.09.2016 (03.11.2017) Not relevant
1 According to EU Endorsement Status Report of 11.02.2019.
IFRS 9 “Financial Instruments” IFRS 9 was published in July 2014 and endorsed by the European Union on 22 November 2016. It is to be applied effective 1 January 2018. IFRS 9 includes revised guidance on classification and measurement of financial instruments, including a new expected credit loss model for calculating impairment on financial assets and new general hedge accounting requirements. The standard replaces existing guidance in IAS 39 Financial Instruments: Recognition and Measurement. RHI Magnesita implemented IFRS 9 on 1 January 2018 using the modified retrospective approach, meaning that the 2017 comparative numbers in the 2018 Consolidated Financial Statements are not restated. The impact of IFRS 9 as of 1 January 2018 amounting to €1.8 million was recognised in equity - additional information on that effect is disclosed in the table at the end of Note (2) summarising the effects of the initial application of IFRS 9 and IFRS 15. No reclassifi-cations between different components of equity were required due to the initial application of IFRS 9.
With regard to the revised classification and measurement principles, IFRS 9 contains three classification categories: “measured at amor-tised cost”, “fair value through other comprehensive income” and “fair value through profit or loss”. The standard eliminates the existing IAS 39 categories: “loans and receivables”, “held to maturity” and “available-for-sale”. The resulting effect of the reclassification of the financial assets due to the adoption of IFRS 9 was immaterial.
Subsequent accounting differences may arise due to the new classification under IFRS 9. Shares in investment funds that were previously classified as “available-for-sale”, with respective changes in fair value accounted for through other comprehensive income, are now clas-sified as “fair value through profit or loss” as the payments made in connection with the funds do not solely constitute payments of prin-cipal and interest. Changes in fair value are therefore recognised in profit or loss. In addition, equity instruments from the “at amortised cost” and “available-for-sale” categories were classified as “fair value through profit or loss”.
For the category “measured at amortised cost”, IFRS 9 replaces the previously applied incurred loss model under IAS 39 with the ex-pected loss model. The expected loss model implies a three-stage model for financial assets. Stage 1 is applied when the credit risk has not risen significantly and an investment grade rating exists. Consequently, a risk provision for credit losses expected from possible de-fault events within the next twelve months has to be recognised. Stage 2 is applied when the credit risk of receivables has risen signifi-cantly, in which case a risk provision amounting to the expected credit losses that result from all default events over the remaining term of the instrument has to be recognised. Stage 3 is equivalent to default. IFRS 9 requires a simplified impairment approach for trade receiva-bles and contract assets that do not contain a significant financing component. With this simplified approach, the risk provision is to be
A N N U A L R E P O R T 2 0 1 8R H I M A G N E S I TA
1 1 1
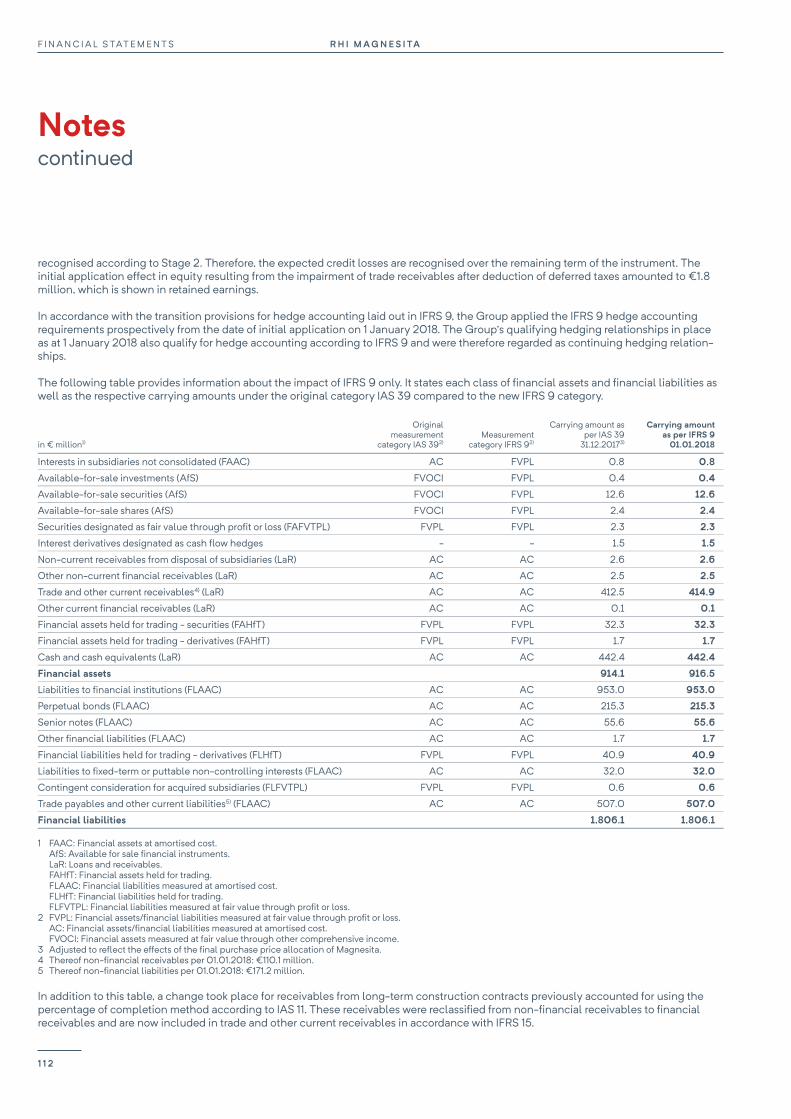
F I N A N C I A L S TAT E M E N T S R H I M AG N E S I TA
Notes continued
110
recognised according to Stage 2. Therefore, the expected credit losses are recognised over the remaining term of the instrument. The initial application effect in equity resulting from the impairment of trade receivables after deduction of deferred taxes amounted to €1.8 million, which is shown in retained earnings.
In accordance with the transition provisions for hedge accounting laid out in IFRS 9, the Group applied the IFRS 9 hedge accounting requirements prospectively from the date of initial application on 1 January 2018. The Group’s qualifying hedging relationships in place as at 1 January 2018 also qualify for hedge accounting according to IFRS 9 and were therefore regarded as continuing hedging relation-ships.
The following table provides information about the impact of IFRS 9 only. It states each class of financial assets and financial liabilities as well as the respective carrying amounts under the original category IAS 39 compared to the new IFRS 9 category.
in € million1)
Original measurement
category IAS 392) Measurement
category IFRS 92)
Carrying amount as per IAS 39
31.12.20173)
Carrying amount as per IFRS 9
01.01.2018
Interests in subsidiaries not consolidated (FAAC) AC FVPL 0.8 0.8
Available-for-sale investments (AfS) FVOCI FVPL 0.4 0.4
Available-for-sale securities (AfS) FVOCI FVPL 12.6 12.6
Available-for-sale shares (AfS) FVOCI FVPL 2.4 2.4
Securities designated as fair value through profit or loss (FAFVTPL) FVPL FVPL 2.3 2.3
Interest derivatives designated as cash flow hedges - - 1.5 1.5
Non-current receivables from disposal of subsidiaries (LaR) AC AC 2.6 2.6
Other non-current financial receivables (LaR) AC AC 2.5 2.5
Trade and other current receivables4) (LaR) AC AC 412.5 414.9
Other current financial receivables (LaR) AC AC 0.1 0.1
Financial assets held for trading - securities (FAHfT) FVPL FVPL 32.3 32.3
Financial assets held for trading - derivatives (FAHfT) FVPL FVPL 1.7 1.7
Cash and cash equivalents (LaR) AC AC 442.4 442.4
Financial assets 914.1 916.5
Liabilities to financial institutions (FLAAC) AC AC 953.0 953.0
Perpetual bonds (FLAAC) AC AC 215.3 215.3
Senior notes (FLAAC) AC AC 55.6 55.6
Other financial liabilities (FLAAC) AC AC 1.7 1.7
Financial liabilities held for trading - derivatives (FLHfT) FVPL FVPL 40.9 40.9
Liabilities to fixed-term or puttable non-controlling interests (FLAAC) AC AC 32.0 32.0
Contingent consideration for acquired subsidiaries (FLFVTPL) FVPL FVPL 0.6 0.6
Trade payables and other current liabilities5) (FLAAC) AC AC 507.0 507.0
Financial liabilities 1,806.1 1,806.1
1 FAAC: Financial assets at amortised cost. AfS: Available for sale financial instruments. LaR: Loans and receivables. FAHfT: Financial assets held for trading. FLAAC: Financial liabilities measured at amortised cost. FLHfT: Financial liabilities held for trading. FLFVTPL: Financial liabilities measured at fair value through profit or loss. 2 FVPL: Financial assets/financial liabilities measured at fair value through profit or loss. AC: Financial assets/financial liabilities measured at amortised cost. FVOCI: Financial assets measured at fair value through other comprehensive income. 3 Adjusted to reflect the effects of the final purchase price allocation of Magnesita. 4 Thereof non-financial receivables per 01.01.2018: €110.1 million. 5 Thereof non-financial liabilities per 01.01.2018: €171.2 million.
In addition to this table, a change took place for receivables from long-term construction contracts previously accounted for using the percentage of completion method according to IAS 11. These receivables were reclassified from non-financial receivables to financial receivables and are now included in trade and other current receivables in accordance with IFRS 15.
R H I M A G N E S I TAF I N A N C I A L S TAT E M E N T S
1 1 2
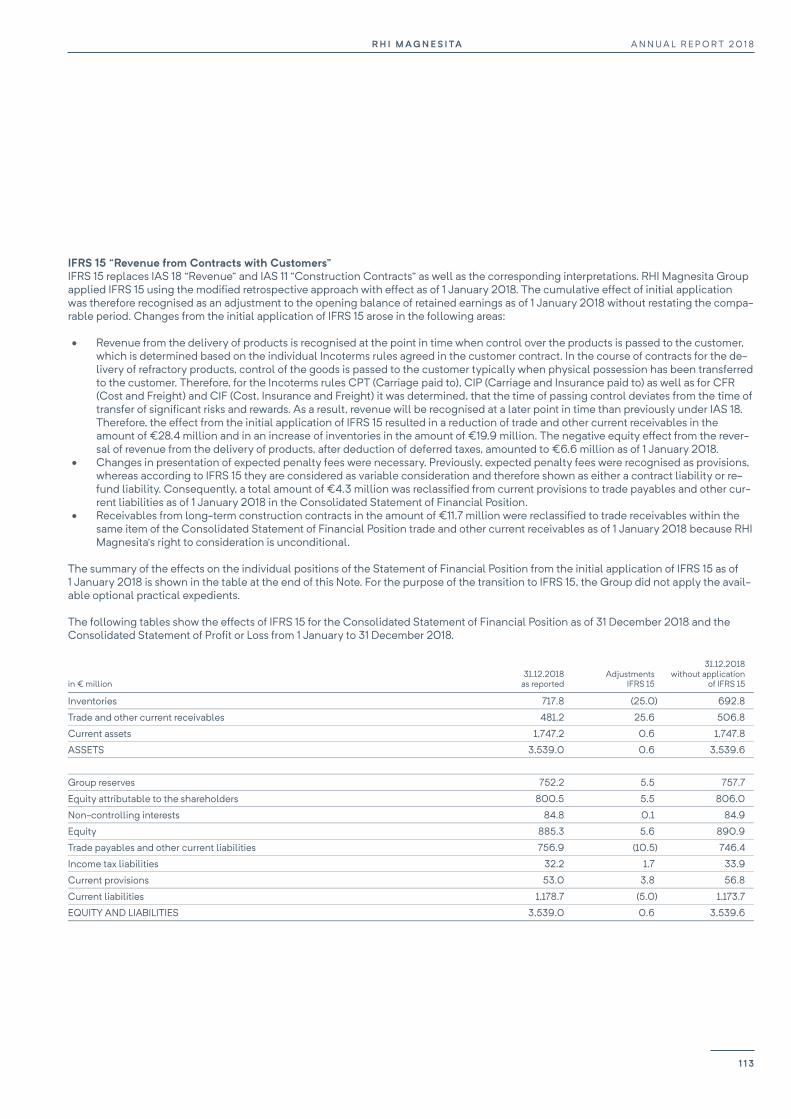
R H I M AG N E S I TA A N N U A L R E P O R T 2 0 1 8
111
IFRS 15 “Revenue from Contracts with Customers” IFRS 15 replaces IAS 18 “Revenue” and IAS 11 “Construction Contracts” as well as the corresponding interpretations. RHI Magnesita Group applied IFRS 15 using the modified retrospective approach with effect as of 1 January 2018. The cumulative effect of initial application was therefore recognised as an adjustment to the opening balance of retained earnings as of 1 January 2018 without restating the compa-rable period. Changes from the initial application of IFRS 15 arose in the following areas:
Revenue from the delivery of products is recognised at the point in time when control over the products is passed to the customer, which is determined based on the individual Incoterms rules agreed in the customer contract. In the course of contracts for the de-livery of refractory products, control of the goods is passed to the customer typically when physical possession has been transferred to the customer. Therefore, for the Incoterms rules CPT (Carriage paid to), CIP (Carriage and Insurance paid to) as well as for CFR (Cost and Freight) and CIF (Cost, Insurance and Freight) it was determined, that the time of passing control deviates from the time of transfer of significant risks and rewards. As a result, revenue will be recognised at a later point in time than previously under IAS 18. Therefore, the effect from the initial application of IFRS 15 resulted in a reduction of trade and other current receivables in the amount of €28.4 million and in an increase of inventories in the amount of €19.9 million. The negative equity effect from the rever-sal of revenue from the delivery of products, after deduction of deferred taxes, amounted to €6.6 million as of 1 January 2018.
Changes in presentation of expected penalty fees were necessary. Previously, expected penalty fees were recognised as provisions, whereas according to IFRS 15 they are considered as variable consideration and therefore shown as either a contract liability or re-fund liability. Consequently, a total amount of €4.3 million was reclassified from current provisions to trade payables and other cur-rent liabilities as of 1 January 2018 in the Consolidated Statement of Financial Position.
Receivables from long-term construction contracts in the amount of €11.7 million were reclassified to trade receivables within the same item of the Consolidated Statement of Financial Position trade and other current receivables as of 1 January 2018 because RHI Magnesita’s right to consideration is unconditional.
The summary of the effects on the individual positions of the Statement of Financial Position from the initial application of IFRS 15 as of 1 January 2018 is shown in the table at the end of this Note. For the purpose of the transition to IFRS 15, the Group did not apply the avail-able optional practical expedients.
The following tables show the effects of IFRS 15 for the Consolidated Statement of Financial Position as of 31 December 2018 and the Consolidated Statement of Profit or Loss from 1 January to 31 December 2018.
in € million 31.12.2018
as reported Adjustments
IFRS 15
31.12.2018 without application
of IFRS 15
Inventories 717.8 (25.0) 692.8
Trade and other current receivables 481.2 25.6 506.8
Current assets 1,747.2 0.6 1,747.8
ASSETS 3,539.0 0.6 3,539.6
Group reserves 752.2 5.5 757.7
Equity attributable to the shareholders 800.5 5.5 806.0
Non-controlling interests 84.8 0.1 84.9
Equity 885.3 5.6 890.9
Trade payables and other current liabilities 756.9 (10.5) 746.4
Income tax liabilities 32.2 1.7 33.9
Current provisions 53.0 3.8 56.8
Current liabilities 1,178.7 (5.0) 1,173.7
EQUITY AND LIABILITIES 3,539.0 0.6 3,539.6
A N N U A L R E P O R T 2 0 1 8R H I M A G N E S I TA
1 1 3
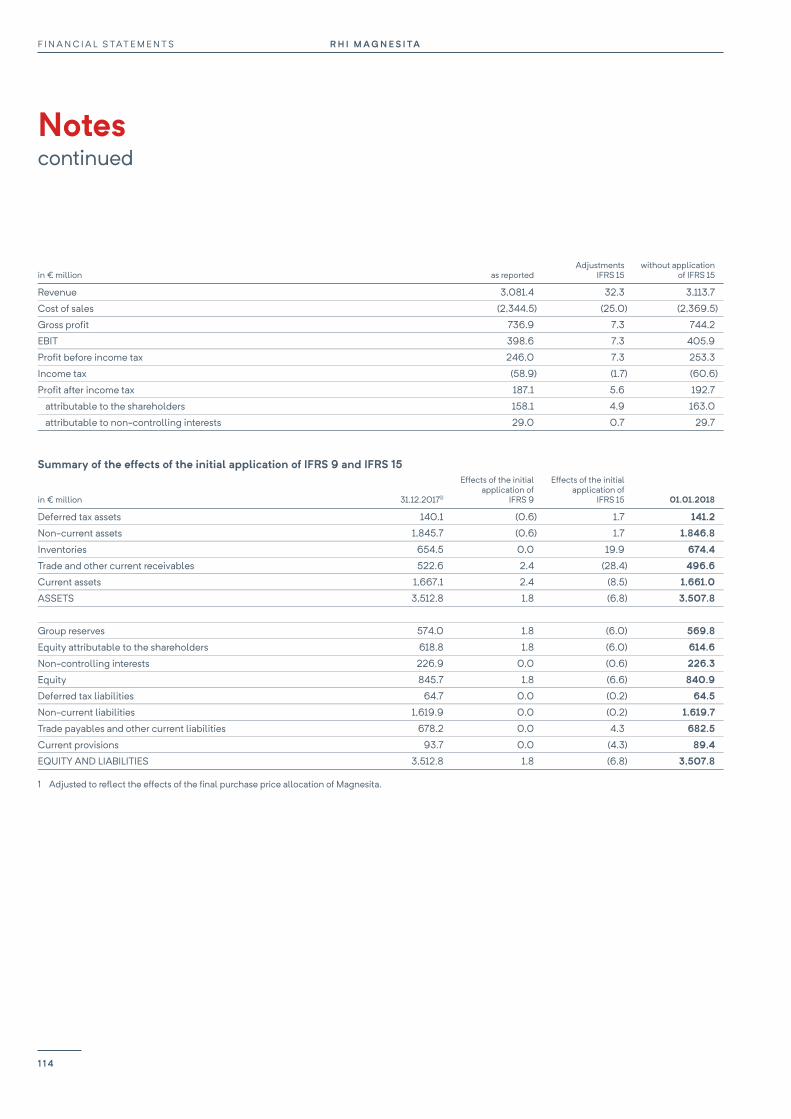
F I N A N C I A L S TAT E M E N T S R H I M AG N E S I TA
Notes continued
112
in € million as reported Adjustments
IFRS 15 without application
of IFRS 15
Revenue 3,081.4 32.3 3,113.7
Cost of sales (2,344.5) (25.0) (2,369.5)
Gross profit 736.9 7.3 744.2
EBIT 398.6 7.3 405.9
Profit before income tax 246.0 7.3 253.3
Income tax (58.9) (1.7) (60.6)
Profit after income tax 187.1 5.6 192.7
attributable to the shareholders 158.1 4.9 163.0
attributable to non-controlling interests 29.0 0.7 29.7
Summary of the effects of the initial application of IFRS 9 and IFRS 15
in € million 31.12.20171)
Effects of the initial application of
IFRS 9
Effects of the initial application of
IFRS 15 01.01.2018
Deferred tax assets 140.1 (0.6) 1.7 141.2
Non-current assets 1,845.7 (0.6) 1.7 1,846.8
Inventories 654.5 0.0 19.9 674.4
Trade and other current receivables 522.6 2.4 (28.4) 496.6
Current assets 1,667.1 2.4 (8.5) 1,661.0
ASSETS 3,512.8 1.8 (6.8) 3,507.8
Group reserves 574.0 1.8 (6.0) 569.8
Equity attributable to the shareholders 618.8 1.8 (6.0) 614.6
Non-controlling interests 226.9 0.0 (0.6) 226.3
Equity 845.7 1.8 (6.6) 840.9
Deferred tax liabilities 64.7 0.0 (0.2) 64.5
Non-current liabilities 1,619.9 0.0 (0.2) 1,619.7
Trade payables and other current liabilities 678.2 0.0 4.3 682.5
Current provisions 93.7 0.0 (4.3) 89.4
EQUITY AND LIABILITIES 3,512.8 1.8 (6.8) 3,507.8
1 Adjusted to reflect the effects of the final purchase price allocation of Magnesita.
R H I M A G N E S I TAF I N A N C I A L S TAT E M E N T S
1 1 4

R H I M AG N E S I TA A N N U A L R E P O R T 2 0 1 8
113
3. Other changes in comparative information Consolidated Statement of Financial Position The Statement of Financial Position per 31 December 2017 was adjusted for the final fair values of the acquired assets and liabilities of Magnesita. The details of the effects are shown in Note (5) Group of consolidated companies under Acquisition of Magnesita.
Consolidated Statement of Profit or Loss The Statement of Profit or Loss 2017 was adjusted for the effects of the subsequent measurement of the values determined in the final purchase price allocation of Magnesita.
Additionally, in order to improve comparability with other FTSE 350 companies and ensure better understanding of the entity’s financial performance, certain items in the Statement of Profit or Loss 2017 were reclassified. As of 31 December 2017, the effect on revenue amounted to €4.0 million, on gross profit to €(23.3) million, on EBIT to €50.8 million and on net finance costs to €(50.8) million. Varia-ble commissions in the amount of €(27.3) million as of 31 December 2017 were reclassified from selling and marketing expenses to cost of sales and the expenses for strategic and merger-related projects (2017: €24.4 million) are now presented in other expenses, instead of general and administrative expenses. Variable commissions are costs directly linked with revenue. This reclassification should ensure better interpretation of these costs. Foreign exchange gains and losses as well as the effects from derivatives were reclassified from other income and expenses to a separate line item in net finance costs which is called “Net expense on foreign exchange effects and related derivatives”. This reclassification was done because the majority of foreign exchange effects are incurred due to financing activities and the effects from derivatives are related to foreign exchange effects.
Additionally, interest expenses on borrowings are now reported as a separate item due to its significance. Other net financial expenses include all remaining financial income and expenses. The information for the previous year was adjusted accordingly.
Consolidated Statement of Cash Flows Cash flows from derivatives in the amount of €8.2 million were reclassified from cash flow from operating activities to net cash flow from financing activities because they are related to foreign exchange effects of financing activities.
Segment reporting In 2018, RHI Magnesita reorganised its internal structure and reporting. The activities formerly concentrated in the Raw material segment are now split between the Steel and Industrial segment. Each segment serves different customers and generates exclusively external revenue. The gross profit serves the management of the RHI Magnesita Group for internal performance management. The profit of joint ventures and associates, net finance costs and income taxes are managed on a group basis and are not allocated. The information for the previous year was adjusted accordingly.
4. New financial reporting standards not yet applied The Group has chosen to not early adopt the following new and revised IFRSs, that have been issued by the IASB, but are not yet manda-tory:
Standard Title Publication
(EU endorsement)1) Mandatory application for
RHI Magnesita
Expected effects on RHI Magnesita Consolidated
Financial Statements
New standards
IFRS 9 Prepayment Features with Negative Compensation 12.10.2017
(22.03.2018) 01.01.2019 No effect
IFRS 16 Leases 13.01.2016 (31.10.2017) 01.01.2019 Material effects expected
IFRIC 23 Uncertainty over Income Tax Treatments 07.06.2017 (23.10.2018) 01.01.2019 No effect
Amendments of standards
IAS 28 Long-term Interests in Associates and Joint Ventures 12.10.2017
(08.02.2019) 01.01.2019 No effect
1 According to EU Endorsement Status Report of 11.02.2019.
A N N U A L R E P O R T 2 0 1 8R H I M A G N E S I TA
1 1 5
F I N A N C I A L S TAT E M E N T S R H I M AG N E S I TA
Notes continued
114
IFRS 16 “Leases” General impact of application of IFRS 16 Leases The accounting standard IFRS 16, which was issued in January 2016, supersedes IAS 17 “Leases” and the related interpretations and is applicable to financial years beginning on or after 1 January 2019. Accounting for the lessor according to IFRS 16 is comparable to the current regulations. In contrast, accounting will change fundamentally for the lessee with the application of IFRS 16. In future, most leases will have to be recognised as assets and liabilities in the Statement of Financial Position of the lessee, regardless of whether they are considered operating or financing leases under the previous criteria of IAS 17.
According to IFRS 16, a lessee recognises a right of use, which represents his right to use the underlying asset, and a liability from the lease, which reflects the obligation of lease payments. Exemptions are provided for short-term leases and assets of minor value. Moreover, the type of expenses related to these leases will change since IFRS 16 replaces the straight-line expenses for operating leases with a depreciation charge for rights of use and interest expenses for liabilities from the lease. In the Consolidated Statement of Cash Flows, there is a shift from cash flow from operating activities to cash flow from financing activities since the repayment of leasing liabilities must in any case be shown as cash flow from financing activities.
RHI Magnesita has chosen the modified retrospective application of IFRS 16 in accordance with IFRS 16:C5(b). Consequently, the Group will not restate the comparative information.
RHI Magnesita will make use of the practical expedient available on transition to IFRS 16 not to reassess whether a contract is or contains a lease. Accordingly, the definition of a lease in accordance with IAS 17 and IFRIC 4 will continue to apply to those leases entered or modi-fied before 1 January 2019.
The change in definition of a lease mainly relates to the concept of control. IFRS 16 distinguishes between leases and service contracts on the basis of whether the use of an identified asset is controlled by the customer. Control is considered to exist if the customer has:
The right to obtain substantially all of the economic benefits from the use of an identified asset; and The right to direct the use of that asset.
RHI Magnesita will apply the definition of a lease and related guidance set out in IFRS 16 to all lease contracts entered into or modified on or after 1 January 2019.
Impact on Lessee Accounting IFRS 16 has no economic impact on the Group. It has no effect on how the business is run, nor on cash flows for the Group. It does how-ever have a significant impact on the way the assets, liabilities and the Statement of Profit or Loss of the Group are presented, as well as the classification of cash flows relating to lease contracts.
On initial application of IFRS 16, for all leases (except as noted below), RHI Magnesita will:
Recognise right-of-use assets and lease liabilities in the Consolidated Statement of Financial Position, initially measured at the present value of the future lease payments;
Recognise depreciation of right-of-use assets and interest on lease liabilities in the Consolidated Statement of Profit or Loss; Separate the total amount of cash paid into a principal portion (presented within financing activities) and interest (presented within
operating activities) in the Consolidated Statement of Cash Flows.
Furthermore, on initial application RHI Magnesita will make use of the following practical expedients:
Applying a single discount rate to a portfolio of leases with reasonably similar characteristics; Relying on its assessment of whether leases are onerous immediately before the date of initial application as an alternative to per-
forming impairment review; Treating leases for which the lease term ends within 12 months of the date of initial application as short-term leases.
For short-term leases (lease term of 12 months or less) and leases of low-value assets, the RHI Magnesita Group will opt to recognise a lease expense on a straight-line basis as permitted by IFRS 16.
Based on a preliminary assessment, it is expected that the RHI Magnesita Group will recognise right-of-use assets and corresponding lease liabilities of €62.0 million in respect of all these leases. The impact on profit or loss is estimated to be a decrease in other expenses by €13.3 million, an increase in depreciation by €12.6 million and an increase in interest expense by €0.6 million.
R H I M A G N E S I TAF I N A N C I A L S TAT E M E N T S
1 1 6
R H I M AG N E S I TA A N N U A L R E P O R T 2 0 1 8
115
Under IAS 17, all lease payments on operating leases are presented as part of cash flows from operating activities. Under IFRS 16, the cash generated by operating activities is expected to increase by €13.3 million and the net cash outflow in financing activities is expected to increase by the same amount.
For existing finance leases RHI Magnesita does not expect an impact on the amounts recognised in the Group’s Consolidated Statement of Financial Position.
The following financial reporting standards were issued by the IASB, but had not yet been adopted by the EU at the time of the prepara-tion of the RHI Magnesita Consolidated Financial Statements:
Standard Title Publication1)Mandatory application for
RHI Magnesita
Expected effects on RHI Magnesita Consolidated
Financial Statements
New standards and interpretations
IFRS 14 Regulatory Deferral Accounts 30.01.2014 No EU endorsement Not relevant
IFRS 17 Insurance Contracts 18.05.2017 01.01.2021 Not relevant
Amendments of standards
IAS 1, IAS 8 Definition of Material 31.10.2018 01.01.2020 No material effects
IAS 19 Plan Amendment, Curtailment or Settlement 07.02.2018 01.01.2019 No material effects
IFRS 3 Business Combinations 22.10.2018 01.01.2020 No effect
Various Amendments to References to the Conceptual Framework in IFRS Standards 29.03.2018 01.01.2020 No effect
Various Annual Improvements to IFRSs 2015-2017 Cycle 12.12.2017 01.01.2019 No effect
1 According to EU Endorsement Status Report of 11.02.2019.
A N N U A L R E P O R T 2 0 1 8R H I M A G N E S I TA
1 1 7
F I N A N C I A L S TAT E M E N T S R H I M AG N E S I TA
Notes continued
116
5. Group of consolidated companies Changes in the group of consolidated companies in the previous year Acquisition of Magnesita On 26 October 2017, RHI Magnesita N.V. via its indirect, wholly-owned subsidiary Dutch Brasil Holding B.V. obtained control in Magnesi-ta Refratários S.A. and its subsidiaries (Magnesita) after acquiring 50% plus one share and corresponding voting rights in Magnesita Re-fratários S.A. The acquisition led to a cash inflow of €50.2 million (purchase price paid of €117.3 million less acquired cash and cash equivalents of €167.5 million).
The fair values of the acquired assets and liabilities at the acquisition date have been adjusted according to IFRS 3 compared to the Con-solidated Financial Statements 2017 over the course of the measurement period. The final fair values of the assets and liabilities recog-nised as a result of the acquisition are presented as follows:
in € million Preliminary fair value Adjustments made Final fair value
Property, plant and equipment 439.0 251.2 690.2
Other intangible assets 161.4 160.2 321.6
thereof customer relationships 122.0 (20.0) 102.0
thereof mining rights 0.0 185.1 185.1
Investments in joint ventures and associates 9.9 (9.1) 0.8
Other non-current financial assets 4.3 0.0 4.3
Other non-current assets 16.3 0.0 16.3
Deferred tax assets 49.9 (35.5) 14.4
Inventories 244.7 1.0 245.7
Trade and other current receivables 175.6 (7.4) 168.2
Income tax receivables 9.2 0.0 9.2
Other current financial assets 42.7 0.0 42.7
Cash and cash equivalents 166.2 0.0 166.2
Assets held for sale 33.6 0.0 33.6
Non-current financial liabilities (550.8) 0.0 (550.8)
Deferred tax liabilities (0.3) (91.6) (91.9)
Provisions for pensions (81.0) 0.0 (81.0)
Other personnel provisions (1.5) 0.0 (1.5)
Other non-current provisions (51.7) (62.9) (114.6)
Other non-current liabilities (2.0) 0.0 (2.0)
Current financial liabilities (131.4) 0.0 (131.4)
Current derivative financial liabilities (0.2) 0.0 (0.2)
Trade and other current liabilities (238.4) (6.8) (245.2)
Income tax liabilities (10.1) 0.0 (10.1)
Current provisions (25.8) (21.4) (47.2)
Liabilities relating to assets held for sale (9.4) 0.0 (9.4)
Net assets 250.2 177.7 427.9
Non-controlling interest (125.1) (88.9) (214.0)
Proportional share of net assets acquired 125.1 88.8 213.9
Goodwill 171.7 (88.8) 82.9
Purchase price 296.8 0.0 296.8
The goodwill of €82.9 million essentially reflects expected synergies achieved by optimising production capacities and cost structure as well as new business of the enlarged Group. Goodwill is not deductible for tax purposes. The goodwill has been allocated to cash-generating unit Steel - Linings in the amount of €82.1 million and to cash-generating unit Industrial - Raw Material in the amount of €0.8 million.
R H I M A G N E S I TAF I N A N C I A L S TAT E M E N T S
1 1 8
R H I M AG N E S I TA A N N U A L R E P O R T 2 0 1 8
117
The table below provides information on the carrying amount of goodwill:
in € million
Preliminary goodwill recognised per acquisition date as at 31 December 2017 171.7
Adjustments relating to business combination fair values (88.8)
Exchange rate differences 2017 (1.4)
Goodwill recognised as at 31 December 2017 81.5
Exchange rate differences 2018 (1.7)
Goodwill recognised as at 31 December 2018 79.8
Non-controlling interests have been measured at their proportionate share of Magnesita’s identifiable net assets.
Material adjustments to final fair values since prior reporting date Intangible assets arising from non-patented technology and customer relationships were recognised in the purchase price allocation to the amount of €11.5 million and €102.0 million respectively. Discounted cash flow models were applied to value these intangible assets. The reason for the fair value adjustment of customer relations was that higher quality information was obtained over the course of the reporting period. Furthermore, since the valuation of property, plant and equipment was not completed as of 31 December 2017, valuation of intangible assets arising from customer relationships could not be considered final. The increase in the value of property, plant and equipment in the measurement period reduced the fair value of the customer relationships to a varying degree because of the associated higher contributory asset charges.
As at the previous financial reporting date, the preliminary fair value of property, plant and equipment was approximated by using mainly historical book values because the technical valuation was not completed at the majority of the production sites. After completion of the valuation of property, plant and equipment within the measurement period, fair value amounts to €690.2 million and was determined by external appraisers applying a replacement cost approach.
As part of the business combination, the Group recognised intangible assets for mining rights arising from three significant mines in Brazil and the USA. These were initially not recognised as at 31 December 2017, as insufficient data was available at that time. After finalisation of the purchase price allocation fair value of the mining rights amounts to €185.1 million. The intangible assets arising from mining rights were valued using discounted cash flow models, based on the life-of-mine plans as at the acquisition date. Expected cash flows are based on estimates of future production, margins, operating costs and forecast capital expenditure. The value of PPE items that form part of the mines (but valued separately) was deducted from the value of the mining rights in order to avoid double counting.
The total amortisation of the acquired technology, mining rights, and customer relationships in the current reporting period amounts to €11.2 million (11-12/2017: €2.2 million). The total depreciation of property, plant and equipment increased by €37.1 million in 2018 (11-12/2017: €6.3 million) as a result of the fair value adjustments.
A liability for an unfavourable contract was recognised as at the previous reporting date, the value of which has been adjusted and final-ised during the measurement period. The fair value of the liability amounts to €109.3 million. This value was calculated using a discount-ed cash flow model based on foregone profits compared to market conditions, the term of the contract, assumptions of future costs and an appropriate discount rate. The provision for an unfavourable contract has been amortised by €10.0 million (11-12/2017: €1.6 million) in other income and €(8.7) million (11-12/2017: €(1.0) million) were accrued as interest expense in the current reporting period.
The Group was required – in accordance with the share purchase agreement (SPA) and Brazilian laws and regulations – to make a man-datory public offer in Brazil which had to be addressed to all remaining Magnesita shareholders and had to be made on the same terms and conditions as those made available to the Sellers under the SPA, including as to purchase price and form of consideration. The Group decided to combine the mandatory offer with a so-called “delisting tender offer” in an Integrated Tender Offer (ITO) and has filed with the Brazilian Securities Commission the respective request. The launch of the ITO was communicated to the minority shareholders on 10 November 2018.
Magnesita shareholders received the option of selling each Magnesita share in exchange of: (i) R$18.46, adjusted by SELIC (the Brazilian benchmark interest rate) from 26 October 2017 until the date of the settlement of the auction of the Integrated Tender Offer, plus 0.1998 RHI Magnesita shares or (ii) a cash-only alternative consideration.
A N N U A L R E P O R T 2 0 1 8R H I M A G N E S I TA
1 1 9
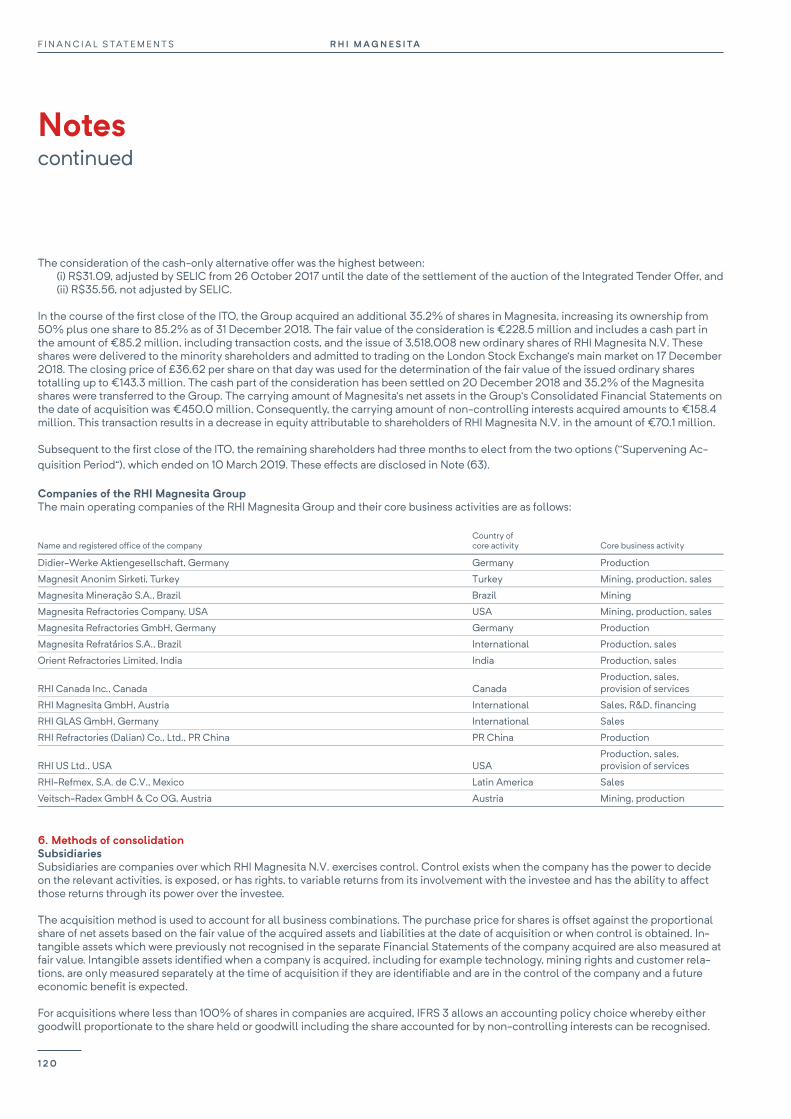
F I N A N C I A L S TAT E M E N T S R H I M AG N E S I TA
Notes continued
118
The consideration of the cash-only alternative offer was the highest between: (i) R$31.09, adjusted by SELIC from 26 October 2017 until the date of the settlement of the auction of the Integrated Tender Offer, and (ii) R$35.56, not adjusted by SELIC.
In the course of the first close of the ITO, the Group acquired an additional 35.2% of shares in Magnesita, increasing its ownership from 50% plus one share to 85.2% as of 31 December 2018. The fair value of the consideration is €228.5 million and includes a cash part in the amount of €85.2 million, including transaction costs, and the issue of 3,518,008 new ordinary shares of RHI Magnesita N.V. These shares were delivered to the minority shareholders and admitted to trading on the London Stock Exchange's main market on 17 December 2018. The closing price of £36.62 per share on that day was used for the determination of the fair value of the issued ordinary shares totalling up to €143.3 million. The cash part of the consideration has been settled on 20 December 2018 and 35.2% of the Magnesita shares were transferred to the Group. The carrying amount of Magnesita’s net assets in the Group’s Consolidated Financial Statements on the date of acquisition was €450.0 million. Consequently, the carrying amount of non-controlling interests acquired amounts to €158.4 million. This transaction results in a decrease in equity attributable to shareholders of RHI Magnesita N.V. in the amount of €70.1 million.
Subsequent to the first close of the ITO, the remaining shareholders had three months to elect from the two options (‘‘Supervening Ac-quisition Period“), which ended on 10 March 2019. These effects are disclosed in Note (63).
Companies of the RHI Magnesita Group The main operating companies of the RHI Magnesita Group and their core business activities are as follows:
Name and registered office of the company Country of core activity Core business activity
Didier-Werke Aktiengesellschaft, Germany Germany Production
Magnesit Anonim Sirketi, Turkey Turkey Mining, production, sales
Magnesita Mineração S.A., Brazil Brazil Mining
Magnesita Refractories Company, USA USA Mining, production, sales
Magnesita Refractories GmbH, Germany Germany Production
Magnesita Refratários S.A., Brazil International Production, sales
Orient Refractories Limited, India India Production, sales
RHI Canada Inc., Canada Canada Production, sales, provision of services
RHI Magnesita GmbH, Austria International Sales, R&D, financing
RHI GLAS GmbH, Germany International Sales
RHI Refractories (Dalian) Co., Ltd., PR China PR China Production
RHI US Ltd., USA USA Production, sales, provision of services
RHI-Refmex, S.A. de C.V., Mexico Latin America Sales
Veitsch-Radex GmbH & Co OG, Austria Austria Mining, production
6. Methods of consolidation Subsidiaries Subsidiaries are companies over which RHI Magnesita N.V. exercises control. Control exists when the company has the power to decide on the relevant activities, is exposed, or has rights, to variable returns from its involvement with the investee and has the ability to affect those returns through its power over the investee.
The acquisition method is used to account for all business combinations. The purchase price for shares is offset against the proportional share of net assets based on the fair value of the acquired assets and liabilities at the date of acquisition or when control is obtained. In-tangible assets which were previously not recognised in the separate Financial Statements of the company acquired are also measured at fair value. Intangible assets identified when a company is acquired, including for example technology, mining rights and customer rela-tions, are only measured separately at the time of acquisition if they are identifiable and are in the control of the company and a future economic benefit is expected.
For acquisitions where less than 100% of shares in companies are acquired, IFRS 3 allows an accounting policy choice whereby either goodwill proportionate to the share held or goodwill including the share accounted for by non-controlling interests can be recognised.
R H I M A G N E S I TAF I N A N C I A L S TAT E M E N T S
1 2 0

R H I M AG N E S I TA A N N U A L R E P O R T 2 0 1 8
119
This accounting policy choice can be exercised for each acquisition. For the acquisition of Magnesita, non-controlling interests have been measured at their proportionate share of Magnesita’s identifiable net assets.
If the initial accounting for a business combination is incomplete by the end of the reporting period in which the combination occurs, the Group reports provisional amounts for the items for which the accounting is incomplete. Those provisional amounts are adjusted within twelve months of the acquisition to reflect new information about facts and circumstances that existed as of the acquisition date.
After completing the purchase price allocation, the determined goodwill is allocated to the relevant cash-generating unit and tested for impairment. In accordance with the provisions of IFRS 3, negative goodwill is immediately recognised to profit or loss in other income after renewed measurement of the identifiable assets, liabilities and contingent liabilities.
Net assets of subsidiaries not attributable to RHI Magnesita N.V. are shown separately under equity as non-controlling interests. The basis for non-controlling interests is the equity after adjustment to the accounting and measurement principles of the RHI Magnesita Group and proportional consolidation entries.
Transaction costs which are directly related to business combinations are expensed as incurred. Contingent consideration included in the purchase price is recorded at fair value at initial consolidation.
When additional shares are acquired in entities already included in the Consolidated Financial Statements as subsidiaries, the difference between the purchase price and the proportional carrying amount in the subsidiary’s net assets is offset against shareholders’ equity. Gains and losses from the sale of shares are recorded in equity unless they lead to a loss of control.
For step acquisitions the difference between the carrying amount to be transferred and the fair value at initial full consolidation, is real-ised through profit or loss.
All intragroup results are fully eliminated.
In accordance with IAS 12, deferred taxes are calculated on temporary differences arising from the consolidation.
Subsidiaries are deconsolidated on the day control ends.
Joint ventures and associates Shares in joint ventures and associates are accounted for using the equity method. A joint venture is a joint arrangement between the RHI Magnesita Group and one or several other partners whereby the parties that have joint control over the arrangement have rights to the net assets of the arrangement.
An associate is an entity over which the RHI Magnesita Group has significant influence. Significant influence is the power to participate in the investee’s financial and operating policy decisions without control or joint control. There is the rebuttable presumption that if a com-pany holds directly or indirectly 20% of the shares of the investee or has other abilities (e.g. through seats in the supervisory board) to influence the company’s financial and operating policy decisions it has significant influence.
At the date of acquisition, a positive difference between the acquisition costs and the share in the fair values of identified assets and lia-bilities of the joint ventures and associates is determined and recognised as goodwill. Goodwill is shown as part of investments in joint ventures and associates in the Statement of Financial Position.
The acquisition cost of investments accounted for using the equity method is adjusted each year to reflect the change in the equity of the individual joint venture or associate that is attributable to the RHI Magnesita Group. Unrealised intragroup results from transactions are offset against the carrying amount of the investment on a pro-rata basis during consolidation, if material.
RHI Magnesita examines at every reporting date whether there exist any objective indications of an impairment of the shares in joint ven-tures and associates. If such indications exist, the required impairment is determined as the difference between the recoverable amount and the carrying amount of the joint ventures and associates and recognised in profit and loss in the item share of profit of joint ventures and associates.
The Financial Statements of the companies accounted for using the equity method are prepared in accordance with uniform accounting and measurement methods throughout the Group.
A N N U A L R E P O R T 2 0 1 8R H I M A G N E S I TA
1 2 1
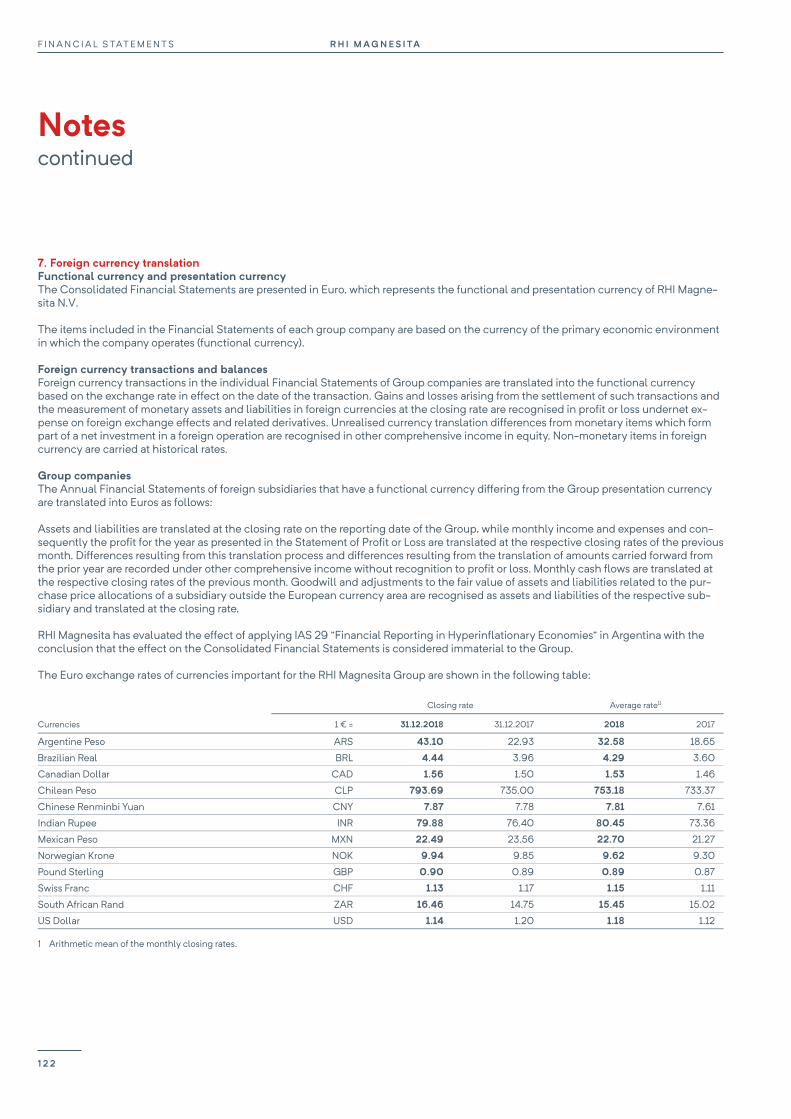
F I N A N C I A L S TAT E M E N T S R H I M AG N E S I TA
Notes continued
120
7. Foreign currency translation Functional currency and presentation currency The Consolidated Financial Statements are presented in Euro, which represents the functional and presentation currency of RHI Magne-sita N.V.
The items included in the Financial Statements of each group company are based on the currency of the primary economic environment in which the company operates (functional currency).
Foreign currency transactions and balances Foreign currency transactions in the individual Financial Statements of Group companies are translated into the functional currency based on the exchange rate in effect on the date of the transaction. Gains and losses arising from the settlement of such transactions and the measurement of monetary assets and liabilities in foreign currencies at the closing rate are recognised in profit or loss undernet ex-pense on foreign exchange effects and related derivatives. Unrealised currency translation differences from monetary items which form part of a net investment in a foreign operation are recognised in other comprehensive income in equity. Non-monetary items in foreign currency are carried at historical rates.
Group companies The Annual Financial Statements of foreign subsidiaries that have a functional currency differing from the Group presentation currency are translated into Euros as follows:
Assets and liabilities are translated at the closing rate on the reporting date of the Group, while monthly income and expenses and con-sequently the profit for the year as presented in the Statement of Profit or Loss are translated at the respective closing rates of the previous month. Differences resulting from this translation process and differences resulting from the translation of amounts carried forward from the prior year are recorded under other comprehensive income without recognition to profit or loss. Monthly cash flows are translated at the respective closing rates of the previous month. Goodwill and adjustments to the fair value of assets and liabilities related to the pur-chase price allocations of a subsidiary outside the European currency area are recognised as assets and liabilities of the respective sub-sidiary and translated at the closing rate.
RHI Magnesita has evaluated the effect of applying IAS 29 “Financial Reporting in Hyperinflationary Economies” in Argentina with the conclusion that the effect on the Consolidated Financial Statements is considered immaterial to the Group.
The Euro exchange rates of currencies important for the RHI Magnesita Group are shown in the following table:
Closing rate Average rate1)
Currencies 1 € = 31.12.2018 31.12.2017 2018 2017
Argentine Peso ARS 43.10 22.93 32.58 18.65
Brazilian Real BRL 4.44 3.96 4.29 3.60
Canadian Dollar CAD 1.56 1.50 1.53 1.46
Chilean Peso CLP 793.69 735.00 753.18 733.37
Chinese Renminbi Yuan CNY 7.87 7.78 7.81 7.61
Indian Rupee INR 79.88 76.40 80.45 73.36
Mexican Peso MXN 22.49 23.56 22.70 21.27
Norwegian Krone NOK 9.94 9.85 9.62 9.30
Pound Sterling GBP 0.90 0.89 0.89 0.87
Swiss Franc CHF 1.13 1.17 1.15 1.11
South African Rand ZAR 16.46 14.75 15.45 15.02
US Dollar USD 1.14 1.20 1.18 1.12
1 Arithmetic mean of the monthly closing rates.
R H I M A G N E S I TAF I N A N C I A L S TAT E M E N T S
1 2 2
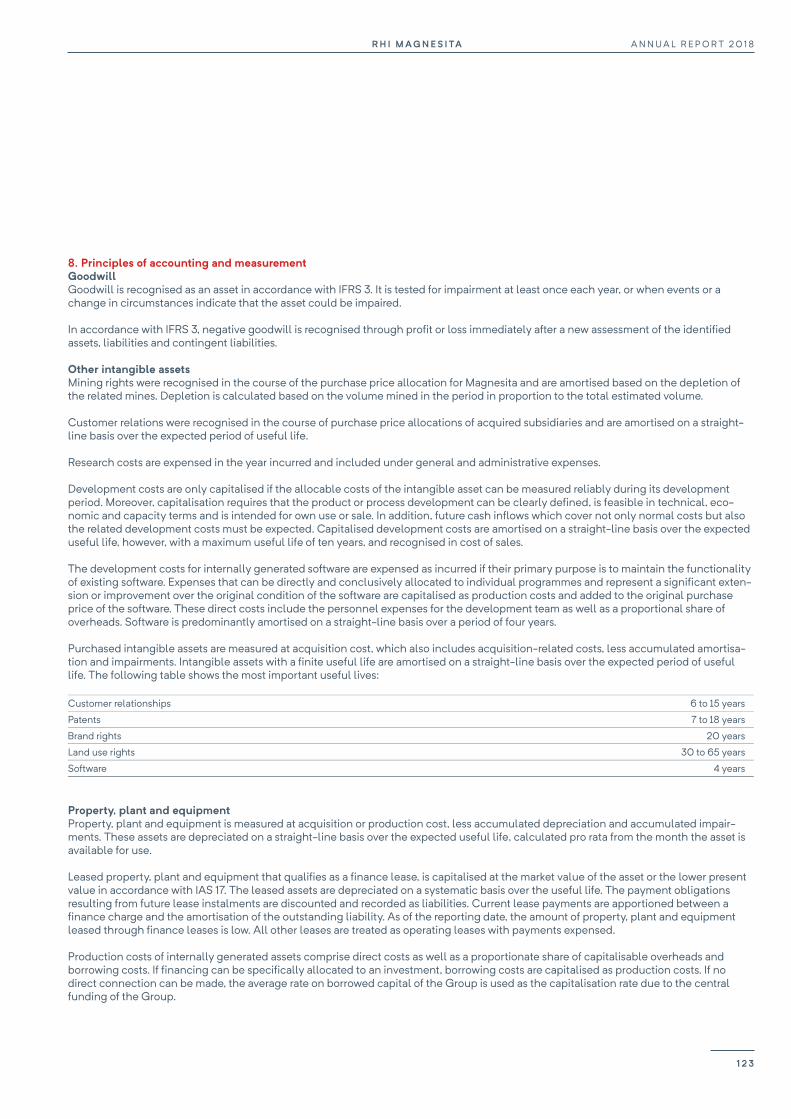
R H I M AG N E S I TA A N N U A L R E P O R T 2 0 1 8
121
8. Principles of accounting and measurement Goodwill Goodwill is recognised as an asset in accordance with IFRS 3. It is tested for impairment at least once each year, or when events or a change in circumstances indicate that the asset could be impaired.
In accordance with IFRS 3, negative goodwill is recognised through profit or loss immediately after a new assessment of the identified assets, liabilities and contingent liabilities.
Other intangible assets Mining rights were recognised in the course of the purchase price allocation for Magnesita and are amortised based on the depletion of the related mines. Depletion is calculated based on the volume mined in the period in proportion to the total estimated volume.
Customer relations were recognised in the course of purchase price allocations of acquired subsidiaries and are amortised on a straight-line basis over the expected period of useful life.
Research costs are expensed in the year incurred and included under general and administrative expenses.
Development costs are only capitalised if the allocable costs of the intangible asset can be measured reliably during its development period. Moreover, capitalisation requires that the product or process development can be clearly defined, is feasible in technical, eco-nomic and capacity terms and is intended for own use or sale. In addition, future cash inflows which cover not only normal costs but also the related development costs must be expected. Capitalised development costs are amortised on a straight-line basis over the expected useful life, however, with a maximum useful life of ten years, and recognised in cost of sales.
The development costs for internally generated software are expensed as incurred if their primary purpose is to maintain the functionality of existing software. Expenses that can be directly and conclusively allocated to individual programmes and represent a significant exten-sion or improvement over the original condition of the software are capitalised as production costs and added to the original purchase price of the software. These direct costs include the personnel expenses for the development team as well as a proportional share of overheads. Software is predominantly amortised on a straight-line basis over a period of four years.
Purchased intangible assets are measured at acquisition cost, which also includes acquisition-related costs, less accumulated amortisa-tion and impairments. Intangible assets with a finite useful life are amortised on a straight-line basis over the expected period of useful life. The following table shows the most important useful lives:
Customer relationships 6 to 15 years
Patents 7 to 18 years
Brand rights 20 years
Land use rights 30 to 65 years
Software 4 years
Property, plant and equipment Property, plant and equipment is measured at acquisition or production cost, less accumulated depreciation and accumulated impair-ments. These assets are depreciated on a straight-line basis over the expected useful life, calculated pro rata from the month the asset is available for use.
Leased property, plant and equipment that qualifies as a finance lease, is capitalised at the market value of the asset or the lower present value in accordance with IAS 17. The leased assets are depreciated on a systematic basis over the useful life. The payment obligations resulting from future lease instalments are discounted and recorded as liabilities. Current lease payments are apportioned between a finance charge and the amortisation of the outstanding liability. As of the reporting date, the amount of property, plant and equipment leased through finance leases is low. All other leases are treated as operating leases with payments expensed.
Production costs of internally generated assets comprise direct costs as well as a proportionate share of capitalisable overheads and borrowing costs. If financing can be specifically allocated to an investment, borrowing costs are capitalised as production costs. If no direct connection can be made, the average rate on borrowed capital of the Group is used as the capitalisation rate due to the central funding of the Group.
A N N U A L R E P O R T 2 0 1 8R H I M A G N E S I TA
1 2 3

F I N A N C I A L S TAT E M E N T S R H I M AG N E S I TA
Notes continued
122
Expected demolition and disposal costs at the end of an asset’s useful life are capitalised as part of acquisition cost and recorded as a provision. The criteria for this treatment are a legal or constructive obligation towards a third party and the ability to prepare a reliable estimate.
Real estate, land and plant under construction are not depreciated. Depreciation of other material property, plant and equipment is based on the following useful lives in the RHI Magnesita Group:
Factory and office buildings 15 to 50 years
Land improvement 8 to 30 years
Crusher machines and mixing facilities 8 to 20 years
Presses 10 to 12 years
Tunnel, rotary and shaft kilns 50 years
Other calcining and drying kilns 20 to 30 years
Cars, other plant, furniture and fixtures 3 to 35 years
The residual values and economic useful lives are reviewed regularly and adjusted if necessary.
When components of plant or equipment have to be replaced at regular intervals, the relevant replacement costs are capitalised as in-curred if the criteria per IAS 16 have been met. The carrying amount of the replaced components is derecognised. Regular maintenance and repair costs are expensed as incurred.
Gains or losses from the disposal of property, plant and equipment, which result as the difference between the net realisable value and the carrying amount, are recognised as income or expense in the Consolidated Statement of Profit or Loss.
Impairment of property, plant and equipment, goodwill and other intangible assets Property, plant and equipment and intangible assets, including goodwill, are tested for impairment if there is any indication that the value of these items may be impaired. Intangible assets with an indefinite useful life and goodwill are tested for impairment at least annually.
An asset is considered to be impaired if its recoverable amount is less than the carrying amount. The recoverable amount of an asset is the higher of its fair value less costs of disposal and its value in use (present value of future cash flows). If the carrying amount is higher than the recoverable amount, an impairment loss equivalent to the resulting difference is recognised in the Statement of Profit or Loss. If the reason for an impairment loss recognised in the past for property, plant and equipment and for other intangible assets ceases to exist, a reversal of impairment on the amortised acquisition and production costs is recognised to profit or loss.
In the case of impairments related to cash-generating units (CGU) which contain goodwill, existing goodwill is initially reduced. If the required impairment exceeds the carrying amount of goodwill, the difference is apportioned proportionately to the remaining non-current tangible and intangible assets of the CGU. Reversals of impairment losses recognised on goodwill are not permitted and are therefore not considered. The effects of impairment tests at the CGU level are shown separately in the Statement of Profit or Loss.
If there is an indication for an impairment of a specific asset, only this specific asset will be tested for impairment. The recoverable amount is determined through fair value. If the fair value is lower than the carrying amount, an impairment loss is recorded in EBIT or, in the case of restructuring, in restructuring costs.
Cash-generating units (CGU) In the RHI Magnesita Group the individual assets do not generate cash inflows independent of one another; therefore, no recoverable amount can be presented for individual assets. As a result, the assets are combined in CGUs, which largely generate independent cash inflows. These units are combined in strategic business units and reflect the market presence and the market appearance and are as such responsible for cash inflows. CGU's are determined based on group of assets that can generate cash inflows independent of other assets.
The organisational structures of the Group reflect these units. In addition to the joint management and control of the business activities in each unit, the sales know-how, the knowledge of RHI Magnesita’s long-standing customer relationships or knowledge of the customer’s production facilities and processes further support these units. Product knowledge is manifested in the application-oriented knowledge of chemical, physical and thermal properties of RHI Magnesita products. The services offered extend over the life cycle of RHI Magnesita products at the customer’s plant, from the appropriate installation and support of optimal operations, to environmentally sound disposal with the customer or the sustainable reuse in RHI Magnesita’s production process. These factors determine cash inflow to a significant extent and consequently form the basis for the CGU structures of RHI Magnesita.
R H I M A G N E S I TAF I N A N C I A L S TAT E M E N T S
1 2 4

R H I M AG N E S I TA A N N U A L R E P O R T 2 0 1 8
123
The CGUs of the strategic business unit Steel are Linings and Flow Control. These two units are determined according to the production stages in the process of steel production.
In the Industrial Division, each industry line of business (glass, cement/lime, non-ferrous metals and environment, energy, chemicals) forms a separate CGU. All raw material producing facilities with the exception of Norway are combined in one CGU.
The plant in Porsgrunn, Norway, is not included in the raw materials unit, but treated as a separate CGU because a management team was installed specifically for the coordination and implementation of the optimisation measures due to the dimension and the special situa-tion at the Porsgrunn plant. This organisation goes beyond plant management and also includes sub-tasks of the administration process-es.
As in the previous year, the impairment test is based on the value in use; the recoverable amount is determined using the discounted cash flow method and incorporates the terminal value. The detailed planning of the first five years is congruent with the strategic business and financial planning. Based on the detailed planning period, it is geared to a steady-state business development, which balances out possi-ble economic or other non-sustainable fluctuations in the detailed planning period and forms the basis for the calculation of the terminal value. As in the previous year, the terminal value is based on a growth rate derived from the difference of the current and the possible degree of utilisation of the assets.
The net cash flows are discounted using a discount rate that is calculated taking into account the weighted average cost of capital of comparable companies (peer group); the corresponding parameters are derived from capital market information. In addition, country-specific risk premiums are considered in the weighted average cost of capital.The discount rate ranges between 10.1% and 13.0% in the year 2018. In the previous year, the discount rates ranged between 5.7% and 8.6%. The increase of the discount rate resulted from annual update of the peer group parameters as well as considering the location of the CGU’s assets (as a cash outflows originator) in the discount rate determination methodology.
Composition of estimated future cash flows The estimates of future cash flows include forecasts of the cash flows from continued use. If assets are disposed at the end of their useful life, the related cash flows are also included in the forecasts.
A simplified statement of cash flows serves to determine the cash flows on the basis of strategic business and financial planning. The forecasts include cash flows from future maintenance investments. Expansion investments are only taken into account when there has been a significant cash outflow or significant payment obligations have been entered into due to services received and it is sufficiently certain that the investment measure will be completed. All other expansion investments are not considered; this applies in particular to expansion investments that have been decided on but not begun.
Working capital is included in the carrying amount of the CGU; therefore, the recoverable amount only takes into account changes in working capital.
Basis for Planning Basis for the impairment test was the Long Term Plan 2019 to 2025, which was approved by the Board, and developed with the growth rates used in the forward-looking business plan. To forecast the CGUs’ cash flows, management predicts the growth rate using external sources for the development of the customer’s industries and expert assumptions. This includes forecasts about the regional growth of the steel production and the output of the non-steel clients. In combination with the development of the specific refractory consump-tion, which considers also technological improvements, the growth rates for the individual CGUs are determined.
2018 2017
Discount rate
before Tax Perpetual annuity
growth rate Goodwill
in € million Discount rate
before tax Perpetual annuity
growth rate Goodwill
in € million
Steel Division - Linings 11.3% 0.9% 88.4 8.6% 0.9% 90.1
Steel Division - Flow Control 11.3% 0.9% 27.3 8.5% 0.9% 28.3
The remaining goodwill of €1.7 million (31.12.2017: €1.8 million) is spread among the remaining CGU's, all of them having sufficient head-room.
A N N U A L R E P O R T 2 0 1 8R H I M A G N E S I TA
1 2 5
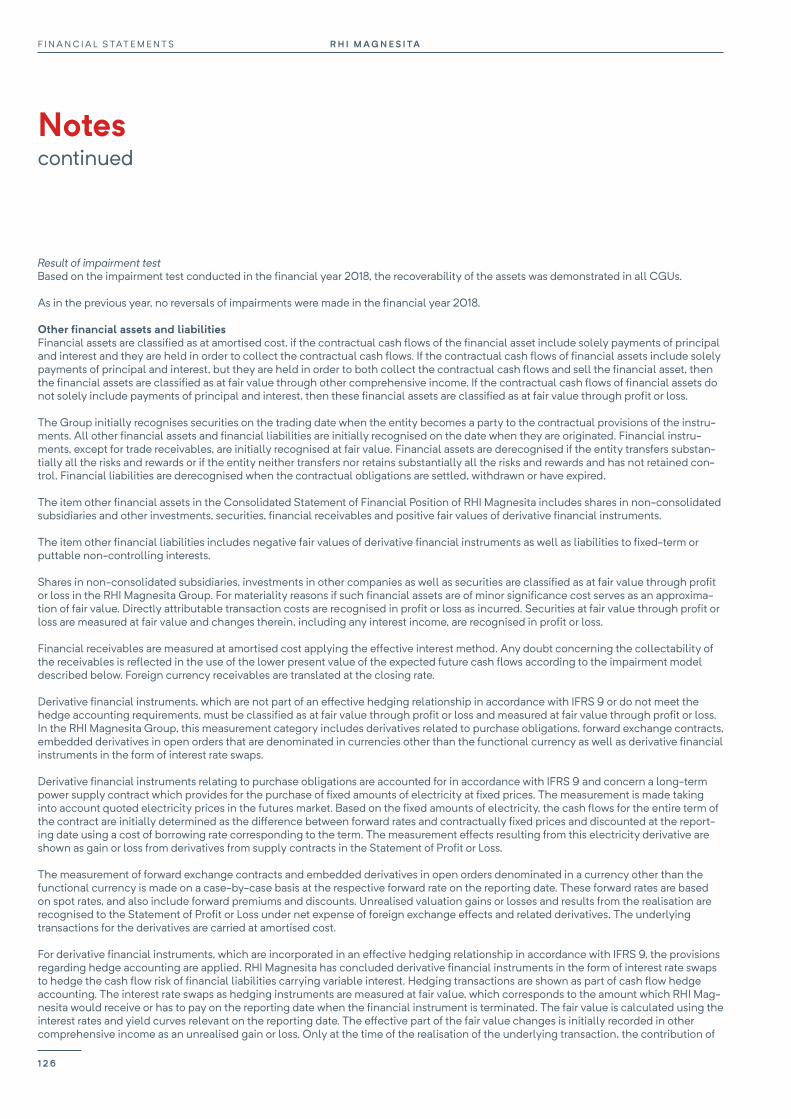
F I N A N C I A L S TAT E M E N T S R H I M AG N E S I TA
Notes continued
124
Result of impairment test Based on the impairment test conducted in the financial year 2018, the recoverability of the assets was demonstrated in all CGUs.
As in the previous year, no reversals of impairments were made in the financial year 2018.
Other financial assets and liabilities Financial assets are classified as at amortised cost, if the contractual cash flows of the financial asset include solely payments of principal and interest and they are held in order to collect the contractual cash flows. If the contractual cash flows of financial assets include solely payments of principal and interest, but they are held in order to both collect the contractual cash flows and sell the financial asset, then the financial assets are classified as at fair value through other comprehensive income. If the contractual cash flows of financial assets do not solely include payments of principal and interest, then these financial assets are classified as at fair value through profit or loss.
The Group initially recognises securities on the trading date when the entity becomes a party to the contractual provisions of the instru-ments. All other financial assets and financial liabilities are initially recognised on the date when they are originated. Financial instru-ments, except for trade receivables, are initially recognised at fair value. Financial assets are derecognised if the entity transfers substan-tially all the risks and rewards or if the entity neither transfers nor retains substantially all the risks and rewards and has not retained con-trol. Financial liabilities are derecognised when the contractual obligations are settled, withdrawn or have expired.
The item other financial assets in the Consolidated Statement of Financial Position of RHI Magnesita includes shares in non-consolidated subsidiaries and other investments, securities, financial receivables and positive fair values of derivative financial instruments.
The item other financial liabilities includes negative fair values of derivative financial instruments as well as liabilities to fixed-term or puttable non-controlling interests.
Shares in non-consolidated subsidiaries, investments in other companies as well as securities are classified as at fair value through profit or loss in the RHI Magnesita Group. For materiality reasons if such financial assets are of minor significance cost serves as an approxima-tion of fair value. Directly attributable transaction costs are recognised in profit or loss as incurred. Securities at fair value through profit or loss are measured at fair value and changes therein, including any interest income, are recognised in profit or loss.
Financial receivables are measured at amortised cost applying the effective interest method. Any doubt concerning the collectability of the receivables is reflected in the use of the lower present value of the expected future cash flows according to the impairment model described below. Foreign currency receivables are translated at the closing rate.
Derivative financial instruments, which are not part of an effective hedging relationship in accordance with IFRS 9 or do not meet the hedge accounting requirements, must be classified as at fair value through profit or loss and measured at fair value through profit or loss. In the RHI Magnesita Group, this measurement category includes derivatives related to purchase obligations, forward exchange contracts, embedded derivatives in open orders that are denominated in currencies other than the functional currency as well as derivative financial instruments in the form of interest rate swaps.
Derivative financial instruments relating to purchase obligations are accounted for in accordance with IFRS 9 and concern a long-term power supply contract which provides for the purchase of fixed amounts of electricity at fixed prices. The measurement is made taking into account quoted electricity prices in the futures market. Based on the fixed amounts of electricity, the cash flows for the entire term of the contract are initially determined as the difference between forward rates and contractually fixed prices and discounted at the report-ing date using a cost of borrowing rate corresponding to the term. The measurement effects resulting from this electricity derivative are shown as gain or loss from derivatives from supply contracts in the Statement of Profit or Loss.
The measurement of forward exchange contracts and embedded derivatives in open orders denominated in a currency other than the functional currency is made on a case-by-case basis at the respective forward rate on the reporting date. These forward rates are based on spot rates, and also include forward premiums and discounts. Unrealised valuation gains or losses and results from the realisation are recognised to the Statement of Profit or Loss under net expense of foreign exchange effects and related derivatives. The underlying transactions for the derivatives are carried at amortised cost.
For derivative financial instruments, which are incorporated in an effective hedging relationship in accordance with IFRS 9, the provisions regarding hedge accounting are applied. RHI Magnesita has concluded derivative financial instruments in the form of interest rate swaps to hedge the cash flow risk of financial liabilities carrying variable interest. Hedging transactions are shown as part of cash flow hedge accounting. The interest rate swaps as hedging instruments are measured at fair value, which corresponds to the amount which RHI Mag-nesita would receive or has to pay on the reporting date when the financial instrument is terminated. The fair value is calculated using the interest rates and yield curves relevant on the reporting date. The effective part of the fair value changes is initially recorded in other comprehensive income as an unrealised gain or loss. Only at the time of the realisation of the underlying transaction, the contribution of
R H I M A G N E S I TAF I N A N C I A L S TAT E M E N T S
1 2 6

R H I M AG N E S I TA A N N U A L R E P O R T 2 0 1 8
125
the hedging instrument is shown in the Statement of Profit or Loss. Ineffective parts of the fair value changes of cash flow hedges are recognised immediately in the Statement of Profit or Loss. If the underlying transaction is no longer expected to take place, the accumu-lated amount previously recorded in other comprehensive income is reclassified to the Statement of Profit or Loss.
Capital shares of non-controlling interests in subsidiaries with a fixed term are recognised under other financial liabilities in the Consoli-dated Statement of Financial Position in accordance with IAS 32. The liabilities are measured at amortised cost. The share of profit at-tributable to non-controlling interests is recognised under other net financial expenses in the Statement of Profit or Loss. Dividend pay-ments to non-controlling interests reduce liabilities.
Furthermore, the RHI Magnesita Group has entered into purchase obligations with non-controlling shareholders of a subsidiary. Based on these agreements, the shareholders receive the right to tender their shares at any time on previously defined conditions. In this case, IAS 32 provides for carrying a liability in the amount of the probable future exercise price. The difference between the estimated liability and the carrying amount of the non-controlling interest was recognised to equity at the time of initial recognition without affecting profit or loss. Subsequently, the liability to puttable non-controlling interests is measured at amortised cost and changes are recorded in net fi-nance costs.
Impairment of financial assets Impairment of financial instruments is based on expected credit losses (ECL). Expected credit losses are defined as the difference be-tween all contractual cash flows the entity is entitled to according to the contract and the cash flows that the entity expects to receive. The measurement of expected credit losses is generally a function of the probability of default, loss given default and the exposure at default.
RHI Magnesita recognises a loss allowance for expected credit losses on investments in debt instruments that are measured at amortised cost, trade receivables and contract assets. The amount of expected credit losses is updated at each reporting date to reflect changes in credit risk since initial recognition of the respective financial instrument.
The Group recognises lifetime ECL for trade receivables and contract assets by applying the simplified approach. The expected credit losses on these financial assets are generally estimated using a provision matrix based on the Group’s historical credit loss experience for customer groups located in different geographic regions. Forward-looking information is incorporated in the determination of the appli-cable loss rates for trade receivables. For the Group, the general economic development of the countries in which it sells its goods and services is the relevant for the determination if adjustment of the historical loss rates is necessary.
For all other financial instruments, the Group recognises lifetime ECL when there has been a significant increase in credit risk since initial recognition. However, if the credit risk on the financial instrument has not increased significantly since initial recognition, the Group measures the loss allowance for that financial instrument at an amount equal to 12-month ECL.
Lifetime ECL represents the expected credit losses that will result from all possible default events over the expected life of a financial instrument. In contrast, 12-month ECL represents the portion of lifetime ECL that is expected to result from default events on a financial instrument that are possible within 12 months after the reporting date.
RHI Magnesita takes use of the practical expedient that if a financial instrument has an ‘investment grade’ rating that it is assumed to be of low credit risk and no significant increase in the credit risk took place and the expected credit loss is calculated using the 12 month ECL. Among other factors the Group considers a significant increase in credit risk to have taken place when contractual payments are more than 30 days past due.
The Group considers the following as constituting an event of default, hence leading to a credit-impaired financial asset:
significant financial difficulty of the issuer or the borrower; a breach of contract; the lender(s) of the borrower, for economic or contractual reasons relating to the borrower’s financial difficulty, having granted to
the borrower concessions that the lender(s) would not otherwise consider; it is becoming probable that the borrower will enter bankruptcy or other financial reorganisation; the disappearance of an active market for that financial asset because of financial difficulties.
In addition to these factors, RHI Magnesita applies the presumption in regards to trade receivables, that a default event has occurred when such receivables are 180 days past due unless the Group has reasonable and supportable information for anything different. 180 days past due are used as an objective evidence of default as this is presumed to reflect the Group’s customer industry.
A N N U A L R E P O R T 2 0 1 8R H I M A G N E S I TA
1 2 7

F I N A N C I A L S TAT E M E N T S R H I M AG N E S I TA
Notes continued
126
For those financial instruments where objective evidence of default is present an individual assessment on expected credit losses takes place.
Generally, financial instruments are written off when there is no reasonable expectation of recovery. Financial assets written off may still be subject to enforcement activities under the Group’s recovery procedures, taking into account legal advice where appropriate. Any recoveries made are recognised in profit or loss.
Deferred taxes Deferred taxes are recognised on temporary differences between the tax base and the IFRS carrying amount of assets and liabilities, tax-loss carryforwards and consolidation entries.
Deferred tax assets are recognised on temporary differences to the extent it is probable that sufficient deferred tax liabilities exist or that sufficient taxable income before the reversal of temporary differences is available for the settlement of deductible temporary differences.
Deferred taxes are recognised on temporary differences relating to shares in subsidiaries and joint ventures, unless the parent company is in a position to control the timing of the reversal of the temporary differences and it is probable that the temporary differences will not reverse. No temporary differences are recognised for financial instruments which were issued by subsidiaries to non-controlling interests and which are classified as a financial liability in accordance with IFRS.
The calculation of deferred taxes is based on the tax rate expected in the individual countries at the time the deferred tax asset is realised or the liability is settled and generally reflects the enacted or substantively enacted tax rate on the reporting date. As in the previous year, deferred taxes of the Austrian group companies are determined at the corporation tax rate of 25.0%. Deferred tax assets and liabilities of the Brazilian group companies are measured mainly at 34.0%. Tax rates from 12.5% to 34.9% (31.12.2017: 12.5% to 35.0%) were applied to the other companies.
Deferred tax assets and liabilities are offset if there is an enforceable right to offset current tax receivables against current tax liabilities, and if the deferred taxes relate to income taxes due from/to the same tax authorities.
Inventories Inventories are stated at the lower of cost or net realisable value as of the reporting date. The determination of acquisition cost of pur-chased inventories is based on the average cost. Finished goods and work in process are valued at fixed and variable production cost. The net realisable value is the estimated selling price in the ordinary course of business minus any estimated cost to complete and to sell the goods. Impairments due to reduced usability are reflected in the calculation of the net realisable value.
Trade and other current receivables Trade receivables are initially measured at the transaction price according to IFRS 15 and subsequently carried at amortised cost minus any valuation allowances. Valuation allowances are calculated in accordance with the simplified approach of the impairment model for financial instruments (see impairment of financial assets above).
Receivables denominated in foreign currencies are translated using the closing rate.
Emission certificates Emission certificates acquired for a consideration are carried at cost and recognised to profit and loss in cost of sales when used up, writ-ten down to fair value or sold. In the case of a shortfall, a provision is recognised equivalent to the fair value of the lacking emission certif-icates.
Emission certificates allocated free of charge are not accounted for. Proceeds from the sale of these rights are recognised as income.
Cash and cash equivalents Cash and cash equivalents includes cash on hand, cheques received and cash at banks with an original term of a maximum of three months. Moreover, shares in money market funds, which are only exposed to insignificant value fluctuations due to their high credit rating and investments in extremely short-term money market instruments and can be converted to defined cash amounts within a few days at any time, are also recorded under cash equivalents under IAS 7.
Cash and cash equivalents denominated in foreign currencies are translated at the closing rate.
R H I M A G N E S I TAF I N A N C I A L S TAT E M E N T S
1 2 8

R H I M AG N E S I TA A N N U A L R E P O R T 2 0 1 8
127
Disposal groups held for sale Non-current assets and disposal groups which can be sold in their present state and whose sale is highly probable are classified as held for sale. Assets and liabilities which are intended to be sold together in a single transaction represent a disposal group held for sale and are shown separately from other assets and liabilities in the Statement of Financial Position.
Non-current assets and disposal groups which are classified as held for sale are carried at the lower of fair value less costs to sell and carrying amount. Impairments are initially allocated to existing goodwill and then to the non-current assets on a pro-rata basis, based on the carrying amount of each individual asset of the disposal group. Impairments beyond that are allocated to current assets pursuant to the liquidity principle and recognised through profit or loss in the item other expenses. Non-current assets are not depreciated as long as they are classified as held for sale.
Borrowings and other financial liabilities Financial liabilities include liabilities to financial institutions and other lenders and are measured at fair value less directly attributable transaction costs at initial recognition. In subsequent measurements these liabilities are measured at amortised cost applying the effec-tive interest method. Financial liabilities in foreign currency are translated at the closing rate.
A financial liability is derecognised when the obligation under the liability is discharged (by payment or legal release), cancelled or ex-pires.
When an existing financial liability is replaced by another from the same lender on substantially different terms, or the terms of an exist-ing liability are substantially modified, such an exchange or modification is treated as the derecognition of the original liability and the recognition of a new liability. The terms are substantially different if the discounted present value of the cash flows under the new terms, including any fees paid net of any fees received and discounted using the original effective interest rate, is at least 10% different from the discounted present value of the remaining cash flows of the original financial liability. The difference in the respective carrying amounts is subsequently recognised in the Statement of Profit or Loss, including any costs or fees.
Provisions Provisions are recognised when the Group incurs a legal or constructive obligation as a result of past events, and it is probable that an outflow of resources will be required to meet this obligation, and the amount of the obligation can be reliably estimated.
Non-current provisions are measured at their discounted settlement value as of the reporting date if the discounting effect is material.
If maturities cannot be estimated, they are shown under current provisions.
Provisions for pensions With respect to post-employment benefits, a differentiation is made between defined contribution and defined benefit plans.
Defined contribution plans limit the company’s obligation to the agreed amount of contributions to earmarked pension plans. The related expenses are shown in the functional areas and thus in EBIT. No provisions are necessary.
Defined benefit plans require the company to provide the agreed amount of benefits to active and former employees and their depend-ents, with a differentiation made between pension systems financed through provisions and pension systems financed by funds.
For pension plans financed through external funds, the pension obligation according to the projected unit credit method is netted out against the fair value of the plan assets. If the plan assets are not sufficient to cover the obligation, the net obligation is recognised under provisions for pensions. However, if the plan assets exceed the obligations, the asset recognised is limited to reductions of future contribu-tion payments to the plan and is shown under other non-current assets.
The present value of defined benefit obligations for current pensions, future pension benefits and similar obligations and the related expenses are calculated separately for each plan annually by independent qualified actuaries in accordance with the provisions of IAS 19. The present value of future benefits is based on the length of service, expected wage/salary developments and pension adjustments.
The expense to be recognised in a period includes current and past service costs, settlement gains and losses, interest expenses from the interest accrued on obligations, interest income from plan assets and administration costs paid from plan assets. The net interest expense is shown separately in net finance costs. All other expenses related to defined benefit plans are allocated to the costs of the relevant functional areas.
Actuarial assumptions required to calculate these obligations, include the discount rate , increases in wages/salaries and pensions, re-tirement starting age and probability of employee turnover and actual claims. The calculation is based on local demographic parameters.
A N N U A L R E P O R T 2 0 1 8R H I M A G N E S I TA
1 2 9

F I N A N C I A L S TAT E M E N T S R H I M AG N E S I TA
Notes continued
128
Interest rates chosen on the basis of the interest on high-quality corporate bonds issued with adequate maturities and currencies are applied to determine the present value of pension obligations. In countries where there is no sufficiently liquid market for high-quality corporate bonds, the returns on government bonds are used as a basis.
The rates of increase for wages/salaries were based on an average of past years, which is also considered to be realistic for the future.
The fluctuation probabilities were estimated specific to age or according to seniority.
The retirement age used for the calculation is based on the respective statutory provisions of the country concerned. The calculation is based on the earliest possible retirement age according to the current statutory provisions of the respective country, among other things depending on gender and date of birth.
Remeasurement gains and losses are recorded net of deferred taxes under other comprehensive income in the period incurred.
Other personnel provisions Other personnel provisions include provisions for termination benefits, service anniversary bonuses, payments to semi-retirees, share-based payments and lump-sum settlements.
Provisions for termination benefits are primarily related to obligations to employees whose employment is subject to Austrian law.
Employees who joined an Austrian company before 31 December 2002 receive a one-off lump-sum termination benefit as defined by Austrian labour legislation if the employer terminates the employment relationship or when the employee retires. The termination pay-ment depends on the relevant salary at the time of the termination as well as the number of years of service and ranges between two and 12 monthly salaries. These obligations are measured in accordance with IAS 19 using the projected unit credit method applying an accu-mulation period of 25 years. Remeasurement gains and losses are recorded directly to other comprehensive income after considering tax effects and shown in the Statement of Comprehensive Income.
For employees who joined an Austrian company after 31 December 2002, employers are required to make regular contributions equal to 1.53% of the monthly wage/salary to a statutory termination benefit scheme. The company has no further obligations. Claims by employ-ees to termination benefits are filed with the statutory termination benefit scheme, while the regular contributions are treated like defined contribution pension plans and included under personnel expenses of the functional areas.
Service anniversary bonuses are one-time special payments that are dependent on the employee’s wage/salary and length of service. The employer is required by collective bargaining agreements or company agreements to make these payments after an employee has reached a certain number of uninterrupted years of service with the same company. Obligations are mainly related to service anniversary bonuses in Austrian and German group companies. Under IAS 19 service anniversary bonuses are treated as other long-term employee benefits. Provisions for service anniversary bonuses are calculated based on the projected unit credit method. Remeasurement gains or losses are recorded in the personnel costs of the functional areas in the period incurred.
Local labour laws and other similar regulations require individual group companies to create provisions for semi-retirement obligations. The obligations are partially covered by qualified plan assets and are reported on a net basis in the Statement of Financial Position.
In 2018, the Remuneration Committee of RHI Magnesita developed a new Remuneration Policy for the members of senior management of the Group. Based on this new long-term incentive programme, share-options are granted. The fair value of these options as well as any adjustments of the fair value are measured at every reporting date and recognised in equity.
Obligations for lump-sum settlements are based on company agreements in individual companies.
Other provisions Provisions for warranties are created for individual contracts at the time of the sale of the goods concerned or after the service has been provided. The amounts of the provisions are based on the expected or actual warranty claims.
Provisions for restructuring are created providing a detailed formal restructuring plan has been developed and announced prior to the reporting date or whose implementation was commenced prior to the reporting date.
R H I M A G N E S I TAF I N A N C I A L S TAT E M E N T S
1 3 0

R H I M AG N E S I TA A N N U A L R E P O R T 2 0 1 8
129
The Group recognises provisions for demolition and disposal costs and environmental damages. RHI Magnesita’s facilities and its refrac-tory, exploration and mining operations are subject to environmental and governmental laws and regulations in each of the jurisdictions in which it operates. These laws govern, among other things, reclamation or restoration of the environment in mined areas and the clean-up of contaminated properties. Provisions for demolition and disposal costs and environmental damages include the estimated demoli-tion and disposal costs of plants and buildings as well as environmental restoration costs arising from mining activities, based on the present value of estimated cash flows of the expected costs. The estimated future costs of deactivation of assets are reviewed annually and adjusted, if appropriate.
A provision for a contract obligation is recognised when the expected benefits to be derived from a contract are lower than the unavoida-ble cost of meeting its obligations under the contract. The non-current provisions are measured at the present value of the unavoidable costs of meeting the obligation under the contract which exceed the economic benefits expected to arise from that contract.
Provisions for labour and civil contingencies are recognised for all risks referring to legal proceedings that represent probable loss. As-sessment of the likelihood of loss includes analysis of available evidence, including the opinion of internal and external legal advisors of the RHI Magnesita Group.
Trade payables and other current liabilities These liabilities are initially recognised at fair value, and subsequently measured at amortised cost.
Liabilities denominated in foreign currencies are translated at the closing rate.
Government grants Government grants to promote investments are recognised as deferred income and released through profit or loss over the useful life of the relevant asset distributed on a straight-line basis.
Grants that were granted as compensation for expenses or losses are recognised to profit or loss in the periods in which the subsidised expenses are incurred. In the RHI Magnesita Group, they mainly include grants for research and employee development. Grants for re-search are recorded as income in general and administrative expenses.
Revenue and expenses Revenue from the sale of goods and services is recognised at an amount that reflects the consideration to which the Group expects to be entitled in exchange for those goods or services. The transaction price is the expected consideration to be received, to the extent that it is highly probable that there will not be a significant reversal of revenue in future periods. If the consideration in a contract includes a varia-ble amount, the Group estimates the amount of consideration to which it will be entitled in exchange for transferring the goods or ser-vices to the customer. The variable consideration is estimated at contract inception and constrained until it is highly probable that a sig-nificant revenue reversal in the amount of cumulative revenue recognised will not occur when the associated uncertainty with the varia-ble consideration is subsequently resolved. The average credit term is 60 days upon transfer of goods or service. The Group is using the practical expedient in IFRS 15 and does not adjust the promised amount of consideration for the effects of a significant financing compo-nent if it expects, at contract inception, that the period between the transfer of the promised good or service to the customer and pay-ment will be one year or less. At contract inception, the Group identifies the goods or services promised in the contract and assesses which of the promised goods or services shall be identified as separate performance obligations. Promised goods or services give rise to separate performance obligations if they are capable of being distinct. Revenue is recognised as control is transferred, either over time or at a point of time. Control is defined as the ability to direct the use of and obtain substantially all of the economic benefits from an asset.
With regard to delivery contracts of refractory products the goods promised are distinct and control of the goods is passed to the custom-er typically when physical possession has been transferred to the customer. The transport service does not give rise to a separate perfor-mance obligation to which a part of revenue would have to be allocated, as this service is performed before control of the products is transferred to the customer.
In consignment arrangements, RHI Magnesita Group ships products to a customer but retains control of the goods until a predetermined event occurs. Revenue is not recognised on delivery of the products to the customer if the delivered products are held on consignment, but generally when the withdrawal of the products from the consignment stock occurs. Most of the products within consignment ar-rangements have a high stock turn rate.
A N N U A L R E P O R T 2 0 1 8R H I M A G N E S I TA
1 3 1
F I N A N C I A L S TAT E M E N T S R H I M AG N E S I TA
Notes continued
130
The Group provides services (e.g. supervision, installation) that are either sold separately or bundled together with the sale of products to a customer. Contracts for bundled sales of products and installation services are comprised of two performance obligations as the prom-ises to transfer products and provide services are capable of being distinct and separately identifiable. Accordingly, the transaction price allocated is based on the relative stand-alone selling prices of the product and services. Revenue from services is recognised over time, using an input method to measure progress towards complete satisfaction of the service, because the customer simultaneously receives and consumes the benefits provided by the Group.
Contracts for bundled sales of refractory products and non-refractory products (e.g. machines) provided to the customer free of charge comprise two performance obligations that are separately identifiable. Consequently, the Group allocates the transaction price based on the relative stand-alone selling prices of these performance obligations and also allocates revenue to the non-refractory product which is delivered free of charge.
For contracts in the Steel segment with variable payment arrangements (transaction price depends on the customer’s production perfor-mance) the management has determined that the promise to transfer each of the products and services to the customer is not separately identifiable from all the other promises in the context of such contracts. Thus, only one single performance obligation, the performance of a management refractory service, exists. Further information is provided under Note (10). With regard to these contracts, revenue is recognised over time on the basis using the output-oriented method (e.g. quantity of steel produced in the customer aggregate serviced).
Expected penalty fees from guaranteed durabilities when using refractory products are considered as a variable consideration in the form of a contract or a refund liability. Based on the expected value method, the amount of the variable consideration is estimated. The estima-tion of the variable consideration is not subject to a constraint as the Group has significant experience with promising durabilities. Thus, it is concluded that a significant reversal of revenue is highly unlikely once the uncertainty no longer exists. All other warranties guarantee that the transferred products correspond to the contractually agreed specifications and are classified as assurance type warranties. Con-sequently, no separate distinct performance obligation to the customer exists.
If transfer of goods or services to a customer is performed before the customer pays consideration or before payment is due, a contract asset, excluding any amounts presented as a receivable is recognised. A contract asset is an entity’s right to consideration in exchange for goods or services that the entity has transferred to a customer.
If a customer pays consideration before the entity transfers a good or service to the customer, the entity shall present the contract as a contract liability when the payment is made or the payment is due (whatever is earlier). A contract liability is an entity’s obligation to transfer goods or services to a customer for which the entity has received consideration (or an amount of consideration is due) from the customer.
Contract costs are the incremental costs of obtaining a contract and must be recognised as an asset if the company expects to recover those costs. As a practical expedient, RHI Magnesita expenses such costs when incurred, if the amortisation period would be 12 months or less.
In general, the term of customer contracts in accordance with IFRS 15 is no longer than one year. Therefore, the Group decided, as a practical expedient, not to disclose the remaining performance obligations for contracts with original expected duration of less than one year.
Expenses are recognised to the Statement of Profit or Loss when a service is consumed or the costs are incurred.
Interest income and expenses are recognised in accordance with the effective interest method.
Dividends from investments that are not accounted for using the equity method are recognised to profit and loss at the time the legal claim arises.
Income taxes are recognised according to the local regulations applicable to each company. Current and deferred income taxes are rec-ognised in the Statement of Profit or Loss unless they are related to items which were recorded directly in equity or in other comprehen-sive income. In such a case, income taxes are also recorded in equity or other comprehensive income.
R H I M A G N E S I TAF I N A N C I A L S TAT E M E N T S
1 3 2
R H I M AG N E S I TA A N N U A L R E P O R T 2 0 1 8
131
RHI Magnesita GmbH, Vienna, Austria, acts as the head of a corporate tax group. A tax compensation agreement was concluded in 2017 between the head of the group and eight Austrian group members. According to the group and tax compensation agreement, the mem-bers of the group have to pay a positive tax compensation of 20% of the taxable profit to the head of the group if the result is positive, as long as tax loss carry forwards exist with the head of the group; subsequently 25% of the taxable profit have to be paid. In case of a tax loss of the group member, the head of the group has to pay a negative tax compensation to the member of the group, with a rate of 12.5% being applied insofar as the loss can be utilised within the group. In case the losses of a group member were compensated (negative tax allocation payment) and this group member generates taxable income within the next three years (after compensation), the positive tax allocation amounts to 12.5%. In case of a loss in the tax group, an unused tax loss of a group member is retained and offset against future taxable profits of the group member. When the contract is terminated, a compensation payment is agreed for unused tax losses of a group member, which were allocated to the head of the group.
In Germany, Didier-Werke Aktiengesellschaft, Wiesbaden, acts as the head of a tax group for corporate and trade tax purposes. The seven tax group members are obliged to transfer their profit or loss to Didier-Werke Aktiengesellschaft based on a profit or loss transfer agreement. Additionally, Didier-Werke Aktiengesellschaft, Wiesbaden, acts as the head of a tax group for VAT purposes with nine Ger-man tax group members. Furthermore, Rearden G Holdings Eins GmbH, Hagen, acts as the head of a two-level structure tax group with four group members for corporate, trade tax and VAT purposes.
9. Segment reporting The RHI Magnesita Group comprises the operating segments Steel and Industrial. The segmentation of the business activities reflects the internal control and reporting structures and is regularly reported to the Chief Executive Officer.
The Steel segment specialises in supporting customers in the steel-producing and steel-processing industry. The Industrial segment serves customers in the glass, cement/lime, nonferrous metals and environment, energy, chemicals industries. The main activities of the two segments consist of market development, global sales of high-grade refractory bricks, mixes and special products as well as provid-ing services at the customers’ sites.
The globally located manufacturing sites, which extract and process raw materials, are combined in one organisational unit. The alloca-tion of manufacturing cost of the production plants to the Steel and Industrial Divisions is based on the supply flow.
Statements of Profit or Loss up to gross profit are available for each segment. The gross profit serves the management of the RHI Magnesi-ta Group for internal performance management. Selling and marketing expenses, general and administrative expenses, other income and expenses, profit of joint ventures, net finance costs and income taxes are managed on a group basis and are not allocated.
Segment assets include trade receivables and inventories, which are available to the operating segments and are reported to the man-agement for control and measurement, as well as property, plant and equipment, goodwill and other intangible assets, which are allocat-ed to the segments based on the capacity of the assets provided to the segments. All other assets are not allocated. The recognition of segment assets is determined on the basis of the accounting and measurement methods applied to the IFRS Consolidated Financial Statements.
Data on revenue by country are disclosed by the sites of the customers. Data on non-current assets (goodwill, intangible assets and prop-erty, plant and equipment) are disclosed on the basis of the respective locations of the companies of the RHI Magnesita Group.
10. Critical accounting judgments and key sources of estimation uncertainty The RHI Magnesita Group used forward-looking assumptions and estimates, especially with respect to business combinations, non-current assets, valuation adjustments to inventories and receivables, provisions and income taxes to a certain extent in the application of accounting and measurement methods.
The estimates are based on comparable values in the past, plan data and other findings regarding transactions to be accounted. The actual values may ultimately deviate from the assumptions and estimates made. The resulting changes in value of assets, liabilities, reve-nue and expenses are accounted for in the reporting period in which the change is made and in the affected future reporting periods.
A N N U A L R E P O R T 2 0 1 8R H I M A G N E S I TA
1 3 3

F I N A N C I A L S TAT E M E N T S R H I M AG N E S I TA
Notes continued
132
Critical accounting judgments Revenue recognition For customer contracts in the Steel segment with variable payment arrangements where transaction price depends on the customer’s production performance, (e.g. quantity of steel produced in the customer aggregate serviced) the management has determined that the promise to transfer each of the products and services to the customer is not separately identifiable from the other promises in the context of such contracts. The customer expects complete refractory management for the agreed product areas in the steel plant in order to enable steel production. Thus, only one single performance obligation, performance of a management refractory service, exists.
There are no other critical accounting judgments made in the preparation of the Consolidated Financial Statements.
Key sources of estimation uncertainty Business combinations (initial consolidation) Estimates relating to the calculation of fair values of acquired assets, liabilities and contingent liabilities are required within the context of business combinations.
If intangible assets are identified, estimates are necessary for the determination of fair values by means of discounted cash flows, includ-ing the duration, amount of future cash flows, and discount rate. When determining the fair value of land, buildings and technical plant, above all the estimate of comparability of the reference objects with the objects subject to valuation is discretionary.
When making estimates in the context of purchase price allocations on major acquisitions, RHI Magnesita consults with independent experts who accompany the execution of the discretionary decisions and record it in appraisal documents.
Impairment of intangible assets with finite useful lives and property, plant and equipment Intangible assets with a finite useful life and property, plant and equipment must be tested for impairment when events or a change in circumstances indicate that the carrying amount of an asset may not be recoverable. The carrying amounts of these assets amounted to €1,427.4 million at 31 December 2018 (31.12.2017: €1,512.9 million). In accordance with IAS 36, such impairment losses are determined through comparisons with the discounted future cash flows expected from the related assets of the cash-generating units (CGUs).
As part of the annual planning process, the impairment test is conducted for the CGUs defined in the RHI Magnesita Group, thus taking into account all changes resulting from updates of strategic planning. Sensitivity analyses are also performed as part of the impairment test. In their calculation one of the main parameters is changed as follows: increase in the discount rate by 10%, reduction in the form of the contribution margin by 10% and reduction of the growth rate in terminal value by 50%. In all CGUs, these simulations do not result in impairments.
Likewise, in all CGUs a reduction of the discount rate by 10%, an increase in profitability in the form of the contribution margin by 10% and an increase in the growth rate in terminal value by 50% do not result in reversals of impairments.
There was no triggering event in 2018.
Impairment of goodwill and other intangible assets with indefinite useful life The effect of an adverse change by plus 10% in the estimated interest rates as of 31 December 2018 or by minus 10% in the contribution margin would not result in an impairment of goodwill recognised (carrying amount 31.12.2018: €131.2 million, 31.12.2017: €38.7 million) nor in an impairment charge to intangible assets with indefinite useful lives (carrying amount at 31.12.2018 and 31.12.2017: €1.8 million).
Intangible assets and property, plant and equipment Management uses its experience to estimate the remaining useful life of an asset. The actual useful life of an asset may be impacted by an unexpected event that may result in an adjustment to the carrying amount of the asset.
Provisions for pensions and termination benefits The present value of pension and termination benefit obligations depends on a number of factors, which are based on actuarial assump-tions such as interest rates, future salary and pension increases as well as life expectancy. Due to the long-term orientation of these obli-gations, these assumptions are subject to significant uncertainties.
The following sensitivity analysis shows the change in present value of the pension and termination benefit obligations if one key param-eter changes, while the other influences are maintained constant. In reality, however, it is rather unlikely that these influences do not correlate. The present value of the pension obligations for the sensitivities shown was calculated using the same method as for the actual present value of the pension obligations (projected unit credit method).
R H I M A G N E S I TAF I N A N C I A L S TAT E M E N T S
1 3 4

R H I M AG N E S I TA A N N U A L R E P O R T 2 0 1 8
133
31.12.2018 31.12.2017
in € million
Change of assumption in percentage points
or years Pension plans Termination
benefits Pension plans Termination
benefits
Present value of the obligations 506.6 55.5 517.1 58.1
Interest rate +0.25 (14.0) (1.5) (14.9) (1.5)
(0.25) 15.0 1.5 15.7 1.6
Salary increase +0.25 0.9 1.5 0.8 1.6
(0.25) (1.7) (1.4) (0.7) (3.5)
Pension increase +0.25 10.3 - 10.6 -
(0.25) (10.1) - (10.2) -
Life expectancy +1 year 17.2 - 18.3 -
(1) year (17.3) - (23.6) -
These changes would have no immediate effect on the result of the period as remeasurement gains and losses are recorded in other comprehensive income without impact on profit or loss.
The assumptions regarding the interest rate are reviewed semi-annually; all other assumptions are reviewed at the end of the year.
Other provisions The recognition and measurement of other provisions totalling €162.2 million (31.12.2017: €209.4 million) were based on the best possi-ble estimates using the information available at the reporting date. The estimates take into account the underlying legal relationships and are performed by internal experts or, when appropriate, also by external experts. Despite the best possible assumptions and estimates, cash outflows expected at the reporting day may deviate from actual cash outflows. As soon as additional information is available, the estimates made are reviewed and provisions are also adjusted.
The majority of the provisions refers to an unfavourable contract which was recognised in the course of the acquisition of Magnesita and is mainly based on an estimate of forgone profit margins compared to market conditions which is further explained in Note (5) Group of consolidated companies.
Income taxes The calculation of income taxes of RHI Magnesita N.V. and its subsidiaries is based on the tax laws applicable in the individual countries. Due to their complexity, the tax items presented in the Consolidated Financial Statements may be subject to different interpretations by local finance authorities.
RHI Magnesita is continually adapting its global presence to better serve its customers and maintain its competitive advantage. As a re-sult, in this way the Group maintains discussions with tax authorities about functions transferred between related parties and their exit value, however due to its nature, they do not impact the Group's accounts.
When determining the amount of the capitalisable deferred tax assets, an estimate of the management is required regarding the amount of future taxable income and the expected time. Should the future taxable profit deviate by 10% from the assumption made on the re-porting date within the planning period defined for the accounting and measurement of deferred taxes, the net position of deferred tax assets amounting to €92.7 million (31.12.2017: €75.4 million) would have to be increased by €0.6 million (31.12.2017: €0.8 million) or reduced by €0.6 million (31.12.2017: €0.9 million).
A N N U A L R E P O R T 2 0 1 8R H I M A G N E S I TA
1 3 5
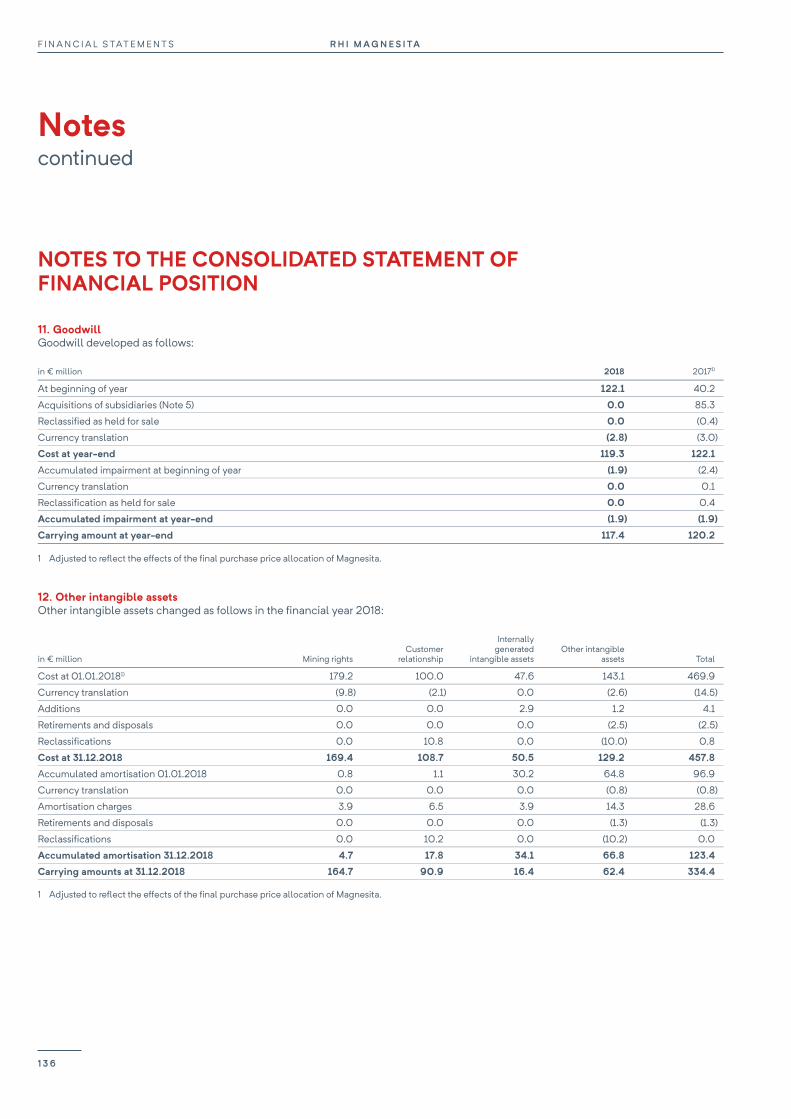
F I N A N C I A L S TAT E M E N T S R H I M AG N E S I TA
Notes continued
134
11. Goodwill Goodwill developed as follows:
in € million 2018 20171)
At beginning of year 122.1 40.2
Acquisitions of subsidiaries (Note 5) 0.0 85.3
Reclassified as held for sale 0.0 (0.4)
Currency translation (2.8) (3.0)
Cost at year-end 119.3 122.1
Accumulated impairment at beginning of year (1.9) (2.4)
Currency translation 0.0 0.1
Reclassification as held for sale 0.0 0.4
Accumulated impairment at year-end (1.9) (1.9)
Carrying amount at year-end 117.4 120.2
1 Adjusted to reflect the effects of the final purchase price allocation of Magnesita.
12. Other intangible assets Other intangible assets changed as follows in the financial year 2018:
in € million Mining rights Customer
relationship
Internally generated
intangible assets Other intangible
assets Total
Cost at 01.01.20181) 179.2 100.0 47.6 143.1 469.9
Currency translation (9.8) (2.1) 0.0 (2.6) (14.5)
Additions 0.0 0.0 2.9 1.2 4.1
Retirements and disposals 0.0 0.0 0.0 (2.5) (2.5)
Reclassifications 0.0 10.8 0.0 (10.0) 0.8
Cost at 31.12.2018 169.4 108.7 50.5 129.2 457.8
Accumulated amortisation 01.01.2018 0.8 1.1 30.2 64.8 96.9
Currency translation 0.0 0.0 0.0 (0.8) (0.8)
Amortisation charges 3.9 6.5 3.9 14.3 28.6
Retirements and disposals 0.0 0.0 0.0 (1.3) (1.3)
Reclassifications 0.0 10.2 0.0 (10.2) 0.0
Accumulated amortisation 31.12.2018 4.7 17.8 34.1 66.8 123.4
Carrying amounts at 31.12.2018 164.7 90.9 16.4 62.4 334.4
1 Adjusted to reflect the effects of the final purchase price allocation of Magnesita.
NOTES TO THE CONSOLIDATED STATEMENT OF FINANCIAL POSITION
R H I M A G N E S I TAF I N A N C I A L S TAT E M E N T S
1 3 6
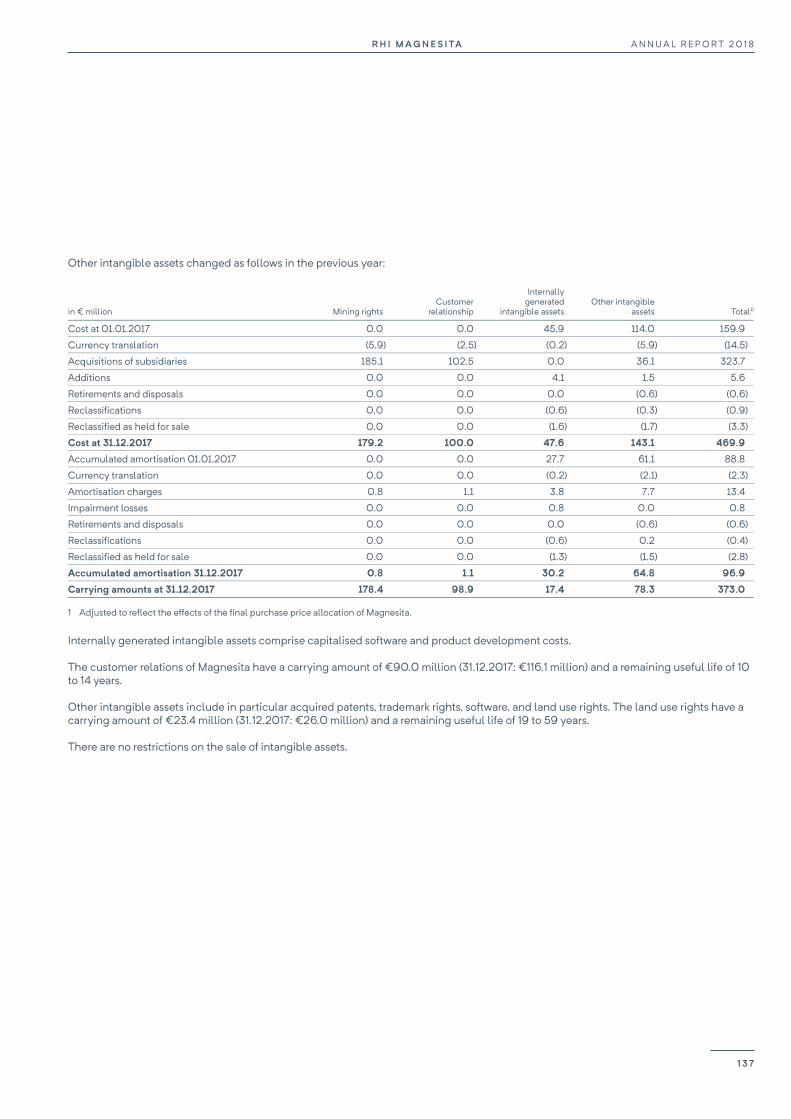
R H I M AG N E S I TA A N N U A L R E P O R T 2 0 1 8
135
Other intangible assets changed as follows in the previous year:
in € million Mining rights Customer
relationship
Internally generated
intangible assets Other intangible
assets Total1)
Cost at 01.01.2017 0.0 0.0 45.9 114.0 159.9
Currency translation (5.9) (2.5) (0.2) (5.9) (14.5)
Acquisitions of subsidiaries 185.1 102.5 0.0 36.1 323.7
Additions 0.0 0.0 4.1 1.5 5.6
Retirements and disposals 0.0 0.0 0.0 (0.6) (0.6)
Reclassifications 0.0 0.0 (0.6) (0.3) (0.9)
Reclassified as held for sale 0.0 0.0 (1.6) (1.7) (3.3)
Cost at 31.12.2017 179.2 100.0 47.6 143.1 469.9
Accumulated amortisation 01.01.2017 0.0 0.0 27.7 61.1 88.8
Currency translation 0.0 0.0 (0.2) (2.1) (2.3)
Amortisation charges 0.8 1.1 3.8 7.7 13.4
Impairment losses 0.0 0.0 0.8 0.0 0.8
Retirements and disposals 0.0 0.0 0.0 (0.6) (0.6)
Reclassifications 0.0 0.0 (0.6) 0.2 (0.4)
Reclassified as held for sale 0.0 0.0 (1.3) (1.5) (2.8)
Accumulated amortisation 31.12.2017 0.8 1.1 30.2 64.8 96.9
Carrying amounts at 31.12.2017 178.4 98.9 17.4 78.3 373.0
1 Adjusted to reflect the effects of the final purchase price allocation of Magnesita.
Internally generated intangible assets comprise capitalised software and product development costs.
The customer relations of Magnesita have a carrying amount of €90.0 million (31.12.2017: €116.1 million) and a remaining useful life of 10 to 14 years.
Other intangible assets include in particular acquired patents, trademark rights, software, and land use rights. The land use rights have a carrying amount of €23.4 million (31.12.2017: €26.0 million) and a remaining useful life of 19 to 59 years.
There are no restrictions on the sale of intangible assets.
A N N U A L R E P O R T 2 0 1 8R H I M A G N E S I TA
1 3 7
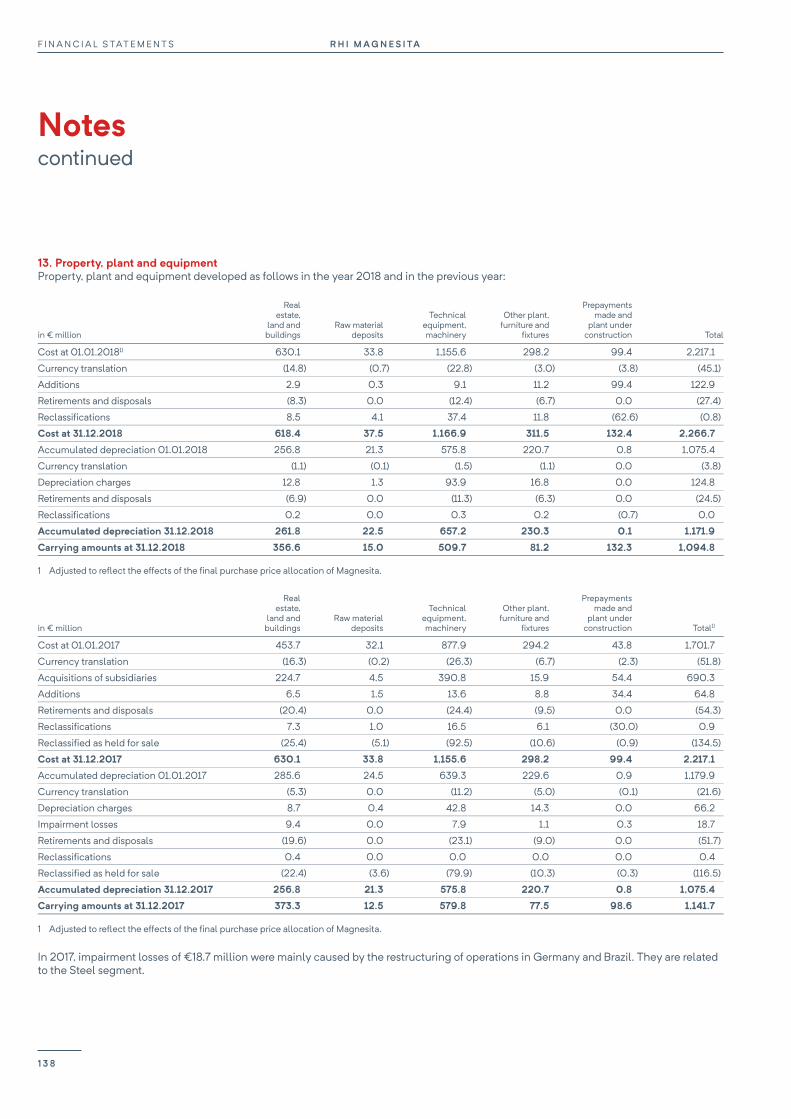
F I N A N C I A L S TAT E M E N T S R H I M AG N E S I TA
Notes continued
136
13. Property, plant and equipment Property, plant and equipment developed as follows in the year 2018 and in the previous year:
in € million
Real estate,
land and buildings
Raw material deposits
Technical equipment, machinery
Other plant, furniture and
fixtures
Prepayments made and
plant under construction Total
Cost at 01.01.20181) 630.1 33.8 1,155.6 298.2 99.4 2,217.1
Currency translation (14.8) (0.7) (22.8) (3.0) (3.8) (45.1)
Additions 2.9 0.3 9.1 11.2 99.4 122.9
Retirements and disposals (8.3) 0.0 (12.4) (6.7) 0.0 (27.4)
Reclassifications 8.5 4.1 37.4 11.8 (62.6) (0.8)
Cost at 31.12.2018 618.4 37.5 1,166.9 311.5 132.4 2,266.7
Accumulated depreciation 01.01.2018 256.8 21.3 575.8 220.7 0.8 1,075.4
Currency translation (1.1) (0.1) (1.5) (1.1) 0.0 (3.8)
Depreciation charges 12.8 1.3 93.9 16.8 0.0 124.8
Retirements and disposals (6.9) 0.0 (11.3) (6.3) 0.0 (24.5)
Reclassifications 0.2 0.0 0.3 0.2 (0.7) 0.0
Accumulated depreciation 31.12.2018 261.8 22.5 657.2 230.3 0.1 1,171.9
Carrying amounts at 31.12.2018 356.6 15.0 509.7 81.2 132.3 1,094.8
1 Adjusted to reflect the effects of the final purchase price allocation of Magnesita.
in € million
Real estate,
land and buildings
Raw material deposits
Technical equipment, machinery
Other plant, furniture and
fixtures
Prepayments made and
plant under construction Total1)
Cost at 01.01.2017 453.7 32.1 877.9 294.2 43.8 1,701.7
Currency translation (16.3) (0.2) (26.3) (6.7) (2.3) (51.8)
Acquisitions of subsidiaries 224.7 4.5 390.8 15.9 54.4 690.3
Additions 6.5 1.5 13.6 8.8 34.4 64.8
Retirements and disposals (20.4) 0.0 (24.4) (9.5) 0.0 (54.3)
Reclassifications 7.3 1.0 16.5 6.1 (30.0) 0.9
Reclassified as held for sale (25.4) (5.1) (92.5) (10.6) (0.9) (134.5)
Cost at 31.12.2017 630.1 33.8 1,155.6 298.2 99.4 2,217.1
Accumulated depreciation 01.01.2017 285.6 24.5 639.3 229.6 0.9 1,179.9
Currency translation (5.3) 0.0 (11.2) (5.0) (0.1) (21.6)
Depreciation charges 8.7 0.4 42.8 14.3 0.0 66.2
Impairment losses 9.4 0.0 7.9 1.1 0.3 18.7
Retirements and disposals (19.6) 0.0 (23.1) (9.0) 0.0 (51.7)
Reclassifications 0.4 0.0 0.0 0.0 0.0 0.4
Reclassified as held for sale (22.4) (3.6) (79.9) (10.3) (0.3) (116.5)
Accumulated depreciation 31.12.2017 256.8 21.3 575.8 220.7 0.8 1,075.4
Carrying amounts at 31.12.2017 373.3 12.5 579.8 77.5 98.6 1,141.7
1 Adjusted to reflect the effects of the final purchase price allocation of Magnesita.
In 2017, impairment losses of €18.7 million were mainly caused by the restructuring of operations in Germany and Brazil. They are related to the Steel segment.
R H I M A G N E S I TAF I N A N C I A L S TAT E M E N T S
1 3 8
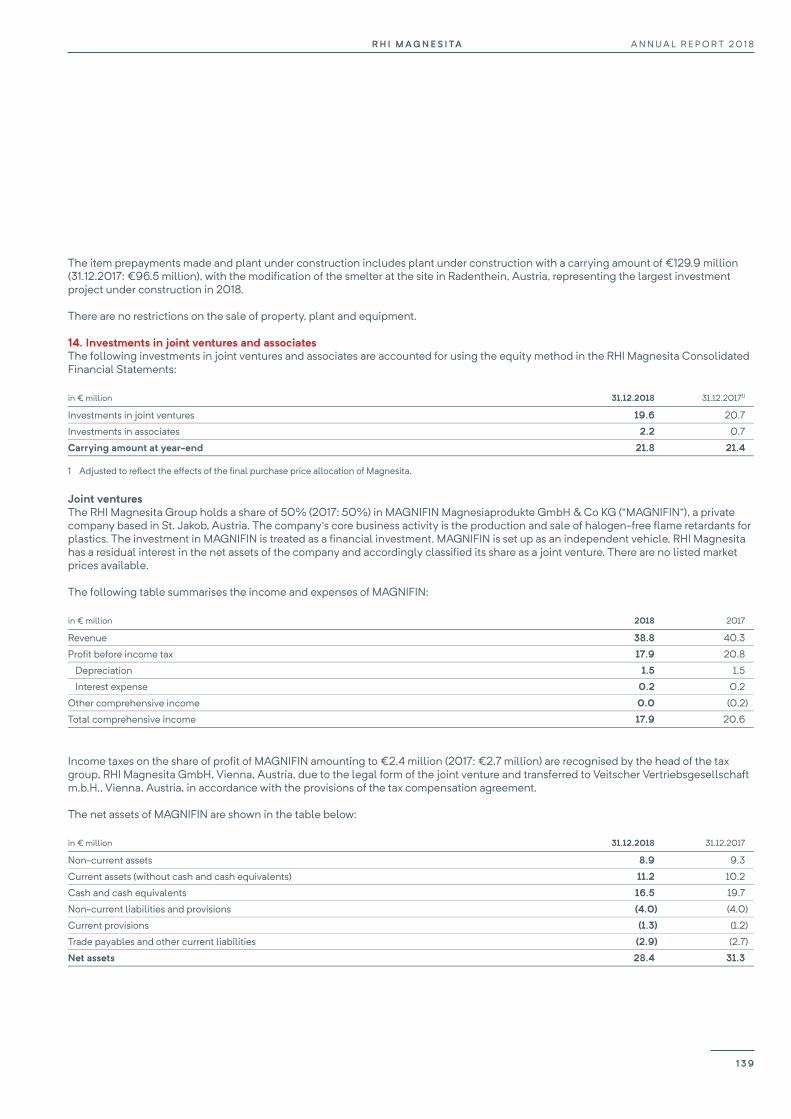
R H I M AG N E S I TA A N N U A L R E P O R T 2 0 1 8
137
The item prepayments made and plant under construction includes plant under construction with a carrying amount of €129.9 million (31.12.2017: €96.5 million), with the modification of the smelter at the site in Radenthein, Austria, representing the largest investment project under construction in 2018.
There are no restrictions on the sale of property, plant and equipment.
14. Investments in joint ventures and associates The following investments in joint ventures and associates are accounted for using the equity method in the RHI Magnesita Consolidated Financial Statements:
in € million 31.12.2018 31.12.20171)
Investments in joint ventures 19.6 20.7
Investments in associates 2.2 0.7
Carrying amount at year-end 21.8 21.4
1 Adjusted to reflect the effects of the final purchase price allocation of Magnesita.
Joint ventures The RHI Magnesita Group holds a share of 50% (2017: 50%) in MAGNIFIN Magnesiaprodukte GmbH & Co KG (“MAGNIFIN”), a private company based in St. Jakob, Austria. The company’s core business activity is the production and sale of halogen-free flame retardants for plastics. The investment in MAGNIFIN is treated as a financial investment. MAGNIFIN is set up as an independent vehicle. RHI Magnesita has a residual interest in the net assets of the company and accordingly classified its share as a joint venture. There are no listed market prices available.
The following table summarises the income and expenses of MAGNIFIN:
in € million 2018 2017
Revenue 38.8 40.3
Profit before income tax 17.9 20.8
Depreciation 1.5 1.5
Interest expense 0.2 0.2
Other comprehensive income 0.0 (0.2)
Total comprehensive income 17.9 20.6
Income taxes on the share of profit of MAGNIFIN amounting to €2.4 million (2017: €2.7 million) are recognised by the head of the tax group, RHI Magnesita GmbH, Vienna, Austria, due to the legal form of the joint venture and transferred to Veitscher Vertriebsgesellschaft m.b.H., Vienna, Austria, in accordance with the provisions of the tax compensation agreement.
The net assets of MAGNIFIN are shown in the table below:
in € million 31.12.2018 31.12.2017
Non-current assets 8.9 9.3
Current assets (without cash and cash equivalents) 11.2 10.2
Cash and cash equivalents 16.5 19.7
Non-current liabilities and provisions (4.0) (4.0)
Current provisions (1.3) (1.2)
Trade payables and other current liabilities (2.9) (2.7)
Net assets 28.4 31.3
A N N U A L R E P O R T 2 0 1 8R H I M A G N E S I TA
1 3 9
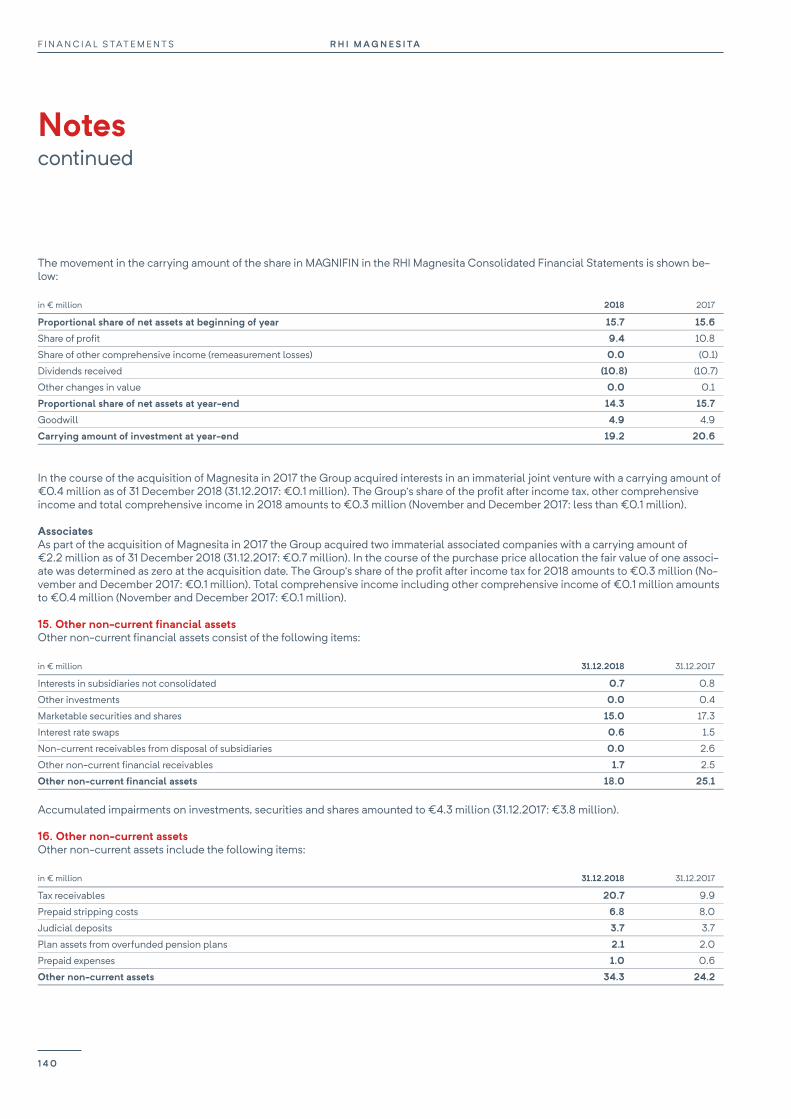
F I N A N C I A L S TAT E M E N T S R H I M AG N E S I TA
Notes continued
138
The movement in the carrying amount of the share in MAGNIFIN in the RHI Magnesita Consolidated Financial Statements is shown be-low:
in € million 2018 2017
Proportional share of net assets at beginning of year 15.7 15.6
Share of profit 9.4 10.8
Share of other comprehensive income (remeasurement losses) 0.0 (0.1)
Dividends received (10.8) (10.7)
Other changes in value 0.0 0.1
Proportional share of net assets at year-end 14.3 15.7
Goodwill 4.9 4.9
Carrying amount of investment at year-end 19.2 20.6
In the course of the acquisition of Magnesita in 2017 the Group acquired interests in an immaterial joint venture with a carrying amount of €0.4 million as of 31 December 2018 (31.12.2017: €0.1 million). The Group’s share of the profit after income tax, other comprehensive income and total comprehensive income in 2018 amounts to €0.3 million (November and December 2017: less than €0.1 million).
Associates As part of the acquisition of Magnesita in 2017 the Group acquired two immaterial associated companies with a carrying amount of €2.2 million as of 31 December 2018 (31.12.2017: €0.7 million). In the course of the purchase price allocation the fair value of one associ-ate was determined as zero at the acquisition date. The Group’s share of the profit after income tax for 2018 amounts to €0.3 million (No-vember and December 2017: €0.1 million). Total comprehensive income including other comprehensive income of €0.1 million amounts to €0.4 million (November and December 2017: €0.1 million).
15. Other non-current financial assets Other non-current financial assets consist of the following items:
in € million 31.12.2018 31.12.2017
Interests in subsidiaries not consolidated 0.7 0.8
Other investments 0.0 0.4
Marketable securities and shares 15.0 17.3
Interest rate swaps 0.6 1.5
Non-current receivables from disposal of subsidiaries 0.0 2.6
Other non-current financial receivables 1.7 2.5
Other non-current financial assets 18.0 25.1 Accumulated impairments on investments, securities and shares amounted to €4.3 million (31.12.2017: €3.8 million).
16. Other non-current assets Other non-current assets include the following items:
in € million 31.12.2018 31.12.2017
Tax receivables 20.7 9.9
Prepaid stripping costs 6.8 8.0
Judicial deposits 3.7 3.7
Plan assets from overfunded pension plans 2.1 2.0
Prepaid expenses 1.0 0.6
Other non-current assets 34.3 24.2
R H I M A G N E S I TAF I N A N C I A L S TAT E M E N T S
1 4 0

R H I M AG N E S I TA A N N U A L R E P O R T 2 0 1 8
139
Prepaid expenses for stripping costs arising from mining raw materials in a surface mine are included in non-current assets due to the planned use of the mine.
Tax receivables relate to input tax credits, which are expected to be utilised in the medium term.
17. Deferred taxes Deferred taxes are related to the following significant balance sheet items and loss carryforwards:
31.12.2018 31.12.2018 2018 31.12.20171) 31.12.20171) 20171)
in € million Deferred tax assets Deferred tax
liabilities Expense/(Income) Deferred tax assets Deferred tax
liabilities Expense/(Income)
Property, plant and equipment, intangible assets 20.1 159.7 (25.1) 52.1 219.8 (29.9)
Inventories 33.3 5.6 (9.8) 20.5 (1.6) (1.5)
Trade receivables, other assets 7.7 7.1 (24.8) 6.4 38.4 (11.5)
Pensions and other personnel provisions 69.6 (0.2) 2.3 70.2 0.3 6.4
Other provisions 26.1 1.6 (0.1) 25.9 (0.7) 3.9
Trade payables, other liabilities 18.0 4.4 10.6 26.6 4.7 (1.4)
Tax loss carried forward 96.1 29.9 134.6 - 8.4
Offsetting (99.8) (99.8) (196.2) (196.2) -
Deferred taxes 171.1 78.4 (17.0) 140.1 64.7 (25.6)
1 Adjusted to reflect the effects of the final purchase price allocation of Magnesita.
As of 31 December 2018, subsidiaries which generated tax losses in the past year or the previous year recognised net deferred tax assets on temporary differences and on tax loss carryforwards of €47.8 million (31.12.2017: €26.0 million). Deferred Tax Assets have been recog-nised because the companies concerned are expected to generate taxable income in the future.
Tax loss carryforwards totalled €467.7 million in the RHI Magnesita Group as of 31 December 2018 (31.12.2017: €609.7 million). A signifi-cant part of the tax loss carryforwards originated in Austria and Brazil where their deduction can be carried forward indefinitely. The an-nual compensation of tax loss carryforwards in Austria is limited to 75% and in Brazil to 30% of the respective taxable profits. Deferred taxes on tax losses of €155.1 million (31.12.2017: €157.7 million) were not recognised. Of these losses, €5.8 million (31.12.2017: €3.4 mil-lion) will expire in 2021, while the remainder will be carried forward indefinitely.
In addition, no deferred tax assets were recognised for temporary differences totalling €5.1 million (31.12.2017: €16.2 million) as it is not sufficiently probable that they can be used. The deductible temporary differences can be carried forward indefinitely.
Taxable temporary differences of €1,085.7 million (31.12.2017: €667.0 million) and deductible temporary differences of €501.1 million (31.12.2017: €295.6 million) were not recognised on shares in subsidiaries because the corresponding distributions of profit or the sale of the investments are controlled by the Group and are not expected in the foreseeable future.
The maturity structure of deferred taxes is shown in the table below:
31.12.2018 31.12.20171)
in € million Current Non-current Total Current Non-current Total
Deferred tax assets 78.0 93.1 171.1 11.0 129.1 140.1
Deferred tax liabilities 2.9 (81.3) (78.4) 78.8 (14.1) 64.7
1 Adjusted to reflect the effects of the final purchase price allocation of Magnesita.
A N N U A L R E P O R T 2 0 1 8R H I M A G N E S I TA
1 4 1
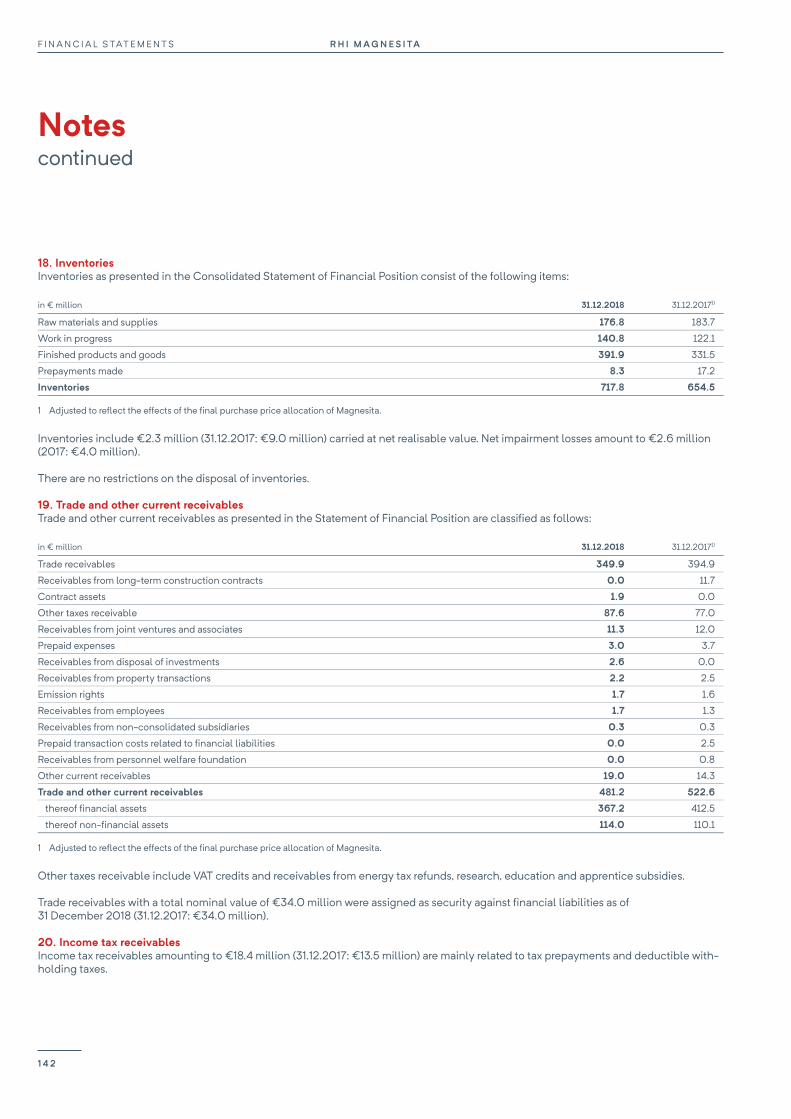
F I N A N C I A L S TAT E M E N T S R H I M AG N E S I TA
Notes continued
140
18. Inventories Inventories as presented in the Consolidated Statement of Financial Position consist of the following items:
in € million 31.12.2018 31.12.20171)
Raw materials and supplies 176.8 183.7
Work in progress 140.8 122.1
Finished products and goods 391.9 331.5
Prepayments made 8.3 17.2
Inventories 717.8 654.5
1 Adjusted to reflect the effects of the final purchase price allocation of Magnesita.
Inventories include €2.3 million (31.12.2017: €9.0 million) carried at net realisable value. Net impairment losses amount to €2.6 million (2017: €4.0 million).
There are no restrictions on the disposal of inventories.
19. Trade and other current receivables Trade and other current receivables as presented in the Statement of Financial Position are classified as follows:
in € million 31.12.2018 31.12.20171)
Trade receivables 349.9 394.9
Receivables from long-term construction contracts 0.0 11.7
Contract assets 1.9 0.0
Other taxes receivable 87.6 77.0
Receivables from joint ventures and associates 11.3 12.0
Prepaid expenses 3.0 3.7
Receivables from disposal of investments 2.6 0.0
Receivables from property transactions 2.2 2.5
Emission rights 1.7 1.6
Receivables from employees 1.7 1.3
Receivables from non-consolidated subsidiaries 0.3 0.3
Prepaid transaction costs related to financial liabilities 0.0 2.5
Receivables from personnel welfare foundation 0.0 0.8
Other current receivables 19.0 14.3
Trade and other current receivables 481.2 522.6
thereof financial assets 367.2 412.5
thereof non-financial assets 114.0 110.1
1 Adjusted to reflect the effects of the final purchase price allocation of Magnesita.
Other taxes receivable include VAT credits and receivables from energy tax refunds, research, education and apprentice subsidies.
Trade receivables with a total nominal value of €34.0 million were assigned as security against financial liabilities as of 31 December 2018 (31.12.2017: €34.0 million).
20. Income tax receivables Income tax receivables amounting to €18.4 million (31.12.2017: €13.5 million) are mainly related to tax prepayments and deductible with-holding taxes.
R H I M A G N E S I TAF I N A N C I A L S TAT E M E N T S
1 4 2
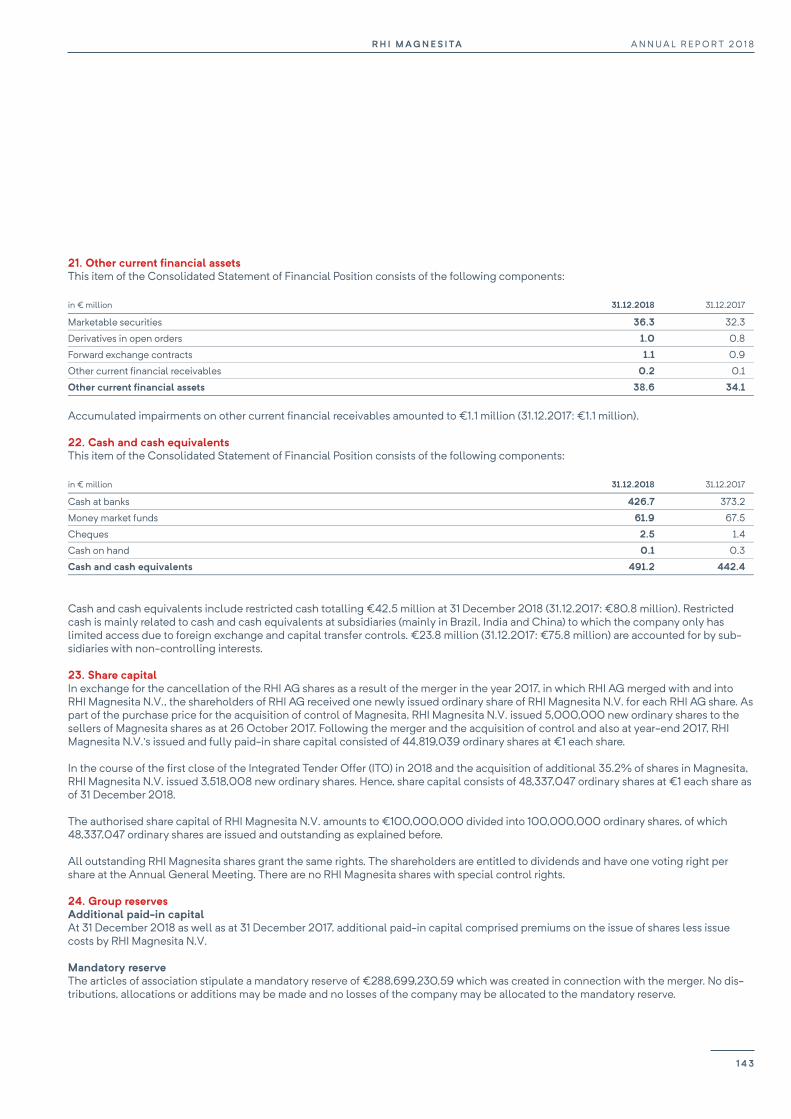
R H I M AG N E S I TA A N N U A L R E P O R T 2 0 1 8
141
21. Other current financial assets This item of the Consolidated Statement of Financial Position consists of the following components:
in € million 31.12.2018 31.12.2017
Marketable securities 36.3 32.3
Derivatives in open orders 1.0 0.8
Forward exchange contracts 1.1 0.9
Other current financial receivables 0.2 0.1
Other current financial assets 38.6 34.1 Accumulated impairments on other current financial receivables amounted to €1.1 million (31.12.2017: €1.1 million).
22. Cash and cash equivalents This item of the Consolidated Statement of Financial Position consists of the following components:
in € million 31.12.2018 31.12.2017
Cash at banks 426.7 373.2
Money market funds 61.9 67.5
Cheques 2.5 1.4
Cash on hand 0.1 0.3
Cash and cash equivalents 491.2 442.4
Cash and cash equivalents include restricted cash totalling €42.5 million at 31 December 2018 (31.12.2017: €80.8 million). Restricted cash is mainly related to cash and cash equivalents at subsidiaries (mainly in Brazil, India and China) to which the company only has limited access due to foreign exchange and capital transfer controls. €23.8 million (31.12.2017: €75.8 million) are accounted for by sub-sidiaries with non-controlling interests.
23. Share capital In exchange for the cancellation of the RHI AG shares as a result of the merger in the year 2017, in which RHI AG merged with and into RHI Magnesita N.V., the shareholders of RHI AG received one newly issued ordinary share of RHI Magnesita N.V. for each RHI AG share. As part of the purchase price for the acquisition of control of Magnesita, RHI Magnesita N.V. issued 5,000,000 new ordinary shares to the sellers of Magnesita shares as at 26 October 2017. Following the merger and the acquisition of control and also at year-end 2017, RHI Magnesita N.V.’s issued and fully paid-in share capital consisted of 44,819,039 ordinary shares at €1 each share.
In the course of the first close of the Integrated Tender Offer (ITO) in 2018 and the acquisition of additional 35.2% of shares in Magnesita, RHI Magnesita N.V. issued 3,518,008 new ordinary shares. Hence, share capital consists of 48,337,047 ordinary shares at €1 each share as of 31 December 2018.
The authorised share capital of RHI Magnesita N.V. amounts to €100,000,000 divided into 100,000,000 ordinary shares, of which 48,337,047 ordinary shares are issued and outstanding as explained before.
All outstanding RHI Magnesita shares grant the same rights. The shareholders are entitled to dividends and have one voting right per share at the Annual General Meeting. There are no RHI Magnesita shares with special control rights.
24. Group reserves Additional paid-in capital At 31 December 2018 as well as at 31 December 2017, additional paid-in capital comprised premiums on the issue of shares less issue costs by RHI Magnesita N.V.
Mandatory reserve The articles of association stipulate a mandatory reserve of €288,699,230.59 which was created in connection with the merger. No dis-tributions, allocations or additions may be made and no losses of the company may be allocated to the mandatory reserve.
A N N U A L R E P O R T 2 0 1 8R H I M A G N E S I TA
1 4 3
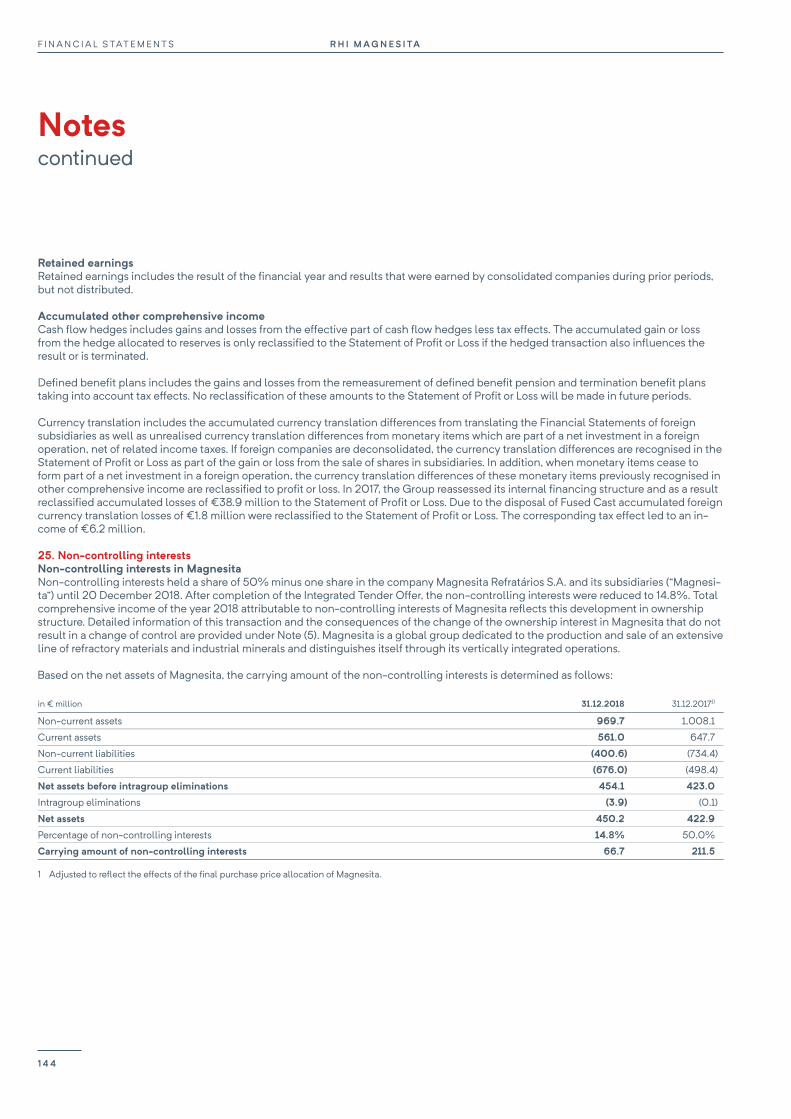
F I N A N C I A L S TAT E M E N T S R H I M AG N E S I TA
Notes continued
142
Retained earnings Retained earnings includes the result of the financial year and results that were earned by consolidated companies during prior periods, but not distributed.
Accumulated other comprehensive income Cash flow hedges includes gains and losses from the effective part of cash flow hedges less tax effects. The accumulated gain or loss from the hedge allocated to reserves is only reclassified to the Statement of Profit or Loss if the hedged transaction also influences the result or is terminated.
Defined benefit plans includes the gains and losses from the remeasurement of defined benefit pension and termination benefit plans taking into account tax effects. No reclassification of these amounts to the Statement of Profit or Loss will be made in future periods.
Currency translation includes the accumulated currency translation differences from translating the Financial Statements of foreign subsidiaries as well as unrealised currency translation differences from monetary items which are part of a net investment in a foreign operation, net of related income taxes. If foreign companies are deconsolidated, the currency translation differences are recognised in the Statement of Profit or Loss as part of the gain or loss from the sale of shares in subsidiaries. In addition, when monetary items cease to form part of a net investment in a foreign operation, the currency translation differences of these monetary items previously recognised in other comprehensive income are reclassified to profit or loss. In 2017, the Group reassessed its internal financing structure and as a result reclassified accumulated losses of €38.9 million to the Statement of Profit or Loss. Due to the disposal of Fused Cast accumulated foreign currency translation losses of €1.8 million were reclassified to the Statement of Profit or Loss. The corresponding tax effect led to an in-come of €6.2 million.
25. Non-controlling interests Non-controlling interests in Magnesita Non-controlling interests held a share of 50% minus one share in the company Magnesita Refratários S.A. and its subsidiaries (“Magnesi-ta”) until 20 December 2018. After completion of the Integrated Tender Offer, the non-controlling interests were reduced to 14.8%. Total comprehensive income of the year 2018 attributable to non-controlling interests of Magnesita reflects this development in ownership structure. Detailed information of this transaction and the consequences of the change of the ownership interest in Magnesita that do not result in a change of control are provided under Note (5). Magnesita is a global group dedicated to the production and sale of an extensive line of refractory materials and industrial minerals and distinguishes itself through its vertically integrated operations.
Based on the net assets of Magnesita, the carrying amount of the non-controlling interests is determined as follows:
in € million 31.12.2018 31.12.20171)
Non-current assets 969.7 1,008.1
Current assets 561.0 647.7
Non-current liabilities (400.6) (734.4)
Current liabilities (676.0) (498.4)
Net assets before intragroup eliminations 454.1 423.0
Intragroup eliminations (3.9) (0.1)
Net assets 450.2 422.9
Percentage of non-controlling interests 14.8% 50.0%
Carrying amount of non-controlling interests 66.7 211.5
1 Adjusted to reflect the effects of the final purchase price allocation of Magnesita.
R H I M A G N E S I TAF I N A N C I A L S TAT E M E N T S
1 4 4
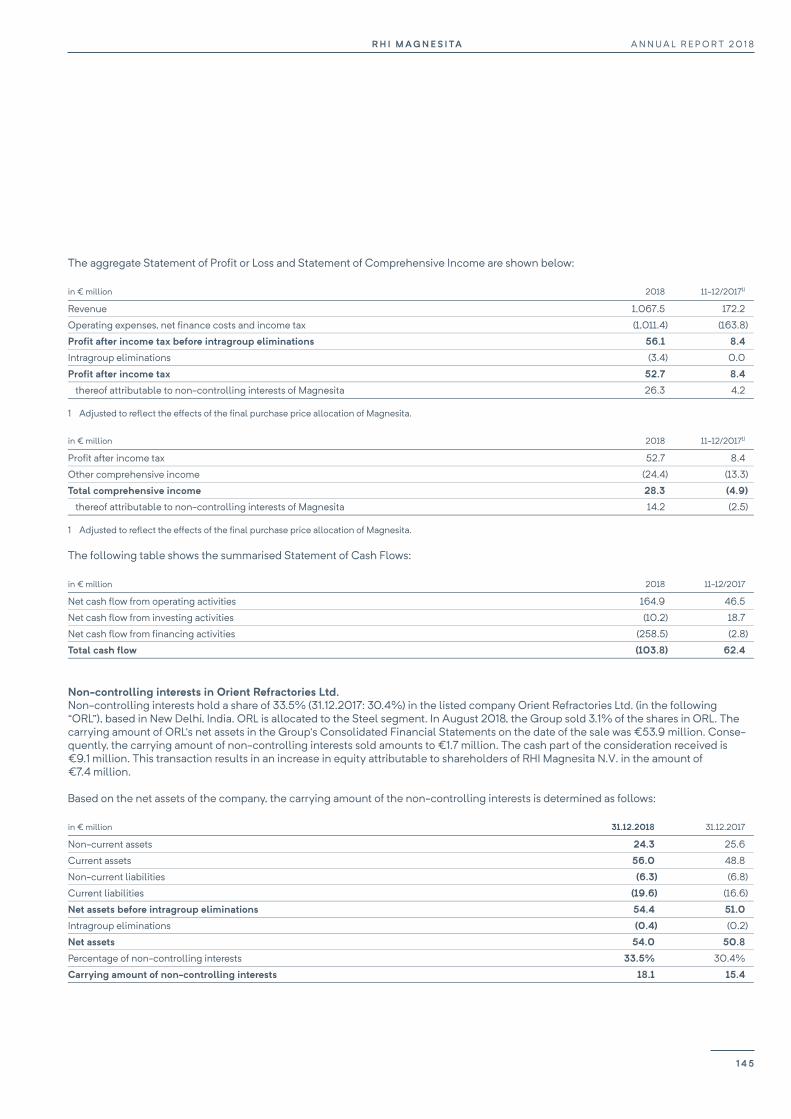
R H I M AG N E S I TA A N N U A L R E P O R T 2 0 1 8
143
The aggregate Statement of Profit or Loss and Statement of Comprehensive Income are shown below:
in € million 2018 11-12/20171)
Revenue 1,067.5 172.2
Operating expenses, net finance costs and income tax (1,011.4) (163.8)
Profit after income tax before intragroup eliminations 56.1 8.4
Intragroup eliminations (3.4) 0.0
Profit after income tax 52.7 8.4
thereof attributable to non-controlling interests of Magnesita 26.3 4.2
1 Adjusted to reflect the effects of the final purchase price allocation of Magnesita.
in € million 2018 11-12/20171)
Profit after income tax 52.7 8.4
Other comprehensive income (24.4) (13.3)
Total comprehensive income 28.3 (4.9)
thereof attributable to non-controlling interests of Magnesita 14.2 (2.5)
1 Adjusted to reflect the effects of the final purchase price allocation of Magnesita.
The following table shows the summarised Statement of Cash Flows:
in € million 2018 11-12/2017
Net cash flow from operating activities 164.9 46.5
Net cash flow from investing activities (10.2) 18.7
Net cash flow from financing activities (258.5) (2.8)
Total cash flow (103.8) 62.4
Non-controlling interests in Orient Refractories Ltd. Non-controlling interests hold a share of 33.5% (31.12.2017: 30.4%) in the listed company Orient Refractories Ltd. (in the following “ORL”), based in New Delhi, India. ORL is allocated to the Steel segment. In August 2018, the Group sold 3.1% of the shares in ORL. The carrying amount of ORL’s net assets in the Group’s Consolidated Financial Statements on the date of the sale was €53.9 million. Conse-quently, the carrying amount of non-controlling interests sold amounts to €1.7 million. The cash part of the consideration received is €9.1 million. This transaction results in an increase in equity attributable to shareholders of RHI Magnesita N.V. in the amount of €7.4 million.
Based on the net assets of the company, the carrying amount of the non-controlling interests is determined as follows:
in € million 31.12.2018 31.12.2017
Non-current assets 24.3 25.6
Current assets 56.0 48.8
Non-current liabilities (6.3) (6.8)
Current liabilities (19.6) (16.6)
Net assets before intragroup eliminations 54.4 51.0
Intragroup eliminations (0.4) (0.2)
Net assets 54.0 50.8
Percentage of non-controlling interests 33.5% 30.4%
Carrying amount of non-controlling interests 18.1 15.4
A N N U A L R E P O R T 2 0 1 8R H I M A G N E S I TA
1 4 5
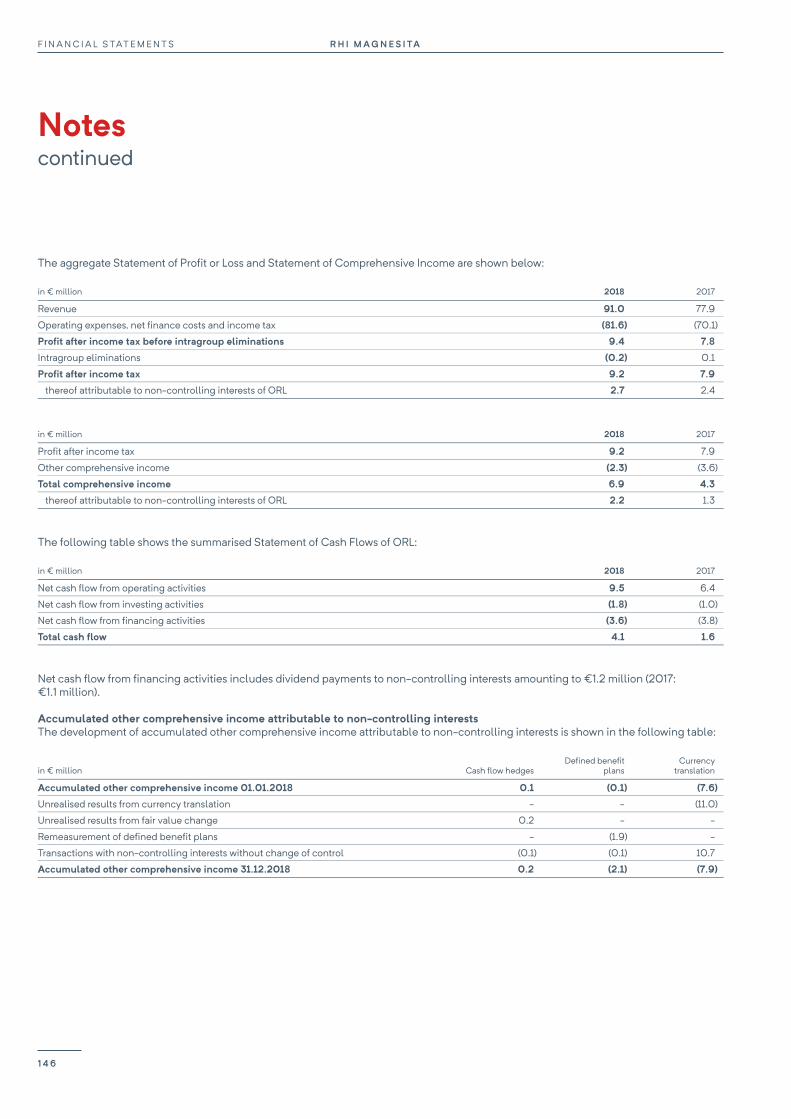
F I N A N C I A L S TAT E M E N T S R H I M AG N E S I TA
Notes continued
144
The aggregate Statement of Profit or Loss and Statement of Comprehensive Income are shown below:
in € million 2018 2017
Revenue 91.0 77.9
Operating expenses, net finance costs and income tax (81.6) (70.1)
Profit after income tax before intragroup eliminations 9.4 7.8
Intragroup eliminations (0.2) 0.1
Profit after income tax 9.2 7.9
thereof attributable to non-controlling interests of ORL 2.7 2.4
in € million 2018 2017
Profit after income tax 9.2 7.9
Other comprehensive income (2.3) (3.6)
Total comprehensive income 6.9 4.3
thereof attributable to non-controlling interests of ORL 2.2 1.3
The following table shows the summarised Statement of Cash Flows of ORL:
in € million 2018 2017
Net cash flow from operating activities 9.5 6.4
Net cash flow from investing activities (1.8) (1.0)
Net cash flow from financing activities (3.6) (3.8)
Total cash flow 4.1 1.6
Net cash flow from financing activities includes dividend payments to non-controlling interests amounting to €1.2 million (2017: €1.1 million).
Accumulated other comprehensive income attributable to non-controlling interests The development of accumulated other comprehensive income attributable to non-controlling interests is shown in the following table:
in € million Cash flow hedges Defined benefit
plans Currency
translation
Accumulated other comprehensive income 01.01.2018 0.1 (0.1) (7.6)
Unrealised results from currency translation - - (11.0)
Unrealised results from fair value change 0.2 - -
Remeasurement of defined benefit plans - (1.9) -
Transactions with non-controlling interests without change of control (0.1) (0.1) 10.7
Accumulated other comprehensive income 31.12.2018 0.2 (2.1) (7.9)
R H I M A G N E S I TAF I N A N C I A L S TAT E M E N T S
1 4 6
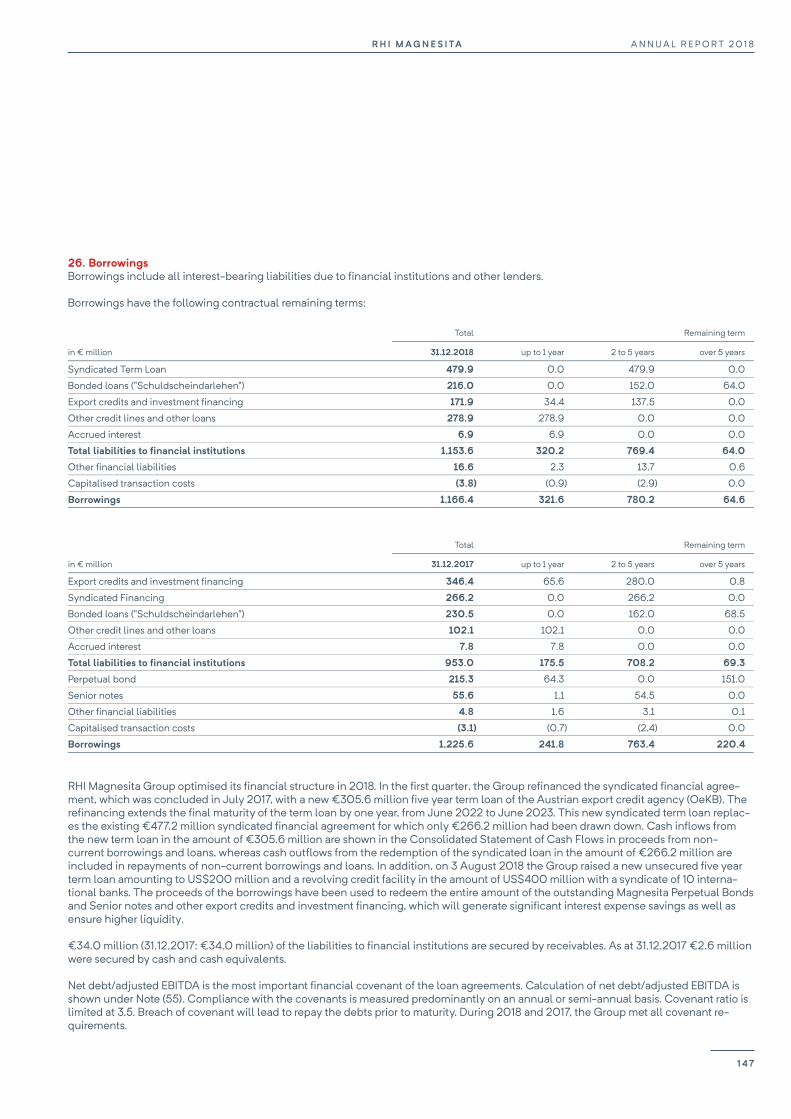
R H I M AG N E S I TA A N N U A L R E P O R T 2 0 1 8
145
26. Borrowings Borrowings include all interest-bearing liabilities due to financial institutions and other lenders.
Borrowings have the following contractual remaining terms:
Total Remaining term
in € million 31.12.2018 up to 1 year 2 to 5 years over 5 years
Syndicated Term Loan 479.9 0.0 479.9 0.0
Bonded loans ("Schuldscheindarlehen") 216.0 0.0 152.0 64.0
Export credits and investment financing 171.9 34.4 137.5 0.0
Other credit lines and other loans 278.9 278.9 0.0 0.0
Accrued interest 6.9 6.9 0.0 0.0
Total liabilities to financial institutions 1,153.6 320.2 769.4 64.0
Other financial liabilities 16.6 2.3 13.7 0.6
Capitalised transaction costs (3.8) (0.9) (2.9) 0.0
Borrowings 1,166.4 321.6 780.2 64.6
Total Remaining term
in € million 31.12.2017 up to 1 year 2 to 5 years over 5 years
Export credits and investment financing 346.4 65.6 280.0 0.8
Syndicated Financing 266.2 0.0 266.2 0.0
Bonded loans ("Schuldscheindarlehen") 230.5 0.0 162.0 68.5
Other credit lines and other loans 102.1 102.1 0.0 0.0
Accrued interest 7.8 7.8 0.0 0.0
Total liabilities to financial institutions 953.0 175.5 708.2 69.3
Perpetual bond 215.3 64.3 0.0 151.0
Senior notes 55.6 1.1 54.5 0.0
Other financial liabilities 4.8 1.6 3.1 0.1
Capitalised transaction costs (3.1) (0.7) (2.4) 0.0
Borrowings 1,225.6 241.8 763.4 220.4
RHI Magnesita Group optimised its financial structure in 2018. In the first quarter, the Group refinanced the syndicated financial agree-ment, which was concluded in July 2017, with a new €305.6 million five year term loan of the Austrian export credit agency (OeKB). The refinancing extends the final maturity of the term loan by one year, from June 2022 to June 2023. This new syndicated term loan replac-es the existing €477.2 million syndicated financial agreement for which only €266.2 million had been drawn down. Cash inflows from the new term loan in the amount of €305.6 million are shown in the Consolidated Statement of Cash Flows in proceeds from non-current borrowings and loans, whereas cash outflows from the redemption of the syndicated loan in the amount of €266.2 million are included in repayments of non-current borrowings and loans. In addition, on 3 August 2018 the Group raised a new unsecured five year term loan amounting to US$200 million and a revolving credit facility in the amount of US$400 million with a syndicate of 10 interna-tional banks. The proceeds of the borrowings have been used to redeem the entire amount of the outstanding Magnesita Perpetual Bonds and Senior notes and other export credits and investment financing, which will generate significant interest expense savings as well as ensure higher liquidity.
€34.0 million (31.12.2017: €34.0 million) of the liabilities to financial institutions are secured by receivables. As at 31.12.2017 €2.6 million were secured by cash and cash equivalents.
Net debt/adjusted EBITDA is the most important financial covenant of the loan agreements. Calculation of net debt/adjusted EBITDA is shown under Note (55). Compliance with the covenants is measured predominantly on an annual or semi-annual basis. Covenant ratio is limited at 3.5. Breach of covenant will lead to repay the debts prior to maturity. During 2018 and 2017, the Group met all covenant re-quirements.
A N N U A L R E P O R T 2 0 1 8R H I M A G N E S I TA
1 4 7
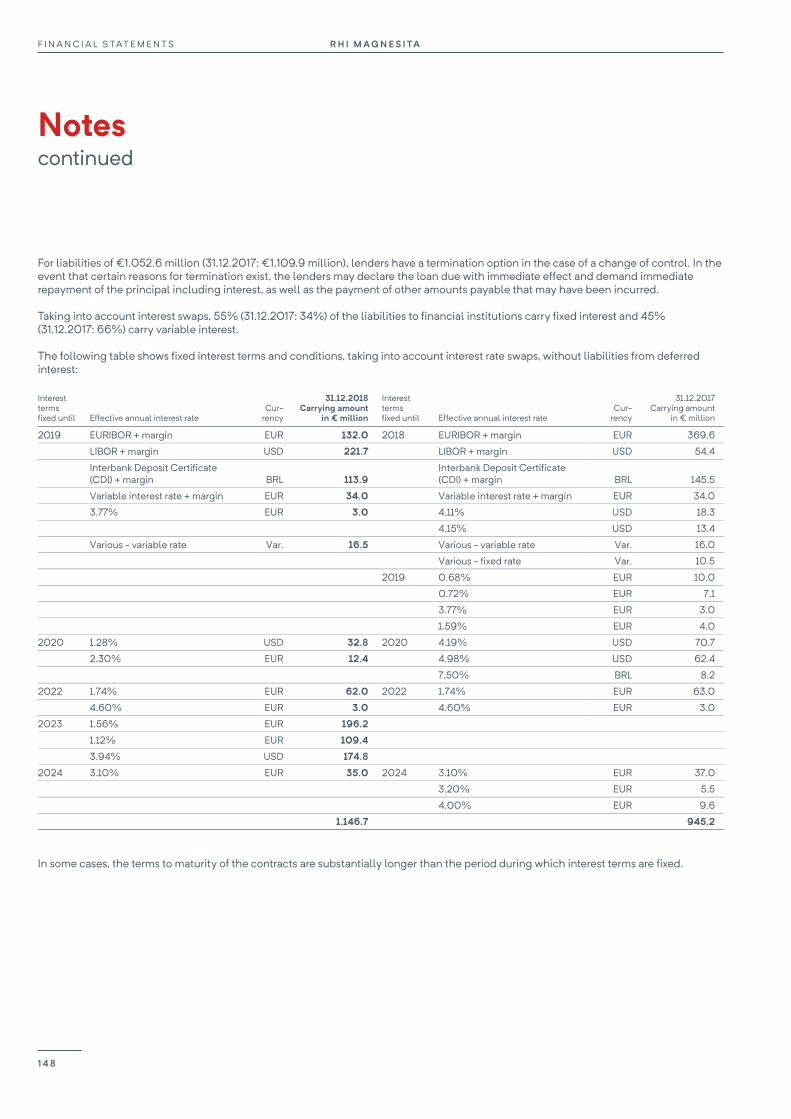
F I N A N C I A L S TAT E M E N T S R H I M AG N E S I TA
Notes continued
146
For liabilities of €1,052.6 million (31.12.2017: €1,109.9 million), lenders have a termination option in the case of a change of control. In the event that certain reasons for termination exist, the lenders may declare the loan due with immediate effect and demand immediate repayment of the principal including interest, as well as the payment of other amounts payable that may have been incurred.
Taking into account interest swaps, 55% (31.12.2017: 34%) of the liabilities to financial institutions carry fixed interest and 45% (31.12.2017: 66%) carry variable interest.
The following table shows fixed interest terms and conditions, taking into account interest rate swaps, without liabilities from deferred interest:
Interest terms fixed until Effective annual interest rate
Cur- rency
31.12.2018 Carrying amount
in € million
Interest terms fixed until Effective annual interest rate
Cur- rency
31.12.2017 Carrying amount
in € million
2019 EURIBOR + margin EUR 132.0 2018 EURIBOR + margin EUR 369.6
LIBOR + margin USD 221.7 LIBOR + margin USD 54.4
Interbank Deposit Certificate (CDI) + margin BRL 113.9
Interbank Deposit Certificate (CDI) + margin BRL 145.5
Variable interest rate + margin EUR 34.0 Variable interest rate + margin EUR 34.0
3.77% EUR 3.0 4.11% USD 18.3
4.15% USD 13.4
Various - variable rate Var. 16.5 Various - variable rate Var. 16.0
Various - fixed rate Var. 10.5
2019 0.68% EUR 10.0
0.72% EUR 7.1
3.77% EUR 3.0
1.59% EUR 4.0
2020 1.28% USD 32.8 2020 4.19% USD 70.7
2.30% EUR 12.4 4.98% USD 62.4
7.50% BRL 8.2
2022 1.74% EUR 62.0 2022 1.74% EUR 63.0
4.60% EUR 3.0 4.60% EUR 3.0
2023 1.56% EUR 196.2
1.12% EUR 109.4
3.94% USD 174.8
2024 3.10% EUR 35.0 2024 3.10% EUR 37.0
3.20% EUR 5.5
4.00% EUR 9.6
1,146.7 945.2
In some cases, the terms to maturity of the contracts are substantially longer than the period during which interest terms are fixed.
R H I M A G N E S I TAF I N A N C I A L S TAT E M E N T S
1 4 8

R H I M AG N E S I TA A N N U A L R E P O R T 2 0 1 8
147
27. Other financial liabilities Other financial liabilities include the negative fair value of derivative financial instruments as well as fixed-term and puttable non-controlling interests in Group companies. This item of the Consolidated Statement of Financial Position consists of the following items:
31.12.2018 31.12.2017
in € million Current Non-current Total Current Non-current Total
Derivatives from supply contracts 0.9 20.0 20.9 6.8 33.4 40.2
Interest rate swaps 0.0 7.3 7.3 0.0 0.2 0.2
Derivatives in open orders 0.0 0.0 0.0 0.5 0.0 0.5
Derivative financial liabilities 0.9 27.3 28.2 7.3 33.6 40.9
Fixed-term or puttable non-controlling interests 14.1 22.2 36.3 10.1 21.9 32.0
Other financial liabilities 15.0 49.5 64.5 17.4 55.5 72.9
Additional explanations on derivative financial instruments are provided under Note (54).
28. Provisions for pensions The net liability from pension obligations in the Consolidated Statement of Financial Position is as follows:
in € million 31.12.2018 31.12.2017
Present value of pension obligations 506.6 517.1
Fair value of plan assets (223.9) (228.6)
Funded status 282.7 288.5
Asset ceiling 19.5 18.3
Net liability from pension obligations 302.2 306.8
thereof assets from overfunded pension plans 2.1 1.9
thereof pensions 304.3 308.7
The present value of pension obligations by beneficiary groups is as follows:
in € million 31.12.2018 31.12.2017
Active beneficiaries 101.4 107.9
Vested terminated beneficiaries 68.7 71.9
Retirees 336.5 337.3
Present value of pension obligations 506.6 517.1
The calculation of pension obligations is based on the following actuarial assumptions:
in % 31.12.2018 31.12.2017
Interest rate 3.3% 3.1%
Future salary increase 2.7% 2.8%
Future pension increase 2.2% 2.1%
These are average values which were weighted with the present value of the respective pension obligation.
A N N U A L R E P O R T 2 0 1 8R H I M A G N E S I TA
1 4 9
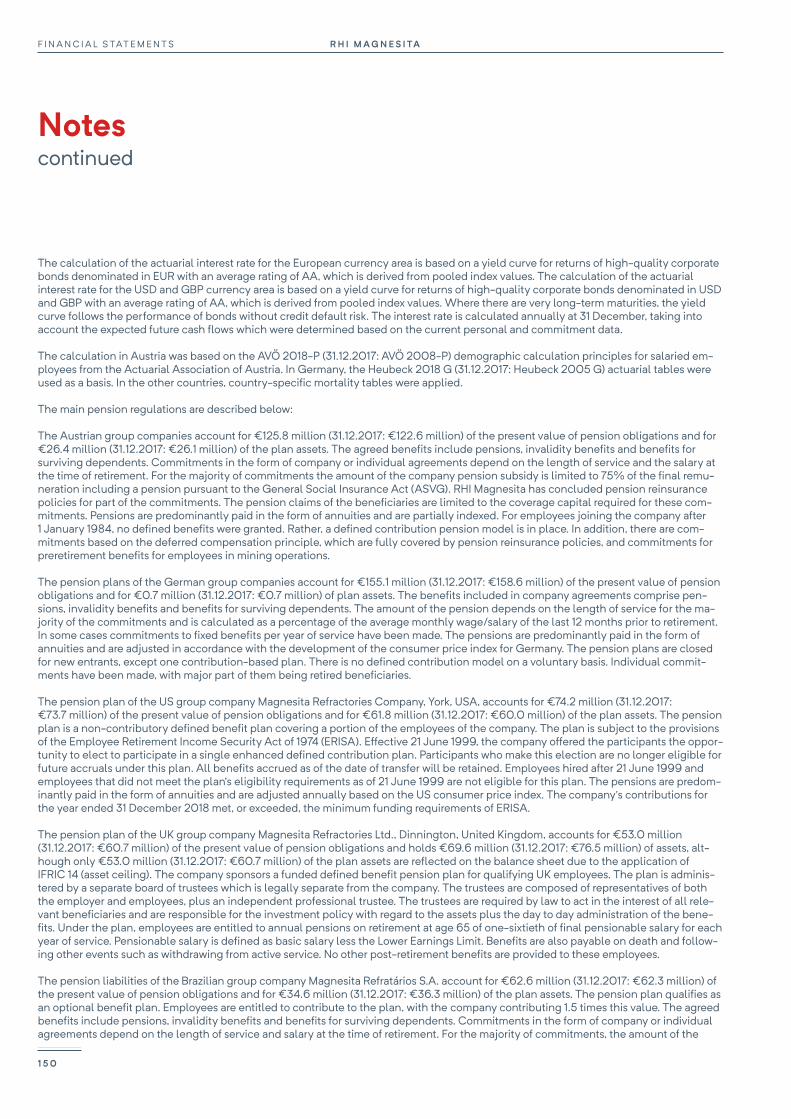
F I N A N C I A L S TAT E M E N T S R H I M AG N E S I TA
Notes continued
148
The calculation of the actuarial interest rate for the European currency area is based on a yield curve for returns of high-quality corporate bonds denominated in EUR with an average rating of AA, which is derived from pooled index values. The calculation of the actuarial interest rate for the USD and GBP currency area is based on a yield curve for returns of high-quality corporate bonds denominated in USD and GBP with an average rating of AA, which is derived from pooled index values. Where there are very long-term maturities, the yield curve follows the performance of bonds without credit default risk. The interest rate is calculated annually at 31 December, taking into account the expected future cash flows which were determined based on the current personal and commitment data.
The calculation in Austria was based on the AVÖ 2018-P (31.12.2017: AVÖ 2008-P) demographic calculation principles for salaried em-ployees from the Actuarial Association of Austria. In Germany, the Heubeck 2018 G (31.12.2017: Heubeck 2005 G) actuarial tables were used as a basis. In the other countries, country-specific mortality tables were applied.
The main pension regulations are described below:
The Austrian group companies account for €125.8 million (31.12.2017: €122.6 million) of the present value of pension obligations and for €26.4 million (31.12.2017: €26.1 million) of the plan assets. The agreed benefits include pensions, invalidity benefits and benefits for surviving dependents. Commitments in the form of company or individual agreements depend on the length of service and the salary at the time of retirement. For the majority of commitments the amount of the company pension subsidy is limited to 75% of the final remu-neration including a pension pursuant to the General Social Insurance Act (ASVG). RHI Magnesita has concluded pension reinsurance policies for part of the commitments. The pension claims of the beneficiaries are limited to the coverage capital required for these com-mitments. Pensions are predominantly paid in the form of annuities and are partially indexed. For employees joining the company after 1 January 1984, no defined benefits were granted. Rather, a defined contribution pension model is in place. In addition, there are com-mitments based on the deferred compensation principle, which are fully covered by pension reinsurance policies, and commitments for preretirement benefits for employees in mining operations.
The pension plans of the German group companies account for €155.1 million (31.12.2017: €158.6 million) of the present value of pension obligations and for €0.7 million (31.12.2017: €0.7 million) of plan assets. The benefits included in company agreements comprise pen-sions, invalidity benefits and benefits for surviving dependents. The amount of the pension depends on the length of service for the ma-jority of the commitments and is calculated as a percentage of the average monthly wage/salary of the last 12 months prior to retirement. In some cases commitments to fixed benefits per year of service have been made. The pensions are predominantly paid in the form of annuities and are adjusted in accordance with the development of the consumer price index for Germany. The pension plans are closed for new entrants, except one contribution-based plan. There is no defined contribution model on a voluntary basis. Individual commit-ments have been made, with major part of them being retired beneficiaries.
The pension plan of the US group company Magnesita Refractories Company, York, USA, accounts for €74.2 million (31.12.2017: €73.7 million) of the present value of pension obligations and for €61.8 million (31.12.2017: €60.0 million) of the plan assets. The pension plan is a non-contributory defined benefit plan covering a portion of the employees of the company. The plan is subject to the provisions of the Employee Retirement Income Security Act of 1974 (ERISA). Effective 21 June 1999, the company offered the participants the oppor-tunity to elect to participate in a single enhanced defined contribution plan. Participants who make this election are no longer eligible for future accruals under this plan. All benefits accrued as of the date of transfer will be retained. Employees hired after 21 June 1999 and employees that did not meet the plan's eligibility requirements as of 21 June 1999 are not eligible for this plan. The pensions are predom-inantly paid in the form of annuities and are adjusted annually based on the US consumer price index. The company's contributions for the year ended 31 December 2018 met, or exceeded, the minimum funding requirements of ERISA.
The pension plan of the UK group company Magnesita Refractories Ltd., Dinnington, United Kingdom, accounts for €53.0 million (31.12.2017: €60.7 million) of the present value of pension obligations and holds €69.6 million (31.12.2017: €76.5 million) of assets, alt-hough only €53.0 million (31.12.2017: €60.7 million) of the plan assets are reflected on the balance sheet due to the application of IFRIC 14 (asset ceiling). The company sponsors a funded defined benefit pension plan for qualifying UK employees. The plan is adminis-tered by a separate board of trustees which is legally separate from the company. The trustees are composed of representatives of both the employer and employees, plus an independent professional trustee. The trustees are required by law to act in the interest of all rele-vant beneficiaries and are responsible for the investment policy with regard to the assets plus the day to day administration of the bene-fits. Under the plan, employees are entitled to annual pensions on retirement at age 65 of one-sixtieth of final pensionable salary for each year of service. Pensionable salary is defined as basic salary less the Lower Earnings Limit. Benefits are also payable on death and follow-ing other events such as withdrawing from active service. No other post-retirement benefits are provided to these employees.
The pension liabilities of the Brazilian group company Magnesita Refratários S.A. account for €62.6 million (31.12.2017: €62.3 million) of the present value of pension obligations and for €34.6 million (31.12.2017: €36.3 million) of the plan assets. The pension plan qualifies as an optional benefit plan. Employees are entitled to contribute to the plan, with the company contributing 1.5 times this value. The agreed benefits include pensions, invalidity benefits and benefits for surviving dependents. Commitments in the form of company or individual agreements depend on the length of service and salary at the time of retirement. For the majority of commitments, the amount of the
R H I M A G N E S I TAF I N A N C I A L S TAT E M E N T S
1 5 0
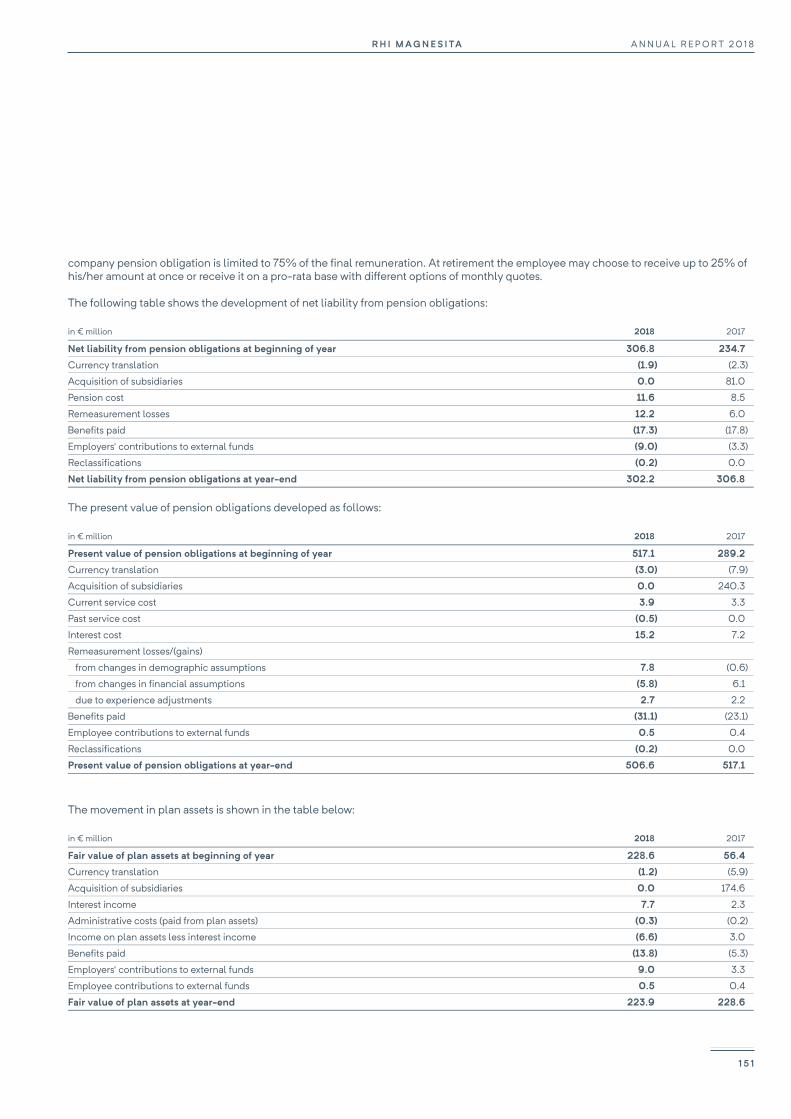
R H I M AG N E S I TA A N N U A L R E P O R T 2 0 1 8
149
company pension obligation is limited to 75% of the final remuneration. At retirement the employee may choose to receive up to 25% of his/her amount at once or receive it on a pro-rata base with different options of monthly quotes.
The following table shows the development of net liability from pension obligations:
in € million 2018 2017
Net liability from pension obligations at beginning of year 306.8 234.7
Currency translation (1.9) (2.3)
Acquisition of subsidiaries 0.0 81.0
Pension cost 11.6 8.5
Remeasurement losses 12.2 6.0
Benefits paid (17.3) (17.8)
Employers' contributions to external funds (9.0) (3.3)
Reclassifications (0.2) 0.0
Net liability from pension obligations at year-end 302.2 306.8 The present value of pension obligations developed as follows:
in € million 2018 2017
Present value of pension obligations at beginning of year 517.1 289.2
Currency translation (3.0) (7.9)
Acquisition of subsidiaries 0.0 240.3
Current service cost 3.9 3.3
Past service cost (0.5) 0.0
Interest cost 15.2 7.2
Remeasurement losses/(gains)
from changes in demographic assumptions 7.8 (0.6)
from changes in financial assumptions (5.8) 6.1
due to experience adjustments 2.7 2.2
Benefits paid (31.1) (23.1)
Employee contributions to external funds 0.5 0.4
Reclassifications (0.2) 0.0
Present value of pension obligations at year-end 506.6 517.1
The movement in plan assets is shown in the table below:
in € million 2018 2017
Fair value of plan assets at beginning of year 228.6 56.4
Currency translation (1.2) (5.9)
Acquisition of subsidiaries 0.0 174.6
Interest income 7.7 2.3
Administrative costs (paid from plan assets) (0.3) (0.2)
Income on plan assets less interest income (6.6) 3.0
Benefits paid (13.8) (5.3)
Employers' contributions to external funds 9.0 3.3
Employee contributions to external funds 0.5 0.4
Fair value of plan assets at year-end 223.9 228.6
A N N U A L R E P O R T 2 0 1 8R H I M A G N E S I TA
1 5 1
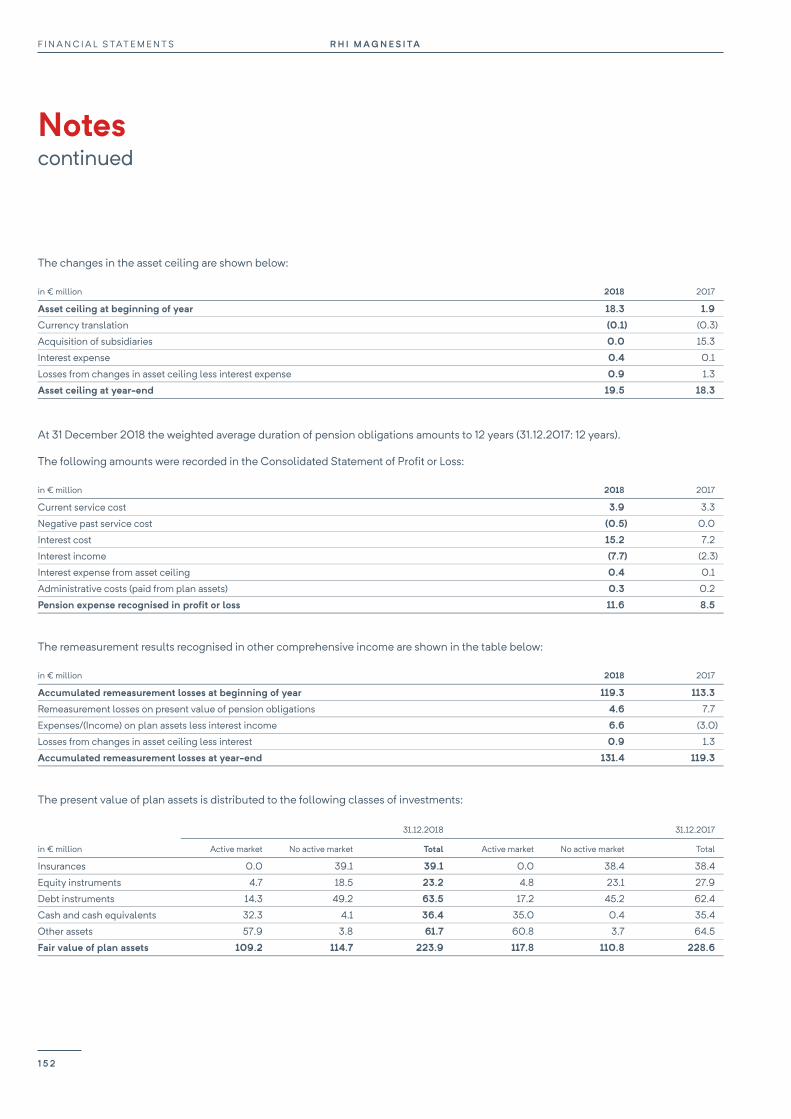
F I N A N C I A L S TAT E M E N T S R H I M AG N E S I TA
Notes continued
150
The changes in the asset ceiling are shown below:
in € million 2018 2017
Asset ceiling at beginning of year 18.3 1.9
Currency translation (0.1) (0.3)
Acquisition of subsidiaries 0.0 15.3
Interest expense 0.4 0.1
Losses from changes in asset ceiling less interest expense 0.9 1.3
Asset ceiling at year-end 19.5 18.3
At 31 December 2018 the weighted average duration of pension obligations amounts to 12 years (31.12.2017: 12 years).
The following amounts were recorded in the Consolidated Statement of Profit or Loss:
in € million 2018 2017
Current service cost 3.9 3.3
Negative past service cost (0.5) 0.0
Interest cost 15.2 7.2
Interest income (7.7) (2.3)
Interest expense from asset ceiling 0.4 0.1
Administrative costs (paid from plan assets) 0.3 0.2
Pension expense recognised in profit or loss 11.6 8.5
The remeasurement results recognised in other comprehensive income are shown in the table below:
in € million 2018 2017
Accumulated remeasurement losses at beginning of year 119.3 113.3
Remeasurement losses on present value of pension obligations 4.6 7.7
Expenses/(Income) on plan assets less interest income 6.6 (3.0)
Losses from changes in asset ceiling less interest 0.9 1.3
Accumulated remeasurement losses at year-end 131.4 119.3
The present value of plan assets is distributed to the following classes of investments:
31.12.2018 31.12.2017
in € million Active market No active market Total Active market No active market Total
Insurances 0.0 39.1 39.1 0.0 38.4 38.4
Equity instruments 4.7 18.5 23.2 4.8 23.1 27.9
Debt instruments 14.3 49.2 63.5 17.2 45.2 62.4
Cash and cash equivalents 32.3 4.1 36.4 35.0 0.4 35.4
Other assets 57.9 3.8 61.7 60.8 3.7 64.5
Fair value of plan assets 109.2 114.7 223.9 117.8 110.8 228.6
R H I M A G N E S I TAF I N A N C I A L S TAT E M E N T S
1 5 2
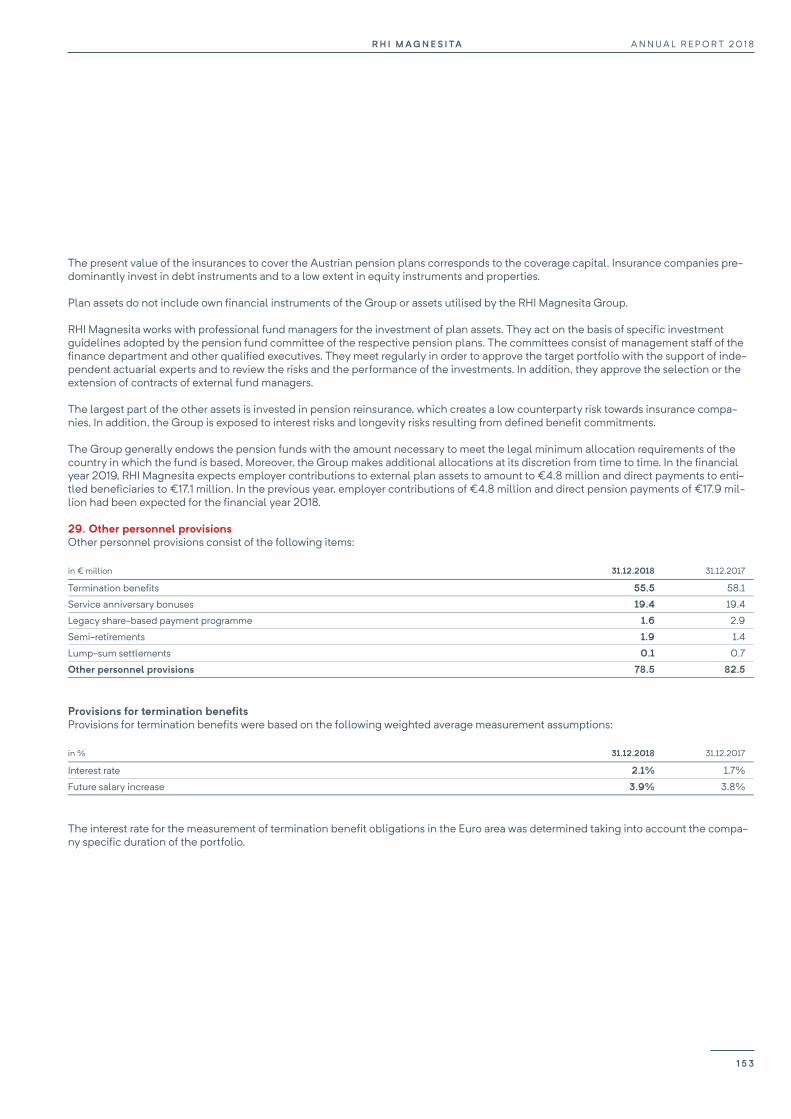
R H I M AG N E S I TA A N N U A L R E P O R T 2 0 1 8
151
The present value of the insurances to cover the Austrian pension plans corresponds to the coverage capital. Insurance companies pre-dominantly invest in debt instruments and to a low extent in equity instruments and properties.
Plan assets do not include own financial instruments of the Group or assets utilised by the RHI Magnesita Group.
RHI Magnesita works with professional fund managers for the investment of plan assets. They act on the basis of specific investment guidelines adopted by the pension fund committee of the respective pension plans. The committees consist of management staff of the finance department and other qualified executives. They meet regularly in order to approve the target portfolio with the support of inde-pendent actuarial experts and to review the risks and the performance of the investments. In addition, they approve the selection or the extension of contracts of external fund managers.
The largest part of the other assets is invested in pension reinsurance, which creates a low counterparty risk towards insurance compa-nies. In addition, the Group is exposed to interest risks and longevity risks resulting from defined benefit commitments.
The Group generally endows the pension funds with the amount necessary to meet the legal minimum allocation requirements of the country in which the fund is based. Moreover, the Group makes additional allocations at its discretion from time to time. In the financial year 2019, RHI Magnesita expects employer contributions to external plan assets to amount to €4.8 million and direct payments to enti-tled beneficiaries to €17.1 million. In the previous year, employer contributions of €4.8 million and direct pension payments of €17.9 mil-lion had been expected for the financial year 2018.
29. Other personnel provisions Other personnel provisions consist of the following items:
in € million 31.12.2018 31.12.2017
Termination benefits 55.5 58.1
Service anniversary bonuses 19.4 19.4
Legacy share-based payment programme 1.6 2.9
Semi-retirements 1.9 1.4
Lump-sum settlements 0.1 0.7
Other personnel provisions 78.5 82.5
Provisions for termination benefits Provisions for termination benefits were based on the following weighted average measurement assumptions:
in % 31.12.2018 31.12.2017
Interest rate 2.1% 1.7%
Future salary increase 3.9% 3.8%
The interest rate for the measurement of termination benefit obligations in the Euro area was determined taking into account the compa-ny specific duration of the portfolio.
A N N U A L R E P O R T 2 0 1 8R H I M A G N E S I TA
1 5 3
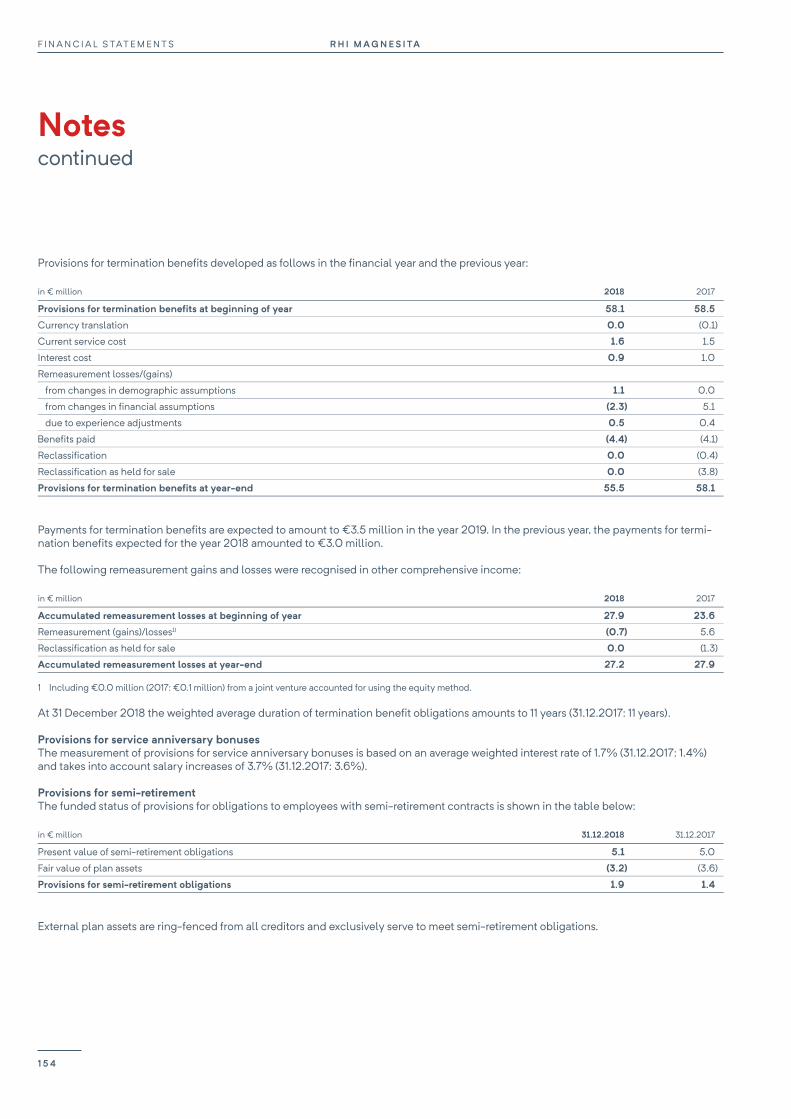
F I N A N C I A L S TAT E M E N T S R H I M AG N E S I TA
Notes continued
152
Provisions for termination benefits developed as follows in the financial year and the previous year:
in € million 2018 2017
Provisions for termination benefits at beginning of year 58.1 58.5
Currency translation 0.0 (0.1)
Current service cost 1.6 1.5
Interest cost 0.9 1.0
Remeasurement losses/(gains)
from changes in demographic assumptions 1.1 0.0
from changes in financial assumptions (2.3) 5.1
due to experience adjustments 0.5 0.4
Benefits paid (4.4) (4.1)
Reclassification 0.0 (0.4)
Reclassification as held for sale 0.0 (3.8)
Provisions for termination benefits at year-end 55.5 58.1
Payments for termination benefits are expected to amount to €3.5 million in the year 2019. In the previous year, the payments for termi-nation benefits expected for the year 2018 amounted to €3.0 million.
The following remeasurement gains and losses were recognised in other comprehensive income:
in € million 2018 2017
Accumulated remeasurement losses at beginning of year 27.9 23.6
Remeasurement (gains)/losses1) (0.7) 5.6
Reclassification as held for sale 0.0 (1.3)
Accumulated remeasurement losses at year-end 27.2 27.9
1 Including €0.0 million (2017: €0.1 million) from a joint venture accounted for using the equity method.
At 31 December 2018 the weighted average duration of termination benefit obligations amounts to 11 years (31.12.2017: 11 years).
Provisions for service anniversary bonuses The measurement of provisions for service anniversary bonuses is based on an average weighted interest rate of 1.7% (31.12.2017: 1.4%) and takes into account salary increases of 3.7% (31.12.2017: 3.6%).
Provisions for semi-retirement The funded status of provisions for obligations to employees with semi-retirement contracts is shown in the table below:
in € million 31.12.2018 31.12.2017
Present value of semi-retirement obligations 5.1 5.0
Fair value of plan assets (3.2) (3.6)
Provisions for semi-retirement obligations 1.9 1.4
External plan assets are ring-fenced from all creditors and exclusively serve to meet semi-retirement obligations.
R H I M A G N E S I TAF I N A N C I A L S TAT E M E N T S
1 5 4
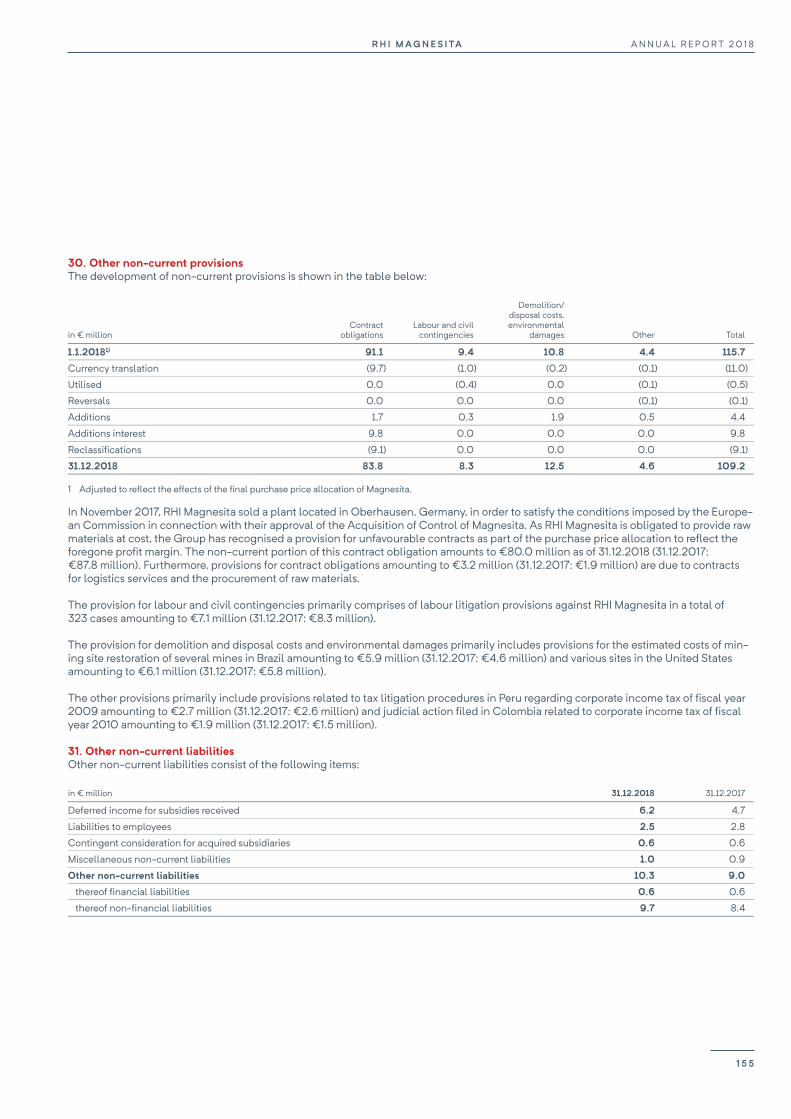
R H I M AG N E S I TA A N N U A L R E P O R T 2 0 1 8
153
30. Other non-current provisions The development of non-current provisions is shown in the table below:
in € million Contract
obligations Labour and civil
contingencies
Demolition/ disposal costs, environmental
damages Other Total
1.1.20181) 91.1 9.4 10.8 4.4 115.7
Currency translation (9.7) (1.0) (0.2) (0.1) (11.0)
Utilised 0.0 (0.4) 0.0 (0.1) (0.5)
Reversals 0.0 0.0 0.0 (0.1) (0.1)
Additions 1.7 0.3 1.9 0.5 4.4
Additions interest 9.8 0.0 0.0 0.0 9.8
Reclassifications (9.1) 0.0 0.0 0.0 (9.1)
31.12.2018 83.8 8.3 12.5 4.6 109.2
1 Adjusted to reflect the effects of the final purchase price allocation of Magnesita. In November 2017, RHI Magnesita sold a plant located in Oberhausen, Germany, in order to satisfy the conditions imposed by the Europe-an Commission in connection with their approval of the Acquisition of Control of Magnesita. As RHI Magnesita is obligated to provide raw materials at cost, the Group has recognised a provision for unfavourable contracts as part of the purchase price allocation to reflect the foregone profit margin. The non-current portion of this contract obligation amounts to €80.0 million as of 31.12.2018 (31.12.2017: €87.8 million). Furthermore, provisions for contract obligations amounting to €3.2 million (31.12.2017: €1.9 million) are due to contracts for logistics services and the procurement of raw materials.
The provision for labour and civil contingencies primarily comprises of labour litigation provisions against RHI Magnesita in a total of 323 cases amounting to €7.1 million (31.12.2017: €8.3 million).
The provision for demolition and disposal costs and environmental damages primarily includes provisions for the estimated costs of min-ing site restoration of several mines in Brazil amounting to €5.9 million (31.12.2017: €4.6 million) and various sites in the United States amounting to €6.1 million (31.12.2017: €5.8 million).
The other provisions primarily include provisions related to tax litigation procedures in Peru regarding corporate income tax of fiscal year 2009 amounting to €2.7 million (31.12.2017: €2.6 million) and judicial action filed in Colombia related to corporate income tax of fiscal year 2010 amounting to €1.9 million (31.12.2017: €1.5 million).
31. Other non-current liabilities Other non-current liabilities consist of the following items:
in € million 31.12.2018 31.12.2017
Deferred income for subsidies received 6.2 4.7
Liabilities to employees 2.5 2.8
Contingent consideration for acquired subsidiaries 0.6 0.6
Miscellaneous non-current liabilities 1.0 0.9
Other non-current liabilities 10.3 9.0
thereof financial liabilities 0.6 0.6
thereof non-financial liabilities 9.7 8.4
A N N U A L R E P O R T 2 0 1 8R H I M A G N E S I TA
1 5 5
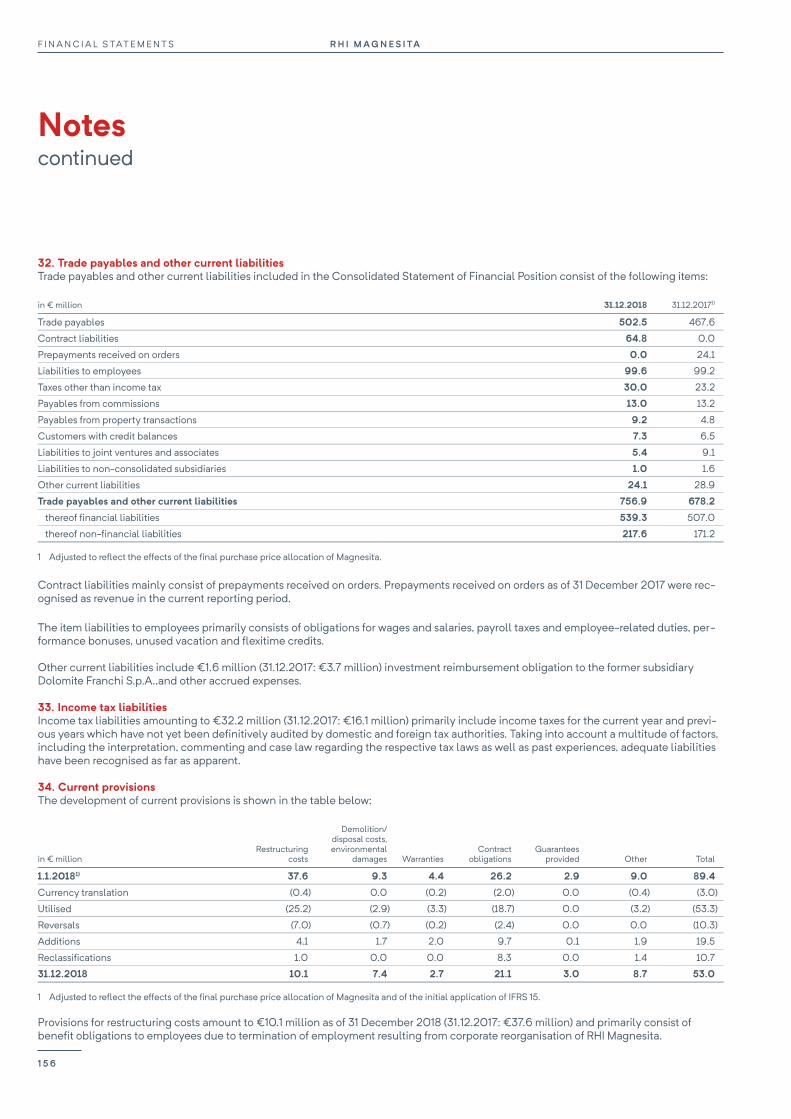
F I N A N C I A L S TAT E M E N T S R H I M AG N E S I TA
Notes continued
154
32. Trade payables and other current liabilities Trade payables and other current liabilities included in the Consolidated Statement of Financial Position consist of the following items:
in € million 31.12.2018 31.12.20171)
Trade payables 502.5 467.6
Contract liabilities 64.8 0.0
Prepayments received on orders 0.0 24.1
Liabilities to employees 99.6 99.2
Taxes other than income tax 30.0 23.2
Payables from commissions 13.0 13.2
Payables from property transactions 9.2 4.8
Customers with credit balances 7.3 6.5
Liabilities to joint ventures and associates 5.4 9.1
Liabilities to non-consolidated subsidiaries 1.0 1.6
Other current liabilities 24.1 28.9
Trade payables and other current liabilities 756.9 678.2
thereof financial liabilities 539.3 507.0
thereof non-financial liabilities 217.6 171.2
1 Adjusted to reflect the effects of the final purchase price allocation of Magnesita.
Contract liabilities mainly consist of prepayments received on orders. Prepayments received on orders as of 31 December 2017 were rec-ognised as revenue in the current reporting period.
The item liabilities to employees primarily consists of obligations for wages and salaries, payroll taxes and employee-related duties, per-formance bonuses, unused vacation and flexitime credits.
Other current liabilities include €1.6 million (31.12.2017: €3.7 million) investment reimbursement obligation to the former subsidiary Dolomite Franchi S.p.A.,and other accrued expenses.
33. Income tax liabilities Income tax liabilities amounting to €32.2 million (31.12.2017: €16.1 million) primarily include income taxes for the current year and previ-ous years which have not yet been definitively audited by domestic and foreign tax authorities. Taking into account a multitude of factors, including the interpretation, commenting and case law regarding the respective tax laws as well as past experiences, adequate liabilities have been recognised as far as apparent.
34. Current provisions The development of current provisions is shown in the table below:
in € million Restructuring
costs
Demolition/ disposal costs, environmental
damages Warranties Contract
obligations Guarantees
provided Other Total
1.1.20181) 37.6 9.3 4.4 26.2 2.9 9.0 89.4
Currency translation (0.4) 0.0 (0.2) (2.0) 0.0 (0.4) (3.0)
Utilised (25.2) (2.9) (3.3) (18.7) 0.0 (3.2) (53.3)
Reversals (7.0) (0.7) (0.2) (2.4) 0.0 0.0 (10.3)
Additions 4.1 1.7 2.0 9.7 0.1 1.9 19.5
Reclassifications 1.0 0.0 0.0 8.3 0.0 1.4 10.7
31.12.2018 10.1 7.4 2.7 21.1 3.0 8.7 53.0
1 Adjusted to reflect the effects of the final purchase price allocation of Magnesita and of the initial application of IFRS 15.
Provisions for restructuring costs amount to €10.1 million as of 31 December 2018 (31.12.2017: €37.6 million) and primarily consist of benefit obligations to employees due to termination of employment resulting from corporate reorganisation of RHI Magnesita.
R H I M A G N E S I TAF I N A N C I A L S TAT E M E N T S
1 5 6
R H I M AG N E S I TA A N N U A L R E P O R T 2 0 1 8
155
The item demolition and disposal costs, environmental damages includes an amount of €2.5 million (31.12.2017: €2.7 million) which refers to the former site in Aken, Germany. It is assumed that this provision will be used up within the next 12 months.
Provisions for warranties include provisions for claims arising from warranties and other similar obligations from the sale of refractory products.
Provisions for contract obligations include the current portion of the Oberhausen contract obligation amounting to €11.5 million (31.12.2017: €16.9 million). The amortisation of this provision led to an income of €10.0 million in 2018. Furthermore, provisions for other unfavourable contracts amounting to €6.7 million (31.12.2017: €6.9 million) and provisions for unfavourable contracts related to contracts for logistics services and the procurement of raw materials totalling €2.9 million (31.12.2017: €2.4 million) are included.
Provisions for guarantees provided include obligations from sureties and guarantees to banks and insurance companies in the country and abroad. The exact due date of the cash outflow is uncertain.
The item other provisions includes provisions for real estate transfer tax amounting to €1.3 million (31.12.2017: €2.4 million) resulting from corporate reorganisation of RHI Magnesita as well as a provision for the share-based remuneration programme of the members of the former Management Board of RHI AG of €1.4 million (31.12.2017: €1.4 million).
In addition, provisions for legal proceedings including attorney’s fees amounting to €3.2 million (31.12.2017: €3.1 million) are included in the item other provisions. It is currently uncertain when precisely the cash outflow is due.
Furthermore, several provisions, which are individually immaterial and cannot be allocated to one of the above-mentioned categories, are included in other provisions. A large part of these costs is expected to be paid within 12 months.
A N N U A L R E P O R T 2 0 1 8R H I M A G N E S I TA
1 5 7

F I N A N C I A L S TAT E M E N T S R H I M AG N E S I TA
Notes continued
156
35. Revenue Revenue is essentially generated by product deliveries and by performing management refractory services. The distribution of revenue by product group, division and country is given in the explanations to segment reporting under Note (50).
36. Cost of sales Cost of sales comprises the production cost of goods sold as well as the purchase price of merchandise sold. In addition to direct material and production costs, it also includes overheads including depreciation charges on production equipment, amortisation charges of in-tangible assets as well as impairment losses and reversals of impairment losses of inventories. Moreover, cost of sales also includes the costs of services provided by the Group or services received.
37. Selling and marketing expenses This item includes personnel expenses for the sales staff as well as depreciation charges and other operating expenses related to the market and sales processes.
38. General and administrative expenses General and administrative expenses primarily consist of personnel expenses for the administrative functions, legal and other consulting costs, expenses for research and non-capitalisable development costs.
Research and development expenses totalled €32.6 million (2017: €24.0 million), of which development costs amounting to €8.3 mil-lion (2017: €4.6 million) were capitalised. Income from research grants amounted to €3.8 million (2017: €3.8 million) in 2018. Amortisa-tion and impairment of development costs amounting to €3.8 million (2017: €4.3 million) are recognised under cost of sales.
39. Other income The individual components of other income are:
in € million 2018 20171)
Result from derivatives from supply contracts 19.6 4.9
Amortisation of Oberhausen provision 10.0 1.6
Income from restructuring 5.4 0.3
Income from the disposal of non-current assets 2.2 0.9
Miscellaneous income 6.7 2.7
Other income 43.9 10.4
1 Adjusted to reflect the effects of the final purchase price allocation of Magnesita and the changes in presentation.
Income from restructuring amounting to €5.4 million results from the reversal of acquisition-related provisions for redundancy pro-grammes.
NOTES TO THE CONSOLIDATED STATEMENT OF PROFIT OR LOSS
R H I M A G N E S I TAF I N A N C I A L S TAT E M E N T S
1 5 8
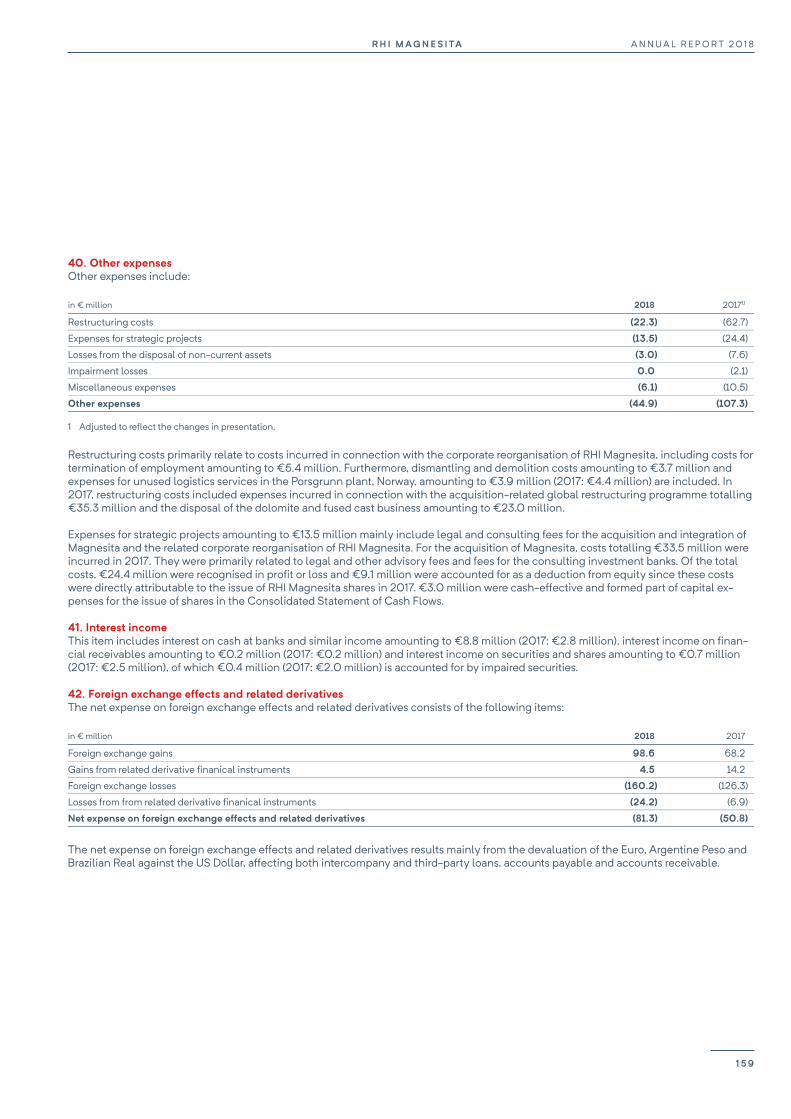
R H I M AG N E S I TA A N N U A L R E P O R T 2 0 1 8
157
40. Other expenses Other expenses include:
in € million 2018 20171)
Restructuring costs (22.3) (62.7)
Expenses for strategic projects (13.5) (24.4)
Losses from the disposal of non-current assets (3.0) (7.6)
Impairment losses 0.0 (2.1)
Miscellaneous expenses (6.1) (10.5)
Other expenses (44.9) (107.3)
1 Adjusted to reflect the changes in presentation.
Restructuring costs primarily relate to costs incurred in connection with the corporate reorganisation of RHI Magnesita, including costs for termination of employment amounting to €5.4 million. Furthermore, dismantling and demolition costs amounting to €3.7 million and expenses for unused logistics services in the Porsgrunn plant, Norway, amounting to €3.9 million (2017: €4.4 million) are included. In 2017, restructuring costs included expenses incurred in connection with the acquisition-related global restructuring programme totalling €35.3 million and the disposal of the dolomite and fused cast business amounting to €23.0 million.
Expenses for strategic projects amounting to €13.5 million mainly include legal and consulting fees for the acquisition and integration of Magnesita and the related corporate reorganisation of RHI Magnesita. For the acquisition of Magnesita, costs totalling €33.5 million were incurred in 2017. They were primarily related to legal and other advisory fees and fees for the consulting investment banks. Of the total costs, €24.4 million were recognised in profit or loss and €9.1 million were accounted for as a deduction from equity since these costs were directly attributable to the issue of RHI Magnesita shares in 2017. €3.0 million were cash-effective and formed part of capital ex-penses for the issue of shares in the Consolidated Statement of Cash Flows.
41. Interest income This item includes interest on cash at banks and similar income amounting to €8.8 million (2017: €2.8 million), interest income on finan-cial receivables amounting to €0.2 million (2017: €0.2 million) and interest income on securities and shares amounting to €0.7 million (2017: €2.5 million), of which €0.4 million (2017: €2.0 million) is accounted for by impaired securities.
42. Foreign exchange effects and related derivatives The net expense on foreign exchange effects and related derivatives consists of the following items:
in € million 2018 2017
Foreign exchange gains 98.6 68.2
Gains from related derivative finanical instruments 4.5 14.2
Foreign exchange losses (160.2) (126.3)
Losses from from related derivative finanical instruments (24.2) (6.9)
Net expense on foreign exchange effects and related derivatives (81.3) (50.8)
The net expense on foreign exchange effects and related derivatives results mainly from the devaluation of the Euro, Argentine Peso and Brazilian Real against the US Dollar, affecting both intercompany and third-party loans, accounts payable and accounts receivable.
A N N U A L R E P O R T 2 0 1 8R H I M A G N E S I TA
1 5 9
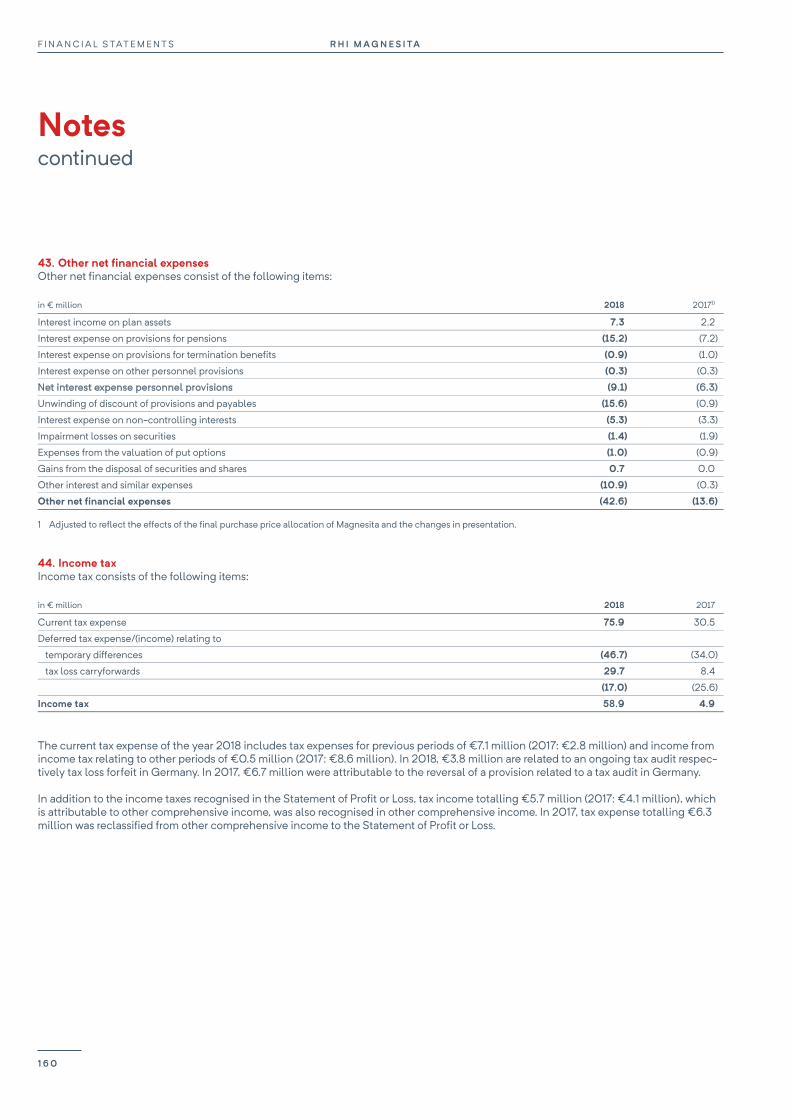
F I N A N C I A L S TAT E M E N T S R H I M AG N E S I TA
Notes continued
158
43. Other net financial expenses Other net financial expenses consist of the following items:
in € million 2018 20171)
Interest income on plan assets 7.3 2.2
Interest expense on provisions for pensions (15.2) (7.2)
Interest expense on provisions for termination benefits (0.9) (1.0)
Interest expense on other personnel provisions (0.3) (0.3)
Net interest expense personnel provisions (9.1) (6.3)
Unwinding of discount of provisions and payables (15.6) (0.9)
Interest expense on non-controlling interests (5.3) (3.3)
Impairment losses on securities (1.4) (1.9)
Expenses from the valuation of put options (1.0) (0.9)
Gains from the disposal of securities and shares 0.7 0.0
Other interest and similar expenses (10.9) (0.3)
Other net financial expenses (42.6) (13.6)
1 Adjusted to reflect the effects of the final purchase price allocation of Magnesita and the changes in presentation.
44. Income tax Income tax consists of the following items:
in € million 2018 2017
Current tax expense 75.9 30.5
Deferred tax expense/(income) relating to
temporary differences (46.7) (34.0)
tax loss carryforwards 29.7 8.4
(17.0) (25.6)
Income tax 58.9 4.9
The current tax expense of the year 2018 includes tax expenses for previous periods of €7.1 million (2017: €2.8 million) and income from income tax relating to other periods of €0.5 million (2017: €8.6 million). In 2018, €3.8 million are related to an ongoing tax audit respec-tively tax loss forfeit in Germany. In 2017, €6.7 million were attributable to the reversal of a provision related to a tax audit in Germany.
In addition to the income taxes recognised in the Statement of Profit or Loss, tax income totalling €5.7 million (2017: €4.1 million), which is attributable to other comprehensive income, was also recognised in other comprehensive income. In 2017, tax expense totalling €6.3 million was reclassified from other comprehensive income to the Statement of Profit or Loss.
R H I M A G N E S I TAF I N A N C I A L S TAT E M E N T S
1 6 0
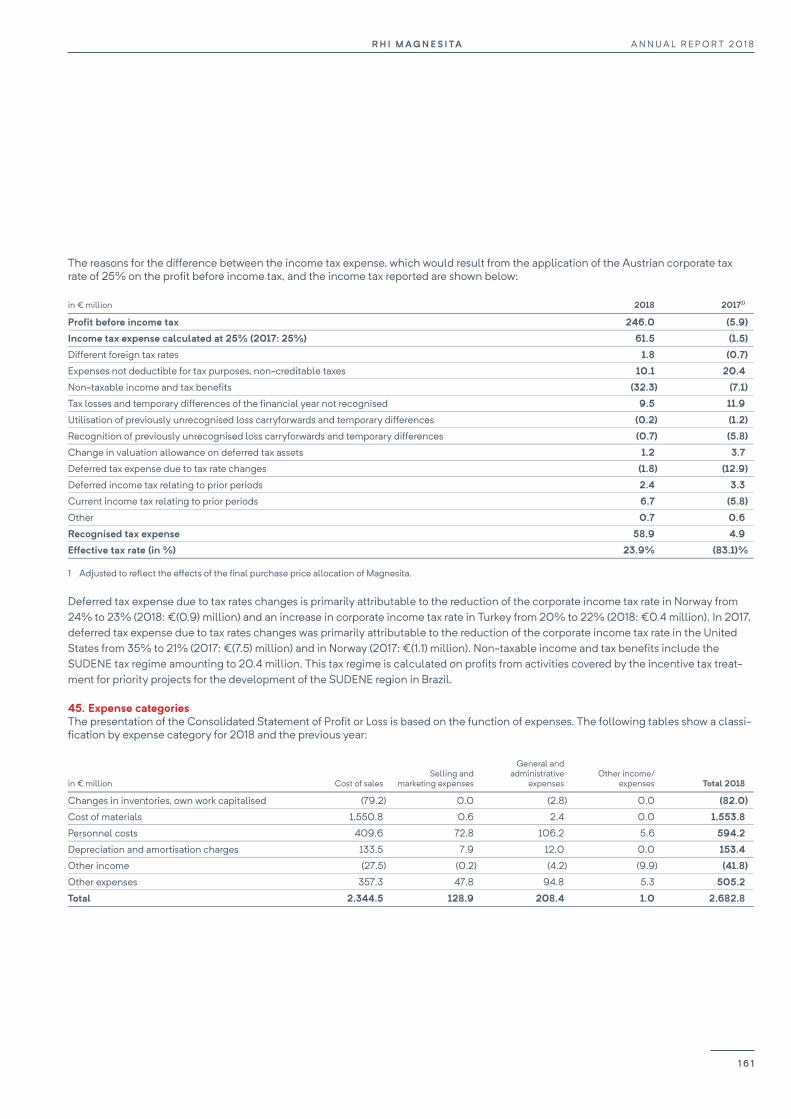
R H I M AG N E S I TA A N N U A L R E P O R T 2 0 1 8
159
The reasons for the difference between the income tax expense, which would result from the application of the Austrian corporate tax rate of 25% on the profit before income tax, and the income tax reported are shown below:
in € million 2018 20171)
Profit before income tax 246.0 (5.9)
Income tax expense calculated at 25% (2017: 25%) 61.5 (1.5)
Different foreign tax rates 1.8 (0.7)
Expenses not deductible for tax purposes, non-creditable taxes 10.1 20.4
Non-taxable income and tax benefits (32.3) (7.1)
Tax losses and temporary differences of the financial year not recognised 9.5 11.9
Utilisation of previously unrecognised loss carryforwards and temporary differences (0.2) (1.2)
Recognition of previously unrecognised loss carryforwards and temporary differences (0.7) (5.8)
Change in valuation allowance on deferred tax assets 1.2 3.7
Deferred tax expense due to tax rate changes (1.8) (12.9)
Deferred income tax relating to prior periods 2.4 3.3
Current income tax relating to prior periods 6.7 (5.8)
Other 0.7 0.6
Recognised tax expense 58.9 4.9
Effective tax rate (in %) 23.9% (83.1)%
1 Adjusted to reflect the effects of the final purchase price allocation of Magnesita.
Deferred tax expense due to tax rates changes is primarily attributable to the reduction of the corporate income tax rate in Norway from 24% to 23% (2018: €(0.9) million) and an increase in corporate income tax rate in Turkey from 20% to 22% (2018: €0.4 million). In 2017, deferred tax expense due to tax rates changes was primarily attributable to the reduction of the corporate income tax rate in the United States from 35% to 21% (2017: €(7.5) million) and in Norway (2017: €(1.1) million). Non-taxable income and tax benefits include the SUDENE tax regime amounting to 20.4 million. This tax regime is calculated on profits from activities covered by the incentive tax treat-ment for priority projects for the development of the SUDENE region in Brazil.
45. Expense categories The presentation of the Consolidated Statement of Profit or Loss is based on the function of expenses. The following tables show a classi-fication by expense category for 2018 and the previous year:
in € million Cost of sales Selling and
marketing expenses
General and administrative
expenses Other income/
expenses Total 2018
Changes in inventories, own work capitalised (79.2) 0.0 (2.8) 0.0 (82.0)
Cost of materials 1,550.8 0.6 2.4 0.0 1,553.8
Personnel costs 409.6 72.8 106.2 5.6 594.2
Depreciation and amortisation charges 133.5 7.9 12.0 0.0 153.4
Other income (27.5) (0.2) (4.2) (9.9) (41.8)
Other expenses 357.3 47.8 94.8 5.3 505.2
Total 2,344.5 128.9 208.4 1.0 2,682.8
A N N U A L R E P O R T 2 0 1 8R H I M A G N E S I TA
1 6 1
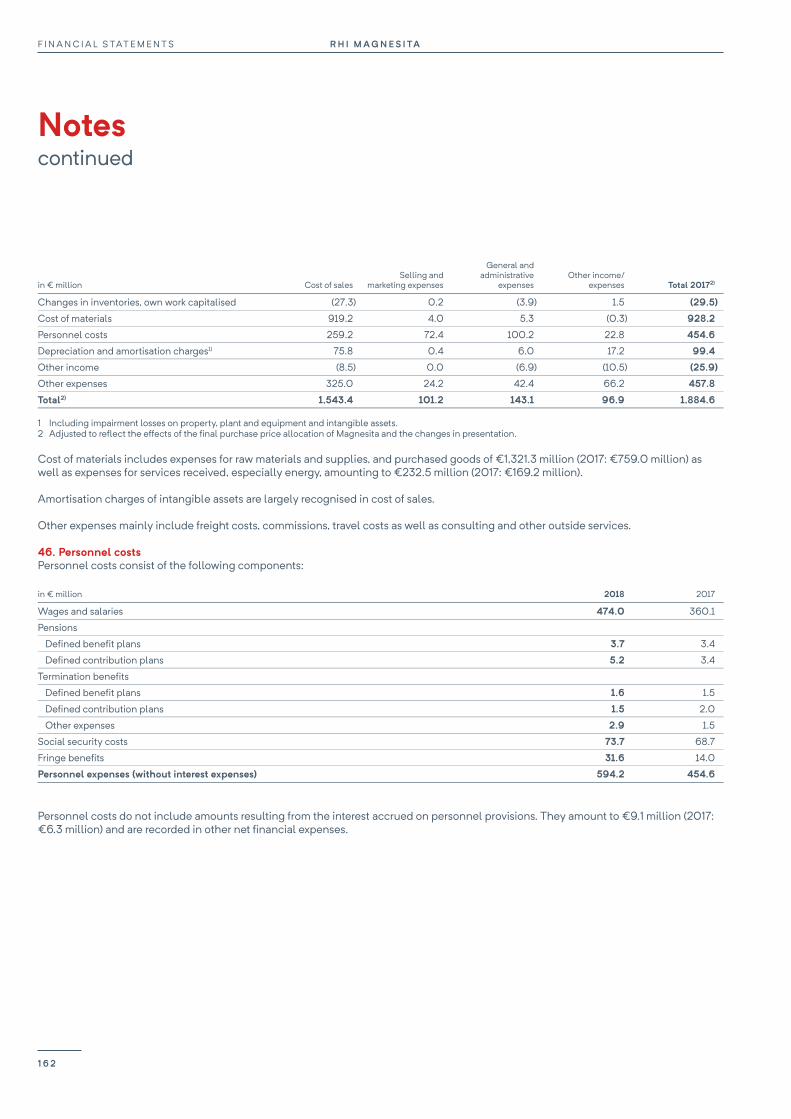
F I N A N C I A L S TAT E M E N T S R H I M AG N E S I TA
Notes continued
160
in € million Cost of sales Selling and
marketing expenses
General and administrative
expenses Other income/
expenses Total 20172)
Changes in inventories, own work capitalised (27.3) 0.2 (3.9) 1.5 (29.5)
Cost of materials 919.2 4.0 5.3 (0.3) 928.2
Personnel costs 259.2 72.4 100.2 22.8 454.6
Depreciation and amortisation charges1) 75.8 0.4 6.0 17.2 99.4
Other income (8.5) 0.0 (6.9) (10.5) (25.9)
Other expenses 325.0 24.2 42.4 66.2 457.8
Total2) 1,543.4 101.2 143.1 96.9 1,884.6
1 Including impairment losses on property, plant and equipment and intangible assets. 2 Adjusted to reflect the effects of the final purchase price allocation of Magnesita and the changes in presentation. Cost of materials includes expenses for raw materials and supplies, and purchased goods of €1,321.3 million (2017: €759.0 million) as well as expenses for services received, especially energy, amounting to €232.5 million (2017: €169.2 million).
Amortisation charges of intangible assets are largely recognised in cost of sales.
Other expenses mainly include freight costs, commissions, travel costs as well as consulting and other outside services.
46. Personnel costs Personnel costs consist of the following components:
in € million 2018 2017
Wages and salaries 474.0 360.1
Pensions
Defined benefit plans 3.7 3.4
Defined contribution plans 5.2 3.4
Termination benefits
Defined benefit plans 1.6 1.5
Defined contribution plans 1.5 2.0
Other expenses 2.9 1.5
Social security costs 73.7 68.7
Fringe benefits 31.6 14.0
Personnel expenses (without interest expenses) 594.2 454.6
Personnel costs do not include amounts resulting from the interest accrued on personnel provisions. They amount to €9.1 million (2017: €6.3 million) and are recorded in other net financial expenses.
R H I M A G N E S I TAF I N A N C I A L S TAT E M E N T S
1 6 2
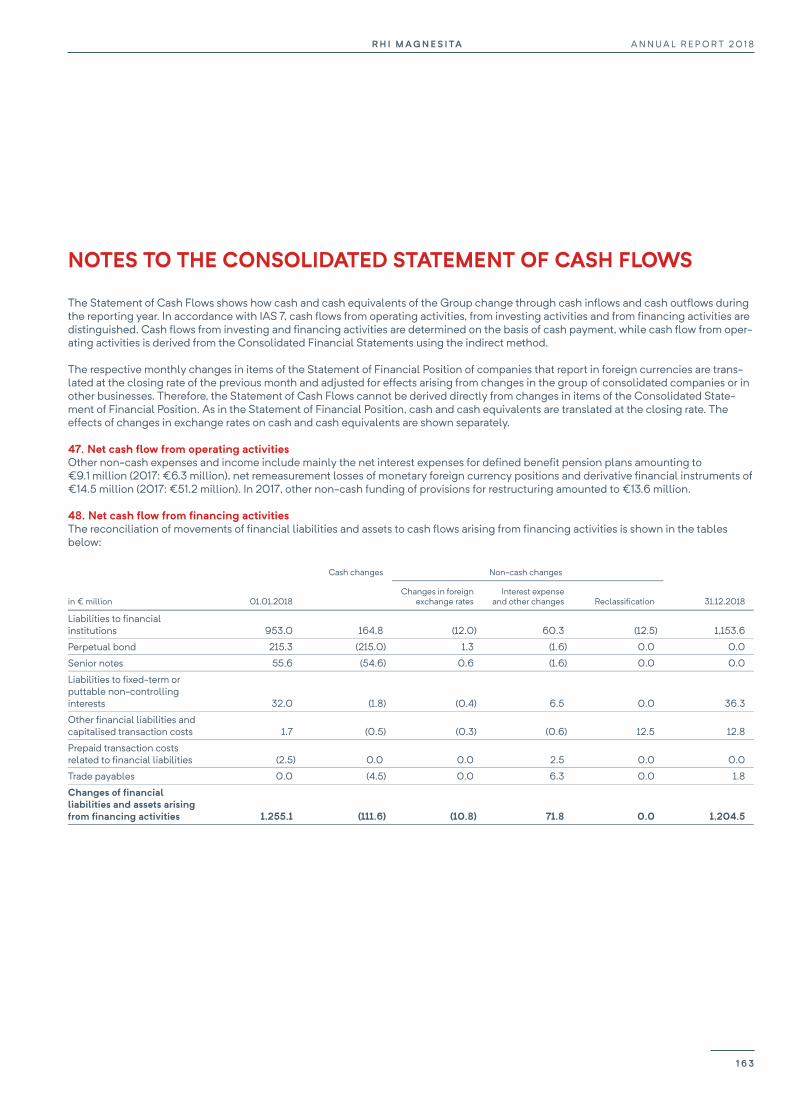
R H I M AG N E S I TA A N N U A L R E P O R T 2 0 1 8
161
The Statement of Cash Flows shows how cash and cash equivalents of the Group change through cash inflows and cash outflows during the reporting year. In accordance with IAS 7, cash flows from operating activities, from investing activities and from financing activities are distinguished. Cash flows from investing and financing activities are determined on the basis of cash payment, while cash flow from oper-ating activities is derived from the Consolidated Financial Statements using the indirect method.
The respective monthly changes in items of the Statement of Financial Position of companies that report in foreign currencies are trans-lated at the closing rate of the previous month and adjusted for effects arising from changes in the group of consolidated companies or in other businesses. Therefore, the Statement of Cash Flows cannot be derived directly from changes in items of the Consolidated State-ment of Financial Position. As in the Statement of Financial Position, cash and cash equivalents are translated at the closing rate. The effects of changes in exchange rates on cash and cash equivalents are shown separately.
47. Net cash flow from operating activities Other non-cash expenses and income include mainly the net interest expenses for defined benefit pension plans amounting to €9.1 million (2017: €6.3 million), net remeasurement losses of monetary foreign currency positions and derivative financial instruments of €14.5 million (2017: €51.2 million). In 2017, other non-cash funding of provisions for restructuring amounted to €13.6 million.
48. Net cash flow from financing activities The reconciliation of movements of financial liabilities and assets to cash flows arising from financing activities is shown in the tables below:
Cash changes Non-cash changes
in € million 01.01.2018 Changes in foreign
exchange rates Interest expense
and other changes Reclassification 31.12.2018
Liabilities to financial institutions 953.0 164.8 (12.0) 60.3 (12.5) 1,153.6
Perpetual bond 215.3 (215.0) 1.3 (1.6) 0.0 0.0
Senior notes 55.6 (54.6) 0.6 (1.6) 0.0 0.0
Liabilities to fixed-term or puttable non-controlling interests 32.0 (1.8) (0.4) 6.5 0.0 36.3
Other financial liabilities and capitalised transaction costs 1.7 (0.5) (0.3) (0.6) 12.5 12.8
Prepaid transaction costs related to financial liabilities (2.5) 0.0 0.0 2.5 0.0 0.0
Trade payables 0.0 (4.5) 0.0 6.3 0.0 1.8
Changes of financial liabilities and assets arising from financing activities 1,255.1 (111.6) (10.8) 71.8 0.0 1,204.5
NOTES TO THE CONSOLIDATED STATEMENT OF CASH FLOWS
A N N U A L R E P O R T 2 0 1 8R H I M A G N E S I TA
1 6 3
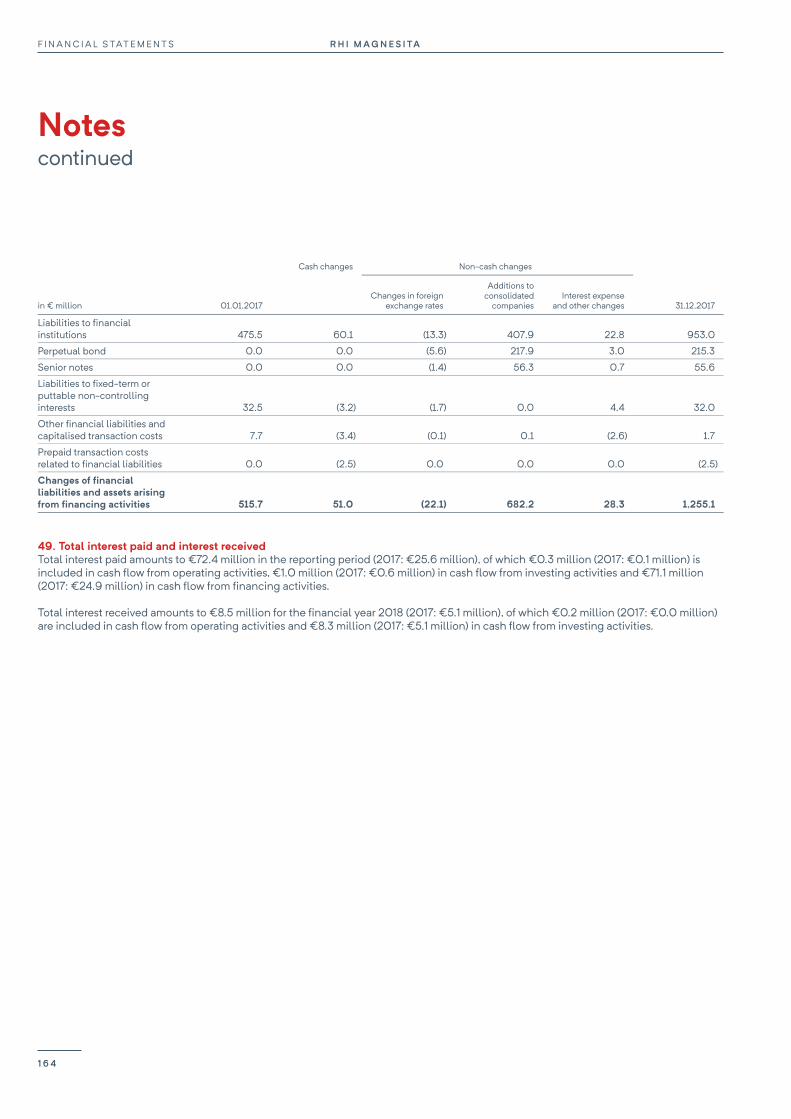
F I N A N C I A L S TAT E M E N T S R H I M AG N E S I TA
Notes continued
162
Cash changes Non-cash changes
in € million 01.01.2017 Changes in foreign
exchange rates
Additions to consolidated
companies Interest expense
and other changes 31.12.2017
Liabilities to financial institutions 475.5 60.1 (13.3) 407.9 22.8 953.0
Perpetual bond 0.0 0.0 (5.6) 217.9 3.0 215.3
Senior notes 0.0 0.0 (1.4) 56.3 0.7 55.6
Liabilities to fixed-term or puttable non-controlling interests 32.5 (3.2) (1.7) 0.0 4.4 32.0
Other financial liabilities and capitalised transaction costs 7.7 (3.4) (0.1) 0.1 (2.6) 1.7
Prepaid transaction costs related to financial liabilities 0.0 (2.5) 0.0 0.0 0.0 (2.5)
Changes of financial liabilities and assets arising from financing activities 515.7 51.0 (22.1) 682.2 28.3 1,255.1
49. Total interest paid and interest received Total interest paid amounts to €72.4 million in the reporting period (2017: €25.6 million), of which €0.3 million (2017: €0.1 million) is included in cash flow from operating activities, €1.0 million (2017: €0.6 million) in cash flow from investing activities and €71.1 million (2017: €24.9 million) in cash flow from financing activities.
Total interest received amounts to €8.5 million for the financial year 2018 (2017: €5.1 million), of which €0.2 million (2017: €0.0 million) are included in cash flow from operating activities and €8.3 million (2017: €5.1 million) in cash flow from investing activities.
R H I M A G N E S I TAF I N A N C I A L S TAT E M E N T S
1 6 4

R H I M AG N E S I TA A N N U A L R E P O R T 2 0 1 8
163
50. Segment reporting Segment reporting by operating company division
The following tables show the financial information for the operating segments for the year 2018 and the previous year:
in € million Steel Industrial Group 2018
Revenue 2,204.3 877.1 3,081.4
Gross profit 522.4 214.5 736.9
EBIT 398.6
Net finance costs (162.7)
Share of profit of joint ventures and associates 10.1
Profit before income tax 246.0
Depreciation and amortisation charges (97.5) (55.9) (153.4)
Segment assets 31.12.2018 1,666.3 948.0 2,614.3
Investments in joint ventures and associates 31.12.2018 21.8
Reconciliation to total assets 902.9
3,539.0
Investments in property, plant and equipment and intangible assets (according to non-current assets statement) 67.7 59.3 127.0
in € million Steel Industrial Group 20171)
Segment revenue 1,312.6 637.5 1,950.1
Gross profit 284.4 122.3 406.7
EBIT 65.5
Net finance costs (82.4)
Share of profit of joint ventures and associates 11.0
Profit before income tax (5.9)
Depreciation and amortisation charges (53.0) (26.6) (79.6)
Segment assets 31.12.2017 1,941.9 742.2 2,684.1
Investments in joint ventures and associates 31.12.2017 21.4
Reconciliation to total assets 807.3
3,512.8
Investments in property, plant and equipment and intangible assets (according to non-current assets statement) 135.5 17.8 153.3
1 Adjusted to reflect the effects of the final purchase price allocation of Magnesita and the changes in presentation.
OTHER DISCLOSURES
A N N U A L R E P O R T 2 0 1 8R H I M A G N E S I TA
1 6 5
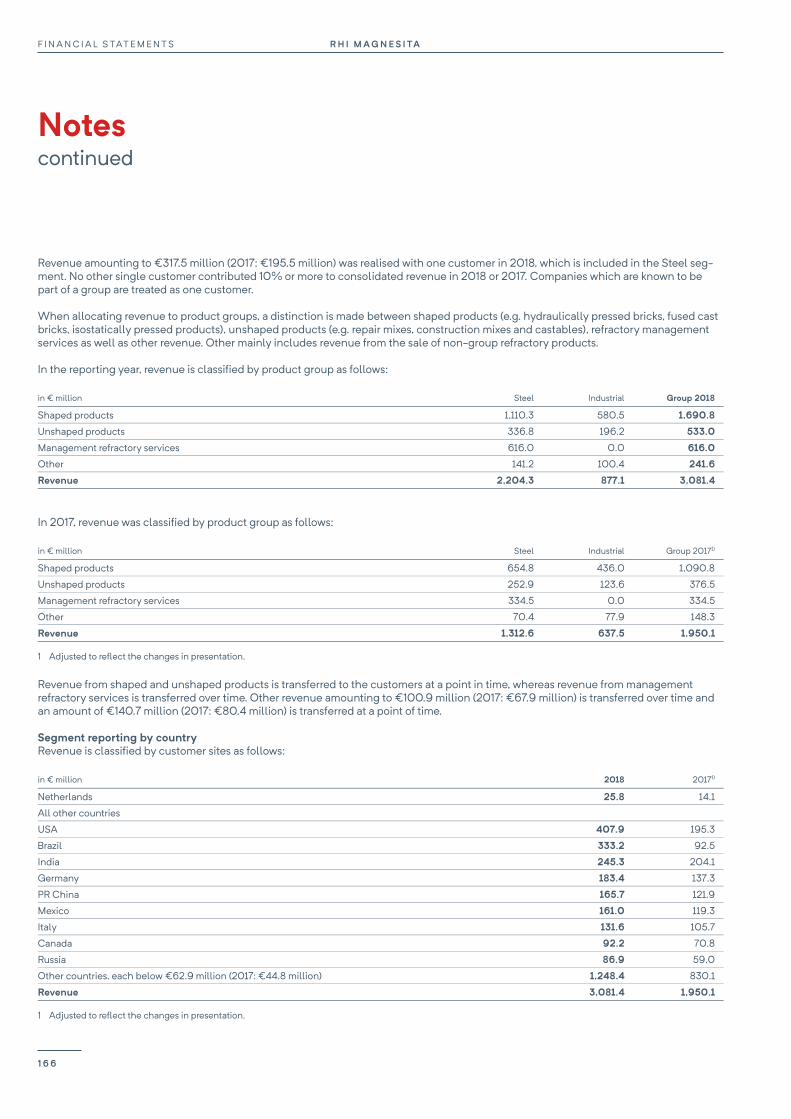
F I N A N C I A L S TAT E M E N T S R H I M AG N E S I TA
Notes continued
164
Revenue amounting to €317.5 million (2017: €195.5 million) was realised with one customer in 2018, which is included in the Steel seg-ment. No other single customer contributed 10% or more to consolidated revenue in 2018 or 2017. Companies which are known to be part of a group are treated as one customer.
When allocating revenue to product groups, a distinction is made between shaped products (e.g. hydraulically pressed bricks, fused cast bricks, isostatically pressed products), unshaped products (e.g. repair mixes, construction mixes and castables), refractory management services as well as other revenue. Other mainly includes revenue from the sale of non-group refractory products.
In the reporting year, revenue is classified by product group as follows:
in € million Steel Industrial Group 2018
Shaped products 1,110.3 580.5 1,690.8
Unshaped products 336.8 196.2 533.0
Management refractory services 616.0 0.0 616.0
Other 141.2 100.4 241.6
Revenue 2,204.3 877.1 3,081.4
In 2017, revenue was classified by product group as follows:
in € million Steel Industrial Group 20171)
Shaped products 654.8 436.0 1,090.8
Unshaped products 252.9 123.6 376.5
Management refractory services 334.5 0.0 334.5
Other 70.4 77.9 148.3
Revenue 1,312.6 637.5 1,950.1
1 Adjusted to reflect the changes in presentation.
Revenue from shaped and unshaped products is transferred to the customers at a point in time, whereas revenue from management refractory services is transferred over time. Other revenue amounting to €100.9 million (2017: €67.9 million) is transferred over time and an amount of €140.7 million (2017: €80.4 million) is transferred at a point of time.
Segment reporting by country Revenue is classified by customer sites as follows:
in € million 2018 20171)
Netherlands 25.8 14.1
All other countries
USA 407.9 195.3
Brazil 333.2 92.5
India 245.3 204.1
Germany 183.4 137.3
PR China 165.7 121.9
Mexico 161.0 119.3
Italy 131.6 105.7
Canada 92.2 70.8
Russia 86.9 59.0
Other countries, each below €62.9 million (2017: €44.8 million) 1,248.4 830.1
Revenue 3,081.4 1,950.1
1 Adjusted to reflect the changes in presentation.
R H I M A G N E S I TAF I N A N C I A L S TAT E M E N T S
1 6 6
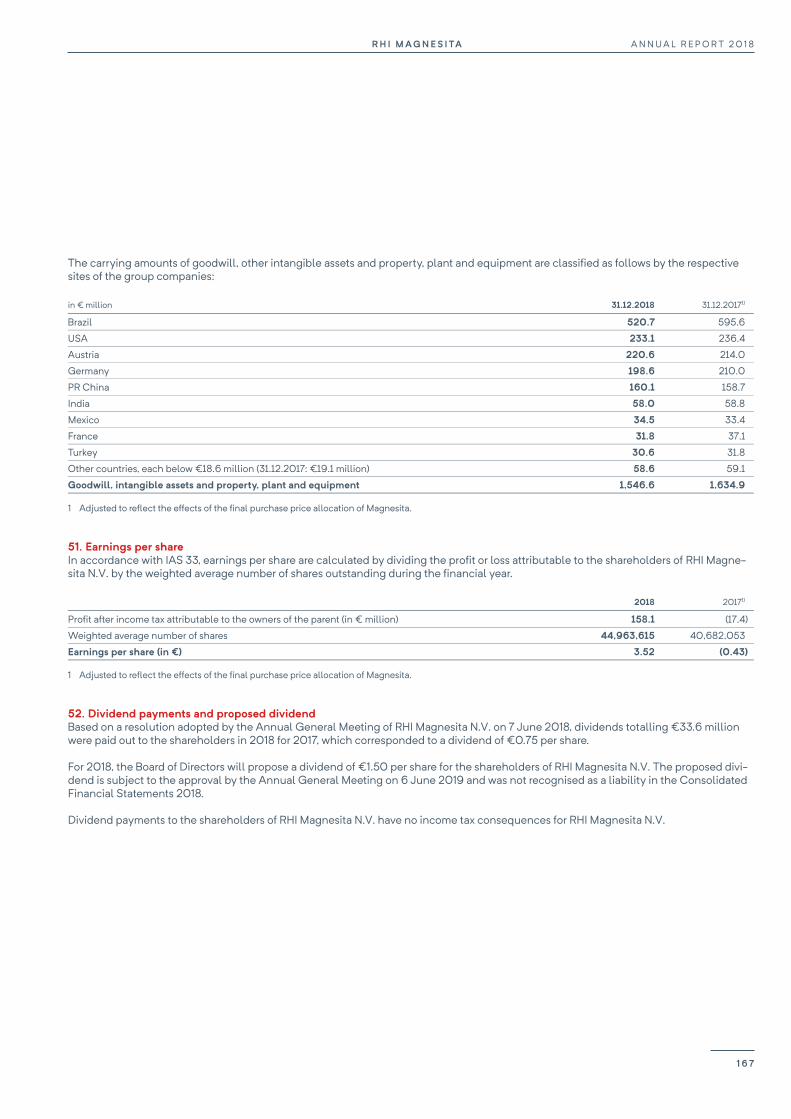
R H I M AG N E S I TA A N N U A L R E P O R T 2 0 1 8
165
The carrying amounts of goodwill, other intangible assets and property, plant and equipment are classified as follows by the respective sites of the group companies:
in € million 31.12.2018 31.12.20171)
Brazil 520.7 595.6
USA 233.1 236.4
Austria 220.6 214.0
Germany 198.6 210.0
PR China 160.1 158.7
India 58.0 58.8
Mexico 34.5 33.4
France 31.8 37.1
Turkey 30.6 31.8
Other countries, each below €18.6 million (31.12.2017: €19.1 million) 58.6 59.1
Goodwill, intangible assets and property, plant and equipment 1,546.6 1,634.9
1 Adjusted to reflect the effects of the final purchase price allocation of Magnesita.
51. Earnings per share In accordance with IAS 33, earnings per share are calculated by dividing the profit or loss attributable to the shareholders of RHI Magne-sita N.V. by the weighted average number of shares outstanding during the financial year.
2018 20171)
Profit after income tax attributable to the owners of the parent (in € million) 158.1 (17.4)
Weighted average number of shares 44,963,615 40,682,053
Earnings per share (in €) 3.52 (0.43)
1 Adjusted to reflect the effects of the final purchase price allocation of Magnesita.
52. Dividend payments and proposed dividend Based on a resolution adopted by the Annual General Meeting of RHI Magnesita N.V. on 7 June 2018, dividends totalling €33.6 million were paid out to the shareholders in 2018 for 2017, which corresponded to a dividend of €0.75 per share.
For 2018, the Board of Directors will propose a dividend of €1.50 per share for the shareholders of RHI Magnesita N.V. The proposed divi-dend is subject to the approval by the Annual General Meeting on 6 June 2019 and was not recognised as a liability in the Consolidated Financial Statements 2018.
Dividend payments to the shareholders of RHI Magnesita N.V. have no income tax consequences for RHI Magnesita N.V.
A N N U A L R E P O R T 2 0 1 8R H I M A G N E S I TA
1 6 7

F I N A N C I A L S TAT E M E N T S R H I M AG N E S I TA
Notes continued
166
53. Additional disclosures on financial instruments The following tables show the carrying amounts and fair values of financial assets and liabilities by measurement category and level and the allocation to the measurement category in accordance with IFRS 13. In addition, carrying amounts are shown aggregated according to measurement category.
31.12.2018 01.01.2018
in € million
Measurement category
IFRS 91) Level Carrying
amount Fair value Carrying
amount Fair value
Other non-current financial assets
Interests in subsidiaries not consolidated FVPL 3 0.7 0.7 0.8 0.8
Investments FVPL 3 0.0 0.0 0.4 0.4
Marketable securities FVPL 1 14.5 14.5 14.9 14.9
Shares FVPL 1 0.0 0.0 1.9 1.9
Shares FVPL 3 0.5 0.5 0.5 0.5
Interest derivatives designated as cash flow hedges - 2 0.6 0.6 1.5 1.5
Non-current receivables from disposal of subsidiaries AC - 0.0 - 2.6 -
Other non-current financial receivables AC - 1.7 - 2.5 -
Trade and other current receivables2) AC - 367.2 - 426.6 -
Other current financial assets
Marketable securities FVPL 1 35.2 35.2 32.3 32.3
Shares FVPL 1 1.1 1.1 0.0 0.0
Derivatives FVPL 2 2.1 2.1 1.7 1.7
Other current financial receivables AC - 0.2 - 0.1 -
Cash and cash equivalents AC - 491.2 - 442.4 -
Financial assets 915.0 928.2
Non-current and current borrowings
Liabilities to financial institutions AC 2 1,153.6 1,165.6 953.0 966.1
Perpetual bonds AC 1 0.0 0.0 215.3 217.0
Senior notes AC 2 0.0 0.0 55.6 55.6
Other financial liabilities and capitalised transaction costs AC 2 12.8 12.8 1.7 1.7
Non-current and current other financial liabilities
Derivatives FVPL 2 20.9 20.9 40.9 40.9
Interest derivatives designated as cash flow hedges - 2 7.3 7.3 0.0 0.0
Liabilities to fixed-term or puttable non-controlling interests AC 2 36.3 36.3 32.0 32.0
Other non-current liabilities
Contingent consideration for acquired subsidiaries FVPL 3 0.6 0.6 0.6 0.6
Trade payables and other current liabilities3) AC - 539.3 - 507.0 -
Financial liabilities 1,770.8 1,806.1
Aggregated according to measurement category
Financial assets measured at FVPL 54.1 52.5
Financial assets measured at amortised cost 860.3 874.2
Financial liabilities measured at amortised cost 1,742.0 1,764.6
Financial liabilities measured at FVPL 21.5 41.5
1 FVPL: Financial assets/financial liabilities measured at fair value through profit or loss. AC: Financial assets/financial liabilities measured at amortised cost. 2 Thereof non-financial receivables per 01.01.2018: €98.4 million. 3 Thereof non-financial liabilities per 01.01.2018: €175.5 million.
R H I M A G N E S I TAF I N A N C I A L S TAT E M E N T S
1 6 8

R H I M AG N E S I TA A N N U A L R E P O R T 2 0 1 8
167
In the RHI Magnesita Group marketable securities, derivative financial instruments, shares, investments and interests in subsidiaries not consolidated are measured at fair value.
Fair value is defined as the amount for which an asset could be exchanged, or a liability settled, between market participants in an arm's length transaction on the day of measurement. When the fair value is determined it is assumed that the transaction in which the asset is sold or the liability is transferred takes place either in the main market for the asset or liability, or in the most favourable market if there is no main market. RHI Magnesita considers the characteristics of the asset or liability to be measured which a market participant would consider in pricing. It is assumed that market participants act in their best economic interest.
RHI Magnesita takes into account the availability of observable market prices in an active market and uses the following hierarchy to determine fair value:
Level 1: Prices quoted in active markets for identical financial instruments.
Level 2: Measurement techniques in which all important data used are based on observable market data.
Level 3: Measurement techniques in which at least one significant parameter is based on non-observable market data.
The fair value of securities, shares, investments and interests in subsidiaries not consolidated is based on price quotations at the reporting date (Level 1), where such quotations exist. In other cases a valuation model (Level 3) would be used for such instruments with the excep-tion that such instruments are immaterial to the group, in which case amortised cost serves as an approximation of fair value.
The fair value of interest derivatives in a hedging relationship (interest rate swaps) is determined by calculating the present value of future cash flows based on current yield curves taking into account the corresponding terms (Level 2).
The fair value of other derivative contracts corresponds to the market value of the forward exchange contracts and the embedded deriva-tives in open orders denominated in a currency other than the functional currency, as well as the market value of a long-term power supply contract, which was classified as a derivative financial instrument since 2015. These derivatives are measured using quoted for-ward rates that are currently observable (Level 2).
The fair value of the contingent consideration liability amounting to €0.6 million recognised in 2017 due to the acquisition of Agellis is determined by discounting the estimated earn-out with the transaction’s internal rate of return (Level 3).
RHI Magnesita takes into account reclassifications in the measurement hierarchy at the end of the reporting period in which the changes occur. Apart from the initial application of IFRS 9, there were no shifts between the different measurement levels in the two reporting periods.
Financial liabilities and liabilities to fixed-term or puttable non-controlling interests are carried at amortised cost in the Consolidated Statement of Financial Position; the fair values of the financial liabilities are only shown in the notes. The fair value of the perpetual bond is based on price quotations at the reporting date (Level 1), all other liabilities are calculated at the present value of the discounted future cash flows using yield curves that are currently observable (Level 2).
The financial receivables approximately correspond to the fair value as due to the amount of the existing receivables no material devia-tion between the fair value and the carrying amount is assumed and the credit default risk is accounted for by forming valuation allow-ances.
The remaining terms of trade and other current receivables and liabilities as well as cash and cash equivalents are predominantly short. Therefore, the carrying amounts of these items approximate fair value at the reporting date.
At the two reporting dates, no contractual netting agreement of financial assets and liabilities were in place.
A N N U A L R E P O R T 2 0 1 8R H I M A G N E S I TA
1 6 9

F I N A N C I A L S TAT E M E N T S R H I M AG N E S I TA
Notes continued
168
Net results by measurement category in accordance with IFRS 9/IAS 39 The effect of financial instruments on the income and expenses recognised in 2018 and 2017 is shown in the following table, classified according to the measurement categories defined in IFRS 9/IAS 39:
in € million 2018 2017
Net gain from financial assets and liabilities measured at fair value through profit or loss 1.4 0.0
Net (loss)/gain from financial assets and liabilities measured at fair value through profit or loss designated on initial recognition (1.2) 0.1
Net loss from financial assets and liabilities measured at amortised cost (123.5) 0.0
Net gain on available-for-sale financial assets recognised in profit or loss 0.0 0.5
Net loss from loans and receivables as well as financial liabilities at amortised cost 0.0 (87.7)
Net gain on financial assets and financial liabilities classified as held for trading 0.0 12.2
The net gain on available-for-sale financial assets recognised in the Consolidated Statement of Profit or Loss includes income from secu-rities and shares, income from the disposal of securities and shares, as well as impairment losses and income from reversals of impairment losses. According to IFRS 9 these financial instruments are now included in the fair value through profit or loss category, hence the corre-sponding gains or losses are included in the gains or losses from financial assets measured at fair value through profit or loss.
The net loss arising from loans and receivables as well as financial liabilities includes interest income and expenses, changes in valuation allowances and losses on derecognition, foreign exchange gains and losses as well as expenses related to the measurement of put op-tions. According to IFRS 9 these financial instruments are now included in the amortised cost category, hence the corresponding gains or losses are included in the gains or losses from financial assets and liabilities measured at amortised cost.
The net gain of financial assets held for trading and financial liabilities includes unrealised results from the measurement of a long-term commodity futures contract as well as changes in the market value and realised results of forward exchange contracts and embedded derivatives in open orders in a currency other than the functional currency of RHI Magnesita, interest derivatives which do not meet the requirements of hedge accounting in accordance with IAS 39 and interest income from securities. According to IFRS 9 these financial instruments are now included in the fair value through profit or loss category, hence the corresponding gains/losses are included in the gains/losses from financial assets and financial liabilities measured at fair value through profit or loss.
The net gain from financial assets and liabilities at fair value through profit or loss designated on initial recognition includes income relat-ed to the measurement of securities and personnel obligations.
Net finance costs include interest income amounting to €9.5 million (2017: €5.0 million) and interest expenses of €69.5 million (2017: €26.5 million), which result from financial assets and liabilities which are not carried at fair value through profit or loss.
54. Derivative financial instruments Commodity forward The RHI Magnesita Group concluded a commodity forward contract for electricity for the fusion plant in Porsgrunn, Norway, in November 2011 which has been accounted for as a financial instrument in accordance with IFRS 9 since 31 December 2015 because the “own-use exemption” (exemption for own use in accordance with IFRS 9.2.6) no longer applies.
The measurement of the entire term of the contract until the end of the year 2023 at market price level leads to a financial liability of €20.9 million at 31 December 2018 (31.12.2017: €40.1 million). The corresponding present value of the cash flows for the agreed electric-ity supply totals €71.3 million at 31 December 2018 (31.12.2017: €83.4 million); the present value of the cash flow at market price amounts to €50.4 million (31.12.2017: €43.3 million).
Interest rate swaps RHI Magnesita has concluded interest rate swaps to hedge the cash flow risk associated to financial liabilities carrying variable interest rates. Variable interest cash flows of financial liabilities were designated as hedged items. The cash flow changes of the hedged items, which result from the changes of the variable interest rates, are balanced out by the cash flow changes of the interest rate swaps. These hedging measures pursue the objective to transform variable-interest financial liabilities into fixed interest financial liabilities, thus hedg-ing the cash flow from the financial liabilities. Ineffectiveness in the hedge relationship may arise due to credit risk, although this risk is assessed to be very low.
R H I M A G N E S I TAF I N A N C I A L S TAT E M E N T S
1 7 0
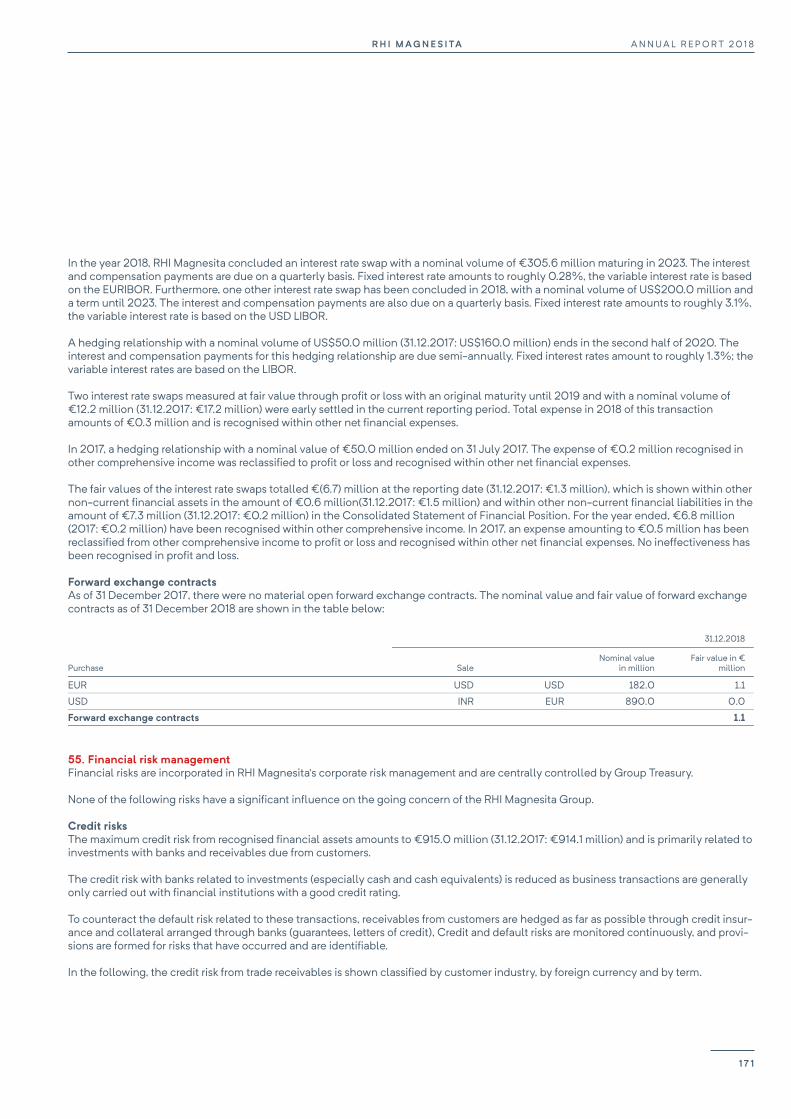
R H I M AG N E S I TA A N N U A L R E P O R T 2 0 1 8
169
In the year 2018, RHI Magnesita concluded an interest rate swap with a nominal volume of €305.6 million maturing in 2023. The interest and compensation payments are due on a quarterly basis. Fixed interest rate amounts to roughly 0.28%, the variable interest rate is based on the EURIBOR. Furthermore, one other interest rate swap has been concluded in 2018, with a nominal volume of US$200.0 million and a term until 2023. The interest and compensation payments are also due on a quarterly basis. Fixed interest rate amounts to roughly 3.1%, the variable interest rate is based on the USD LIBOR.
A hedging relationship with a nominal volume of US$50.0 million (31.12.2017: US$160.0 million) ends in the second half of 2020. The interest and compensation payments for this hedging relationship are due semi-annually. Fixed interest rates amount to roughly 1.3%; the variable interest rates are based on the LIBOR.
Two interest rate swaps measured at fair value through profit or loss with an original maturity until 2019 and with a nominal volume of €12.2 million (31.12.2017: €17.2 million) were early settled in the current reporting period. Total expense in 2018 of this transaction amounts of €0.3 million and is recognised within other net financial expenses.
In 2017, a hedging relationship with a nominal value of €50.0 million ended on 31 July 2017. The expense of €0.2 million recognised in other comprehensive income was reclassified to profit or loss and recognised within other net financial expenses.
The fair values of the interest rate swaps totalled €(6.7) million at the reporting date (31.12.2017: €1.3 million), which is shown within other non-current financial assets in the amount of €0.6 million(31.12.2017: €1.5 million) and within other non-current financial liabilities in the amount of €7.3 million (31.12.2017: €0.2 million) in the Consolidated Statement of Financial Position. For the year ended, €6.8 million (2017: €0.2 million) have been recognised within other comprehensive income. In 2017, an expense amounting to €0.5 million has been reclassified from other comprehensive income to profit or loss and recognised within other net financial expenses. No ineffectiveness has been recognised in profit and loss.
Forward exchange contracts As of 31 December 2017, there were no material open forward exchange contracts. The nominal value and fair value of forward exchange contracts as of 31 December 2018 are shown in the table below:
31.12.2018
Purchase Sale Nominal value
in million Fair value in €
million
EUR USD USD 182.0 1.1
USD INR EUR 890.0 0.0
Forward exchange contracts 1.1
55. Financial risk management Financial risks are incorporated in RHI Magnesita’s corporate risk management and are centrally controlled by Group Treasury.
None of the following risks have a significant influence on the going concern of the RHI Magnesita Group.
Credit risks The maximum credit risk from recognised financial assets amounts to €915.0 million (31.12.2017: €914.1 million) and is primarily related to investments with banks and receivables due from customers.
The credit risk with banks related to investments (especially cash and cash equivalents) is reduced as business transactions are generally only carried out with financial institutions with a good credit rating.
To counteract the default risk related to these transactions, receivables from customers are hedged as far as possible through credit insur-ance and collateral arranged through banks (guarantees, letters of credit), Credit and default risks are monitored continuously, and provi-sions are formed for risks that have occurred and are identifiable.
In the following, the credit risk from trade receivables is shown classified by customer industry, by foreign currency and by term.
A N N U A L R E P O R T 2 0 1 8R H I M A G N E S I TA
1 7 1
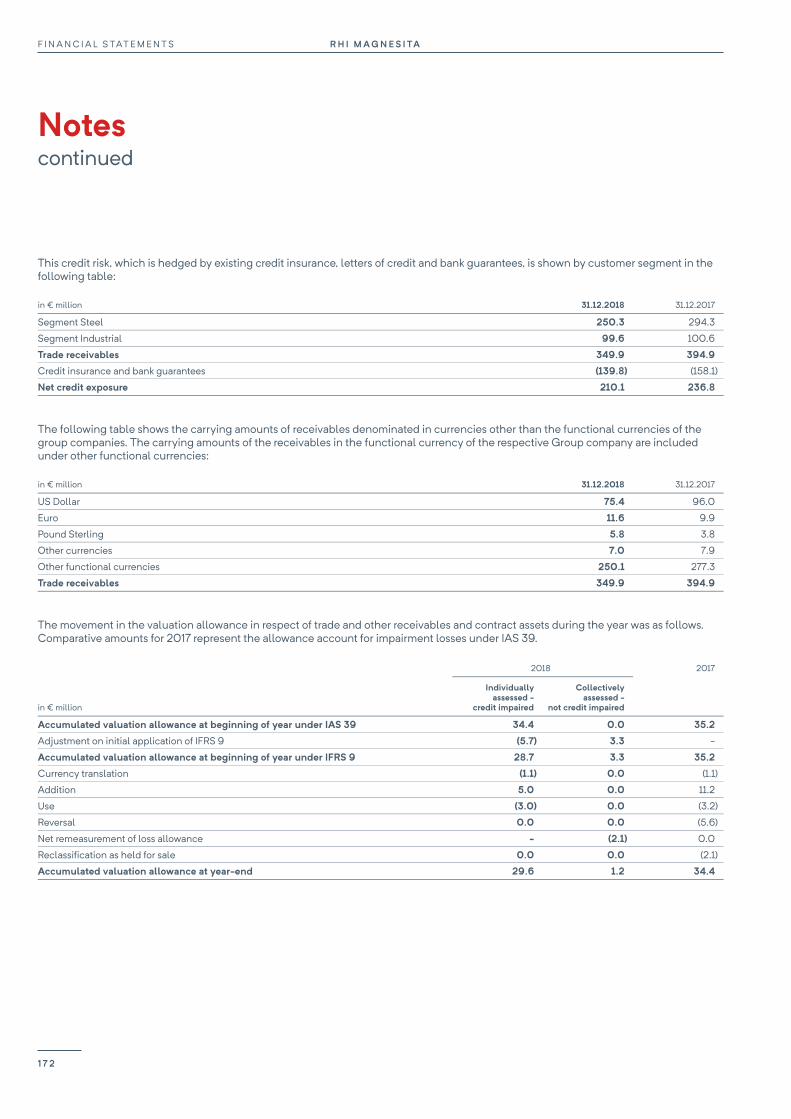
F I N A N C I A L S TAT E M E N T S R H I M AG N E S I TA
Notes continued
170
This credit risk, which is hedged by existing credit insurance, letters of credit and bank guarantees, is shown by customer segment in the following table:
in € million 31.12.2018 31.12.2017
Segment Steel 250.3 294.3
Segment Industrial 99.6 100.6
Trade receivables 349.9 394.9
Credit insurance and bank guarantees (139.8) (158.1)
Net credit exposure 210.1 236.8
The following table shows the carrying amounts of receivables denominated in currencies other than the functional currencies of the group companies. The carrying amounts of the receivables in the functional currency of the respective Group company are included under other functional currencies:
in € million 31.12.2018 31.12.2017
US Dollar 75.4 96.0
Euro 11.6 9.9
Pound Sterling 5.8 3.8
Other currencies 7.0 7.9
Other functional currencies 250.1 277.3
Trade receivables 349.9 394.9
The movement in the valuation allowance in respect of trade and other receivables and contract assets during the year was as follows. Comparative amounts for 2017 represent the allowance account for impairment losses under IAS 39.
2018 2017
in € million
Individually assessed -
credit impaired
Collectively assessed -
not credit impaired
Accumulated valuation allowance at beginning of year under IAS 39 34.4 0.0 35.2
Adjustment on initial application of IFRS 9 (5.7) 3.3 -
Accumulated valuation allowance at beginning of year under IFRS 9 28.7 3.3 35.2
Currency translation (1.1) 0.0 (1.1)
Addition 5.0 0.0 11.2
Use (3.0) 0.0 (3.2)
Reversal 0.0 0.0 (5.6)
Net remeasurement of loss allowance - (2.1) 0.0
Reclassification as held for sale 0.0 0.0 (2.1)
Accumulated valuation allowance at year-end 29.6 1.2 34.4
R H I M A G N E S I TAF I N A N C I A L S TAT E M E N T S
1 7 2
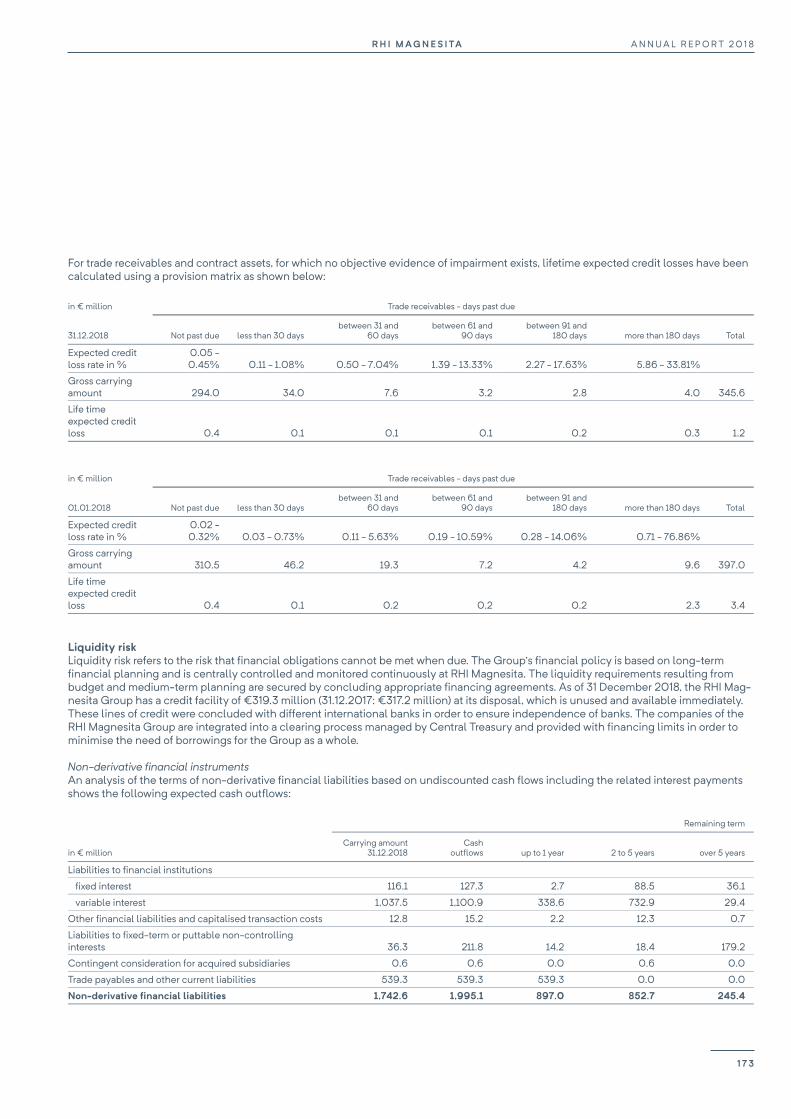
R H I M AG N E S I TA A N N U A L R E P O R T 2 0 1 8
171
For trade receivables and contract assets, for which no objective evidence of impairment exists, lifetime expected credit losses have been calculated using a provision matrix as shown below:
in € million Trade receivables - days past due
31.12.2018 Not past due less than 30 days between 31 and
60 days between 61 and
90 days between 91 and
180 days more than 180 days Total
Expected credit loss rate in %
0.05 - 0.45% 0.11 - 1.08% 0.50 - 7.04% 1.39 - 13.33% 2.27 - 17.63% 5.86 - 33.81%
Gross carrying amount 294.0 34.0 7.6 3.2 2.8 4.0 345.6
Life time expected credit loss 0.4 0.1 0.1 0.1 0.2 0.3 1.2
in € million Trade receivables - days past due
01.01.2018 Not past due less than 30 days between 31 and
60 days between 61 and
90 days between 91 and
180 days more than 180 days Total
Expected credit loss rate in %
0.02 - 0.32% 0.03 - 0.73% 0.11 - 5.63% 0.19 - 10.59% 0.28 - 14.06% 0.71 - 76.86%
Gross carrying amount 310.5 46.2 19.3 7.2 4.2 9.6 397.0
Life time expected credit loss 0.4 0.1 0.2 0.2 0.2 2.3 3.4
Liquidity risk Liquidity risk refers to the risk that financial obligations cannot be met when due. The Group’s financial policy is based on long-term financial planning and is centrally controlled and monitored continuously at RHI Magnesita. The liquidity requirements resulting from budget and medium-term planning are secured by concluding appropriate financing agreements. As of 31 December 2018, the RHI Mag-nesita Group has a credit facility of €319.3 million (31.12.2017: €317.2 million) at its disposal, which is unused and available immediately. These lines of credit were concluded with different international banks in order to ensure independence of banks. The companies of the RHI Magnesita Group are integrated into a clearing process managed by Central Treasury and provided with financing limits in order to minimise the need of borrowings for the Group as a whole.
Non-derivative financial instruments An analysis of the terms of non-derivative financial liabilities based on undiscounted cash flows including the related interest payments shows the following expected cash outflows:
Remaining term
in € million Carrying amount
31.12.2018 Cash
outflows up to 1 year 2 to 5 years over 5 years
Liabilities to financial institutions
fixed interest 116.1 127.3 2.7 88.5 36.1
variable interest 1,037.5 1,100.9 338.6 732.9 29.4
Other financial liabilities and capitalised transaction costs 12.8 15.2 2.2 12.3 0.7
Liabilities to fixed-term or puttable non-controlling interests 36.3 211.8 14.2 18.4 179.2
Contingent consideration for acquired subsidiaries 0.6 0.6 0.0 0.6 0.0
Trade payables and other current liabilities 539.3 539.3 539.3 0.0 0.0
Non-derivative financial liabilities 1,742.6 1,995.1 897.0 852.7 245.4
A N N U A L R E P O R T 2 0 1 8R H I M A G N E S I TA
1 7 3

F I N A N C I A L S TAT E M E N T S R H I M AG N E S I TA
Notes continued
172
Remaining term
in € million Carrying amount
31.12.20171) Cash
outflows up to 1 year 2 to 5 years over 5 years
Liabilities to financial institutions
fixed interest 176.7 202.7 60.6 96.8 45.3
variable interest 776.3 858.1 146.5 683.7 27.9
Perpetual bond 215.3 309.5 79.1 52.9 177.5
Senior Notes 55.5 66.0 5.2 60.8 0.0
Other financial liabilities and capitalised transaction costs 1.7 1.8 0.9 0.8 0.1
Liabilities to fixed-term or puttable non-controlling interests 32.0 161.0 10.1 12.3 138.6
Contingent consideration for acquired subsidiaries 0.6 0.6 0.0 0.6 0.0
Trade payables and other current liabilities 507.0 507.0 507.0 0.0 0.0
Non-derivative financial liabilities 1,765.1 2,106.7 809.4 907.9 389.4
1 Adjusted to reflect the effects of the final purchase price allocation of Magnesita.
Derivative financial instruments The remaining terms of derivative financial instruments based on expected undiscounted cash flow as of 31 December 2018 and 31 December 2017 are shown in the table below:
Remaining term
in € million Carrying amount
31.12.2018 Cash flows up to 1 year 2 to 5 years over 5 years
Receivables from derivatives with net settlement
Interest rate swaps 0.6 0.6 0.5 0.1 0.0
Derivatives in open orders 1.0 1.0 1.0 0.0 0.0
Forward exchange contracts 1.1 1.1 1.1 0.0 0.0
Liabilities from derivatives with net settlement
Derivatives from supply contracts 20.9 22.2 1.0 21.2 0.0
Interest rate swaps 7.3 8.1 2.4 5.7 0.0
Remaining term
in € million Carrying amount
31.12.2017 Cash flows up to 1 year 2 to 5 years over 5 years
Receivables from derivatives with net settlement
Interest rate swaps 1.5 1.5 0.9 0.6 0.0
Financial assets held for trading 1.7 1.7 1.7 0.0 0.0
Liabilities from derivatives with net settlement
Financial liabilities held for trading 40.9 43.5 7.5 28.8 7.2
Foreign currency risks Foreign currency risks arise where business transactions (operating activities, investments, financing) are conducted in a currency other than the functional currency of a company. They are monitored at the group level and analysed with respect to hedging options. Usually the net position of the Group in the respective currency serves as the basis for decisions regarding the use of hedging instruments.
F I N A N C I A L S TAT E M E N T S R H I M AG N E S I TA
Notes continued
170
This credit risk, which is hedged by existing credit insurance, letters of credit and bank guarantees, is shown by customer segment in the following table:
in € million 31.12.2018 31.12.2017
Segment Steel 250.3 294.3
Segment Industrial 99.6 100.6
Trade receivables 349.9 394.9
Credit insurance and bank guarantees (139.8) (158.1)
Net credit exposure 210.1 236.8
The following table shows the carrying amounts of receivables denominated in currencies other than the functional currencies of the group companies. The carrying amounts of the receivables in the functional currency of the respective Group company are included under other functional currencies:
in € million 31.12.2018 31.12.2017
US Dollar 75.4 96.0
Euro 11.6 9.9
Pound Sterling 5.8 3.8
Other currencies 7.0 7.9
Other functional currencies 250.1 277.3
Trade receivables 349.9 394.9
The movement in the valuation allowance in respect of trade and other receivables and contract assets during the year was as follows. Comparative amounts for 2017 represent the allowance account for impairment losses under IAS 39.
2018 2017
in € million
Individually assessed -
credit impaired
Collectively assessed -
not credit impaired
Accumulated valuation allowance at beginning of year under IAS 39 34.4 0.0 35.2
Adjustment on initial application of IFRS 9 (5.7) 3.3 -
Accumulated valuation allowance at beginning of year under IFRS 9 28.7 3.3 35.2
Currency translation (1.1) 0.0 (1.1)
Addition 5.0 0.0 11.2
Use (3.0) 0.0 (3.2)
Reversal 0.0 0.0 (5.6)
Net remeasurement of loss allowance - (2.1) 0.0
Reclassification as held for sale 0.0 0.0 (2.1)
Accumulated valuation allowance at year-end 29.6 1.2 34.4
R H I M A G N E S I TAF I N A N C I A L S TAT E M E N T S
1 74
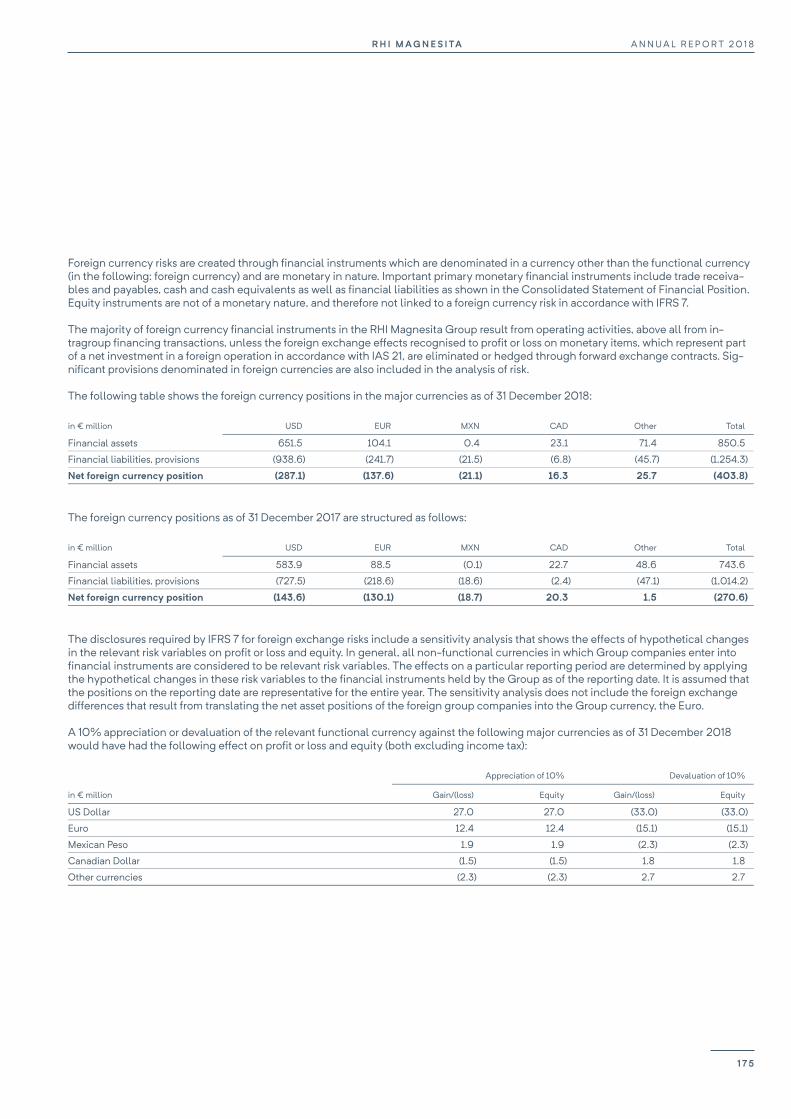
R H I M AG N E S I TA A N N U A L R E P O R T 2 0 1 8
173
Foreign currency risks are created through financial instruments which are denominated in a currency other than the functional currency (in the following: foreign currency) and are monetary in nature. Important primary monetary financial instruments include trade receiva-bles and payables, cash and cash equivalents as well as financial liabilities as shown in the Consolidated Statement of Financial Position. Equity instruments are not of a monetary nature, and therefore not linked to a foreign currency risk in accordance with IFRS 7.
The majority of foreign currency financial instruments in the RHI Magnesita Group result from operating activities, above all from in-tragroup financing transactions, unless the foreign exchange effects recognised to profit or loss on monetary items, which represent part of a net investment in a foreign operation in accordance with IAS 21, are eliminated or hedged through forward exchange contracts. Sig-nificant provisions denominated in foreign currencies are also included in the analysis of risk.
The following table shows the foreign currency positions in the major currencies as of 31 December 2018:
in € million USD EUR MXN CAD Other Total
Financial assets 651.5 104.1 0.4 23.1 71.4 850.5
Financial liabilities, provisions (938.6) (241.7) (21.5) (6.8) (45.7) (1,254.3)
Net foreign currency position (287.1) (137.6) (21.1) 16.3 25.7 (403.8)
The foreign currency positions as of 31 December 2017 are structured as follows:
in € million USD EUR MXN CAD Other Total
Financial assets 583.9 88.5 (0.1) 22.7 48.6 743.6
Financial liabilities, provisions (727.5) (218.6) (18.6) (2.4) (47.1) (1,014.2)
Net foreign currency position (143.6) (130.1) (18.7) 20.3 1.5 (270.6)
The disclosures required by IFRS 7 for foreign exchange risks include a sensitivity analysis that shows the effects of hypothetical changes in the relevant risk variables on profit or loss and equity. In general, all non-functional currencies in which Group companies enter into financial instruments are considered to be relevant risk variables. The effects on a particular reporting period are determined by applying the hypothetical changes in these risk variables to the financial instruments held by the Group as of the reporting date. It is assumed that the positions on the reporting date are representative for the entire year. The sensitivity analysis does not include the foreign exchange differences that result from translating the net asset positions of the foreign group companies into the Group currency, the Euro.
A 10% appreciation or devaluation of the relevant functional currency against the following major currencies as of 31 December 2018 would have had the following effect on profit or loss and equity (both excluding income tax):
Appreciation of 10% Devaluation of 10%
in € million Gain/(loss) Equity Gain/(loss) Equity
US Dollar 27.0 27.0 (33.0) (33.0)
Euro 12.4 12.4 (15.1) (15.1)
Mexican Peso 1.9 1.9 (2.3) (2.3)
Canadian Dollar (1.5) (1.5) 1.8 1.8
Other currencies (2.3) (2.3) 2.7 2.7
A N N U A L R E P O R T 2 0 1 8R H I M A G N E S I TA
1 7 5
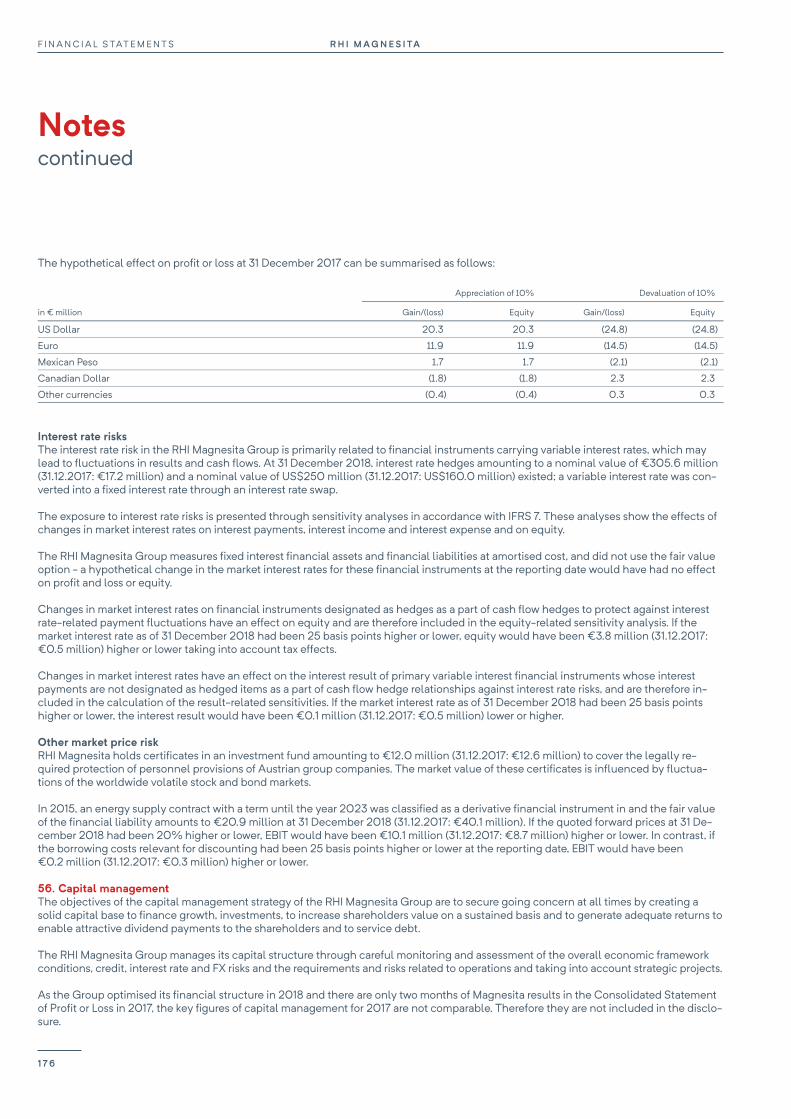
F I N A N C I A L S TAT E M E N T S R H I M AG N E S I TA
Notes continued
174
The hypothetical effect on profit or loss at 31 December 2017 can be summarised as follows:
Appreciation of 10% Devaluation of 10%
in € million Gain/(loss) Equity Gain/(loss) Equity
US Dollar 20.3 20.3 (24.8) (24.8)
Euro 11.9 11.9 (14.5) (14.5)
Mexican Peso 1.7 1.7 (2.1) (2.1)
Canadian Dollar (1.8) (1.8) 2.3 2.3
Other currencies (0.4) (0.4) 0.3 0.3
Interest rate risks The interest rate risk in the RHI Magnesita Group is primarily related to financial instruments carrying variable interest rates, which may lead to fluctuations in results and cash flows. At 31 December 2018, interest rate hedges amounting to a nominal value of €305.6 million (31.12.2017: €17.2 million) and a nominal value of US$250 million (31.12.2017: US$160.0 million) existed; a variable interest rate was con-verted into a fixed interest rate through an interest rate swap.
The exposure to interest rate risks is presented through sensitivity analyses in accordance with IFRS 7. These analyses show the effects of changes in market interest rates on interest payments, interest income and interest expense and on equity.
The RHI Magnesita Group measures fixed interest financial assets and financial liabilities at amortised cost, and did not use the fair value option - a hypothetical change in the market interest rates for these financial instruments at the reporting date would have had no effect on profit and loss or equity.
Changes in market interest rates on financial instruments designated as hedges as a part of cash flow hedges to protect against interest rate-related payment fluctuations have an effect on equity and are therefore included in the equity-related sensitivity analysis. If the market interest rate as of 31 December 2018 had been 25 basis points higher or lower, equity would have been €3.8 million (31.12.2017: €0.5 million) higher or lower taking into account tax effects.
Changes in market interest rates have an effect on the interest result of primary variable interest financial instruments whose interest payments are not designated as hedged items as a part of cash flow hedge relationships against interest rate risks, and are therefore in-cluded in the calculation of the result-related sensitivities. If the market interest rate as of 31 December 2018 had been 25 basis points higher or lower, the interest result would have been €0.1 million (31.12.2017: €0.5 million) lower or higher.
Other market price risk RHI Magnesita holds certificates in an investment fund amounting to €12.0 million (31.12.2017: €12.6 million) to cover the legally re-quired protection of personnel provisions of Austrian group companies. The market value of these certificates is influenced by fluctua-tions of the worldwide volatile stock and bond markets.
In 2015, an energy supply contract with a term until the year 2023 was classified as a derivative financial instrument in and the fair value of the financial liability amounts to €20.9 million at 31 December 2018 (31.12.2017: €40.1 million). If the quoted forward prices at 31 De-cember 2018 had been 20% higher or lower, EBIT would have been €10.1 million (31.12.2017: €8.7 million) higher or lower. In contrast, if the borrowing costs relevant for discounting had been 25 basis points higher or lower at the reporting date, EBIT would have been €0.2 million (31.12.2017: €0.3 million) higher or lower.
56. Capital management The objectives of the capital management strategy of the RHI Magnesita Group are to secure going concern at all times by creating a solid capital base to finance growth, investments, to increase shareholders value on a sustained basis and to generate adequate returns to enable attractive dividend payments to the shareholders and to service debt.
The RHI Magnesita Group manages its capital structure through careful monitoring and assessment of the overall economic framework conditions, credit, interest rate and FX risks and the requirements and risks related to operations and taking into account strategic projects.
As the Group optimised its financial structure in 2018 and there are only two months of Magnesita results in the Consolidated Statement of Profit or Loss in 2017, the key figures of capital management for 2017 are not comparable. Therefore they are not included in the disclo-sure.
R H I M A G N E S I TAF I N A N C I A L S TAT E M E N T S
1 7 6
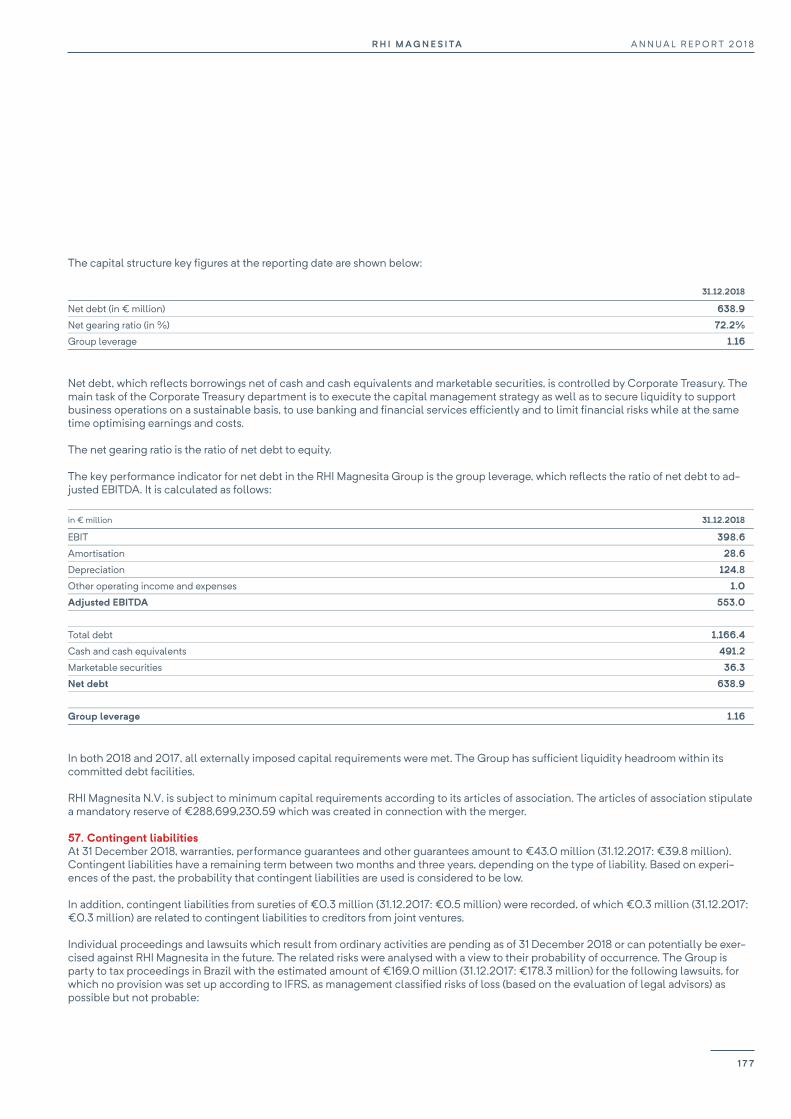
R H I M AG N E S I TA A N N U A L R E P O R T 2 0 1 8
175
The capital structure key figures at the reporting date are shown below:
31.12.2018
Net debt (in € million) 638.9
Net gearing ratio (in %) 72.2%
Group leverage 1.16
Net debt, which reflects borrowings net of cash and cash equivalents and marketable securities, is controlled by Corporate Treasury. The main task of the Corporate Treasury department is to execute the capital management strategy as well as to secure liquidity to support business operations on a sustainable basis, to use banking and financial services efficiently and to limit financial risks while at the same time optimising earnings and costs.
The net gearing ratio is the ratio of net debt to equity.
The key performance indicator for net debt in the RHI Magnesita Group is the group leverage, which reflects the ratio of net debt to ad-justed EBITDA. It is calculated as follows:
in € million 31.12.2018
EBIT 398.6
Amortisation 28.6
Depreciation 124.8
Other operating income and expenses 1.0
Adjusted EBITDA 553.0
Total debt 1,166.4
Cash and cash equivalents 491.2
Marketable securities 36.3
Net debt 638.9
Group leverage 1.16
In both 2018 and 2017, all externally imposed capital requirements were met. The Group has sufficient liquidity headroom within its committed debt facilities.
RHI Magnesita N.V. is subject to minimum capital requirements according to its articles of association. The articles of association stipulate a mandatory reserve of €288,699,230.59 which was created in connection with the merger.
57. Contingent liabilities At 31 December 2018, warranties, performance guarantees and other guarantees amount to €43.0 million (31.12.2017: €39.8 million). Contingent liabilities have a remaining term between two months and three years, depending on the type of liability. Based on experi-ences of the past, the probability that contingent liabilities are used is considered to be low.
In addition, contingent liabilities from sureties of €0.3 million (31.12.2017: €0.5 million) were recorded, of which €0.3 million (31.12.2017: €0.3 million) are related to contingent liabilities to creditors from joint ventures.
Individual proceedings and lawsuits which result from ordinary activities are pending as of 31 December 2018 or can potentially be exer-cised against RHI Magnesita in the future. The related risks were analysed with a view to their probability of occurrence. The Group is party to tax proceedings in Brazil with the estimated amount of €169.0 million (31.12.2017: €178.3 million) for the following lawsuits, for which no provision was set up according to IFRS, as management classified risks of loss (based on the evaluation of legal advisors) as possible but not probable:
A N N U A L R E P O R T 2 0 1 8R H I M A G N E S I TA
1 7 7
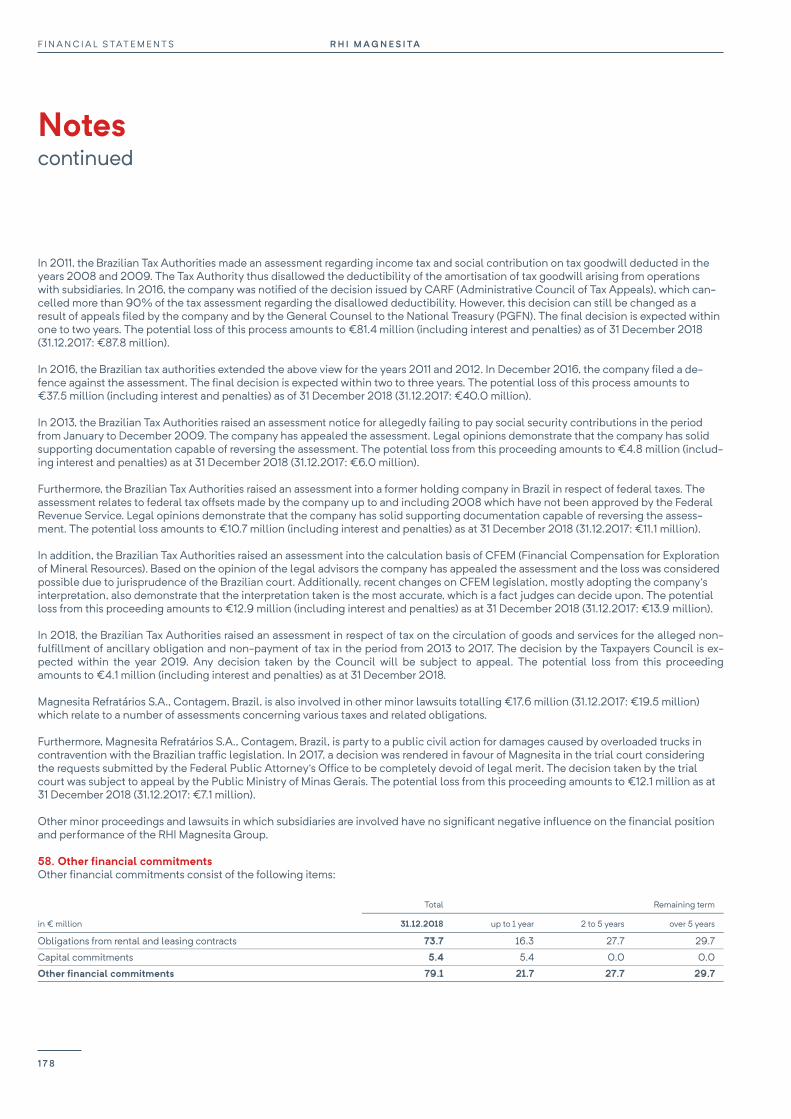
F I N A N C I A L S TAT E M E N T S R H I M AG N E S I TA
Notes continued
176
In 2011, the Brazilian Tax Authorities made an assessment regarding income tax and social contribution on tax goodwill deducted in the years 2008 and 2009. The Tax Authority thus disallowed the deductibility of the amortisation of tax goodwill arising from operations with subsidiaries. In 2016, the company was notified of the decision issued by CARF (Administrative Council of Tax Appeals), which can-celled more than 90% of the tax assessment regarding the disallowed deductibility. However, this decision can still be changed as a result of appeals filed by the company and by the General Counsel to the National Treasury (PGFN). The final decision is expected within one to two years. The potential loss of this process amounts to €81.4 million (including interest and penalties) as of 31 December 2018 (31.12.2017: €87.8 million).
In 2016, the Brazilian tax authorities extended the above view for the years 2011 and 2012. In December 2016, the company filed a de-fence against the assessment. The final decision is expected within two to three years. The potential loss of this process amounts to €37.5 million (including interest and penalties) as of 31 December 2018 (31.12.2017: €40.0 million).
In 2013, the Brazilian Tax Authorities raised an assessment notice for allegedly failing to pay social security contributions in the period from January to December 2009. The company has appealed the assessment. Legal opinions demonstrate that the company has solid supporting documentation capable of reversing the assessment. The potential loss from this proceeding amounts to €4.8 million (includ-ing interest and penalties) as at 31 December 2018 (31.12.2017: €6.0 million).
Furthermore, the Brazilian Tax Authorities raised an assessment into a former holding company in Brazil in respect of federal taxes. The assessment relates to federal tax offsets made by the company up to and including 2008 which have not been approved by the Federal Revenue Service. Legal opinions demonstrate that the company has solid supporting documentation capable of reversing the assess-ment. The potential loss amounts to €10.7 million (including interest and penalties) as at 31 December 2018 (31.12.2017: €11.1 million).
In addition, the Brazilian Tax Authorities raised an assessment into the calculation basis of CFEM (Financial Compensation for Exploration of Mineral Resources). Based on the opinion of the legal advisors the company has appealed the assessment and the loss was considered possible due to jurisprudence of the Brazilian court. Additionally, recent changes on CFEM legislation, mostly adopting the company’s interpretation, also demonstrate that the interpretation taken is the most accurate, which is a fact judges can decide upon. The potential loss from this proceeding amounts to €12.9 million (including interest and penalties) as at 31 December 2018 (31.12.2017: €13.9 million).
In 2018, the Brazilian Tax Authorities raised an assessment in respect of tax on the circulation of goods and services for the alleged non-fulfillment of ancillary obligation and non-payment of tax in the period from 2013 to 2017. The decision by the Taxpayers Council is ex-pected within the year 2019. Any decision taken by the Council will be subject to appeal. The potential loss from this proceeding amounts to €4.1 million (including interest and penalties) as at 31 December 2018.
Magnesita Refratários S.A., Contagem, Brazil, is also involved in other minor lawsuits totalling €17.6 million (31.12.2017: €19.5 million) which relate to a number of assessments concerning various taxes and related obligations.
Furthermore, Magnesita Refratários S.A., Contagem, Brazil, is party to a public civil action for damages caused by overloaded trucks in contravention with the Brazilian traffic legislation. In 2017, a decision was rendered in favour of Magnesita in the trial court considering the requests submitted by the Federal Public Attorney's Office to be completely devoid of legal merit. The decision taken by the trial court was subject to appeal by the Public Ministry of Minas Gerais. The potential loss from this proceeding amounts to €12.1 million as at 31 December 2018 (31.12.2017: €7.1 million).
Other minor proceedings and lawsuits in which subsidiaries are involved have no significant negative influence on the financial position and performance of the RHI Magnesita Group.
58. Other financial commitments Other financial commitments consist of the following items:
Total Remaining term
in € million 31.12.2018 up to 1 year 2 to 5 years over 5 years
Obligations from rental and leasing contracts 73.7 16.3 27.7 29.7
Capital commitments 5.4 5.4 0.0 0.0
Other financial commitments 79.1 21.7 27.7 29.7
R H I M A G N E S I TAF I N A N C I A L S TAT E M E N T S
1 7 8
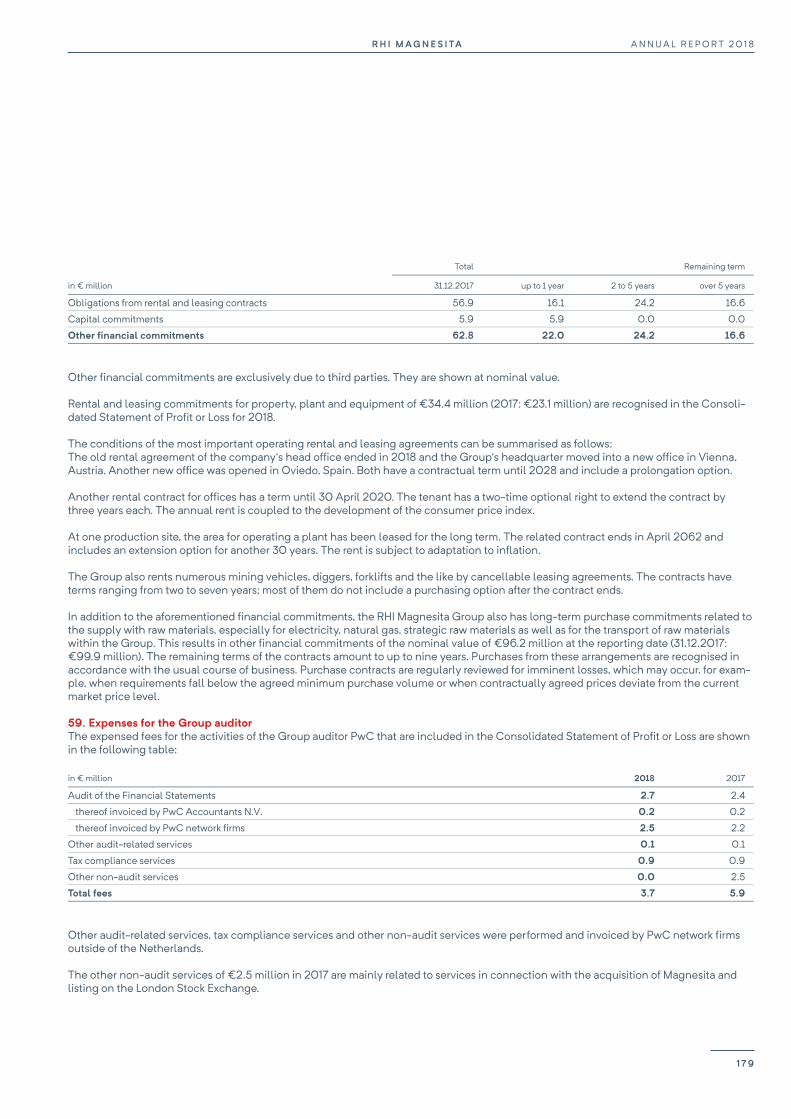
R H I M AG N E S I TA A N N U A L R E P O R T 2 0 1 8
177
Total Remaining term
in € million 31.12.2017 up to 1 year 2 to 5 years over 5 years
Obligations from rental and leasing contracts 56.9 16.1 24.2 16.6
Capital commitments 5.9 5.9 0.0 0.0
Other financial commitments 62.8 22.0 24.2 16.6
Other financial commitments are exclusively due to third parties. They are shown at nominal value.
Rental and leasing commitments for property, plant and equipment of €34.4 million (2017: €23.1 million) are recognised in the Consoli-dated Statement of Profit or Loss for 2018.
The conditions of the most important operating rental and leasing agreements can be summarised as follows: The old rental agreement of the company’s head office ended in 2018 and the Group’s headquarter moved into a new office in Vienna, Austria. Another new office was opened in Oviedo, Spain. Both have a contractual term until 2028 and include a prolongation option.
Another rental contract for offices has a term until 30 April 2020. The tenant has a two-time optional right to extend the contract by three years each. The annual rent is coupled to the development of the consumer price index.
At one production site, the area for operating a plant has been leased for the long term. The related contract ends in April 2062 and includes an extension option for another 30 years. The rent is subject to adaptation to inflation.
The Group also rents numerous mining vehicles, diggers, forklifts and the like by cancellable leasing agreements. The contracts have terms ranging from two to seven years; most of them do not include a purchasing option after the contract ends.
In addition to the aforementioned financial commitments, the RHI Magnesita Group also has long-term purchase commitments related to the supply with raw materials, especially for electricity, natural gas, strategic raw materials as well as for the transport of raw materials within the Group. This results in other financial commitments of the nominal value of €96.2 million at the reporting date (31.12.2017: €99.9 million). The remaining terms of the contracts amount to up to nine years. Purchases from these arrangements are recognised in accordance with the usual course of business. Purchase contracts are regularly reviewed for imminent losses, which may occur, for exam-ple, when requirements fall below the agreed minimum purchase volume or when contractually agreed prices deviate from the current market price level.
59. Expenses for the Group auditor The expensed fees for the activities of the Group auditor PwC that are included in the Consolidated Statement of Profit or Loss are shown in the following table:
in € million 2018 2017
Audit of the Financial Statements 2.7 2.4
thereof invoiced by PwC Accountants N.V. 0.2 0.2
thereof invoiced by PwC network firms 2.5 2.2
Other audit-related services 0.1 0.1
Tax compliance services 0.9 0.9
Other non-audit services 0.0 2.5
Total fees 3.7 5.9
Other audit-related services, tax compliance services and other non-audit services were performed and invoiced by PwC network firms outside of the Netherlands.
The other non-audit services of €2.5 million in 2017 are mainly related to services in connection with the acquisition of Magnesita and listing on the London Stock Exchange.
A N N U A L R E P O R T 2 0 1 8R H I M A G N E S I TA
1 7 9

F I N A N C I A L S TAT E M E N T S R H I M AG N E S I TA
Notes continued
178
60. Annual average number of employees The average number of employees of the RHI Magnesita Group based on full time equivalents amounts to:
2018 2017
Salaried employees 5,947 3,788
Waged workers 8,171 4,781
Number of employees on annual average 14,118 8,569
Sixteen full time equivalents of salaried employees work in the Netherlands.
61. Transactions with related parties Related companies include subsidiaries that are not fully consolidated, joint ventures, associates and MSP Foundation, Liechtenstein, as a shareholder of RHI Magnesita N.V. since it exercises significant influence based on its share of more than 25% in RHI Magnesita N.V. In accordance with IAS 24.9v, the personnel welfare foundation of Stopinc AG, Hünenberg, Switzerland, also has to be considered a related company.
Related persons are persons having authority and responsibility for planning, directing and controlling the activities of the Group (key management personnel) and their close family members. Since 26 October 2017, key management personnel comprises of members of the Board of Directors of RHI Magnesita N.V. and the Executive Management Team. Before that, members of the Management Board and the Supervisory Board of RHI AG formed the key management personnel.
Related companies In 2018, the Group conducted the following transaction with its related companies:
Joint ventures Associates
Non- consolidated
subsidiaries
in € million 2018 2017 2018 20171) 2018 20171)
Revenue from the sale of goods and services 3.1 3.4 0.1 0.4 0.3 0.1
Purchase of raw materials 3.2 2.5 20.3 3.8 0.1 0.0
Interest income 0.1 0.1 0.8 0.0 0.0 0.0
Asset purchase 0.0 0.0 0.6 0.0 0.0 0.0
Trade and other receivables 0.9 1.3 0.0 1.1 0.2 0.2
Loans granted 0.0 0.0 10.4 9.6 0.1 0.1
Trade liabilities 0.3 0.6 5.1 8.5 0.9 1.6
Dividends received 10.8 10.7 0.2 0.0 0.0 0.0
1 Adjusted to reflect the effects of the final purchase price allocation of Magnesita.
In 2018 and 2017, the Group charged electricity and stock management costs to the joint venture MAGNIFIN Magnesiaprodukte GmbH & Co KG, St. Jakob, Austria, and purchased raw materials. In 2018 and in November and December 2017, the associate Sinterco S.A., Name-che, Belgium, sold sintered doloma to the RHI Magnesita Group. Furthermore, the Group has a financing receivable of €10.4 million (31.12.2017: €9.6 million) from a loan agreement with Sinterco.
The balances at the end of 2018 are unsecured and will be paid in cash. All income and expenses 2017 of the joint ventures, associates and non-consolidated subsidiaries acquired in the course of the acquisition of Magnesita relate to the periods November and December 2017. Before the acquisition of Magnesita the Group had no associates.
To secure a pension claim of a former employee of MAGNIFIN, RHI Magnesita has assumed a surety amounting to €0.3 million (31.12.2017: €0.3 million). A resulting cash outflow is not expected. No guarantees were received.
R H I M A G N E S I TAF I N A N C I A L S TAT E M E N T S
1 8 0
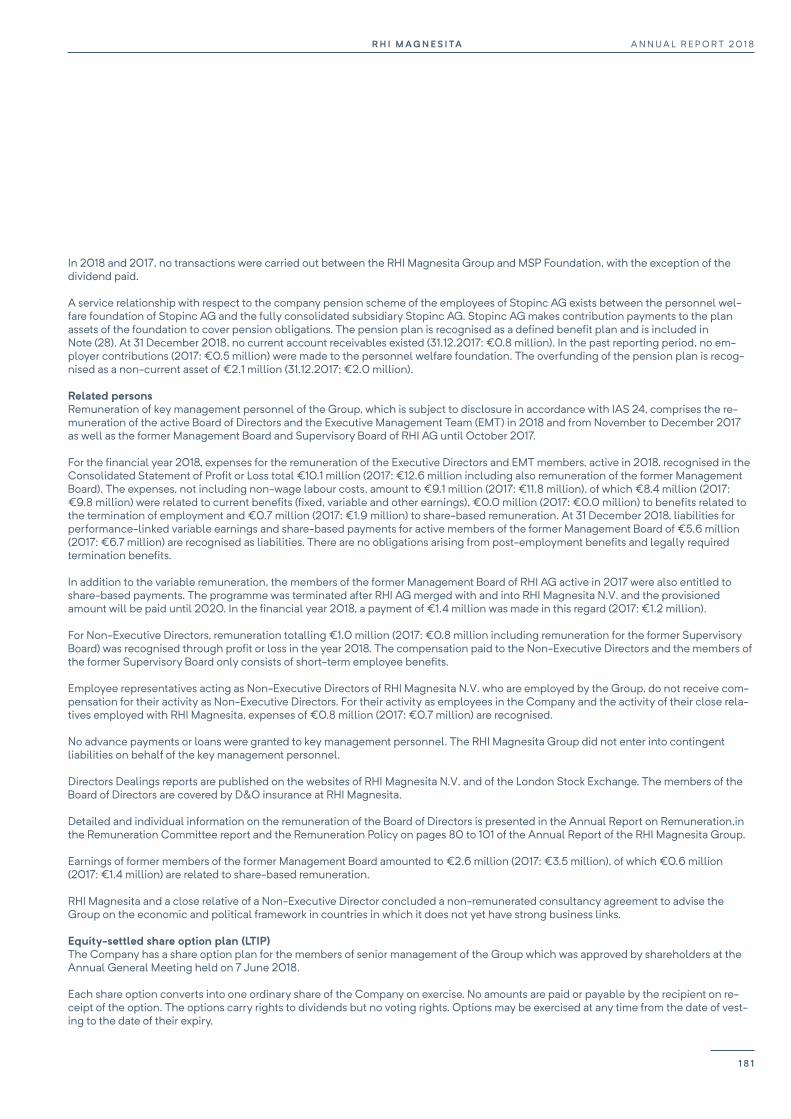
R H I M AG N E S I TA A N N U A L R E P O R T 2 0 1 8
179
In 2018 and 2017, no transactions were carried out between the RHI Magnesita Group and MSP Foundation, with the exception of the dividend paid.
A service relationship with respect to the company pension scheme of the employees of Stopinc AG exists between the personnel wel-fare foundation of Stopinc AG and the fully consolidated subsidiary Stopinc AG. Stopinc AG makes contribution payments to the plan assets of the foundation to cover pension obligations. The pension plan is recognised as a defined benefit plan and is included in Note (28). At 31 December 2018, no current account receivables existed (31.12.2017: €0.8 million). In the past reporting period, no em-ployer contributions (2017: €0.5 million) were made to the personnel welfare foundation. The overfunding of the pension plan is recog-nised as a non-current asset of €2.1 million (31.12.2017: €2.0 million).
Related persons Remuneration of key management personnel of the Group, which is subject to disclosure in accordance with IAS 24, comprises the re-muneration of the active Board of Directors and the Executive Management Team (EMT) in 2018 and from November to December 2017 as well as the former Management Board and Supervisory Board of RHI AG until October 2017.
For the financial year 2018, expenses for the remuneration of the Executive Directors and EMT members, active in 2018, recognised in the Consolidated Statement of Profit or Loss total €10.1 million (2017: €12.6 million including also remuneration of the former Management Board). The expenses, not including non-wage labour costs, amount to €9.1 million (2017: €11.8 million), of which €8.4 million (2017: €9.8 million) were related to current benefits (fixed, variable and other earnings), €0.0 million (2017: €0.0 million) to benefits related to the termination of employment and €0.7 million (2017: €1.9 million) to share-based remuneration. At 31 December 2018, liabilities for performance-linked variable earnings and share-based payments for active members of the former Management Board of €5.6 million (2017: €6.7 million) are recognised as liabilities. There are no obligations arising from post-employment benefits and legally required termination benefits.
In addition to the variable remuneration, the members of the former Management Board of RHI AG active in 2017 were also entitled to share-based payments. The programme was terminated after RHI AG merged with and into RHI Magnesita N.V. and the provisioned amount will be paid until 2020. In the financial year 2018, a payment of €1.4 million was made in this regard (2017: €1.2 million).
For Non-Executive Directors, remuneration totalling €1.0 million (2017: €0.8 million including remuneration for the former Supervisory Board) was recognised through profit or loss in the year 2018. The compensation paid to the Non-Executive Directors and the members of the former Supervisory Board only consists of short-term employee benefits.
Employee representatives acting as Non-Executive Directors of RHI Magnesita N.V. who are employed by the Group, do not receive com-pensation for their activity as Non-Executive Directors. For their activity as employees in the Company and the activity of their close rela-tives employed with RHI Magnesita, expenses of €0.8 million (2017: €0.7 million) are recognised.
No advance payments or loans were granted to key management personnel. The RHI Magnesita Group did not enter into contingent liabilities on behalf of the key management personnel.
Directors Dealings reports are published on the websites of RHI Magnesita N.V. and of the London Stock Exchange. The members of the Board of Directors are covered by D&O insurance at RHI Magnesita.
Detailed and individual information on the remuneration of the Board of Directors is presented in the Annual Report on Remuneration,in the Remuneration Committee report and the Remuneration Policy on pages 80 to 101 of the Annual Report of the RHI Magnesita Group.
Earnings of former members of the former Management Board amounted to €2.6 million (2017: €3.5 million), of which €0.6 million (2017: €1.4 million) are related to share-based remuneration.
RHI Magnesita and a close relative of a Non-Executive Director concluded a non-remunerated consultancy agreement to advise the Group on the economic and political framework in countries in which it does not yet have strong business links.
Equity-settled share option plan (LTIP) The Company has a share option plan for the members of senior management of the Group which was approved by shareholders at the Annual General Meeting held on 7 June 2018.
Each share option converts into one ordinary share of the Company on exercise. No amounts are paid or payable by the recipient on re-ceipt of the option. The options carry rights to dividends but no voting rights. Options may be exercised at any time from the date of vest-ing to the date of their expiry.
A N N U A L R E P O R T 2 0 1 8R H I M A G N E S I TA
1 8 1
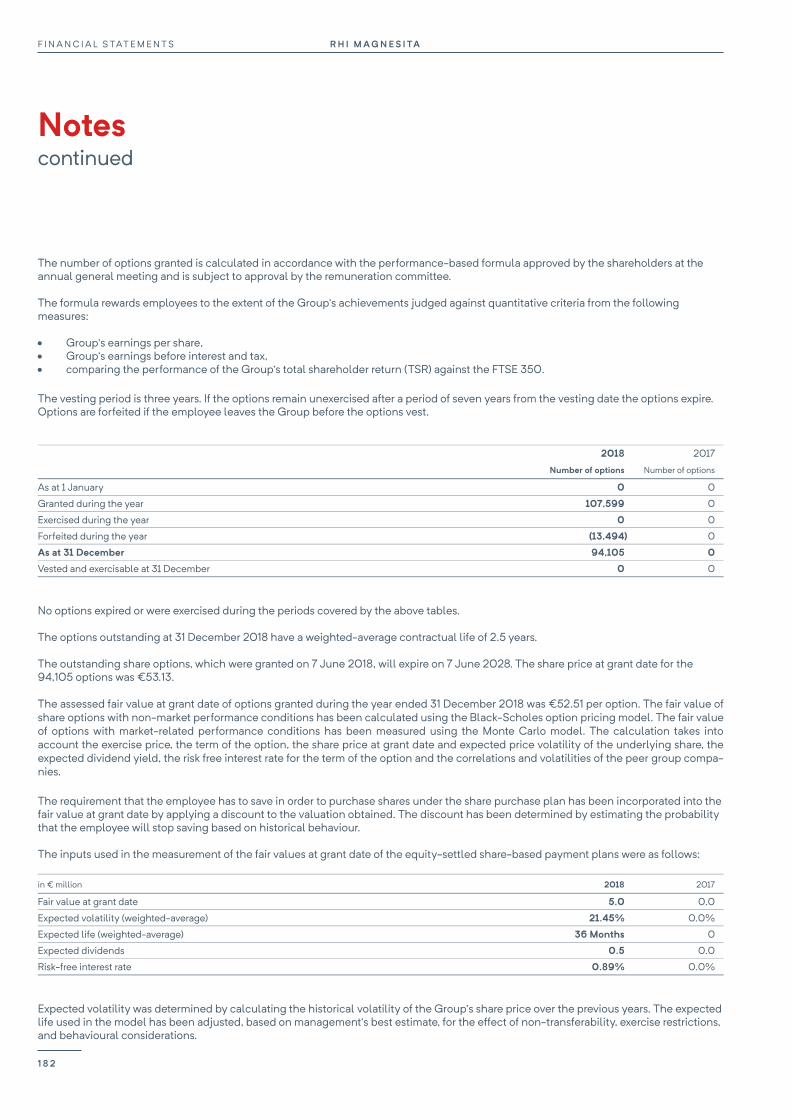
F I N A N C I A L S TAT E M E N T S R H I M AG N E S I TA
Notes continued
180
The number of options granted is calculated in accordance with the performance-based formula approved by the shareholders at the annual general meeting and is subject to approval by the remuneration committee.
The formula rewards employees to the extent of the Group’s achievements judged against quantitative criteria from the following measures:
Group’s earnings per share, Group’s earnings before interest and tax, comparing the performance of the Group’s total shareholder return (TSR) against the FTSE 350.
The vesting period is three years. If the options remain unexercised after a period of seven years from the vesting date the options expire. Options are forfeited if the employee leaves the Group before the options vest.
2018 2017
Number of options Number of options
As at 1 January 0 0
Granted during the year 107,599 0
Exercised during the year 0 0
Forfeited during the year (13,494) 0
As at 31 December 94,105 0
Vested and exercisable at 31 December 0 0
No options expired or were exercised during the periods covered by the above tables.
The options outstanding at 31 December 2018 have a weighted-average contractual life of 2.5 years.
The outstanding share options, which were granted on 7 June 2018, will expire on 7 June 2028. The share price at grant date for the 94,105 options was €53.13.
The assessed fair value at grant date of options granted during the year ended 31 December 2018 was €52.51 per option. The fair value of share options with non-market performance conditions has been calculated using the Black-Scholes option pricing model. The fair value of options with market-related performance conditions has been measured using the Monte Carlo model. The calculation takes into account the exercise price, the term of the option, the share price at grant date and expected price volatility of the underlying share, the expected dividend yield, the risk free interest rate for the term of the option and the correlations and volatilities of the peer group compa-nies.
The requirement that the employee has to save in order to purchase shares under the share purchase plan has been incorporated into the fair value at grant date by applying a discount to the valuation obtained. The discount has been determined by estimating the probability that the employee will stop saving based on historical behaviour.
The inputs used in the measurement of the fair values at grant date of the equity-settled share-based payment plans were as follows:
in € million 2018 2017
Fair value at grant date 5.0 0.0
Expected volatility (weighted-average) 21.45% 0.0%
Expected life (weighted-average) 36 Months 0
Expected dividends 0.5 0.0
Risk-free interest rate 0.89% 0.0%
Expected volatility was determined by calculating the historical volatility of the Group’s share price over the previous years. The expected life used in the model has been adjusted, based on management’s best estimate, for the effect of non-transferability, exercise restrictions, and behavioural considerations.
R H I M A G N E S I TAF I N A N C I A L S TAT E M E N T S
1 8 2
R H I M AG N E S I TA A N N U A L R E P O R T 2 0 1 8
181
62. Board of Directors of RHI Magnesita N.V. The members of the Board of Directors are as follows:
Herbert Cordt, Chairman Stefan Borgas, CEO Octavio Lopes (until 31 December 2018) Fersen Lambranho (until 22 January 2019) David Schlaff Stanislaus Prinz zu Sayn-Wittgenstein-Berleburg Celia Baxter Andrew Hosty James Leng John Ramsay Wolfgang Ruttenstorfer Karl Sevelda Franz Reiter Michael Schwarz
63. Material events after the reporting date On 10 March 2019 the Supervening Acquisition Period of the Integrated Tender Offer (as described in Note (5) of the Consolidated Finan-cial Statements) ended. RHI Magnesita N.V. via its indirect, wholly-owned subsidiary Dutch Brasil Holding B.V. received valid acceptanc-es from holders of 6,167,636 Magnesita Refratários S.A. common shares, representing approximately 12.3% of the total share capital of Magnesita Refratários S.A. increasing its total ownership to 97.5%. As a result, 1,139,400 new RHI Magnesita N.V. shares were issued. The cash disbursement of this transaction amounts to €30.2 million.
After the reporting date on 31 December 2018, there were no other events of special significance which may have a material effect on the financial position and performance of the RHI Magnesita Group.
A N N U A L R E P O R T 2 0 1 8R H I M A G N E S I TA
1 8 3
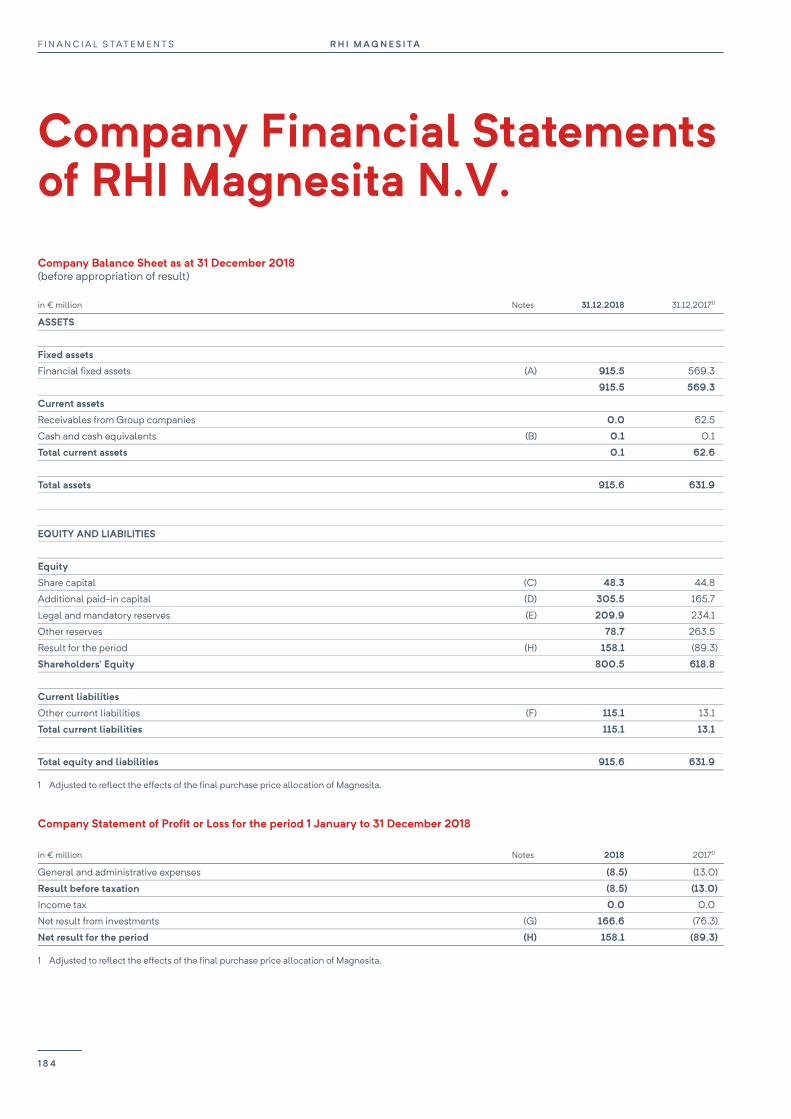
F I N A N C I A L S TAT E M E N T S R H I M AG N E S I TA
Company Financial Statements of RHI Magnesita N.V.
182
Company Balance Sheet as at 31 December 2018 (before appropriation of result)
in € million Notes 31.12.2018 31.12.20171)
ASSETS
Fixed assets
Financial fixed assets (A) 915.5 569.3
915.5 569.3
Current assets
Receivables from Group companies 0.0 62.5
Cash and cash equivalents (B) 0.1 0.1
Total current assets 0.1 62.6
Total assets 915.6 631.9
EQUITY AND LIABILITIES
Equity
Share capital (C) 48.3 44.8
Additional paid-in capital (D) 305.5 165.7
Legal and mandatory reserves (E) 209.9 234.1
Other reserves 78.7 263.5
Result for the period (H) 158.1 (89.3)
Shareholders' Equity 800.5 618.8
Current liabilities
Other current liabilities (F) 115.1 13.1
Total current liabilities 115.1 13.1
Total equity and liabilities 915.6 631.9
1 Adjusted to reflect the effects of the final purchase price allocation of Magnesita.
Company Statement of Profit or Loss for the period 1 January to 31 December 2018
in € million Notes 2018 20171)
General and administrative expenses (8.5) (13.0)
Result before taxation (8.5) (13.0)
Income tax 0.0 0.0
Net result from investments (G) 166.6 (76.3)
Net result for the period (H) 158.1 (89.3)
1 Adjusted to reflect the effects of the final purchase price allocation of Magnesita.
R H I M A G N E S I TAF I N A N C I A L S TAT E M E N T S
1 8 4
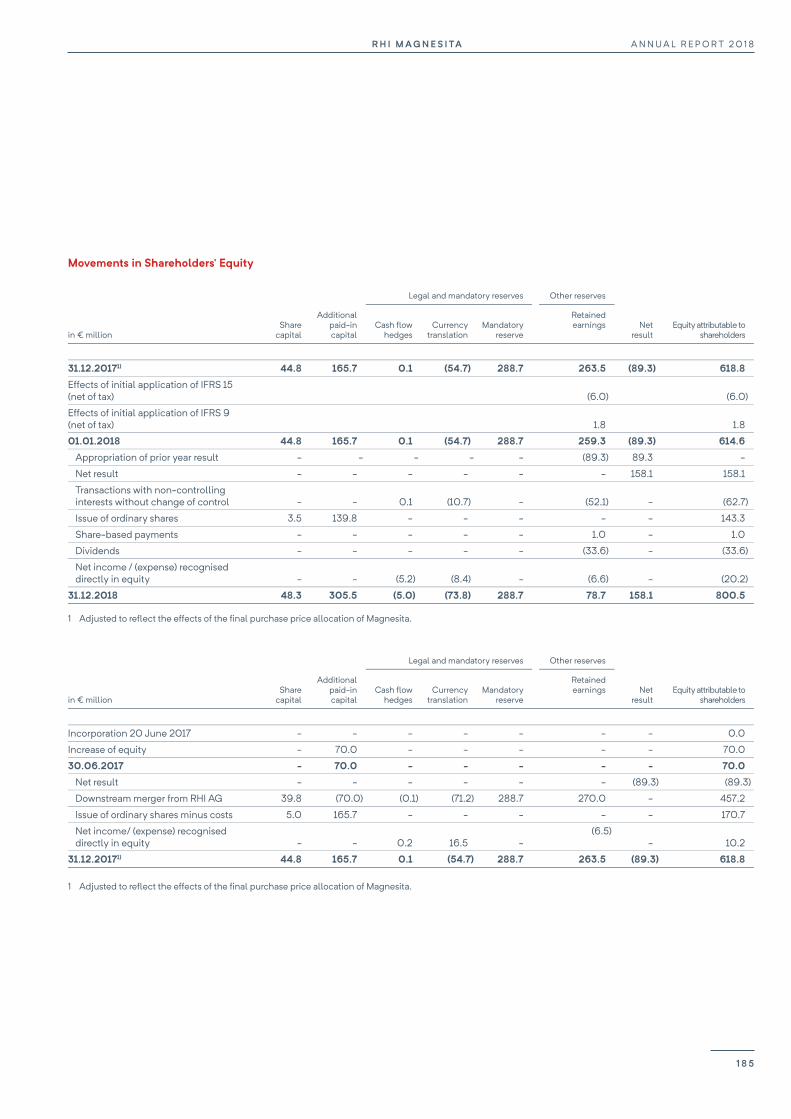
R H I M AG N E S I TA A N N U A L R E P O R T 2 0 1 8
183
Movements in Shareholders’ Equity
Legal and mandatory reserves Other reserves
in € million Share
capital
Additional paid-in capital
Cash flow hedges
Currency translation
Mandatory reserve
Retained earnings Net
result Equity attributable to
shareholders
31.12.20171) 44.8 165.7 0.1 (54.7) 288.7 263.5 (89.3) 618.8
Effects of initial application of IFRS 15 (net of tax) (6.0) (6.0)
Effects of initial application of IFRS 9 (net of tax) 1.8 1.8
01.01.2018 44.8 165.7 0.1 (54.7) 288.7 259.3 (89.3) 614.6
Appropriation of prior year result - - - - - (89.3) 89.3 -
Net result - - - - - - 158.1 158.1
Transactions with non-controlling interests without change of control - - 0.1 (10.7) - (52.1) - (62.7)
Issue of ordinary shares 3.5 139.8 - - - - - 143.3
Share-based payments - - - - - 1.0 - 1.0
Dividends - - - - - (33.6) - (33.6)
Net income / (expense) recognised directly in equity - - (5.2) (8.4) - (6.6) - (20.2)
31.12.2018 48.3 305.5 (5.0) (73.8) 288.7 78.7 158.1 800.5
1 Adjusted to reflect the effects of the final purchase price allocation of Magnesita.
Legal and mandatory reserves Other reserves
in € million Share
capital
Additional paid-in capital
Cash flow hedges
Currency translation
Mandatory reserve
Retained earnings Net
result Equity attributable to
shareholders
Incorporation 20 June 2017 - - - - - - - 0.0
Increase of equity - 70.0 - - - - - 70.0
30.06.2017 - 70.0 - - - - - 70.0
Net result - - - - - - (89.3) (89.3)
Downstream merger from RHI AG 39.8 (70.0) (0.1) (71.2) 288.7 270.0 - 457.2
Issue of ordinary shares minus costs 5.0 165.7 - - - - - 170.7
Net income/ (expense) recognised directly in equity - - 0.2 16.5 -
(6.5) - 10.2
31.12.20171) 44.8 165.7 0.1 (54.7) 288.7 263.5 (89.3) 618.8 1 Adjusted to reflect the effects of the final purchase price allocation of Magnesita.
A N N U A L R E P O R T 2 0 1 8R H I M A G N E S I TA
1 8 5
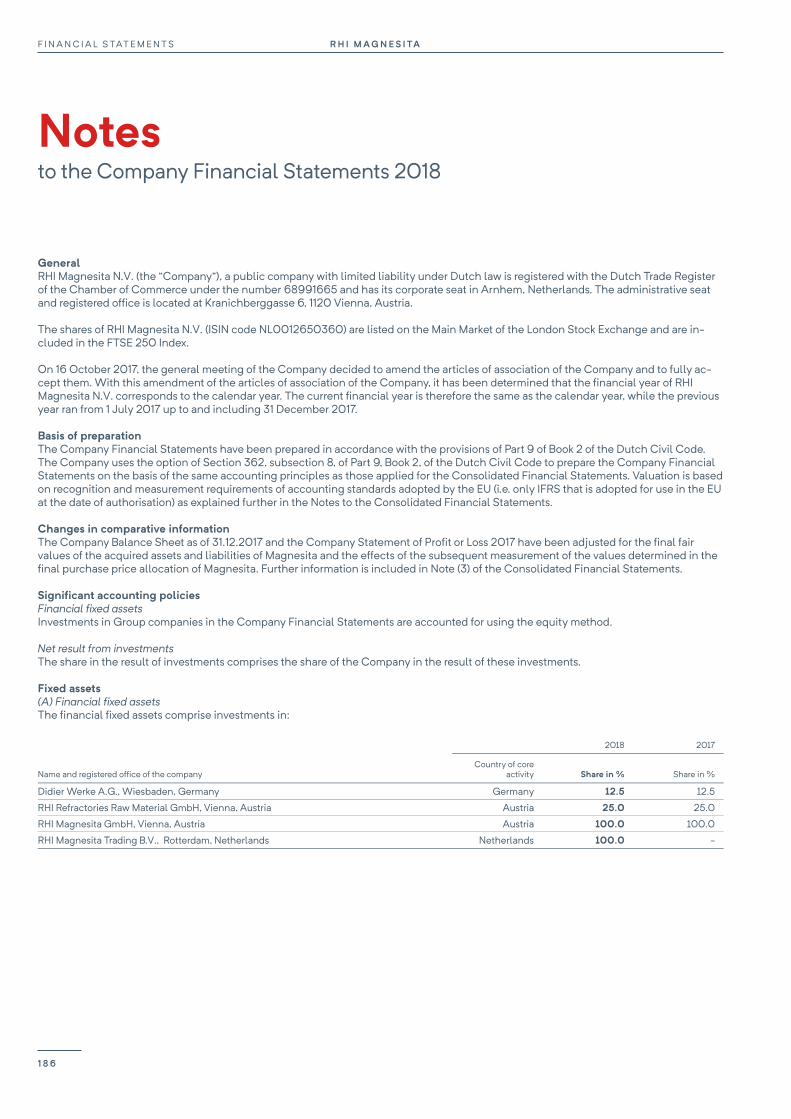
F I N A N C I A L S TAT E M E N T S R H I M AG N E S I TA
Notes to the Company Financial Statements 2018
General RHI Magnesita N.V. (the “Company”), a public company with limited liability under Dutch law is registered with the Dutch Trade Register of the Chamber of Commerce under the number 68991665 and has its corporate seat in Arnhem, Netherlands. The administrative seat and registered office is located at Kranichberggasse 6, 1120 Vienna, Austria.
The shares of RHI Magnesita N.V. (ISIN code NL0012650360) are listed on the Main Market of the London Stock Exchange and are in-cluded in the FTSE 250 Index.
On 16 October 2017, the general meeting of the Company decided to amend the articles of association of the Company and to fully ac-cept them. With this amendment of the articles of association of the Company, it has been determined that the financial year of RHI Magnesita N.V. corresponds to the calendar year. The current financial year is therefore the same as the calendar year, while the previous year ran from 1 July 2017 up to and including 31 December 2017.
Basis of preparation The Company Financial Statements have been prepared in accordance with the provisions of Part 9 of Book 2 of the Dutch Civil Code. The Company uses the option of Section 362, subsection 8, of Part 9, Book 2, of the Dutch Civil Code to prepare the Company Financial Statements on the basis of the same accounting principles as those applied for the Consolidated Financial Statements. Valuation is based on recognition and measurement requirements of accounting standards adopted by the EU (i.e. only IFRS that is adopted for use in the EU at the date of authorisation) as explained further in the Notes to the Consolidated Financial Statements.
Changes in comparative information The Company Balance Sheet as of 31.12.2017 and the Company Statement of Profit or Loss 2017 have been adjusted for the final fair values of the acquired assets and liabilities of Magnesita and the effects of the subsequent measurement of the values determined in the final purchase price allocation of Magnesita. Further information is included in Note (3) of the Consolidated Financial Statements.
Significant accounting policies Financial fixed assets Investments in Group companies in the Company Financial Statements are accounted for using the equity method.
Net result from investments The share in the result of investments comprises the share of the Company in the result of these investments.
Fixed assets (A) Financial fixed assets The financial fixed assets comprise investments in:
2018 2017
Name and registered office of the company Country of core
activity Share in % Share in %
Didier Werke A.G., Wiesbaden, Germany Germany 12.5 12.5
RHI Refractories Raw Material GmbH, Vienna, Austria Austria 25.0 25.0
RHI Magnesita GmbH, Vienna, Austria Austria 100.0 100.0
RHI Magnesita Trading B.V., Rotterdam, Netherlands Netherlands 100.0 -
R H I M A G N E S I TAF I N A N C I A L S TAT E M E N T S
1 8 6

R H I M AG N E S I TA A N N U A L R E P O R T 2 0 1 8
185
The investments have developed as follows:
in € million 31.12.2018 31.12.20171)
At beginning of year 569.3 0.0
Effects of the initial application of IFRS 9 and IFRS 15 (4.2) 0.0
From downstream merger 0.0 457.2
Transactions with non-controlling interests without change of control (59.2) 0.0
Capital contributions 262.1 179.5
Changes from currency translation and cash flow hedges (13.6) 16.7
Changes from defined benefit plans (6.5) (5.6)
Equity settled transaction 1.0 (2.2)
Net result from investments 166.6 (76.3)
Balance at year-end 915.5 569.3
1 Adjusted to reflect the effects of the final purchase price allocation of Magnesita.
The following list, prepared in accordance with the relevant legal requirements (Dutch Civil Code, Book 2, Sections 379), shows all com-panies in which RHI Magnesita N.V. holds a direct or indirect share of at least 20% (with the exception of the RHISA Employee Trust):
31.12.2018 31.12.2017
Ser. no. Name and registered office of the company Share- holder
Share in %
Share- holder
Share in %
1. RHI Magnesita N.V., Arnhem, Netherlands
A N N U A L R E P O R T 2 0 1 8R H I M A G N E S I TA
1 8 7

F I N A N C I A L S TAT E M E N T S R H I M AG N E S I TA
Notes to the Company Financial Statements 2018
186
2. Agellis Group AB, Sund, Sweden 56. 100.0 56. 100.0
3. Baker Refractories Holding Company, Wilmington, USA 43. 100.0 43. 100.0
4. Baker Refractories I.C., Inc., Wilmington, USA 3. 100.0 3. 100.0
5. Baker Refractories, Las Vegas, USA 43. 100.0 43. 100.0
6. Betriebs- und Baugesellschaft mit beschränkter Haftung, Wiesbaden, Germany 10. 100.0 10. 100.0
7. D.S.I.P.C.-Didier Société Industrielle de Production et de Constructions, Valenciennes, France 10. 100.0 10. 100.0
8. Didier Belgium N.V., Evergem, Belgium 71.,104. 100.0 71.,104. 100.0
9. Didier Vertriebsgesellschaft mbH, Wiesbaden, Germany 10. 100.0 10. 100.0
10. Didier-Werke Aktiengesellschaft, Wiesbaden, Germany 1.,56. 100.0 1.,56. 100.0
11. Dutch Brasil Holding B.V., Arnhem, Netherlands 110. 100.0 110. 100.0
12. Dutch MAS B.V., Arnhem, Netherlands 10. 100.0 10. 100.0
13. Dutch US Holding B.V., Arnhem, Netherlands 110. 100.0 110. 100.0
14. FE "VERA", Dnepropetrovsk, Ukraine 56. 100.0 56. 100.0
15. Feuerfestwerk Bad Hönningen GmbH, Hagen, Germany 115. 100.0 115. 100.0
16. FireShark Refractories GmbH, Vienna, Austria 74. 100.0 74. 100.0
17. Full Line Supply Africa (Pty) Ltd., Sandton, South Africa; i.l. 83. 100.0 83. 100.0
18. GIX International Limited, Dinnington, United Kingdom 116. 100.0 116. 100.0
19. INDRESCO U.K. Ltd., Dinnington, United Kingdom 18. 100.0 18. 100.0
20. INTERSTOP (Shanghai) Co., Ltd., Shanghai, PR China 109. 100.0 109. 100.0
21. Liaoning RHI Jinding Magnesia Co., Ltd., Dashiqiao City, PR China1) 56. 83.3 56. 83.3
22. LLC "RHI Wostok Service", Moscow, Russia 56.,74. 100.0 56.,74. 100.0
23. LLC "RHI Wostok", Moscow, Russia 56.,74. 100.0 56.,74. 100.0
24. Lokalbahn Mixnitz-St. Erhard Aktien-Gesellschaft, Vienna, Austria 95. 100.0 95. 100.0
25. LWB Holding Company, Las Vegas, USA 57. 100.0 57. 100.0
Fully consolidated subsidiaries
R H I M A G N E S I TAF I N A N C I A L S TAT E M E N T S
1 8 8
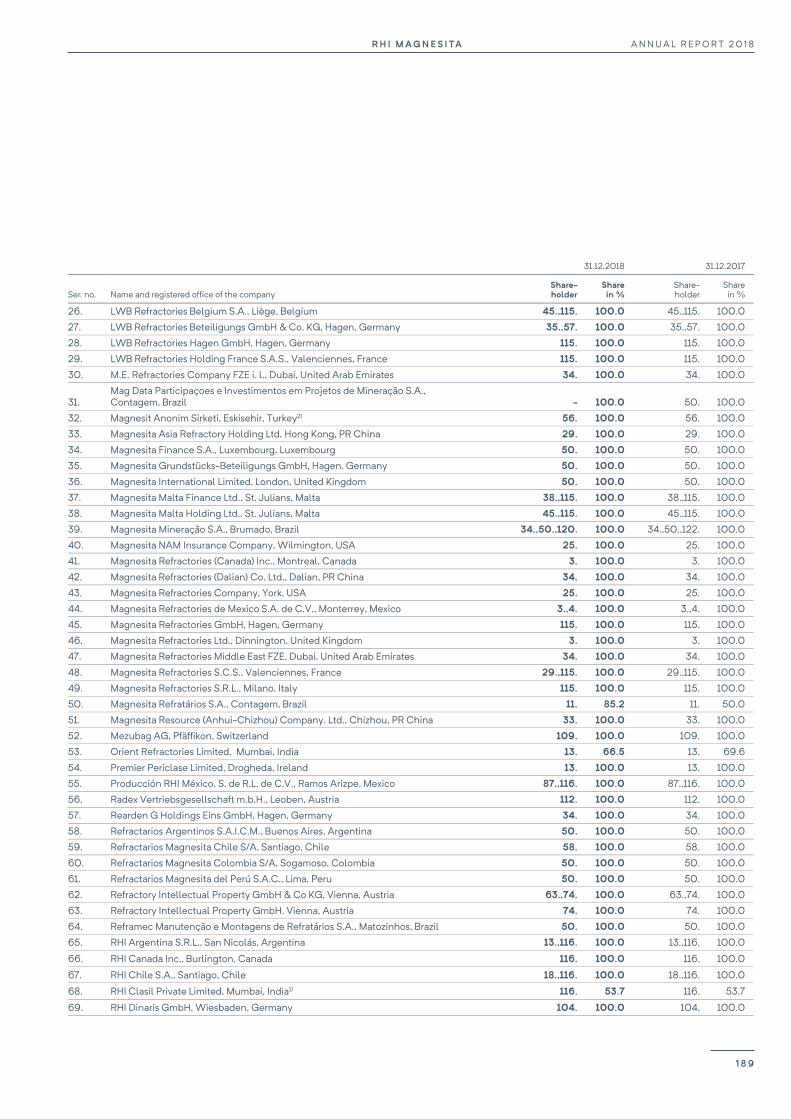
F I N A N C I A L S TAT E M E N T S R H I M AG N E S I TA
Notes to the Company Financial Statements 2018
186
2. Agellis Group AB, Sund, Sweden 56. 100.0 56. 100.0
3. Baker Refractories Holding Company, Wilmington, USA 43. 100.0 43. 100.0
4. Baker Refractories I.C., Inc., Wilmington, USA 3. 100.0 3. 100.0
5. Baker Refractories, Las Vegas, USA 43. 100.0 43. 100.0
6. Betriebs- und Baugesellschaft mit beschränkter Haftung, Wiesbaden, Germany 10. 100.0 10. 100.0
7. D.S.I.P.C.-Didier Société Industrielle de Production et de Constructions, Valenciennes, France 10. 100.0 10. 100.0
8. Didier Belgium N.V., Evergem, Belgium 71.,104. 100.0 71.,104. 100.0
9. Didier Vertriebsgesellschaft mbH, Wiesbaden, Germany 10. 100.0 10. 100.0
10. Didier-Werke Aktiengesellschaft, Wiesbaden, Germany 1.,56. 100.0 1.,56. 100.0
11. Dutch Brasil Holding B.V., Arnhem, Netherlands 110. 100.0 110. 100.0
12. Dutch MAS B.V., Arnhem, Netherlands 10. 100.0 10. 100.0
13. Dutch US Holding B.V., Arnhem, Netherlands 110. 100.0 110. 100.0
14. FE "VERA", Dnepropetrovsk, Ukraine 56. 100.0 56. 100.0
15. Feuerfestwerk Bad Hönningen GmbH, Hagen, Germany 115. 100.0 115. 100.0
16. FireShark Refractories GmbH, Vienna, Austria 74. 100.0 74. 100.0
17. Full Line Supply Africa (Pty) Ltd., Sandton, South Africa; i.l. 83. 100.0 83. 100.0
18. GIX International Limited, Dinnington, United Kingdom 116. 100.0 116. 100.0
19. INDRESCO U.K. Ltd., Dinnington, United Kingdom 18. 100.0 18. 100.0
20. INTERSTOP (Shanghai) Co., Ltd., Shanghai, PR China 109. 100.0 109. 100.0
21. Liaoning RHI Jinding Magnesia Co., Ltd., Dashiqiao City, PR China1) 56. 83.3 56. 83.3
22. LLC "RHI Wostok Service", Moscow, Russia 56.,74. 100.0 56.,74. 100.0
23. LLC "RHI Wostok", Moscow, Russia 56.,74. 100.0 56.,74. 100.0
24. Lokalbahn Mixnitz-St. Erhard Aktien-Gesellschaft, Vienna, Austria 95. 100.0 95. 100.0
25. LWB Holding Company, Las Vegas, USA 57. 100.0 57. 100.0
Fully consolidated subsidiaries
R H I M AG N E S I TA A N N U A L R E P O R T 2 0 1 8
187
31.12.2018 31.12.2017
Ser. no. Name and registered office of the company Share- holder
Share in %
Share- holder
Share in %
26. LWB Refractories Belgium S.A., Liège, Belgium 45.,115. 100.0 45.,115. 100.0
27. LWB Refractories Beteiligungs GmbH & Co. KG, Hagen, Germany 35.,57. 100.0 35.,57. 100.0
28. LWB Refractories Hagen GmbH, Hagen, Germany 115. 100.0 115. 100.0
29. LWB Refractories Holding France S.A.S., Valenciennes, France 115. 100.0 115. 100.0
30. M.E. Refractories Company FZE i. l., Dubai, United Arab Emirates 34. 100.0 34. 100.0
31. Mag Data Participaçoes e Investimentos em Projetos de Mineração S.A., Contagem, Brazil - 100.0 50. 100.0
32. Magnesit Anonim Sirketi, Eskisehir, Turkey2) 56. 100.0 56. 100.0
33. Magnesita Asia Refractory Holding Ltd, Hong Kong, PR China 29. 100.0 29. 100.0
34. Magnesita Finance S.A., Luxembourg, Luxembourg 50. 100.0 50. 100.0
35. Magnesita Grundstücks-Beteiligungs GmbH, Hagen, Germany 50. 100.0 50. 100.0
36. Magnesita International Limited, London, United Kingdom 50. 100.0 50. 100.0
37. Magnesita Malta Finance Ltd., St. Julians, Malta 38.,115. 100.0 38.,115. 100.0
38. Magnesita Malta Holding Ltd., St. Julians, Malta 45.,115. 100.0 45.,115. 100.0
39. Magnesita Mineração S.A., Brumado, Brazil 34.,50.,120. 100.0 34.,50.,122. 100.0
40. Magnesita NAM Insurance Company, Wilmington, USA 25. 100.0 25. 100.0
41. Magnesita Refractories (Canada) Inc., Montreal, Canada 3. 100.0 3. 100.0
42. Magnesita Refractories (Dalian) Co. Ltd., Dalian, PR China 34. 100.0 34. 100.0
43. Magnesita Refractories Company, York, USA 25. 100.0 25. 100.0
44. Magnesita Refractories de Mexico S.A. de C.V., Monterrey, Mexico 3.,4. 100.0 3.,4. 100.0
45. Magnesita Refractories GmbH, Hagen, Germany 115. 100.0 115. 100.0
46. Magnesita Refractories Ltd., Dinnington, United Kingdom 3. 100.0 3. 100.0
47. Magnesita Refractories Middle East FZE, Dubai, United Arab Emirates 34. 100.0 34. 100.0
48. Magnesita Refractories S.C.S., Valenciennes, France 29.,115. 100.0 29.,115. 100.0
49. Magnesita Refractories S.R.L., Milano, Italy 115. 100.0 115. 100.0
50. Magnesita Refratários S.A., Contagem, Brazil 11. 85.2 11. 50.0
51. Magnesita Resource (Anhui-Chizhou) Company. Ltd., Chizhou, PR China 33. 100.0 33. 100.0
52. Mezubag AG, Pfäffikon, Switzerland 109. 100.0 109. 100.0
53. Orient Refractories Limited, Mumbai, India 13. 66.5 13. 69.6
54. Premier Periclase Limited, Drogheda, Ireland 13. 100.0 13. 100.0
55. Producción RHI México, S. de R.L. de C.V., Ramos Arizpe, Mexico 87.,116. 100.0 87.,116. 100.0
56. Radex Vertriebsgesellschaft m.b.H., Leoben, Austria 112. 100.0 112. 100.0
57. Rearden G Holdings Eins GmbH, Hagen, Germany 34. 100.0 34. 100.0
58. Refractarios Argentinos S.A.I.C.M., Buenos Aires, Argentina 50. 100.0 50. 100.0
59. Refractarios Magnesita Chile S/A, Santiago, Chile 58. 100.0 58. 100.0
60. Refractarios Magnesita Colombia S/A, Sogamoso, Colombia 50. 100.0 50. 100.0
61. Refractarios Magnesita del Perú S.A.C., Lima, Peru 50. 100.0 50. 100.0
62. Refractory Intellectual Property GmbH & Co KG, Vienna, Austria 63.,74. 100.0 63.,74. 100.0
63. Refractory Intellectual Property GmbH, Vienna, Austria 74. 100.0 74. 100.0
64. Reframec Manutenção e Montagens de Refratários S.A., Matozinhos, Brazil 50. 100.0 50. 100.0
65. RHI Argentina S.R.L., San Nicolás, Argentina 13.,116. 100.0 13.,116. 100.0
66. RHI Canada Inc., Burlington, Canada 116. 100.0 116. 100.0
67. RHI Chile S.A., Santiago, Chile 18.,116. 100.0 18.,116. 100.0
68. RHI Clasil Private Limited, Mumbai, India1) 116. 53.7 116. 53.7
69. RHI Dinaris GmbH, Wiesbaden, Germany 104. 100.0 104. 100.0
A N N U A L R E P O R T 2 0 1 8R H I M A G N E S I TA
1 8 9

F I N A N C I A L S TAT E M E N T S R H I M AG N E S I TA
Notes to the Company Financial Statements 2018
188
31.12.2018 31.12.2017
Ser. no. Name and registered office of the company Share- holder
Share in %
Share- holder
Share in %
70. RHI Finance A/S, Hellerup, Denmark 74. 100.0 74. 100.0
71. RHI GLAS GmbH, Wiesbaden, Germany 104. 100.0 104. 100.0
72. RHI India Private Limited, Navi Mumbai, India 11.,116. 100.0 11.,116. 100.0
73. RHI ITALIA S.R.L., Brescia, Italy 74. 100.0 74. 100.0
74. RHI Magnesita GmbH, Vienna, Austria 1. 100.0 1. 100.0
75. RHI Magnesita Distribution B.V., Rotterdam, Netherlands 76. 100.0 - -
76. RHI Magnesita Trading B.V., Rotterdam, Netherlands 1. 100.0 - -
77. RHI Marvo Feuerungs- und Industriebau GmbH, Gerbstedt, Germany 78. 100.0 78. 100.0
78. RHI MARVO Feuerungs- und Industriebau GmbH, Kerpen, Germany 10. 100.0 10. 100.0
79. RHI MARVO S.R.L., Ploiesti, Romania 56.,110. 100.0 56.,110. 100.0
80. RHI Normag AS, Porsgrunn, Norway 56. 100.0 56. 100.0
81. RHI Refractories (Dalian) Co., Ltd., Dalian, PR China 56. 100.0 56. 100.0
82. RHI Refractories (Site Services) Ltd., Dinnington, United Kingdom 19. 100.0 19. 100.0
83. RHI Refractories Africa (Pty) Ltd., Sandton, South Africa 56.,107. 100.0 56.,107. 100.0
84. RHI Refractories Andino C.A., Puerto Ordaz, Venezuela 116. 100.0 116. 100.0
85. RHI Refractories Asia Pacific Pte. Ltd., Singapore 74. 100.0 74. 100.0
86. RHI Refractories Egypt LLC., Cairo, Egypt 56.,110. 100.0 56.,110. 100.0
87. RHI Refractories España, S.L., Lugones, Spain 10.,12. 100.0 10.,12. 100.0
88. RHI Refractories France SA, Valenciennes, France3) 108. 100.0 108. 100.0
89. RHI Refractories Holding Company, Wilmington, USA 116. 100.0 116. 100.0
90. RHI Refractories Ibérica, S.L., Lugones, Spain 108. 100.0 108. 100.0
91. RHI Refractories Italiana s.r.l., Brescia, Italy; i.l. 108. 100.0 108. 100.0
92. RHI Refractories Liaoning Co., Ltd., Bayuquan, PR China1) 56. 66.0 56. 66.0
93. RHI Refractories Mercosul Ltda., Sao Paulo, Brazil 110.,116. 100.0 110.,116. 100.0
94. RHI Refractories Nord AB, Stockholm, Sweden 108. 100.0 108. 100.0
95. RHI Refractories Raw Material GmbH, Vienna, Austria 1.,56.,74. 100.0 1.,56.,74. 100.0
96. RHI Refractories Site Services GmbH, Wiesbaden, Germany 10. 100.0 10. 100.0
97. RHI Refractories UK Limited, Bonnybridge, United Kingdom 10. 100.0 10. 100.0
98. RHI Refratários Brasil Ltda, Belo Horizonte, Brazil 11.,116. 100.0 11.,116. 100.0
99. RHI Sales Europe West GmbH, Mülheim-Kärlich, Germany 10.,108. 100.0 10.,108. 100.0
100. RHI Trading (Dalian) Co., Ltd., Dalian, PR China 56. 100.0 56. 100.0
101. RHI Ukraina LLC, Dnepropetrovsk, Ukraine 56.,110. 100.0 - -
102. RHI United Offices America, S.A. de C.V., Monterrey, Mexico 87.,103. 100.0 87.,103. 100.0
103. RHI United Offices Europe, S.L., Lugones, Spain 87. 100.0 87. 100.0
104. RHI Urmitz AG & Co. KG, Mülheim-Kärlich, Germany 9.,10. 100.0 9.,10. 100.0
105. RHI US Ltd., Wilmington, USA 13. 100.0 13. 100.0
106. RHI-Refmex, S.A. de C.V., Ramos Arizpe, Mexico 87.,116. 100.0 87.,116. 100.0
107. RHISA Employee Trust, Sandton, South Africa4) - 0.0 - 0.0
108. SAPREF AG für feuerfestes Material, Basel, Switzerland 116. 100.0 116. 100.0
109. Stopinc Aktiengesellschaft, Hünenberg, Switzerland 10.,56. 100.0 10.,56. 100.0
110. Veitscher Vertriebsgesellschaft m.b.H., Vienna, Austria 74. 100.0 74. 100.0
111. Veitsch-Radex America LLC., Wilmington, USA 105. 100.0 105. 100.0
112. Veitsch-Radex GmbH & Co OG, Vienna, Austria 74.,113. 100.0 74.,113. 100.0
113. Veitsch-Radex GmbH, Vienna, Austria 74. 100.0 74. 100.0
114. Veitsch-Radex Vertriebsgesellschaft m.b.H., Vienna, Austria 74. 100.0 74. 100.0
R H I M A G N E S I TAF I N A N C I A L S TAT E M E N T S
1 9 0
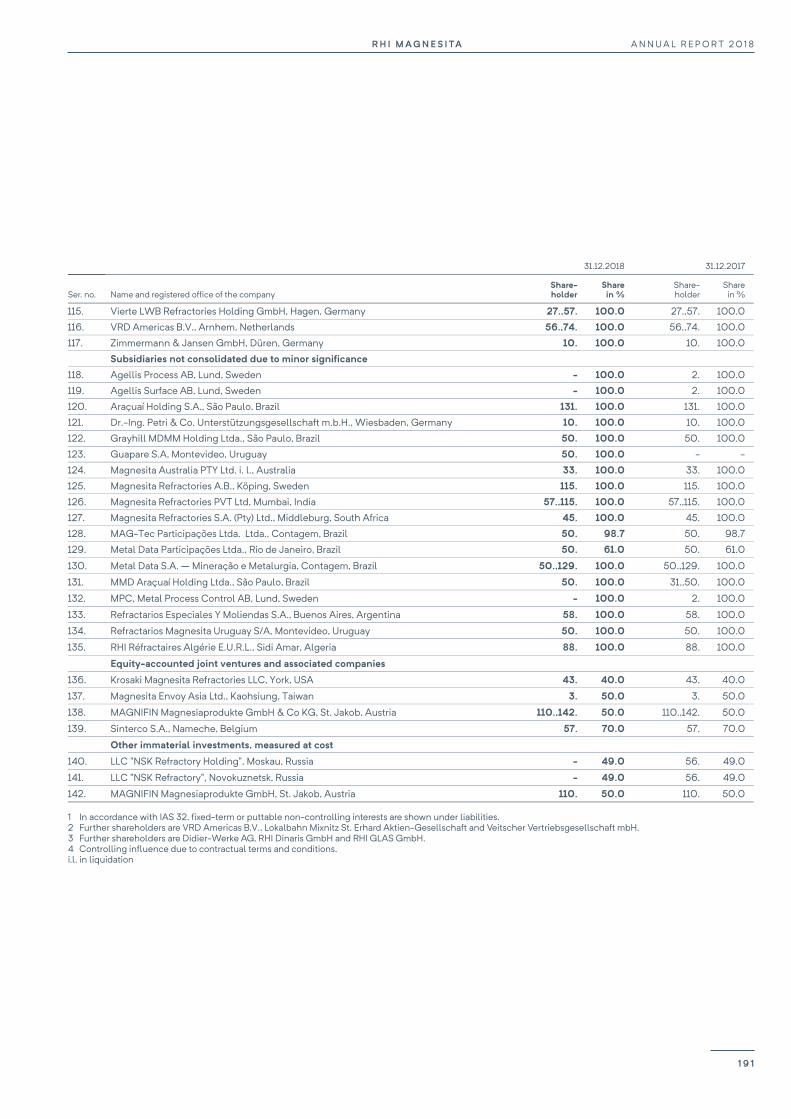
R H I M AG N E S I TA A N N U A L R E P O R T 2 0 1 8
189
31.12.2018 31.12.2017
Ser. no. Name and registered office of the company Share- holder
Share in %
Share- holder
Share in %
115. Vierte LWB Refractories Holding GmbH, Hagen, Germany 27.,57. 100.0 27.,57. 100.0
116. VRD Americas B.V., Arnhem, Netherlands 56.,74. 100.0 56.,74. 100.0
117. Zimmermann & Jansen GmbH, Düren, Germany 10. 100.0 10. 100.0
Subsidiaries not consolidated due to minor significance 118. Agellis Process AB, Lund, Sweden - 100.0 2. 100.0
119. Agellis Surface AB, Lund, Sweden - 100.0 2. 100.0
120. Araçuaí Holding S.A., São Paulo, Brazil 131. 100.0 131. 100.0
121. Dr.-Ing. Petri & Co. Unterstützungsgesellschaft m.b.H., Wiesbaden, Germany 10. 100.0 10. 100.0
122. Grayhill MDMM Holding Ltda., São Paulo, Brazil 50. 100.0 50. 100.0
123. Guapare S.A, Montevideo, Uruguay 50. 100.0 - -
124. Magnesita Australia PTY Ltd. i. l., Australia 33. 100.0 33. 100.0
125. Magnesita Refractories A.B., Köping, Sweden 115. 100.0 115. 100.0
126. Magnesita Refractories PVT Ltd, Mumbai, India 57.,115. 100.0 57.,115. 100.0
127. Magnesita Refractories S.A. (Pty) Ltd., Middleburg, South Africa 45. 100.0 45. 100.0
128. MAG-Tec Participações Ltda. Ltda., Contagem, Brazil 50. 98.7 50. 98.7
129. Metal Data Participações Ltda., Rio de Janeiro, Brazil 50. 61.0 50. 61.0
130. Metal Data S.A. – Mineração e Metalurgia, Contagem, Brazil 50.,129. 100.0 50.,129. 100.0
131. MMD Araçuaí Holding Ltda., São Paulo, Brazil 50. 100.0 31.,50. 100.0
132. MPC, Metal Process Control AB, Lund, Sweden - 100.0 2. 100.0
133. Refractarios Especiales Y Moliendas S.A., Buenos Aires, Argentina 58. 100.0 58. 100.0
134. Refractarios Magnesita Uruguay S/A, Montevideo, Uruguay 50. 100.0 50. 100.0
135. RHI Réfractaires Algérie E.U.R.L., Sidi Amar, Algeria 88. 100.0 88. 100.0
Equity-accounted joint ventures and associated companies
136. Krosaki Magnesita Refractories LLC, York, USA 43. 40.0 43. 40.0
137. Magnesita Envoy Asia Ltd., Kaohsiung, Taiwan 3. 50.0 3. 50.0
138. MAGNIFIN Magnesiaprodukte GmbH & Co KG, St. Jakob, Austria 110.,142. 50.0 110.,142. 50.0
139. Sinterco S.A., Nameche, Belgium 57. 70.0 57. 70.0
Other immaterial investments, measured at cost
140. LLC "NSK Refractory Holding", Moskau, Russia - 49.0 56. 49.0
141. LLC "NSK Refractory", Novokuznetsk, Russia - 49.0 56. 49.0
142. MAGNIFIN Magnesiaprodukte GmbH, St. Jakob, Austria 110. 50.0 110. 50.0
1 In accordance with IAS 32, fixed-term or puttable non-controlling interests are shown under liabilities. 2 Further shareholders are VRD Americas B.V., Lokalbahn Mixnitz St. Erhard Aktien-Gesellschaft and Veitscher Vertriebsgesellschaft mbH. 3 Further shareholders are Didier-Werke AG, RHI Dinaris GmbH and RHI GLAS GmbH. 4 Controlling influence due to contractual terms and conditions. i.l. in liquidation
A N N U A L R E P O R T 2 0 1 8R H I M A G N E S I TA
1 9 1
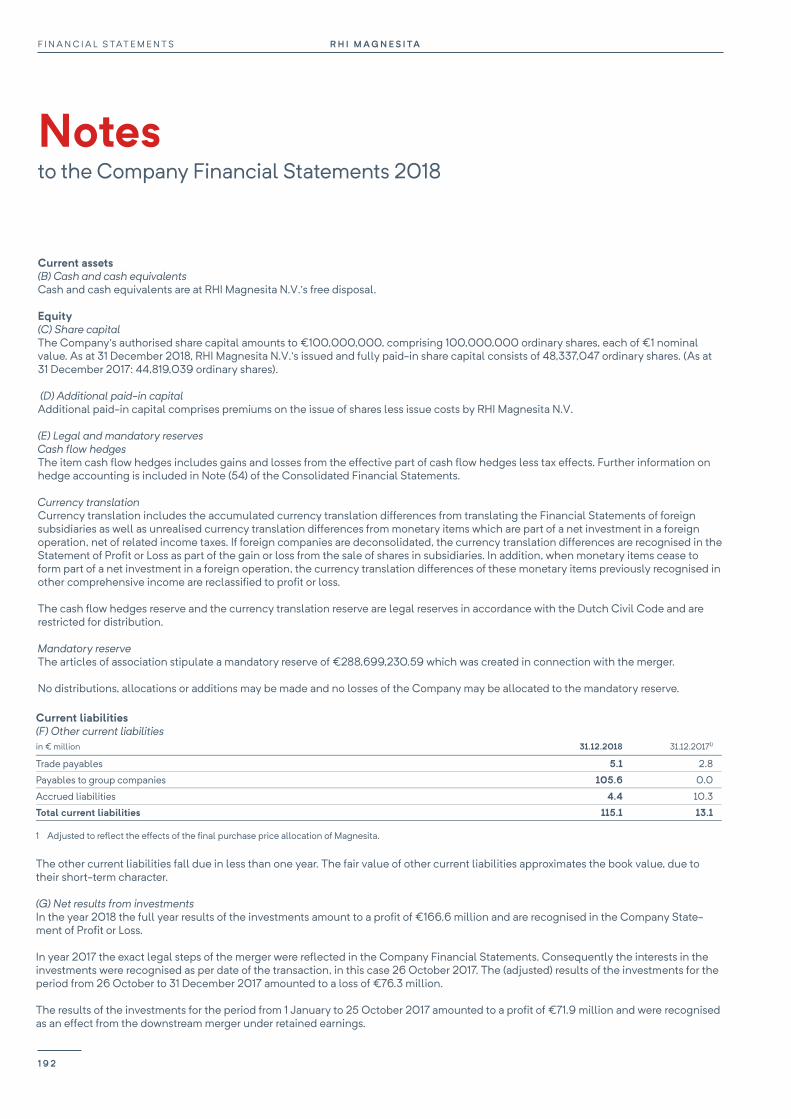
F I N A N C I A L S TAT E M E N T S R H I M AG N E S I TA
Notes to the Company Financial Statements 2018
190
Current assets (B) Cash and cash equivalents Cash and cash equivalents are at RHI Magnesita N.V.’s free disposal.
Equity (C) Share capital The Company’s authorised share capital amounts to €100,000,000, comprising 100,000,000 ordinary shares, each of €1 nominal value. As at 31 December 2018, RHI Magnesita N.V.’s issued and fully paid-in share capital consists of 48,337,047 ordinary shares. (As at 31 December 2017: 44,819,039 ordinary shares).
(D) Additional paid-in capital Additional paid-in capital comprises premiums on the issue of shares less issue costs by RHI Magnesita N.V.
(E) Legal and mandatory reserves Cash flow hedges The item cash flow hedges includes gains and losses from the effective part of cash flow hedges less tax effects. Further information on hedge accounting is included in Note (54) of the Consolidated Financial Statements.
Currency translation Currency translation includes the accumulated currency translation differences from translating the Financial Statements of foreign subsidiaries as well as unrealised currency translation differences from monetary items which are part of a net investment in a foreign operation, net of related income taxes. If foreign companies are deconsolidated, the currency translation differences are recognised in the Statement of Profit or Loss as part of the gain or loss from the sale of shares in subsidiaries. In addition, when monetary items cease to form part of a net investment in a foreign operation, the currency translation differences of these monetary items previously recognised in other comprehensive income are reclassified to profit or loss.
The cash flow hedges reserve and the currency translation reserve are legal reserves in accordance with the Dutch Civil Code and are restricted for distribution.
Mandatory reserve The articles of association stipulate a mandatory reserve of €288,699,230.59 which was created in connection with the merger.
No distributions, allocations or additions may be made and no losses of the Company may be allocated to the mandatory reserve.
R H I M AG N E S I TA A N N U A L R E P O R T 2 0 1 8
191
Current liabilities (F) Other current liabilities in € million 31.12.2018 31.12.20171)
Trade payables 5.1 2.8
Payables to group companies 105.6 0.0
Accrued liabilities 4.4 10.3
Total current liabilities 115.1 13.1
1 Adjusted to reflect the effects of the final purchase price allocation of Magnesita.
The other current liabilities fall due in less than one year. The fair value of other current liabilities approximates the book value, due to their short-term character.
(G) Net results from investments In the year 2018 the full year results of the investments amount to a profit of €166.6 million and are recognised in the Company State-ment of Profit or Loss.
In year 2017 the exact legal steps of the merger were reflected in the Company Financial Statements. Consequently the interests in the investments were recognised as per date of the transaction, in this case 26 October 2017. The (adjusted) results of the investments for the period from 26 October to 31 December 2017 amounted to a loss of €76.3 million.
The results of the investments for the period from 1 January to 25 October 2017 amounted to a profit of €71.9 million and were recognised as an effect from the downstream merger under retained earnings.
(H) Net result for the period In 2018, there are no differences in the result between the Company Financial Statements and the Consolidated Financial Statements.
In 2017, a different accounting treatment of the merger has been applied in the Consolidated Financial Statements and the Company Financial Statements. In the Consolidated Financial Statements the results of a full year have been recognised in the Consolidated Statement of Profit or Loss (the so called ‘pooling of interest methodology’), whereas in the Company Financial Statements the results of the period 26 October 2017 to 31 December 2017 have been recognised in the Company Statement of Profit or Loss (the so called ‘car-ryover accounting methodology). The difference in year 2017 between the Consolidated Financial Statements and the Company Finan-cial Statements is shown in the table below:
in € million 20171)
Company’s net result for the period 1 July to 31 December 2017 (89.3)
Result of the investments for the period from 1 January 2017 to 25 October 2017 recognised in retained earning 71.9
Company’s consolidated results 2017 (attributable to shareholders of RHI Magnesita N.V.) (17.4)
1 Adjusted to reflect the effects of the final purchase price allocation of Magnesita.
Proposed appropriation of result It is proposed that pursuant to Article 27 clause 1 of the articles of association of the Company the result shown in RHI Magnesita N.V. income statement be appropriated as follows:
in € million 2018
Profit attributable to shareholders 158.1
In accordance with Article 27 clause 1 to be transferred to reserves 0.0
At the disposal of the General Meeting of shareholders 158.1
For 2018, the Board of Directors will propose a dividend of €1.50 per share for the shareholders of RHI Magnesita N.V. The proposed divi-dend is subject to the approval by the Annual General Meeting on 6 June 2019.
R H I M A G N E S I TAF I N A N C I A L S TAT E M E N T S
1 9 2
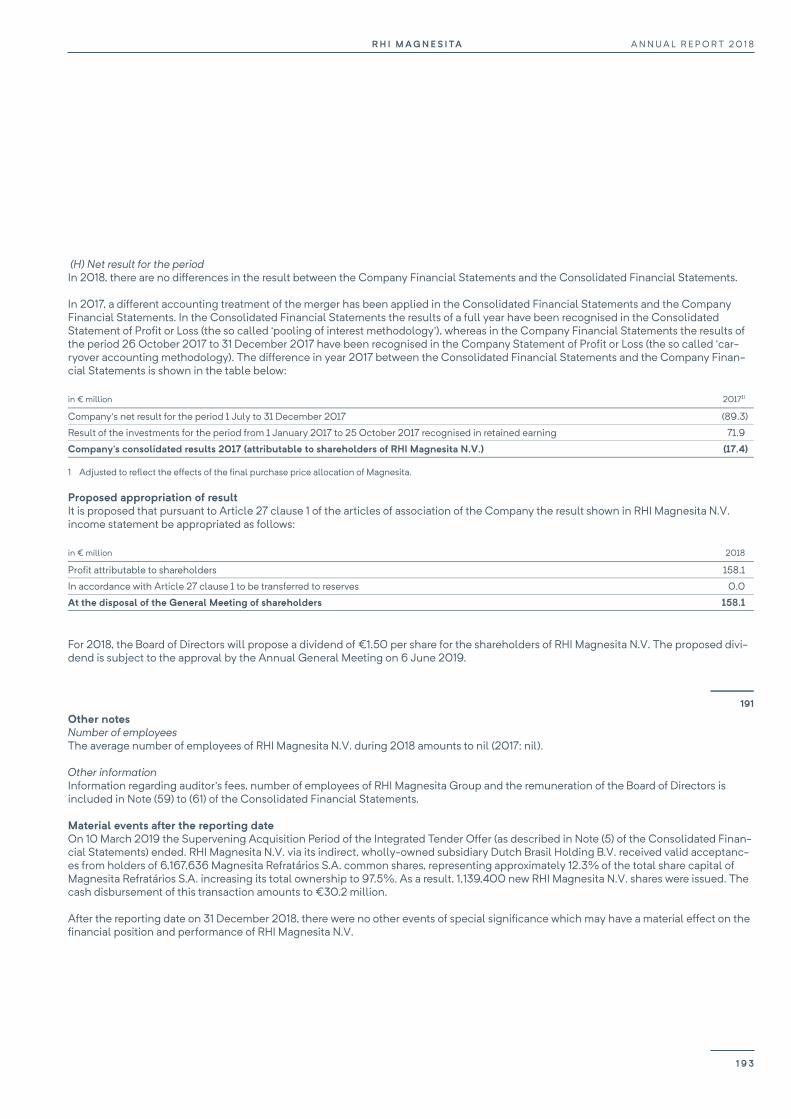
R H I M AG N E S I TA A N N U A L R E P O R T 2 0 1 8
191
Current liabilities (F) Other current liabilities in € million 31.12.2018 31.12.20171)
Trade payables 5.1 2.8
Payables to group companies 105.6 0.0
Accrued liabilities 4.4 10.3
Total current liabilities 115.1 13.1
1 Adjusted to reflect the effects of the final purchase price allocation of Magnesita.
The other current liabilities fall due in less than one year. The fair value of other current liabilities approximates the book value, due to their short-term character.
(G) Net results from investments In the year 2018 the full year results of the investments amount to a profit of €166.6 million and are recognised in the Company State-ment of Profit or Loss.
In year 2017 the exact legal steps of the merger were reflected in the Company Financial Statements. Consequently the interests in the investments were recognised as per date of the transaction, in this case 26 October 2017. The (adjusted) results of the investments for the period from 26 October to 31 December 2017 amounted to a loss of €76.3 million.
The results of the investments for the period from 1 January to 25 October 2017 amounted to a profit of €71.9 million and were recognised as an effect from the downstream merger under retained earnings.
(H) Net result for the period In 2018, there are no differences in the result between the Company Financial Statements and the Consolidated Financial Statements.
In 2017, a different accounting treatment of the merger has been applied in the Consolidated Financial Statements and the Company Financial Statements. In the Consolidated Financial Statements the results of a full year have been recognised in the Consolidated Statement of Profit or Loss (the so called ‘pooling of interest methodology’), whereas in the Company Financial Statements the results of the period 26 October 2017 to 31 December 2017 have been recognised in the Company Statement of Profit or Loss (the so called ‘car-ryover accounting methodology). The difference in year 2017 between the Consolidated Financial Statements and the Company Finan-cial Statements is shown in the table below:
in € million 20171)
Company’s net result for the period 1 July to 31 December 2017 (89.3)
Result of the investments for the period from 1 January 2017 to 25 October 2017 recognised in retained earning 71.9
Company’s consolidated results 2017 (attributable to shareholders of RHI Magnesita N.V.) (17.4)
1 Adjusted to reflect the effects of the final purchase price allocation of Magnesita.
Proposed appropriation of result It is proposed that pursuant to Article 27 clause 1 of the articles of association of the Company the result shown in RHI Magnesita N.V. income statement be appropriated as follows:
in € million 2018
Profit attributable to shareholders 158.1
In accordance with Article 27 clause 1 to be transferred to reserves 0.0
At the disposal of the General Meeting of shareholders 158.1
For 2018, the Board of Directors will propose a dividend of €1.50 per share for the shareholders of RHI Magnesita N.V. The proposed divi-dend is subject to the approval by the Annual General Meeting on 6 June 2019.
F I N A N C I A L S TAT E M E N T S R H I M AG N E S I TA
Notes to the Company Financial Statements 2018
192
Other notes Number of employees The average number of employees of RHI Magnesita N.V. during 2018 amounts to nil (2017: nil).
Other information Information regarding auditor's fees, number of employees of RHI Magnesita Group and the remuneration of the Board of Directors is included in Note (59) to (61) of the Consolidated Financial Statements.
Material events after the reporting date On 10 March 2019 the Supervening Acquisition Period of the Integrated Tender Offer (as described in Note (5) of the Consolidated Finan-cial Statements) ended. RHI Magnesita N.V. via its indirect, wholly-owned subsidiary Dutch Brasil Holding B.V. received valid acceptanc-es from holders of 6,167,636 Magnesita Refratários S.A. common shares, representing approximately 12.3% of the total share capital of Magnesita Refratários S.A. increasing its total ownership to 97.5%. As a result, 1,139,400 new RHI Magnesita N.V. shares were issued. The cash disbursement of this transaction amounts to €30.2 million.
After the reporting date on 31 December 2018, there were no other events of special significance which may have a material effect on the financial position and performance of RHI Magnesita N.V.
A N N U A L R E P O R T 2 0 1 8R H I M A G N E S I TA
1 9 3
F I N A N C I A L S TAT E M E N T S R H I M AG N E S I TA
Notes to the Company Financial Statements 2018
192
Other notes Number of employees The average number of employees of RHI Magnesita N.V. during 2018 amounts to nil (2017: nil).
Other information Information regarding auditor's fees, number of employees of RHI Magnesita Group and the remuneration of the Board of Directors is included in Note (59) to (61) of the Consolidated Financial Statements.
Material events after the reporting date On 10 March 2019 the Supervening Acquisition Period of the Integrated Tender Offer (as described in Note (5) of the Consolidated Finan-cial Statements) ended. RHI Magnesita N.V. via its indirect, wholly-owned subsidiary Dutch Brasil Holding B.V. received valid acceptanc-es from holders of 6,167,636 Magnesita Refratários S.A. common shares, representing approximately 12.3% of the total share capital of Magnesita Refratários S.A. increasing its total ownership to 97.5%. As a result, 1,139,400 new RHI Magnesita N.V. shares were issued. The cash disbursement of this transaction amounts to €30.2 million.
After the reporting date on 31 December 2018, there were no other events of special significance which may have a material effect on the financial position and performance of RHI Magnesita N.V.
F I N A N C I A L S TAT E M E N T S R H I M AG N E S I TA
194
Provisions of the articles of association on profit and distributions The stipulations of Article 27 and 28 of the Articles of Association concerning profit and distributions are:
27 Profit and distributions 27.1 The Board may resolve that the profits realised during a financial year will fully or partially be appropriated to increase and/or form reserves. With due regard to Article 26.2, a deficit may only be offset against the reserves prescribed by law to the extent this is permitted by law.
27.2 The allocation of profits remaining after application of Article 27.1 shall be determined by the General Meeting. The Board shall make a proposal for that purpose. A proposal to make a distribution of profits shall be dealt with as a separate agenda item at the General Meet-ing.
27.3 Distribution of profits shall be made after adoption of the annual accounts if permitted under the law given the contents of the annu-al accounts.
27.4 The Board may resolve to make interim distributions and/or to make distributions at the expense of any reserve of the Company, other than the Mandatory Reserve.
27.5 Distributions on shares may be made only up to an amount which does not exceed the amount of the Distributable Equity. If it con-cerns an interim distribution, the compliance with this requirement must be evidenced by an interim statement of assets and liabilities as referred to in Section 2:105 paragraph 4 of the Dutch Civil Code. The Company shall deposit the statement of assets and liabilities at the Dutch Trade Register within eight days after the day on which the resolution to make the distribution is published.
27.6 Distributions on shares payable in cash shall be paid in euro, unless the Board determines that payment shall be made in another currency.
27.7 The Board is authorised to determine that a distribution on shares will not be made in cash but in kind or in the form of shares, or to determine that shareholders may choose to accept the distribution in cash and/or in the form of shares, all this out of the profits and/or at the expense of reserves, other than the Mandatory Reserve, and all this if and in so far the Board has been designated by the General Meeting in accordance with Article 6.1. The Board shall set the conditions under which such a choice may be made.
28 Release for payment Distributions of profits and other distributions shall be made payable four weeks after adoption of the relevant resolution, unless the Board or the General Meeting at the proposal of the Board determine another date.
Other information
R H I M AG N E S I TA A N N U A L R E P O R T 2 0 1 8
193
Vienna, 26 March 2019
Board of Directors
Herbert Cordt, Chairman Stefan Borgas, CEO David Schlaff Stanislaus Prinz zu Sayn- Wittgenstein-Berleburg Celia Baxter Andrew Hosty James Leng John Ramsay Wolfgang Ruttenstorfer Karl Sevelda Franz Reiter Michael Schwarz
R H I M A G N E S I TAF I N A N C I A L S TAT E M E N T S
1 9 4
Independent auditor’s reportTo: the general meeting and the board of directors of RHI Magnesita N.V.
Report on the financial and consolidated financial statements 2018Our opinionIn our opinion:
¥ RHI Magnesita N.V.’s consolidated financial statements give a true and fair view of the financial position of the Group as at 31 December 2018 and of its result and cash flows for the year then ended in accordance with International Financial Reporting Standards as adopted by the European Union (EU-IFRS) and with Part 9 of Book 2 of the Dutch Civil Code;
¥ RHI Magnesita N.V.’s company financial statements give a true and fair view of the financial position of the Company as at 31 December 2018 and of its result for the year then ended in accordance with Part 9 of Book 2 of the Dutch Civil Code.
What we have auditedWe have audited the accompanying financial statements 2018 of RHI Magnesita N.V., Vienna (‘the Company’). The financial statements include the consolidated financial statements of RHI Magnesita N.V. together with its subsidiaries (‘the Group’) and the company financial statements.
The consolidated financial statements comprise:
¥ the Consolidated Statement of Financial Position as at 31 December 2018;
¥ the following statements for 2018: the Consolidated Statement of Profit or Loss and the Consolidated Statement of Comprehensive Income, Consolidated Statement of Cash Flows and Consolidated Statement of Changes in Equity; and
¥ the Notes to the Consolidated Financial Statements, comprising significant accounting policies and other explanatory information.
The company financial statements comprise:
¥ the company balance sheet as at 31 December 2018; ¥ the company statement of profit or loss for the year then ended; ¥ the notes, comprising the accounting policies applied and other
explanatory information.
The financial reporting framework applied in the preparation of the financial statements is EU-IFRS and the relevant provisions of Part 9 of Book 2 of the Dutch Civil Code for the consolidated financial statements and Part 9 of Book 2 of the Dutch Civil Code for the company financial statements.
The basis for our opinionWe conducted our audit in accordance with Dutch law, including the Dutch Standards on Auditing. We have further described our responsibilities under those standards in the section ‘Our responsibilities for the audit of the financial statements’ of our report.
We believe that the audit evidence we have obtained is sufficient and appropriate to provide a basis for our opinion.
IndependenceWe are independent of RHI Magnesita N.V. in accordance with the European Regulation on specific requirements regarding statutory audit of public-interest entities, the ‘Wet toezicht accountantsorganisaties’ (Wta, Audit firms supervision act), the ‘Verordening inzake de onafhankelijkheid van accountants bij assuranceopdrachten’ (ViO – Code of Ethics for Professional Accountants, a regulation with respect to independence) and other relevant independence requirements in the Netherlands. Furthermore, we have complied with the ‘Verordening gedrags- en beroepsregels accountants’ (VGBA – Code of Ethics for Professional Accountants, a regulation with respect to rules of professional conduct).
Our audit approachOverview and contextRHI Magnesita N.V. is a worldwide producer of refractory products. Refractory products are used in all the world’s high-temperature industrial processes. The Group is comprised of several components and therefore we considered our group audit scope and approach as set out in the section ‘The scope of our group audit’. We paid specific attention to the areas of focus driven by the operations of the Group, as set out below.
The financial year 2018 was characterised by the integration of Magnesita Refratários S.A., the in 2017 acquired Magnesita Group, and by organisational changes throughout the Group. This affected the determination of materiality, the scope of our group audit and our audit procedures as described in the sections ‘Materiality’, ‘The scope of our audit’ and ‘Key audit matters’.
As part of designing our audit, we determined materiality and assessed the risks of material misstatement in the financial statements. In particular, we considered where the board of directors made important judgements, for example, in respect of significant accounting estimates that involved making assumptions and considering future events that are inherently uncertain. In note 10 of the consolidated financial statements, the Company describes the areas of judgement in applying accounting policies and the key sources of estimation uncertainty. Given the significant estimation uncertainty and the related higher inherent risks of material misstatement in the recoverability of deferred tax assets, final accounting of the Magnesita acquisition, valuation of goodwill and other intangible assets, we considered these matters as key audit matters as set out in the section ‘Key audit matters’ of this report. Furthermore we identified the implementation of IFRS 15, the new revenue standard, as a key audit matter.
1 9 5
A N N U A L R E P O R T 2 0 1 8R H I M A G N E S I TA
1 9 5
A N N U A L R E P O R T 2 0 1 8R H I M A G N E S I TA
Other areas of focus, that were not considered to be key audit matters, were the disclosures as required by IAS 8 concerning the transition to the new accounting standard IFRS 16 ‘Leases’. As in all of our audits, we also addressed the risk of management override of internal controls, including evaluating whether there was evidence of bias by the board of directors that may represent a risk of material misstatements due to fraud.
We ensured that the audit teams at both group and component level included the appropriate skills and competences, which are needed for the audit of an international industrial products company. We therefore included specialists in the areas of IT and corporate income tax, as well as experts in the areas of valuation and employee benefits, in our audit team.
The outline of our audit approach was as follows:
Materiality ¥ Overall materiality: €13.8 million.
Audit scope ¥ We conducted audit work in 42 locations. ¥ Site visits were conducted to 6
countries – Brasil, US, Canada, China, India and Austria.
¥ Audit coverage: 93% of consolidated revenue, 93% of consolidated total assets, 97% of consolidated EBIT and 99% of consolidated EBITDA.
Key audit matters ¥ Recoverability of deferred tax assets; ¥ Finalisation of the purchase price allocation in respect of
the acquisition of Magnesita Refratários S.A.; ¥ Valuation of goodwill and other intangible assets; ¥ Implementation of IFRS 15, the new revenue standard.
MaterialityThe scope of our audit is influenced by the application of materiality, which is further explained in the section ‘Our responsibilities for the audit of the financial statements’.
Based on our professional judgement, we determined certain quantitative thresholds for materiality, including the overall materiality for the financial statements as a whole as set out in the table below. These, together with qualitative considerations, helped us to determine the nature, timing and extent of our audit procedures on the individual financial statement line items and disclosures and to evaluate the effect of identified misstatements, both individually and in aggregate, on the financial statements as a whole and on our opinion.
Overall group materiality
€13.8 million (2017: €8.0 million).
Basis for determining materiality
We used our professional judgement to determine overall materiality. As a basis for our judgement, we used approximately 2.5% of earnings before interest, taxes depreciation and amortisation (EBITDA).
Rationale for benchmark applied
We used EBITDA as the benchmark, a generally accepted auditing practice, based on our analysis of the common information needs of users of the financial statements. On this basis, we believe that EBITDA is an important metric for the financial performance of the Company.
Component materiality
To each component in our audit scope, we, based on our judgement, allocate materiality that is less than our overall group materiality. The range of materiality allocated across components was between €0.9 million and €11 million.
We also take misstatements and possible misstatements into account that, in our judgement, are material for qualitative reasons.
We agreed with the board of directors that we would report to them misstatements identified during our audit above €0.7 million (2017: €0.4 million) as well as misstatements below that amount that, in our view, warranted reporting for qualitative reasons.
The scope of our group auditRHI Magnesita N.V. is the parent company of a group of entities. The financial information of this group is included in the consolidated financial statements of RHI Magnesita N.V.
We tailored the scope of our audit to ensure that we performed sufficient work to be able to give an opinion on the financial statements as a whole, taking into account the management structure of the Group, the nature of operations of its components, the accounting processes and controls, and the markets in which the components of the Group operate. In establishing the overall group audit strategy and plan, we determined the type of work required to be performed at component level by the Group engagement team and by each component auditor.
We have audited the complete financial information of 20 components, of which 5 components are individually financially significant to the Group:
¥ RHI Magnesita GmbH (formerly RHI Feuerfest GmbH), Austria ¥ Magnesita Refratários S.A., Brasil ¥ Magnesita Mineracao S.A., Brasil ¥ RHI US, USA ¥ Magnesita Refractories Company, USA
Key auditmatters
Audit scope
Materiality
Independent auditor’s reportcontinued
R H I M A G N E S I TAF I N A N C I A L S TAT E M E N T S
1 9 6
R H I M A G N E S I TAF I N A N C I A L S TAT E M E N T S
1 9 6

We further performed specific risk-focussed audit procedures for 3 components as they include significant or higher risk areas:
¥ Magnesita Refractories Middle East, Dubai ¥ Magnesita Finance S.A., Luxembourg ¥ Dutch Brasil Holding B.V., Netherlands
Additionally, we selected 21 components for audit procedures to achieve appropriate coverage on financial line items in the consolidated financial statements and to build an element of unpredictability in our audit.
In total, in performing these procedures, we achieved the following coverage on the financial line items:
Revenue 93%
Total assets 93%
EBIT 97%
EBITDA 99%
None of the remaining components represented more than 1% of total group revenue or total group assets. For those remaining components we performed, among other things, analytical procedures to corroborate our assessment that there were no significant risks of material misstatements within those components.
The group engagement team performed the audit work for the parent company RHI Magnesita N.V. and the Austrian entities in scope for the group audit. For all other components, we used component auditors who are familiar with the local laws and regulations to perform the audit work.
Where component auditors performed the work, we determined the level of involvement we needed to have in their audit work to be able to conclude whether we had obtained sufficient appropriate audit evidence as a basis for our opinion on the consolidated financial statements as a whole.
We issued instructions to the component audit teams in our audit scope. These instructions included amongst others our risk analysis, materiality and scope of the work. We explained to the component audit teams the structure of the Group, the main developments that are relevant for the component auditors, the risks identified, the materiality levels to be applied and our global audit approach. We had individual calls with each of the in-scope component audit teams during the year including upon conclusion of their work. During these calls, we discussed the significant accounting and audit issues identified by the component auditors, the reports of the component auditors, the findings of their procedures and other matters, which could be of relevance for the consolidated financial statements.
wwThe group engagement team visits the component teams and local management on a rotational basis. In the current year, the group audit team visited the Magnesita finance functions in Brasil, China and US given the importance of the judgements involved in the final purchase price allocation resulting from the acquisition of Magnesita Group, as well as the Chinese, Canadian, US, Austrian and Indian operating locations. For each of these locations we reviewed selected working papers of the component auditors.
The group engagement team at the head office audited the group consolidation, financial statements disclosures, IFRS 15 adjustments, inventory valuation and a number of complex items. These include acquisition accounting, impairment testing and valuation of deferred tax assets.
By performing the procedures above at components, combined with additional procedures at group level, we have been able to obtain sufficient and appropriate audit evidence on the Group’s financial information, as a whole, to provide a basis for our opinion on the financial statements.
Our focus on fraudOur objectivesWe assess and respond to the risk of fraud in the context of our audit of the financial statements. In this context and with reference to the sections on responsibilities in this report, our objectives in relation to fraud are:
¥ to identify and assess the risks of material misstatement of the financial statements due to fraud;
¥ to obtain sufficient appropriate audit evidence regarding the assessed risks of material misstatement due to fraud, through designing and implementing appropriate audit responses;
¥ to respond appropriately to fraud or suspected fraud identified during the audit.
However, because of the characteristics of fraud, particularly those involving sophisticated and carefully organised schemes to conceal it, such as forgery, deliberate failure to record transactions and collusion, our audit might not detect instances of material fraud.
Our risk assessmentWe obtained an understanding of the entity and its environment, including the entity’s internal control. We made enquiries of group and local management, the internal audit function, legal and compliance departments and the audit committee. In addition, we considered other external and internal information. As part of our process of identifying fraud risks, we evaluated fraud risk factors with respect to financial reporting fraud, misappropriation of assets and bribery and corruption. Fraud risk factors are events or conditions, which indicate an incentive or pressure, an opportunity, or an attitude or rationalisation to commit fraud. We evaluated the fraud risk factors to consider whether those factors indicated a risk of material misstatement due to fraud.
As in all of our audits, we addressed the risk of management override of internal controls, including evaluating whether there was evidence of bias by the board of directors that may represent a risk of material misstatement due to fraud.
A N N U A L R E P O R T 2 0 1 8R H I M A G N E S I TA
1 9 7
A N N U A L R E P O R T 2 0 1 8R H I M A G N E S I TA
1 9 7
Independent auditor’s reportcontinued
Our response to the risk of fraudWe evaluated the design and the implementation and, where considered appropriate, tested the operating effectiveness of internal controls that mitigate fraud risks. In addition, we performed procedures, which include journal entry testing and evaluating accounting estimates for bias.
In particular, our procedures consisted of checking the results of whistleblowing and complaints procedures with the entity, data analysis of high-risk journal entries and evaluation of key estimates and judgements by RHI Magnesita N.V. (including retrospective reviews of prior year’s estimates). Where we identified instances of unexpected journal entries or other risks through our data analytics, we performed additional audit procedures to address each identified risk. These procedures also included testing of transactions back to source information. We also incorporated elements of unpredictability in our audit.
We considered the outcome of our other audit procedures and evaluated whether any findings or misstatements were indicative of fraud. If so, we reevaluate our assessment of fraud risk and its resulting impact on our audit procedures.
We refer to the key audit matters “Recoverability of deferred income tax assets”, “Valuation of goodwill and other intangible assets” and “Finalisation of the purchase price allocation in respect of the acquisition of Magnesita Refratários S.A.”, which are examples of our approach related to areas of higher risk due to accounting estimates where management makes significant judgements.
Key audit mattersKey audit matters are those matters that, in our professional judgement, were of most significance in the audit of the financial statements. We have communicated the key audit matters to the board of directors. The key audit matters are not a comprehensive reflection of all matters identified by our audit and that we discussed. In this section, we described the key audit matters and included a summary of the audit procedures we performed on those matters.
We addressed the key audit matters in the context of our audit of the financial statements as a whole, and in forming our opinion thereon. We do not provide separate opinions on these matters or on specific elements of the financial statements. Any comments or observations we made on the results of our procedures should be read in this context.
Given the non-recurring nature of the restructuring following the Magnesita acquisition in 2017, the key audit matter “Accounting for restructuring” as considered in the 2017 auditor’s report, in our opinion, does not longer warrant the classification of key audit matter in 2018.
Key audit matter Our audit work and observations
Recoverability of deferred tax assets Refer to note 8, 10, 17 and 44 of the consolidated financial statements
The Group capitalised deferred tax assets on tax loss carry-forwards and deductible temporary differences arising on various items for the amount of €171.1 million. Reference is made to note 17 of the financial statements.
Deferred tax assets are capitalised based on the assumption that sufficient taxable income will be generated against which loss carry-forwards and other deductible temporary differences can be offset. This assumption is based on estimates of the current and the estimated taxable results, and any future measures implemented by the company in several jurisdictions concerned that will have an effect on income tax. The Group also has losses and other temporary differences for which no deferred tax asset has been recognised in these consolidated financial statements.
Due to the inherent level of uncertainty, the potential limitations in the recoverability of deferred tax assets and the significant judgement involved, we considered the recoverability of deferred tax assets to be a key audit matter for our audit.
We have requested and obtained confirmation letters from third party tax advisors to confirm the existence and accuracy of the tax loss carry-forwards, taking into account the expiration dates per jurisdiction. In addition, together with our tax specialists, we have assessed per tax jurisdiction the level of potential offsetting of the deferred tax assets with the deferred tax liabilities.
Furthermore, we have critically assessed the underlying assumptions of the forecasted taxable income through agreeing the forecasted future taxable profits with approved business plans in a tax jurisdiction. We also assessed the past performance against the expected future tax profits in the business plans used by the Group, by using our knowledge of the Group and the industry in which it operates. In addition, we have considered the local expiry period together with any applicable restrictions in recovery for each individual jurisdiction.
We assessed and corroborated the adequacy and appropriateness of the disclosure made in the consolidated financial statements.
The above procedures did not result in material audit findings.
R H I M A G N E S I TAF I N A N C I A L S TAT E M E N T S
1 9 8
R H I M A G N E S I TAF I N A N C I A L S TAT E M E N T S
1 9 8
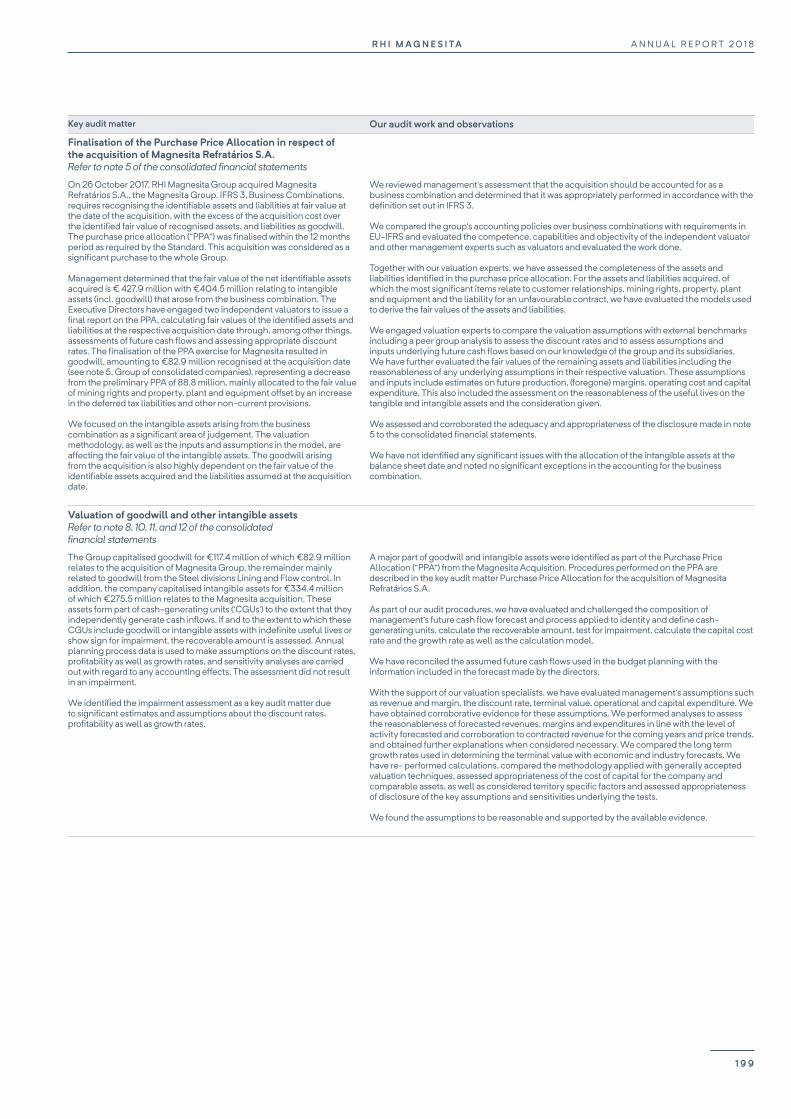
Key audit matter Our audit work and observations
Finalisation of the Purchase Price Allocation in respect of the acquisition of Magnesita Refratários S.A.Refer to note 5 of the consolidated financial statements
On 26 October 2017, RHI Magnesita Group acquired Magnesita Refratários S.A., the Magnesita Group. IFRS 3, Business Combinations, requires recognising the identifiable assets and liabilities at fair value at the date of the acquisition, with the excess of the acquisition cost over the identified fair value of recognised assets, and liabilities as goodwill. The purchase price allocation (“PPA”) was finalised within the 12 months period as required by the Standard. This acquisition was considered as a significant purchase to the whole Group.
Management determined that the fair value of the net identifiable assets acquired is € 427.9 million with €404.5 million relating to intangible assets (incl. goodwill) that arose from the business combination. The Executive Directors have engaged two independent valuators to issue a final report on the PPA, calculating fair values of the identified assets and liabilities at the respective acquisition date through, among other things, assessments of future cash flows and assessing appropriate discount rates. The finalisation of the PPA exercise for Magnesita resulted in goodwill, amounting to €82.9 million recognised at the acquisition date (see note 5, Group of consolidated companies), representing a decrease from the preliminary PPA of 88.8 million, mainly allocated to the fair value of mining rights and property, plant and equipment offset by an increase in the deferred tax liabilities and other non-current provisions.
We focused on the intangible assets arising from the business combination as a significant area of judgement. The valuation methodology, as well as the inputs and assumptions in the model, are affecting the fair value of the intangible assets. The goodwill arising from the acquisition is also highly dependent on the fair value of the identifiable assets acquired and the liabilities assumed at the acquisition date.
We reviewed management’s assessment that the acquisition should be accounted for as a business combination and determined that it was appropriately performed in accordance with the definition set out in IFRS 3.
We compared the group’s accounting policies over business combinations with requirements in EU-IFRS and evaluated the competence, capabilities and objectivity of the independent valuator and other management experts such as valuators and evaluated the work done.
Together with our valuation experts, we have assessed the completeness of the assets and liabilities identified in the purchase price allocation. For the assets and liabilities acquired, of which the most significant items relate to customer relationships, mining rights, property, plant and equipment and the liability for an unfavourable contract, we have evaluated the models used to derive the fair values of the assets and liabilities.
We engaged valuation experts to compare the valuation assumptions with external benchmarks including a peer group analysis to assess the discount rates and to assess assumptions and inputs underlying future cash flows based on our knowledge of the group and its subsidiaries. We have further evaluated the fair values of the remaining assets and liabilities including the reasonableness of any underlying assumptions in their respective valuation. These assumptions and inputs include estimates on future production, (foregone) margins, operating cost and capital expenditure. This also included the assessment on the reasonableness of the useful lives on the tangible and intangible assets and the consideration given.
We assessed and corroborated the adequacy and appropriateness of the disclosure made in note 5 to the consolidated financial statements.
We have not identified any significant issues with the allocation of the intangible assets at the balance sheet date and noted no significant exceptions in the accounting for the business combination.
Valuation of goodwill and other intangible assetsRefer to note 8, 10, 11, and 12 of the consolidated financial statements
The Group capitalised goodwill for €117.4 million of which €82.9 million relates to the acquisition of Magnesita Group, the remainder mainly related to goodwill from the Steel divisions Lining and Flow control. In addition, the company capitalised intangible assets for €334.4 million of which €275.5 million relates to the Magnesita acquisition. These assets form part of cash-generating units (‘CGUs’) to the extent that they independently generate cash inflows. If and to the extent to which these CGUs include goodwill or intangible assets with indefinite useful lives or show sign for impairment, the recoverable amount is assessed. Annual planning process data is used to make assumptions on the discount rates, profitability as well as growth rates, and sensitivity analyses are carried out with regard to any accounting effects. The assessment did not result in an impairment.
We identified the impairment assessment as a key audit matter due to significant estimates and assumptions about the discount rates, profitability as well as growth rates.
A major part of goodwill and intangible assets were identified as part of the Purchase Price Allocation (“PPA”) from the Magnesita Acquisition. Procedures performed on the PPA are described in the key audit matter Purchase Price Allocation for the acquisition of Magnesita Refratários S.A.
As part of our audit procedures, we have evaluated and challenged the composition of management’s future cash flow forecast and process applied to identity and define cash-generating units, calculate the recoverable amount, test for impairment, calculate the capital cost rate and the growth rate as well as the calculation model.
We have reconciled the assumed future cash flows used in the budget planning with the information included in the forecast made by the directors.
With the support of our valuation specialists, we have evaluated management’s assumptions such as revenue and margin, the discount rate, terminal value, operational and capital expenditure. We have obtained corroborative evidence for these assumptions. We performed analyses to assess the reasonableness of forecasted revenues, margins and expenditures in line with the level of activity forecasted and corroboration to contracted revenue for the coming years and price trends, and obtained further explanations when considered necessary. We compared the long term growth rates used in determining the terminal value with economic and industry forecasts. We have re- performed calculations, compared the methodology applied with generally accepted valuation techniques, assessed appropriateness of the cost of capital for the company and comparable assets, as well as considered territory specific factors and assessed appropriateness of disclosure of the key assumptions and sensitivities underlying the tests.
We found the assumptions to be reasonable and supported by the available evidence.
A N N U A L R E P O R T 2 0 1 8R H I M A G N E S I TA
1 9 9
Independent auditor’s reportcontinued
Key audit matter Our audit work and observations
Implementation of IFRS 15, the new revenue standardRefer to note 2, 8, 10, 35 and 50 of the consolidated financial statements
As described in note 2, 8 and 10 of the consolidated financial statements the Group has adopted IFRS 15 Revenue from Contracts with Customers. The application and adoption of this accounting standard is complex. IFRS 15 establishes a comprehensive framework for determining whether, how much and when revenue is recognised.
The Group has applied the modified retrospective approach and has recognised the cumulative effect of initial application as an adjustment to the opening balance of retained earnings as per 1 January 2018. The Group applies several practical expedients in its implementation.
In relation to the recognition of revenue under IFRS 15 the Group has to apply judgement in multiple areas, such as when control over refractory products passes to the customer, bundling of contracts, identifying performance obligations and allocating the transaction price to these performance obligations and whether revenue should be recognised at a point in time or over time.
As a result, we consider the adoption and implementation of IFRS 15 a key audit matter.
We performed inquiries of Management to obtain an understanding of the process for the revenue recognition under IFRS 15.
We evaluated the design and technical implementation of the processes of the Group, surrounding the implementation and recording adjustments arising from the adoption of IFRS 15.
We have obtained a schedule of contract types with the underlying master agreements for the Group. We evaluated the accuracy and completeness of the contract types in the schedule, including the technical implementation thereon, based on our knowledge of the Group and experience of the industry in which it operates. We analysed the existing contracts with customers and considered the Group’s revenue recognition policies in respect of those revenue streams. We evaluated the judgement applied by the Group, in particular with respect to when control over refractory products passes to the customer, bundling of contracts, identifying performance obligations and allocating the transaction price to these performance obligations and whether revenue should be recognised at a point in time or over time.
We obtained a schedule of the cumulative effect and adjustments as at 1 January 2018 and for the current year and evaluated the completeness and mathematical accuracy of the schedule by assessing whether the schedule of adjustments is complete and reflects appropriate consideration for the changes in the revenue accounting under IFRS 15. We have performed substantive testing in order to verify that the accounting for the revenue transactions are appropriately reflecting the revenue recognition policies in line with IFRS 15.
Furthermore, we have assessed the adequacy of the related (IFRS 15) disclosures in the financial statements. Our audit procedures did not indicate material findings with respect to the application of IFRS 15 and disclosures thereto.
R H I M A G N E S I TAF I N A N C I A L S TAT E M E N T S
2 0 0
R H I M A G N E S I TAF I N A N C I A L S TAT E M E N T S
2 0 0
Report on the other information included in the annual reportIn addition to the financial statements and our auditor’s report thereon, the annual report contains other information that consists of:
¥ the section strategic report; ¥ the section governance; ¥ the other information pursuant to Part 9 of Book 2 of the Dutch
Civil Code.
Based on the procedures performed as set out below, we conclude that the other information:
¥ is consistent with the financial statements and does not contain material misstatements;
¥ contains the information that is required by Part 9 of Book 2 of the Dutch Civil Code.
We have read the other information. Based on our knowledge and understanding obtained in our audit of the financial statements or otherwise, we have considered whether the other information contains material misstatements.
By performing our procedures, we comply with the requirements of Part 9 of Book 2 of the Dutch Civil Code and the Dutch Standard 720. The scope of such procedures was substantially less than the scope of those performed in our audit of the financial statements.
The directors are responsible for the preparation of the other information, including the directors’ report and the other information in accordance with Part 9 of Book 2 of the Dutch Civil Code.
Report on other legal and regulatory requirements Our appointmentWe were appointed as auditors of RHI Magnesita N.V. by the supervisory board following the passing of a resolution by the shareholders at the annual meeting held on 4 October 2017. Our appointment has been renewed annually by shareholders representing a total period of uninterrupted engagement appointment of 2 years.
No prohibited non-audit servicesTo the best of our knowledge and belief, we have not provided prohibited non-audit services as referred to in Article 5(1) of the European Regulation on specific requirements regarding statutory audit of public-interest entities.
Services renderedThe services, in addition to the audit, that we have provided to the Company and its controlled entities, for the period to which our statutory audit relates, are disclosed in note 59 to the consolidated financial statements.
Responsibilities for the financial statements and the auditResponsibilities of the executive directors for the financial statementsThe executive directors are responsible for:
¥ the preparation and fair presentation of the financial statements in accordance with EU-IFRS and with Part 9 of Book 2 of the Dutch Civil Code; and for
¥ such internal control as the executive directors determine is necessary to enable the preparation of the financial statements that are free from material misstatement, whether due to fraud or error.
As part of the preparation of the financial statements, the executive directors are responsible for assessing the Company’s ability to continue as a going concern. Based on the financial reporting frameworks mentioned, the executive directors should prepare the financial statements using the going-concern basis of accounting unless the executive directors intend either to liquidate the company or to cease operations, or have no realistic alternative but to do so. The executive directors should disclose events and circumstances that may cast significant doubt on the Company’s ability to continue as a going concern in the financial statements.
The board of directors is responsible for overseeing the Company’s financial reporting process.
Our responsibilities for the audit of the financial statementsOur responsibility is to plan and perform an audit engagement in a manner that allows us to obtain sufficient and appropriate audit evidence to provide a basis for our opinion. Our audit opinion aims to provide reasonable assurance about whether the financial statements are free from material misstatement. Reasonable assurance is a high but not absolute level of assurance, which makes it possible that we may not detect all misstatements. Misstatements may arise due to fraud or error. They are considered to be material if, individually or in the aggregate, they could reasonably be expected to influence the economic decisions of users taken on the basis of the financial statements.
Materiality affects the nature, timing and extent of our audit procedures and the evaluation of the effect of identified misstatements on our opinion.
A more detailed description of our responsibilities is set out in the appendix to our report.
Amsterdam, 26 March 2019PricewaterhouseCoopers Accountants N.V.E.M.W.H. van der Vleuten RA MSc
A N N U A L R E P O R T 2 0 1 8R H I M A G N E S I TA
2 0 1
A N N U A L R E P O R T 2 0 1 8R H I M A G N E S I TA
2 0 1

Independent auditor’s reportcontinued
Appendix to our auditor’s report on the financial statements 2018 of RHI Magnesita N.V.In addition to what is included in our auditor’s report, we have further set out in this appendix our responsibilities for the audit of the financial statements and explained what an audit involves.
The auditor’s responsibilities for the audit of the financial statementsWe have exercised professional judgement and have maintained professional scepticism throughout the audit in accordance with Dutch Standards on Auditing, ethical requirements and independence requirements. Our objectives are to obtain reasonable assurance about whether the financial statements as a whole are free from material misstatement, whether due to fraud or error. Our audit consisted, among other things of the following:
¥ Identifying and assessing the risks of material misstatement of the financial statements, whether due to fraud or error, designing and performing audit procedures responsive to those risks, and obtaining audit evidence that is sufficient and appropriate to provide a basis for our opinion. The risk of not detecting a material misstatement resulting from fraud is higher than for one resulting from error, as fraud may involve collusion, forgery, intentional omissions, misrepresentations, or the intentional override of internal control.
¥ Obtaining an understanding of internal control relevant to the audit in order to design audit procedures that are appropriate in the circumstances, but not for the purpose of expressing an opinion on the effectiveness of the Company’s internal control.
¥ Evaluating the appropriateness of accounting policies used and the reasonableness of accounting estimates and related disclosures made by the executive directors.
¥ Concluding on the appropriateness of the executive directors’ use of the going-concern basis of accounting, and based on the audit evidence obtained, concluding whether a material uncertainty exists related to events and/or conditions that may cast significant doubt on the Company’s ability to continue as a going concern. If we conclude that a material uncertainty exists, we are required to draw attention in our auditor’s report to the related disclosures in the financial statements or, if such disclosures are inadequate, to modify our opinion. Our conclusions are based on the audit evidence obtained up to the date of our auditor’s report and are made in the context of our opinion on the financial statements as a whole. However, future events or conditions may cause the company to cease to continue as a going concern.
¥ Evaluating the overall presentation, structure and content of the financial statements, including the disclosures, and evaluating whether the financial statements represent the underlying transactions and events in a manner that achieves fair presentation.
Considering our ultimate responsibility for the opinion on the consolidated financial statements, we are responsible for the direction, supervision and performance of the group audit. In this context, we have determined the nature and extent of the audit procedures for components of the Group to ensure that we performed enough work to be able to give an opinion on the financial statements as a whole. Determining factors are the geographic structure of the Group, the significance and/or risk profile of group entities or activities, the accounting processes and controls, and the industry in which the Group operates. On this basis, we selected group entities for which an audit or review of financial information or specific balances was considered necessary.
We communicate with the board of directors regarding, among other matters, the planned scope and timing of the audit and significant audit findings, including any significant deficiencies in internal control that we identify during our audit. In this respect, we also issue an additional report to the audit committee in accordance with Article 11 of the EU Regulation on specific requirements regarding statutory audit of public-interest entities. The information included in this additional report is consistent with our audit opinion in this auditor’s report.
We provide the board of directors with a statement that we have complied with relevant ethical requirements regarding independence, and to communicate with them all relationships and other matters that may reasonably be thought to bear on our independence, and where applicable, related safeguards.
From the matters communicated with the board of directors, we determine those matters that were of most significance in the audit of the financial statements of the current period and are therefore the key audit matters. We describe these matters in our auditor’s report unless law or regulation precludes public disclosure about the matter or when, in extremely rare circumstances, not communicating the matter is in the public interest.
R H I M A G N E S I TAF I N A N C I A L S TAT E M E N T S
2 0 2
R H I M A G N E S I TAF I N A N C I A L S TAT E M E N T S
2 0 2
Alternative performance measures (“APMs”)APMs used by the Group are reviewed below to provide a definition and reconciliation from each non-IFRS APM to its IFRS equivalent, and to explain the purpose and usefulness of each APM.In general, APMs are presented externally to meet investors’ requirements for further clarity and transparency of the Group’s underlying financial performance. The APMs are also used internally in the management of our business performance, budgeting and forecasting.
APMs are non-IFRS measures. As a result, APMs allow investors and other readers to review different kinds of revenue, profits and costs and should not be used in isolation. Commentary within the Annual Report, including the Financial Review, as well as the Consolidated Financial Statements and the accompanying notes, should be referred to in order to fully appreciate all the factors that affect our business. We strongly encourage readers not to rely on any single financial measure, but to carefully review our reporting in its entirety.
Adjusted pro-forma results at a constant currency Whilst the merger became effective on 27 October 2017, the adjusted pro-forma results were prepared as if the combined Group had existed since 1 January 2017. The pro-forma results are, where appropriate, adjusted to reflect the purchase price allocation (“PPA”) related to the acquisition of Magnesita and other adjustments. This measure provides an estimation of the historical financial performance of the current Group structure.
Given the changes in capital structure arising from the acquisition of Magnesita, the historical interest, tax and dividend charges are not deemed to be meaningful. As a result, adjusted pro-forma results have only been provided down to EBITA.
Figures presented at constant currency represent 2017 amounts retranslated to average 2018 exchange rates.
EBITAEBIT, as presented in Consolidated Statement of Profit and Loss, excluding amortisation and impairments.
EBITDA EBIT, as presented in Consolidated Statement of Profit and Loss, excluding depreciation, amortisation and impairments.
Adjusted EBITDA and EBITATo provide further transparency and clarity to the ongoing, underlying financial performance of the Group, adjusted EBITDA and EBITA are used. Both measures exclude other income and expenses as presented in Consolidated Statement of Profit and Loss.
Adjusted earnings per share (“EPS”)Adjusted EPS is used to assess the Company’s operational performance per ordinary share outstanding. It is calculated using adjusted EBITA (as described above) and removes the impact of foreign exchange effects, amortisation, restructuring expenses, one-off non-cash expenses related to the refinancing of the legacy debt, and other non-cash financial income and expenses that are not directly related to operational performance.
Operating cash flow and free cash flowAlternative measures for cash flow are presented to reflect net cash inflow from operating activities before certain items. Free cash flow is considered relevant to reflect the cash performance of business operations after meeting the usual obligations of financing and tax. It is therefore measured before all other remaining cash flows, being those related to acquisitions and disposals, other equity-related and debt-related funding movements, and foreign exchange impacts on financing and investing activities.
Working capitalWorking capital and intensity provides a measure how efficient the Company is in managing operating cash conversion cycles. Working capital is the sum of manageable working capital, composed of inventories, trade receivables and trade payables and other receivables and payables. Working capital intensity is measured as a percentage of last three months annualised revenue.
Net debtWe present an alternative measure to bring together the various funding sources that are included in the Consolidated Balance Sheet and the accompanying notes. Net debt is a measure defined in the Group’s principal financing arrangements and reflects the net indebtedness of the Group and includes all cash, cash equivalents and marketable securities; and any debt or debt-like items.
A N N U A L R E P O R T 2 0 1 8R H I M A G N E S I TA
2 0 3
A N N U A L R E P O R T 2 0 1 8R H I M A G N E S I TA
2 0 3

ShareholderinformationRHI Magnesita N.V. is a public company with limited liability under Dutch law and was incorporated on 20 June 2017. It has its corporate seat in Arnhem, the Netherlands, its administrative seat in Vienna, Austria and its registered office at Kranichberggasse 6, 1120 Vienna, Austria.
The telephone number of the Issuer is +43 50 2136200.
The shares of RHI Magnesita N.V. are listed on the Premium Segment of the Official List on the Main Market of the London Stock Exchange.
Ticker symbol: RHIM ISIN Code: NL0012650360
Investor informationThe Company’s website www.rhimagnesita.com provides information for shareholders and should be the first port of call for general queries. The investors section contains details on the current and historical share price, Annual and Interim Reports, analyst presentations, shareholder meetings as well as a ‘Shareholders FAQ’ section.
You can also subscribe to an email alert service to automatically receive an email when significant announcements are made.
Shareholding informationPlease contact our Registrar, Computershare, for all administrative enquiries about your shareholding, such as the loss of a share certificate, dividend payments, or a change of address:
Computershare Investor Services PLC The Pavilions, Bridgwater Road Bristol BS99 6ZZ United Kingdom
Website: https://www-uk.computershare.com T: +44 (0) 370 707 1402
Financial calendarQ1 Trading Update May 2019
Annual General Meeting 6 June 2019
Half Year Results August 2019
Q3 Trading Update November 2019
DividendThe Board of Directors has recommended a dividend of €1.50 per share, for the year ended 31 December 2018. Payment of this dividend is subject to approval at the 2019 Annual General Meeting.
Investor relations departmentSackville House 40 Piccadilly London W1J 0DR United Kingdom
T: +44 20 7292 6171 Email: [email protected]
Corporate brokersPeel Hunt LLP Moor House 120 London Wall London EC2Y 5ET United Kingdom
T: +44 20 7418 8900 www.peelhunt.com
Barclays 10 The North Colonnade Canary Wharf London E14 4BB United Kingdom
T: +44 20 7623 2323 www.barclays.com
AuditorPricewaterhouseCoopers Accountants N.V. Thomas R. Malthusstraat 5 1066 JR Amsterdam P.O. Box 90357
T: +31 88 792 00 20 www.pwc.nl
Follow us
R H I M A G N E S I TAO T H E R I N F O R M AT I O N
2 0 4

Designed and produced by MerchantCantos www.merchantcantos.com

RHI MagnesitaHeadquartersKranichberggasse 61120 ViennaAustriawww.rhimagnesita.com
RH
I Magnesita - The driving force in refractories - A
nnual Report 20
18