t fx gold (pm) 1 132.80 -3.0% t market overview - … · final bids for barrick gold’s zaldivar...
TRANSCRIPT
Market Overview
Please see important disclosures at the end of this document (page 12)
as of: 20 July 2015
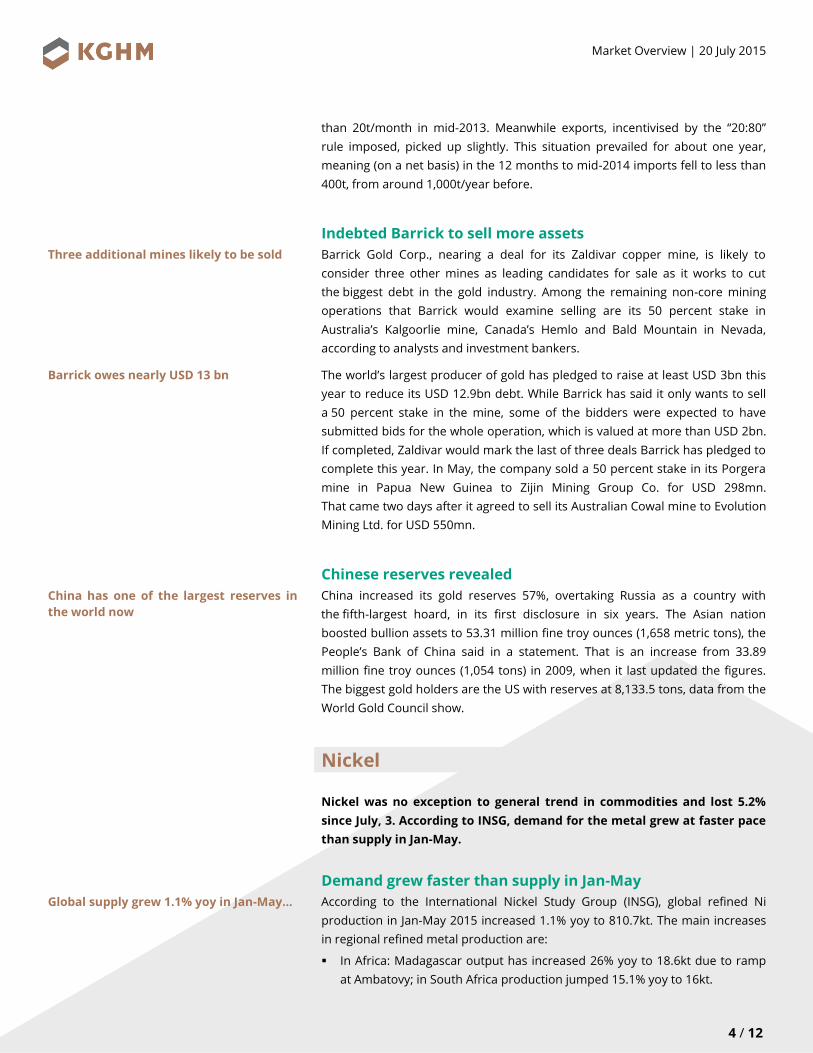
Copper: Commodities had hard time over the last fortnight with
broad BBG index losing 4.2%, reflecting turmoil over China and
Greece. Copper was no different and dropped 5.1%. Reuters reported
another decline in spot TC/RCs in China (page 2).
Gold: Gold declined more than 5.3% in the early hours of Monday,
July, 20th. The precious metal fell to its lowest level since 11th
February
2010, i.e. 1088.05 USD/troz, marking a new 5-year low. Data show that
gold imports have recovered in India, but still remain low. China
became the fifth-largest holder of the metal (page 3).
Nickel: Nickel was no exception to general trend in commodities and
lost 5.2% since July, 3rd. According to INSG, demand for the metal
grew at faster pace than supply in Jan-May (page 4).
China: China’s biggest state-owned banks have lent a combined RMB
1.3tn (USD 209bn) to the local margin finance agency in recent weeks
to stop stock market sell-off, raising concerns about sustainability
of the recent equities rebound (page 6).
Poland: National Bank of Poland (NBP) has published its quarterly
survey on condition of Polish companies in 2q15. Overall assessment
of current situation in enterprises sector is optimistic, although short
term expectations are mixed (page 6).
Key market prices
Close price 2w chng.
LME (USD/t)
q Copper 5 465.00 -5.1%
q Nickel 11 425.00 -5.2%
LBMA (USD/troz)
q Silver 15.01 -4.0%
q Gold (PM) 1 132.80 -3.0%
FX
q EUR/USD 1.0889 -1.9%
q EUR/PLN 4.1021 -2.1%
q USD/PLN 3.7676 -0.1%
p USD/CAD 1.2998 3.4%
p USD/CLP 643.07 0.9%
Stocks
q KGHM 101.90 -3.7%
Source: Bloomberg, KGHM; (more on page 10)
Important macroeconomic data
Release For
GDP (yoy) 2Q 7.0%
Industrial prod. (yoy) Jun 6.8% p
BoC rate decision Jul 0.50% q
Industrial prod. (yoy) Jun 7.6% p
Copper exports ($) Jun 3 095 p Latest prices declines in commodities were rather broad
(2w % change in prices; BBG Commodity Index constituents) Source: Bloomberg, KGHM; (more on page 8)
Market Risk Unit
Grzegorz Laskowski
Łukasz Bielak
Marek Krochta
Wojciech Demski
Lech Chłopecki
in cooperation with
David Stypula
Source: Bloomberg, KGHM
-12,0
-10,0
-8,0
-6,0
-4,0
-2,0
0,0
2,0
4,0
WT
I C
rud
e o
il
UL
SD
oil
KC
HR
W W
he
at
Bre
nt
Cru
de
oil
Wh
ea
t
RB
OB
Ga
solin
e
So
yb
ea
n o
il
Co
pp
er
Silve
r
Le
an
Ho
gs
Nic
ke
l
Liv
e C
att
le
Co
tto
n
Go
ld
Su
ga
r
So
yb
ea
n
Co
rn
Alu
min
um
Co
ffe
e
So
yb
ea
n m
ea
l
Na
tura
l G
as
Zin
c
Energy Metals Other

Market Overview | 20 July 2015
2 / 12
Base and precious metals | Other commodities
Copper
Commodities had hard time over the last fortnight with broad BBG index
losing 4.2%, reflecting turmoil over China and Greece. Copper was no
different and dropped 5.1%. Reuters reported another decline in spot
TC/RCs in China.
Chinese smelters cut concentrate treatment charges
Large copper smelters in China have lowered their minimum treatment charges
for spot copper concentrate imports in the third quarter by 10% as global
supply falls, according to Reuters’ findings. Treatment and refining charges
(TC/RCs) fall when supply declines or demand rises as smelters compete for
material and may prompt Chinese factories to limit their refined copper
production because of low margins.
The smelters have agreed to set bottom charge for spot shipments at USD 90/t
and USc 9/lb in the third quarter, down from already-lowered USD 100/t and
USc 10/lb three months before, according to Reuters’ sources. The charges
offered by global traders for spot standard-grade concentrate to China had
fallen below USD 90/t and USc 9/lb this month, which compares with about
USD 120/t and USc 12/lb in February. The latest quotations are well below the
2015 term benchmark of USD 107/t and USc 10.7/lb for standard-quality
concentrate. This year’s developments of TC/RCs reflect lower-than-expected
global supply of clean, standard-grade concentrates as some mines cut output
and global traders bought more standard-grade for mixing with low grades.
Demand for spot concentrate imports by China may rise in the third quarter as
four large smelters had completed maintenance in May and June. The agreed
minimum level is also below the USD 94/t and USc 9.4/lb TC/RC for a small
shipment of standard-grade concentrate sold to China in late June.
Other important information on copper market:
Cupric Canyon Capital, a private equity firm backed by a unit of Barclays, will
spend USD 200mn to bring its copper-silver mine in Botswana
to production. Construction of the mine, which will be built by Cupric's
Botswana unit Khoemacau, is set to start in 2016 with the first output
expected to be shipped to the markets in 2018. Cupric’s Africa CEO
estimates the mine would produce 50kt of copper and 1.8mn oz of silver
annually.
BHP Billiton Ltd., Teck Resources Ltd., HudBay Minerals Inc. and China
Molybdenum Co. Ltd. are said to be among the companies that submitted
final bids for Barrick Gold’s Zaldivar copper mine in Chile. The final decision
is expected by the first week of August. The copper mine, valued at more
Spot TC/RCs dropped 10% qoq squeezing
smelters’ margins
TC/RCs stand at USD 90/t and USc 9/lb,
well below 2015 term benchmark
Demand for concentrate may rise as four
large smelters finished maintenance

Market Overview | 20 July 2015
3 / 12
than USD 2bn, had proven and probable copper reserves as of 2014 end at
5.6bn pounds.
Chilean state copper commission Cochilco lowered its forecasts of country’s
annual copper production in 2015 to 5.88mn tonnes from 5.94mn tonnes
estimated in April.
Indonesian Gresik copper smelter, located in eastern Java has been shut for
at least ten days because of technical reasons – problems with the cooling
water system. The plant has capacity of more than 300k tonnes per year.
Teck has not restarted production of copper cathode at its Quebrada Blanca
mine in northern Chile, after halting it late last month after an unexpected
ground movement. The mining, however, has continued at the high-altitude,
open pit operation. The mine produced 48kt of copper last year and was
forecast to produce 45-50kt this year.
According to Barclays, total global commodity assets under management
fell to USD 266bn at the end of May from USD 268bn in April. Inflows into
commodity investments in May were still positive overall but totalled less
than USD 0.5bn. Inflows into ETPs (exchange traded products), the strongest
segment of the market in early 2015, have now been negative for three
consecutive months with an outflow of USD 0.6bn in May.
Gold
Gold declined more than 5.3% in the early hours of Monday, July, 20th
. The
precious metal fell to its lowest level since 11th February 2010, i.e. 1088,05
USD/troz, marking a new 5-year low. Data show that gold imports have
recovered in India, but still remain low. China became the fifth-largest
holder of the metal.
Indian imports stabilize after a sharp decline
Indian gold imports have recovered from the bashing they took from
government intervention in 2013/2014 but remain lower than in previous years,
and the government has announced some new schemes to reduce them
further.
India has for generations played a crucial role in the world gold market as
the main physical market. In recent years it has relinquished that top spot
to China, partly because of the astonishing growth in that country’s gold
demand, but also because from early-2013 the Indian government made
a number of serious interventions to curb imports: an increase in the import
duty to 10% from 1% and restrictions on who and how much could bring into
the country (through the “20:80” rule which required one-fourth of gold
imported to be made available for export). This had a dramatic impact on
India’s imports of gold.
Metal imports fell from an average of around 80t/month in 2011/2012 to less
New government restrictions on imports
Weak 2013 and 2014 for import
Market Overview | 20 July 2015
4 / 12
than 20t/month in mid-2013. Meanwhile exports, incentivised by the “20:80”
rule imposed, picked up slightly. This situation prevailed for about one year,
meaning (on a net basis) in the 12 months to mid-2014 imports fell to less than
400t, from around 1,000t/year before.
Indebted Barrick to sell more assets
Barrick Gold Corp., nearing a deal for its Zaldivar copper mine, is likely to
consider three other mines as leading candidates for sale as it works to cut
the biggest debt in the gold industry. Among the remaining non-core mining
operations that Barrick would examine selling are its 50 percent stake in
Australia’s Kalgoorlie mine, Canada’s Hemlo and Bald Mountain in Nevada,
according to analysts and investment bankers.
The world’s largest producer of gold has pledged to raise at least USD 3bn this
year to reduce its USD 12.9bn debt. While Barrick has said it only wants to sell
a 50 percent stake in the mine, some of the bidders were expected to have
submitted bids for the whole operation, which is valued at more than USD 2bn.
If completed, Zaldivar would mark the last of three deals Barrick has pledged to
complete this year. In May, the company sold a 50 percent stake in its Porgera
mine in Papua New Guinea to Zijin Mining Group Co. for USD 298mn.
That came two days after it agreed to sell its Australian Cowal mine to Evolution
Mining Ltd. for USD 550mn.
Chinese reserves revealed
China increased its gold reserves 57%, overtaking Russia as a country with
the fifth-largest hoard, in its first disclosure in six years. The Asian nation
boosted bullion assets to 53.31 million fine troy ounces (1,658 metric tons), the
People’s Bank of China said in a statement. That is an increase from 33.89
million fine troy ounces (1,054 tons) in 2009, when it last updated the figures.
The biggest gold holders are the US with reserves at 8,133.5 tons, data from the
World Gold Council show.
Nickel
Nickel was no exception to general trend in commodities and lost 5.2%
since July, 3. According to INSG, demand for the metal grew at faster pace
than supply in Jan-May.
Demand grew faster than supply in Jan-May
According to the International Nickel Study Group (INSG), global refined Ni
production in Jan-May 2015 increased 1.1% yoy to 810.7kt. The main increases
in regional refined metal production are:
In Africa: Madagascar output has increased 26% yoy to 18.6kt due to ramp
at Ambatovy; in South Africa production jumped 15.1% yoy to 16kt.
Three additional mines likely to be sold
Barrick owes nearly USD 13 bn
China has one of the largest reserves in
the world now
Global supply grew 1.1% yoy in Jan-May…
Market Overview | 20 July 2015
5 / 12
In Americas, output has increased 5.3% yoy to 125.4kt, with higher
production reported from Canada, Columbia, Cuba, Guatemala and
Venezuela, offset by lower output in Brazil.
The main decreases in regional refined Ni production are:
After rising for many years, output in Asia has contracted 1.4% yoy to 376kt
due to cutbacks in China, with production down 8.6% yoy. This lower output
has been partially offset by increased production in Japan, India, S. Korea
and Myanmar.
Output in Europe has declined 3.4% yoy largely due to declining production
from Russia (-5.4% yoy), Greece (-16.7% yoy) and France (-18.1% yoy)
partially offset by increase in Finland (31.2% yoy).
Output in Oceania is estimated to have declined 3.2% yoy to 79.5kt due to
declining production in Australia (-11.0% yoy), partially offset by increased
output in New Caledonia (13.4% yoy).
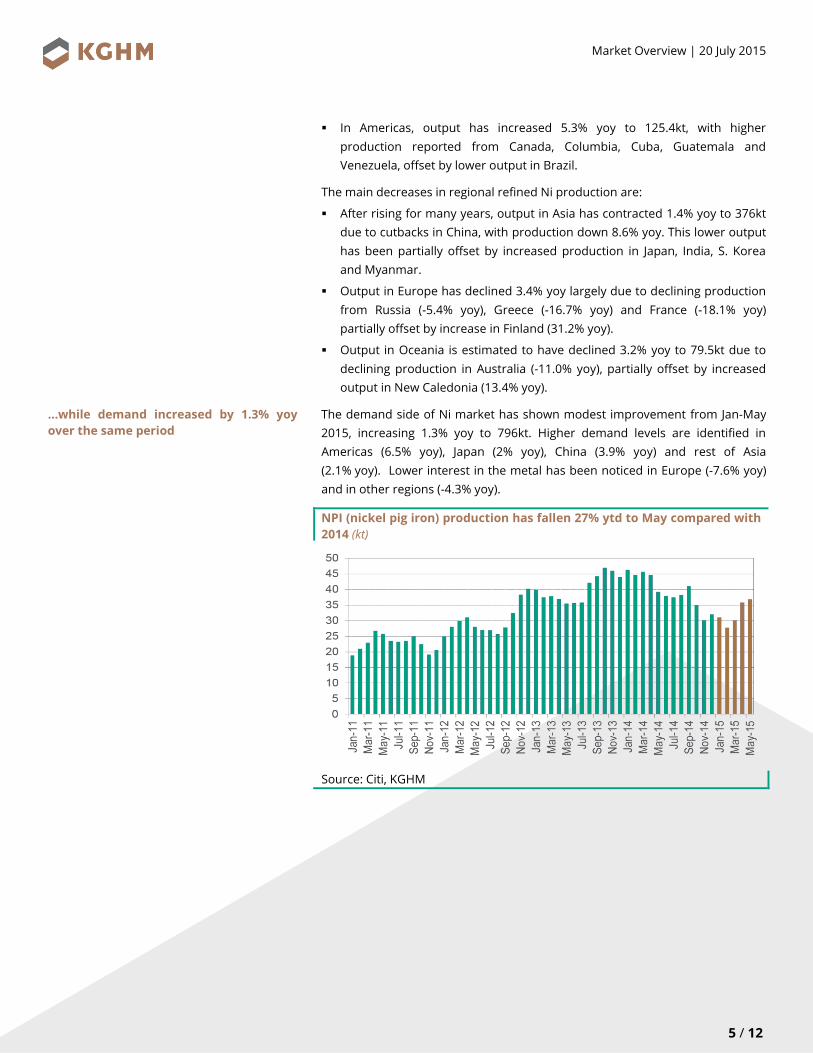
The demand side of Ni market has shown modest improvement from Jan-May
2015, increasing 1.3% yoy to 796kt. Higher demand levels are identified in
Americas (6.5% yoy), Japan (2% yoy), China (3.9% yoy) and rest of Asia
(2.1% yoy). Lower interest in the metal has been noticed in Europe (-7.6% yoy)
and in other regions (-4.3% yoy).
NPI (nickel pig iron) production has fallen 27% ytd to May compared with
2014 (kt)
Source: Citi, KGHM
…while demand increased by 1.3% yoy
over the same period
Market Overview | 20 July 2015
6 / 12
Global economies | Foreign exchange markets
China: state banks rescue equities
China’s biggest state-owned banks have lent a combined RMB 1.3tn
(USD 209bn) to the local margin finance agency in recent weeks to stop
stock market sell-off, raising concerns about sustainability of the recent
equities rebound.
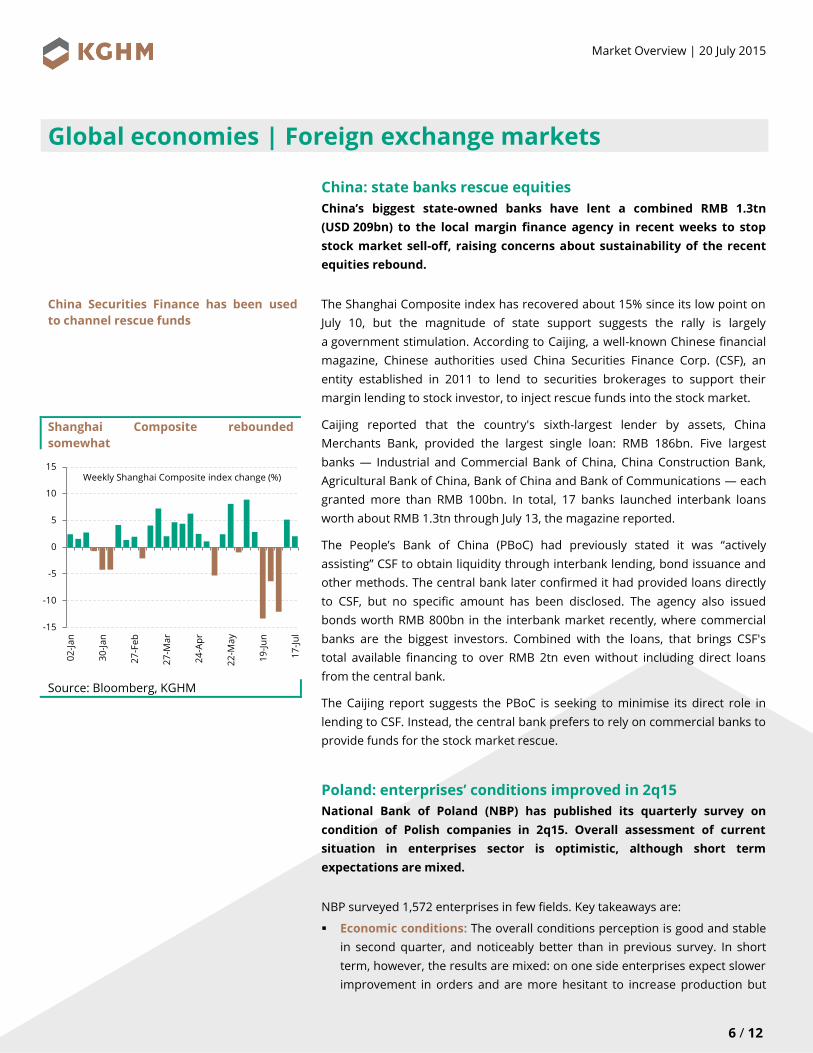
The Shanghai Composite index has recovered about 15% since its low point on
July 10, but the magnitude of state support suggests the rally is largely
a government stimulation. According to Caijing, a well-known Chinese financial
magazine, Chinese authorities used China Securities Finance Corp. (CSF), an
entity established in 2011 to lend to securities brokerages to support their
margin lending to stock investor, to inject rescue funds into the stock market.
Caijing reported that the country's sixth-largest lender by assets, China
Merchants Bank, provided the largest single loan: RMB 186bn. Five largest
banks — Industrial and Commercial Bank of China, China Construction Bank,
Agricultural Bank of China, Bank of China and Bank of Communications — each
granted more than RMB 100bn. In total, 17 banks launched interbank loans
worth about RMB 1.3tn through July 13, the magazine reported.
The People’s Bank of China (PBoC) had previously stated it was “actively
assisting” CSF to obtain liquidity through interbank lending, bond issuance and
other methods. The central bank later confirmed it had provided loans directly
to CSF, but no specific amount has been disclosed. The agency also issued
bonds worth RMB 800bn in the interbank market recently, where commercial
banks are the biggest investors. Combined with the loans, that brings CSF's
total available financing to over RMB 2tn even without including direct loans
from the central bank.
The Caijing report suggests the PBoC is seeking to minimise its direct role in
lending to CSF. Instead, the central bank prefers to rely on commercial banks to
provide funds for the stock market rescue.
Poland: enterprises’ conditions improved in 2q15
National Bank of Poland (NBP) has published its quarterly survey on
condition of Polish companies in 2q15. Overall assessment of current
situation in enterprises sector is optimistic, although short term
expectations are mixed.
NBP surveyed 1,572 enterprises in few fields. Key takeaways are:
Economic conditions: The overall conditions perception is good and stable
in second quarter, and noticeably better than in previous survey. In short
term, however, the results are mixed: on one side enterprises expect slower
improvement in orders and are more hesitant to increase production but
China Securities Finance has been used
to channel rescue funds
Shanghai Composite rebounded
somewhat
Source: Bloomberg, KGHM
-15
-10
-5
0
5
10
15
02
-Ja
n
30
-Ja
n
27
-Fe
b
27
-Ma
r
24
-Ap
r
22
-Ma
y
19
-Ju
n
17
-Ju
l
Weekly Shanghai Composite index change (%)

Market Overview | 20 July 2015
7 / 12
at the same time they continue to raise employment, and number of
investors increases.
Demand, orders, production: Enterprises see relatively few problems with
finding buyers for their goods or services. Forecasts point to slight decrease
in sales growth, despite improved exports outlook.
Employment and salaries: Trends from second quarter are expected to be
maintained. In spite of lower unemployment rate, no strong wage pressures
are visible.
Investments: Despite increased uncertainty and expected lower sales
growth, investment activity remains high and the trend is expected to
continue. One of key factors encouraging higher spending are accumulation
of cash flows (more cash available) and good profitability of exports
production.
Bank loans: Overall, enterprises are not interested in leverage increase and
are able to finance their operations with own assets. Increased demand for
financing is visible in construction sector, but due to its high default risk the
availability of credit is limited.
Liquidity: The level of liquidity is high, close to maximum levels seen in
2007-2008. Also, it did improve in construction sector.
Prices and margins: No breakthrough shall be expected in pricing. Less
companies decreased prices of their products and services than previously,
but the competition is high enough to sustain customers' price pressure.
Due to lower inputs' prices, deflation’s net effect is still positive.
Assessment of current economic conditions is still
improving…
…surely helped by lack of liquidity problems
Source: National Bank of Poland (NBP), KGHM Source: National Bank of Poland (NBP), KGHM
-30
-20
-10
0
10
20
30
20
30
40
50
60
70
80
2005 2006 2007 2008 2009 2010 2011 2012 2013 2014 2015
BOSE change (yoy, rhs)
Current economic conditions indicator (BOSE, lhs)
60
65
70
75
80
2005 2006 2007 2008 2009 2010 2011 2012 2013 2014 2015
Companies with no liquidity problems (% of surveyed companies)

Market Overview | 20 July 2015
8 / 12
Macroeconomic calendar
Important macroeconomic data releases
Weight Date Event For
China
09-Jul Consumer inflation CPI (yoy) Jun 1.4% p 1.2% 1.3%
09-Jul Producer inflation PPI (yoy) Jun -4.8% q -4.6% -4.6%
13-Jul Trade balance (USD bn) Jun 46.5 q 59.5 56.7
13-Jul Exports (yoy) Jun 2.8% p -2.5% 1.0%
14-Jul Foreign reserves (USD bn) Jun 3 690 q 3 730 3 703
15-Jul GDP (yoy) 2Q 7.0% 7.0% 6.8%
15-Jul GDP (sa, qoq)‡ 2Q 1.7% p 1.4% 1.6%
15-Jul Industrial production (yoy) Jun 6.8% p 6.1% 6.0%
15-Jul Fixed assets investments (ytd, yoy) Jun 11.4% 11.4% 11.2%
15-Jul Retail sales (yoy) Jun 10.6% p 10.1% 10.2%
Poland
08-Jul NBP base rate decision Jul 1.50% 1.50% 1.50%
14-Jul Trade balance (EUR mn)‡ May 946 p 119 22.0
14-Jul Exports (EUR mn)‡ May 14 131 q 14 503 13 968
14-Jul Current account balance (EUR mn)‡ May 1 184 p 1 129 349
14-Jul M3 money supply (yoy)‡ Jun 8.3% p 7.6% 7.8%
15-Jul Consumer inflation CPI (yoy) Jun -0.8% p -0.9% -0.8%
15-Jul Budget balance (ytd) Jun 56.7% p 42.6% --
16-Jul Core CPI (excluding food and energy, yoy) Jun 0.2% q 0.4% 0.3%
16-Jul Average gross salary (yoy) Jun 2.5% q 3.2% 4.1%
16-Jul Employment (yoy) Jun 0.9% q 1.1% 1.1%
17-Jul Sold industrial production (yoy) Jun 7.6% p 2.8% 7.0%
17-Jul Retail sales (yoy) Jun 3.8% p 1.8% 3.6%
17-Jul Producer inflation PPI (yoy)‡ Jun -1.6% p -2.1% -1.9%
US
06-Jul Composite PMI - final data Jun 54.6 54.6 --
06-Jul PMI services - final data Jun 54.8 54.8 54.9
14-Jul Retail sales (excluding autos, mom)‡ Jun -0.1% q 0.8% 0.5%
15-Jul Industrial production (mom) Jun 0.3% p -0.2% 0.2%
15-Jul Capacity utilization‡ Jun 78.4% p 78.2% 78.1%
16-Jul Philadelphia Fed business outlook Jul 5.7 q 15.2 12.0
17-Jul Consumer inflation CPI (mom) Jun 0.3% q 0.4% 0.3%
17-Jul Consumer inflation CPI (yoy) Jun 0.1% p 0.0% 0.1%
17-Jul University of Michigan confidence index - preliminary data Jul 93.3 q 96.1 96.0
Eurozone
14-Jul Industrial production (sa, mom)‡ May -0.4% q 0.0% 0.2%
14-Jul Industrial production (wda, yoy)‡ May 1.6% p 0.9% 2.0%
14-Jul ZEW survey expectations Jul 42.7 q 53.7 --
16-Jul Consumer inflation CPI (yoy) - final data Jun 0.2% 0.2% 0.2%
16-Jul Core CPI (yoy) - final data Jun 0.8% 0.8% 0.8%
16-Jul Trade balance (EUR mn) May 18.8 q 24.9 21.8
16-Jul ECB main refinancing rate Jul 0.05% 0.05% 0.05%
16-Jul ECB deposit facility rate Jul -0.2% -0.2% -0.2%
Consensus ²Reading ¹ Previous

Market Overview | 20 July 2015
9 / 12
Weight Date Event For
Germany
06-Jul Factory orders (wda, yoy)‡ May 4.7% p 1.3% 3.8%
07-Jul Industrial production (wda, yoy)‡ May 2.1% p 1.1% 2.6%
14-Jul Harmonized consumer inflation HICP (yoy) - final data Jun 0.1% 0.1% 0.1%
14-Jul Consumer inflation CPI (yoy) - final data Jun 0.3% 0.3% 0.3%
France
10-Jul Industrial production (yoy)‡ May 2.8% p 0.2% 2.4%
15-Jul Harmonized consumer inflation HICP (yoy) Jun 0.3% 0.3% 0.4%
15-Jul Consumer inflation CPI (yoy) Jun 0.3% 0.3% 0.3%
Italy
10-Jul Industrial production (wda, yoy) May 3.0% p 0.1% 1.2%
14-Jul Harmonized consumer inflation HICP (yoy) - final data Jun 0.2% 0.2% 0.2%
UK
07-Jul Industrial production (yoy) May 2.1% p 1.2% 1.6%
09-Jul BoE base rate decision Jul 0.50% 0.50% 0.50%
09-Jul BoE asset purchase target (GBP bn) Jul 375 375 375
14-Jul Consumer inflation CPI (yoy) Jun 0.0% q 0.1% 0.0%
15-Jul Unemployment rate (ILO, 3-months) May 5.6% p 5.5% 5.5%
Japan
13-Jul Industrial production (yoy) - final data May -3.9% p -4.0% --
Chile
06-Jul Economic activity (yoy) May 0.8% q 1.7% 1.5%
07-Jul Copper exports (USD mn) Jun 3 095 p 2 853 --
07-Jul Nominal wages (yoy) May 6.2% q 6.4% --
08-Jul Consumer inflation CPI (yoy) Jun 4.4% p 4.0% 4.2%
14-Jul BCCh overnight rate target Jul 3.00% 3.00% 3.00%
Canada
10-Jul Net change in employment (ths) Jun - 6.4 q 58.9 - 10.0
15-Jul BoC base rate decision Jul 0.50% q 0.75% 0.50%
17-Jul Consumer inflation CPI (yoy) Jun 1.0% p 0.9% 1.0%
Consensus ²Reading ¹ Previous
1
Reading difference to previous release: p = higher than previous; q = lower than previous; = equal to previous. 2
Reading difference to consensus: = higher than consensus; = lower than consensus; = equal to consensus.
mom = month-on-month; yoy = year-on-year; qoq = quarter on quarter; ytd year-to-date; sa = seasonally adjusted; wda = working
days adjusted; ‡ = previous data after revision.
Source: Bloomberg, KGHM

Market Overview | 20 July 2015
10 / 12
Key market data
Key base & precious metal prices, exchange rates and other important market factors
(as of: 17-Jul-15)
Price Average Min Max
LME (USD/t)
Copper 5 465.00 q -5.1% q -4.5% q -14.1% q -22.3% 5 895.36 5 375.00 6 448.00
Molybdenum 12 800.00 q -4.1% q -6.9% q -39.0% q -55.9% 17 247.45 9 250.00 21 500.00
Nickel 11 425.00 q -5.2% q -2.2% q -23.5% q -40.1% 13 477.15 10 900.00 15 455.00
Aluminum 1 663.50 q -1.3% p 1.0% q -9.2% q -15.5% 1 771.04 1 620.00 1 919.00
Tin 15 675.00 p 10.6% p 12.1% q -19.6% q -29.0% 16 769.96 13 980.00 19 750.00
Zinc 2 053.00 p 2.0% p 3.0% q -5.3% q -10.3% 2 123.10 1 955.00 2 405.00
Lead 1 824.50 p 3.9% p 4.0% q -1.5% q -15.6% 1 864.83 1 696.00 2 140.00
LBMA (USD/troz)
Silver 15.01 q -4.0% q -4.4% q -6.0% q -27.8% 16.44 14.93 18.23
Gold ¹ 1 132.80 q -3.0% q -3.3% q -5.5% q -13.0% 1 201.00 1 132.80 1 295.75
LPPM (USD/troz)
Platinum ¹ 998.00 q -7.8% q -7.4% q -17.5% q -33.3% 1 147.67 998.00 1 285.00
Palladium ¹ 621.00 q -9.3% q -8.3% q -22.2% q -29.9% 761.75 621.00 831.00
FX ³
EUR/USD 1.0889 q -1.9% q -2.7% q -10.3% q -19.5% 1.1145 1.0552 1.2043
EUR/PLN 4.1021 q -2.1% q -2.2% q -3.8% q -0.9% 4.1441 3.9822 4.3335
USD/PLN 3.7676 q -0.1% p 0.1% p 7.4% p 23.2% 3.7214 3.5550 3.9260
USD/CAD 1.2998 p 3.4% p 4.2% p 12.0% p 20.9% 1.2389 1.1728 1.2998
USD/CNY 6.2095 p 0.1% p 0.1% p 0.1% p 0.1% 6.2194 6.1883 6.2747
USD/CLP 643.07 p 0.9% p 1.3% p 5.9% p 15.6% 623.07 597.10 652.40
Money market
3m LIBOR USD 0.292 p 0.03 p 0.03 p 0.14 p 0.25 0.271 0.251 0.292
3m EURIBOR -0.019 p 0.27 p 0.36 q -1.24 q -1.09 0.016 -0.019 0.076
3m WIBOR 1.720 0.00 0.00 q -0.17 q -0.36 1.765 1.650 2.060
5y USD interest rate swap 1.792 p 0.01 p 0.00 p 0.01 p 0.03 1.646 1.313 1.909
5y EUR interest rate swap 0.447 q -0.10 q -0.11 p 0.24 q -0.27 0.353 0.176 0.590
5y PLN interest rate swap 2.180 q -0.11 q -0.14 p 0.12 q -0.24 2.051 1.563 2.643
Fuel
WTI Cushing 50.89 q -10.6% q -14.4% q -4.5% q -50.7% 53.21 43.46 61.43
Brent 56.34 q -5.4% q -8.2% p 1.0% q -47.3% 58.00 45.25 66.37
Diesel NY (ULSD) 165.54 q -9.5% q -11.8% q -9.3% q -42.0% 185.28 161.84 233.64
Others
VIX 11.95 q -0.29 q -0.34 q -0.38 q -0.18 15.17 11.95 22.39
BBG Commodity Index 97.57 q -4.2% q -5.0% q -6.5% q -24.9% 101.34 96.96 105.49
S&P500 2 126.64 p 2.4% p 3.1% p 3.3% p 8.6% 2 083.43 1 992.67 2 130.82
DAX 11 673.42 p 5.6% p 6.7% p 19.0% p 19.7% 11 272.40 9 469.66 12 374.73
Shanghai Composite 3 957.35 p 7.3% q -7.5% p 22.3% p 92.5% 3 924.85 3 075.91 5 166.35
WIG 20 2 285.03 p 0.3% q -1.4% q -1.3% q -4.9% 2 379.38 2 216.39 2 549.40
KGHM 101.90 q -3.7% q -4.4% q -6.4% q -20.8% 115.09 99.04 131.00
Price change º From year beginning ²
2W QTD YTD 1Y
º change over: 2W = two weeks; QTD = quarter-to-day; YTD = year-to-date; 1Y = one year.
1 based on daily closing prices.
2 latest
quoted price. 3 central banks’ fixing rates (Bank of China HK for USD/CNY).
4.
Source: Bloomberg, KGHM

Market Overview | 20 July 2015
11 / 12
Copper: official exchange stocks (thousand tonnes) Copper: official LME stocks (thousand tonnes)
0
100
200
300
400
500
600
700
800
900
1 000
2009 2010 2011 2012 2013 2014 2015
SHFE (109.0)
COMEX (8.4)
LME (340.3)
0
50
100
150
200
250
300
350
400
450
2009 2010 2011 2012 2013 2014 2015
Cancelled warrants (24.9)Europe (96.5)America (72.7)Asia (171.1)
Note: Latest values in brackets. Source: Bloomberg, KGHM Note: Latest values in brackets. Source: Bloomberg, KGHM
Copper: price in USD (lhs) and PLN (rhs) per tonne Silver: price (lhs) and gold ratio (rhs)
16 000
17 000
18 000
19 000
20 000
21 000
22 000
23 000
24 000
5 000
5 500
6 000
6 500
7 000
7 500
8 000
Jan-14 May-14 Sep-14 Jan-15 May-15
Price (USD/t) Annual av. (USD/t)
Price (PLN/t) Annual av. (PLN/t)
50
55
60
65
70
75
80
15
20
25
30
35
40
Jan-12 Jul-12 Jan-13 Jul-13 Jan-14 Jul-14 Jan-15 Jul-15
Silver (LBMA) Gold-to-silver price ratio
Source: Bloomberg, KGHM Source: Bloomberg, KGHM
USD: dollar index (lhs) and ECB-based EUR/USD (rhs) PLN: NBP-fixing based rate vs. USD (lhs) and EUR (rhs)
65
70
75
80
85
90
95
100
1051,00
1,05
1,10
1,15
1,20
1,25
1,30
1,35
1,40
1,45
1,50
Jan-12 Jul-12 Jan-13 Jul-13 Jan-14 Jul-14 Jan-15 Jul-15
EUR/USD Dollar index (DXY, rev. scale)
3,80
4,00
4,20
4,40
4,60
4,80
5,00
5,20
2,80
3,00
3,20
3,40
3,60
3,80
4,00
4,20
Jan-12 Jul-12 Jan-13 Jul-13 Jan-14 Jul-14 Jan-15 Jul-15
USD/PLN EUR/PLN
Source: Bloomberg, KGHM Source: Bloomberg, KGHM

Market Overview | 20 July 2015
12 / 12
Legal note
This document has been prepared based on the below listed reports, among others, published in the following period:
6 July – 19 July 2015.
“Commodities Comment” Macquarie Research Metals and Mining, “Commodities Daily” Standard Bank, “Commodities
Weekly” Barclays Capital Research, “Metals Market Update” Morgan Stanley, “Daily Copper Wrap” Mitsui, “Base and
Precious Metals Daily” JPMorgan, „Codziennik” BZ WBK, „Tygodnik Ekonomiczny” BZ WBK, „Raport dzienny” mBank,
„Biuletyn Dzienny” Bank PEKAO S.A., „Dragonomics: China Research” Gavekal
Moreover, additional information published here was acquired in direct conversations with market dealers, from financial
institution reports and from the following websites: lme.co.uk, lbma.org.uk, economy.com/dismal, thebulliondesk.com,
lbma.org.uk/stats, crumonitors.com, metalbulletin.com, nbpportal.pl, nbp.pl, as well as data providing systems: Thomson
Reuters and Bloomberg.
Official metals prices are available on following websites:
base metals: www.lme.com/dataprices_products.asp (charge-free logging)
silver and gold: www.lbma.org.uk/pricing-and-statistics
platinum and palladium: www.lppm.com/statistics.aspx
DISCLAIMER
This document reflects the market view of the staff of KGHM Polska Miedz (Polish Copper)’s Market Risk Unit employees on the
economy, commodity as well as financial markets. Although, according to the our best of our knowledge, all the facts presented
in this publication come from or are based on reliable sources, we do not guarantee their correctness. Moreover, they may be
incomplete or shortened. All the opinions and forecasts are backed by diligently-performed analyses valid as of the publishing
date and may be subject to change. KGHM Polska Miedz (Polish Copper) S.A. is not obligated to announce any subsequent
change of these opinions or forecasts. This document’s purpose is solely informative and must not be interpreted as an offer or
advice with regards to the purchase/sale of any mentioned financial instrument, nor it is part of such offer or advice.
Re-printing or using this publication or itsin whole or part requires prior written consent from KGHM. To acquire that such
consent please contact the Communications and CSR Department of Communication (Departament Komunikacji I CSR) of and
CSR KGHM Polska Miedz SA.
In case of questions or comments please contact us:
KGHM Polska Miedz (Polish Copper) S.A.
Departament Zarządzania Ryzykiem Rynkowym i Kredytowym (Market and Credit Risk Management Department)
Wydzial Ryzyka Rynkowego (Market Risk Unit)
ul. M. Sklodowskiej-Curie 48
59-301 Lubin, Poland