t e co po ation plctrue corporation plc
TRANSCRIPT

T e Co po ation PlcTrue Corporation PlcSeptember 2010
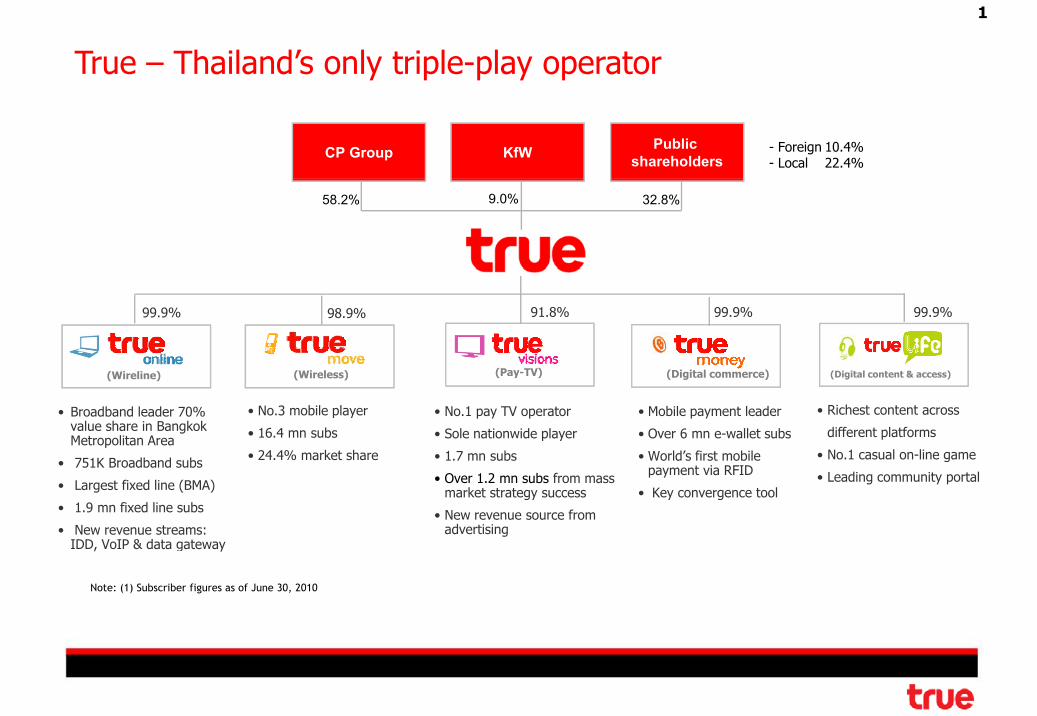
True – Thailand’s only triple-play operator
1
CP Group KfW Public shareholders
- Foreign 10.4%- Local 22.4%
58.2% 9.0% 32.8%
99.9% 98.9% 99.9%91.8% 99.9%
(Wireline)
• Broadband leader 70% value share in Bangkok Metropolitan Area
(Digital commerce)(Pay-TV) (Digital content & access)(Wireless)
• No.3 mobile player
• 16.4 mn subs
• No.1 pay TV operator
• Sole nationwide player
• Mobile payment leader
• Over 6 mn e-wallet subs
• Richest content across
different platforms
• 751K Broadband subs
• Largest fixed line (BMA)
• 1.9 mn fixed line subs
• New revenue streams:
• 24.4% market share • 1.7 mn subs
• Over 1.2 mn subs from mass market strategy success
• New revenue source from advertising
• World’s first mobile payment via RFID
• Key convergence tool
• No.1 casual on-line game
• Leading community portal
IDD, VoIP & data gateway
Note: (1) Subscriber figures as of June 30, 2010

Building around our integrated platform
2
Strengthen “Convergence Lifestyle”1
Increase mobile market share2 Increase mobile market share– Become 3G leader using exclusive “convergence” platform
2
Develop mass market penetration of Pay-TV and Broadband3
Maintain financial discipline and reduce balance sheet leveraging4

True Convergence Index continues to rise3
True Convergence Index*
1,905 2,137
2,349 2,438 ‘000 households
g
1,019 1,139 1,279 1,470 1,684 1,761 1,565 1,693
,
* No. of households using two or more True services; third-party survey normally conducted twice a year
151 151 241 190 182 179 395 403 385 477 483 498
Feb'08 Jul'08 Feb'09 Jul'09 Feb'10 Jul'10
4 products 3 products 2 products
395428 453 469 467 442
‘000 subscribers
937 980 1,004 1,029 1,030 1,021
‘000 subscribers
Super hi-speed package* TrueVisions Satellite Bundling packages *
314 331 359 357 362 365
81 97 93 113 105 77 395
565 581 556 546 536 519
57 70 79 92 102 113 937 980 , ,
1Q09 2Q09 3Q09 4Q09 1Q10 2Q10
Super hi-speed -TrueMove Super hi-speed -TrueVisions
315 329 369 391 392 389
1Q09 2Q09 3Q09 4Q09 1Q10 2Q10
Upsold Non-upsold (Free view) Non-upsold (Free-to-air)* Remark : Excluding hi-speed internet plus 40 TV channels from TrueLife -Freeview * Remark : Including bundling package with TrueMove and Broadband

Numerous convergence benefits
4
Mobile
Subscriber growth for all businesses
Lower churn for mobile by bundling with
high churnBroadband and Pay TV’s lower-churn subs
Higher revenue per user
low churn
Increased share of bundled subs in key businesses
BroadbandPay TV
low churn Difficult for competitors to replicate
Broadband
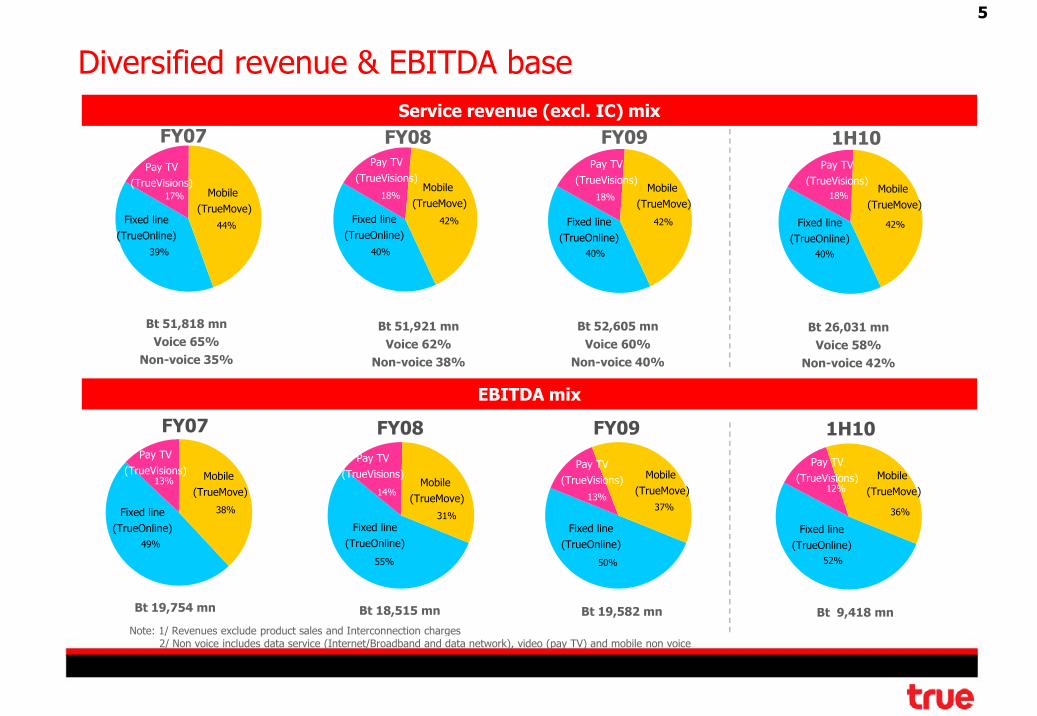
Diversified revenue & EBITDA base
5
Service revenue (excl. IC) mix
Pay TV( )
Pay TV(TrueVisions)
FY08FY07 FY09Pay TV
(TrueVisions)
1H10Pay TV
(TrueVisions)
40%
18%
42%
40%
18%
42%
40%
18%
42%
39%
17%
44%
Mobile (TrueMove)
(TrueVisions)
Fixed line(TrueOnline)
Mobile (TrueMove)
(TrueVisions)
Fixed line(TrueOnline)
Fixed line(TrueOnline)
Mobile (TrueMove)
(TrueVisions)
Fixed line(TrueOnline)
Mobile (TrueMove)
(TrueVisions)
Bt 51,818 mnVoice 65%
Non voice 35%
Bt 51,921 mnVoice 62%
N i 38%
Bt 52,605 mnVoice 60%
N i 40%
Bt 26,031 mnVoice 58%
i 2%Non-voice 35%
FY08FY07
EBITDA mix
Non-voice 38%
FY09
Non-voice 40%
1H10
Non-voice 42%
13%37%
14%
31%
Pay TV(TrueVisions)
13%
38%
Mobile (TrueMove)
Fixed line(TrueOnline)
Mobile (TrueMove)
Pay TV(TrueVisions)
Fixed line
Pay TV(TrueVisions) Mobile
(TrueMove)
Fixed line
12%
36%
Pay TV(TrueVisions) Mobile
(TrueMove)
Fixed line
50%55%
N t 1/ R l d d t l d I t ti h
49%
Bt 18,515 mnBt 19,754 mn
(TrueOnline)
Bt 19,582 mn
(TrueOnline)52%
Bt 9,418 mn
(TrueOnline)
Note: 1/ Revenues exclude product sales and Interconnection charges 2/ Non voice includes data service (Internet/Broadband and data network), video (pay TV) and mobile non voice

True is a strong and highly visible brand
6
Wall Street Journal Asia Survey 2006/07
Thailands’ top 10Thailands’ top 10In innovation
Thailand’s Most Innovative Company 2009
C.P. Seven Eleven(CP All) 3.96Convenience-store operator1
Siam Cement 3.82Construction conglomerate2
True Corp.Expanding in cable, broadband1
C.P. Seven Eleven (CP ALL)Adding convenience stores2
Overall, rankedC.P. Seven Eleven(CP All) 3.96Convenience-store operator1
Siam Cement 3.82Construction conglomerate2
True Corp.Expanding in cable, broadband1
C.P. Seven Eleven (CP ALL)Adding convenience stores2
In innovation
Gold Trusted Brand Awards 2004 - 2008
Charoen Pokphand 3.68Dominant agribusiness firm3
BumrungradHospital 3.63Medical-tourism pioneer4
Kasikornbank 3.615
Advanced Info ServiceCompetitive mobile player3
Total Access CommunicationA leading cellular firm4
Kasikornbank5
Charoen Pokphand 3.68Dominant agribusiness firm3
BumrungradHospital 3.63Medical-tourism pioneer4
Kasikornbank 3.615
Advanced Info ServiceCompetitive mobile player3
Total Access CommunicationA leading cellular firm4
Kasikornbank5s o 3 6Banking, financial-services firm5
Siam Commercial Bank 3.55Banking, financial-services firm6
Advanced Info Service 3.53Leading mobile-phone provider7
s oMarketing heavily to consumers5
Big CSupercenterRetailer known for low price6
Siam Commercial BankLong-standing commercial bank7
s o 3 6Banking, financial-services firm5
Siam Commercial Bank 3.55Banking, financial-services firm6
Advanced Info Service 3.53Leading mobile-phone provider7
s oMarketing heavily to consumers5
Big CSupercenterRetailer known for low price6
Siam Commercial BankLong-standing commercial bank7
PTT 3.52Former state oil company8
Land & House 3.46Property-development firm9
T C 3 32
Charoen PokphandA big name in agribusiness field8
BEC WorldOperates popular TV channel9
L d & H
PTT 3.52Former state oil company8
Land & House 3.46Property-development firm9
T C 3 32
Charoen PokphandA big name in agribusiness field8
BEC WorldOperates popular TV channel9
L d & HTrue Corp. 3.32Cell, cable-TV, broadband firm10 Land & House
Trusted home-building brand10True Corp. 3.32Cell, cable-TV, broadband firm10 Land & House
Trusted home-building brand10

7
Financial highlights – 1H10(Units in millions of Baht unless otherwise indicated) TrueOnline1/ TrueMove1/ TrueVisions1/ Consolidated
Total Revenue (excl IC) 13,676 12,899 4,726 27,315% growth Y-o-Y 2.9% 2.4% -0.9% 0.9%Service Revenue (excl IC) 13,365 11,837 4,674 26,031% growth Y-o-Y 2.3% 2.7% 0.7% 0.4%EBITDA 4,818 3,397 1,157 9,418% growth Y-o-Y -8.4% -1.2% -25.1% -7.3%Depreciation & amortization (2,953) (2,077) (502) (5,508) % growth Y-o-Y 4.7% 1.5% 3.0% 3.3%Interest expense (1 386) (1 659) (146) (3 095)Interest expense (1,386) (1,659) (146) (3,095) % growth Y-o-Y -14.5% -16.7% -8.8% -15.4%Tax, net (444) (124) (91) (688) Current tax (212) - (21) (233) growth Y-o-Y (94) - (268) (362) g ( ) ( ) ( ) Deferred income tax (232) (124) (70) (455) growth Y-o-Y 19 (269) 31 (219) NIOGO 2/ 73 (537) 492 45 growth Y-o-Y (39) 506 (187) 294 NIOGO excl. deferred tax 305 (414) 562 500 growth Y-o-Y (21) 238 (156) 75 Free Cash Flow (470) 1,101 411 1,084 growth Y-o-Y (2,492) 652 (287) (2,127) Capex 1 286 1 715 285 3 299
1/ Before eliminations of inter-company transactions 2/ NIOGO: Net income (loss) from ongoing operations
Capex 1,286 1,715 285 3,299 growth Y-o-Y 262 99 211 728

8
Group performance impacted by unfavorable political situation
50,538 51,818 51,921 52,605 Bt mn
Group service revenue excl. IC NIOGO
(3 766) (6 748) (843)
288 511 424 500
(2 760) 105 (518) ( ) 45
Bt mn
41,456
25,919 26,031
(3,766) (6,748) (843)(2,760)
(5 986)
(1,179)105 (518) (250) 45
2005 2006 2007 2008 2009 1H09 1H10
(5,986)
2005 2006 2007 2008 2009 1H09 1H10
NIOGO excl. deferred income tax NIOGO
19 754 8 19 582
35.6%33.2%
37.3% 34.9% 35.3% 37.5% 34.5%
Bt mnBt mn
EBITDA & EBITDA margin1/ Free cash flow
11,60413,167
10 36411,894
Bt mn
15,705 17,255
19,754 18,515 19,582
10,157 9,418
Bt mnBt mn 10,3649,444
5,7824,383
10,371 10,944
7,318 7,2835,289
2/
2005 2006 2007 2008 2009 1H09 1H10EBITDA EBITDA margin
5,289
2,570 3,299
2005 2006 2007 2008 2009 1H09 1H10
Cash flow from operation CapexNote: 1/ Based on revenue exclude IC p p
%FY06 %FY07 %FY08 %FY09 %1H10Service revenue +21.9% +2.5% +0.2% +1.3% +0.4%EBITDA +9.9% +14.5% -6.3% +5.8% -7.3%
Note: 1/ Based on revenue exclude IC2/ 2009 includes the reversal of over-accrued content-related cost (Bt207mn)

9
Net-debt-to-EBITDA stable; interest coverage improves YoYNet debt-to-EBITDA vs. Interest coverageLong-term* debt composition
11.711.1
83.176.5 78.8 74.9 73.1 72.3 76.7
86.694.1
84.978.0 75.6
67 5 68 8
Bt bn
4 8
times
83.1 76.5 78.8 74.9 73.1 65.4 62.7 54 2
0.0 6.9 14.0 32.4 32.831.7
29.3 28.926.0 24.6
11.110.6 10.6
9.0 11.4
67.5 68.8 4.8 4.5
3.5 3.7 3.1 3.2 3.2
3.3 2 7 2 2 6 2 762.7 54.2 49.6 42.1 38.1 36.1 32.5 32.8
1997 1998 1999 2000 2001 2002 2003 2004 2005 2006 2007 2008 20092Q10
2.7 2.5 2.5 2.6 2.5 2.7
2005 2006 2007 2008 2009 1H09 1H10N t d bt t EBITDA I t t
Note: 1/ figures include current portion of long-term debt but do not include financial lease and debt issuance costs2/ TrueVisions’ debt includes all L-T loans for TrueVisions acquisition
Note: figures do not include financial lease
TrueOnline TrueMove TrueVisionsNet debt to EBITDA Interest coverage
Bt 1.4 bn of debt repaid during Q2 (Bt2.7bn in 1H10)
Bt 3 9 bn of new debt incurred in Q2; mostly to fund business expansionBt 3.9 bn of new debt incurred in Q2; mostly to fund business expansion
1H10 net debt-to-EBITDA stable YoY while interest coverage ratio improved from lower interest expense and debt level

10
TrueVisions refinancing completed in 1H10, another key milestoneTrueVisions Group repayment schedule*
5.5
Previous repayment
1 11.5 1.6
1 0
1.8 1.9 1.9 1.9 1.9
1 0
New repaymentBt bn
1.1
0.20.5
1.0 1.0
2010 2011 2012 2013 2014 2015 2016 2017 2018
New facility: Bt 12 bn in Thai Baht loans from 4 major banks carrying interest rate of MLR-0.5%Refinanced existing loans of Bt 9 732 mn (US$ 186 12 mn + Bt 2 8 bn) at 7 68% interest rateRefinanced existing loans of Bt 9,732 mn (US$ 186.12 mn + Bt 2.8 bn) at 7.68% interest ratePart of remaining proceeds to support pay TV business opportunities
Credit profile improved with FX risk eliminated and more favorable termsLow interest rate -- currently 5 3% (MLR-0 5%)Low interest rate currently 5.3% (MLR 0.5%)8 years maturity with step up repayments, better matching cash flow, conditions relaxed
TrueMove refinancing in the pipeline
Remark: As of 2Q10, Bt 11.4 bn has been drawn down

11

12
Broadband, data & convergence support YoY revenue growthNIOGOService revenue
3,698 5,587 6,913 7,695 8,095
23,789 24,543 24,528 25,989 26,387 Bt mn
782 1,000 45 325 305 (452)
1,201
73
Bt mn
14,865 11,164
8 395 8 350 7 895
5,226 7,792
9,220 9,944 10,397
5,195 5,442
,
4,050 4,099
13,059 13,365 (1,145) (2,713)
(452)
(2 6)
(158) (101)112 73
8,395 8,350 7,895 3,814 3,824
2005 2006 2007 2008 2009 1H09 1H10
Traditional voice (fixed-line, payphone, PCT)Internet, Broadband and Business data services
(2,456)2005 2006 2007 2008 2009 1H09 1H10
NIOGO excl. deferred income tax NIOGO
EBITDA & EBITDA margin Free cash flow
,New revenue stream (IDD, TIG, and VoIP), convergence
44.9% 41.6% 38.8% 38.1% 36.4% 39.6% 35.2% 6,944 6,558
Bt mn
10,677 10,214 9,670 10,195 9,804
Bt mn
4,131
5,5176,558
5,392
3,046
3 153 3,6011 2865,259 4,818
2005 2006 2007 2008 2009 1H09 1H10EBITDA EBITDA margin
816
3,153 ,
1,8492,408 2,551 1,024
1,286
2005 2006 2007 2008 2009 1H09 1H10Cash flow from operation Capex
EBITDA EBITDA marginp p
%FY06 %FY07 %FY08 %FY09 %1H10Service revenue +3.2% -0.1% +6.0% +1.5% +2.3%EBITDA -4.3% -5.3% +5.4% -3.8% -8.4%

Broadband 1H10 net adds exceeds FY09 level
13
739 720 714 711 723 724 686
Bt/sub/mo
Broadband revenue & subscribers
691 751
‘000 subscribers
Subscribers & net adds
2,047
3,258 4,229
4,932 5,495
2,673 2,915 Bt mn
443 548 632 632 691 135
143 105
84 59 15
60
300 443
548 632
691 647
751
2005 2006 2007 2008 2009 1H09 1H10Broadband revenue Blended ARPU
165 300
443 135
2005 2006 2007 2008 2009 1H09 1H10Previous subs Net adds
91%
True’s Super hi-speed subs by speed2009 BMA market share by value
MaxNet/3BB7%
Other1%
CAT1%
91%
True
TOT21%
24%
59%
2%5% 2%
1H09Less than 3Mbps 3Mbps 4-5Mbps 8Mbps up
* Standard speed was adjusted to 3Mbps in Oct’09 , to 4Mbps in Feb’10, and
True70%
BMA
12%
5%
1H10
Standard speed was adjusted to 3Mbps in Oct 09 , to 4Mbps in Feb 10, and to 6Mbps in Aug’10
%FY06 %FY07 %FY08 %FY09 %1H10Broadband revenue +59.2% +29.8% +16.6% +11.4% +9.1%Broadband subscribers +47.4% +23.8% +15.4% +9.2% +16.1%

14
Comprehensive offers capture all market segmentsFeatures Target customersFeatures
30-50 Mbps download2-3 Mbps uploadFree Wi Fi router
Target customers
Very high-end customers Expats
PremiumFree Wi-Fi routerFree unlimited 4 Mbps Wi-Fi
6-16 Mbps download Casual to heavy Internet users
Mass market
6 16 Mbps download512 Kbps - 1 Mbps uploadFree Wi-Fi router
Casual to heavy Internet users
2 Mbps download256 Kbps uploadFree router
Light usersInternet newcomersDial-up users
NicheFree router Dial up users
Ultra hi speed internet launched in Q2 Thailand’s fastest serviceUltra hi-speed internet launched in Q2, Thailand s fastest service
Wi-Fi router promotion for mass market campaign resulted in record high net adds in Q2
Eco Pack launched in mid-May targeting light users/newcomers for the first time

High growth potential for Broadband especially in provinces
15
27.2
Thailand Broadband penetration forecast
98 0%
2009 Fixed-line Broadband penetration
10.6 13.4
17.0
21.5 98.0% 94.0%
81.0% 79.0%
0.1 0.6 1.0 2.2 2.9
3.8 4.9
6.4 0.5
3.0 4.9 41.0%
14.5% 11.1% 10.7%2006 2007 2008 2009 2010E 2011E 2012E 2013E
Subscribers Penetration rate (%)
Source: CompanySource: True Corp & Point Topic, March 2010

Create the next S-curve through new technologies
16
Broadband subscribers
>1mn
718k
• DOCSIS 3.0 • FTTx• WiMAX
>1mn
>800k• WiMAX• Triple Play• HD Content• NGN/NBN
Up to Up to Up to 3.7k
128 KbpsDOCSIS 3.0 NGN/NBNADSL, VDSL FTTx
p50 Mbps
p400 Mbps
p1 Gbps
2002 2003 2004 2007 2008 2009 2010 2011 and beyond

17

18
Revenue growth driven by strong post paid and non voiceService revenue & market share NIOGO
22,309 23,835 22,796 23,575 Bt mn
13.7% 15.3% 15.7% 14.4% 15.0% 14.8% 14.4%(777) (624) (651) (414)
(537)
Bt mn
18 077 18 868 17 868
1,477 2,131 2,490 2,679 3,134
1 445 1 688
1,267 2,101 2,477 2,661
2,573
1,170 1,435
19,530 ,
11,525 11,837
(2,725)
(3,433)(2,883)
(2,725)(3,100) (3,244)
(1,411)(1,044)
16,786 18,077 18,868 17,456 17,868
8,910 8,714
1,445 1,688
2005 2006 2007 2008 2009 1H09 1H10
(3,244)
2005 2006 2007 2008 2009 1H09 1H10
NIOGO excl. deferred income tax NIOGO
EBITDA & EBITDA margin Free cash flow
Voice Non-voice International Roaming and others
44.9% 41.6% 38.8% 38.1% 36.4% 39.6% 35.2%Bt mn
7,268Bt mn
% TMV service revenue market share
10,677 10,214 9,670 10,195 9,804
5,259 4 818
Bt mn
4,710 4,9044,111 3,880
2,762 2,064 2,815
5,262 5,0704,232
Net IC - - +164 (845) (32) (48) +124
, 4,818
2005 2006 2007 2008 2009 1H09 1H10
2,6371,615
1,715
2005 2006 2007 2008 2009 1H09 1H10
Cash flow from operation CapexEBITDA EBITDA margin
p p
%FY06 %FY07 %FY08 %FY09 %1H10Service revenue excl. IC +13.9% +6.8% -4.4% +3.4% +2.7%EBITDA -0.5% +49.2% -24.8% +27.0% -1.2%

19
Overall subscriber share relatively stable
16 356
Subscribers - TrueMove Share of subscribers – Big Three
15.1% 19.4% 23.2% 24.3% 24.6% 24.5% 24.4%
55 5% 50.1% 46.4% 44.9% 44.8%44 7% 44 8%
7 03111,362 13,786 14,575 14,085 15,123
450547
718 971 1,226 1,162 1,233
4,459 7,578
12,080 14,757 15,801 15,247 16,356
‘000 subscribers
23 2% 24 3% 24 6% 24 5% 24 4%
29.4% 30.5% 30.4% 30.8% 30.6% 30.8% 30.8%
55.5% 44.7% 44.8%
4,009 7,031 450
2005 2006 2007 2008 2009 1H09 1H10
Prepaid Postpaid
Net add +1,078 +3,119 +4,502 +2,677 +1,044 +490 +555(‘000 sub)
% TMV subscriber market share
15.1% 19.4% 23.2% 24.3% 24.6% 24.5% 24.4%
2005 2006 2007 2008 2009 1H09 1H10
TrueMove DTAC AIS
p p
ARPU - TrueMove Subscriber mix - TrueMove
8%7%
911 772
Bt/sub/mo
92%
8%
Prepaid
Postpaid 93%
393 292
191 130 116 116 108 321
676
510 430 425 415
1H09 1H10
08321 250
158 105 90 92 83
2005 2006 2007 2008 2009 1H09 1H10
Blended Prepaid PostpaidBlended Prepaid Postpaid
%FY06 %FY07 %FY08 %FY09 %1H10Total Subscribers +70.0% +59.4% +22.2% +7.1% +7.3%Blended ARPU -25.7% -34.6% -32.2% -10.8% -6.8%

20
Postpaid revenue growth more than offset prepaid declines
5 3665,807 Bt mn
911 772 676 510 430 425 415
Bt/sub/moPostpaid subscribers Postpaid revenue & ARPU
11.5% 11.3% 14.1% 16.0% 19.1% 18.2% 18.8%
1,226 1 233
4,979 3 929 4,338 4 223 4,725
387
464 532 704
1,082
414 677
5,366 4,393
4,870 4,927 ,
2,721 3,059
971 9711,226
97 172
253
255 191 7
449 546
718
971
,1,162 1,233
‘000 subscribers
3,929 4,338 4,223 ,
2,307 2,382
2005 2006 2007 2008 2009 1H09 1H10
Voice Non-voice Postpaid ARPU% TMV subscriber market share
453 449 546 718
971 971
2005 2006 2007 2008 2009 1H09 1H10Previous sub Net adds
321 250 158 105 90 92 83
Bt/sub/moPrepaid subscribers Prepaid revenue & ARPU
15.6% 20.6% 24.2% 25.2% 25.2% 25.4% 25.7%
14,575 15 123
8 14 530
1,090 1,668 1,958
1,975 2,052
1 032
12,897
15,815 16,488 15,208 15,195
7,635 7,342
Bt mn
13,786 13,786 14,575 4,331
2,424 789 299 548
4 009
7,031
11,362 13,786 14,575
14,085 15,123
‘000 subscribers
11,807 14,148 14,530 13,232 13,143
6,602 6,332
1,032 1,011
2005 2006 2007 2008 2009 1H09 1H10% TMV subscriber market share
2,928 4,009 7,031
11,362 , ,
1,081 3,022 4,009
2005 2006 2007 2008 2009 1H09 1H10Previous sub Net adds Voice Non-voice Prepaid ARPU% TMV subscriber market sharePrevious sub Net adds
Postpaid %FY06 %FY07 %FY08 %FY09 %1H10Service revenue excl. IC -18.1% +10.9% +1.2% +17.9% +12.5%Subscribers +21.7% +31.3% +35.2% +26.3% +6.1%
Prepaid %FY06 %FY07 %FY08 %FY09 %1H10Service revenue excl. IC +22.6% +4.3% -7.8% -0.1% -3.8%Subscribers +75.4% +61.6% +21.3% +5.7% +7.4%

21
Non-voice services continue to drive growth
9.6% 10.4% 11.8% 13.3% 12.5% 14.3%
3,134
Non-voice revenue Non-voice revenue mix
1 1731,367 1,514
1,616 2,131
2,490 2,679
,
1,445 1,688
Bt mn
32.2%
%53.4%
28.2%
22 0%
752 787 805 949 466 476
206 336 360 569
208 371
1,173
771 841
2006 2007 2008 2009 1H09 1H10
14.4%
1H09
22.0%49.8%
1H10
2006 2007 2008 2009 1H09 1H10
Messaging (SMS/MMS) Mobile Internet Content & RBT Messaging (SMS/MMS) Mobile Internet Content & RBT
Growth driven by popularity of mobile internet and smartphones
% TMV subscriber market share
Growth driven by popularity of mobile internet and smartphones
High growth potential with low smartphone penetration ~10%
%FY06 %FY07 %FY08 %FY09 %1H10Non-voice revenues +44.2% +16.9% +7.6% +17.0% +16.8%

Regulatory/Litigation Update
22
3G 2.1GHz regulation published in Royal Gazette on July 29, auction possible in September
3G 850MHz commercial launch id d b CAT’ b d l t bl d f A t3G 850MHz commercial launch considered by CAT’s board, approval tabled for August
2G concession conversion is being fast-tracked by the government, targeted for completion within August, operators concerned by legal and regulatory issues
Foreign dominance regulation drafted by the NTC; several issues remain unclear
Concession amendments Cabinet awaits final study by ICT Ministry on the impact of theConcession amendments Cabinet awaits final study by ICT Ministry on the impact of the changes; CAT states no negative effects from the amendments
Draft Frequency Allocation Act amended by the Senate, now with the Lower House
Mobile Number Portability NTC revised deadline to Sept 1; True and other operators will submit a joint letter to the NTC opposing the new deadline
IC regime True has lodged an appeal opposing the NTC’s new IC rates with Hutch
On-net/Off-net regulation imposed by NTC opposed by three major operators

3G presents a bright future for True GroupTrue Group’s rich content and convergence platform to strengthen our 3G positioning
Ready to move ahead with the 3G bidding
Several funding options available including strong commitment from local banksSeveral funding options available, including strong commitment from local banks
W3 W4 W1 W2 W3 W4 W1 W2 W3 W4 W1 W2 W3 W4 W1 W2 W3 W4Auction preparation
Publication of final IM Jul 29
Jul-10 Nov-10Oct-10Aug-10 Sep-10NTC’s 3.9G licensing timeline
Publication of final IM Jul 29Prequalification phase
Application period + 10% depositPrequalification process
Auction training phaseInformation session 7 daysQualified bidder mock auction
Deadline: Aug 3015 days
Qualified bidder mock auctionAuction phase
Auction start Sep 20 - 28Announcement of the winners 7 days
Granting of licenses phasePre-licensing qualificationLicenses issued
45 days after auction endsLicenses issued
Source: NTC, Company

24

25
Stronger growth expected in 2H10 as ad revenue picking upNIOGOS i NIOGOService revenues
463 676 865 992 910 13 74
7,943 8,445 8,866
9,431 9,533 Bt mn
866
1,418
1,007 1,166 983
Bt mn
7,480 7,769 8,001 8,426 8,549
4,321 4,218
294 253 26 203
4,641 4,674 - Advertising- Others
- Subscription & installation 866 1,245 1,097 1,130 1,020 718 562
866 679
492
F h fl
2005 2006 2007 2008 2009 1H09 1H10
Subscription & installation Others Advertising
2005 2006 2007 2008 2009 1H09 1H10
NIOGO excl. deferred income tax NIOGO
27.8% 26.4% 25.9% 26.1% 27.0%32.4%
24.5%24.8% 28.1%
EBITDA & EBITDA margin Free cash flow
2,190Bt mn
2,253 2,366 2,527 2,666 2,622
1,544 1 157
28.1%Bt mn 1,796
911
1,594 1,520
772 696
914 2851,157
2005 2006 2007 2008 2009 1H09 1H10
EBITDA EBITDA margin w/o TVS extra item
792 914660 614 232 74
285
2005 2006 2007 2008 2009 1H09 1H10
Cash flow from operation CapexNote: 2009 includes the reversal of over-accrued content-related cost (Bt207mn)
p p
%FY06 %FY07 %FY08 %FY09 %1H10Service revenue +6.3% +5.0% +6.4% +1.1% +0.7%EBITDA +5.0% +6.8% +5.5% -1.7% -25.1%

26
Mass market campaign further drives sub growth
1,291 1,217 1,104 988 806 836 752
Bt/sub/moSubscribers & ARPU Bundled package subscribers & upselling rate
19.0%30.4% 38.0% 33.6% 38.1%
319527
549 584 523 90
143 199 174 225
624
1,039
1,469 1,676 1,613 1,658
‘000 subscribers
524
546 581 519
394
819
1,029 980 1,021 ‘000 subscribers
484 466 481 479 459 443 435 93
149 320 470 411 474 65 319 484
624
2005 2006 2007 2008 2009 1H09 1H10Net adds +26 +140 +415 +430 +194 +144 (19) (‘000)
75 249 391 329 389
-
46 92 70
113
319
394
2005 2006 2007 2008 2009 1H09 1H102005 2006 2007 2008 2009 1H09 1H10Premium (Platinum, Gold, Silver) Standard (Knowledge)Freeview Free-to-air
Blended ARPU * Upselling rate refers to the upgrading of mass market subscribers to higher-value packages
**Restated to include subscribers of TrueVisions- hi-speed bundling
Upsold Non-upsold (Free-to-air) Non-upsold (Free view)% Upselling rate
Restated to include subscribers of TrueVisions hi speed bundling packages since 4Q09
Value created from upselling and advertising opportunities
HDTV the 2010 Premier League kick-off and new promotions offer a bright outlook for H2HDTV, the 2010 Premier League kick off and new promotions offer a bright outlook for H2
%FY06 %FY07 %FY08 %FY09 %1H10Total subscribers +28.9% +66.6% +41.4% +14.1% +2.8%ARPU -5.7% -9.3% -10.5% -18.4% -10.0%

27
New mass market campaigns build competitive advantage
Mass market campaigns launched in June/July with more channels, better value
Satellite dish with 42 channels for Bt 2,990 (no monthly fee) down from Bt 3,990 for dish and 39 channels
New packages provide broader content, improving upselling opportunities
“TrueLife Free to Air” promotion targets the lower-end of the mass market andTrueLife Free to Air promotion targets the lower end of the mass market and supports higher ad revenue

28
HD channels launched to boost retention, supports ARPU
Thailand’s first HDTV channels are a key differentiator for TrueVisions
Offers the best viewing experience for premium subscribers, supports ARPU
Competitors cannot replicate service due to limited technology/capacity
Three HDTV channels available: TrueSport HD, HBO HD & AF HD
St k t Fi t b t h f 12 000 HDTV t t b ld t idlStrong market response. First batch of 12,000 HDTV set-top boxes sold out rapidly

29
Focus on content development continues
Content development for all segments remains a core strategy
Academy Fantasia, our key retention tool, launched its 7th season in June
New content introduced in Q2 included Golf Channel Thailand and Woman Channel
More local content is in the pipeline to respond to consumer trends
Year-round back-to-back reality shows planned such as Coffee MasterYear-round back-to-back reality shows planned, such as Coffee Master

High growth opportunity from low household penetration
30
Pay TV penetration
72%
(Unit : Mil HH)
19.1
16%
50%57%
72%
1.61.5 2.6 0.6 1.6
16.0
2.70.5 0.6
5.3
1.1 2.2
Thailand Malaysia Singapore HongKong
Note : 1) Data source : Pan-Regional TV in Asia 2009, 2Q09, Casbaa2) Thailand data: AGB Neilson research
Thailand Malaysia Singapore Hong KongNo. of HH Non Pay TV HHLocal cable subscriber % Pay TV penetration
Thailand’s pay TV penetration is relatively low (16%) compared to Asia-Pacific peers
TrueVisions is the only nationwide operator with exclusive key content
)
TrueVisions is the only nationwide operator with exclusive key content

31
Reorganization puts TrueVisions on a firmer long-term footingOld structure New structure
TH TH
TRUE
99.99%
TRUE
99.99%
91.08%
TMMCOT
25.01%
73.32%
TVGMCOT
48.34%
99.99%
73.32%25.01%
99.99%
TVS
73.32%
0.4%
0.66%
99.34% 99.99% 99.99% 99.99% 99.99%
TVS0.4%0.66%
51.0% 99.99% 99.99% 99.99%
25.01%
Remark:TH: Telecom Holding – a holding company under True GroupTM: True Multimedia – Business data transmission
Transaction description:TH established a new wholly owned holding company –
d ( )
TVC Cineplex SSV PTE TDM TVC Cineplex SSV PTE TDM
TVG: True Visions Group – a newly setup holding company for Pay TV GroupTVS: True Visions - Pay TV business under MCOT concession TVC: True Visions Cable – Pay TV business under MCOT concession
Cineplex - Producing television programs
TrueVisions Group Company Limited (TVG)TVG acquires
− 73.32% of TVS shares from TM; − 48.34% of TVC shares from TVS
Post transaction True’s effective holding increasedSSV: Satellite Service - Sale and rental of equipment PTE: Panther Entertainment (formerly UBC Fantasia) - Providing artist
management services and production of music, and othersTDM: True Digital Media (formerly Red Media) - Advertising sales agency for
pay-TV Group
Post transaction, True s effective holding increased− 98.3% in TVS (91.8% previously)− 98.5% in TVC (91.2% previously)
Provides operational flexibility and foundationto support future developmentto support future development
Expect stronger revenue growth in second half, signs of turnaround seen in July
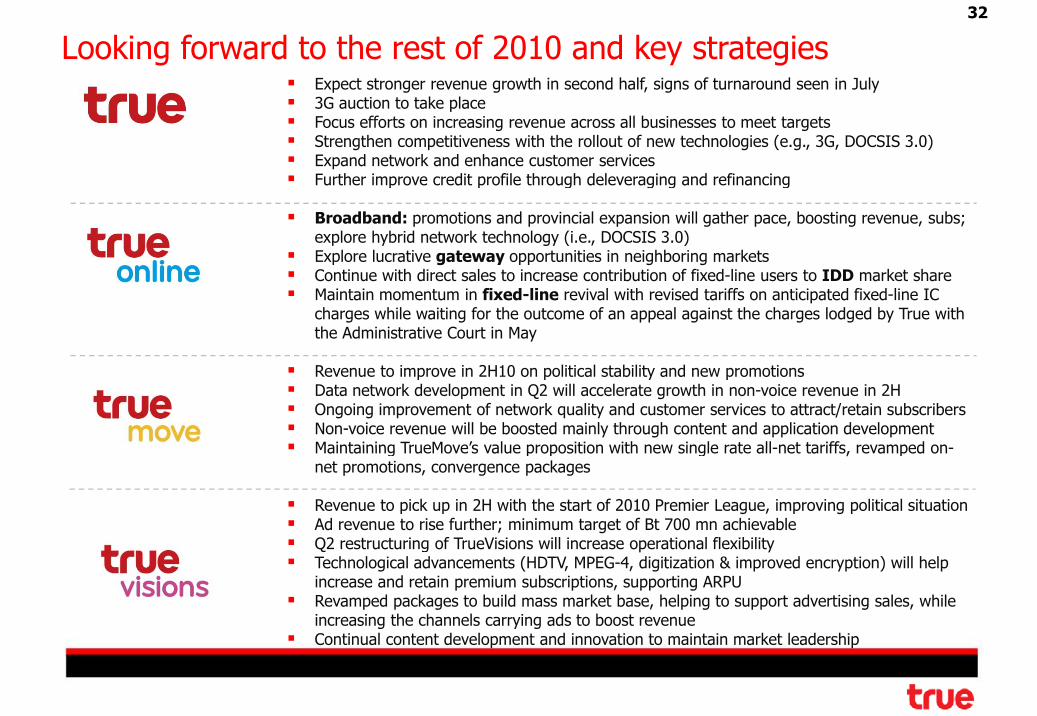
Looking forward to the rest of 2010 and key strategies32
Expect stronger revenue growth in second half, signs of turnaround seen in July3G auction to take placeFocus efforts on increasing revenue across all businesses to meet targetsStrengthen competitiveness with the rollout of new technologies (e.g., 3G, DOCSIS 3.0)Expand network and enhance customer servicesFurther improve credit profile through deleveraging and refinancingFurther improve credit profile through deleveraging and refinancing
Broadband: promotions and provincial expansion will gather pace, boosting revenue, subs; explore hybrid network technology (i.e., DOCSIS 3.0)Explore lucrative gateway opportunities in neighboring marketsContinue with direct sales to increase contribution of fixed-line users to IDD market shareMaintain momentum in fixed-line revival with revised tariffs on anticipated fixed-line IC charges while waiting for the outcome of an appeal against the charges lodged by True with the Administrative Court in May
Revenue to improve in 2H10 on political stability and new promotionsData network development in Q2 will accelerate growth in non-voice revenue in 2HOngoing improvement of network quality and customer services to attract/retain subscribersNon-voice revenue will be boosted mainly through content and application developmentMaintaining TrueMove’s value proposition with new single rate all-net tariffs revamped on-Maintaining TrueMove s value proposition with new single rate all-net tariffs, revamped on-net promotions, convergence packages
Revenue to pick up in 2H with the start of 2010 Premier League, improving political situationAd revenue to rise further; minimum target of Bt 700 mn achievableQ2 t t i f T Vi i ill i ti l fl ibilitQ2 restructuring of TrueVisions will increase operational flexibilityTechnological advancements (HDTV, MPEG-4, digitization & improved encryption) will help increase and retain premium subscriptions, supporting ARPURevamped packages to build mass market base, helping to support advertising sales, while increasing the channels carrying ads to boost revenueg y gContinual content development and innovation to maintain market leadership

33
Disclaimer: This presentation contains statements about expected future events and financial results that are forward-looking and subject to risks and uncertainties. For these statements, we claim the protection of the safe harbor for forward-looking statements contained in the Private Securities Litigation Reform
Thank You
of the safe harbor for forward looking statements contained in the Private Securities Litigation Reform Act of 1995. Discussion of factors that may affect future results is contained in our recent filings with the Securities and Exchange Commission.
Thank You

AppendixppSlides (#)
Normalized results (Consolidated) A1Normalized results (TrueOnline) A2Normalized results (TrueMove) A3Normalized results (TrueVisions) A4Consolidated Revenue Profile (Before Eliminations) A5Operating Expenses A6-7Operating Expenses A6 7Balance sheet A8Free Cash Flow A9-12Impact to P&L from TVS refinancing/reorganization A13
1

Normalized Results (Consolidated) A1
(Baht in millions unless otherwise indicated) 2Q10 1Q10 2Q09 Change QoQ Change YoY 1H10 1H09 Change YoYAmt. % Amt. % Amt. %
Revenue 14,816 15,800 15,128 (984) -6.2% (312) -2.1% 30,617 30,696 (79) -0.3%Revenue 14,816 15,800 15,128 (984) 6.2% (312) 2.1% 30,617 30,696 (79) 0.3% Revenues from providing services 14,312 15,021 14,545 (710) -4.7% (233) -1.6% 29,333 29,539 (207) -0.7% - Interconnection revenue 1,601 1,701 1,782 (100) -5.9% (181) -10.2% 3,302 3,621 (319) -8.8% - Revenue from service exclude IC 12,711 13,320 12,763 (610) -4.6% (52) -0.4% 26,031 25,919 112 +0.4% Revenues from product sales 505 779 583 (274) -35.2% (78) -13.4% 1,284 1,157 127 +11.0%
Cost of providing services 9,720 9,969 9,527 (249) -2.5% 193 +2.0% 19,688 19,294 395 +2.0%Regulatory costs 1 698 1 846 1 812 (149) -8 0% (114) -6 3% 3 544 3 675 (131) -3 6% Regulatory costs 1,698 1,846 1,812 (149) 8.0% (114) 6.3% 3,544 3,675 (131) 3.6%
Network operating expenses 5,519 5,694 5,288 (175) -3.1% 230 +4.4% 11,212 10,909 303 +2.8% - Interconnection charge 1,541 1,637 1,802 (97) -5.9% (262) -14.5% 3,178 3,669 (491) -13.4% - Network operating expenses exclude IC 3,978 4,056 3,486 (79) -1.9% 492 +14.1% 8,034 7,240 794 +11.0% Depreciation and amortization 2,503 2,429 2,427 75 +3.1% 76 +3.1% 4,932 4,709 223 +4.7%Cost of sales 440 663 562 (223) -33.6% (122) -21.7% 1,103 1,100 3 +0.2%Selling and administrative expenses 2,997 2,919 2,809 78 +2.7% 188 +6.7% 5,916 5,477 439 +8.0%Selling and administrative expenses 2,997 2,919 2,809 78 +2.7% 188 +6.7% 5,916 5,477 439 +8.0% Depreciation and amortization 299 277 317 22 +7.9% (18) -5.7% 576 623 (47) -7.6% Others S&A 2,698 2,642 2,492 56 +2.1% 206 +8.3% 5,340 4,854 486 +10.0%Total operarting expenses 13,157 13,550 12,898 (394) -2.9% 259 +2.0% 26,707 25,871 836 +3.2%
EBITDA 4,462 4,956 4,974 (494) -10.0% (513) -10.3% 9,418 10,157 (740) -7.3% Depreciation & amortization (2,802) (2,706) (2,744) 96 +3.6% 58 +2.1% (5,508) (5,332) 175 +3.3%Operating profit 1,660 2,250 2,230 (590) -26.2% (570) -25.6% 3,910 4,825 (915) -19.0%p g p , , , ( ) ( ) , , ( ) Interest expense - net (1,610) (1,465) (1,737) 146 +9.9% (127) -7.3% (3,075) (3,606) (531) -14.7% - Interest income 12 8 27 4 +54.0% (16) -57.0% 19 51 (32) -62.0% - Interest expenses (1,622) (1,473) (1,765) 150 +10.2% (143) -8.1% (3,095) (3,657) (563) -15.4% Other financial fee (167) (98) (133) 69 +70.3% 34 +25.2% (264) (245) 19 +7.8% Income tax (expense) revenue (0) (688) (657) (688) -100.0% (657) -100.0% (688) (1,269) (581) -45.8% - Current tax 10 (243) (348) (252) -103.9% (358) -102.7% (233) (595) (362) -60.8% - Deferred income tax (10) (445) (309) (436) -97.8% (299) -96.9% (455) (674) (219) -32.5%( ) ( ) ( ) ( ) ( ) ( ) ( ) ( )Income from continuing operations (117) (1) (297) (117) -21832.4% 180 +60.5% (118) (295) 177 +60.0% Share of results in subsidiaries and associates 12 9 (1) 4 +39.3% 14 NM 21 (5) 26 NM Minority interest 184 (43) (178) 227 NM 363 +203.3% 141 50 91 +180.7%Net income (loss) from continuing operations including share of results in subsidiaries 79 (35) (477) 114 +328.6% 556 +116.6% 45 (250) 294 +117.9%
NIOGO excl deferred income tax 89 411 (168) (322) -78 3% 257 +152 9% 500 424 75 +17 7%NIOGO excl. deferred income tax 89 411 (168) (322) -78.3% 257 +152.9% 500 424 75 +17.7%
Non recurring items (528) 1,275 1,701 (1,802) -141.4% (2,229) -131.0% 747 1,343 (596) -44.4% Foreign exchange gain (loss) (1,340) 1,165 1,610 (2,505) -215.1% (2,950) -183.3% (175) 1,230 (1,406) -114.3% Hedging unwinding cost from TVS refinancing (879) - - (879) NM (879) NM (879) - (879) NM Adjustment for deferred tax 1,614 - - 1,614 NM 1,614 NM 1,614 - 1,614 NM Other (expenses) income 77 110 91 (33) -29.7% (14) -15.4% 187 112 75 +66.6%Net profit (loss) to shareholders of the parent (448) 1,240 1,224 (1,688) -136.2% (1,673) -136.6% 792 1,093 (301) -27.6%Minority interest (184) 43 178 227 NM 363 +203.3% (141) (50) 91 +180.7%Net profit (loss) for the period (633) 1,283 1,403 (1,916) -149.3% (2,035) NM 651 1,043 (392) -37.6%EBITDA margin (on gross IC) 30.1% 31.4% 32.9% -125 bps -277 bps 30.8% 33.1% -233 bpsEBITDA margin (on net IC) 33.8% 35.1% 37.3% -139 bps -351 bps 34.5% 37.5% -304 bps

A2Normalized TrueOnline Results
(Baht in millions unless otherwise indicated) 2Q10 1Q10 2Q09 Change QoQ Change YoY 1H10 1H09 Change YoYAmt. % Amt. % Amt. %Amt. % Amt. % Amt. %
Revenue 6,750 6,926 6,569 (176) -2.5% 181 +2.8% 13,676 13,290 386 +2.9% Revenues from providing services 6,620 6,745 6,462 (125) -1.8% 158 +2.4% 13,365 13,059 306 +2.3% Revenues from product sales 130 181 106 (51) -28.4% 24 +22.4% 311 231 80 +34.4%
Cost of providing services 4,249 4,334 4,022 (85) -2.0% 227 +5.6% 8,582 7,994 589 +7.4% Regulatory costs 399 405 485 (6) -1.6% (87) -17.9% 804 986 (183) -18.5%
Network operating expenses 2 476 2 562 2 213 (86) -3 4% 263 +11 9% 5 038 4 427 611 +13 8% Network operating expenses 2,476 2,562 2,213 (86) 3.4% 263 +11.9% 5,038 4,427 611 +13.8% Depreciation and amortization 1,374 1,366 1,324 8 +0.6% 50 +3.8% 2,740 2,580 160 +6.2%Cost of sales 103 140 90 (38) -27.0% 12 +13.3% 243 194 49 +25.3%Selling and administrative expenses 1,493 1,494 1,307 (1) -0.1% 186 +14.2% 2,986 2,665 322 +12.1% Depreciation and amortization 111 102 115 9 +8.7% (4) -3.7% 213 240 (27) -11.3% Others S&A 1,381 1,392 1,192 (10) -0.7% 190 +15.9% 2,773 2,424 349 +14.4%Total operarting expenses 5,844 5,968 5,419 (124) -2.1% 425 +7.8% 11,812 10,852 960 +8.8%p g p , , , ( ) , ,EBITDA 2,391 2,426 2,589 (35) -1.5% (197) -7.6% 4,818 5,259 (441) -8.4% Depreciation & amortization (1,485) (1,468) (1,439) 17 +1.1% 46 +3.2% (2,953) (2,821) 133 +4.7%Operating profit 906 958 1,150 (52) -5.4% (243) -21.2% 1,864 2,438 (574) -23.5% Interest expense - net (779) (595) (870) 183 +30.8% (91) -10.5% (1,374) (1,586) (212) -13.4% - Interest income 7 4 18 3 +86.5% (11) -58.8% 11 34 (22) -66.2% - Interest expenses (786) (599) (888) 187 +31.2% (102) -11.4% (1,386) (1,620) (234) -14.5% Other financial fee (103) (54) (97) 49 +90.1% 6 +6.6% (158) (175) (17) -9.9% Income tax (expense) revenue (75) (369) (265) (294) -79.7% (190) -71.7% (444) (519) (75) -14.5% - Current tax (55) (157) (189) (102) -65.0% (134) -70.9% (212) (305) (94) -30.7% - Deferred income tax (20) (212) (76) (192) -90.6% (56) -73.8% (232) (213) 19 +8.7%
Income from continuing operations (51) (61) (82) 10 +16.1% 31 +37.9% (111) 158 (270) -170.4% Share of results in subsidiaries and associates 12 8 0 4 +49.9% 12 NM 20 (3) 23 NM Minority interest 195 (31) (34) 226 NM 229 NM 164 (43) 207 +479.5%Net income (loss) from continuing operations including share of results in subsidiaries 156 (83) (116) 240 +287.3% 273 +234.3% 73 112 (39) -35.0%NIOGO excl. deferred income tax 176 129 (41) 48 +37.0% 217 NM 305 325 (21) -6.3%Non recurring items (1,255) 412 381 (1,667) -405.0% (1,637) -429.3% (844) 597 (1,440) -241.4% Foreign exchange gain (loss) (758) 303 292 (1,061) -349.9% (1,050) -359.5% (454) 482 (936) -194.3% Hedging unwinding cost (618) - - (618) NM (618) NM (618) - (618) NM Adjustment for deferred tax 50 - - 50 NM 50 NM 50 - 50 NM Other (expenses) income 70 108 89 (39) -35.6% (19) -21.8% 178 115 64 +55.6%Net profit (loss) to shareholders of the parent (1,099) 328 265 (1,427) -434.9% (1,364) NM (771) 709 (1,480) -208.8%Minority interest (195) 31 34 226 NM 229 NM (164) 43 207 +479.5%Net profit (loss) for the period (1,294) 359 299 (1,653) -460.3% (1,593) NM (935) 752 (1,687) -224.3%EBITDA margin 35.4% 35.0% 39.4% +39 bps -398 bps 35.2% 39.6% -434 bps

A3Normalized TrueMove Results
(Baht in millions unless otherwise indicated) 2Q10 1Q10 2Q09 Change QoQ Change YoY 1H10 1H09 Change YoYAmt. % Amt. % Amt. %Amt. % Amt. % Amt. %
Revenue 7,714 8,487 7,890 (774) -9.1% (176) -2.2% 16,201 16,223 (22) -0.1% Revenues from providing services 7,288 7,850 7,406 (562) -7.2% (118) -1.6% 15,139 15,147 (8) -0.1% - Interconnection revenue 1,601 1,701 1,783 (100) -5.9% (182) -10.2% 3,302 3,622 (320) -8.8% - Revenue from service exclude IC 5,687 6,149 5,623 (462) -7.5% 64 +1.1% 11,837 11,525 312 +2.7% Revenues from product sales 425 637 484 (212) -33.3% (59) -12.1% 1,062 1,076 (13) -1.2%Cost of providing services 5,221 5,316 5,386 (94) -1.8% (165) -3.1% 10,537 10,848 (311) -2.9%
Regulatory costs 1 166 1 311 1 194 (145) -11 1% (28) -2 3% 2 476 2 428 48 +2 0% Regulatory costs 1,166 1,311 1,194 (145) 11.1% (28) 2.3% 2,476 2,428 48 +2.0% Network operating expenses 3,090 3,121 3,251 (31) -1.0% (161) -5.0% 6,211 6,618 (407) -6.1% - Interconnection charge 1,541 1,637 1,802 (97) -5.9% (262) -14.5% 3,178 3,669 (491) -13.4% - Network operating expenses exclude IC 1,549 1,483 1,449 66 +4.4% 100 +6.9% 3,033 2,948 84 +2.9% Depreciation and amortization 966 885 942 81 +9.2% 24 +2.5% 1,850 1,802 48 +2.7%Cost of sales 392 558 466 (166) -29.8% (74) -16.0% 950 969 (19) -2.0%Selling and administrative expenses 1,759 1,635 1,540 125 +7.6% 219 +14.2% 3,394 3,015 379 +12.6% Depreciation and amortization 112 115 132 (3) -2.7% (20) -15.0% 227 246 (18) -7.5%p ( ) ( ) ( ) Others S&A 1,647 1,520 1,408 128 +8.4% 239 +17.0% 3,167 2,769 398 +14.4%Total operarting expenses 7,373 7,509 7,393 (136) -1.8% (20) -0.3% 14,881 14,832 49 +0.3%EBITDA 1,419 1,979 1,571 (560) -28.3% (152) -9.7% 3,397 3,439 (41) -1.2% Depreciation & amortization (1,078) (1,000) (1,073) 78 +7.8% 4 +0.4% (2,077) (2,048) 30 +1.5%Operating profit 341 979 497 (638) -65.2% (156) -31.4% 1,320 1,391 (71) -5.1% Interest expense - net (807) (845) (846) (39) -4.6% (39) -4.6% (1,652) (1,976) (324) -16.4% - Interest income 4 4 9 1 +17.7% (5) -52.2% 8 17 (9) -53.0%te est co e 9 % (5) 5 % 8 (9) 53 0% - Interest expenses (811) (849) (855) (38) -4.5% (44) -5.1% (1,659) (1,992) (333) -16.7% Other financial fee (40) (42) (34) (1) -3.6% 6 +17.4% (82) (67) 15 +23.0% Income tax (expense) revenue 60 (184) (180) (244) -132.7% (240) -133.3% (124) (392) (269) -68.5% - Current tax - - - - NM - NM - - - NM - Deferred income tax 60 (184) (180) (244) -132.7% (240) -133.3% (124) (392) (269) -68.5%Income from continuing operations (446) (92) (563) (354) -385.6% 118 +20.9% (537) (1,044) 506 +48.5%
Share of results in subsidiaries and associates - - - - NM - NM - - - NM Share of results in subsidiaries and associates NM NM NM Minority interest - - 0 - NM (0) -100.0% - 0 (0) -100.0%Net income (loss) from continuing operations including share of results in subsidiaries (446) (92) (563) (354) -385.6% 118 +20.9% (537) (1,044) 506 +48.5%NIOGO excl. deferred income tax (506) 92 (383) (598) -649.5% (123) -32.1% (414) (651) 238 +36.5%Non recurring items 388 707 1,116 (319) -45.1% (728) -65.2% 1,095 597 497 +83.2% Foreign exchange gain (loss) (173) 703 1,111 (876) -124.6% (1,284) -115.6% 530 597 (67) -11.2%
H d i i di t f TVS fi i NM NM NM Hedging unwinding cost from TVS refinancing - - - - NM - NM - - - NM Adjustment for deferred tax 548 - - 548 NM 548 NM 548 - 548 NM Other (expenses) income 13 4 5 9 +240.6% 8 +183.2% 17 1 16 NMNet profit (loss) to shareholders of the pare (58) 615 553 (672) -109.4% (610) -110.4% 557 (446) 1,003 +224.9%Minority interest - - (0) - #DIV/0! (0) -100.0% - (0) (0) -100.0%Net profit (loss) for the period (58) 615 553 (672) -109.4% (610) NM 557 (446) 1,003 +224.9%EBITDA margin (on gross IC) 18.4% 23.3% 19.9% -492 bps -151 bps 21.0% 21.2% -23 bpsEBITDA margin (on net IC) 23 2% 29 2% 25 7% -595 bps -251 bps 26 3% 27 3% -95 bpsEBITDA margin (on net IC) 23.2% 29.2% 25.7% -595 bps -251 bps 26.3% 27.3% -95 bps
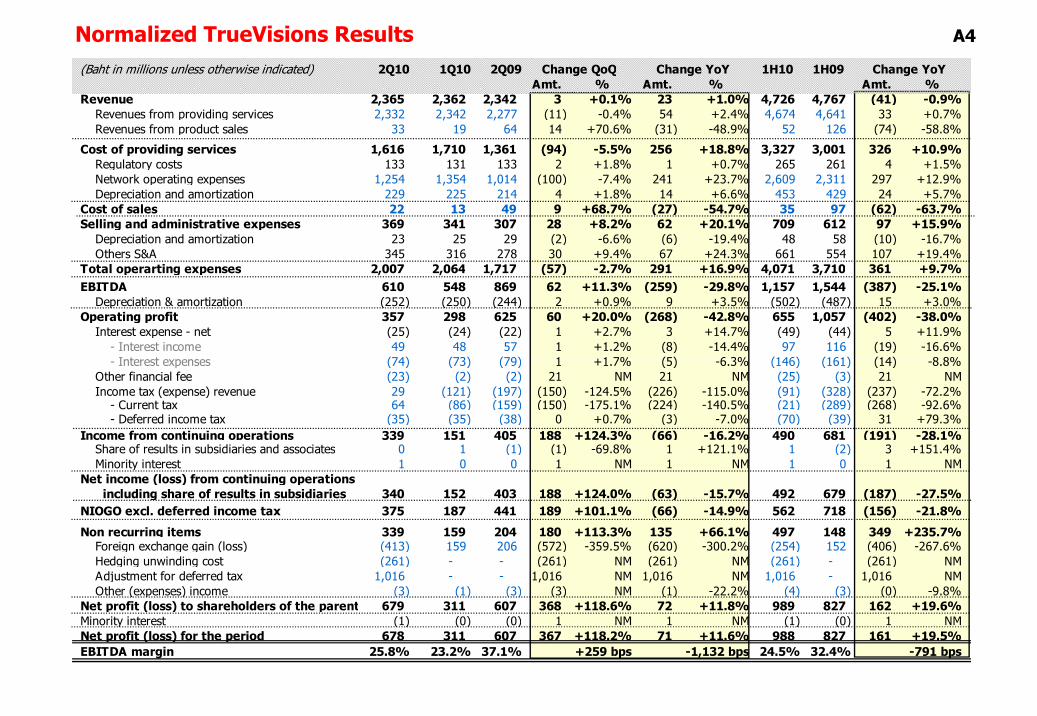
Normalized TrueVisions Results A4
(Baht in millions unless otherwise indicated) 2Q10 1Q10 2Q09 Change QoQ Change YoY 1H10 1H09 Change YoYAmt. % Amt. % Amt. %
Revenue 2,365 2,362 2,342 3 +0.1% 23 +1.0% 4,726 4,767 (41) -0.9% Revenues from providing services 2,332 2,342 2,277 (11) -0.4% 54 +2.4% 4,674 4,641 33 +0.7% Revenues from product sales 33 19 64 14 +70.6% (31) -48.9% 52 126 (74) -58.8%
Cost of providing services 1,616 1,710 1,361 (94) -5.5% 256 +18.8% 3,327 3,001 326 +10.9% Regulatory costs 133 131 133 2 +1.8% 1 +0.7% 265 261 4 +1.5%
Network operating expenses 1 254 1 354 1 014 (100) 7 4% 241 +23 7% 2 609 2 311 297 +12 9% Network operating expenses 1,254 1,354 1,014 (100) -7.4% 241 +23.7% 2,609 2,311 297 +12.9% Depreciation and amortization 229 225 214 4 +1.8% 14 +6.6% 453 429 24 +5.7%Cost of sales 22 13 49 9 +68.7% (27) -54.7% 35 97 (62) -63.7%Selling and administrative expenses 369 341 307 28 +8.2% 62 +20.1% 709 612 97 +15.9% Depreciation and amortization 23 25 29 (2) -6.6% (6) -19.4% 48 58 (10) -16.7% Others S&A 345 316 278 30 +9.4% 67 +24.3% 661 554 107 +19.4%Total operarting expenses 2 007 2 064 1 717 (57) -2 7% 291 +16 9% 4 071 3 710 361 +9 7%Total operarting expenses 2,007 2,064 1,717 (57) -2.7% 291 +16.9% 4,071 3,710 361 +9.7%EBITDA 610 548 869 62 +11.3% (259) -29.8% 1,157 1,544 (387) -25.1% Depreciation & amortization (252) (250) (244) 2 +0.9% 9 +3.5% (502) (487) 15 +3.0%Operating profit 357 298 625 60 +20.0% (268) -42.8% 655 1,057 (402) -38.0% Interest expense - net (25) (24) (22) 1 +2.7% 3 +14.7% (49) (44) 5 +11.9% - Interest income 49 48 57 1 +1.2% (8) -14.4% 97 116 (19) -16.6%
I t t (74) (73) (79) 1 1 7% (5) 6 3% (146) (161) (14) 8 8% - Interest expenses (74) (73) (79) 1 +1.7% (5) -6.3% (146) (161) (14) -8.8% Other financial fee (23) (2) (2) 21 NM 21 NM (25) (3) 21 NM Income tax (expense) revenue 29 (121) (197) (150) -124.5% (226) -115.0% (91) (328) (237) -72.2% - Current tax 64 (86) (159) (150) -175.1% (224) -140.5% (21) (289) (268) -92.6% - Deferred income tax (35) (35) (38) 0 +0.7% (3) -7.0% (70) (39) 31 +79.3%Income from continuing operations 339 151 405 188 +124.3% (66) -16.2% 490 681 (191) -28.1%
Share of results in subsidiaries and associates 0 1 (1) (1) 69 8% 1 +121 1% 1 (2) 3 +151 4% Share of results in subsidiaries and associates 0 1 (1) (1) -69.8% 1 +121.1% 1 (2) 3 +151.4% Minority interest 1 0 0 1 NM 1 NM 1 0 1 NMNet income (loss) from continuing operations including share of results in subsidiaries 340 152 403 188 +124.0% (63) -15.7% 492 679 (187) -27.5%NIOGO excl. deferred income tax 375 187 441 189 +101.1% (66) -14.9% 562 718 (156) -21.8%
Non recurring items 339 159 204 180 +113.3% 135 +66.1% 497 148 349 +235.7% Foreign exchange gain (loss) (413) 159 206 (572) -359.5% (620) -300.2% (254) 152 (406) -267.6% Hedging unwinding cost (261) - - (261) NM (261) NM (261) - (261) NM Adjustment for deferred tax 1,016 - - 1,016 NM 1,016 NM 1,016 - 1,016 NM Other (expenses) income (3) (1) (3) (3) NM (1) -22.2% (4) (3) (0) -9.8%Net profit (loss) to shareholders of the parent 679 311 607 368 +118.6% 72 +11.8% 989 827 162 +19.6%Minority interest (1) (0) (0) 1 NM 1 NM (1) (0) 1 NMNet profit (loss) for the period 678 311 607 367 +118.2% 71 +11.6% 988 827 161 +19.5%EBITDA margin 25.8% 23.2% 37.1% +259 bps -1,132 bps 24.5% 32.4% -791 bps

Consolidated Revenue Profile (Before Eliminations) A5
2Q10 1Q10 2Q09 Change QoQ Change YoY 1H10 1H09 Change YoYAmt. % Amt. % Amt. %
TrueVisions 2,365 2,362 2,342 3 +0.1% 23 +1.0% 4,726 4,767 (41) -0.9% - Service revenue 2,332 2,342 2,277 (11) -0.4% 54 +2.4% 4,674 4,641 33 +0.7% - Product sales 33 19 64 14 +70.6% (31) -48.9% 52 126 (74) -58.8%Intersegment elimination (72) (53) (69) (19) -36.0% (3) -3.9% (124) (168) 43 +25.9%Intersegment elimination (72) (53) (69) (19) 36.0% (3) 3.9% (124) (168) 43 25.9%TrueVisions after elimination 2,293 2,309 2,273 (16) -0.7% 20 +0.9% 4,602 4,600 3 +0.1%TrueMove 7,714 8,487 7,890 (774) -9.1% (176) -2.2% 16,201 16,223 (22) -0.1% - Service revenue 7,288 7,850 7,406 (562) -7.2% (118) -1.6% 15,139 15,147 (8) -0.1% - Product sales 425 637 484 (212) -33.3% (59) -12.1% 1,062 1,076 (13) -1.2%Intersegment elimination (467) (402) (327) (65) -16.2% (140) -42.8% (870) (848) (22) -2.6%True Move after elimination 7,246 8,085 7,563 (839) -10.4% (316) -4.2% 15,331 15,375 (44) -0.3%, , , ( ) ( ) , , ( )TrueOnline 6,750 6,926 6,569 (176) -2.5% 181 +2.8% 13,676 13,290 386 +2.9%Internet, Broadband and Data network services 2,752 2,690 2,580 62 +2.3% 173 +6.7% 5,442 5,195 247 +4.8% - Data network service 927 868 888 60 +6.9% 39 +4.4% 1,795 1,823 (28) -1.5% - Business data service 704 645 665 59 +9.2% 39 +5.8% 1,349 1,377 (28) -2.0% - Business data service for TMV 269 209 222 60 +28.7% 47 +21.0% 477 494 (17) -3.4%
- Business data service for Non-TMV 436 436 444 (1) -0 1% (8) -1 8% 872 883 (11) -1 3% Business data service for Non TMV 436 436 444 (1) 0.1% (8) 1.8% 872 883 (11) 1.3% - Multimedia 223 223 223 0 +0.1% 0 +0.0% 446 446 0 +0.1% - Internet & Broadband 1,825 1,823 1,691 2 +0.1% 134 +7.9% 3,647 3,372 275 +8.2% - Broadband 1,447 1,469 1,344 (22) -1.5% 103 +7.6% 2,915 2,673 242 +9.1% - Dial up Internet & Other (excl. TIG) 378 354 347 24 +6.8% 31 +9.0% 732 699 33 +4.7%New revenue stream, Convergence & others 1,998 2,100 1,713 (102) -4.9% 285 +16.6% 4,098 3,440 658 +19.1%
New revenue stream 285 275 235 10 +3 7% 50 +21 4% 559 493 67 +13 5% - New revenue stream 285 275 235 10 +3.7% 50 +21.4% 559 493 67 +13.5% - International call 190 197 156 (6) -3.3% 34 +22.1% 387 348 39 +11.2% - Others 94 78 79 17 +21.5% 16 +20.1% 172 144 28 +19.1% - Convergence & others 1,713 1,826 1,479 (112) -6.1% 235 +15.9% 3,539 2,947 592 +20.1%
Traditional voice 1,870 1,954 2,170 (85) -4.3% (300) -13.8% 3,824 4,424 (600) -13.6% - Fixed-line & VAS (excl. IDD & VOIP) 1,723 1,792 1,948 (69) -3.9% (225) -11.5% 3,516 3,968 (452) -11.4%, , , ( ) ( ) , , ( ) - Public phone 85 97 128 (12) -12.3% (43) -33.4% 182 255 (73) -28.7% - PCT 62 65 94 (3) -5.2% (32) -34.5% 126 201 (74) -37.1% TrueOnline service revenue 6,620 6,745 6,462 (125) -1.8% 158 +2.4% 13,365 13,059 306 +2.3%
TrueOnline product sales 130 181 106 (51) -28.4% 24 +22.4% 311 231 80 +34.4%Intersegment elimination (1,473) (1,520) (1,276) 47 +3.1% (197) -15.4% (2,993) (2,569) (424) -16.5%TrueOnline after elimination 5 277 5 406 5 292 (129) 2 4% (16) 0 3% 10 683 10 721 (38) 0 4%TrueOnline after elimination 5,277 5,406 5,292 (129) -2.4% (16) -0.3% 10,683 10,721 (38) -0.4%Normalized consolidated revenues 16,828 17,775 16,800 (947) -5.3% 28 +0.2% 34,603 34,280 323 +0.9%Total intersegment elimination (2,012) (1,975) (1,672) (37) -1.9% (340) -20.3% (3,987) (3,584) (403) -11.2%Normalized consolidated revenues-net 14,816 15,800 15,128 (984) -6.2% (312) -2.1% 30,617 30,696 (79) -0.3%

Operating Expenses A6
2Q10 1Q10 2Q09 Change QoQ Change YoY 1H10 1H09 Change YoY Amt. % Amt. % Amt. %
Consolidated
Regulatory costs 1,698 1,846 1,812 (149) -8.0% (114) -6.3% 3,544 3,675 (131) -3.6%
Cost of sales 440 663 562 (223) -33.6% (122) -21.7% 1,103 1,100 3 +0.2%
Interconnect charges (IC) 1,541 1,637 1,802 (97) -5.9% (262) -14.5% 3,178 3,669 (491) -13.4%
Core operating expenses (Core OPEX) 6,676 6,698 5,978 (22) -0.3% 698 +11.7% 13,374 12,094 1,280 +10.6%
- Network operating expenses exclude IC 3 978 4 056 3 486 (79) -1 9% 492 +14 1% 8 034 7 240 794 +11 0% Network operating expenses exclude IC 3,978 4,056 3,486 (79) 1.9% 492 +14.1% 8,034 7,240 794 +11.0%
- Selling and administrative expenses 2,698 2,642 2,492 56 +2.1% 206 +8.3% 5,340 4,854 486 +10.0%
Total cash operating expenses 10,354 10,845 10,153 (490) -4.5% 201 +2.0% 21,199 20,539 660 +3.2%
Depreciation and amortization 2,802 2,706 2,744 96 +3.6% 58 +2.1% 5,508 5,332 175 +3.3%
Total operating expenses 13,157 13,550 12,898 (394) -2.9% 259 +2.0% 26,707 25,871 836 +3.2%
TrueMove
2Q10 1Q10 2Q09 Change QoQ Change YoY 1H10 1H09 Change YoY Amt. % Amt. % Amt. %Amt. % Amt. % Amt. %
Regulatory costs 1,166 1,311 1,194 (145) -11.1% (28) -2.3% 2,476 2,428 48 +2.0%
Cost of sales 392 558 466 (166) -29.8% (74) -16.0% 950 969 (19) -2.0%
Interconnect charges (IC) 1,541 1,637 1,802 (97) -5.9% (262) -14.5% 3,178 3,669 (491) -13.4%g ( ) , , , ( ) ( ) , , ( )
Core operating expenses (Core OPEX) 3,197 3,003 2,857 194 +6.5% 340 +11.9% 6,200 5,718 482 +8.4%
- Network operating expenses exclude IC 1,549 1,483 1,449 66 +4.4% 100 +6.9% 3,033 2,948 84 +2.9%
- Selling and administrative expenses 1,647 1,520 1,408 128 +8.4% 239 +17.0% 3,167 2,769 398 +14.4%
Total cash operating expenses 6 295 6 509 6 319 (214) -3 3% (24) -0 4% 12 804 12 784 20 +0 2%
7
Total cash operating expenses 6,295 6,509 6,319 (214) 3.3% (24) 0.4% 12,804 12,784 20 +0.2%
Depreciation and amortization 1,078 1,000 1,073 78 +7.8% 4 +0.4% 2,077 2,048 30 +1.5%
Total operating expenses 7,373 7,509 7,393 (136) -1.8% (20) -0.3% 14,881 14,832 49 +0.3%
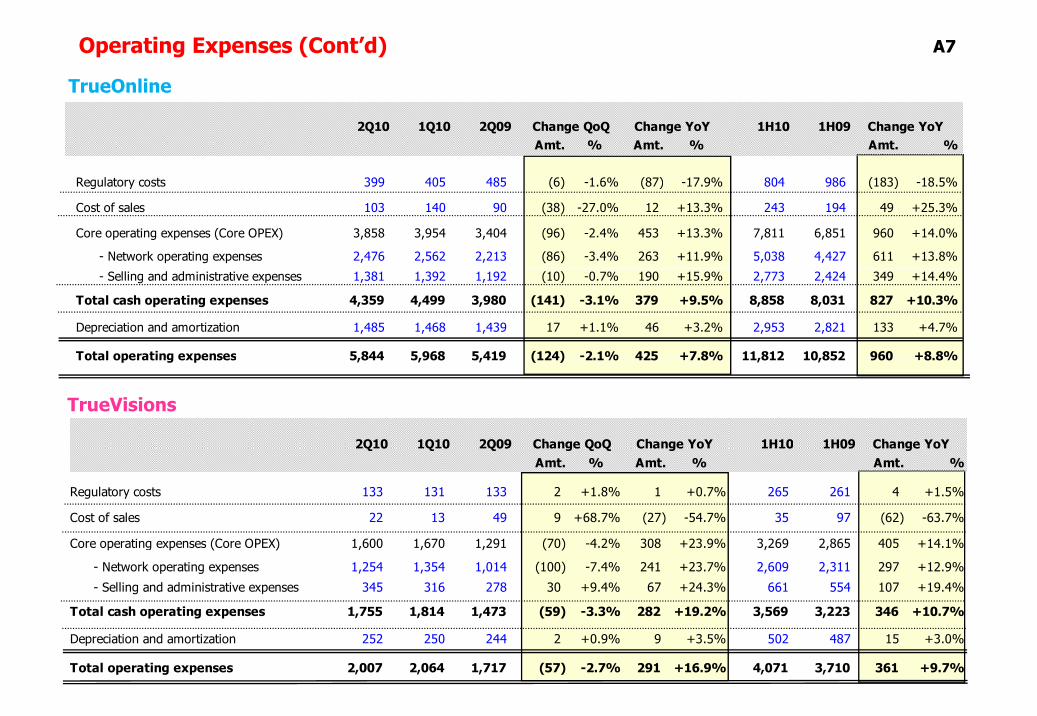
Operating Expenses (Cont’d) A7
TrueOnlineTrueOnline
2Q10 1Q10 2Q09 Change QoQ Change YoY 1H10 1H09 Change YoY Amt. % Amt. % Amt. %
R l t t 399 405 485 (6) 1 6% (87) 17 9% 804 986 (183) 18 5%Regulatory costs 399 405 485 (6) -1.6% (87) -17.9% 804 986 (183) -18.5%
Cost of sales 103 140 90 (38) -27.0% 12 +13.3% 243 194 49 +25.3%
Core operating expenses (Core OPEX) 3,858 3,954 3,404 (96) -2.4% 453 +13.3% 7,811 6,851 960 +14.0%
- Network operating expenses 2,476 2,562 2,213 (86) -3.4% 263 +11.9% 5,038 4,427 611 +13.8%
- Selling and administrative expenses 1,381 1,392 1,192 (10) -0.7% 190 +15.9% 2,773 2,424 349 +14.4%
Total cash operating expenses 4,359 4,499 3,980 (141) -3.1% 379 +9.5% 8,858 8,031 827 +10.3%
Depreciation and amortization 1,485 1,468 1,439 17 +1.1% 46 +3.2% 2,953 2,821 133 +4.7%
Total operating expenses 5,844 5,968 5,419 (124) -2.1% 425 +7.8% 11,812 10,852 960 +8.8%
TrueVisions
Total operating expenses 5,844 5,968 5,419 (124) 2.1% 425 +7.8% 11,812 10,852 960 +8.8%
2Q10 1Q10 2Q09 Change QoQ Change YoY 1H10 1H09 Change YoY2Q10 1Q10 2Q09 Change QoQ Change YoY 1H10 1H09 Change YoY Amt. % Amt. % Amt. %
Regulatory costs 133 131 133 2 +1.8% 1 +0.7% 265 261 4 +1.5%
Cost of sales 22 13 49 9 +68.7% (27) -54.7% 35 97 (62) -63.7%
Core operating expenses (Core OPEX) 1,600 1,670 1,291 (70) -4.2% 308 +23.9% 3,269 2,865 405 +14.1%
- Network operating expenses 1,254 1,354 1,014 (100) -7.4% 241 +23.7% 2,609 2,311 297 +12.9%
- Selling and administrative expenses 345 316 278 30 +9.4% 67 +24.3% 661 554 107 +19.4%
Total cash operating expenses 1,755 1,814 1,473 (59) -3.3% 282 +19.2% 3,569 3,223 346 +10.7%
Depreciation and amortization 252 250 244 2 +0.9% 9 +3.5% 502 487 15 +3.0%
Total operating expenses 2,007 2,064 1,717 (57) -2.7% 291 +16.9% 4,071 3,710 361 +9.7%

Balance SheetA8
Consolidated
THB millions 30 Jun 10 31 Dec 09 % chg.
ASSETS
C t t
Consolidated
Current assets
Cash and restricted cash 7,339 6,264 17.2%
Other current assets 14,877 14,293 4.1%
Non current assetsNon current assets
Investments 421 399 5.6%
Property, plant & equipment 66,270 68,693 -3.5%
Goodwill 12,428 12,428 0.0%
Intangible assets, net 5,267 5,340 -1.4%
Deferred income tax assets 8,843 8,224 7.5%
Other assets 1,041 780 33.4%
TOTAL ASSETS 116,484 116,421 0.1%TOTAL ASSETS 116,484 116,421 0.1%
LIABILITIES & EQUITY
LIABILITIES 105,190 105,779 -0.6%
Current liabilities 30,187 31,422 -3.9%
Non-current liabilities 75,004 74,356 0.9%
EQUITY 11,294 10,642 6.1%
TOTAL LIABILITIES & EQUITY 116,484 116,421 0.1%

Free Cash Flow - Consolidated A9
2Q10 1Q10 2Q09 Change QoQ Change YoY 1H10 1H09 Change YoY Amt. % Amt. % Amt. %
Cash flows from operating activities:Cash received from operations (before working capital) 4,144 5,648 5,440 (1,503) -26.6% (1,296) -23.8% 9,792 11,268 (1,476) -13.1%
Changes in operating working capital 1,096 (2,701) 405 3,797 NM 690 +170.4% (1,606) (1,182) (424) -35.9%
- Trade accounts receivable (120) (652) (678) 532 +81.7% 559 +82.4% (772) (909) 137 +15.1%
Sh t t i t t t di iti (9) 29 (2) (38) NM (7) 305 2% 20 52 (33) 62 3%- Short term investment - trading securities (9) 29 (2) (38) NM (7) -305.2% 20 52 (33) -62.3%
- Inventories (146) (355) 116 209 +59.0% (261) NM (500) (390) (111) -28.4%
- Other current assets 212 49 (216) 163 +331.3% 428 NM 262 96 166 +173.3%
- Other non-current assets (278) 28 (42) (306) NM (236) -562.5% (250) (11) (238) -2096.0%
- Trade accounts payable 602 (545) 713 1,147 NM (110) -15.5% 58 (110) 167 NM
f l d h ( 8) ( 88) ( ) ( ) ( ) ( ) ( )- Investments in film and program rights (268) (388) (114) 120 +31.0% (154) -134.4% (657) (625) (32) -5.1%
- Accrued expenses and other current liabilites 1,134 (798) 725 1,931 NM 409 +56.4% 336 821 (485) -59.1%
- Other non-current liabilities (33) (70) (95) 37 +53.5% 63 +65.9% (103) (106) 3 +3.2%
Cash received from operations 5,240 2,946 5,846 2,293 +77.8% (606) -10.4% 8,186 10,086 (1,900) -18.8%
Less: Interest paid (1,895) (1,007) (2,032) (888) -88.2% 137 +6.8% (2,902) (3,396) 495 +14.6%
Income tax paid (499) (420) (550) (79) -18.8% 51 +9.2% (920) (951) 32 +3.3%
Add: Interest received 6 12 29 (6) -51.7% (23) -79.2% 18 43 (25) -57.5%
Cash flows from operation 2,852 1,531 3,292 1,320 +86.2% (440) -13.4% 4,383 5,782 (1,398) -24.2%
Capex (1,669) (1,630) (1,239) - +0.0% 430 +34.7% (3,299) (2,570) 728 +28.3%
Free Cash Flow 1,183 (99) 2,053 1,282 NM (870) -42.4% 1,084 3,211 (2,127) -66.2%

Free Cash Flow - TrueMove A10
2Q10 1Q10 2Q09 Change QoQ Change YoY 1H10 1H09 Change YoY Amt. % Amt. % Amt. %
Cash flows from operating activities:Cash flows from operating activities:Cash received from operations (before working capital) 1,547 2,116 1,641 (568) -26.9% (94) -5.7% 3,663 3,660 3 +0.1%
Changes in operating working capital 1,628 (936) 1,098 2,563 NM 529 +48.2% 692 380 312 +82.0%
- Trade accounts receivable (110) (899) 320 789 +87.7% (430) NM (1,010) (311) (698) -224.5%
- Due from related companies (25) 79 (32) (104) NM 7 +23.0% 55 (43) 97 NM
- Inventories (95) 574 307 (669) NM (402) NM 479 233 246 +105.5%
- Other current assets (44) (416) 89 372 +89.4% (133) NM (460) 394 (854) NM
- Other non-current assets (1) 11 (14) (12) NM 14 +96.3% 11 (18) 29 NM
- Trade accounts payable 399 (462) (1,018) 861 NM 1,417 NM (63) (1,861) 1,798 +96.6%
- Due to related companies (14) 56 51 (71) NM (65) NM 42 (49) 91 NMp ( ) ( ) ( ) ( )
- Accrued expenses and other current liabilites 1,702 279 1,546 1,422 +508.9% 155 +10.0% 1,981 2,341 (360) -15.4%
- Other non-current liabilities (23) 3 (5) (25) NM (18) -354.4% (20) (17) (3) -19.3%
- Regulatory costs - - - - NM - NM - - - NM
- Deferred Income tax assets - - - - NM - NM - - - NM
- Deferred Income tax liabitities - - - - NM - NM - - - NM
- Liability under concession minimum payment (162) (162) (145) - +0.0% (17) -11.4% (323) (290) (33) -11.4%
Cash received from operations 3,175 1,180 2,739 1,995 +169.1% 436 +15.9% 4,355 4,040 315 +7.8%
Less: Interest paid (962) (513) (1,016) (449) -87.5% 53 +5.3% (1,475) (1,799) 323 +18.0%
Income tax paid (70) (73) (94) 3 +4.5% 24 +25.7% (142) (191) 48 +25.4%
Add: Interest received 4 9 7 (5) -56.7% (3) -42.8% 13 14 (1) -5.9%Add: Interest received 4 9 7 (5) 56.7% (3) 42.8% 13 14 (1) 5.9%
Withhoding income tax retund 3 62 - (59) -95.2% 3 NM 65 - 65 NM
Cash flows from operation 2,150 665 1,637 1,485 +223.1% 513 +31.4% 2,815 2,064 751 +36.4%
Capex (913) (802) (681) - +0.0% 231 +33.9% (1,715) (1,615) 99 +6.2%
Free Cash Flow 1,237 (137) 955 1,374 NM 282 +29.5% 1,101 449 652 +145.1%

Free Cash Flow - TrueOnline A11
2Q10 1Q10 2Q09 Change QoQ Change YoY 1H10 1H09 Change YoY Amt. % Amt. % Amt. %
Cash flows from operating activities:Cash flows from operating activities:Cash received from operations (before working capital) 1,943 2,605 2,737 (662) -25.4% (793) -29.0% 4,548 5,519 (971) -17.6%
Changes in operating working capital (695) (1,238) (338) 543 +43.9% (357) -105.5% (1,933) (448) (1,485) -331.8%
- Trade accounts receivable (1,141) 295 585 (1,436) NM (1,725) NM (846) 943 (1,789) NM
- Short term investment - trading securities - - - - NM - NM - - - NMg
- Inventories (217) (182) (281) (35) -19.2% 64 +22.8% (398) (665) 267 +40.2%
- Other current assets 142 16 81 126 +813.2% 61 +75.1% 158 (66) 223 NM
- Other non-current assets (278) 31 (28) (309) NM (250) -893.0% (247) 12 (259) NM
- Trade accounts payable 265 785 (678) (520) -66.2% 943 NM 1,051 (8) 1,059 NM
- Investments in film and program rights - - - - NM - NM - - - NM Investments in film and program rights NM NM NM
- Accrued expenses and other current liabilites 140 (2,037) (135) 2,177 NM 275 NM (1,897) (988) (909) -92.0%
- Other non-current liabilities 393 (146) 117 538 NM 275 +234.6% 247 325 (78) -23.9%
Cash received from operations 1,248 1,367 2,398 (119) -8.7% (1,150) -48.0% 2,615 5,071 (2,456) -48.4%
Less: Interest paid (820) (491) (919) (329) -67.0% 98 +10.7% (1,312) (1,481) 169 +11.4%
Income tax paid (189) (309) (269) 120 +38 8% 80 +29 8% (499) (573) 75 +13 0% Income tax paid (189) (309) (269) 120 +38.8% 80 +29.8% (499) (573) 75 +13.0%
Add: Interest received 8 3 21 5 +161.3% (13) -63.0% 11 29 (18) -62.9%
Cash flows from operation 246 569 1,231 (323) -56.7% (985) -80.0% 816 3,046 (2,230) -73.2%
Capex (597) (689) (557) - +0.0% 40 +7.2% (1,286) (1,024) 262 +25.6%
Free Cash Flow (350) (120) 675 (231) -193.0% (1,025) NM (470) 2,022 (2,492) NM

Free Cash Flow - TrueVisions A12
2Q10 1Q10 2Q09 Change QoQ Change YoY 1H10 1H09 Change YoY Amt. % Amt. % Amt. %
Cash flows from operating activities:p gCash received from operations (before working capital) 1,114 456 628 658 +144.2% 486 +77.5% 1,570 1,275 295 +23.1%
Changes in operating working capital (382) (194) (2) (188) -96.8% (381) NM (577) (345) (232) -67.3%
- Trade accounts receivable (34) (26) 78 (8) -31.3% (112) NM (60) 57 (117) NM
- Due from related companies (9) (96) 175 87 +90.6% (184) NM (105) 18 (123) NM
- Loans to from related company (interest (rece - - - - NM - NM - - - NM
- Inventories (25) 1 6 (26) NM (31) NM (24) 44 (68) NM
- Other current assets (342) 191 37 (533) NM (380) NM (152) (16) (136) -863.1%
- Other non-current assets (1,023) 7 (2) (1,030) NM (1,022) NM (1,017) 9 (1,026) NM
- Trade accounts payable 667 (358) 435 1,025 NM 231 +53.2% 309 42 267 +642.7%p y ( ) ,
- Due to related companies 498 10 (73) 488 NM 571 NM 509 (57) 565 NM
- Accrued expenses and other current liabilites (157) 35 (661) (192) NM 505 +76.3% (121) (422) 300 +71.3%
- Other non-current liabilities 43 42 2 0 +1.0% 40 NM 85 (22) 106 NM
- Amortised deposit customer - - - - NM - NM - - - NM
- DTA from forward contract - - - - NM - NM - - - NM DTA from forward contract NM NM NM
Cash received from operations 732 262 626 470 +179.4% 106 +16.9% 994 931 63 +6.8%
Less: Interest paid (73) (0) (0) (73) NM (73) NM (73) (2) (72) -4681.1%
Income tax paid (224) (0) (157) (224) NM (68) -43.0% (224) (157) (68) -43.0%
Add: Interest received - - - - NM - NM - - - NM
Cash flows from operation 434 262 469 172 +65 9% (35) -7 4% 696 772 (76) -9 9%Cash flows from operation 434 262 469 172 +65.9% (35) 7.4% 696 772 (76) 9.9%
Capex (152) (133) (32) - +0.0% 120 +372.6% (285) (74) 211 +285.3%
Free Cash Flow 283 129 437 154 +119.6% (154) -35.3% 411 698 (287) -41.1%

Impact to P&L from TVS refinancing/reorganization A13
1. Loss from heding unwinding cost and FX TrueOnline TrueVisions ConsolidatedHedging unwinding cost (included in financial cost) (617.8) (260.8) (878.6) Realized FX losses from loan repayment (included in FX gain/loss) (517.0) (311.7) (828.7) Total expenses (1,134.8) (572.5) (1,707.3)
2. Gain from deferred income taxgTotal deferred income tax gain 1,015.8 1,015.8
3. Net impact (1,134.8) 443.3 (691.5)
Net impact to Group P&L was a Bt 691.5 mn loss
3. Net impact (1,134.8) 443.3 (691.5)
Bt 1.1 bn net loss at TrueOnlineBt 443 mn net gain at TrueVisions
Normalized as one off items