t 1. incidence rates1 of nonfatal occupational injuries ... · pdf file18,727.9 4.2 2.3 1.2...
TRANSCRIPT

TABLE 1. Incidence rates1 of nonfatal occupational injuries and illnesses by industry and case types, 2010
Industry2 NAICScode3
2010Annualaverage
employment4(thousands)
Totalrecordable
cases
Cases with days away from work,job transfer, or restriction
Otherrecordable
casesTotalCases
with daysaway from
work5
Caseswith job
transfer orrestriction
All industries including State and local government6 ............. 124,868.5 3.8 1.9 1.2 0.8 1.9
Private industry6 .......................................................................... 106,444.4 3.5 1.8 1.1 .8 1.7
Goods producing6 ........................................................................... 18,727.9 4.2 2.3 1.2 1.1 1.9
Natural resources and mining6,7 ........................................................ 1,579.8 3.7 2.2 1.4 .8 1.5
Agriculture, forestry, fishing and hunting6 .................................................. 11 967.8 4.8 2.7 1.7 1.1 2.0Crop production6,8 ......................................................................................... 111 416.0 4.6 2.7 1.6 1.1 1.9
Oilseed and grain farming6 ........................................................................ 1111 16.4 4.7 2.6 1.3 1.3 2.1Vegetable and melon farming6 .................................................................. 1112 83.5 4.2 2.4 1.6 .8 1.8Fruit and tree nut farming6 ......................................................................... 1113 155.1 4.8 2.6 1.7 .9 2.2Greenhouse, nursery, and floriculture production6 .................................... 1114 125.2 5.2 3.2 1.5 1.7 1.9Other crop farming6,8 ................................................................................. 1119 35.9 3.1 1.9 1.4 .4 1.3
Animal production6,8 ...................................................................................... 112 158.6 5.2 2.8 2.0 .9 2.4Cattle ranching and farming6 ..................................................................... 1121 88.5 4.4 2.3 1.9 .4 2.0
Beef cattle ranching and farming, including feedlots6 ............................ 11211 23.3 5.5 2.6 2.1 .5 2.9Dairy cattle and milk production6 ........................................................... 11212 65.2 4.0 2.2 1.8 .4 1.8
Poultry and egg production6 ...................................................................... 1123 35.2 5.8 3.2 1.6 1.6 2.6Sheep and goat farming6 ........................................................................... 1124 .6 – – – – –Animal aquaculture6,8 ................................................................................ 1125 3.7 6.8 2.5 .9 – 4.4Other animal production6 ........................................................................... 1129 9.6 4.8 2.5 1.0 1.6 2.3
Forestry and logging ...................................................................................... 113 55.9 3.6 2.0 1.8 .2 1.7Logging ...................................................................................................... 1133 49.5 3.9 2.2 2.0 .2 1.7
Support activities for agriculture and forestry ................................................ 115 328.9 4.9 2.9 1.6 1.3 2.0Support activities for crop production ........................................................ 1151 286.5 4.7 2.8 1.4 1.4 1.9
Support activities for crop production .................................................... 11511 286.5 4.7 2.8 1.4 1.4 1.9Cotton ginning ................................................................................... 115111 6.8 4.5 1.5 1.1 – 3.0Soil preparation, planting, and cultivating .......................................... 115112 22.8 3.3 1.8 1.3 .5 1.5Crop harvesting, primarily by machine .............................................. 115113 9.5 2.5 1.6 – .9 .9Postharvest crop activities (except cotton ginning) ........................... 115114 77.7 6.6 4.2 1.8 2.4 2.4Farm labor contractors and crew leaders .......................................... 115115 154.7 4.1 2.3 1.2 1.1 1.8Farm management services .............................................................. 115116 14.9 3.0 1.9 .8 1.2 1.1
Support activities for animal production ..................................................... 1152 27.9 7.5 4.3 3.8 .6 3.2Support activities for forestry ..................................................................... 1153 14.5 3.3 1.2 .8 .4 2.1
Mining7 ....................................................................................................... 21 612.0 2.3 1.4 1.0 .4 .9Oil and gas extraction .................................................................................... 211 148.2 1.2 .7 .5 .2 .5
Oil and gas extraction ................................................................................ 2111 148.2 1.2 .7 .5 .2 .5
See footnotes at end of table.

TABLE 1. Incidence rates1 of nonfatal occupational injuries and illnesses by industry and case types, 2010 — Continued
Industry2 NAICScode3
2010Annualaverage
employment4(thousands)
Totalrecordable
cases
Cases with days away from work,job transfer, or restriction
Otherrecordable
casesTotalCases
with daysaway from
work5
Caseswith job
transfer orrestriction
Oil and gas extraction ............................................................................ 21111 148.2 1.2 0.7 0.5 0.2 0.5Crude petroleum and natural gas extraction ..................................... 211111 144.2 1.2 .7 .5 .2 .5Natural gas liquid extraction .............................................................. 211112 4.0 1.6 .9 .9 – .6
Mining (except oil and gas)9 .......................................................................... 212 201.9 3.1 2.0 1.5 .5 1.1Coal mining9 .............................................................................................. 2121 80.1 3.9 2.6 2.3 .3 1.3
Coal mining9 .......................................................................................... 21211 80.1 3.9 2.6 2.3 .3 1.3Bituminous coal and lignite surface mining9 ...................................... 212111 35.9 1.8 1.2 1.1 .1 .6Bituminous coal underground mining9 ............................................... 212112 43.1 5.6 3.7 3.3 .4 1.9Anthracite mining9 ............................................................................. 212113 1.1 5.3 4.3 4.2 – –
Metal ore mining9 ....................................................................................... 2122 34.0 2.6 1.6 1.0 .6 1.0Iron ore mining9 ..................................................................................... 21221 4.7 2.0 1.1 .8 .4 .9Gold ore and silver ore mining9 ............................................................. 21222 12.4 2.6 1.5 .8 .7 1.1
Gold ore mining9 ................................................................................ 212221 11.3 2.2 1.2 .7 .5 1.0Silver ore mining9 .............................................................................. 212222 1.1 7.7 5.4 1.8 3.5 2.3
Copper, nickel, lead, and zinc mining9 .................................................. 21223 12.5 2.5 1.7 1.0 .7 .8Lead ore and zinc ore mining9 ........................................................... 212231 1.8 4.0 2.8 1.5 1.2 1.2Copper ore and nickel ore mining9 .................................................... 212234 10.7 2.3 1.6 .9 .6 .7
Other metal ore mining9 ......................................................................... 21229 4.3 3.6 2.4 1.8 .6 1.2Uranium-radium-vanadium ore mining9 ............................................. 212291 .9 – – – – –All other metal ore mining9 ................................................................ 212299 3.5 3.8 2.5 1.9 .6 1.3
Nonmetallic mineral mining and quarrying9 ............................................... 2123 87.9 2.5 1.6 .9 .7 .8Stone mining and quarrying9 ................................................................. 21231 41.3 2.5 1.7 1.0 .7 .9
Dimension stone mining and quarrying9 ............................................ 212311 7.2 2.8 2.1 1.5 .6 .8Crushed and broken limestone mining and quarrying9 ...................... 212312 21.4 2.4 1.6 1.0 .6 .8Crushed and broken granite mining and quarrying9 .......................... 212313 5.0 2.1 1.3 .6 .7 .8Other crushed and broken stone mining and quarrying9 ................... 212319 7.6 2.7 1.8 .9 .8 1.0
Sand, gravel, clay, and ceramic and refractory minerals mining andquarrying9 ............................................................................................ 21232 34.7 2.4 1.5 .9 .7 .8Construction sand and gravel mining9 ............................................... 212321 25.4 2.4 1.6 .9 .6 .8Kaolin and ball clay mining9 ............................................................... 212324 2.6 1.8 1.3 .5 .8 .5Clay and ceramic and refractory minerals mining9 ............................ 212325 3.3 3.1 1.7 1.0 .7 1.4
Other nonmetallic mineral mining and quarrying9 .................................. 21239 11.9 2.6 1.7 .8 .9 .9Potash, soda, and borate mineral mining9 ......................................... 212391 3.7 2.7 1.6 .7 .9 1.1Phosphate rock mining9 ..................................................................... 212392 1.7 1.6 1.1 – .9 .5Other chemical and fertilizer mineral mining9 .................................... 212393 2.9 3.0 2.1 1.2 .8 1.0All other nonmetallic mineral mining9 ................................................ 212399 3.6 2.8 2.1 1.3 .8 .8
Support activities for mining .......................................................................... 213 261.8 2.2 1.4 .9 .5 .9Support activities for mining ...................................................................... 2131 261.8 2.2 1.4 .9 .5 .9
Support activities for mining .................................................................. 21311 261.8 2.2 1.4 .9 .5 .9Drilling oil and gas wells .................................................................... 213111 60.8 3.3 1.9 1.3 .7 1.3Support activities for oil and gas operations ...................................... 213112 188.5 1.9 1.2 .8 .4 .7
See footnotes at end of table.

TABLE 1. Incidence rates1 of nonfatal occupational injuries and illnesses by industry and case types, 2010 — Continued
Industry2 NAICScode3
2010Annualaverage
employment4(thousands)
Totalrecordable
cases
Cases with days away from work,job transfer, or restriction
Otherrecordable
casesTotalCases
with daysaway from
work5
Caseswith job
transfer orrestriction
Construction ........................................................................................ 5,701.5 4.0 2.1 1.5 0.6 1.9
Construction .............................................................................................. 23 5,701.5 4.0 2.1 1.5 .6 1.9Construction of buildings ............................................................................... 236 1,282.3 3.5 1.7 1.2 .5 1.8
Residential building construction ............................................................... 2361 617.1 4.2 2.1 1.7 .4 2.1Nonresidential building construction .......................................................... 2362 665.2 2.9 1.3 .8 .5 1.6
Heavy and civil engineering construction ...................................................... 237 827.5 3.8 2.2 1.3 .9 1.7Utility system construction ......................................................................... 2371 384.5 3.5 2.0 1.1 .9 1.5
Water and sewer line and related structures construction ..................... 23711 160.0 4.5 2.6 1.4 1.2 1.9Oil and gas pipeline and related structures construction ....................... 23712 91.9 1.7 1.1 .5 .6 .7Power and communication line and related structures construction ..... 23713 132.7 3.6 2.0 1.1 .9 1.6
Land subdivision ........................................................................................ 2372 55.7 1.9 .9 .7 .2 1.0Highway, street, and bridge construction .................................................. 2373 288.6 4.8 2.6 1.6 1.0 2.2Other heavy and civil engineering construction ......................................... 2379 98.7 3.2 1.9 1.2 .7 1.3
Specialty trade contractors ............................................................................ 238 3,591.8 4.3 2.3 1.7 .6 2.0Foundation, structure, and building exterior contractors ........................... 2381 714.0 5.2 3.1 2.2 .9 2.1
Poured concrete foundation and structure contractors .......................... 23811 152.0 4.5 2.6 1.7 .9 1.9Structural steel and precast concrete contractors ................................. 23812 69.0 5.1 2.8 1.8 1.1 2.3Framing contractors ............................................................................... 23813 59.5 5.8 3.7 2.7 1.0 2.2Masonry contractors .............................................................................. 23814 144.8 4.9 3.6 2.4 1.2 1.3Glass and glazing contractors ............................................................... 23815 52.1 5.8 2.9 2.1 .8 3.0Roofing contractors ............................................................................... 23816 164.5 5.9 3.3 2.4 .9 2.6Siding contractors .................................................................................. 23817 33.6 5.2 2.4 2.2 .2 2.8
Building equipment contractors ................................................................. 2382 1,671.3 4.2 2.1 1.5 .5 2.1Electrical contractors ............................................................................. 23821 735.5 3.7 1.9 1.4 .5 1.8Plumbing, heating, and air-conditioning contractors .............................. 23822 816.3 4.9 2.3 1.8 .6 2.5Other building equipment contractors .................................................... 23829 119.5 3.3 1.8 1.1 .6 1.5
Building finishing contractors ..................................................................... 2383 678.2 3.8 2.1 1.6 .5 1.7Drywall and insulation contractors ......................................................... 23831 217.4 5.0 2.7 1.8 .9 2.3Painting and wall covering contractors .................................................. 23832 173.1 2.8 1.8 1.5 .3 1.1Flooring contractors ............................................................................... 23833 63.9 – 2.5 2.1 .4 2.1Tile and terrazzo contractors ................................................................. 23834 44.8 1.5 .8 .5 .4 .7Finish carpentry contractors .................................................................. 23835 117.8 3.7 1.8 1.5 .3 1.9Other building finishing contractors ....................................................... 23839 61.2 3.7 2.2 1.6 .6 1.5
Other specialty trade contractors ............................................................... 2389 528.3 3.8 1.9 1.5 .4 1.9Site preparation contractors .................................................................. 23891 268.6 3.6 1.8 1.4 .4 1.8All other specialty trade contractors ...................................................... 23899 259.6 4.1 2.1 1.6 .5 2.0
See footnotes at end of table.

TABLE 1. Incidence rates1 of nonfatal occupational injuries and illnesses by industry and case types, 2010 — Continued
Industry2 NAICScode3
2010Annualaverage
employment4(thousands)
Totalrecordable
cases
Cases with days away from work,job transfer, or restriction
Otherrecordable
casesTotalCases
with daysaway from
work5
Caseswith job
transfer orrestriction
Manufacturing ...................................................................................... 11,446.6 4.4 2.4 1.1 1.3 2.0
Manufacturing ............................................................................................ 31-33 11,446.6 4.4 2.4 1.1 1.3 2.0Food manufacturing ....................................................................................... 311 1,441.9 5.8 3.7 1.4 2.3 2.0
Animal food manufacturing ........................................................................ 3111 51.6 4.5 2.6 1.5 1.1 1.9Animal food manufacturing .................................................................... 31111 51.6 4.5 2.6 1.5 1.1 1.9
Dog and cat food manufacturing ....................................................... 311111 20.1 4.2 2.5 1.1 1.4 1.7Other animal food manufacturing ...................................................... 311119 31.5 4.7 2.7 1.8 .9 2.0
Grain and oilseed milling ........................................................................... 3112 58.5 4.4 2.5 1.2 1.3 1.8Flour milling and malt manufacturing ..................................................... 31121 17.8 5.8 3.3 1.9 1.5 2.5
Flour milling ....................................................................................... 311211 12.7 5.3 3.2 1.6 1.6 2.1Rice milling ........................................................................................ 311212 4.3 6.7 3.2 2.2 1.0 3.5
Starch and vegetable fats and oils manufacturing ................................. 31122 26.5 2.6 1.5 .6 .9 1.1Wet corn milling ................................................................................. 311221 12.2 1.7 .8 .3 .5 .9Soybean processing .......................................................................... 311222 6.2 3.7 1.8 .5 1.3 1.9Fats and oils refining and blending .................................................... 311225 6.1 2.9 2.0 .9 1.1 .9
Breakfast cereal manufacturing ............................................................. 31123 14.2 5.9 3.5 1.6 1.8 2.4Sugar and confectionery product manufacturing ....................................... 3113 66.2 5.8 3.0 1.4 1.6 2.8
Sugar manufacturing ............................................................................. 31131 12.0 10.1 3.6 2.1 1.5 6.5Sugarcane mills ................................................................................. 311311 3.1 7.0 3.0 1.9 1.1 4.1Cane sugar refining ........................................................................... 311312 2.8 5.5 3.6 1.3 2.3 1.9
Chocolate and confectionery manufacturing from cacao beans ............ 31132 6.9 3.8 2.3 .8 1.6 1.5Confectionery manufacturing from purchased chocolate ...................... 31133 31.1 5.3 3.4 1.3 2.0 2.0Nonchocolate confectionery manufacturing .......................................... 31134 16.3 4.0 2.1 1.1 1.0 1.9
Fruit and vegetable preserving and specialty food manufacturing ............ 3114 174.5 5.2 3.1 1.5 1.7 2.0Frozen food manufacturing .................................................................... 31141 88.2 4.9 3.1 1.5 1.6 1.8
Frozen fruit, juice, and vegetable manufacturing ............................... 311411 31.9 5.9 3.4 1.8 1.6 2.5Frozen specialty food manufacturing ................................................. 311412 56.3 4.3 2.9 1.3 1.6 1.4
Fruit and vegetable canning, pickling, and drying ................................. 31142 86.3 5.5 3.2 1.5 1.7 2.3Fruit and vegetable canning .............................................................. 311421 64.1 5.4 3.1 1.5 1.7 2.3Specialty canning .............................................................................. 311422 12.1 5.8 3.7 1.7 2.0 2.2Dried and dehydrated food manufacturing ........................................ 311423 10.1 5.8 3.2 1.4 1.8 2.6
Dairy product manufacturing ..................................................................... 3115 130.3 6.3 4.0 1.8 2.2 2.3Dairy product (except frozen) manufacturing ........................................ 31151 109.9 6.6 4.3 1.9 2.4 2.4
Fluid milk manufacturing .................................................................... 311511 53.0 7.5 5.0 2.3 2.7 2.5Cheese manufacturing ...................................................................... 311513 40.6 6.5 4.0 1.7 2.3 2.5Dry, condensed, and evaporated dairy product manufacturing ......... 311514 14.1 4.4 2.7 1.1 1.6 1.7
Ice cream and frozen dessert manufacturing ........................................ 31152 20.4 4.3 2.6 1.1 1.5 1.7Animal slaughtering and processing .......................................................... 3116 487.7 6.9 4.7 1.2 3.5 2.3
Animal slaughtering and processing ...................................................... 31161 487.7 6.9 4.7 1.2 3.5 2.3
See footnotes at end of table.

TABLE 1. Incidence rates1 of nonfatal occupational injuries and illnesses by industry and case types, 2010 — Continued
Industry2 NAICScode3
2010Annualaverage
employment4(thousands)
Totalrecordable
cases
Cases with days away from work,job transfer, or restriction
Otherrecordable
casesTotalCases
with daysaway from
work5
Caseswith job
transfer orrestriction
Animal (except poultry) slaughtering ................................................. 311611 145.5 8.8 6.0 1.4 4.5 2.8Meat processed from carcasses ........................................................ 311612 108.9 6.5 4.1 1.4 2.7 2.5Rendering and meat byproduct processing ....................................... 311613 8.5 6.5 3.9 1.9 2.0 2.6Poultry processing ............................................................................. 311615 224.9 5.9 4.1 .9 3.2 1.8
Seafood product preparation and packaging ............................................. 3117 36.7 6.0 3.7 2.4 1.3 2.3Seafood product preparation and packaging ......................................... 31171 36.7 6.0 3.7 2.4 1.3 2.3
Seafood canning ................................................................................ 311711 3.7 8.7 4.2 3.0 1.2 4.5Fresh and frozen seafood processing ............................................... 311712 33.0 5.8 3.7 2.4 1.3 2.1
Bakeries and tortilla manufacturing ........................................................... 3118 273.7 4.4 3.0 1.4 1.6 1.4Bread and bakery product manufacturing ............................................. 31181 202.3 4.2 2.9 1.4 1.5 1.3
Retail bakeries ................................................................................... 311811 64.5 1.7 .9 .6 .3 .8Commercial bakeries ......................................................................... 311812 127.1 5.1 3.6 1.7 1.8 1.5
Cookie, cracker, and pasta manufacturing ............................................ 31182 53.9 5.1 3.3 1.3 2.0 1.8Cookie and cracker manufacturing .................................................... 311821 31.6 5.0 3.4 1.6 1.8 1.6Flour mixes and dough manufacturing from purchased flour ............ 311822 15.2 6.0 4.0 1.0 3.0 2.0Dry pasta manufacturing ................................................................... 311823 7.1 3.5 1.4 .9 .5 2.1
Tortilla manufacturing ............................................................................ 31183 17.4 4.7 3.1 1.4 1.7 1.6Other food manufacturing .......................................................................... 3119 162.6 5.2 3.4 1.6 1.8 1.9
Snack food manufacturing ..................................................................... 31191 46.4 5.3 3.3 1.5 1.8 2.0Roasted nuts and peanut butter manufacturing ................................ 311911 12.5 5.6 3.2 1.0 2.2 2.4Other snack food manufacturing ....................................................... 311919 33.9 5.2 3.4 1.6 1.7 1.9
Coffee and tea manufacturing ............................................................... 31192 14.3 4.8 2.9 1.3 1.6 2.0Flavoring syrup and concentrate manufacturing ................................... 31193 9.6 3.8 1.8 .9 .8 2.0Seasoning and dressing manufacturing ................................................ 31194 32.3 4.5 3.1 1.3 1.8 1.4
Mayonnaise, dressing, and other prepared sauce manufacturing ..... 311941 12.7 4.6 3.5 1.3 2.2 1.1Spice and extract manufacturing ....................................................... 311942 19.6 4.5 2.8 1.3 1.5 1.7
All other food manufacturing .................................................................. 31199 60.0 5.9 4.0 2.1 1.9 1.9Perishable prepared food manufacturing .......................................... 311991 34.6 7.1 5.0 2.6 2.4 2.2All other miscellaneous food manufacturing ...................................... 311999 25.4 4.4 2.8 1.5 1.3 1.6
Beverage and tobacco product manufacturing .............................................. 312 184.8 6.4 4.4 1.9 2.6 2.0Beverage manufacturing ........................................................................... 3121 167.2 6.8 4.7 1.9 2.8 2.0
Soft drink and ice manufacturing ........................................................... 31211 94.9 8.3 6.3 2.5 3.8 2.0Soft drink manufacturing .................................................................... 312111 74.5 8.6 6.6 2.6 4.0 2.0Bottled water manufacturing .............................................................. 312112 13.2 7.2 5.5 2.2 3.3 1.7Ice manufacturing .............................................................................. 312113 7.2 6.2 4.4 2.2 2.1 1.8
Breweries ............................................................................................... 31212 24.6 3.7 1.6 .9 .7 2.0Wineries ................................................................................................. 31213 40.6 4.8 2.5 1.2 1.3 2.3Distilleries .............................................................................................. 31214 7.2 4.5 2.3 .8 1.5 2.2
Tobacco manufacturing ............................................................................. 3122 17.6 3.0 1.6 1.1 .5 1.4Tobacco stemming and redrying ........................................................... 31221 2.9 5.0 2.3 1.4 .9 2.6Tobacco product manufacturing ............................................................ 31222 14.7 2.8 1.5 1.0 .5 1.3
See footnotes at end of table.

TABLE 1. Incidence rates1 of nonfatal occupational injuries and illnesses by industry and case types, 2010 — Continued
Industry2 NAICScode3
2010Annualaverage
employment4(thousands)
Totalrecordable
cases
Cases with days away from work,job transfer, or restriction
Otherrecordable
casesTotalCases
with daysaway from
work5
Caseswith job
transfer orrestriction
Cigarette manufacturing .................................................................... 312221 9.2 2.5 1.3 1.1 0.2 1.2Other tobacco product manufacturing ............................................... 312229 5.5 3.2 1.9 .9 .9 1.3
Textile mills .................................................................................................... 313 119.0 3.3 1.7 .7 1.0 1.5Fiber, yarn, and thread mills ...................................................................... 3131 29.1 2.6 1.4 .6 .8 1.2
Fiber, yarn, and thread mills .................................................................. 31311 29.1 2.6 1.4 .6 .8 1.2Yarn spinning mills ............................................................................ 313111 20.7 2.6 1.3 .4 1.0 1.3Yarn texturizing, throwing, and twisting mills ..................................... 313112 7.1 1.8 1.1 .7 .5 .7Thread mills ....................................................................................... 313113 1.4 6.7 3.6 3.6 – 3.1
Fabric mills ................................................................................................ 3132 53.5 3.5 1.6 .7 .9 1.9Broadwoven fabric mills ......................................................................... 31321 28.3 3.0 1.5 .5 1.0 1.5Narrow fabric mills and schiffli machine embroidery ............................. 31322 7.3 3.1 1.7 1.3 .4 1.4
Narrow fabric mills ............................................................................. 313221 6.8 2.9 1.6 1.2 .4 1.3Schiffli machine embroidery .............................................................. 313222 .5 5.2 – – – –
Nonwoven fabric mills ............................................................................ 31323 11.2 5.0 1.9 .6 1.2 3.2Knit fabric mills ...................................................................................... 31324 6.7 3.4 1.2 .7 .5 2.2
Weft knit fabric mills ........................................................................... 313241 2.9 2.3 1.3 1.0 – 1.0Other knit fabric and lace mills .......................................................... 313249 3.8 4.3 1.1 .5 .6 3.2
Textile and fabric finishing and fabric coating mills ................................... 3133 36.4 3.5 2.3 1.0 1.3 1.3Textile and fabric finishing mills ............................................................. 31331 29.7 2.7 1.8 .7 1.1 .9
Broadwoven fabric finishing mills ...................................................... 313311 16.0 2.9 1.9 1.0 1.0 .9Textile and fabric finishing (except broadwoven fabric) mills ............ 313312 13.7 2.4 1.6 .3 1.3 .8
Fabric coating mills ................................................................................ 31332 6.7 7.1 4.4 2.1 2.2 2.8Textile product mills8 ..................................................................................... 314 120.3 3.1 1.9 .9 1.0 1.2
Textile furnishings mills ............................................................................. 3141 58.3 2.2 1.4 .4 1.1 .8Carpet and rug mills .............................................................................. 31411 35.0 2.5 1.6 .3 1.3 .9Curtain and linen mills ........................................................................... 31412 23.4 1.8 1.1 .4 .7 .7
Curtain and drapery mills ................................................................... 314121 9.7 1.1 .8 .5 .4 .2Other household textile product mills ................................................ 314129 13.7 2.3 1.3 .4 .9 1.0
Other textile product mills8 ......................................................................... 3149 62.0 4.0 2.4 1.5 .9 1.6Textile bag and canvas mills ................................................................. 31491 24.6 3.9 2.3 1.8 .6 1.6
Textile bag mills ................................................................................. 314911 6.7 3.3 1.9 1.5 .3 1.4Canvas and related product mills ...................................................... 314912 17.9 4.2 2.5 1.9 .7 1.6
All other textile product mills8 ................................................................ 31499 37.4 4.1 2.5 1.4 1.1 1.7Rope, cordage, and twine mills ......................................................... 314991 3.7 8.4 5.5 3.0 2.6 2.8All other miscellaneous textile product mills8 ..................................... 314999 31.0 3.6 2.1 1.2 .9 1.5
Apparel manufacturing8 ................................................................................. 315 160.2 3.0 1.5 .7 .8 1.5Apparel knitting mills .................................................................................. 3151 19.4 2.8 1.3 .6 .7 1.5
Hosiery and sock mills ........................................................................... 31511 11.3 3.4 1.7 .9 .9 1.6Sheer hosiery mills ............................................................................ 315111 4.3 2.8 1.1 .5 .6 1.7Other hosiery and sock mills ............................................................. 315119 7.1 3.8 2.1 1.1 1.0 1.6
Other apparel knitting mills .................................................................... 31519 8.1 1.9 .7 – .5 1.2
See footnotes at end of table.

TABLE 1. Incidence rates1 of nonfatal occupational injuries and illnesses by industry and case types, 2010 — Continued
Industry2 NAICScode3
2010Annualaverage
employment4(thousands)
Totalrecordable
cases
Cases with days away from work,job transfer, or restriction
Otherrecordable
casesTotalCases
with daysaway from
work5
Caseswith job
transfer orrestriction
Outerwear knitting mills ..................................................................... 315191 6.3 2.1 0.7 – 0.4 1.3Cut and sew apparel manufacturing8 ........................................................ 3152 126.5 2.8 1.4 .6 .8 1.3
Cut and sew apparel contractors8 ......................................................... 31521 47.4 2.4 1.5 .4 1.0 1.0Men’s and boys’ cut and sew apparel contractors8 ........................... 315211 9.0 3.8 2.5 1.6 .9 1.3
Men’s and boys’ cut and sew apparel manufacturing ............................ 31522 29.4 3.3 1.5 .9 .6 1.8Men’s and boys’ cut and sew suit, coat, and overcoatmanufacturing .................................................................................. 315222 8.0 3.6 1.8 1.4 .4 1.8
Men’s and boys’ cut and sew work clothing manufacturing ............... 315225 7.1 2.7 1.6 .9 .7 1.1Men’s and boys’ cut and sew other outerwear manufacturing .......... 315228 6.6 2.9 1.4 .5 .9 1.5
Women’s and girls’ cut and sew apparel manufacturing ....................... 31523 34.1 2.6 1.4 .7 .7 1.2Women’s and girls’ cut and sew lingerie, loungewear, andnightwear manufacturing ................................................................. 315231 1.9 7.5 3.5 1.0 2.4 4.0
Women’s and girls’ cut and sew dress manufacturing ...................... 315233 7.4 .8 .6 .5 – .2Women’s and girls’ cut and sew suit, coat, tailored jacket, and skirtmanufacturing .................................................................................. 315234 2.2 – – – – –
Women’s and girls’ cut and sew other outerwear manufacturing ...... 315239 14.4 3.8 1.7 .5 1.2 2.1Other cut and sew apparel manufacturing ............................................. 31529 15.6 3.0 1.3 .6 .7 1.7
All other cut and sew apparel manufacturing .................................... 315299 13.8 3.2 1.4 .6 .8 1.8Apparel accessories and other apparel manufacturing ............................. 3159 14.3 5.4 2.0 1.3 .7 3.4
Apparel accessories and other apparel manufacturing ......................... 31599 14.3 5.4 2.0 1.3 .7 3.4Glove and mitten manufacturing ........................................................ 315992 2.2 8.8 3.8 2.2 1.6 5.0Other apparel accessories and other apparel manufacturing ............ 315999 6.5 2.4 1.1 .9 – 1.3
Leather and allied product manufacturing ..................................................... 316 27.3 5.0 2.6 .9 1.7 2.4Footwear manufacturing ............................................................................ 3162 12.6 5.6 2.9 .8 2.1 2.8
Footwear manufacturing ........................................................................ 31621 12.6 5.6 2.9 .8 2.1 2.8Rubber and plastics footwear manufacturing .................................... 316211 – 4.0 2.6 .9 1.7 1.4Men’s footwear (except athletic) manufacturing ................................ 316213 5.4 7.6 3.7 .8 2.9 3.9Other footwear manufacturing ........................................................... 316219 2.6 3.6 2.6 .9 1.7 1.1
Other leather and allied product manufacturing ........................................ 3169 10.7 2.4 1.2 .7 .5 1.2Other leather and allied product manufacturing .................................... 31699 10.7 2.4 1.2 .7 .5 1.2
Luggage manufacturing ..................................................................... 316991 3.3 1.6 1.0 .7 – .6Women’s handbag and purse manufacturing .................................... 316992 1.4 3.9 1.8 – 1.5 2.1All other leather good and allied product manufacturing ................... 316999 4.9 2.6 1.4 1.0 .5 1.2
Wood product manufacturing ........................................................................ 321 343.5 6.2 3.4 1.9 1.5 2.8Sawmills and wood preservation ............................................................... 3211 82.4 6.7 3.8 2.5 1.3 2.9
Sawmills and wood preservation ........................................................... 32111 82.4 6.7 3.8 2.5 1.3 2.9Sawmills ............................................................................................ 321113 73.6 6.9 3.8 2.5 1.3 3.1Wood preservation ............................................................................ 321114 8.8 5.6 4.0 2.4 1.6 1.6
Veneer, plywood, and engineered wood product manufacturing .............. 3212 64.2 4.7 2.6 1.4 1.2 2.1Veneer, plywood, and engineered wood product manufacturing .......... 32121 64.2 4.7 2.6 1.4 1.2 2.1
Hardwood veneer and plywood manufacturing ................................. 321211 14.5 5.1 3.1 1.6 1.5 2.0
See footnotes at end of table.

TABLE 1. Incidence rates1 of nonfatal occupational injuries and illnesses by industry and case types, 2010 — Continued
Industry2 NAICScode3
2010Annualaverage
employment4(thousands)
Totalrecordable
cases
Cases with days away from work,job transfer, or restriction
Otherrecordable
casesTotalCases
with daysaway from
work5
Caseswith job
transfer orrestriction
Softwood veneer and plywood manufacturing ................................... 321212 13.8 3.5 2.1 0.8 1.4 1.3Engineered wood member (except truss) manufacturing .................. 321213 4.2 2.4 2.1 – 2.1 –Truss manufacturing .......................................................................... 321214 19.3 7.3 3.7 2.5 1.3 3.5Reconstituted wood product manufacturing ...................................... 321219 12.4 2.7 1.2 .9 .3 1.5
Other wood product manufacturing ........................................................... 3219 196.9 6.5 3.4 1.8 1.6 3.1Millwork .................................................................................................. 32191 94.6 5.8 2.9 1.4 1.5 2.9
Wood window and door manufacturing ............................................. 321911 46.8 5.5 2.5 1.1 1.4 3.1Cut stock, resawing lumber, and planing ........................................... 321912 11.7 5.8 2.9 1.8 1.1 2.9Other millwork (including flooring) ..................................................... 321918 36.0 6.1 3.5 1.7 1.8 2.6
Wood container and pallet manufacturing ............................................. 32192 50.1 7.1 4.4 2.6 1.8 2.7All other wood product manufacturing ............................................... 32199 52.2 7.2 3.4 1.7 1.7 3.8Manufactured home (mobile home) manufacturing ........................... 321991 19.4 7.9 4.3 1.9 2.5 3.6Prefabricated wood building manufacturing ...................................... 321992 13.8 7.0 3.2 2.0 1.2 3.8All other miscellaneous wood product manufacturing ....................... 321999 19.0 6.6 2.6 1.4 1.2 4.0
Paper manufacturing ..................................................................................... 322 390.7 3.4 2.0 1.0 1.0 1.4Pulp, paper, and paperboard mills ............................................................. 3221 110.2 2.5 1.4 .9 .5 1.2
Pulp mills ............................................................................................... 32211 6.0 2.2 1.2 .7 .5 1.0Paper mills ............................................................................................. 32212 74.1 2.7 1.5 1.0 .5 1.3
Paper (except newsprint) mills .......................................................... 322121 66.2 2.7 1.5 1.0 .5 1.3Newsprint mills .................................................................................. 322122 7.9 2.6 1.4 .9 .5 1.2
Paperboard mills .................................................................................... 32213 30.1 2.1 1.1 .8 .3 1.0Converted paper product manufacturing ................................................... 3222 280.5 3.7 2.2 1.0 1.2 1.5
Paperboard container manufacturing .................................................... 32221 147.2 3.7 2.2 .9 1.2 1.5Corrugated and solid fiber box manufacturing ................................... 322211 92.8 3.6 2.2 .9 1.3 1.4Folding paperboard box manufacturing ............................................. 322212 28.9 4.0 2.2 1.3 .9 1.8Setup paperboard box manufacturing ............................................... 322213 3.7 3.3 1.4 1.0 – 1.9Fiber can, tube, drum, and similar products manufacturing .............. 322214 9.0 3.1 1.3 .8 .5 1.8Nonfolding sanitary food container manufacturing ............................ 322215 12.8 4.0 2.4 .8 1.5 1.6
Paper bag and coated and treated paper manufacturing ...................... 32222 61.5 4.1 2.6 1.3 1.3 1.5Coated and laminated packaging paper manufacturing .................... 322221 13.8 3.7 2.6 .8 1.8 1.1Coated and laminated paper manufacturing ..................................... 322222 27.9 4.5 2.6 1.7 .9 1.9Coated paper bag and pouch manufacturing .................................... 322223 7.3 3.9 2.2 1.1 1.1 1.7Uncoated paper and multiwall bag manufacturing ............................ 322224 9.3 3.8 2.5 1.0 1.4 1.3Laminated aluminum foil manufacturing for flexible packaging uses 322225 1.5 4.6 2.9 1.4 1.5 1.7
Stationery product manufacturing .......................................................... 32223 25.6 4.3 2.6 1.2 1.5 1.7Die-cut paper and paperboard office supplies manufacturing ........... 322231 8.7 3.8 1.9 .9 1.0 1.9Envelope manufacturing .................................................................... 322232 13.0 4.7 3.1 1.3 1.9 1.6Stationery, tablet, and related product manufacturing ....................... 322233 3.8 4.3 2.8 1.6 1.2 1.5Other converted paper product manufacturing .................................. 32229 46.3 3.1 1.9 1.0 .9 1.2Sanitary paper product manufacturing .............................................. 322291 31.1 2.6 1.7 .9 .7 1.0All other converted paper product manufacturing .............................. 322299 15.2 4.2 2.5 1.2 1.4 1.7
See footnotes at end of table.

TABLE 1. Incidence rates1 of nonfatal occupational injuries and illnesses by industry and case types, 2010 — Continued
Industry2 NAICScode3
2010Annualaverage
employment4(thousands)
Totalrecordable
cases
Cases with days away from work,job transfer, or restriction
Otherrecordable
casesTotalCases
with daysaway from
work5
Caseswith job
transfer orrestriction
Printing and related support activities ............................................................ 323 494.0 3.2 1.8 1.0 0.8 1.4Printing and related support activities ........................................................ 3231 494.0 3.2 1.8 1.0 .8 1.4
Printing .................................................................................................. 32311 459.7 3.2 1.8 1.0 .8 1.4Commercial lithographic printing ....................................................... 323110 186.3 3.9 2.2 1.3 .9 1.7Commercial gravure printing ............................................................. 323111 10.8 6.6 4.7 – 1.0 1.9Commercial flexographic printing ...................................................... 323112 33.1 2.9 1.7 .6 1.1 1.2Commercial screen printing ............................................................... 323113 59.6 2.2 1.3 .8 .5 .9Quick printing ..................................................................................... 323114 49.2 1.2 .5 .3 .3 .7Digital printing .................................................................................... 323115 24.1 2.1 1.0 .7 .4 1.1Manifold business forms printing ....................................................... 323116 25.3 3.3 1.5 .7 .9 1.8Books printing .................................................................................... 323117 23.8 3.1 1.9 .7 1.2 1.2Other commercial printing ................................................................. 323119 41.4 3.0 2.0 .9 1.0 1.1
Support activities for printing ................................................................. 32312 34.3 3.1 1.9 .8 1.0 1.2Tradebinding and related work .......................................................... 323121 17.1 3.9 1.7 1.0 .8 2.1Prepress services .............................................................................. 323122 17.2 2.3 2.0 .7 1.3 .4
Petroleum and coal products manufacturing ................................................. 324 109.9 1.5 .9 .6 .3 .6Petroleum and coal products manufacturing ............................................. 3241 109.9 1.5 .9 .6 .3 .6
Petroleum refineries .............................................................................. 32411 71.7 .9 .5 .3 .2 .4Asphalt paving, roofing, and saturated materials manufacturing ........... 32412 23.8 2.8 1.7 1.2 .5 1.0
Asphalt paving mixture and block manufacturing .............................. 324121 13.1 3.5 2.0 1.6 .4 1.5Asphalt shingle and coating materials manufacturing ....................... 324122 10.6 1.9 1.4 .8 .6 .5
Other petroleum and coal products manufacturing ............................... 32419 14.5 2.7 1.5 1.0 .5 1.1Petroleum lubricating oil and grease manufacturing ......................... 324191 9.4 2.9 1.3 .8 .6 1.5
Chemical manufacturing ................................................................................ 325 789.2 2.4 1.5 .7 .8 1.0Basic chemical manufacturing ................................................................... 3251 141.7 2.3 1.4 .7 .7 .9
Petrochemical manufacturing ................................................................ 32511 24.7 1.0 .5 .3 .2 .5Synthetic organic dye and pigment manufacturing ............................ 325132 5.6 2.6 2.1 1.1 .9 .5
Other basic inorganic chemical manufacturing ...................................... 32518 39.4 2.1 1.1 .7 .4 1.1Alkalies and chlorine manufacturing .................................................. 325181 8.3 2.0 1.3 .7 .6 .6All other basic inorganic chemical manufacturing ............................. 325188 29.4 2.0 .9 .6 .3 1.2
Other basic organic chemical manufacturing ........................................ 32519 46.6 2.5 1.4 .6 .8 1.2All other basic organic chemical manufacturing ................................ 325199 33.6 2.2 1.3 .6 .8 .8
Resin, synthetic rubber, and artificial and synthetic fibers and filamentsmanufacturing .......................................................................................... 3252 89.3 2.4 1.5 .8 .7 .9
Resin and synthetic rubber manufacturing ............................................ 32521 63.1 2.4 1.5 .8 .6 1.0Plastics material and resin manufacturing ......................................... 325211 52.3 2.2 1.4 .8 .6 .9Synthetic rubber manufacturing ......................................................... 325212 10.7 3.3 2.0 1.0 1.0 1.3
Artificial and synthetic fibers and filaments manufacturing .................... 32522 26.2 2.5 1.6 .8 .7 .9Cellulosic organic fiber manufacturing ............................................... 325221 9.2 2.2 1.1 .6 .5 1.1Noncellulosic organic fiber manufacturing ......................................... 325222 17.0 2.6 1.8 1.0 .8 .8
Pesticide, fertilizer, and other agricultural chemical manufacturing ........... 3253 35.8 2.4 1.2 .6 .6 1.2
See footnotes at end of table.

TABLE 1. Incidence rates1 of nonfatal occupational injuries and illnesses by industry and case types, 2010 — Continued
Industry2 NAICScode3
2010Annualaverage
employment4(thousands)
Totalrecordable
cases
Cases with days away from work,job transfer, or restriction
Otherrecordable
casesTotalCases
with daysaway from
work5
Caseswith job
transfer orrestriction
Fertilizer manufacturing ......................................................................... 32531 22.3 2.9 1.4 0.8 0.5 1.5Nitrogenous fertilizer manufacturing .................................................. 325311 7.2 2.7 .9 – .8 1.8Phosphatic fertilizer manufacturing ................................................... 325312 7.1 3.0 1.6 1.3 .4 1.4Fertilizer (mixing only) manufacturing ................................................ 325314 7.9 3.0 1.6 1.1 .5 1.4
Pesticide and other agricultural chemical manufacturing ...................... 32532 13.5 1.6 .8 .2 .6 .7Pharmaceutical and medicine manufacturing ............................................ 3254 282.6 2.0 1.3 .6 .7 .8
Pharmaceutical and medicine manufacturing ........................................ 32541 282.6 2.0 1.3 .6 .7 .8Medicinal and botanical manufacturing ............................................. 325411 20.0 2.9 1.7 .5 1.2 1.1Pharmaceutical preparation manufacturing ....................................... 325412 216.4 1.9 1.2 .6 .6 .7In-vitro diagnostic substance manufacturing ..................................... 325413 19.6 2.1 1.1 .3 .8 1.0Biological product (except diagnostic) manufacturing ....................... 325414 26.7 2.3 1.5 .6 .9 .9
Paint, coating, and adhesive manufacturing .............................................. 3255 55.3 3.1 1.7 1.0 .7 1.3Paint and coating manufacturing ........................................................... 32551 36.1 2.9 1.6 1.0 .7 1.2Adhesive manufacturing ........................................................................ 32552 19.2 3.5 1.9 1.2 .8 1.5
Soap, cleaning compound, and toilet preparation manufacturing ............. 3256 101.0 3.0 2.0 .8 1.1 1.1Soap and cleaning compound manufacturing ....................................... 32561 51.5 3.1 1.9 .8 1.0 1.3
Soap and other detergent manufacturing .......................................... 325611 24.1 2.7 1.7 .8 1.0 1.0Polish and other sanitation good manufacturing ............................... 325612 22.8 3.7 2.1 .9 1.1 1.6Surface active agent manufacturing .................................................. 325613 4.7 2.2 1.5 .5 1.1 .6
Toilet preparation manufacturing ........................................................... 32562 49.5 2.9 2.1 .9 1.2 .8Other chemical product and preparation manufacturing ........................... 3259 83.5 3.1 1.8 .8 1.1 1.3
Printing ink manufacturing ..................................................................... 32591 9.5 2.9 1.7 1.0 .8 1.1Explosives manufacturing ...................................................................... 32592 6.8 2.6 2.1 1.0 1.1 .5All other chemical product and preparation manufacturing ................... 32599 67.2 3.2 1.8 .7 1.1 1.4
Custom compounding of purchased resins ....................................... 325991 15.0 5.1 3.5 1.2 2.3 1.6Photographic film, paper, plate, and chemical manufacturing ........... 325992 18.8 2.1 1.2 .5 .7 .9All other miscellaneous chemical product and preparationmanufacturing .................................................................................. 325998 33.3 2.9 1.4 .6 .8 1.5
Plastics and rubber products manufacturing8 ................................................ 326 615.3 5.1 3.0 1.3 1.7 2.2Plastics product manufacturing8 ................................................................ 3261 496.3 5.1 2.9 1.3 1.6 2.2
Plastics packaging materials and unlaminated film and sheetmanufacturing ...................................................................................... 32611 80.8 4.0 2.5 1.1 1.4 1.5Plastics bag and pouch manufacturing .............................................. 326111 30.9 4.3 2.5 .9 1.6 1.8Plastics packaging film and sheet (including laminated)manufacturing .................................................................................. 326112 12.0 4.5 2.4 1.2 1.2 2.2
Unlaminated plastics film and sheet (except packaging)manufacturing .................................................................................. 326113 37.9 3.5 2.4 1.2 1.2 1.1
Plastics pipe, pipe fitting, and unlaminated profile shapemanufacturing ...................................................................................... 32612 46.3 4.2 2.4 1.0 1.3 1.9Unlaminated plastics profile shape manufacturing ............................ 326121 21.7 4.6 2.7 .8 1.9 1.9Plastics pipe and pipe fitting manufacturing ...................................... 326122 24.6 3.9 2.0 1.2 .8 1.8
See footnotes at end of table.

TABLE 1. Incidence rates1 of nonfatal occupational injuries and illnesses by industry and case types, 2010 — Continued
Industry2 NAICScode3
2010Annualaverage
employment4(thousands)
Totalrecordable
cases
Cases with days away from work,job transfer, or restriction
Otherrecordable
casesTotalCases
with daysaway from
work5
Caseswith job
transfer orrestriction
Laminated plastics plate, sheet (except packaging), and shapemanufacturing ...................................................................................... 32613 15.1 4.4 2.4 1.3 1.1 2.0
Polystyrene foam product manufacturing .............................................. 32614 25.2 4.1 2.3 1.2 1.1 1.8Urethane and other foam product (except polystyrene) manufacturing 32615 29.6 7.3 4.8 2.1 2.8 2.5Plastics bottle manufacturing ................................................................. 32616 32.2 3.0 1.9 1.0 .9 1.1Other plastics product manufacturing8 .................................................. 32619 267.1 5.8 3.1 1.3 1.7 2.7
Plastics plumbing fixture manufacturing ............................................ 326191 12.8 5.6 3.2 1.4 1.8 2.4Resilient floor covering manufacturing .............................................. 326192 4.5 6.2 3.5 1.4 2.2 2.6All other plastics product manufacturing8 .......................................... 326199 249.8 5.8 3.0 1.3 1.7 2.7
Rubber product manufacturing8 ................................................................. 3262 119.1 5.3 3.3 1.4 2.0 1.9Tire manufacturing ................................................................................. 32621 51.7 4.8 3.3 1.2 2.0 1.5
Tire manufacturing (except retreading) ............................................. 326211 45.2 4.7 3.2 1.2 2.0 1.6Tire retreading ................................................................................... 326212 6.5 5.5 4.2 1.7 2.5 1.3
Rubber and plastics hoses and belting manufacturing .......................... 32622 20.2 5.9 3.6 1.6 2.0 2.2Other rubber product manufacturing8 .................................................... 32629 47.1 5.5 3.3 1.4 1.9 2.3
Rubber product manufacturing for mechanical use ........................... 326291 24.3 5.6 3.0 1.6 1.3 2.7All other rubber product manufacturing8 ............................................ 326299 22.9 5.4 3.6 1.1 2.5 1.8
Nonmetallic mineral product manufacturing .................................................. 327 375.6 6.0 3.5 1.8 1.7 2.5Clay product and refractory manufacturing ............................................... 3271 40.6 5.8 3.6 1.7 1.9 2.2
Pottery, ceramics, and plumbing fixture manufacturing ......................... 32711 16.4 3.9 2.5 1.7 .8 1.4Vitreous china plumbing fixture and china and earthenwarebathroom accessories manufacturing .............................................. 327111 3.8 2.3 1.4 – 1.0 1.0
Vitreous china, fine earthenware, and other pottery productmanufacturing .................................................................................. 327112 7.3 3.3 1.9 1.6 .3 1.4
Porcelain electrical supply manufacturing ......................................... 327113 5.3 5.5 3.8 2.5 1.2 1.7Clay building material and refractories manufacturing .......................... 32712 24.2 7.0 4.3 1.8 2.5 2.7
Brick and structural clay tile manufacturing ....................................... 327121 7.1 6.3 3.3 1.2 2.0 3.0Ceramic wall and floor tile manufacturing .......................................... 327122 6.3 7.9 5.1 1.7 3.4 2.8Other structural clay product manufacturing ...................................... 327123 1.0 11.8 2.1 – – 9.7Clay refractory manufacturing ........................................................... 327124 4.4 7.0 5.1 3.9 1.2 2.0
Glass and glass product manufacturing .................................................... 3272 79.6 5.7 3.1 1.1 2.1 2.6Glass and glass product manufacturing ................................................ 32721 79.6 5.7 3.1 1.1 2.1 2.6
Flat glass manufacturing ................................................................... 327211 10.0 5.7 3.3 .9 2.3 2.4Other pressed and blown glass and glassware manufacturing ......... 327212 15.9 6.5 3.6 1.0 2.6 2.8Glass container manufacturing .......................................................... 327213 16.1 5.8 3.5 .9 2.6 2.3Glass product manufacturing made of purchased glass ................... 327215 37.6 5.4 2.7 1.2 1.5 2.6
Cement and concrete product manufacturing ........................................... 3273 175.9 6.7 4.0 2.1 1.9 2.7Ready-mix concrete manufacturing ....................................................... 32732 88.0 5.0 3.4 2.1 1.3 1.6Concrete pipe, brick, and block manufacturing ..................................... 32733 26.1 6.0 3.6 1.8 1.8 2.4
Concrete block and brick manufacturing ........................................... 327331 17.9 6.4 3.8 2.2 1.6 2.6Concrete pipe manufacturing ............................................................ 327332 8.1 5.1 3.2 .9 2.3 1.9
See footnotes at end of table.

TABLE 1. Incidence rates1 of nonfatal occupational injuries and illnesses by industry and case types, 2010 — Continued
Industry2 NAICScode3
2010Annualaverage
employment4(thousands)
Totalrecordable
cases
Cases with days away from work,job transfer, or restriction
Otherrecordable
casesTotalCases
with daysaway from
work5
Caseswith job
transfer orrestriction
Other concrete product manufacturing .................................................. 32739 47.8 9.7 5.5 2.3 3.2 4.2Lime and gypsum product manufacturing ................................................. 3274 13.8 2.3 1.2 1.0 .2 1.1
Gypsum product manufacturing ............................................................ 32742 9.8 2.6 1.3 1.2 .2 1.2Other nonmetallic mineral product manufacturing ..................................... 3279 65.7 5.6 3.0 1.8 1.2 2.6
Abrasive product manufacturing ............................................................ 32791 9.3 5.5 3.1 1.4 1.6 2.4All other nonmetallic mineral product manufacturing ............................. 32799 56.4 5.6 3.0 1.9 1.1 2.6
Cut stone and stone product manufacturing ...................................... 327991 23.2 5.3 3.7 2.5 1.2 1.7Ground or treated mineral and earth manufacturing ......................... 327992 6.0 3.2 2.2 1.5 .7 1.1Mineral wool manufacturing ............................................................... 327993 16.1 6.9 3.2 1.8 1.3 3.8All other miscellaneous nonmetallic mineral product manufacturing 327999 11.0 5.4 1.8 .9 .9 3.6
Primary metal manufacturing ......................................................................... 331 350.9 6.3 3.4 1.6 1.8 2.9Iron and steel mills and ferroalloy manufacturing ...................................... 3311 84.3 3.6 1.8 .8 1.0 1.9
Iron and steel mills and ferroalloy manufacturing .................................. 33111 84.3 3.6 1.8 .8 1.0 1.9Iron and steel mills ............................................................................. 331111 81.8 3.6 1.8 .8 1.0 1.8Electrometallurgical ferroalloy product manufacturing ....................... 331112 2.6 4.6 2.0 1.2 .9 2.6
Steel product manufacturing from purchased steel ................................... 3312 50.4 6.7 3.6 1.9 1.6 3.2Iron and steel pipe and tube manufacturing from purchased steel ........ 33121 22.7 8.0 3.9 2.1 1.8 4.1Rolling and drawing of purchased steel ................................................. 33122 27.7 5.6 3.3 1.8 1.5 2.3
Rolled steel shape manufacturing ..................................................... 331221 19.5 6.0 3.4 2.0 1.4 2.6Steel wire drawing ............................................................................. 331222 8.2 4.5 2.8 1.3 1.6 1.7
Alumina and aluminum production and processing ................................... 3313 52.8 4.6 2.6 1.3 1.4 2.0Alumina and aluminum production and processing ............................... 33131 52.8 4.6 2.6 1.3 1.4 2.0
Primary aluminum production ............................................................ 331312 8.3 3.3 1.9 .5 1.4 1.4Secondary smelting and alloying of aluminum .................................. 331314 4.7 7.2 4.5 3.0 1.6 2.7Aluminum sheet, plate, and foil manufacturing .................................. 331315 14.0 3.0 1.3 .6 .7 1.6Aluminum extruded product manufacturing ....................................... 331316 17.5 5.5 3.3 1.5 1.8 2.2Other aluminum rolling and drawing .................................................. 331319 6.4 5.4 3.3 1.7 1.6 2.1
Nonferrous metal (except aluminum) production and processing ............. 3314 56.7 5.5 3.4 1.6 1.8 2.2Nonferrous metal (except aluminum) smelting and refining .................. 33141 9.1 3.7 2.1 .8 1.3 1.6
Primary smelting and refining of nonferrous metal (except copperand aluminum) ................................................................................. 331419 7.1 4.3 2.4 .9 1.6 1.8
Copper rolling, drawing, extruding, and alloying .................................... 33142 26.1 6.1 3.7 1.8 1.9 2.4Copper rolling, drawing, and extruding .............................................. 331421 10.9 7.3 4.3 2.6 1.7 3.0Copper wire (except mechanical) drawing ........................................ 331422 14.2 5.1 3.1 1.3 1.8 2.0
Nonferrous metal (except copper and aluminum) rolling, drawing,extruding, and alloying ......................................................................... 33149 21.5 5.6 3.5 1.7 1.8 2.1Nonferrous metal (except copper and aluminum) rolling, drawing,and extruding ................................................................................... 331491 12.3 4.4 2.4 1.2 1.2 1.9
Secondary smelting, refining, and alloying of nonferrous metal(except copper and aluminum) ........................................................ 331492 9.2 7.3 4.9 2.3 2.7 2.4
Foundries ................................................................................................... 3315 106.8 9.7 5.1 2.3 2.8 4.6
See footnotes at end of table.
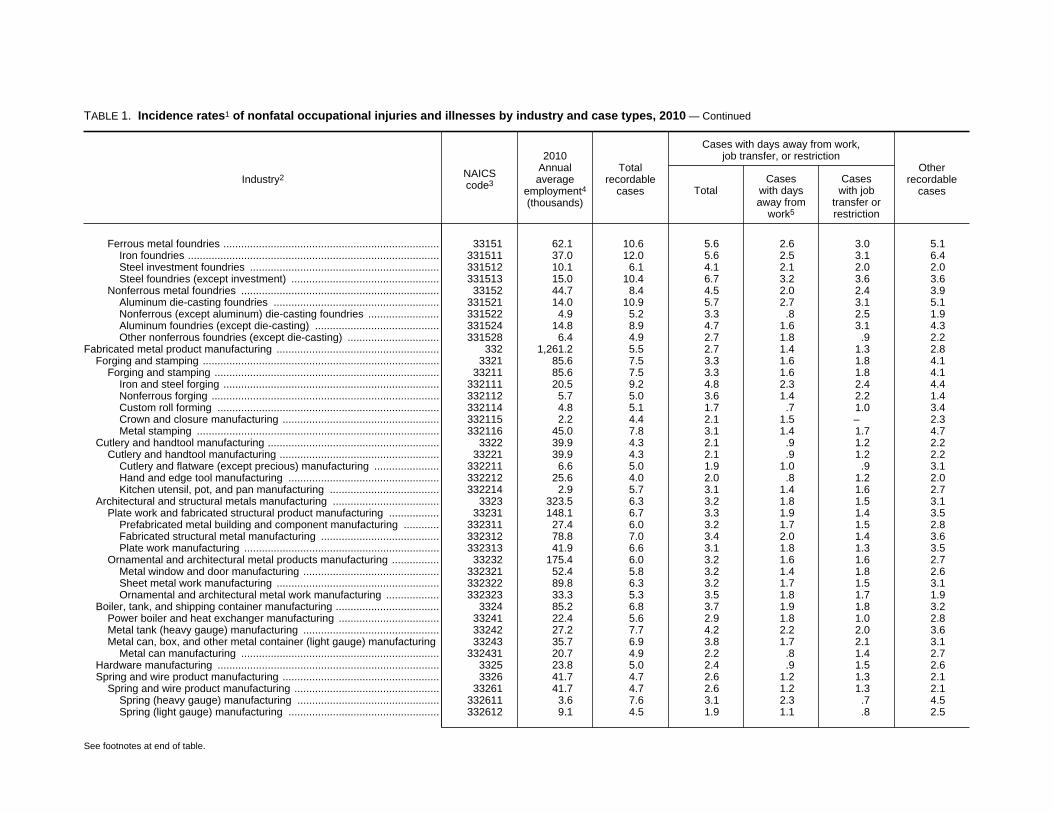
TABLE 1. Incidence rates1 of nonfatal occupational injuries and illnesses by industry and case types, 2010 — Continued
Industry2 NAICScode3
2010Annualaverage
employment4(thousands)
Totalrecordable
cases
Cases with days away from work,job transfer, or restriction
Otherrecordable
casesTotalCases
with daysaway from
work5
Caseswith job
transfer orrestriction
Ferrous metal foundries ......................................................................... 33151 62.1 10.6 5.6 2.6 3.0 5.1Iron foundries ..................................................................................... 331511 37.0 12.0 5.6 2.5 3.1 6.4Steel investment foundries ................................................................ 331512 10.1 6.1 4.1 2.1 2.0 2.0Steel foundries (except investment) .................................................. 331513 15.0 10.4 6.7 3.2 3.6 3.6
Nonferrous metal foundries ................................................................... 33152 44.7 8.4 4.5 2.0 2.4 3.9Aluminum die-casting foundries ........................................................ 331521 14.0 10.9 5.7 2.7 3.1 5.1Nonferrous (except aluminum) die-casting foundries ........................ 331522 4.9 5.2 3.3 .8 2.5 1.9Aluminum foundries (except die-casting) .......................................... 331524 14.8 8.9 4.7 1.6 3.1 4.3Other nonferrous foundries (except die-casting) ............................... 331528 6.4 4.9 2.7 1.8 .9 2.2
Fabricated metal product manufacturing ....................................................... 332 1,261.2 5.5 2.7 1.4 1.3 2.8Forging and stamping ................................................................................ 3321 85.6 7.5 3.3 1.6 1.8 4.1
Forging and stamping ............................................................................ 33211 85.6 7.5 3.3 1.6 1.8 4.1Iron and steel forging ......................................................................... 332111 20.5 9.2 4.8 2.3 2.4 4.4Nonferrous forging ............................................................................. 332112 5.7 5.0 3.6 1.4 2.2 1.4Custom roll forming ........................................................................... 332114 4.8 5.1 1.7 .7 1.0 3.4Crown and closure manufacturing ..................................................... 332115 2.2 4.4 2.1 1.5 – 2.3Metal stamping .................................................................................. 332116 45.0 7.8 3.1 1.4 1.7 4.7
Cutlery and handtool manufacturing .......................................................... 3322 39.9 4.3 2.1 .9 1.2 2.2Cutlery and handtool manufacturing ...................................................... 33221 39.9 4.3 2.1 .9 1.2 2.2
Cutlery and flatware (except precious) manufacturing ...................... 332211 6.6 5.0 1.9 1.0 .9 3.1Hand and edge tool manufacturing ................................................... 332212 25.6 4.0 2.0 .8 1.2 2.0Kitchen utensil, pot, and pan manufacturing ..................................... 332214 2.9 5.7 3.1 1.4 1.6 2.7
Architectural and structural metals manufacturing .................................... 3323 323.5 6.3 3.2 1.8 1.5 3.1Plate work and fabricated structural product manufacturing ................. 33231 148.1 6.7 3.3 1.9 1.4 3.5
Prefabricated metal building and component manufacturing ............ 332311 27.4 6.0 3.2 1.7 1.5 2.8Fabricated structural metal manufacturing ........................................ 332312 78.8 7.0 3.4 2.0 1.4 3.6Plate work manufacturing .................................................................. 332313 41.9 6.6 3.1 1.8 1.3 3.5
Ornamental and architectural metal products manufacturing ................ 33232 175.4 6.0 3.2 1.6 1.6 2.7Metal window and door manufacturing .............................................. 332321 52.4 5.8 3.2 1.4 1.8 2.6Sheet metal work manufacturing ....................................................... 332322 89.8 6.3 3.2 1.7 1.5 3.1Ornamental and architectural metal work manufacturing .................. 332323 33.3 5.3 3.5 1.8 1.7 1.9
Boiler, tank, and shipping container manufacturing ................................... 3324 85.2 6.8 3.7 1.9 1.8 3.2Power boiler and heat exchanger manufacturing .................................. 33241 22.4 5.6 2.9 1.8 1.0 2.8Metal tank (heavy gauge) manufacturing .............................................. 33242 27.2 7.7 4.2 2.2 2.0 3.6Metal can, box, and other metal container (light gauge) manufacturing 33243 35.7 6.9 3.8 1.7 2.1 3.1
Metal can manufacturing ................................................................... 332431 20.7 4.9 2.2 .8 1.4 2.7Hardware manufacturing ........................................................................... 3325 23.8 5.0 2.4 .9 1.5 2.6Spring and wire product manufacturing ..................................................... 3326 41.7 4.7 2.6 1.2 1.3 2.1
Spring and wire product manufacturing ................................................. 33261 41.7 4.7 2.6 1.2 1.3 2.1Spring (heavy gauge) manufacturing ................................................ 332611 3.6 7.6 3.1 2.3 .7 4.5Spring (light gauge) manufacturing ................................................... 332612 9.1 4.5 1.9 1.1 .8 2.5
See footnotes at end of table.

TABLE 1. Incidence rates1 of nonfatal occupational injuries and illnesses by industry and case types, 2010 — Continued
Industry2 NAICScode3
2010Annualaverage
employment4(thousands)
Totalrecordable
cases
Cases with days away from work,job transfer, or restriction
Otherrecordable
casesTotalCases
with daysaway from
work5
Caseswith job
transfer orrestriction
Other fabricated wire product manufacturing .................................... 332618 29.0 4.4 2.7 1.1 1.6 1.7Machine shops; turned product; and screw, nut, and bolt manufacturing 3327 300.4 4.7 1.8 1.1 .7 3.0
Machine shops ...................................................................................... 33271 233.3 4.5 1.6 1.0 .6 2.9Turned product and screw, nut, and bolt manufacturing ....................... 33272 67.1 5.5 2.3 1.3 1.0 3.2
Precision turned product manufacturing ............................................ 332721 32.8 5.8 2.6 1.6 1.0 3.3Bolt, nut, screw, rivet, and washer manufacturing ............................. 332722 34.3 5.1 2.0 1.0 1.0 3.1
Coating, engraving, heat treating, and allied activities .............................. 3328 118.4 5.9 3.5 1.5 2.0 2.4Coating, engraving, heat treating, and allied activities .......................... 33281 118.4 5.9 3.5 1.5 2.0 2.4
Metal heat treating ............................................................................. 332811 15.4 5.0 3.8 1.6 2.2 1.2Metal coating, engraving (except jewelry and silverware), and alliedservices to manufacturers ............................................................... 332812 47.8 6.2 3.5 1.4 2.1 2.7
Electroplating, plating, polishing, anodizing, and coloring ................. 332813 55.2 6.0 3.5 1.7 1.8 2.5Other fabricated metal product manufacturing .......................................... 3329 242.7 4.1 2.2 1.1 1.1 2.0
Metal valve manufacturing ..................................................................... 33291 79.2 3.2 1.7 .8 .9 1.5Industrial valve manufacturing ........................................................... 332911 23.4 3.7 2.0 .9 1.1 1.7Fluid power valve and hose fitting manufacturing ............................. 332912 30.0 2.4 1.5 .6 .9 1.0Plumbing fixture fitting and trim manufacturing ................................. 332913 9.8 2.5 1.4 .6 .8 1.1Other metal valve and pipe fitting manufacturing .............................. 332919 16.0 4.3 1.8 .9 .8 2.5
All other fabricated metal product manufacturing .................................. 33299 163.4 4.6 2.4 1.2 1.2 2.2Ball and roller bearing manufacturing ................................................ 332991 26.2 3.6 1.6 .6 1.0 2.0Small arms ammunition manufacturing ............................................. 332992 10.3 4.4 2.5 1.5 .9 2.0Ammunition (except small arms) manufacturing ............................... 332993 16.1 1.5 .9 .3 .6 .6Small arms manufacturing ................................................................. 332994 10.3 4.9 2.4 1.3 1.1 2.5Other ordnance and accessories manufacturing ............................... 332995 5.6 1.9 .4 – – 1.5Fabricated pipe and pipe fitting manufacturing .................................. 332996 26.6 2.6 1.0 .3 .6 1.6Enameled iron and metal sanitary ware manufacturing .................... 332998 11.1 6.4 2.5 1.0 1.6 3.9All other miscellaneous fabricated metal product manufacturing ...... 332999 53.3 7.0 4.2 2.4 1.8 2.8
Machinery manufacturing8 ............................................................................. 333 978.8 4.4 2.1 1.0 1.1 2.3Agriculture, construction, and mining machinery manufacturing ............... 3331 198.6 4.8 2.4 1.1 1.2 2.4
Agricultural implement manufacturing ................................................... 33311 69.6 6.6 3.0 1.5 1.5 3.6Farm machinery and equipment manufacturing ................................ 333111 53.9 7.2 3.2 1.6 1.6 3.9Lawn and garden tractor and home lawn and garden equipmentmanufacturing .................................................................................. 333112 15.7 4.8 2.3 1.0 1.3 2.4
Construction machinery manufacturing ................................................. 33312 60.3 5.2 2.8 1.4 1.5 2.4Mining and oil and gas field machinery manufacturing .......................... 33313 68.6 2.7 1.4 .6 .8 1.4
Mining machinery and equipment manufacturing .............................. 333131 10.6 3.6 1.4 .9 .5 2.2Oil and gas field machinery and equipment manufacturing ............... 333132 58.0 2.6 1.4 .5 .8 1.2
Industrial machinery manufacturing8 ......................................................... 3332 96.9 4.5 2.1 1.3 .8 2.3Sawmill and woodworking machinery manufacturing ............................ 33321 4.3 5.0 3.8 2.7 1.2 1.1Plastics and rubber industry machinery manufacturing ......................... 33322 12.5 6.0 3.2 1.6 1.6 2.8Other industrial machinery manufacturing8 ........................................... 33329 80.1 4.2 1.9 1.2 .7 2.3
See footnotes at end of table.

TABLE 1. Incidence rates1 of nonfatal occupational injuries and illnesses by industry and case types, 2010 — Continued
Industry2 NAICScode3
2010Annualaverage
employment4(thousands)
Totalrecordable
cases
Cases with days away from work,job transfer, or restriction
Otherrecordable
casesTotalCases
with daysaway from
work5
Caseswith job
transfer orrestriction
Paper industry machinery manufacturing .......................................... 333291 8.6 6.4 1.7 1.2 0.4 4.8Textile machinery manufacturing ....................................................... 333292 4.5 4.2 2.1 .6 1.4 2.2Printing machinery and equipment manufacturing ............................ 333293 10.0 2.8 1.6 .7 .9 1.2Food product machinery manufacturing ............................................ 333294 15.7 6.0 2.0 1.1 .9 4.0Semiconductor machinery manufacturing ......................................... 333295 14.0 1.0 .6 .3 .3 .4All other industrial machinery manufacturing8 ................................... 333298 27.3 4.5 2.6 1.8 .8 1.9
Commercial and service industry machinery manufacturing ..................... 3333 92.6 3.1 1.7 .7 1.1 1.4Commercial and service industry machinery manufacturing ................. 33331 92.6 3.1 1.7 .7 1.1 1.4
Automatic vending machine manufacturing ....................................... 333311 3.4 1.5 .9 .4 .5 .6Commercial laundry, drycleaning, and pressing machinemanufacturing .................................................................................. 333312 3.3 7.4 3.1 1.6 1.5 4.3
Office machinery manufacturing ........................................................ 333313 6.6 .9 .4 – – .6Optical instrument and lens manufacturing ....................................... 333314 21.8 2.4 1.4 .5 .8 1.0Photographic and photocopying equipment manufacturing .............. 333315 9.7 1.8 1.2 .4 .8 .6Other commercial and service industry machinery manufacturing .... 333319 47.8 3.8 2.2 .8 1.4 1.6
Ventilation, heating, air-conditioning, and commercial refrigerationequipment manufacturing8 ....................................................................... 3334 125.6 4.9 2.4 1.0 1.4 2.5Ventilation, heating, air-conditioning, and commercial refrigerationequipment manufacturing8 ................................................................... 33341 125.6 4.9 2.4 1.0 1.4 2.5Air purification equipment manufacturing .......................................... 333411 15.7 4.6 2.3 1.0 1.3 2.3Heating equipment (except warm air furnaces) manufacturing ......... 333414 16.2 6.5 3.0 1.4 1.7 3.4Air-conditioning and warm air heating equipment and commercialand industrial refrigeration equipment manufacturing8 .................... 333415 83.5 4.6 2.4 .9 1.5 2.2
Metalworking machinery manufacturing .................................................... 3335 151.4 4.8 1.8 1.0 .8 2.9Metalworking machinery manufacturing ................................................ 33351 151.4 4.8 1.8 1.0 .8 2.9
Industrial mold manufacturing ........................................................... 333511 31.5 5.5 2.4 1.3 1.1 3.1Machine tool (metal cutting types) manufacturing ............................. 333512 21.9 3.3 1.0 .6 .5 2.3Machine tool (metal forming types) manufacturing ............................ 333513 10.7 3.7 1.7 .9 .8 2.0Special die and tool, die set, jig, and fixture manufacturing .............. 333514 56.0 5.6 1.8 1.1 .7 3.8Cutting tool and machine tool accessory manufacturing ................... 333515 20.6 3.8 1.9 .8 1.1 1.9Rolling mill machinery and equipment manufacturing ....................... 333516 3.6 6.8 2.2 1.1 1.1 4.6
Engine, turbine, and power transmission equipment manufacturing ......... 3336 89.8 3.8 1.8 .8 1.0 2.1Engine, turbine, and power transmission equipment manufacturing ..... 33361 89.8 3.8 1.8 .8 1.0 2.1
Turbine and turbine generator set units manufacturing ..................... 333611 26.9 3.9 2.0 .8 1.2 1.9Speed changer, industrial high-speed drive, and gearmanufacturing .................................................................................. 333612 11.4 5.0 2.0 .8 1.2 3.0
Mechanical power transmission equipment manufacturing ............... 333613 12.6 5.3 2.1 1.4 .7 3.2Other engine equipment manufacturing ............................................ 333618 38.8 3.0 1.5 .7 .8 1.5
Other general purpose machinery manufacturing8 .................................... 3339 223.9 4.3 2.0 1.0 1.0 2.2Pump and compressor manufacturing ................................................... 33391 46.6 3.4 1.9 .7 1.2 1.4
Pump and pumping equipment manufacturing .................................. 333911 25.7 3.6 2.1 .8 1.3 1.4
See footnotes at end of table.

TABLE 1. Incidence rates1 of nonfatal occupational injuries and illnesses by industry and case types, 2010 — Continued
Industry2 NAICScode3
2010Annualaverage
employment4(thousands)
Totalrecordable
cases
Cases with days away from work,job transfer, or restriction
Otherrecordable
casesTotalCases
with daysaway from
work5
Caseswith job
transfer orrestriction
Air and gas compressor manufacturing ............................................. 333912 18.4 3.0 1.5 0.7 0.8 1.5Measuring and dispensing pump manufacturing ............................... 333913 2.6 3.6 2.5 – 2.3 1.2
Material handling equipment manufacturing .......................................... 33392 61.7 6.0 2.8 1.5 1.3 3.2Elevator and moving stairway manufacturing .................................... 333921 7.9 9.9 4.7 2.4 2.3 5.2Conveyor and conveying equipment manufacturing ......................... 333922 25.4 5.9 2.7 1.6 1.1 3.2Overhead traveling crane, hoist, and monorail systemmanufacturing .................................................................................. 333923 11.3 4.7 2.5 1.3 1.1 2.2
Industrial truck, tractor, trailer, and stacker machinerymanufacturing .................................................................................. 333924 17.0 5.4 2.3 1.1 1.1 3.1
All other general purpose machinery manufacturing8 ............................ 33399 115.5 3.7 1.6 .8 .8 2.0Power-driven handtool manufacturing ............................................... 333991 7.4 4.4 2.5 1.1 1.3 1.9Welding and soldering equipment manufacturing ............................. 333992 11.9 3.5 1.8 .9 .9 1.7Packaging machinery manufacturing ................................................ 333993 16.3 3.6 1.7 .9 .8 1.9Industrial process furnace and oven manufacturing8 ........................ 333994 10.1 4.7 1.7 .9 .8 2.9Fluid power cylinder and actuator manufacturing .............................. 333995 14.5 5.4 2.3 1.0 1.3 3.1Fluid power pump and motor manufacturing ..................................... 333996 16.9 2.2 1.1 .5 .7 1.1All other miscellaneous general purpose machinery manufacturing8 333999 34.5 3.5 1.3 .8 .5 2.2
Computer and electronic product manufacturing ........................................... 334 1,093.1 1.5 .8 .4 .4 .8Computer and peripheral equipment manufacturing ................................. 3341 159.5 .7 .4 .2 .2 .3
Computer and peripheral equipment manufacturing ............................. 33411 159.5 .7 .4 .2 .2 .3Electronic computer manufacturing ................................................... 334111 88.3 .6 .4 .2 .1 .2Computer terminal manufacturing ..................................................... 334113 12.5 .2 – – – –Other computer peripheral equipment manufacturing ....................... 334119 37.1 .7 .4 .2 .2 .4
Communications equipment manufacturing8 ............................................. 3342 116.6 1.6 .8 .4 .3 .8Telephone apparatus manufacturing ..................................................... 33421 27.4 1.3 .7 .6 .1 .6Radio and television broadcasting and wireless communicationsequipment manufacturing8 ................................................................... 33422 66.1 1.6 .8 .4 .4 .8
Other communications equipment manufacturing ................................. 33429 23.1 2.0 .8 .3 .6 1.1Audio and video equipment manufacturing ............................................... 3343 20.5 2.3 1.4 .4 1.0 .9Semiconductor and other electronic component manufacturing ............... 3344 362.9 1.7 .8 .4 .5 .9
Semiconductor and other electronic component manufacturing ........... 33441 362.9 1.7 .8 .4 .5 .9Electron tube manufacturing .............................................................. 334411 4.8 1.0 .5 – – .6Bare printed circuit board manufacturing ........................................... 334412 37.7 2.3 1.2 .6 .6 1.1Semiconductor and related device manufacturing ............................ 334413 175.5 1.2 .6 .3 .3 .6Electronic capacitor manufacturing ................................................... 334414 5.8 2.3 .9 .5 .4 1.4Electronic coil, transformer, and other inductor manufacturing ......... 334416 8.3 4.4 2.4 1.0 1.4 2.0Electronic connector manufacturing .................................................. 334417 17.4 2.9 1.8 1.0 .8 1.0Printed circuit assembly (electronic assembly) manufacturing .......... 334418 49.3 1.5 .7 .3 .3 .9Other electronic component manufacturing ....................................... 334419 60.0 2.3 1.1 .4 .7 1.2
Navigational, measuring, electromedical, and control instrumentsmanufacturing8 ........................................................................................ 3345 407.3 1.6 .8 .4 .4 .8
See footnotes at end of table.

TABLE 1. Incidence rates1 of nonfatal occupational injuries and illnesses by industry and case types, 2010 — Continued
Industry2 NAICScode3
2010Annualaverage
employment4(thousands)
Totalrecordable
cases
Cases with days away from work,job transfer, or restriction
Otherrecordable
casesTotalCases
with daysaway from
work5
Caseswith job
transfer orrestriction
Navigational, measuring, electromedical, and control instrumentsmanufacturing ...................................................................................... 33451 407.3 1.6 0.8 0.4 0.4 0.8Electromedical and electrotherapeutic apparatus manufacturing8 .... 334510 59.3 1.4 .8 .3 .5 .5Search, detection, navigation, guidance, aeronautical, and nauticalsystem and instrument manufacturing ............................................. 334511 146.9 1.2 .6 .3 .3 .6
Automatic environmental control manufacturing for residential,commercial, and appliance use ....................................................... 334512 18.4 2.6 1.4 .6 .8 1.2
Instruments and related products manufacturing for measuring,displaying, and controlling industrial process variables ................... 334513 55.3 2.4 1.0 .6 .4 1.4
Totalizing fluid meter and counting device manufacturing ................. 334514 10.9 4.1 2.1 .7 1.3 2.0Instrument manufacturing for measuring and testing electricity andelectrical signals8 ............................................................................. 334515 40.5 1.0 .5 .3 .2 .6
Analytical laboratory instrument manufacturing ................................. 334516 30.5 1.3 .6 .3 .3 .7Watch, clock, and part manufacturing ............................................... 334518 3.5 1.3 .5 – – .8Other measuring and controlling device manufacturing .................... 334519 29.4 1.7 .8 .4 .4 .8Prerecorded compact disc (except software), tape, and recordreproducing ...................................................................................... 334612 11.9 2.7 1.9 .7 1.2 .8
Electrical equipment, appliance, and component manufacturing .................. 335 355.5 3.3 1.8 .7 1.0 1.5Electric lighting equipment manufacturing ................................................. 3351 45.5 3.6 1.9 .7 1.3 1.6
Electric lamp bulb and part manufacturing ............................................ 33511 9.0 3.9 1.9 .8 1.1 2.0Lighting fixture manufacturing ............................................................... 33512 36.5 3.5 1.9 .6 1.3 1.6
Residential electric lighting fixture manufacturing ............................. 335121 8.3 3.2 1.7 .5 1.2 1.6Commercial, industrial, and institutional electric lighting fixturemanufacturing .................................................................................. 335122 19.3 3.4 2.0 .6 1.4 1.4
Other lighting equipment manufacturing ............................................ 335129 8.9 3.9 2.1 .8 1.3 1.9Household appliance manufacturing ......................................................... 3352 58.1 3.3 1.6 .7 1.0 1.7
Small electrical appliance manufacturing .............................................. 33521 12.3 5.1 2.3 1.3 1.0 2.8Electric housewares and household fan manufacturing .................... 335211 9.0 5.9 2.4 1.4 1.1 3.4Household vacuum cleaner manufacturing ....................................... 335212 3.3 3.2 2.1 1.1 1.0 1.1
Major appliance manufacturing ............................................................. 33522 45.8 2.9 1.5 .5 1.0 1.4Household cooking appliance manufacturing .................................... 335221 10.6 3.0 1.4 .6 .8 1.7Other major household appliance manufacturing .............................. 335228 – 4.2 2.0 .7 1.3 2.2
Electrical equipment manufacturing .......................................................... 3353 135.8 3.4 1.9 .8 1.1 1.6Electrical equipment manufacturing ...................................................... 33531 135.8 3.4 1.9 .8 1.1 1.6
Power, distribution, and specialty transformer manufacturing ........... 335311 24.5 5.4 3.5 1.7 1.9 1.9Motor and generator manufacturing .................................................. 335312 38.6 4.4 2.4 .9 1.5 2.0Switchgear and switchboard apparatus manufacturing ..................... 335313 28.4 2.8 1.5 .6 .9 1.3Relay and industrial control manufacturing ....................................... 335314 44.3 1.8 .7 .3 .4 1.1
Other electrical equipment and component manufacturing ....................... 3359 116.1 3.0 1.6 .7 .9 1.3Battery manufacturing ........................................................................... 33591 23.6 3.9 2.1 .8 1.3 1.7Communication and energy wire and cable manufacturing ................... 33592 19.7 2.5 1.5 .7 .8 1.0
See footnotes at end of table.

TABLE 1. Incidence rates1 of nonfatal occupational injuries and illnesses by industry and case types, 2010 — Continued
Industry2 NAICScode3
2010Annualaverage
employment4(thousands)
Totalrecordable
cases
Cases with days away from work,job transfer, or restriction
Otherrecordable
casesTotalCases
with daysaway from
work5
Caseswith job
transfer orrestriction
Other communication and energy wire manufacturing ...................... 335929 11.5 3.0 1.9 1.0 0.9 1.1Wiring device manufacturing ................................................................. 33593 40.2 3.3 1.7 .6 1.1 1.5
Current-carrying wiring device manufacturing ................................... 335931 30.0 2.9 1.6 .7 1.0 1.3Noncurrent-carrying wiring device manufacturing ............................. 335932 10.2 4.3 2.1 .5 1.5 2.2
All other electrical equipment and component manufacturing ............... 33599 32.6 2.1 1.2 .7 .5 1.0Carbon and graphite product manufacturing ..................................... 335991 6.5 3.1 2.1 1.2 .9 1.0All other miscellaneous electrical equipment and componentmanufacturing .................................................................................. 335999 26.2 1.9 .9 .6 .4 1.0
Transportation equipment manufacturing8 .................................................... 336 1,303.2 5.5 3.0 1.2 1.7 2.5Motor vehicle manufacturing ..................................................................... 3361 153.7 8.0 3.9 1.4 2.6 4.0
Automobile and light duty motor vehicle manufacturing ........................ 33611 129.8 8.2 4.1 1.4 2.7 4.1Automobile manufacturing ................................................................. 336111 93.3 7.7 4.1 1.6 2.6 3.5Light truck and utility vehicle manufacturing ...................................... 336112 36.5 9.6 3.9 1.0 2.9 5.7
Heavy duty truck manufacturing ............................................................ 33612 23.9 6.8 3.2 1.2 2.0 3.6Motor vehicle body and trailer manufacturing ............................................ 3362 104.7 9.5 4.3 1.8 2.4 5.2
Motor vehicle body and trailer manufacturing .................................... 33621 104.7 9.5 4.3 1.8 2.4 5.2Motor vehicle body manufacturing ..................................................... 336211 48.2 8.1 4.2 1.9 2.3 3.9Truck trailer manufacturing ................................................................ 336212 21.3 7.8 3.5 1.6 1.9 4.2Travel trailer and camper manufacturing ........................................... 336214 24.1 13.2 5.6 2.0 3.6 7.6
Motor vehicle parts manufacturing ............................................................ 3363 400.5 5.6 3.0 1.1 1.9 2.5Motor vehicle gasoline engine and engine parts manufacturing ........... 33631 45.5 5.2 2.7 .9 1.8 2.5
Carburetor, piston, piston ring, and valve manufacturing .................. 336311 9.1 4.8 2.6 .7 1.9 2.1Gasoline engine and engine parts manufacturing ............................. 336312 36.4 5.3 2.7 .9 1.8 2.6
Motor vehicle electrical and electronic equipment manufacturing ......... 33632 51.4 3.8 1.9 .7 1.2 2.0Vehicular lighting equipment manufacturing ...................................... 336321 10.9 4.5 2.6 .7 1.9 1.9Other motor vehicle electrical and electronic equipmentmanufacturing .................................................................................. 336322 40.5 3.6 1.7 .7 1.0 2.0
Motor vehicle steering and suspension components (except spring)manufacturing ...................................................................................... 33633 25.4 5.7 3.0 1.0 2.1 2.6
Motor vehicle brake system manufacturing ........................................... 33634 21.7 4.3 2.6 1.0 1.7 1.7Motor vehicle transmission and power train parts manufacturing ......... 33635 51.5 5.4 2.9 1.2 1.7 2.6Motor vehicle seating and interior trim manufacturing ........................... 33636 40.4 6.8 4.4 1.3 3.1 2.4Motor vehicle metal stamping ................................................................ 33637 54.7 7.6 3.8 1.6 2.1 3.8Other motor vehicle parts manufacturing .............................................. 33639 110.0 5.3 2.9 1.1 1.8 2.4
Motor vehicle air-conditioning manufacturing .................................... 336391 5.8 5.2 2.9 1.6 1.3 2.3All other motor vehicle parts manufacturing ...................................... 336399 104.2 5.3 2.9 1.1 1.8 2.4
Aerospace product and parts manufacturing ............................................. 3364 465.8 3.2 1.9 .7 1.1 1.4Aerospace product and parts manufacturing ......................................... 33641 465.8 3.2 1.9 .7 1.1 1.4
Aircraft manufacturing ....................................................................... 336411 217.6 3.7 2.3 .9 1.4 1.4Aircraft engine and engine parts manufacturing ................................ 336412 76.8 2.7 1.4 .6 .8 1.3Other aircraft parts and auxiliary equipment manufacturing .............. 336413 97.3 4.3 2.2 .9 1.3 2.1
See footnotes at end of table.

TABLE 1. Incidence rates1 of nonfatal occupational injuries and illnesses by industry and case types, 2010 — Continued
Industry2 NAICScode3
2010Annualaverage
employment4(thousands)
Totalrecordable
cases
Cases with days away from work,job transfer, or restriction
Otherrecordable
casesTotalCases
with daysaway from
work5
Caseswith job
transfer orrestriction
Guided missile and space vehicle manufacturing ............................. 336414 52.5 0.8 0.4 0.2 0.2 0.4Guided missile and space vehicle propulsion unit and propulsionunit parts manufacturing .................................................................. 336415 14.0 1.2 .7 .4 .3 .5
Other guided missile and space vehicle parts and auxiliaryequipment manufacturing ................................................................ 336419 7.6 2.7 2.2 .5 1.7 .5
Railroad rolling stock manufacturing ......................................................... 3365 19.1 3.1 1.7 .8 .9 1.5Ship and boat building8 .............................................................................. 3366 124.4 8.5 5.3 3.0 2.3 3.2
Ship and boat building8 .......................................................................... 33661 124.4 8.5 5.3 3.0 2.3 3.2Ship building and repairing ................................................................ 336611 98.1 9.3 5.8 3.2 2.5 3.5Boat building8 .................................................................................... 336612 26.3 5.5 3.2 1.9 1.3 2.3
Other transportation equipment manufacturing ......................................... 3369 35.0 5.4 2.7 1.3 1.4 2.7Other transportation equipment manufacturing ..................................... 33699 35.0 5.4 2.7 1.3 1.4 2.7
Motorcycle, bicycle, and parts manufacturing ................................... 336991 12.8 6.1 2.9 1.6 1.3 3.2Military armored vehicle, tank, and tank component manufacturing 336992 10.8 4.7 2.7 1.1 1.7 2.0All other transportation equipment manufacturing ............................. 336999 11.3 5.3 2.3 1.2 1.2 3.0
Furniture and related product manufacturing8 ............................................... 337 363.6 5.2 2.8 1.3 1.5 2.4Household and institutional furniture and kitchen cabinet manufacturing8 3371 229.8 5.3 2.8 1.4 1.4 2.5
Wood kitchen cabinet and countertop manufacturing ........................... 33711 103.4 5.5 2.8 1.7 1.1 2.7Household and institutional furniture manufacturing8 ............................ 33712 126.4 5.2 2.9 1.2 1.6 2.3
Upholstered household furniture manufacturing ................................ 337121 52.0 5.0 2.5 1.1 1.5 2.4Nonupholstered wood household furniture manufacturing ................ 337122 39.8 5.1 3.2 1.1 2.1 1.9Metal household furniture manufacturing .......................................... 337124 5.7 3.8 1.1 .9 – 2.7Household furniture (except wood and metal) manufacturing ........... 337125 5.0 5.5 3.8 1.7 2.2 1.7Institutional furniture manufacturing8 ................................................. 337127 22.1 6.4 3.5 1.8 1.6 2.9
Office furniture (including fixtures) manufacturing ..................................... 3372 97.6 5.4 2.8 1.2 1.6 2.6Office furniture (including fixtures) manufacturing ................................. 33721 97.6 5.4 2.8 1.2 1.6 2.6
Wood office furniture manufacturing .................................................. 337211 16.8 5.4 3.2 1.1 2.2 2.2Custom architectural woodwork and millwork manufacturing ............ 337212 16.1 4.6 1.8 1.1 .7 2.8Office furniture (except wood) manufacturing .................................... 337214 20.3 5.1 2.9 1.1 1.8 2.2Showcase, partition, shelving, and locker manufacturing .................. 337215 44.5 5.9 2.9 1.4 1.6 3.0
Other furniture related product manufacturing ........................................... 3379 36.2 4.1 2.8 1.0 1.8 1.3Mattress manufacturing ......................................................................... 33791 22.9 4.8 3.2 1.3 1.9 1.5Blind and shade manufacturing ............................................................. 33792 13.3 2.9 2.0 .5 1.5 .9
Miscellaneous manufacturing ........................................................................ 339 568.4 3.0 1.6 .8 .8 1.5Medical equipment and supplies manufacturing ....................................... 3391 303.3 2.5 1.3 .6 .8 1.2
Medical equipment and supplies manufacturing ................................... 33911 303.3 2.5 1.3 .6 .8 1.2Surgical and medical instrument manufacturing ................................ 339112 115.6 2.2 1.2 .4 .7 1.1Surgical appliance and supplies manufacturing8 ............................... 339113 96.4 3.1 1.7 .8 .9 1.4Dental equipment and supplies manufacturing ................................. 339114 15.4 4.0 1.7 .4 1.3 2.3Ophthalmic goods manufacturing ...................................................... 339115 29.6 3.2 1.8 .5 1.3 1.4Dental laboratories ............................................................................ 339116 46.2 .9 .4 .3 .1 .5
See footnotes at end of table.

TABLE 1. Incidence rates1 of nonfatal occupational injuries and illnesses by industry and case types, 2010 — Continued
Industry2 NAICScode3
2010Annualaverage
employment4(thousands)
Totalrecordable
cases
Cases with days away from work,job transfer, or restriction
Otherrecordable
casesTotalCases
with daysaway from
work5
Caseswith job
transfer orrestriction
Other miscellaneous manufacturing .......................................................... 3399 265.2 3.6 1.9 1.0 0.9 1.7Jewelry and silverware manufacturing .................................................. 33991 29.2 1.9 .9 .6 .3 1.0
Jewelry (except costume) manufacturing .......................................... 339911 20.7 1.6 .9 .5 .4 .7Silverware and hollowware manufacturing ........................................ 339912 1.5 – – – – –Jewelers’ material and lapidary work manufacturing ......................... 339913 2.3 2.5 .8 .8 – 1.7Costume jewelry and novelty manufacturing ..................................... 339914 4.7 3.5 1.0 1.0 – –
Sporting and athletic goods manufacturing ........................................... 33992 41.8 3.5 1.6 .7 .9 1.9Doll, toy, and game manufacturing ........................................................ 33993 12.0 2.8 2.1 .9 1.2 .7Office supplies (except paper) manufacturing ....................................... 33994 14.0 4.1 1.9 1.1 .8 2.2
Pen and mechanical pencil manufacturing ........................................ 339941 3.3 3.2 2.0 – – 1.2Lead pencil and art good manufacturing ........................................... 339942 4.8 4.7 3.0 1.3 1.7 1.7Carbon paper and inked ribbon manufacturing ................................. 339944 1.2 2.9 1.8 – 1.3 –
Sign manufacturing ................................................................................ 33995 64.2 3.6 2.1 1.4 .7 1.5All other miscellaneous manufacturing .................................................. 33999 104.0 4.1 2.0 1.0 1.0 2.1
Gasket, packing, and sealing device manufacturing ......................... 339991 26.9 4.3 2.1 .8 1.3 2.1Burial casket manufacturing .............................................................. 339995 4.5 3.1 1.2 .7 .5 1.9All other miscellaneous manufacturing .............................................. 339999 48.3 4.2 1.9 1.1 .8 2.4
Service providing ............................................................................ 87,716.6 3.4 1.7 1.0 .7 1.6
Trade, transportation, and utilities10 ................................................. 24,503.5 4.1 2.4 1.4 1.1 1.7
Wholesale trade ......................................................................................... 42 5,487.5 3.4 2.1 1.1 1.0 1.3Merchant wholesalers, durable goods ........................................................... 423 2,729.9 3.1 1.7 .9 .8 1.4
Motor vehicle and motor vehicle parts and supplies merchantwholesalers .............................................................................................. 4231 308.9 4.1 2.4 1.5 1.0 1.7
Furniture and home furnishing merchant wholesalers ............................... 4232 94.0 3.5 1.5 .9 .6 2.0Lumber and other construction materials merchant wholesalers .............. 4233 193.6 4.8 2.8 1.7 1.1 2.0Professional and commercial equipment and supplies merchantwholesalers .............................................................................................. 4234 605.4 2.0 1.1 .6 .5 .8
Metal and mineral (except petroleum) merchant wholesalers ................... 4235 110.9 4.2 2.5 1.3 1.3 1.7Hardware, and plumbing and heating equipment and supplies merchantwholesalers .............................................................................................. 4237 222.5 2.9 1.3 .6 .7 1.6
Machinery, equipment, and supplies merchant wholesalers ..................... 4238 610.0 3.4 1.7 .9 .7 1.7Miscellaneous durable goods merchant wholesalers ................................ 4239 274.8 3.3 2.0 1.2 .7 1.3
Sporting and recreational goods and supplies merchant wholesalers .. 42391 45.0 1.8 1.3 .7 .6 .5Toy and hobby goods and supplies merchant wholesalers ................... 42392 21.3 2.0 1.2 .3 .9 .8Recyclable material merchant wholesalers ........................................... 42393 103.8 5.6 3.2 2.2 1.0 2.4Jewelry, watch, precious stone, and precious metal merchantwholesalers .......................................................................................... 42394 40.5 .6 .3 .2 .1 .3
Other miscellaneous durable goods merchant wholesalers .................. 42399 64.3 2.3 1.6 .9 .7 .8
See footnotes at end of table.

TABLE 1. Incidence rates1 of nonfatal occupational injuries and illnesses by industry and case types, 2010 — Continued
Industry2 NAICScode3
2010Annualaverage
employment4(thousands)
Totalrecordable
cases
Cases with days away from work,job transfer, or restriction
Otherrecordable
casesTotalCases
with daysaway from
work5
Caseswith job
transfer orrestriction
Merchant wholesalers, nondurable goods ..................................................... 424 1,939.9 4.5 3.0 1.5 1.5 1.5Paper and paper product merchant wholesalers ....................................... 4241 125.4 2.1 1.4 .8 .6 .7Drugs and druggists’ sundries merchant wholesalers ............................... 4242 193.6 2.2 1.3 .6 .7 .8Apparel, piece goods, and notions merchant wholesalers ........................ 4243 132.6 1.9 1.0 .5 .6 .9Grocery and related product merchant wholesalers .................................. 4244 707.2 6.2 4.5 2.0 2.5 1.7Farm product raw material merchant wholesalers ..................................... 4245 74.3 4.4 2.6 2.0 .6 1.9Chemical and allied products merchant wholesalers ................................ 4246 120.8 2.8 1.8 .8 1.0 1.0Petroleum and petroleum products merchant wholesalers ....................... 4247 94.2 2.0 1.3 1.0 .3 .8Beer, wine, and distilled alcoholic beverage merchant wholesalers .......... 4248 162.2 7.3 5.2 2.7 2.5 2.1Miscellaneous nondurable goods merchant wholesalers .......................... 4249 329.6 4.1 2.3 1.2 1.0 1.8
Wholesale electronic markets and agents and brokers ................................. 425 817.6 2.0 1.0 .7 .3 –
Retail trade ................................................................................................ 44-45 14,521.5 4.1 2.2 1.2 1.0 1.9Motor vehicle and parts dealers .................................................................... 441 1,620.5 3.8 1.8 1.2 .5 2.1
Automobile dealers .................................................................................... 4411 1,003.0 3.7 1.4 1.1 .4 2.2New car dealers ..................................................................................... 44111 887.4 3.9 1.5 1.1 .4 2.4Used car dealers ................................................................................... 44112 115.6 – .7 .5 .2 –
Other motor vehicle dealers ...................................................................... 4412 130.7 3.6 1.8 1.4 .4 1.8Recreational vehicle dealers ................................................................. 44121 28.0 4.2 1.6 1.2 .4 2.6Motorcycle, boat, and other motor vehicle dealers ................................ 44122 102.7 3.5 1.9 1.4 .4 1.6
Automotive parts, accessories, and tire stores .......................................... 4413 486.8 4.2 2.5 1.5 1.0 1.7Automotive parts and accessories stores .............................................. 44131 322.6 3.5 2.2 1.3 .8 1.3Tire dealers ............................................................................................ 44132 164.3 5.4 3.1 1.8 1.3 2.4
Furniture and home furnishings stores .......................................................... 442 441.3 4.2 2.4 1.5 1.0 1.7Furniture stores ......................................................................................... 4421 218.3 3.9 2.5 – 1.0 –Home furnishings stores ............................................................................ 4422 223.0 4.5 2.4 1.4 1.0 2.1
Floor covering stores ............................................................................. 44221 70.0 2.2 .6 .5 .1 1.5Other home furnishings stores .............................................................. 44229 153.0 5.9 3.5 2.0 1.5 2.4
Electronics and appliance stores ................................................................... 443 500.8 1.6 .7 .4 .3 .9Electronics and appliance stores ............................................................... 4431 500.8 1.6 .7 .4 .3 .9
Appliance, television, and other electronics stores ................................ 44311 384.9 1.9 .9 .4 .4 1.1Computer and software stores .............................................................. 44312 105.4 .6 .3 .2 .1 .3
Building material and garden equipment and supplies dealers ..................... 444 1,151.1 5.1 3.0 1.4 1.6 2.2Building material and supplies dealers ...................................................... 4441 1,020.4 5.3 3.1 1.4 1.7 2.2
Home centers ........................................................................................ 44411 630.1 6.2 3.7 1.5 2.2 2.6Paint and wallpaper stores .................................................................... 44412 34.5 3.0 2.2 .5 1.7 .9Other building material dealers .............................................................. 44419 212.5 3.8 2.2 – .7 –
Lawn and garden equipment and supplies stores ..................................... 4442 130.8 4.0 2.3 1.7 .6 1.7Outdoor power equipment stores .......................................................... 44421 29.7 1.9 1.4 1.4 – .5Nursery, garden center, and farm supply stores ................................... 44422 101.1 4.7 2.6 1.8 .8 2.1
Food and beverage stores ............................................................................. 445 2,830.4 5.1 2.9 1.5 1.4 2.3
See footnotes at end of table.

TABLE 1. Incidence rates1 of nonfatal occupational injuries and illnesses by industry and case types, 2010 — Continued
Industry2 NAICScode3
2010Annualaverage
employment4(thousands)
Totalrecordable
cases
Cases with days away from work,job transfer, or restriction
Otherrecordable
casesTotalCases
with daysaway from
work5
Caseswith job
transfer orrestriction
Grocery stores ........................................................................................... 4451 2,478.3 5.4 3.0 1.6 1.4 2.4Supermarkets and other grocery (except convenience) stores ............. 44511 2,337.6 5.7 3.1 1.6 1.5 2.5Convenience stores ............................................................................... 44512 140.7 – .8 .7 .1 .8
Specialty food stores ................................................................................. 4452 214.0 3.4 2.1 1.2 .9 1.3Meat markets ......................................................................................... 44521 48.0 2.1 .9 .6 .3 1.2Fruit and vegetable markets .................................................................. 44523 38.7 3.7 2.2 1.5 .6 1.6
Beer, wine, and liquor stores ..................................................................... 4453 138.0 2.7 1.4 .9 .5 1.3Health and personal care stores .................................................................... 446 984.7 2.8 1.1 .7 .4 1.7
Health and personal care stores ................................................................ 4461 984.7 2.8 1.1 .7 .4 1.7Pharmacies and drug stores .................................................................. 44611 718.1 3.3 1.3 .8 .6 2.0Cosmetics, beauty supplies, and perfume stores .................................. 44612 103.6 1.1 .7 .6 – .4Other health and personal care stores .................................................. 44619 99.4 1.6 .7 .5 .2 1.0
Gasoline stations ........................................................................................... 447 824.8 2.9 1.5 1.1 .4 1.4Gasoline stations ....................................................................................... 4471 824.8 2.9 1.5 1.1 .4 1.4
Gasoline stations with convenience stores ............................................ 44711 725.3 2.9 1.5 1.1 .4 1.4Other gasoline stations .......................................................................... 44719 99.5 3.3 1.6 1.3 .3 1.7
Clothing and clothing accessories stores ...................................................... 448 1,370.1 2.7 .8 .6 .2 1.9Clothing stores ........................................................................................... 4481 1,057.1 3.0 .8 .6 .2 2.2
Men’s clothing stores ............................................................................. 44811 55.5 1.2 .9 – – .4Women’s clothing stores ....................................................................... 44812 280.6 3.7 .3 .2 11( ) 3.4Children’s and infants’ clothing stores ................................................... 44813 72.8 4.2 .9 .8 – 3.4Family clothing stores ............................................................................ 44814 486.7 3.4 1.3 .9 .4 2.1Other clothing stores ............................................................................. 44819 109.4 1.5 .4 .4 11( ) 1.1
Shoe stores ............................................................................................... 4482 179.8 – 1.3 1.1 .2 1.2Jewelry, luggage, and leather goods stores .............................................. 4483 133.2 .7 .1 .1 – .5
Jewelry stores ........................................................................................ 44831 119.7 .7 .1 .1 – .6Sporting goods, hobby, book, and music stores ............................................ 451 608.7 3.2 1.3 .7 .6 2.0
Sporting goods, hobby, and musical instrument stores ............................. 4511 461.9 3.5 1.4 .7 .7 2.1Sporting goods stores ............................................................................ 45111 236.2 2.8 1.6 .6 1.0 1.2Hobby, toy, and game stores ................................................................. 45112 150.5 5.4 1.4 .9 .5 4.0Sewing, needlework, and piece goods stores ....................................... 45113 44.2 2.8 1.0 1.0 – 1.8Musical instrument and supplies stores ................................................. 45114 31.0 1.7 .8 .6 – .9
Book, periodical, and music stores ............................................................ 4512 146.8 2.4 .8 .6 .1 1.6Book stores and news dealers .............................................................. 45121 124.3 2.9 .9 .8 .1 2.0Prerecorded tape, compact disc, and record stores .............................. 45122 22.5 .3 .1 – – –
General merchandise stores ......................................................................... 452 2,992.6 5.0 3.2 1.4 1.8 1.8Department stores ..................................................................................... 4521 1,495.6 4.3 2.8 1.3 1.5 1.5Other general merchandise stores ............................................................ 4529 1,497.0 5.6 3.6 1.4 2.2 2.0
Warehouse clubs and superstores ........................................................ 45291 1,155.5 5.9 3.9 1.5 2.4 2.0All other general merchandise stores .................................................... 45299 341.5 4.5 2.4 1.1 1.3 2.1
Miscellaneous store retailers ......................................................................... 453 781.6 3.1 1.6 .9 .7 1.5
See footnotes at end of table.

TABLE 1. Incidence rates1 of nonfatal occupational injuries and illnesses by industry and case types, 2010 — Continued
Industry2 NAICScode3
2010Annualaverage
employment4(thousands)
Totalrecordable
cases
Cases with days away from work,job transfer, or restriction
Otherrecordable
casesTotalCases
with daysaway from
work5
Caseswith job
transfer orrestriction
Florists ....................................................................................................... 4531 70.2 1.5 0.3 0.3 – 1.2Office supplies, stationery, and gift stores ................................................. 4532 314.5 2.0 1.1 .7 0.4 .9
Office supplies and stationery stores ..................................................... 45321 146.1 2.5 1.4 .7 .7 1.0Gift, novelty, and souvenir stores .......................................................... 45322 168.4 1.5 .9 .7 .1 .7
Used merchandise stores .......................................................................... 4533 124.5 4.8 2.5 1.0 1.5 2.3Pet and pet supplies stores ................................................................... 45391 100.4 8.4 4.0 2.2 1.8 4.4
Nonstore retailers .......................................................................................... 454 414.9 3.5 2.2 1.3 .9 1.2Electronic shopping and mail-order houses .............................................. 4541 240.0 1.8 1.2 .6 .6 .6
Electronic shopping and mail-order houses .......................................... 45411 240.0 1.8 1.2 .6 .6 .6Electronic shopping ........................................................................... 454111 88.3 1.1 .7 .4 .3 .5Electronic auctions ............................................................................ 454112 6.1 – – – – –Mail-order houses .............................................................................. 454113 145.5 2.3 1.6 .7 .8 .7
Vending machine operators ....................................................................... 4542 39.5 3.2 2.0 1.5 .5 1.2Direct selling establishments ..................................................................... 4543 135.4 6.3 4.0 2.5 1.5 –
Fuel dealers ........................................................................................... 45431 81.5 7.8 4.8 – 1.0 3.0Other direct selling establishments ........................................................ 45439 53.9 4.1 2.8 .6 2.1 1.3
Transportation and warehousing10 ............................................................ 48-49 3,937.4 5.2 3.6 2.3 1.3 1.6Air transportation ........................................................................................... 481 452.8 8.1 6.3 4.6 1.7 1.7
Scheduled air transportation ...................................................................... 4811 411.2 8.7 6.9 5.0 1.9 1.7Scheduled air transportation .................................................................. 48111 411.2 8.7 6.9 5.0 1.9 1.7
Scheduled passenger air transportation ............................................ 481111 400.6 8.8 7.0 5.1 1.9 1.7Scheduled freight air transportation ................................................... 481112 10.6 5.4 3.6 2.6 1.0 1.8
Nonscheduled air transportation ................................................................ 4812 41.5 2.9 1.4 .9 .5 1.6Rail transportation10 ...................................................................................... 482 – 2.0 1.4 1.3 .1 .6Water transportation ...................................................................................... 483 60.7 3.2 1.6 1.3 .3 1.6
Deep sea, coastal, and Great Lakes water transportation ........................ 4831 37.3 4.0 1.5 1.2 .3 2.5Deep sea, coastal, and Great Lakes water transportation .................... 48311 37.3 4.0 1.5 1.2 .3 2.5
Deep sea freight transportation ......................................................... 483111 11.7 – 2.3 – – –Inland water transportation ........................................................................ 4832 23.4 2.2 1.7 1.5 .2 .5
Inland water transportation .................................................................... 48321 23.4 2.2 1.7 1.5 .2 .5Inland water freight transportation ..................................................... 483211 19.4 2.3 1.8 1.6 .2 .5
Truck transportation ....................................................................................... 484 1,240.1 5.0 3.3 2.4 .9 1.6General freight trucking ............................................................................. 4841 859.8 5.3 3.5 2.5 1.1 1.7
General freight trucking, local ................................................................ 48411 201.8 4.8 3.5 2.5 .9 1.3General freight trucking, long-distance .................................................. 48412 658.0 5.4 3.6 2.4 1.1 1.9
Specialized freight trucking ........................................................................ 4842 380.3 4.3 2.9 2.2 .6 1.4Used household and office goods moving ............................................. 48421 83.7 5.5 4.0 2.5 1.5 1.5Specialized freight (except used goods) trucking, local ......................... 48422 189.0 3.7 2.4 2.0 .4 1.3Specialized freight (except used goods) trucking, long-distance ........... 48423 107.7 4.5 3.0 2.4 .6 1.5
Transit and ground passenger transportation ................................................ 485 419.5 5.3 3.4 2.5 .9 1.9
See footnotes at end of table.

TABLE 1. Incidence rates1 of nonfatal occupational injuries and illnesses by industry and case types, 2010 — Continued
Industry2 NAICScode3
2010Annualaverage
employment4(thousands)
Totalrecordable
cases
Cases with days away from work,job transfer, or restriction
Otherrecordable
casesTotalCases
with daysaway from
work5
Caseswith job
transfer orrestriction
Urban transit systems ................................................................................ 4851 41.6 7.6 5.5 3.8 1.8 2.1Interurban and rural bus transportation ..................................................... 4852 17.4 6.0 3.5 2.8 .6 2.6Taxi and limousine service ........................................................................ 4853 67.6 2.7 1.8 1.5 .4 .9
Taxi service ........................................................................................... 48531 32.0 3.8 2.6 2.0 .6 1.2Limousine service .................................................................................. 48532 35.6 1.5 1.0 .9 – –
School and employee bus transportation .................................................. 4854 184.1 5.2 3.4 2.7 .7 1.8Charter bus industry .................................................................................. 4855 30.0 3.9 2.3 1.7 .5 1.6Other transit and ground passenger transportation ................................... 4859 78.8 6.3 4.0 2.5 1.4 2.4
Pipeline transportation ................................................................................... 486 41.6 2.5 1.1 .9 .2 1.4Pipeline transportation of crude oil ............................................................ 4861 8.9 1.8 1.2 1.0 – –Pipeline transportation of natural gas ........................................................ 4862 25.9 2.9 .8 .6 .2 2.1
All other pipeline transportation ............................................................. 48699 .4 – – – – –Scenic and sightseeing transportation ........................................................... 487 26.4 4.0 2.6 1.6 .9 1.4
Scenic and sightseeing transportation, water ............................................ 4872 13.8 3.6 2.1 1.4 .7 1.4Support activities for transportation ............................................................... 488 539.8 3.8 2.6 1.6 1.1 1.2
Support activities for air transportation ...................................................... 4881 155.8 4.9 3.1 1.2 – 1.7Support activities for rail transportation ..................................................... 4882 21.6 4.9 2.8 1.6 1.3 2.1Support activities for water transportation ................................................. 4883 87.6 5.2 3.8 3.4 .4 1.4
Port and harbor operations .................................................................... 48831 19.1 6.1 4.7 4.4 .3 1.4Marine cargo handling ........................................................................... 48832 40.2 6.5 4.9 4.4 .4 1.6Navigational services to shipping .......................................................... 48833 18.6 2.1 1.3 .6 .7 .8Other support activities for water transportation .................................... 48839 9.8 4.7 2.4 2.2 – 2.3Other support activities for road transportation ..................................... 48849 30.1 5.6 4.2 3.1 1.1 1.4
Freight transportation arrangement ........................................................... 4885 168.9 2.1 1.3 .7 .6 .8Other support activities for transportation .............................................. 4889 25.6 3.4 2.6 1.2 1.4 .8
Couriers and messengers ............................................................................. 492 519.9 7.2 4.6 2.6 2.0 2.6Couriers and express delivery services ..................................................... 4921 477.4 7.5 4.8 2.7 2.1 2.8Local messengers and local delivery ......................................................... 4922 42.4 3.8 3.1 2.1 1.0 .7
Warehousing and storage ............................................................................. 493 631.6 5.9 4.1 1.8 2.4 1.8Warehousing and storage ......................................................................... 4931 631.6 5.9 4.1 1.8 2.4 1.8
General warehousing and storage ........................................................ 49311 531.9 5.9 4.1 1.7 2.4 1.8Refrigerated warehousing and storage ................................................. 49312 48.4 7.2 5.3 2.6 2.7 1.9Farm product warehousing and storage ................................................ 49313 8.5 6.5 3.2 2.7 .5 3.2Other warehousing and storage ............................................................ 49319 42.7 5.1 3.3 1.5 1.7 1.8
Utilities ....................................................................................................... 22 557.1 3.1 1.7 1.0 .7 1.3Utilities ........................................................................................................... 221 557.1 3.1 1.7 1.0 .7 1.3
Electric power generation, transmission and distribution .......................... 2211 401.9 2.8 1.5 .9 .6 1.3Electric power generation ...................................................................... 22111 174.6 2.1 1.2 .6 .6 .8
Fossil fuel electric power generation ................................................. 221112 106.4 2.9 1.8 1.0 .8 1.1Nuclear electric power generation ..................................................... 221113 52.2 .6 .3 .1 .1 .3
See footnotes at end of table.

TABLE 1. Incidence rates1 of nonfatal occupational injuries and illnesses by industry and case types, 2010 — Continued
Industry2 NAICScode3
2010Annualaverage
employment4(thousands)
Totalrecordable
cases
Cases with days away from work,job transfer, or restriction
Otherrecordable
casesTotalCases
with daysaway from
work5
Caseswith job
transfer orrestriction
Electric power transmission, control, and distribution ............................ 22112 227.2 3.4 1.7 1.2 0.6 1.6Natural gas distribution .............................................................................. 2212 108.2 3.7 2.4 1.1 1.2 1.3Water, sewage and other systems ............................................................ 2213 47.1 4.5 2.5 1.6 .8 2.1
Water supply and irrigation systems ...................................................... 22131 37.7 4.4 2.6 1.5 1.0 1.8Sewage treatment facilities .................................................................... 22132 7.5 4.1 2.3 2.0 .3 1.8
Information ........................................................................................... 2,725.6 1.8 1.1 .8 .3 .8
Information ................................................................................................. 51 2,725.6 1.8 1.1 .8 .3 .8Publishing industries (except Internet) .......................................................... 511 767.3 1.2 .7 .4 .2 .6
Newspaper, periodical, book, and directory publishers ............................. 5111 509.6 1.8 1.0 .6 .4 .8Newspaper publishers ........................................................................... 51111 260.1 2.7 1.5 1.1 .5 1.1Periodical publishers ............................................................................. 51112 119.2 .7 .3 .2 .1 .4Book publishers ..................................................................................... 51113 73.2 1.1 .6 .2 .4 .5Directory and mailing list publishers ...................................................... 51114 35.2 1.1 .8 .6 .2 .3Other publishers .................................................................................... 51119 21.9 1.5 1.0 .4 .5 .5
Software publishers ................................................................................... 5112 257.8 .2 .1 11( ) 11( ) .2Motion picture and sound recording industries .............................................. 512 361.3 2.3 .8 .5 .2 1.6
Motion picture and video industries ........................................................... 5121 344.0 2.4 .8 .5 .2 1.6Motion picture and video distribution ..................................................... 51212 5.4 .4 – – – –Motion picture and video exhibition ....................................................... 51213 132.1 5.2 1.2 .8 .4 4.0Postproduction services and other motion picture and video industries 51219 18.8 .8 .5 .2 .3 .3
Sound recording industries ........................................................................ 5122 17.3 2.0 .6 .6 – 1.3Sound recording studios ........................................................................ 51224 5.4 – – – – –
Broadcasting (except Internet) ...................................................................... 515 295.0 2.8 1.4 .9 .5 –Radio and television broadcasting ............................................................. 5151 210.6 – .7 .6 11( ) –
Radio broadcasting ................................................................................ 51511 93.9 1.1 .3 .3 11( ) .8Television broadcasting ......................................................................... 51512 116.7 – .9 .8 .1 –
Cable and other subscription programming ............................................... 5152 84.4 4.4 3.3 1.5 1.8 1.1Telecommunications8 .................................................................................... 517 922.7 2.2 1.6 1.2 .4 .7
Wired telecommunications carriers8 .......................................................... 5171 613.2 2.7 1.9 1.4 .5 .7Wireless telecommunications carriers (except satellite) ............................ 5172 176.3 .9 .5 .3 .1 .4Satellite telecommunications ..................................................................... 5174 11.8 .7 .3 .2 – –Other telecommunications8 ....................................................................... 5179 121.4 2.2 1.6 1.2 .4 .6
Other information services8 ........................................................................... 519 139.3 .7 .4 .4 11( ) .3Other information services8 ....................................................................... 5191 139.3 .7 .4 .4 11( ) .3
News syndicates .................................................................................... 51911 12.2 .3 .2 .2 – .1Internet publishing and broadcasting and web search portals12 ........... 51913 88.1 .3 .1 .1 – –
Financial activities ............................................................................... 7,508.5 1.3 .6 .4 .2 .7
See footnotes at end of table.

TABLE 1. Incidence rates1 of nonfatal occupational injuries and illnesses by industry and case types, 2010 — Continued
Industry2 NAICScode3
2010Annualaverage
employment4(thousands)
Totalrecordable
cases
Cases with days away from work,job transfer, or restriction
Otherrecordable
casesTotalCases
with daysaway from
work5
Caseswith job
transfer orrestriction
Finance and insurance .............................................................................. 52 5,542.9 0.8 0.3 0.2 0.1 0.5Monetary authorities - central bank ............................................................... 521 20.8 1.5 .5 .3 .2 1.0Credit intermediation and related activities .................................................... 522 2,554.6 .9 .3 .2 .1 .6
Depository credit intermediation ................................................................ 5221 1,720.3 1.0 .3 .2 .1 .7Commercial banking .............................................................................. 52211 1,294.5 .9 .3 .2 .1 .6Savings institutions ................................................................................ 52212 183.5 – .4 .3 – –Credit unions ......................................................................................... 52213 227.3 1.2 .5 .5 .1 .7Other depository credit intermediation ................................................... 52219 14.9 – – – – –
Nondepository credit intermediation .......................................................... 5222 573.9 .7 .2 .2 .1 .4Credit card issuing ................................................................................. 52221 99.5 .7 .1 .1 11( ) .6Sales financing ...................................................................................... 52222 86.4 .7 .3 .2 .1 .4Other nondepository credit intermediation ............................................. 52229 388.1 .6 .2 .1 .1 .4
Activities related to credit intermediation ................................................... 5223 260.4 .6 .2 .2 .1 .4Mortgage and nonmortgage loan brokers ............................................. 52231 64.4 .2 11( ) – – –Financial transactions processing, reserve, and clearinghouseactivities ............................................................................................... 52232 109.0 .9 .4 .2 .2 .6
Other activities related to credit intermediation ..................................... 52239 87.0 .6 .2 .2 11( ) .4Securities, commodity contracts, and other financial investments andrelated activities ........................................................................................... 523 807.2 .3 .1 .1 11( ) .2Securities and commodity contracts intermediation and brokerage .......... 5231 460.1 .2 11( ) 11( ) 11( ) .1
Investment banking and securities dealing ............................................ 52311 152.8 .1 11( ) 11( ) 11( ) .1Securities brokerage .............................................................................. 52312 281.4 .2 11( ) 11( ) 11( ) .2Commodity contracts dealing ................................................................ 52313 13.0 – – – – –
Other financial investment activities .......................................................... 5239 339.4 .4 .2 .1 – .2Portfolio management ........................................................................... 52392 134.4 .4 .3 – – .2All other financial investment activities .................................................. 52399 42.3 .3 .1 .1 – .1
Insurance carriers and related activities ........................................................ 524 2,072.5 .8 .3 .2 .1 .5Insurance carriers ...................................................................................... 5241 1,187.2 .9 .3 .2 .1 .6
Direct life, health, and medical insurance carriers ................................. 52411 619.6 .9 .3 .2 .1 .6Direct insurance (except life, health, and medical) carriers ................... 52412 540.4 1.0 .4 .3 .1 .7Reinsurance carriers ............................................................................. 52413 27.1 .3 .2 .2 – .2
Agencies, brokerages, and other insurance related activities ................... 5242 885.3 .7 .3 .2 .1 .4Insurance agencies and brokerages ..................................................... 52421 648.8 – .3 .2 .1 .3Other insurance related activities .......................................................... 52429 236.5 1.1 .3 .2 11( ) .8
Funds, trusts, and other financial vehicles .................................................... 525 87.7 1.2 .4 .3 – .8Insurance and employee benefit funds ...................................................... 5251 48.4 1.9 .6 .5 – 1.3
Pension funds ........................................................................................ 52511 17.7 2.7 .6 .3 – 2.1Other insurance funds ........................................................................... 52519 20.0 1.6 .7 .7 – .9
Other investment pools and funds ............................................................. 5259 39.3 .4 .1 .1 – .3Open-end investment funds .................................................................. 52591 20.8 .3 .2 .2 – .1
See footnotes at end of table.

TABLE 1. Incidence rates1 of nonfatal occupational injuries and illnesses by industry and case types, 2010 — Continued
Industry2 NAICScode3
2010Annualaverage
employment4(thousands)
Totalrecordable
cases
Cases with days away from work,job transfer, or restriction
Otherrecordable
casesTotalCases
with daysaway from
work5
Caseswith job
transfer orrestriction
Trusts, estates, and agency accounts ................................................... 52592 8.7 – – – – –
Real estate and rental and leasing ............................................................ 53 1,965.6 2.9 1.6 1.0 .6 1.2Real estate8 ................................................................................................... 531 1,418.3 2.7 1.5 1.0 .5 1.2
Lessors of real estate8 ............................................................................... 5311 577.3 3.3 1.9 1.3 – 1.4Lessors of residential buildings and dwellings8 ..................................... 53111 355.3 3.7 2.3 1.6 .8 1.4Lessors of nonresidential buildings (except miniwarehouses)8 ............. 53112 136.7 – 1.0 .6 – 1.0Lessors of miniwarehouses and self-storage units8 .............................. 53113 45.2 – 1.2 .9 .3 –Lessors of other real estate property8 ................................................... 53119 40.1 3.2 1.9 1.6 .2 –
Offices of real estate agents and brokers .................................................. 5312 292.7 – .7 .4 .2 .7Activities related to real estate ................................................................... 5313 548.2 2.9 1.5 .9 – 1.4
Real estate property managers ............................................................. 53131 471.0 3.3 1.6 1.0 – 1.6Offices of real estate appraisers ............................................................ 53132 37.9 .2 .2 .1 – –
Rental and leasing services ........................................................................... 532 521.7 3.3 2.1 1.1 1.0 1.2Automotive equipment rental and leasing ................................................. 5321 163.0 3.8 2.4 1.6 .7 1.5
Passenger car rental and leasing .......................................................... 53211 108.5 3.5 2.0 1.5 .5 1.5Truck, utility trailer, and RV (recreational vehicle) rental and leasing .... 53212 54.5 4.4 2.9 1.9 1.0 1.5
Consumer goods rental ............................................................................. 5322 206.0 3.9 2.8 1.2 – 1.2Consumer electronics and appliances rental ......................................... 53221 27.0 6.5 5.2 2.8 2.4 1.3Other consumer goods rental ................................................................ 53229 95.8 4.6 3.2 1.2 – 1.3
General rental centers ............................................................................... 5323 40.7 2.1 1.4 .5 .9 .7Commercial and industrial machinery and equipment rental and leasing 5324 111.9 2.1 1.2 .7 .5 .8
Construction, transportation, mining, and forestry machinery andequipment rental and leasing .............................................................. 53241 57.9 1.4 1.0 .7 .3 .4
Office machinery and equipment rental and leasing ............................. 53242 8.1 .7 .3 – – .5Other commercial and industrial machinery and equipment rental andleasing ................................................................................................. 53249 46.0 3.3 1.7 .7 1.0 1.6
Lessors of nonfinancial intangible assets (except copyrighted works) .......... 533 25.6 1.0 .2 .1 .1 –
Professional and business services .................................................. 16,644.9 1.7 .9 .6 .3 .8
Professional, scientific, and technical services .......................................... 54 7,525.9 1.0 .4 .3 .2 .6Professional, scientific, and technical services8 ............................................ 541 7,525.9 1.0 .4 .3 .2 .6
Legal services ............................................................................................ 5411 1,133.0 .5 .2 .2 11( ) .3Accounting, tax preparation, bookkeeping, and payroll services ............... 5412 905.5 .5 .2 .1 .1 .3
Accounting, tax preparation, bookkeeping, and payroll services ........... 54121 905.5 .5 .2 .1 .1 .3Offices of certified public accountants ............................................... 541211 405.9 .2 .1 .1 11( ) .1Payroll services ................................................................................. 541214 144.3 .8 .2 .1 .1 .6Other accounting services ................................................................. 541219 240.1 .8 .4 .2 .2 .4
Architectural, engineering, and related services ........................................ 5413 1,295.3 1.0 .4 .3 .2 .5Architectural services ............................................................................ 54131 163.0 .3 .1 .1 – .1
See footnotes at end of table.

TABLE 1. Incidence rates1 of nonfatal occupational injuries and illnesses by industry and case types, 2010 — Continued
Industry2 NAICScode3
2010Annualaverage
employment4(thousands)
Totalrecordable
cases
Cases with days away from work,job transfer, or restriction
Otherrecordable
casesTotalCases
with daysaway from
work5
Caseswith job
transfer orrestriction
Engineering services ............................................................................. 54133 873.3 1.0 0.4 0.2 0.1 0.6Drafting services .................................................................................... 54134 8.2 – – – – –Testing laboratories ............................................................................... 54138 143.3 1.3 .8 .5 .3 .6
Specialized design services ...................................................................... 5414 118.8 .7 .5 .3 .2 .3Computer systems design and related services ........................................ 5415 1,437.0 .4 .2 .1 .1 .2
Computer systems design and related services .................................... 54151 1,437.0 .4 – .1 .1 .2Custom computer programming services .......................................... 541511 623.4 – .2 .1 11( ) .2Computer systems design services ................................................... 541512 655.5 .3 .1 .1 11( ) .2Computer facilities management services ......................................... 541513 51.5 1.1 .5 .2 .3 .7
Management, scientific, and technical consulting services8 ...................... 5416 1,022.2 .6 .3 .2 .1 .3Management consulting services8 ......................................................... 54161 786.6 – .2 .2 .1 –Environmental consulting services ........................................................ 54162 76.8 1.2 .3 .2 – .9Other scientific and technical consulting services ................................. 54169 158.8 .6 .3 .1 .2 .3
Scientific research and development services .......................................... 5417 621.2 1.5 .6 .3 .3 .8Advertising and related services ................................................................ 5418 412.0 1.2 .6 .4 .2 .6Other professional, scientific, and technical services ................................ 5419 581.0 5.7 1.9 1.0 – 3.8
Marketing research and public opinion polling ...................................... 54191 99.3 – – .1 – .4Photographic services ........................................................................... 54192 72.7 1.3 .9 .5 .4 .4Veterinary services ................................................................................ 54194 297.2 9.5 2.7 – 1.0 6.8
Management of companies and enterprises ............................................. 55 1,887.6 1.5 .7 .4 .3 .8
Administrative and support and waste management and remediationservices ................................................................................................... 56 7,231.4 2.8 1.6 1.1 .5 1.2
Administrative and support services8 ............................................................ 561 6,877.4 2.7 1.5 1.1 .4 1.2Facilities support services ......................................................................... 5612 133.5 3.6 1.9 1.4 .6 1.7Employment services8 ............................................................................... 5613 2,535.0 2.1 .9 .6 .3 1.2
Employment placement agencies and executive search services8 ....... 56131 227.2 – .6 .4 .3 –Temporary help services ....................................................................... 56132 1,913.3 1.9 .9 .6 .3 1.0Professional employer organizations ..................................................... 56133 394.5 2.6 1.3 .9 .3 1.4
Business support services ......................................................................... 5614 812.0 1.1 .5 .4 .1 .7Telephone call centers .......................................................................... 56142 421.4 1.1 .4 .4 .1 .7Business service centers ....................................................................... 56143 84.6 1.5 .3 .2 .1 1.2Collection agencies ............................................................................... 56144 150.8 .8 .3 .2 11( ) .6Credit bureaus ....................................................................................... 56145 19.9 .2 – – – .1Other business support services ........................................................... 56149 92.5 1.6 1.0 .7 .3 .6
Travel arrangement and reservation services ........................................... 5615 189.4 1.3 .5 .4 .2 .8Travel agencies ..................................................................................... 56151 85.1 .9 .3 .1 .2 .6Tour operators ....................................................................................... 56152 24.3 1.0 .4 .4 – .6Other travel arrangement and reservation services .............................. 56159 79.9 1.9 .9 .6 .2 1.0
Investigation and security services ............................................................ 5616 784.8 2.0 1.2 .9 .3 .8
See footnotes at end of table.

TABLE 1. Incidence rates1 of nonfatal occupational injuries and illnesses by industry and case types, 2010 — Continued
Industry2 NAICScode3
2010Annualaverage
employment4(thousands)
Totalrecordable
cases
Cases with days away from work,job transfer, or restriction
Otherrecordable
casesTotalCases
with daysaway from
work5
Caseswith job
transfer orrestriction
Investigation, guard, and armored car services ..................................... 56161 671.9 2.0 1.2 0.9 0.3 0.8Investigation services ........................................................................ 561611 38.3 1.0 .6 .5 .1 .5Security guards and patrol services .................................................. 561612 603.8 1.7 1.0 .8 .1 .7Armored car services ......................................................................... 561613 29.8 7.2 4.7 1.9 2.8 2.5
Security systems services ..................................................................... 56162 113.0 2.0 1.1 .9 .2 .9Services to buildings and dwellings ........................................................... 5617 1,739.0 4.3 2.6 1.8 .8 1.6
Exterminating and pest control services ................................................ 56171 94.4 4.1 2.1 1.7 .5 2.0Janitorial services .................................................................................. 56172 913.8 3.4 2.3 1.6 .7 1.1Landscaping services ............................................................................ 56173 612.7 5.5 3.2 2.3 .9 2.2Carpet and upholstery cleaning services ............................................... 56174 42.3 3.8 3.1 1.5 1.6 .7Other services to buildings and dwellings ............................................. 56179 75.8 4.2 1.8 1.2 .6 2.4
Waste management and remediation services ............................................. 562 354.1 4.5 3.0 1.9 1.1 1.5Waste collection ........................................................................................ 5621 138.8 5.2 3.8 2.4 1.4 1.5
Waste collection .................................................................................... 56211 138.8 5.2 3.8 2.4 1.4 1.5Solid waste collection ........................................................................ 562111 119.2 5.4 4.0 2.4 1.5 1.5Other waste collection ....................................................................... 562119 10.6 3.3 1.9 1.6 .3 1.4
Waste treatment and disposal ................................................................... 5622 95.6 4.3 2.7 1.4 1.3 1.6Waste treatment and disposal ............................................................... 56221 95.6 4.3 2.7 1.4 1.3 1.6
Hazardous waste treatment and disposal ......................................... 562211 36.3 3.1 1.9 .7 1.2 1.2Solid waste landfill ............................................................................. 562212 38.9 5.8 3.6 2.2 1.5 2.2Other nonhazardous waste treatment and disposal .......................... 562219 14.3 3.9 2.5 1.4 1.1 1.4
Remediation and other waste management services ................................ 5629 119.6 3.9 2.3 1.6 .7 1.5Remediation services ............................................................................ 56291 74.2 3.6 1.9 1.2 .7 1.8Materials recovery facilities ................................................................... 56292 12.2 3.4 1.8 1.1 .7 1.5All other waste management services ................................................... 56299 33.2 4.5 3.5 2.8 .7 1.1
Education and health services ........................................................... 18,596.7 4.8 2.2 1.3 .9 2.6
Educational services .................................................................................. 61 2,464.5 2.2 .9 .6 .2 1.3Educational services ...................................................................................... 611 2,464.5 2.2 .9 .6 .2 1.3
Elementary and secondary schools ........................................................... 6111 665.1 2.7 1.0 .7 .3 1.7Junior colleges ........................................................................................... 6112 49.6 1.2 .4 .4 – .8Colleges, universities, and professional schools ....................................... 6113 1,139.5 2.2 .9 .6 .3 1.3Business schools and computer and management training ...................... 6114 77.9 .8 .4 .2 – .4
Business and secretarial schools .......................................................... 61141 15.9 2.8 1.7 .9 – 1.0Professional and management development training ........................... 61143 46.1 .4 11( ) – – .4
Technical and trade schools ...................................................................... 6115 121.3 1.5 .6 .3 .3 .9Other schools and instruction .................................................................... 6116 307.8 1.6 .7 .6 .1 .9
Fine arts schools ................................................................................... 61161 70.2 .7 .2 – – .5Sports and recreation instruction ........................................................... 61162 76.8 1.3 .8 .8 – .5All other schools and instruction ............................................................ 61169 143.6 2.1 .9 .8 .1 1.2
See footnotes at end of table.
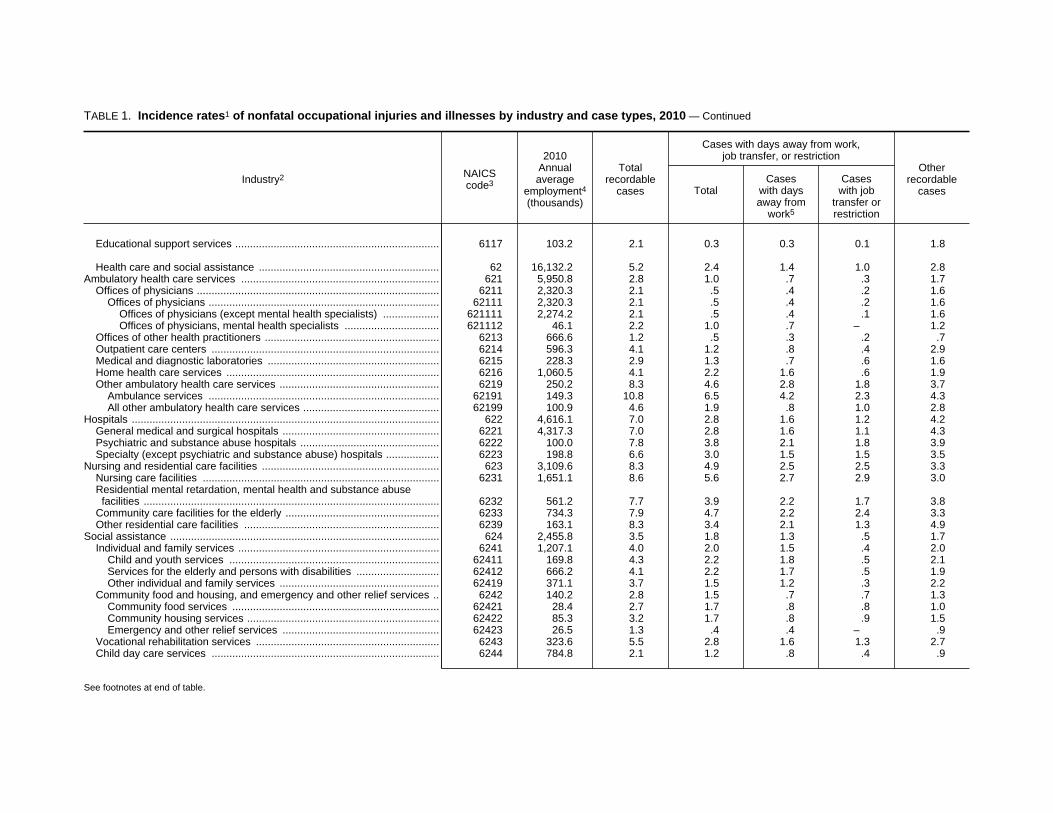
TABLE 1. Incidence rates1 of nonfatal occupational injuries and illnesses by industry and case types, 2010 — Continued
Industry2 NAICScode3
2010Annualaverage
employment4(thousands)
Totalrecordable
cases
Cases with days away from work,job transfer, or restriction
Otherrecordable
casesTotalCases
with daysaway from
work5
Caseswith job
transfer orrestriction
Educational support services ..................................................................... 6117 103.2 2.1 0.3 0.3 0.1 1.8
Health care and social assistance ............................................................. 62 16,132.2 5.2 2.4 1.4 1.0 2.8Ambulatory health care services ................................................................... 621 5,950.8 2.8 1.0 .7 .3 1.7
Offices of physicians .................................................................................. 6211 2,320.3 2.1 .5 .4 .2 1.6Offices of physicians .............................................................................. 62111 2,320.3 2.1 .5 .4 .2 1.6
Offices of physicians (except mental health specialists) ................... 621111 2,274.2 2.1 .5 .4 .1 1.6Offices of physicians, mental health specialists ................................ 621112 46.1 2.2 1.0 .7 – 1.2
Offices of other health practitioners ........................................................... 6213 666.6 1.2 .5 .3 .2 .7Outpatient care centers ............................................................................. 6214 596.3 4.1 1.2 .8 .4 2.9Medical and diagnostic laboratories .......................................................... 6215 228.3 2.9 1.3 .7 .6 1.6Home health care services ........................................................................ 6216 1,060.5 4.1 2.2 1.6 .6 1.9Other ambulatory health care services ...................................................... 6219 250.2 8.3 4.6 2.8 1.8 3.7
Ambulance services .............................................................................. 62191 149.3 10.8 6.5 4.2 2.3 4.3All other ambulatory health care services .............................................. 62199 100.9 4.6 1.9 .8 1.0 2.8
Hospitals ........................................................................................................ 622 4,616.1 7.0 2.8 1.6 1.2 4.2General medical and surgical hospitals ..................................................... 6221 4,317.3 7.0 2.8 1.6 1.1 4.3Psychiatric and substance abuse hospitals ............................................... 6222 100.0 7.8 3.8 2.1 1.8 3.9Specialty (except psychiatric and substance abuse) hospitals .................. 6223 198.8 6.6 3.0 1.5 1.5 3.5
Nursing and residential care facilities ............................................................ 623 3,109.6 8.3 4.9 2.5 2.5 3.3Nursing care facilities ................................................................................ 6231 1,651.1 8.6 5.6 2.7 2.9 3.0Residential mental retardation, mental health and substance abusefacilities .................................................................................................... 6232 561.2 7.7 3.9 2.2 1.7 3.8
Community care facilities for the elderly .................................................... 6233 734.3 7.9 4.7 2.2 2.4 3.3Other residential care facilities .................................................................. 6239 163.1 8.3 3.4 2.1 1.3 4.9
Social assistance ........................................................................................... 624 2,455.8 3.5 1.8 1.3 .5 1.7Individual and family services .................................................................... 6241 1,207.1 4.0 2.0 1.5 .4 2.0
Child and youth services ....................................................................... 62411 169.8 4.3 2.2 1.8 .5 2.1Services for the elderly and persons with disabilities ............................ 62412 666.2 4.1 2.2 1.7 .5 1.9Other individual and family services ...................................................... 62419 371.1 3.7 1.5 1.2 .3 2.2
Community food and housing, and emergency and other relief services .. 6242 140.2 2.8 1.5 .7 .7 1.3Community food services ...................................................................... 62421 28.4 2.7 1.7 .8 .8 1.0Community housing services ................................................................. 62422 85.3 3.2 1.7 .8 .9 1.5Emergency and other relief services ..................................................... 62423 26.5 1.3 .4 .4 – .9
Vocational rehabilitation services .............................................................. 6243 323.6 5.5 2.8 1.6 1.3 2.7Child day care services ............................................................................. 6244 784.8 2.1 1.2 .8 .4 .9
See footnotes at end of table.

TABLE 1. Incidence rates1 of nonfatal occupational injuries and illnesses by industry and case types, 2010 — Continued
Industry2 NAICScode3
2010Annualaverage
employment4(thousands)
Totalrecordable
cases
Cases with days away from work,job transfer, or restriction
Otherrecordable
casesTotalCases
with daysaway from
work5
Caseswith job
transfer orrestriction
Leisure and hospitality ....................................................................... 13,232.5 3.9 1.7 1.1 0.6 2.2
Arts, entertainment, and recreation ........................................................... 71 2,049.9 4.8 2.3 1.3 1.0 2.5Performing arts, spectator sports, and related industries .............................. 711 404.9 6.7 2.8 1.6 1.3 –
Performing arts companies ........................................................................ 7111 110.5 7.3 2.4 1.6 .8 –Spectator sports ........................................................................................ 7112 130.5 – 5.0 2.3 2.6 –
Spectator sports .................................................................................... 71121 130.5 – 5.0 2.3 2.6 –Sports teams and clubs ..................................................................... 711211 69.3 – 8.3 3.8 4.6 –Racetracks ......................................................................................... 711212 38.8 5.4 1.9 .9 .9 3.5Other spectator sports ....................................................................... 711219 22.4 3.6 1.2 .9 .3 2.4
Promoters of performing arts, sports, and similar events .......................... 7113 94.3 2.8 1.1 .7 .4 1.7Agents and managers for artists, athletes, entertainers, and other publicfigures ...................................................................................................... 7114 19.3 2.5 .6 .6 – –
Independent artists, writers, and performers ............................................. 7115 50.3 2.5 1.1 1.1 – 1.5Museums, historical sites, and similar institutions ......................................... 712 127.2 4.7 2.4 1.4 1.0 2.3Amusement, gambling, and recreation industries ......................................... 713 1,517.8 4.3 2.1 1.2 .9 2.2
Amusement parks and arcades ................................................................. 7131 165.1 6.4 4.0 1.3 2.7 2.4Amusement and theme parks ................................................................ 71311 147.1 6.7 4.4 1.4 3.0 2.3
Gambling industries ................................................................................... 7132 251.5 4.5 2.1 1.1 1.0 2.4Other amusement and recreation industries ............................................. 7139 1,101.2 3.9 1.8 1.2 .6 2.1
Golf courses and country clubs ............................................................. 71391 342.4 4.7 1.9 1.3 .6 2.8Skiing facilities ....................................................................................... 71392 34.6 11.8 7.0 3.8 3.2 4.7Marinas .................................................................................................. 71393 30.1 3.5 1.5 1.0 .5 2.0Fitness and recreational sports centers ................................................. 71394 492.4 2.6 1.3 .9 .4 1.3Bowling centers ..................................................................................... 71395 71.0 2.3 .6 .5 .1 1.8All other amusement and recreation industries ..................................... 71399 130.6 4.2 2.5 1.7 .9 1.7
Accommodation and food services ............................................................ 72 11,182.6 3.7 1.5 1.0 .5 2.2Accommodation ............................................................................................. 721 1,788.6 5.3 2.8 1.6 1.2 2.6
Traveler accommodation ........................................................................... 7211 1,724.9 5.4 2.8 1.6 1.2 2.6Hotels (except casino hotels) and motels .............................................. 72111 1,397.7 5.5 2.9 1.7 1.2 2.6Casino hotels ......................................................................................... 72112 302.2 4.7 2.4 1.3 1.1 2.3Other traveler accommodation .............................................................. 72119 24.9 7.8 2.7 1.7 – 5.0
RV (recreational vehicle) parks and recreational camps ........................... 7212 53.1 4.0 1.7 1.3 .4 2.3RV (recreational vehicle) parks and recreational camps ....................... 72121 53.1 4.0 1.7 1.3 .4 2.3
RV (recreational vehicle) parks and campgrounds ............................ 721211 25.5 3.5 1.6 1.3 .3 1.9Recreational and vacation camps (except campgrounds) ................. 721214 27.5 4.5 1.8 1.3 .5 2.7
Rooming and boarding houses .................................................................. 7213 10.6 2.1 .4 – – 1.7Food services and drinking places ................................................................ 722 9,394.0 3.3 1.3 .9 .4 2.1
Full-service restaurants ............................................................................. 7221 4,484.3 3.1 1.1 .8 .2 2.1
See footnotes at end of table.

TABLE 1. Incidence rates1 of nonfatal occupational injuries and illnesses by industry and case types, 2010 — Continued
Industry2 NAICScode3
2010Annualaverage
employment4(thousands)
Totalrecordable
cases
Cases with days away from work,job transfer, or restriction
Otherrecordable
casesTotalCases
with daysaway from
work5
Caseswith job
transfer orrestriction
Limited-service eating places .................................................................... 7222 4,029.1 3.4 1.3 0.9 0.4 2.0Limited-service eating places ................................................................ 72221 4,029.1 3.4 1.3 .9 .4 2.0
Limited-service restaurants ............................................................... 722211 3,430.6 3.3 1.3 .9 .4 2.0Cafeterias, grill buffets, and buffets ................................................... 722212 135.0 3.9 1.5 .9 .5 2.5Snack and nonalcoholic beverage bars ............................................. 722213 463.5 3.3 1.4 1.0 .4 1.9
Special food services ................................................................................. 7223 532.9 5.5 2.9 1.7 1.1 2.6
Other services ...................................................................................... 4,504.8 2.7 1.3 .9 .4 1.4
Other services, except public administration ............................................. 81 4,504.8 2.7 1.3 .9 .4 1.4Repair and maintenance ............................................................................... 811 1,148.6 3.3 1.7 1.3 .4 1.6
Automotive repair and maintenance .......................................................... 8111 807.2 3.2 1.5 1.2 .3 1.7Commercial and industrial machinery and equipment (except automotiveand electronic) repair and maintenance .................................................. 8113 172.9 4.5 2.9 – .9 1.6
Personal and household goods repair and maintenance .......................... 8114 69.7 2.5 1.0 .6 .4 1.5Personal and laundry services ...................................................................... 812 1,284.9 2.3 1.3 .8 .5 1.0
Personal care services .............................................................................. 8121 612.0 .9 .3 .3 .1 –Death care services ................................................................................... 8122 131.4 2.0 1.2 .8 – .8Drycleaning and laundry services .............................................................. 8123 307.0 3.9 2.8 1.4 1.3 1.1
Coin-operated laundries and drycleaners .............................................. 81231 34.2 3.3 2.5 1.9 – .8Drycleaning and laundry services (except coin-operated) ..................... 81232 149.2 – 1.4 1.0 .4 .8Linen and uniform supply ...................................................................... 81233 123.6 5.7 4.2 1.8 2.4 1.6
Linen supply ...................................................................................... 812331 70.5 6.3 4.3 2.1 2.2 2.0Industrial launderers .......................................................................... 812332 53.2 5.0 3.9 1.4 2.5 1.0
Other personal services ............................................................................. 8129 234.4 3.2 1.5 1.2 .3 –Pet care (except veterinary) services .................................................... 81291 62.2 – 2.2 1.8 .4 –Photofinishing ........................................................................................ 81292 15.4 3.0 1.4 1.0 .5 1.6Parking lots and garages ....................................................................... 81293 111.9 2.4 1.4 1.0 .4 1.0All other personal services .................................................................... 81299 44.9 1.1 .8 .7 – .3
Religious, grantmaking, civic, professional, and similar organizations .......... 813 1,324.1 2.6 .9 .7 .3 1.6
State and local government6 ...................................................... 18,424.1 5.7 2.5 1.8 .7 3.2
State government6 ....................................................................... 4,624.5 4.6 2.3 1.8 .5 2.4
Service providing ............................................................................ 4,542.2 4.6 2.3 1.7 .5 2.4
Education and health services ........................................................... 2,547.2 4.9 2.3 1.6 .7 2.6
Educational services .................................................................................. 61 1,928.6 2.6 1.1 .7 .4 1.6Educational services ...................................................................................... 611 1,928.6 2.6 1.1 .7 .4 1.6
See footnotes at end of table.

TABLE 1. Incidence rates1 of nonfatal occupational injuries and illnesses by industry and case types, 2010 — Continued
Industry2 NAICScode3
2010Annualaverage
employment4(thousands)
Totalrecordable
cases
Cases with days away from work,job transfer, or restriction
Otherrecordable
casesTotalCases
with daysaway from
work5
Caseswith job
transfer orrestriction
Colleges, universities, and professional schools ....................................... 6113 1,641.6 2.6 1.1 0.6 0.4 1.6
Health care and social assistance ............................................................. 62 618.6 10.7 5.6 4.1 1.5 5.1Hospitals ........................................................................................................ 622 344.6 11.8 5.1 3.6 1.6 6.6Nursing and residential care facilities ............................................................ 623 140.6 15.1 9.9 7.6 2.4 5.2
Public administration .......................................................................... 1,851.3 4.2 2.1 1.8 .3 2.1
Public administration ................................................................................. 92 1,851.3 4.2 2.1 1.8 .3 2.1Justice, public order, and safety activities ..................................................... 922 724.1 6.0 3.2 2.8 .4 2.8
Justice, public order, and safety activities ................................................. 9221 724.1 6.0 3.2 2.8 .4 2.8Police protection .................................................................................... 92212 96.7 6.7 4.1 3.8 .3 2.6Correctional institutions ......................................................................... 92214 425.0 7.8 4.1 3.5 .6 3.7
Local government6 ...................................................................... 13,799.6 6.1 2.6 1.8 .8 3.5
Goods producing6 ........................................................................... 110.5 9.5 4.9 – 1.3 4.5
Construction ........................................................................................ 109.4 9.5 5.0 – 1.3 4.5
Construction .............................................................................................. 23 109.4 9.5 5.0 – 1.3 4.5Heavy and civil engineering construction ...................................................... 237 106.8 9.6 5.0 – 1.3 4.6
Service providing ............................................................................ 13,689.1 6.1 2.6 1.8 .8 3.5
Trade, transportation, and utilities10 ................................................. 515.4 6.7 4.1 2.9 1.2 2.6
Transportation and warehousing10 ............................................................ 48-49 271.0 7.2 4.4 3.7 .8 2.7Transit and ground passenger transportation ................................................ 485 220.3 7.2 4.5 3.9 .6 2.7
Utilities ....................................................................................................... 22 241.2 6.2 3.8 2.1 – 2.4Utilities ........................................................................................................... 221 241.2 6.2 3.8 2.1 – 2.4
Water, sewage and other systems ............................................................ 2213 163.1 6.2 4.0 2.1 – 2.3
Education and health services ........................................................... 8,689.4 5.1 1.9 1.3 .6 3.3
Educational services .................................................................................. 61 7,785.9 4.9 1.7 1.2 .5 3.2Educational services ...................................................................................... 611 7,785.9 4.9 1.7 1.2 .5 3.2
Elementary and secondary schools ........................................................... 6111 7,236.1 5.1 1.8 1.2 .5 3.3
Health care and social assistance ............................................................. 62 903.5 6.6 2.7 1.8 .9 3.9
See footnotes at end of table.

TABLE 1. Incidence rates1 of nonfatal occupational injuries and illnesses by industry and case types, 2010 — Continued
Industry2 NAICScode3
2010Annualaverage
employment4(thousands)
Totalrecordable
cases
Cases with days away from work,job transfer, or restriction
Otherrecordable
casesTotalCases
with daysaway from
work5
Caseswith job
transfer orrestriction
Hospitals ........................................................................................................ 622 650.9 6.9 2.5 1.7 0.8 4.4Nursing and residential care facilities ............................................................ 623 77.6 11.4 7.3 4.2 3.1 4.2
Public administration .......................................................................... 3,953.9 7.6 3.4 2.5 1.0 4.1
Public administration ................................................................................. 92 3,953.9 7.6 3.4 2.5 1.0 4.1Justice, public order, and safety activities ..................................................... 922 993.0 10.2 4.9 4.0 .9 5.3
Justice, public order, and safety activities ................................................. 9221 993.0 10.2 4.9 4.0 .9 5.3Police protection .................................................................................... 92212 442.5 11.1 4.9 4.1 .8 6.2Fire protection ........................................................................................ 92216 234.3 13.9 7.9 6.8 1.1 6.0
1 The incidence rates represent the number of injuries and illnesses per 100 full-time workers andwere calculated as: (N/EH) x 200,000, where
N = number of injuries and illnesses EH = total hours worked by all employees during the
calendar year 200,000 = base for 100 equivalent full-time workers
(working 40 hours per week, 50 weeks per year)
2 Totals include data for industries not shown separately.3 North American Industry Classification System — United States, 20074 Employment is expressed as an annual average and is derived primarily from the BLS-Quarterly
Census of Employment and Wages (QCEW) program.5 Days-away-from-work cases include those that result in days away from work with or without job
transfer or restriction.6 Excludes farms with fewer than 11 employees.7 Data for Mining (Sector 21 in the North American Industry Classification System — United States,
2007) include establishments not governed by the Mine Safety and Health Administration rules andreporting, such as those in Oil and Gas Extraction and related support activities. Data for mining
operators in coal, metal, and nonmetal mining are provided to BLS by the Mine Safety and HealthAdministration, U.S. Department of Labor. Independent mining contractors are excluded from the coal,metal, and nonmetal mining industries. These data do not reflect the changes the Occupational Safetyand Health Administration made to its recordkeeping requirements effective January 1, 2002; therefore,estimates for these industries are not comparable to estimates in other industries.
8 Industry scope changed in 2009.9 Data for mining operators in this industry are provided to BLS by the Mine Safety and Health
Administration, U.S. Department of Labor. Independent mining contractors are excluded. These datado not reflect the changes the Occupational Safety and Health Administration made to its recordkeepingrequirements effective January 1, 2002; therefore, estimates for these industries are not comparable toestimates in other industries.
10 Data for employers in railroad transportation are provided to BLS by the Federal RailroadAdministration, U.S. Department of Transportation.
11 Data too small to be displayed.12 Industry added in 2009.
NOTE: Because of rounding, components may not add to totals. Dash indicates data do not meetpublication guidelines.
SOURCE: Bureau of Labor Statistics, U.S. Department of Labor, October 2011