systems thinking and the theory of constraints
DESCRIPTION
Systems Thinking and the Theory of Constraints. The “Job-Shop” Simulation. 4 types of products. Product #1. Product #2. B. Start. B. Start. Finish. Finish. A. D. A. D. C. C. Product #3. Product #4. Finish. B. B. Start. Start. A. D. A. D. C. C. Finish. - PowerPoint PPT PresentationTRANSCRIPT

2008, M.
Srinivasan1
Systems Thinking and the Theory of Constraints

2008, M.
Srinivasan2
The “Job-Shop” Simulation
4 types of products
A
B
C
D A
B
C
D
A
B
C
D A
B
C
D
Product #1 Product #2
Product #3 Product #4
StartStart
Start Start
Finish
Finish
Finish
Finish

2008, M.
Srinivasan3
The “Job-Shop” Simulation
Objective: Produce “kits” of products Each kit requires one job of each type
Number of days given to complete kits: 20 days Scorecard: Teams will be “graded” based on:
No. of kits produced Tie-breaker 1: Max. flow days Tie-breaker 2: Total no. of products produced

2008, M.
Srinivasan4
The “Job-Shop” Simulation: Scorecard
Team 1
Team 2
Team 3
Team 4
Team 5
Team 6
Team 7
Team 8
#Blue
#Pink
#Green
#Brown
# KitsMax Flow Days
No. of Products

2008, M.
Srinivasan5
The “Job-Shop” Simulation
What could we have done better? Manage the bottleneck better, right? How can we do that?

2008, M.
Srinivasan6
Systems Thinking
Integrated decision making “Big Picture” Thinking
Thinking “Globally” rather than “Locally”
Understanding how localized decision making can affect the overall goal

2008, M.
Srinivasan7
The Theory of Constraints
Eli Goldratt, a physicist. OPT: a scheduling package. The Goal and the Theory of Constraints.
TOC provides a way of thinking globally.
Goldratt challenges the conventional approach to managing organizations.
2008, M.
Srinivasan8
Traditional Decision Making
The “Cost World” Perspective

2008, M.
Srinivasan9
Traditional Decision Making
How are investment decisions usually made? Usually based on cost considerations (right)? “The Cost-World” Perspective
Consider how the cost-world perspective affects the push towards parts per million (PPM) quality and “Zero” inventory.

2008, M.
Srinivasan10
The Cost World Perspective: Cost and PPM Quality
ReducingScrap
From To
AnnualCost
Savings
AnnualInvestment
NeededThe CostJudgment
Do It!
Maybe?
Do NOT Do
8% 2%
2% 0.5%
0.5% 0.1%
$60,000$15,000
$4,000
$20,000$20,000
$20,000

2008, M.
Srinivasan11
Is 99.5% Quality Good Enough For You?
Doctors in New York State hospitals drop 1,291 babies per year
Chicago O’Hare International Airport has 4,197 unsafe arrivals / departures per year
Post Offices in New York State lose 9,315 pieces of mail per day
No problem. Everything is OK!
If it is, then you won’t mind if:I’ll do better
next time!

2008, M.
Srinivasan12
The Cost World Perspective: Cost and Inventory Turns
IncreasingInventory
Turns
AnnualCost
Savings*
AnnualInvestment
NeededThe CostJudgment
3 6 $2M $2M6 12 $1M $2M12 24 $0.5M $2M
* Assuming starting inventory of $15M and 25% carrying cost
Do It
Maybe?
Do NOT Do
2008, M.
Srinivasan13
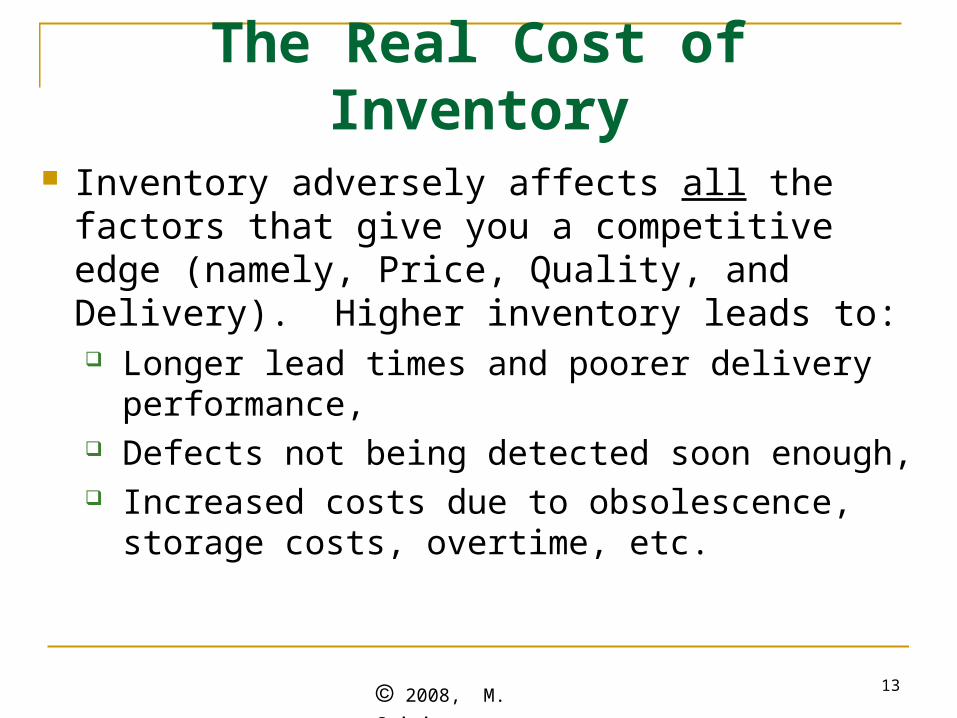
The Real Cost of Inventory
Inventory adversely affects all the factors that give you a competitive edge (namely, Price, Quality, and Delivery). Higher inventory leads to: Longer lead times and poorer delivery performance, Defects not being detected soon enough, Increased costs due to obsolescence, storage costs,
overtime, etc.

2008, M.
Srinivasan14
Traditional Decision Making
Inventory Valuation and Cost Accounting

2008, M.
Srinivasan15
An Inventory Conundrum
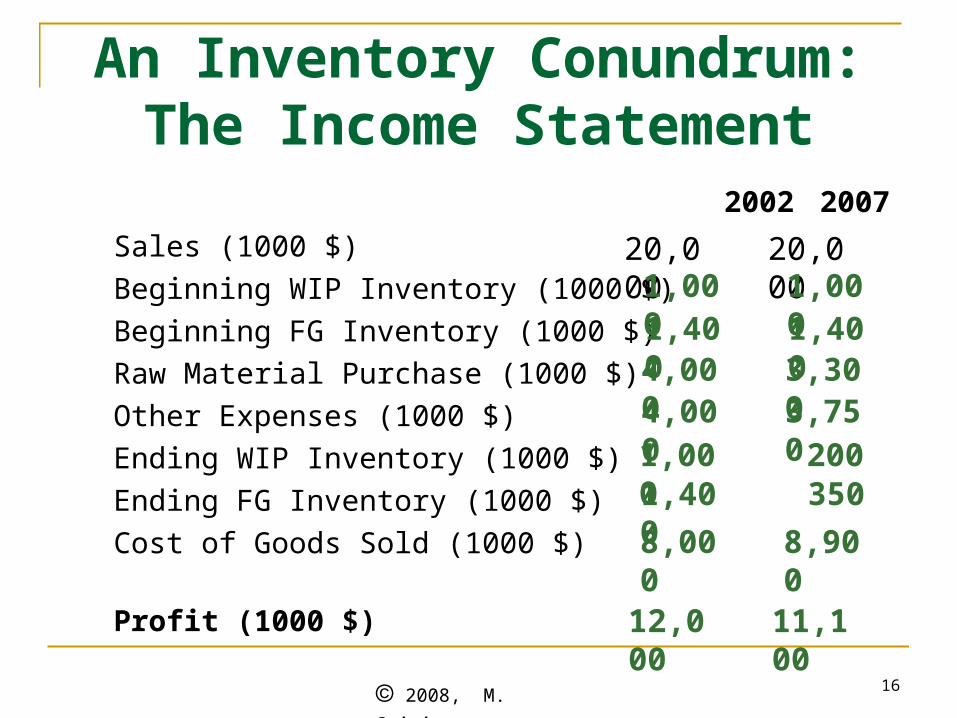
Raw Material cost per unit: $10WIP value per unit: $20Finished Goods value per unit: $35Sale Price per unit: $50
Other Operating Expenses: $4 Million in 2006; $3.75 Million in 2007
2006 2007
Beginning WIP Inventory (1000 units) 50 50
Beginning FG Inventory (1000 units) 40 40
Raw Material (1000 units) 400 330
Sales (1000 units) 400 400
Ending WIP Inventory (1000 units) 50 10
Ending FG Inventory (1000 units) 40 10
2008, M.
Srinivasan16
An Inventory Conundrum: The Income Statement
2002 2007
Sales (1000 $)
Beginning WIP Inventory (1000 $)
Beginning FG Inventory (1000 $)
Raw Material Purchase (1000 $)
Other Expenses (1000 $)
Ending WIP Inventory (1000 $)
Ending FG Inventory (1000 $)
Cost of Goods Sold (1000 $)
Profit (1000 $)
20,000 20,0001,000 1,0001,400 1,4004,000 3,3004,000 3,7501,000 2001,400 350
8,000 8,900
12,000 11,100

2008, M.
Srinivasan17
Traditional Decision Making:Product Costs
How can we calculate a company’s profit?
Net Profit = p Revenuep - c Expensec.
But how do we use this information to, say, decide on launching a new product?
Net Profitp = Revenuep - Expensep, and so,
Net Profit = p Net Profitp
Allocate! If we allocate overhead costs correctly:

2008, M.
Srinivasan18
Obtaining Accurate Product Costs
How do we allocate overhead costs properly so that product costs are accurate? Standard Costing
Activity Based Costing (ABC)
2008, M.
Srinivasan19
Exercise in Cost Accounting:Cromby, Steele and Nash, Inc.
CSN, Inc. is a home maintenance services operation, started by three men, Cromby, Steele, and Nash.
Services offered: Plumbing, Window Cleaning, Gutter Guard Installation, and Landscaping.
There is ample demand for these services. However, there is also a shortage of qualified workers in the area.
CSN has had a motto: “Teach Your Children Well,” ever since their young-er days. They have employed their children, 5 high-school graduates, to run operations.

2008, M.
Srinivasan20
Monthly wage per employee = $2,000 including benefits
Hours budgeted per employee per month = 200 hours
Monthly capacity with 5 employees = 1,000 hours
Total Direct Labor cost per month = $10,000
Direct labor rate = $10,000/1,000 = $10 per hour
CSN, Inc.: Labor Costs

2008, M.
Srinivasan21
CSN, Inc.: Revenue & Cost DataJob Type Plumbing Window
CleaningGutter Guards
Landscaping
Labor Hours/job 2 hours 4 hours 3 hours 5 hours
Revenue/job $130 $170 $200 $250
Material Cost $30 $10 $70 $75
Labor Cost $20 $40 $30 $50
Current Monthly Output
90 jobs 70 jobs 80 jobs 60 jobs
Note:
Total number of jobs per month = 90 + 70 + 80 + 60 = 300 jobs.
At current output level, capacity used = 90 x 2 + 70 x 4 + 80 x 3 + 60 x 5
= 1,000 hours per month

2008, M.
Srinivasan22
Monthly Administrative Overhead (Salaries) = $18,000.
Monthly Non-Administrative Overhead (Rent, Truck Fleet Maintenance, Marketing, Depreciation) = $9,000.
Overhead is currently allocated to products based on production volume. Current volume is 300 jobs per month.
Administrative Overhead per job $18,000/300 = $60.
Non-Administrative Overhead per job = $9,000/300 = $30.
CSN, Inc.: Overheads

2008, M.
Srinivasan23
CSN, Inc.: Summary Cost TableJob Type Plumbing Window
CleaningGutter Guards
Landscaping
Labor Hours/job 2 hours 4 hours 3 hours 5 hours
Revenue/job $130 $170 $200 $250
Material Cost $30 $10 $70 $75
Labor Cost $20 $40 $30 $50
Administrative Overhead Allocation
$60 $60 $60 $60
Non-Administrative Overhead Allocation
Profit -$10 $30 $10 $35
$30 $30 $30 $30
Current Output 90 jobs 70 jobs 80 jobs 60 jobs

2008, M.
Srinivasan24
CSN is using all its labor capacity, and is absorbing all overheads. So there is no labor variance or overhead absorption variance to worry about.
Therefore, the total profit is:
90 x (-$10) + 70 x $30 + 80 x $10 + 60 x $35 =
$4,100 per month.
Cromby, Steele & Nash, Inc.

2008, M.
Srinivasan25
CSN, Inc.: Activity-Based Costing
CSN, Inc. wants to use a better method to allocate the overheads (using Activity-Based Costing).
To accurately allocate Administrative Overhead, CSN gathers data on the time the administrators, Cromby, Steele and Nash, devote to the four products, each month. The data reveals the following breakdown on the time administration spends on the 4 products:
Plumbing: 30%; Window Cleaning: 35%
Gutter Guards: 20%; Landscaping: 15%

2008, M.
Srinivasan26
Job Type Plumbing Window Cleaning
Gutter Guards
Landscaping
Admin O/H Allocated = %age effort x $18,000
$5,400 $6,300 $3,600
Number of Jobs 90 jobs 70 jobs 80 jobs 60 jobs
Administrative O/H Allocation per job
$60 $90 $45
Percentage Effort 30% 35% 20% 15%
CSN, Inc.: Administrative Overhead Allocation using ABC
$45
$2,700
Administrative Overhead to be allocated = $18,000

2008, M.
Srinivasan27
CSN, Inc.: Non-Administrative Overhead Allocation using ABC
Non-Administrative Overhead to be allocated = $9,000.
The allocation is made based on labor hours.
Total labor hours = 1,000. So,
Non-Admin. O/H rate = $9,000/1,000 = $9.00 per labor hour.
Since Plumbing takes 2 hours, the Non-Admin. Overhead allocated to a Plumbing job is = $9 x 2 = $18.
Thus the Non-Administrative Overhead allocation per job is:
Plumbing (2 hours): $18; W. Cleaning (4 hours): $36
G. Guards (3 hours): $27;Landscaping (5 hours): $45

2008, M.
Srinivasan28
Job Type Plumbing Window Cleaning
Gutter Guards
Landscaping
Labor Hrs./job 2 hours 4 hours 3 hours 5 hours
Revenue/job $130 $170 $200 $250
Material Cost $30 $10 $70 $75
Labor Cost $20 $40 $30 $50
Administrative Overhead Allocation
$60 $90 $45 $45
Non-Administrative Overhead Allocation
CSN, Inc.: Improved Allocation with ABC
Profit $2 -$6 $28 $35
$18 $36 $27 $45
Current Output 90 jobs 70 jobs 80 jobs 60 jobs

2008, M.
Srinivasan29
CSN, Inc., Demand for Services
Suppose the monthly demand for these services is:
Plumbing: 250 jobs
Window cleaning: 160 jobs
Gutter guard installs: 145 jobs
Landscaping: 120 jobs
Suppose, too, that CSN, Inc., can choose which products to go after.
What is the best product offering for CSN, Inc., that will maximize its profit?

2008, M.
Srinivasan30
Cromby, Steele & Nash, Inc.
Can CSN do better? Let’s use ABC cost figures.
Which is the most profitable product?
Compute profits if they first complete meeting the demand for the most profitable product, then focus on the next most profitable product, and so on. Use the following pages for your calculations.
Landscaping
2008, M.
Srinivasan31
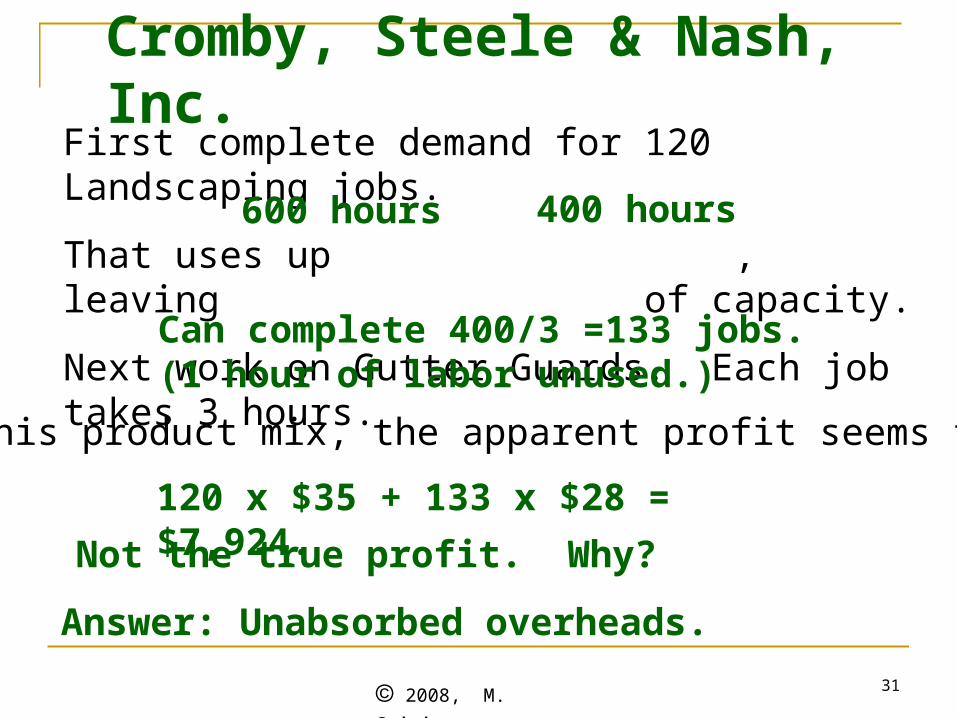
First complete demand for 120 Landscaping jobs.
That uses up , leaving of capacity.
Next work on Gutter Guards. Each job takes 3 hours.
600 hours 400 hours
Can complete 400/3 =133 jobs.(1 hour of labor unused.)
120 x $35 + 133 x $28 = $7,924.
With this product mix, the apparent profit seems to be:
Not the true profit. Why?
Answer: Unabsorbed overheads.
Cromby, Steele & Nash, Inc.

2008, M.
Srinivasan32
CSN, Inc.: Reconciling Variances120 Landscaping and 133 Gutter Guard jobs will each recover $45 of Administrative Overhead, that is:
$45 x 120 + $45 x 133 = $11,385.
Admin. Overhead Variance = $18,000 - $11,385 = $6,615.
So, “optimal” profit is less than earlier profit! Why?
The 1 hour of unused labor gives a Labor Usage Variance of $10 and Non-Admin. Overhead Variance of $9.
So, the total of all the Variances is:
Actual profit with ABC is thus:
$6,634.
$7924 - $6,634 = $1,290.

2008, M.
Srinivasan33
Systems Thinking and the Theory of Constraints
The “Throughput World” Perspective

2008, M.
Srinivasan34
The Theory of Constraints
The Theory of Constraints (TOC) is based on two premises: The Goal of a business is to make more money, … in
the present and in the future.
A system’s constraint(s) determine its output.

2008, M.
Srinivasan35
TOC Performance Measures
Throughput (T): The rate at which the system generates money through sales.
Inventory (I): All the money invested in purchasing things needed by the system to sell its products.
Operating Expenses (OE): All the money the system spends, turning inventory into throughput.

2008, M.
Srinivasan36
The Goal: To Make Money
Bottom Line Measurements
NET PROFIT
RETURN ONINVESTMENT
CASH FLOW(Relative)
(Survival)
(Absolute)

2008, M.
Srinivasan37
Relating TOC Measures to Traditional Measures
Net Profit = T - OE
T = Sales Revenue - Variable Cost (Materials)
OE = Fixed Costs (DL + Overhead)
Asset = Throughput = TTurns “Inventory” I
Return on = Net Profit = T - OE Investment “Inventory” I

2008, M.
Srinivasan38
Priorities in Traditional World
First: OE
Second: T
Distant Third: I

2008, M.
Srinivasan39
Where is the Bang for the Buck? (T vs. OE)
$
Revenue 100
RM 40
DL 10
OH 40
Cost 90
NP 10
100 114
1084040
9888
1612
40 48
Leverage fromDecreasing OE
Leverage fromIncreasing T
Assume a) you have 20% excess capacity, and b) sales will increase by 20% if you can effect a 5% price reduction.
0.95(100) = 951.20(95) = 114
2008, M.
Srinivasan40
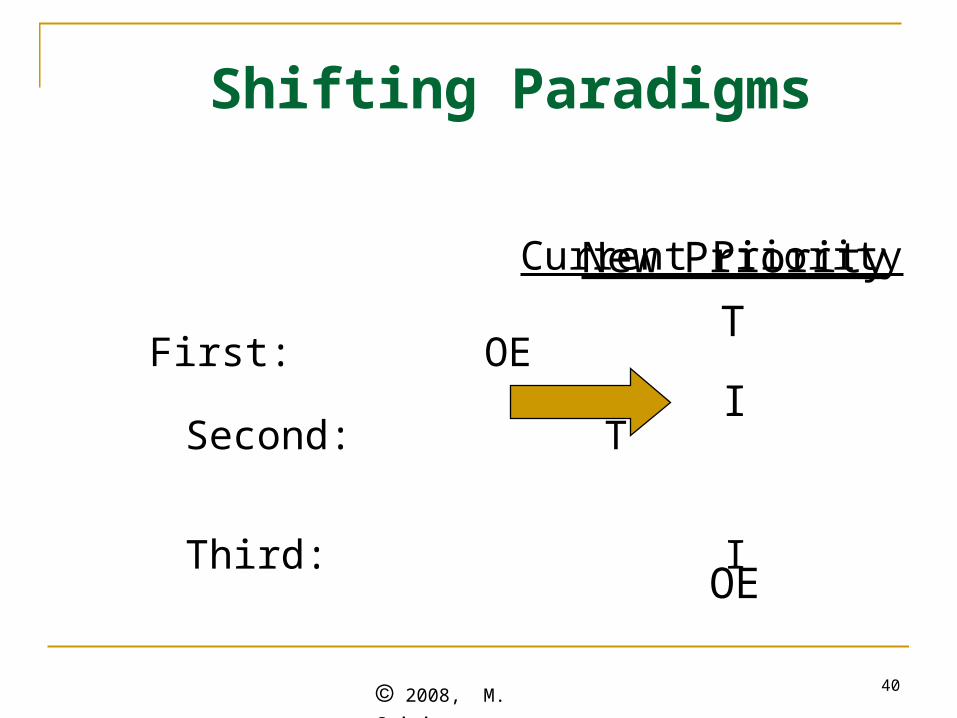
Shifting Paradigms
Current PriorityFirst: OE
Second: T
Third: I
T
I
OE
New Priority

2008, M.
Srinivasan41
Decisions should promote a growth strategy. While enterprises should try to simultaneously increase throughput, decrease inventory, and decrease operating expenses, the focus must be on improving throughput.
Lean Supply Chain Principle 12:
How to Make Money:The Importance of Throughput

2008, M.
Srinivasan42
CSN, Inc.: A Better Approach
a) Consider only the variable costs in the profit equation – use marginal profits.
b) Focus on the constraint. Evaluate rate at which marginal profits are generated at the constraint (Throughput). Best product is the one with the highest Throughput. Complete demand on this product, move to next most profitable product, and so on, till you run out of capacity at constraint.
c) Find total marginal profit, and subtract out fixed costs to get total net profit.

2008, M.
Srinivasan43
Cromby, Steele & Nash, Inc.
Product Plumbing W. Clean G. Guard Landscape
Demand for product 250 jobs 160 jobs 145 jobs 120 jobs
Marginal Profit (Rev. – Var. Cost)
$130-$30 = $100
$170-$10 = $160
$200-$70 = $130
$250-$75 = $175
# of hours needed per job
2 hours 4 hours 3 hours 5 hours
Profit Generation Rate (Throughput)
$50.00 per hour
$40.00 per hour
$43.33 per hour
$35.00 per hour
Capacity at the constraint (total labor hours) = 1,000 hours.
Fixed costs are: Labor + Administrative O/H + Non-Admin. Overhead
= $10,000 + $18,000 + $9,000 = $37,000.

2008, M.
Srinivasan44
Cromby, Steele & Nash, Inc.
This approach is known as Throughput Accounting
Do 250 plumbing jobs first (250 x 2 = 500 hours).
Next, do 145 gutter guards (145 x 3 = 435 hours).
With the remaining 65 hours, you can complete 65/4 = 16 window cleaning jobs (64 hours)
Net Marginal Profit = 250*$100 + 145*$130 + 16*$160 = $46,410.
Subtract fixed costs ($37,000) for net profit = $9,410.

2008, M.
Srinivasan45
CSN, Inc.: Summary
Summary:Profit with arbitrary product mix: $4,100
“Optimal profit” with ABC: $1,290
Optimal profit with Throughput Accounting: $9,410

2008, M.
Srinivasan46
Systems Thinking and the Theory of Constraints
The Job Shop Simulation Revisited
2008, M.
Srinivasan47
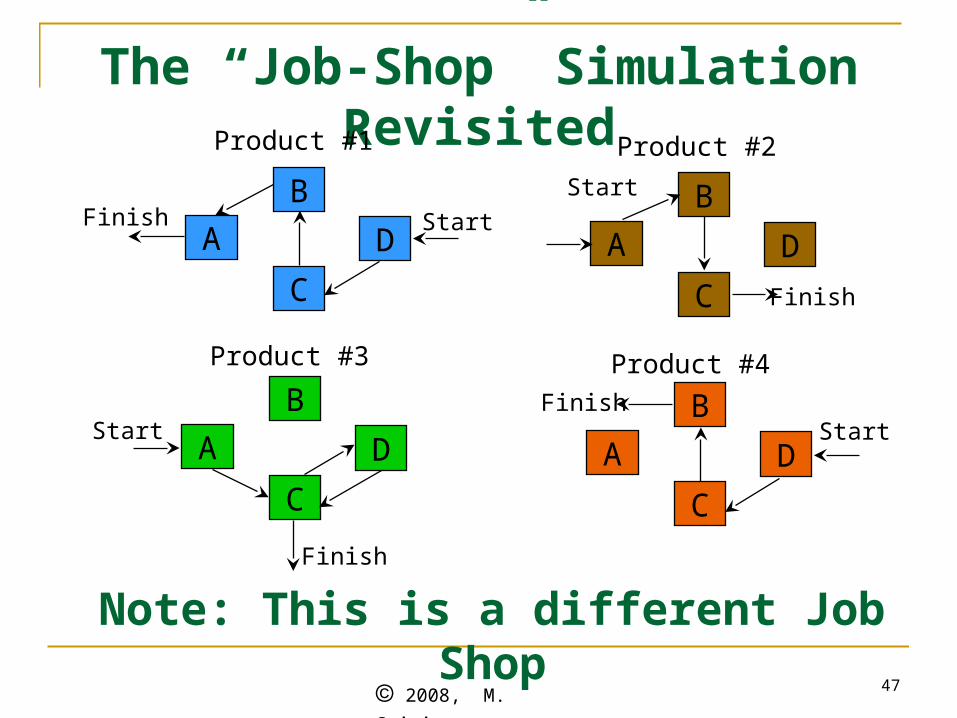
The “Job-Shop” Simulation Revisited
A
B
C
D A
B
C
D
A
B
C
D A
B
C
D
Product #1 Product #2
Product #3 Product #4
FinishStart
Start Start
Start
Finish
Finish
Finish
Note: This is a different Job Shop

2008, M.
Srinivasan48
The “Job-Shop” Simulation
• There are 4 operators. Each operator works 20 days a month at a salary of $2,400 per month.
• The wage rate is set at $120 per operator per day.
• Total labor cost is $9,600.
• The overhead cost (salaries, depreciation, utilities, maintenance, etc.) adds up to $33,600 per month.
• Overhead is allocated based on labor cost as follows: $33,600/$9,600 = 350% of direct labor cost.

2008, M.
Srinivasan49
Job Shop Simulation: Product Costs
• Suppose material costs for the 4 products are:
• Labor Cost is $120 per operator per day
• Overheads are charged at 350% of direct labor cost
• Selling price markup is 30% over total cost.
• Which product(s) should the company focus on?
Product 1: $1,500 Product 2 : $2,500
Product 3 : $2,500 Product 4 : $2,000

2008, M.
Srinivasan50
4
3
2
1
Contri-bution
Sales Price
Sales Mark-up (%)
Product Cost = M+L+O
Over-head (O)
Labor
(L)
Matl. Cost (M)
Product
Profit Contribution Calculations for the 4 Products
1500
2500
2500
2000
480
360
480
360
1680
1260
1680
1260
3660
4120
4660
3620
0.30
0.30
0.30
0.30
4758
5356
6058
4706
1098
1236
1398
1086
Which job(s) will make the company the most money?
Rank them
3
2
1
4

2008, M.
Srinivasan51
The “Job-Shop” Simulation: Scorecard
Team 1
Team 2
Team 3
Team 4
Team 5
Team 6
Team 7
Team 8
#Blue#Brown
#Green
#Orange
$ Profit
Max Flow Days
2008, M.
Srinivasan52
The Theory of Constraints
The Five-Step Focusing Process

2008, M.
Srinivasan53
The Throughput World: The Five Step Focusing Process of TOC
Step 1: Identify the System’s Constraint(s) Step 2: Decide how to Exploit the
System’s Constraints Step 3: Subordinate Everything Else to
that Decision Step 4: Elevate the System’s Constraints Step 5: If a Constraint Was Broken in
Previous Steps, Go to Step 1

2008, M.
Srinivasan54
Types of Constraints
Physical Constraints Physical, tangible; easy to recognize as constraint.
Machine capacity, material availability, space availability, etc.
Market Constraints Demand for company’s products and services is less
than capacity of organization, or not in desired proportion.
Policy Constraints Not physical in nature. Includes entire system of
measures and methods and even mindset that governs the strategic and tactical decisions of the company.

2008, M.
Srinivasan55
Policy Constraints
Mindset Constraints A constraint if thought process or culture of the organization
blocks design & implementation of measures & methods required to achieve goals
Measures Constraints A constraint if the measurement system drive behaviors that
are incongruous with organizational goals
Methods Constraints A constraint when procedures and techniques used result in
actions incompatible with goals

2008, M.
Srinivasan56
Example of a Measures Constraint:The Sales Department
A 1% sales commission: 2 products: Cadillacs: $40,000 Beetles: $20,000
Which product will the sales person push?
Suppose the profit margins are Cadillac: $1,500 Beetle: $2,500
Which product will the CEO want you to push?
Conflicting goals (local and global).

2008, M.
Srinivasan57
Effect of Performance Measures
“Tell me how you will measure me and I will tell you how I will behave.”
“If you measure me in an illogical way, … do not complain about illogical behavior.”

2008, M.
Srinivasan58
Effect of Performance Measures
“If you measure me in an unreasonable way, no one knows how I will behave...”.
“Not even me.”
2008, M.
Srinivasan59
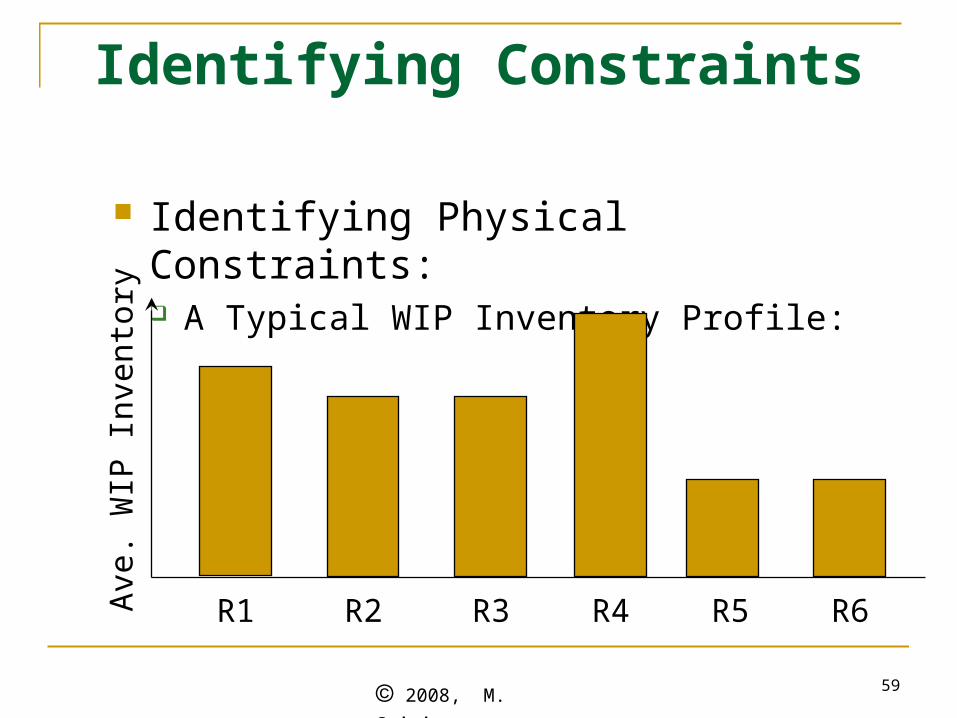
Identifying Constraints
Identifying Physical Constraints: A Typical WIP Inventory Profile:
Ave
. WIP
Inv
ento
ry
R1 R2 R3 R4 R5 R6

2008, M.
Srinivasan60
How can we get the most from Physical Constraints?
Techniques for getting the most from capacity constraints: Eliminate periods of idle time Reduce setup time and run time per unit Improve quality control Purchase additional capacity
Is there anything else we can do?

2008, M.
Srinivasan61
An Example: A Plant Producing 2 Products
Purchased Part$5 / unit
RM1$20 per
unit
RM2$20 per
unit
RM3$20 per
unit
$90 / unit100 units / week
$100 / unit50 units / week
P: Q:
D15 min.
D5 min.
C10 min.
C5 min.
B15 min.
A15 min.
B15 min.
A10 min.
Time available at each work center: 2,400 minutes per weekOperating expenses per week: $6,000
A Production System Manufacturing Two Products, P and Q

2008, M.
Srinivasan62
Can We Meet The Demand?
Perform a Capacity Analysis
Product A B C DP 15 15 15 15
Q 10 30 5 5
Processing Requirements (all times in minutes)
Available time / week on each resource: 2400 min.

2008, M.
Srinivasan63
Can We Meet The Demand?
Resource requirements for 100 P’s and 50 Q’s:
Resource A: 100 x + 50 x = minutes
Resource B: 100 x + 50 x = minutes
Resource C: 100 x + 50 x = minutes
Resource D: 100 x + 50 x = minutes
15 10 2000
15 30 3000
15 5 1750
15 5 1750

2008, M.
Srinivasan64
Any Bottlenecks?
B is a bottleneck.
A, C, & D are not bottlenecks.
We cannot achieve desired levels of production
due to the capacity constraint on B.
What production levels do we set for P & Q?

2008, M.
Srinivasan65
So, is the star and is the “dog.” First we’ll offer the star to the market. If we have residual capacity, we’ll offer the dog! Okay?
The Production Decision Which product has higher profit margin?
Product P: Product Q:
Which product requires less effort? Product P: Product Q:
$45
$60
60 min.
50 min.
Q P

2008, M.
Srinivasan66
What Is The Net Profit?
For 50 units of Q, need 50 x = min. on B, leaving min. on B, for product P.
Each unit of P requires minutes on B. So, we can produce units of P.
If we sell 50 units of Q and units of P, we get 50 x $60 + x $45 = $ per week.
After factoring in operating expense ($6,000), we
30 1500
900
15900/15 = 60
6060 5700
LOSE $300! (Whoops!)

2008, M.
Srinivasan67
Do We Shut The Plant Down?
Is this a “throughput world” perspective? We dealt with “product profits.” Are there
any product profits in the throughput world?
What is the second focusing step? DECIDE HOW TO EXPLOIT THE
CONSTRAINT.

2008, M.
Srinivasan68
Exploiting The Constraint
Each unit of Q brings $ to the company. How many minutes of B for one unit of Q? So, with Q, we receive $ per
constraint minute. Each unit of P brings $ to the company.
How many minutes of B for one unit of P? So, with P, we receive $ per constraint
minute.
60
30
60/30 = $2
45
15
45/15 = $3

2008, M.
Srinivasan69
Throughput World vs. Cost World
The throughput world perspective indicates that we should first focus on producing product .P
The cost world perspective had indicated that we should first focus on producing product .Q
2008, M.
Srinivasan70
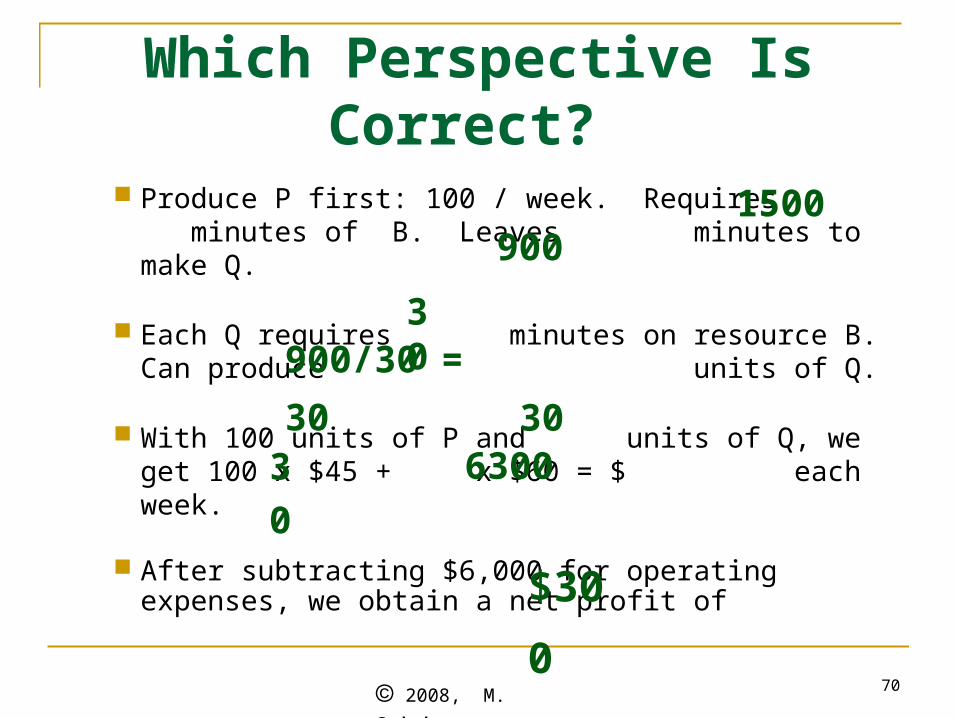
Produce P first: 100 / week. Requires minutes of B. Leaves minutes to make Q.
Each Q requires minutes on resource B. Can produce units of Q.
With 100 units of P and units of Q, we get 100 x $45 + x $60 = $ each week.
After subtracting $6,000 for operating expenses, we obtain a net profit of
1500900
30900/30 = 30
3030 6300
$300
Which Perspective Is Correct?

2008, M.
Srinivasan71
Cost World or Throughput World?
What product will you focus on?
P
But in the long run,“Yes, there are two paths you can go by, …
There’s still time to change the road you’re on.”

2008, M.
Srinivasan72
The “Job-Shop” Simulation
A
B
C
D A
B
C
D
A
B
C
D A
B
C
D
Product #1 Product #2
Product #3 Product #4
FinishStart
Start Start
Start
Finish
Finish
Finish

2008, M.
Srinivasan73
4
3
2
1
Marginal Contribution
Sales Price
Material Cost
Product
Profit Contribution Calculations for the 4 Products
1500
2500
2500
2000
3258
2856
3558
2706
1 (3)
2 (2)
4 (1)
3 (4)
Marginal Contribution / Bottleneck
Days
3258
2856
1779
2706
Revised Ranking
(Old Rank)
# Bottle- Neck Days
Needed
1
1
2
1
4758
5356
6058
4706
2008, M.
Srinivasan74
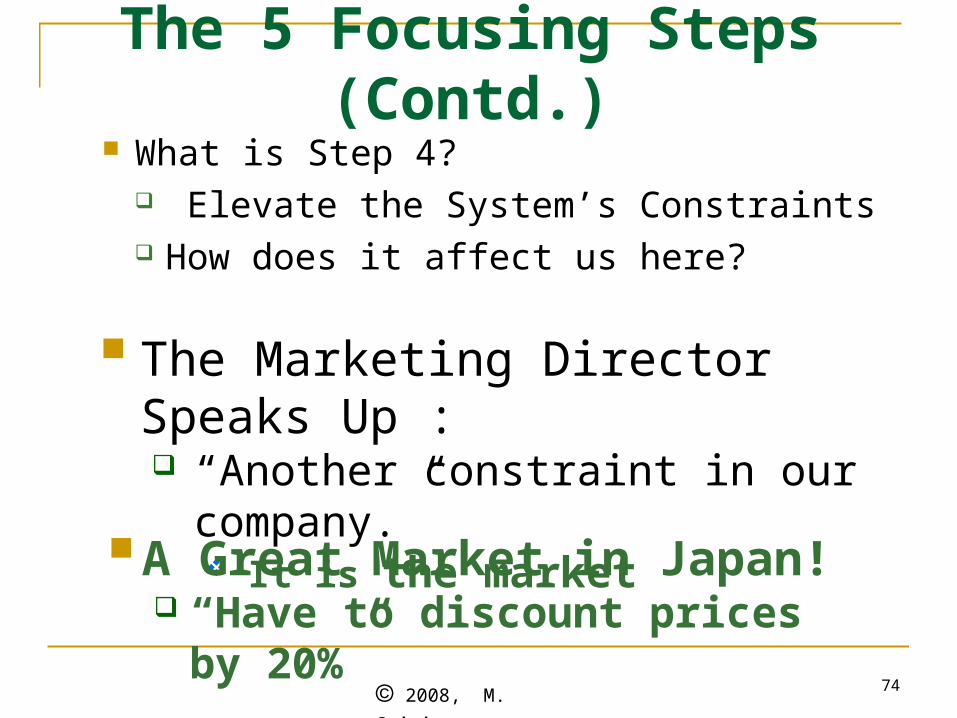
The 5 Focusing Steps (Contd.) What is Step 4?
Elevate the System’s Constraints How does it affect us here?
The Marketing Director Speaks Up : “Another constraint in our company.”
It is the market
A Great Market in Japan! “Have to discount prices by 20%”
2008, M.
Srinivasan75
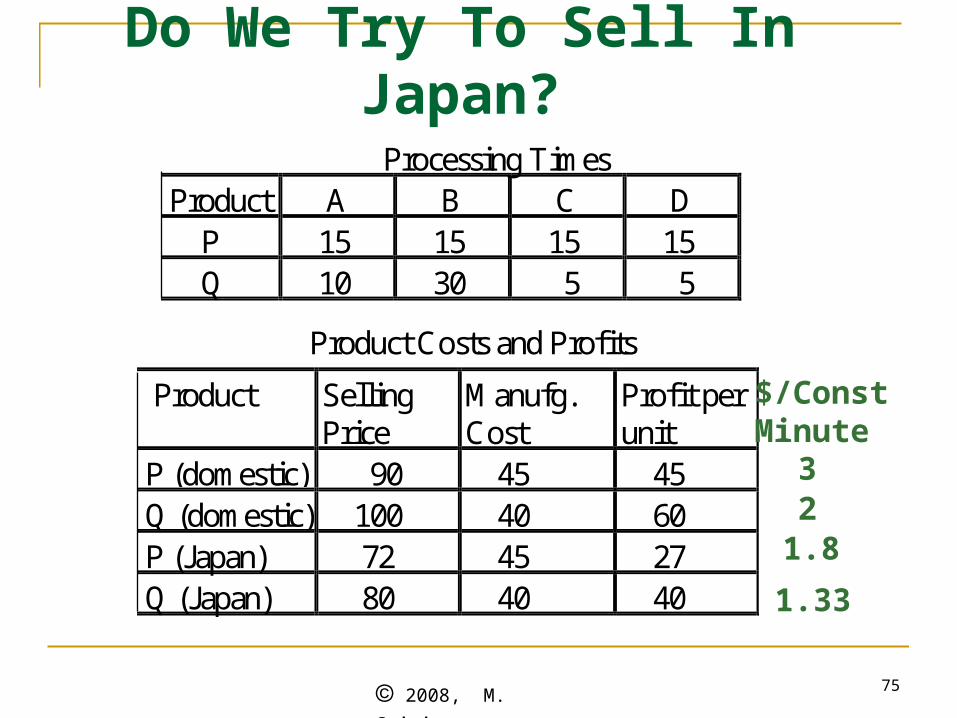
Do We Try To Sell In Japan?
Processing Times Product A B C D P 15 15 15 15 Q 10 30 5 5
Product Costs and Profits
Product SellingPrice
Manufg.Cost
Profit perunit
P (domestic) 90 45 45 Q (domestic) 100 40 60 P (Japan) 72 45 27 Q (Japan) 80 40 40
$/ConstMinute
321.8
1.33

2008, M.
Srinivasan76
Maybe We Should Not Sell in Japan? Right now, we can get at least $ per
constraint minute in the domestic market.2
B
Okay, suppose we do not go to Japan Is there something else we can do?
So, should we go to Japan at all?
Let’s buy another machine! Which one?
How soon do we recover investment?
Cost of the machine = $100,000. Cost of operator: $400 per week.
Perhaps not.
What is weekly operating expense now? $6,400

2008, M.
Srinivasan77
Recovering Our Investment
$3,000(50)
-
$6,400
Plan BProdType
UnitProfit
$/constminute Plan A
$45 3.00 $4,500(100)
$60 2.00 $1,800(30)
$27 1.80 -
$40 1.33 -
OE $6,000
Profit $300
QD
PD
PJ
QJ
6.00
4.00
$4,185(93)
$2,000(50)
$2,785

2008, M.
Srinivasan78
Welcome to the “Paradise Plant!”

2008, M.
Srinivasan79
IF:Clients never change their mind,
Vendors always supply what we ask for, on time,
We do not have any absenteeism,
Our workers are excellently trained,
Our processes are extremely reliable,
Our quality is superb,
Data is readily available and accurate, and
Managing production will be a piece of cake, …
THEN:
You can decide on whatever policies you want.
right?
The Paradise Plant!

2008, M.
Srinivasan80
The Simulator provided you with aparadise plant because all external causeswere eliminated.
Nevertheless,
Was it easy to manage production?
The Paradise Plant!

2008, M.
Srinivasan81
Rethinking Project Management
The Critical Chain
2008, M.
Srinivasan82
Generally a “one-off” type of activity Typically involves completing a set of tasks Tasks typically have long durations that are
also highly variable
Project Management: Characteristics

2008, M.
Srinivasan83
Project Management: Problems Usually Faced
Project is not clearly defined “Known Work” + “Known Unknown Work” + “Unknown Work”
Existing project work is not complete before new projects shift priorities leading to multi-tasking
Problems in a project cascade into another project Constant pressure to increase staff for peak loads A lot of uncertainty involved in estimating task durations

2008, M.
Srinivasan84
First, consider a simple project with 2 tasks performed by 2 different operators:
Managing Projects Under Uncertainty
Task 1 Task 2
If each task takes 15 days on average, what is average project completion time? 30 days
Assume task durations are uniformly distributed (5,25)
5 25
2008, M.
Srinivasan85
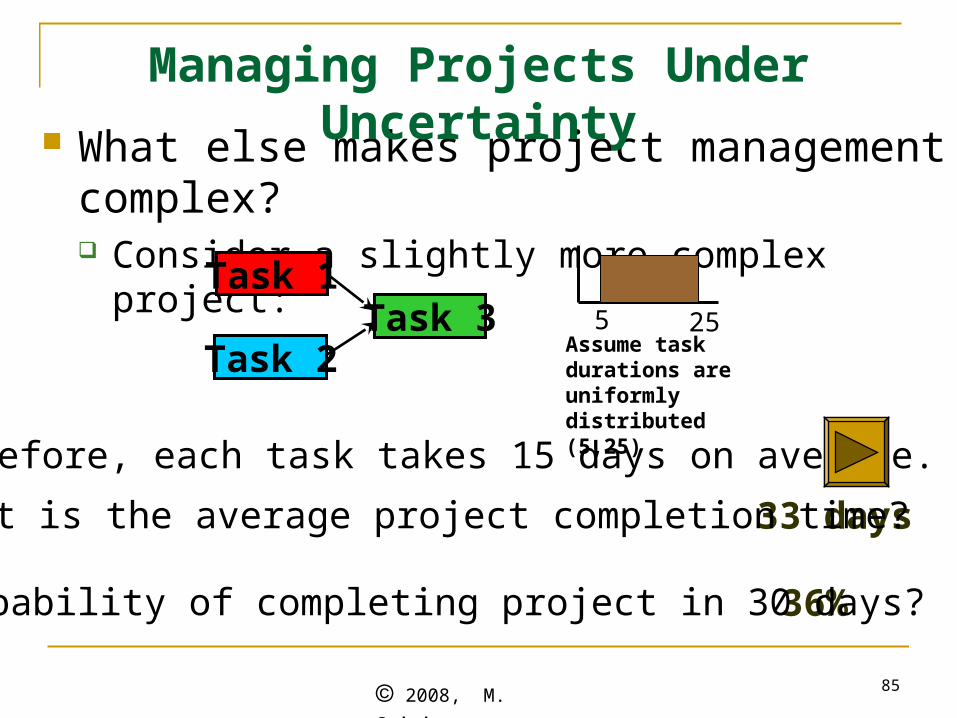
What else makes project management complex? Consider a slightly more complex project:
Task 1
Task 2Task 3
As before, each task takes 15 days on average.
36%Probability of completing project in 30 days?
33 days
5 25Assume task durations are uniformly distributed (5,25)
What is the average project completion time?
Managing Projects Under Uncertainty

2008, M.
Srinivasan86
The affect of resource interdependencies on a simple project:
Task 1
Task 2
Task 3
Task 4Task 5
If each task takes 15 days on average, what is theprobability that the project finishes in 45 days?
Srini; Here we get about 35% slide 86
< 25%
5 25
Managing Projects

2008, M.
Srinivasan87
Conclusion: A project’s most likely completion time is much larger than the sum of the averages of the tasks making up it’s longest path (due to synchronization or due to task dependencies)
So, how do we quote estimated completion time of the project? Do people give a number that they know has
a high (50% or more) chance of missing?
Determining Task Durations

2008, M.
Srinivasan88
Determining Task and Project Durations – the Traditional Way
So, the average task times are “padded” to accommodate any possible delays. Instead of specifying a 50% time estimate (which fails half the time), a 98% confidence estimate is developed for the tasks and project duration.
The project is now estimated to take 70 days, not 45.
What is the chance the project will complete in 70 days?
98% of [5,25] = 5+.98*20 = 5+19.6 = 24.6
5 25
Task 1
Task 2
Task 3
Task 4Task 5

2008, M.
Srinivasan89
A network is drawn up, representing tasks, and precedence relationships between tasks
The task durations are buffered to accommodate uncertainty surrounding the tasks.
Milestones (due dates) are developed for each task.
The Critical Path is determined.
The padded project duration (with safety buffers) is conveyed to the customer and to supervisors
The project is monitored. So, why is it very unlikely that the project will complete on time?
Project Management - The Traditional Way

2008, M.
Srinivasan90
Project Management The TOC Way
The Genesis of the Critical Chain

2008, M.
Srinivasan91
Theory of Constraints and the Critical Chain
Eli Goldratt, a physicist. The Goal (1982, 3rd edition published 2004) The Critical Chain (1997)
Goldratt challenges the conventional approach to managing organizations.
TOC tools for Production: Drum-Buffer-Rope Project Management: Critical Chain

2008, M.
Srinivasan92
The Critical Chain implementation begins with 3 questions:
What to change?
What to change to?
How to cause the change?
Managing the Critical Chain

2008, M.
Srinivasan93
Erroneous assumptions:
It is good to induct work as soon as possible
Protecting task times with buffers will improve on-time performance (this is a biggie)
Multitasking is beneficial
Providing milestones for each task is good
…
What to Change?

2008, M.
Srinivasan94
Parkinson’s Law: “Work expands to fill the time available.” People tend to continue working on a task that could have been completed earlier if they are given a pre-specified completion time.
The Continue to Polish syndrome (aka: the 3-Minute Egg Rule): “It’s not quality if it’s finished before time is up.”
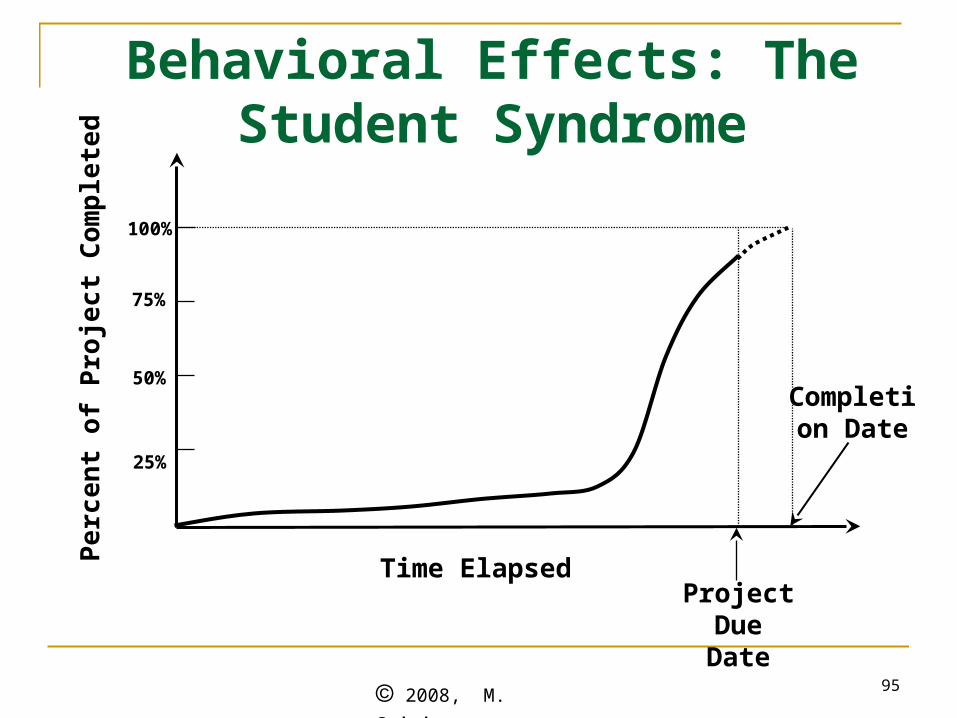
The Student Syndrome: When people feel there is plenty of time to complete a task, other things become important and they procrastinate on the task.
What to Change: Behavioral Effects
2008, M.
Srinivasan95
Behavioral Effects: The Student Syndrome
Time ElapsedProject
Due Date
Per
cen
t of
Pro
ject
Com
ple
ted
25%
50%
75%
100%
Completion Date

2008, M.
Srinivasan96
People do not want to hurt their future negotiating power by finishing too soon.
There is a sense of urgency, promoting a tendency to induct work as soon as possible.
More Behavioral Effects that Increase Task and Project Durations
2008, M.
Srinivasan97
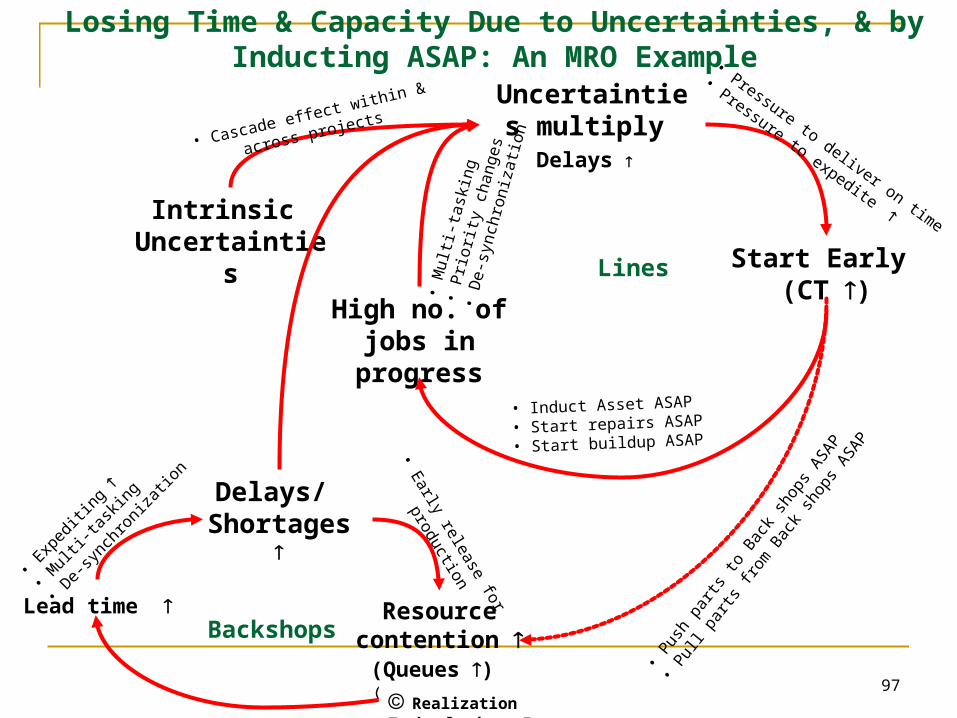
Losing Time & Capacity Due to Uncertainties, & by Inducting ASAP: An MRO Example
Resource contention
(Queues )
Lead time
Delays/ Shortages
Backshops
Start Early (CT )
High no. ofjobs in progress
Uncertainties multiply Delays
• Induct Asset ASAP
• Start repairs ASAP
• Start buildup ASAP
Lines
Intrinsic Uncertainties
•Pressure to deliver on time
•Pressure to expedite
• Cascade effect within &
across projects
•M
ulti-
task
ing
•P
riorit
y ch
ange
s•
De-
sync
hron
izat
ion
•Pus
h pa
rts to
Bac
k sh
ops
ASAP
•Pul
l par
ts fr
om B
ack
shop
s ASAP
•Exp
editin
g
•M
ulti-t
askin
g
•De-
sync
hron
izatio
n •E
arly release for
production
Realization Technologies, Inc.

2008, M.
Srinivasan98
Summary: Sources of Project Delays
A. Synchronization Delays Integration (assembly) points Resources and tasks
B. Delays due to Behavioral Effects Parkinson’s Law “Student” Syndrome “Continue to Polish” Syndrome
C. Queuing Delays Induct work ahead of schedule Multitasking
Realization Technologies, Inc.

2008, M.
Srinivasan99
The Affect of Multitasking
3 Tasks, A, B, C, each of duration 6 days, that have to be executed by one resource. How should you schedule these tasks?
A2 B2 C2 A2 B2 C2 A2 B2 C2
A6 B6 C6
Lead Time for Task A?
Lead Time for Task A?

2008, M.
Srinivasan100
Project Planning (aka Network Building): A meeting of project stakeholders for clarity on intended objectives and success criteria (how to deliver on the order winners)
Identify resource dependencies
Capture time estimates – and build the right safety net – determine “Aggressive But Possible” times
What to Change to?

2008, M.
Srinivasan101
Identify the longest path of dependent events. This is the Critical Chain
Put in place Project Buffer and Feeding Buffers
Avoid displaying milestones (EST, EFT, LST, LFT).
Rather, emphasize the “Relay Runner” work ethic (this is a biggie).
What to Change To?

2008, M.
Srinivasan102
What to Change to?
The Rules of the Critical Chain:
1. Do not schedule Project tasks/ resources precisely at planning time.
2. Pipelining: Do not start projects ASAP.
3. Allow explicit buffer time in projects.
Realization Technologies, Inc.

2008, M.
Srinivasan103
Rationale: Project Buffers are more efficient than safeties within each task
1. Critical Chain Buffering: Aggressive plans without precise resource schedules
• Determine “Aggressive but Possible” times for each activity – remove the padding within each task.
• Determine the critical chain of tasks with these times.
• Provide a project buffer to protect the critical chain.
Traditional Approach:
Critical ChainApproach:
Realization Technologies, Inc.

2008, M.
Srinivasan104
• Most heavily loaded shared resource (constraint), determines throughput
• Project starts are based on constraint’s capacity,
• Pressure to multitask also comes down
Most heavily loaded
resource
Pipelining
Pipelining is more efficient than starting projects ASAP
2. Pipelining: Release Projects Based on Constraints Instead of Starting ASAP
Realization Technologies, Inc.

2008, M.
Srinivasan105
3. Buffer Management: Allocate Resources to Tasks Based on “Buffer Burn Rate”
Realization Technologies, Inc.
Buffer
50% work completed 60% buffer consumed
Chain 2
Burn Rate: % of buffer consumed vs. % of work completed. Automatically calculated on an ongoing basis to assess how much buffer is still available for future uncertainties.
Task Priorities: Tasks that lie on chains with less safety remaining are given top priority. This ensures that buffers are not wasted, and also reduces pressure to multitask.
Buffer
33% work completed 20% buffer consumed
Chain 1

2008, M.
Srinivasan106
Secure agreement on problem to be solved and agreement on direction of solution
Verify that proposed solution will deliver desired results. Ensure that all negative side effects are identified and prevented from happening
Identify all significant potential obstacles that could block implementation of solution
Ensure that necessary leadership is committed to making implementation successful – the RIGHT METRICS
How to Cause the Change?

2008, M.
Srinivasan107
MRO Setting: WR-ALC, NavAir – Cherry Point, MCLB – Albany, Israeli Air Force
Software: Lucent, Microsoft, Intel
Production Supply: Boeing, Lockheed Martin, Larsen & Toubro, Tata Iron & Steel
Testing: AFOTEC, AFFTC (C-17, F-15)
Product Development: Seagate, Harris, BAE Systems
The Critical Chain: Does It Work?