systems of linear inequalities - ms. turnbull's math...
TRANSCRIPT

Systems of Linear Inequalities
Name ____________________ This unit consists of several parts:
1. Linear Inequalities 1-D (one dimension) a. Set notation b. Number line notation c. Interval notation
2. Linear Inequalities 2-D (two dimension) a. Graphing and shading b. System of inequalities (two inequalities)
i. Positive or Negative Y Term Method ii. Test Point Method
3. Solving Systems of Inequalities a. Minimums and maximums b. Word problems (7 Step Method)

Applied Math 30S Systems of Linear Inequalities
2
Lesson 1 Linear Inequalities 1-D (one dimension) There are 3 different types of single-variable notation:
a) Set Notation b) Number Line Notation c) Interval Notation
a) Set Notation:
You will want to remember what each inequality symbol means. This will be easier to do if you remember that the open part of the
symbol always faces the larger quantity.
SYMBOL MEANING
less than
greater than
less than or equal to
greater than or equal
When reading inequalities, it is most common to read the inequality statement from left to right. Remember, the “alligator eats the larger number”! (or the shark, pac-man, etc.)
For example, x < 7 “x is less than seven” x > - 5 “x is greater than negative five” x ≤ 10.75 “x is less than or equal to ten point seven five”
x ≥ 8
15 “x is greater than or equal to eight over fifteen”
It is also correct to state x < 7 as, “seven is greater than x”

Applied Math 30S Systems of Linear Inequalities
3
Solving Inequalities Sometimes it may be required to solve an inequality (i.e. isolate x).
Now examine the method used to solve the following inequality: Example 1: Solve 2x – 5 < 9 2x – 5 < 9
2x < 14 add 5 to both sides
x < 7 divide both sides by 2 The solution to this inequality is all real numbers less than 7 (x is less than seven). Example 2: Solve 3x – 5 < –14
3x – 5 < –14
3x < - 9 add 5 to both sides x < - 3 divide both sides by 3 The solution to this inequality is all real numbers less than -3 (x is less than negative three).
First, let’s review solving equations (with an equal sign). Examine the method used to solve the following equation:
2x – 5 = 9
2x = 14 add 5 to both sides
x = 7 divide both sides by 2 The solution to this equation is exactly 7.

Applied Math 30S Systems of Linear Inequalities
4
sense of inequality changes
Solving linear inequalities is very much the same as solving linear equations
with one very important exception!
If while solving an inequality a negative number is used to multiply or divide each side of the inequality then the sense of the inequality must be reversed.
Example 3: Solve 4x – 1 ≤ 6x – 7
2 6
2 2
4 6 7 1
2 6
4 1 6 7
3
x
x
x
x
x
x
x
The solution to this inequality is all real numbers greater than or equal to 3 (x is greater than or equal to three). Since the left and right sides of the inequality were divided by -2, the inequality sign must flip (from ≤ to ≥).
When multiplying or
dividing by a negative
number, the inequality
sign !

Applied Math 30S Systems of Linear Inequalities
5
integer
An integer is any positive or negative
whole number
rational
A rational number is any number you can express as a fraction (or a
repeating or terminating decimal)
The solution does NOT have to be an integer. So far all of the solutions had intervals bounded by integers. Here is a solved example of a boundary that is a rational number. Example 4: Solve 3x – 2 > 11
3 13
3 3
13
3
3 11 2
13
3
3
2 11
x
x
x
x
x
The solution to this inequality is all real numbers greater than 13
3 (x is greater than
thirteen over three).
Leave the final answer in set notation as a fraction, rather than approximating with decimals (i.e. dividing and rounding).

Applied Math 30S Systems of Linear Inequalities
6
Assignment 1 Linear Inequalities 1-D (one dimension) Solve the following inequalities. State your answer in set notation and in words.
1. 5 3 4 4x x
2. 4 3 11 6x x
3. 7 5 17 3x x
4. 5 2 21x

Applied Math 30S Systems of Linear Inequalities
7
Hint: multiply both sides of the inequality by 3
5. 6 2
3 43
xx
6. 2 3 4 1 5 2x x
7. 3 2 3 4 11 2 7x x x

Applied Math 30S Systems of Linear Inequalities
8
-10 -9 -8 -7 -6 -5 -4 -3 -2 -1 0 1 2 3 4 5 6 7 8 9 10
open circle
-10 -9 -8 -7 -6 -5 -4 -3 -2 -1 0 1 2 3 4 5 6 7 8 9 10
filled circle
Lesson 2 Linear Inequalities 1-D (one dimension)
b) Number Line Notation: The expression x < 7 can be represented by the number line graph shown below. Note: the OPEN circle since 7 is NOT included in the solution. The expression x 7 (less than or equal to 7) would be represented by the number line below. Note: the FILLED circle since 7 is included in the solution. Number Line Summary: Less than Arrow left Not equal to Open circle Greater than Arrow right Equal to Closed circle
Practice: Given the following set notation, determine the number line. Set Notation Number Line Graph
x > –2
x 0 3 < x < 7
–1 < x 4

Applied Math 30S Systems of Linear Inequalities
9
c) Interval Notation:
The expression x < 7 can be represented by the interval notation shown below. Note: this notation represents all the real numbers from negative infinity to 7 (but not including 7).
,7
The expression x 7 (less than or equal to 7) would be represented by the interval notation shown below. Note: To include the 7 use a square bracket around 7.
( ,7]
Interval Notation Summary: Less than Toward - Not equal to Open bracket ( )
Greater than Toward Equal to Closed bracket [ ]
*Note: ’s are always open bracket Practice: Given the following set notation, determine the interval notation. Set Notation Interval Notation
x > –2 _____________________
x 0 _____________________ 3 < x < 7 _____________________
–1 < x 4 _____________________
Parentheses and Brackets
The intervals can also be described in words. ( ) open interval
[ ] closed interval
( ] and [ ) half open interval.

Applied Math 30S Systems of Linear Inequalities
10
-5 -4 -3 -2 -1 0 1 2 3 4 5
-5 -4 -3 -2 -1 0 1 2 3 4 5
-3 -2 -1 0 1 2 3 4 5 6 7 8 9 10
-3 -2 -1 0 1 2 3 4 5 6 7 8 9 10
Notations: Practice Questions with Solutions Set Notation Number Line Graph Interval Notation
x > –2 2,
x 0 0,
3 < x < 7 3,7
–1 < x 4
1,4
Notation Summary Review:
Inequalities Set Notation Number Line Interval Notation
Not equal (not included)
< and > open circle
open ( ) bracket
Equal to (included) and filled circle
closed [ ] bracket
Note: Infinity ( ) always takes an open bracket.

Applied Math 30S Systems of Linear Inequalities
11
Assignment 2 Linear Inequalities 1-D (one dimension) Name _______________________ Date ________________
a) Solve the following inequalities. b) Express the inequality using interval notation. c) Provide a number line graph representing the inequality.
1. 2 2 4x x a) b) Interval notation __________________ c) Number Line Graph 2. 3 3 15 6x x a) b) Interval notation __________________ c) Number Line Graph d) Express the inequality in words (x is greater than, less than, etc.) x is… ______________________________________________________________

Applied Math 30S Systems of Linear Inequalities
12
3. 2 5 17 5x x a) b) Interval notation __________________ c) Number Line Graph d) Express the inequality in words (x is greater than, less than, etc.) x is…
4. 5 4 27x a) b) Interval notation __________________ c) Number Line Graph

Applied Math 30S Systems of Linear Inequalities
13
QUICK REVIEW Graphing Equations Review Question Graph 2x + 3y = 6

Applied Math 30S Systems of Linear Inequalities
14
Lesson 3 Graph Linear Inequalities in Two Variables Graphing the line of inequalities is similar to graphing the line of equations with TWO EXCEPTIONS.
EXCEPTION 1 A solid line is drawn when the expression is equal to. A dotted line is drawn when the expression is not equal to. _ _ _ _ _ Example 1: Two lines graphed below demonstrating when to use solid or dotted lines
Line 1 2 3 12 x y this line is dotted
Line 2 2 4 x y this line is solid

Applied Math 30S Systems of Linear Inequalities
15
EXCEPTION 2 The next step involves shading in the part of the graph which “satisfies” the inequality. We determine this by using one of two methods. Method 1: POSITIVE OR NEGATIVE Y TERM Examine the inequality and determine if y is positive or negative. If the y term is positive, the inequality will be read as it is. If the y term is negative, the inequality sign will be flipped.
Look at the following example using Method 1:
Line 1 2 3 12 x y Since y is positive, y is greater than the right side.
Line 2 2 4 x y Since y is negative, the sign will flip, y is greater than
the right side (y ≥ ).
What the symbols mean: If y is greater than the right side, shade above the line If y is less than the right side, shade below the line
Since both lines were greater than, both inequalities were shaded above the line. Where the shading overlaps is the highlighted portion.

Applied Math 30S Systems of Linear Inequalities
16
Method 2: TEST POINT METHOD The best point to use is the origin (0, 0) provided one of the lines does not pass through this point.
Look at the following example using Method 2:
Line 1 2 3 12 x y
Using test point (0, 0)
2(0) 3(0) 12
0 12
False (as 0 is NOT greater than 12)
The side of the line containing (0,0) is NOT shaded Line 2
2 4 x y
Using test point (0, 0)
2(0) (0) 4
0 4
True (as 0 is less than 4)
The side of the line with (0,0) is shaded
Since one line was “true” over the test point and one line was “false” over the test point, the shading overlaps is the highlighted portion shown above.
Applied Math 30S Systems of Linear Inequalities
17
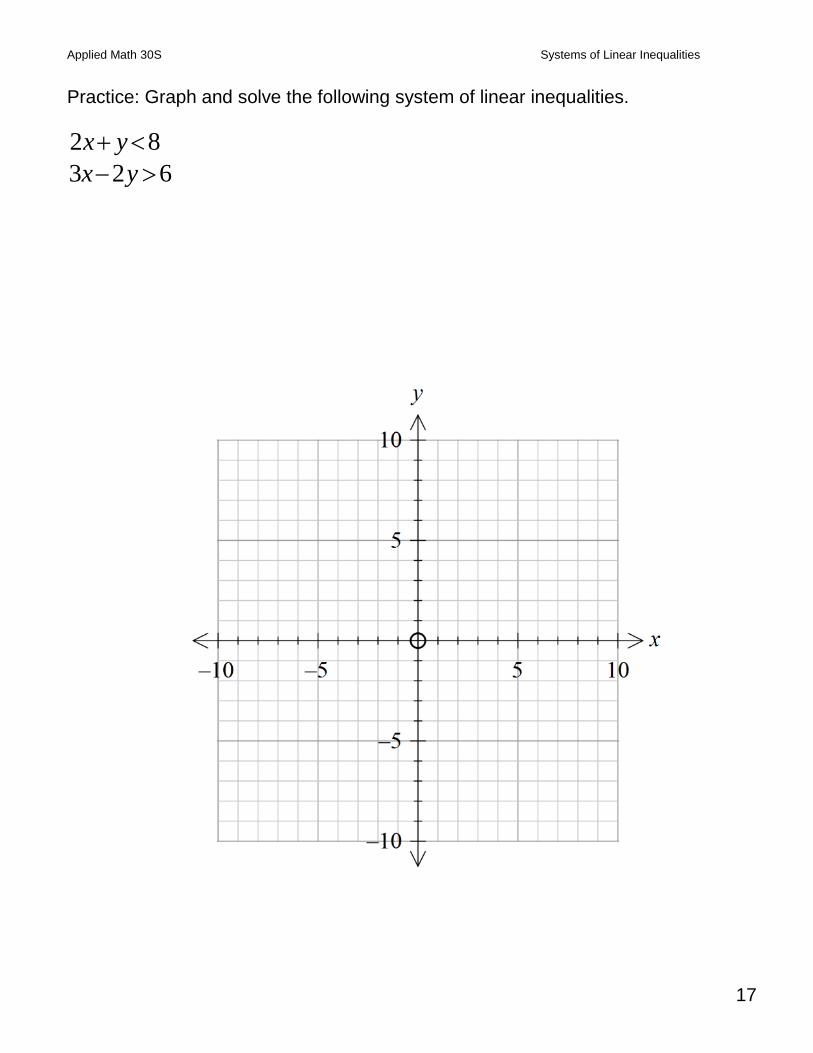
Practice: Graph and solve the following system of linear inequalities.
2 8
3 2 6
x y
x y

Applied Math 30S Systems of Linear Inequalities
18
Practice: Graph and solve the following system of linear inequalities.
5
2 4
x y
x y

Applied Math 30S Systems of Linear Inequalities
19
x-10 -5 5 10
y
-10
-5
5
10
x-10 -5 5 10
y
-10
-5
5
10
Assignment 3 Linear Inequalities 1-D (one dimension) Name ____________________ Date ___________ Choose your graphing method to graph the following inequalities:
2 4
2 6
x y
x y
5
2 4
x y
x y
Y – no X X – no Y Plot them both Draw a line!
Y, then rise, then run, then done!

Applied Math 30S Systems of Linear Inequalities
20
Lesson 4 Evaluating Minimums and Maximums Inequality systems may consist of more than two inequalities. Example 1 Graph the system and determine the min and max values for the expression C = 2x + 3y. The following system has five inequalities
2 8 1 7 10y y x x x y
Here is the graph of the first four inequalities.
Because the rectangle is only in the first quadrant, the graph may be presented with only the first quadrant shown. Here is the graph including the fifth inequality. Only the overlapping solution area is shaded.
x-10 -5 5 10
y
-10
-5
5
10
Remember: Vertical lines contain x only Horizontal lines contain y only Diagonal lines contain x and y

Applied Math 30S Systems of Linear Inequalities
21
x2 4 6 8 10
y
2
4
6
8
10
x2 4 6 8 10
y
2
4
6
8
10
Continuing the example problem and solution from the previous page… Find the maximum and minimum values for the expression C = 2x + 3y over the region determined by:
2 8 1 7 10y y x x x y
Step 1 Graph the inequality as in the original problem (previous page) Step 2 Determine the vertices “corner points” of the shaded region
Reading the points from the graph:
(1, 2), (1, 8), (2, 8), (7, 3), (7, 2) Step 3 Evaluating the points
C = 2x + 3y
2(1) + 3(2) = 8 Min 2(1) + 3(8) = 26 2(2) + 3(8) = 28 Max 2(7) + 3(3) = 23 2(7) + 3(2) = 20 Answer: The maximum value of 28 at (2, 8) minimum value of 8 at (1, 2)

Applied Math 30S Systems of Linear Inequalities
22
Determining Inequalities from Graphs Similar to determining equations of lines, the same characteristics apply to linear inequalities, such as slope and y-intercept. Example 2 Determine the equations of the following lines:
When we determine the inequalities from graphs, we consider whether the line is solid (equal to) or dotted (not equal to) and where the shading falls (above the line = greater than, below the line = less than).
A
B

Applied Math 30S Systems of Linear Inequalities
23
x5 10 15
y
5
10
15
Practice Problem 1
Find the maximum and minimum values for the expression T = y – 2x over the region determined by:
1
12
3
15
2 3 24
y
y
x
x
x y

Applied Math 30S Systems of Linear Inequalities
24
Solution: Problem 1
Graphing the inequalities: The “corners” of the shaded regions are called vertices. (singular – vertex). The coordinates of the vertices are used in a method of problem solving called Linear
Programming. Evaluating the vertices: T = y – 2x (6) – 2(3) = 0 Max (1) – 2(3) = -5 (1) – 2(10.5) = -20 Min Final Answer: The maximum value of 0 at (3, 6) and the minimum value of -20 at (10.5, 1).

Applied Math 30S Systems of Linear Inequalities
25
x5 10 15
y
5
10
15
Assignment 4 Evaluating Minimums and Maximums
1. Find the maximum and minimum values for the expression T = y – 2x over the region determined by:
𝑦 ≥ 0
𝑦 ≤ 6
𝑦 ≤ −𝑥 + 12
𝑥 ≥ 2
𝑥 ≤ 10

Applied Math 30S Systems of Linear Inequalities
26
x5 10 15
y
5
10
15
x5 10 15
y
5
10
15
2. Find the maximum and minimum value for the expression C = 3x + 2y over the region determined by:
3
15
2
9
2 2 26
y
y
x
x
x y
3. Find the maximum and minimum value for the expression C = 2y + x over the region determined by:
0
6
2
10
12
y
y
x
x
y x

Applied Math 30S Systems of Linear Inequalities
27
4. Determine the following inequality expressions based on their graphs below:
a) Line 1 _________________________ Line 2 _________________________
b) Line 1 _________________________ Line 2 _________________________
Applied Math 30S Systems of Linear Inequalities
28
Lesson 5 Creating linear inequalities to solve word problems When determining inequalities, think of the restrictions written in the word problem. The boundaries set by the inequalities may or may not be included, depending on the inequality signs the system contains. You will need to determine, along with the restrictions, the variables or unknowns to be defined. The unknowns are, ultimately, what you will be solving for in the word problem. There will be multiple possible solutions, however, only one particular solution will be “optimal”.
The following scenarios provide you with some information.
Determine the linear inequalities (restrictions) for each
situation.
1. Joanne builds large and small tool sheds.
She is limited to how many tool sheds she can build. Name a
couple of restrictions you would have that would stop you
from building an endless amount of tool sheds.
_________________________ ________________________
Joanne is using plywood sheets and wooden studs to build the sheds. Create two inequalities,
using the information below, which represent her restrictions on materials.
a) She uses 10 sheets of plywood for a small shed and 15 sheets
of plywood for a large shed. She has 60 sheets of plywood
available.
_____________________________________________
b) She uses 15 studs for a small shed and 45 studs for a large shed.
She has 135 studs available.
________________________________________________

Applied Math 30S Systems of Linear Inequalities
29
2. A furniture manufacturer makes sofas and chairs.
The manufacturer is limited to how much furniture they can build. Name a couple of
restrictions you would have that would stop you from building an endless amount of sofas
and chairs.
_________________________
________________________
Manufacturing sofas and chairs
requires carpentry and upholstering. Create two inequalities, using
the information below, which represent the restrictions on the
production.
a) Making a sofa takes 4 hours for carpentry and making a chair
takes 8 hours for carpentry. In one day, 100 hours are available
for carpentry.
__________________________________________
b) Making a sofa takes 12 hours for upholstering and making a
chair takes 4 hours for upholstering. In one day, 80 hours
are available for upholstering.
__________________________________________
3. A company manufactures two types of pants.
The manufacturer is limited to how many pants they can produce. Name a couple of
restrictions you would have that would stop you from producing an endless amount of
clothing.
________________________ ________________________
Create two inequalities, using the information below, which represent the
restrictions on cutting and sewing the pants. The company has a maximum
of 78 minutes of cutting time and 42 minutes of sewing time for the
production of pants.

Applied Math 30S Systems of Linear Inequalities
30
The corduroy type of pants, like Mr. Shahinfar wears, requires 5 minutes of cutting time
and 2 minutes of sewing time.
The leather type of pants, like Mr. McDowell wears, requires 3 minutes of cutting time and
3 minutes of sewing time.
___________________________________________________
___________________________________________________

Applied Math 30S Systems of Linear Inequalities
31
Solve systems of linear inequalities in two variables using technology Graphing the system of inequalities on a graphing calculator x + 2y < 8 3x + 2y ≤ 10 Step 1: Rearrange inequality expressions into “y = mx + b” Step 2: Enter the inequalities into Y = (Y1 = line 1, Y2 = line 2) Greater than ( ) Less than ( ) *Reverse shading Step 3: Adjust the window to suit the system Zoom Standard (6: ZStandard) Zoom Out (3: Zoom Out) Zoom In (2: Zoom In) WINDOW – setting the window manually
*Word problems: Xmin = 0 Ymax = 0 Step 4: GRAPH Step 5: Determine the vertices of the shaded area 2ND TRACE (CALCULATE menu) y-intercept (1: Value, x = 0) x-intercept (2: Zero *see detailed instructions next sheet) intersection point (5: Intersect)

Applied Math 30S Systems of Linear Inequalities
32
Start by entering in your equation or inequality. This example is using the equation y = - 2x + 8 Finding the X-intercept: 2nd TRACE 2: zero
Find your cursor on the screen (move the LEFT and RIGHT arrow keys until it comes into view). If there are multiple equations, ensure your cursor is on the correct line (the one that is intersecting with the x-axis). Note: You can use your UP or DOWN arrow keys to move from line to line.
When the calculator asks “Left Bound?”, it is asking you to place the cursor to the “left” of the x-intercept. Once you have moved your cursor to a spot you are satisfied with, hit ENTER. Notice how the arrow has
appeared? This indicates your first boundary. When the calculator asks “Right Bound?”, it is asking you to place the cursor to the “right” of the x-intercept. Once you have moved your cursor to a spot you are satisfied with, hit ENTER.
Notice how another arrow appeared? This indicates to the calculator the two invisible vertical boundary lines on either side of the x-intercept. Lastly, the calculator asks “Guess?”, and it is asking you to place the cursor as close to the x-intercept as possible. Once you have moved your cursor to a spot you are
satisfied with, hit ENTER.
The final answer should appear now. It is the coordinate point of the x- intercept. The calculator reads Zero x=4 y=0 in this example. Therefore, the x-intercept is (4, 0).

Applied Math 30S Systems of Linear Inequalities
33
Practice Problems Graph the following systems and determine the corner points of the solution area. Include the implicit restrictions (𝒙 ≥ 𝟎, 𝒚 ≥ 𝟎) in each system.
1. 𝒚 − 𝒙 ≤ 𝟐 𝒙 + 𝒚 ≤ 𝟒
2. 𝒚 − 𝟐𝒙 ≥ 𝟑
𝒙 + 𝒚 ≤ 𝟏𝟐
3. 𝟐𝒚 − 𝒙 ≤ 𝟐
𝒙 + 𝟑𝒚 ≤ 𝟖
4. 𝟓𝒚 − 𝟓𝒙 ≤ 𝟏𝟎 𝒙 + 𝟒𝒚 ≤ 𝟗
Lesson 6 Apply linear programming to find optimal solutions to decision-making problems
Seven Step Method
Step 1: Define the variables. Step 2: Construct a table with the given information from the problem. Step 3: Write the Inequalities for Quadrant 1. Step 4: Graph the Inequalities using the intercepts method (include shading). Step 5: Find the coordinates of the point(s) of intersections of the graphed lines
(including the interceptions with the x and y axis). Step 6: Evaluate the vertices for the relation that is to be maximized or minimized (using the profit or production equation given in the question) Step 7: Write a statement which solves the problem.

Applied Math 30S Systems of Linear Inequalities
34
Problem 1
A manufacturer makes long-sleeve and short-sleeve t-shirts. Each long-sleeve shirt requires 4 minutes on the cutting machine and 3 minutes on the stitching machine. Each short-sleeve shirt requires 3 minutes on the cutting machine and 1 minute on the stitching machine. The cutting machine is available only 2 hours each day, and the stitching machine is available only 1 hour each day. If the profit on a short-sleeve shirt is $6.00 and the profit on a long-sleeve shirt is $11.00, how many of each should be produced each day to maximize the profit?
Applied Math 30S Systems of Linear Inequalities
35
L S
0
0 40
30
L S
0
0 60
20L
S
(12, 24)
(0,40)
(20, 0)
(0,60)
(30, 0)
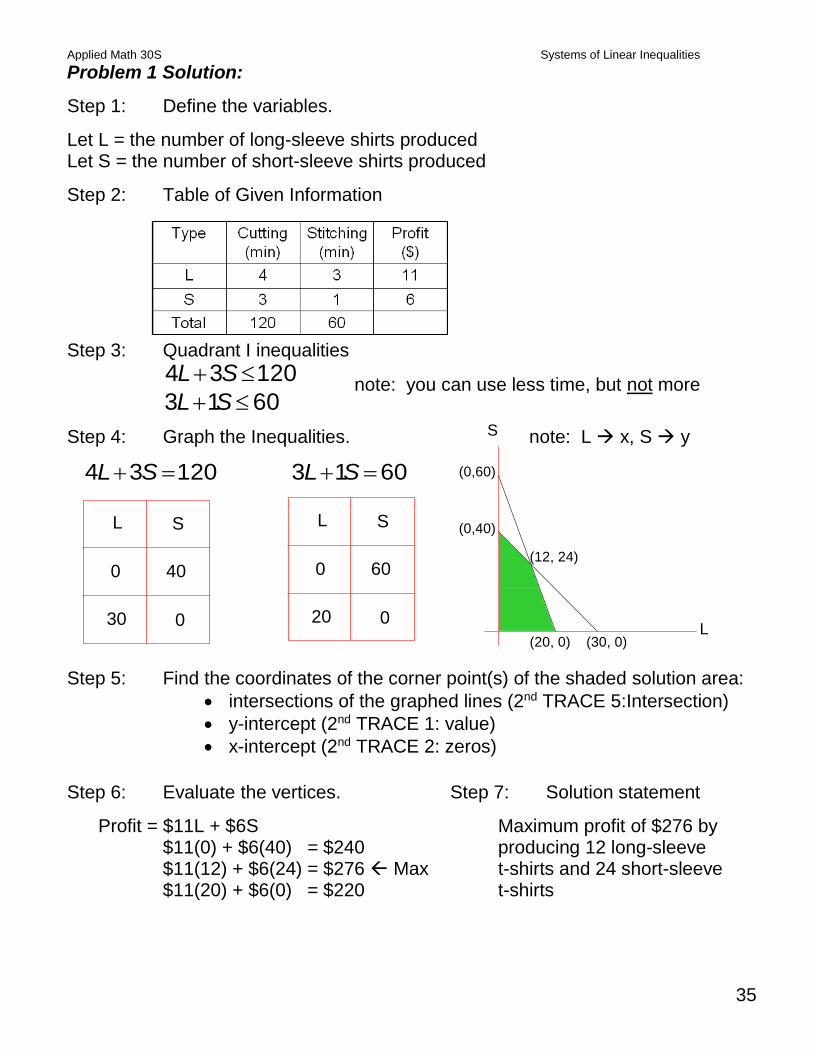
Problem 1 Solution:
Step 1: Define the variables.
Let L = the number of long-sleeve shirts produced Let S = the number of short-sleeve shirts produced
Step 2: Table of Given Information
Step 3: Quadrant I inequalities
4 3 120
3 1 60
L S
L S
note: you can use less time, but not more
Step 4: Graph the Inequalities. note: L x, S y
4 3 120 3 1 60L S L S
Step 5: Find the coordinates of the corner point(s) of the shaded solution area:
intersections of the graphed lines (2nd TRACE 5:Intersection)
y-intercept (2nd TRACE 1: value)
x-intercept (2nd TRACE 2: zeros)
Step 6: Evaluate the vertices. Step 7: Solution statement
Profit = $11L + $6S Maximum profit of $276 by $11(0) + $6(40) = $240 producing 12 long-sleeve $11(12) + $6(24) = $276 Max t-shirts and 24 short-sleeve $11(20) + $6(0) = $220 t-shirts
Applied Math 30S Systems of Linear Inequalities
36
Problem 2 The Alford Computer Company manufactures two types of computers – Standard and Deluxe. In a day, there are 30 hours of electronic manufacturing time and 70 hours of assembly time available. Standard requires 1.5 hours of electronic manufacturing time and 1 hour of assembly time. Deluxe requires 30 minutes of electronic manufacturing time and 2 hours of assembly time. The profit on Standard is $500 and the profit on Deluxe is $360. How many of each model should be produced to achieve a maximum profit? What is the maximum profit? Use the template to solve this problem.
Let x= Let y=
Profit = Maximum profit of

Applied Math 30S Systems of Linear Inequalities
37
Problem 3 A small manufacturing company makes chairs and footstools. Each chair requires 7 feet of lumber, each foot stool 3 feet. A chair requires 8 hours to make, while a foot stool takes 2 hours. The profit on a chair is $30 and $10 on a footstool. If 420 feet of lumber and 400 hours of labour are available, how many of each should be produced to obtain a maximum profit? What is the maximum profit? Use the template to solve this problem. Let x= Let y=
Profit = Maximum profit of

Applied Math 30S Systems of Linear Inequalities
38
Problem 4 Josie is on a diet. Daily, she needs three dietary supplements, A, B and C as follows: at least 16 units of A, 6 units of B, and 20 units of C. These can be found in either of two marketed products Squabb I which contains 2 units of A, 1 unit of B and 5 units of C and Squabb II which contains 4 units of A, 1 unit of B and 2 units of C. The Squabb I pill cost $1.50 and the Squabb II pill costs $2.00. How many of each pill should Josie buy to satisfy her dietary needs and at the same time minimize costs? How is this problem different than the previous examples? This problem is different in two ways.
First, there are three limiting factors supplements A, B and C.
Second, the problem ask you to minimize costs not maximize profits.
Let x= Let y=
Profit = Minimize costs of

Applied Math 30S Systems of Linear Inequalities
39
S
D
(0,60)
(0,35)
(20,0) (70,0)
(10.30)
Solutions: Problem 2
Let x = # of Standard Computers produced y = # of Deluxe Computers produced
1.5 0.5 30
1 2 70
x y
x y
Graphing Calculator entry:
0.5 0.5
2 2
1.5 30
70
xy
xy
Profit = $500 S + $360 D $500 (0) + $360 (35) = $10 500 $500 (10) + $360 (30) = $14 000 Max $500 (20) + $360 (0) = $10 000 Maximum profit of $14 000 obtained by producing 10 Standard and 30 Deluxe Computers.

Applied Math 30S Systems of Linear Inequalities
40
C
F
(0,200)
(0,140)
(50,0) (60,0)
(36,56)
Problem 3 Let x = # of chairs produced y = # of footstools produced
7 3 420
8 2 400
x y
x y
Graphing Calculator entry:
7
3 3
8
2 2
420
400
x
x
y
y
Profit = $30 C + $10 F $30 (0) + $10 (140) = $1 400 $30 (36) + $10 (56) = $1 640 $30 (50) + $10 (0) = $1 500 Maximum profit of $1 640 by producing 36 chairs and 56 footstools.

Applied Math 30S Systems of Linear Inequalities
41
x1 2 3 4 5 6 7 8 9 10
y
1
2
3
4
5
6
7
8
9
10
Squibb I
Squibb II
(4,2)
(2.67,3.33)
(0,10)
(8,0)
Problem 4
Let
x = # of Squibb I pills y = # of Squibb II pills
Three inequalities
2 4 16
6
5 2 20
x y
x y
x y
(greater than or equal because you can take more but not less)
Graphing Calculator entry:
2
4 4
5
2 2
16
6
20
x
x
y
y x
y
*Note: this time we are evaluating for minimum values C = $1.5X + $2Y Minimum cost of $9 by taking $1.5(0) + $2(10) = $20 2 Squibb I pills and 3 Squibb 2 pills $1.5(2) + $2(3) = $9 Min $1.5(4) + $2(2) = $10 $1.5(8) + $2(0) = $16 Note: Not all intersections are integer values
Applied Math 30S Systems of Linear Inequalities
42
Practice Problems 1. Bob builds tool sheds. He uses 10 sheets of dry wall and 15 studs for a small shed and 15 sheets of dry wall and 45 studs for a large shed. He has available 60 sheets of dry wall and 135 studs. If Bob makes $390 profit on a small shed and $520 on a large shed, how many of each type of building should Bob build to maximize his profit? 2. A company makes a product in two different factories. At factory X it takes 30 hours to produce the product and at factory Y it takes 20 hours. The costs of producing these items are $50 at factory X and $60 at factory Y. The company’s labor force can provide 6000 hours of labor each week and resources are $12,000 each week. How should the company allocate its labor and resources to maximize the number of products produced? How many hours would be used at factory X? How many dollars would be spent at factory Y? 3. An agriculture company has 80 tons of type I fertilizer and 120 tons of type II fertilizer. The company mixes these fertilizers into two products. Product X requires 2 parts of type I and 1 part of type II fertilizers. Product Y requires 1 part of type I and 3 parts of type II fertilizers. If each product sells for $2000, what is the maximum revenue and how many of each product should be made and sold to maximize revenue? 4. Two men, John and Bill, make math supplies for schools. In one hour, John can make 10 protractors, 5 compasses, and 5 metre sticks. Bill can make 5 protractors, 5 compasses, and 20 metre sticks in the same time. They have an order for 40 protractors, 80 compasses, and 110 metre sticks. John earns $8.50 per hour, and Bill earns $12.50 per hour. How long should each work to minimize the cost of labour? 5. Ivan and his daughter service lawn equipment such as lawn mowers and weed trimmers. Ivan can service a lawn mower in 15 minutes and a weed trimmer in 12 minutes. His daughter can service a lawn mower in 10 minutes and a weed trimmer in 20 minutes. Ivan is paid $12.00/hour and his daughter is paid $8.00/hour. If they have an order for 50 lawn mowers and 40 weed trimmers, how long should each work to minimize the cost of labour?