systemic risk analysis of global banking systems: basel
TRANSCRIPT

117117
117
IJEM International Journal of Economics and Management
Journal homepage: http://www.ijem.upm.edu.my
Systemic Risk Analysis of Global Banking Systems: Basel III
Regulatory Constraint
FATHIN FAIZAH SAIDA* ,
ASchool of Economics, Faculty of Economics and Management, Universiti Kebangsaan
Malaysia, Malaysia
ABSTRACT
This article is particularly concentrated on measuring systemic risk based on network
topology of bilateral exposures and obligations specifically for the global banking
systems in 2013. Financial network models based on financial exposures are models
that aim to depict causal chains of exposures and obligations of counterparties for
financial institutions. The Basel Committee on Bank Supervision (BCBS) introduces
Basel III regulatory constraint for stabilizing the banking institutions due to the
shortcomings of Basel II and the failure of banking institutions during the recent
financial crisis in 2007. We analyse the exposure of bank risk under Basel III
regulatory constraints. Under Basel III, banks have to meet the capital requirements
effective in 2013 (4.5% for the common equity ratio, 6% for the Tier 1 capital ratio).
Our analysis is the bilateral claims of the ultimate risk of the banking systems of the
13 reporting countries that consist of Austria, Netherland, Greece, Ireland, Portugal,
Belgium, France, Germany, Italy, Spain, Switzerland, the United Kingdom, and the
United States. The contagion analysis is also conducted to predict the domino effect
of the reporting countries to the other counterparty countries. The results show that
only Switzerland’s banking system collapsed after a shock from a core counterparty
such as the United States under the new Basel III regulatory constraint in the rate of
loss given default of 55%.
JEL Classification: C63, G21
Keywords: Basel III regulatory constraint, Financial Network, Systemic risk
Article history:
Received: 11 November 2017
Accepted: 4 Mac 2018
___________________________ Research sponsored by FRGS/1/2017/SS08/UKM/02/2 - A New Framework for Assessing Systemic Risk of Islamic
Banking Systems: Financial Network Modelling
* Corresponding author: Email: [email protected]
Int. Journal of Economics and Management 12 (1): 117-136 (2018)
118118
118
International Journal of Economics and Management
INTRODUCTION
The Basel Committee on Bank Supervision (BCBS) is raising the resilience of the banking
sector by strengthening the regulatory capital framework due to the 2007 financial crisis.
In order to raise the quality and quantity of the regulatory capital base and enhance the
risk coverage of the capital framework, Basel III is introduced. The aim of Basel III to
strengthen the quality of capital held by banking institutions is to implement the new
definition of regulatory capital which provides greater focus on common equity, while
also strengthening the eligibility for other capital instruments. In other words, they are
underpinned by a leverage ratio that leverage in the banking system and provide an extra
layer of protection against model risk and measurement error. In order to strengthen the
quality of capital, Basel III has raised minimum capital requirements for banking
institutions to hold a capital conservation buffer comprising common equity of 4.5% over
and above the regulatory minimum.
In order for the new Basel III to be effective, the Committee has introduced a number
of macro-prudential elements into the capital framework to help contain systemic risks
arising from pro-cyclicality and the interconnectedness of financial institutions. Several
capital requirements introduced by the Committee to mitigate the risks arising from firm-
level exposures among global financial institutions will also help to address systemic risk
and interconnectedness, such higher capital requirements for inter-financial sector
exposures; introduction of liquidity requirements that penalise excessive reliance on
short-term, interbank funding to support longer-dated assets; higher capital requirements
for trading and derivative activities, as well as complex securitisations and off-balance
sheet exposures; and capital incentives for banks to use central counterparties for over-
the-counter derivatives.
Therefore, this study is consistent with the Basel Committee framework by looking
at the macro-prudential analysis in predicting the banking system performance with the
new Basel III by using systemic analysis on financial network modelling. Highly
integrated international systems can be seen as a complex network of banking and shadow
banking systems. In the real-world banking systems, all the participants in the financial
markets are highly interconnected and each of the counterparty actions will affect the
other counterparties’ behaviour as Markose (2012) suggested. Thus, agent-based
computational economics (ACE) according to Tesfatsion and Judd (2006) is based on
object-oriented programming that can produce agents that are both inanimate (e.g.
repositories of databases) and behavioural agents capable of varying degrees of
computational intelligence. Thus, the agents are programmed by the databases provided.
This research particularly concentrates on measuring systemic risk based on network
topology of bilateral exposures and obligations, specifically for the bank level of selected
banking systems. Since the 2007 crisis, the analysis of the financial network has been
increasingly used, thus, extending on the work by Said (2015). This research attempts to
investigate the empirical topologies structure of developed countries banking system in
its aspects by focusing on the foreign claims of the 13 national banking systems. The
main contribution of this research compared to Said (2015) is on the

119119
119
Systemic Risk Analysis of Global Banking Systems
analysis of Basel III regulatory constraint. How does Basel III affect banking systems’
performance through contagion analysis? We, therefore, analyse whether Basel III
improves the probability of default of banking systems.
This study further examines the collective behaviour of the system in the economy
as a necessary step towards macro-prudential policies for the stability of financial policies
implementation. This network analysis provides holistic visualisations and systemic risk
analytics. Borio (2003) discussed the need for more research in macro-prudential
approaches as it will limit the risk of episodes of financial distress with significant losses
in terms of the real output for the economy as a whole. While micro-prudential approach
limits the risk of episodes of financial distress at individual institutions, regardless of their
impact on the overall economy. As there is an interconnectedness of all of the institutions
in the economy, it is thus essential to conduct research on both the macro-prudential and
micro-prudential approaches.
This study analyses the bilateral links between the banking systems of the individual
countries. Our starting point is the bilateral claims of the ultimate risk of the banking
systems of the 13 reporting countries that consist of Austria, Netherland, Greece, Ireland,
Portugal, Belgium, France, Germany, Italy, Spain, Switzerland, the United Kingdom, and
the United States. Our approach provides the following advantages: First, it provides a
global topological structure of the financial network at the reporting countries and reports
the financial exposures of the various banking systems. Second, it presents a useful
framework for identifying vulnerable global systems, both across countries. This
topological structures of network analysis allow us to determine the interconnections
across countries. Unlike Minoiu and Reyes (2011), this study focuses on the exposures
rather than flows of the global banking network.
REVIEW OF LITERATURE
Basel Committee on Banking Supervision (BCBS) introduced Basel III as a result of the
failure of the banking institutions during the 2007 financial crisis. Vousinas (2015)
pointed out the following shortcomings of Basel II: the capital adequacy ratio of 4 percent
was insufficient to offset the huge losses that banks suffered; and Basel II provides
incentives for greater use of the process of securitization which happens when financial
institutions re-package loans into asset-backed securities and then move them off their
balance sheets, so as to reduce their assets' risk weighting. As a result, this process allowed
many banks to reduce their capital requirements and take risks while increasing their
leverage.
Harada et al. (2015) evaluated the effectiveness of Basel III in Japan. They found
that the effectiveness of the new regulations for financial stability critically depends on
the willingness of the regulators to use the new tools. Their study revealed the post-crisis
responses by the Japanese financial authorities in five dimensions (Basel III, stress tests,
OTC derivatives regulations, recovery and resolution planning and bank supervision).

International Journal of Economics and Management
120120
120
Most recent studies (Markose and Goktan (2013) and Said (2015)) of the global
topological structure of the network have only dealt with Basel II regulatory constraints.
However, this study extends its research by analysing the systemic risks of banking
systems under Basel III regulatory constraints. Most of the network analyses have been
restricted to the interbank markets (e.g. Elsinger and Summer, 2006; Lelyveld and
Liedorp, 2004; Bech and Atalay, 2008; Boss et al., 2004; and Craig and von Peter, 2010).
However, the existing research papers that dealt with the topology of global banking are
Hattori and Suda (2007), Minoiu and Reyes (2011) and Markose and Goktan (2013).
Castren and Rancan (2013) constructed financial networks for individual euro area
countries by using financial accounts data at the sector level from 1999 to 2011. They
used the maximum entropy method to estimate bilateral interbank exposures that were
suggested by Upper and Worms (2004). But in a real-world network, the network
structures are not complete and are not highly sparse as estimated by the maximum
entropy method. Therefore, with the availability of bilateral liabilities data from the Bank
for International Settlements (BIS), our study directly observes the bilateral links between
the banking systems at the individual reporting countries level in 2013 to construct real
complex networks of financial systems. The other researches on financial contagion are
those by Allen and Gale (2000), Kiyotaki and Moore (1997), and Rochet and Tirole
(1996). Leitner (2005)’s model shows the threat of contagion using an optimal network
design. The contribution of the paper is the trade-off between risk sharing and the
potential for collapse in the design of optimal financial networks.
Two recent studies that analysed the cross-border contagion are those by Degryse et
al. (2009) and Castren and Rancan (2013) using maximum entropy to estimate bilateral
exposures. Degryse et al. (2009) studied cross-border contagion for the first time using
foreign claims from the BIS database, and also focused on the evolution of cross-border
contagion over the period of 1999 to 2006. The study also identified the size of a
systemically important shock for cross-border contagion and found that the foreign claims
held by the banking system have increased substantially. A further research on cross-
border contagion is suggested as it may pose serious threats to financial stability. Their
simulation results also reveal that contagion risk and the speed of propagation have
increased over time during this study period.
Markose (2012) used US FDIC bank data to investigate a CDS negative carry trade
combined with incentives provided by Basel II and its precursor in the US. They showed
how a multi-agent financial network (MAFN) model is well-suited to monitor bank
activity and to stress test policy for perverse incentives on an ongoing basis. In
comparison, Fagiolo (2010) provided a significant contribution by analysing the world
trade network with respect to the core-periphery structure of the network and the major
role played by OECD countries. He also found that the structure of the network was quite
stable and resistant to systemic shocks and that high involvement in trade network
increased the probability of stock market shock during crisis events. But the most
interesting contribution was provided in an IMF paper by Minoiu and Reyes (2011) who
analysed the financial network flows of banking claims (BIS locational statistics). Their

121121
121
Systemic Risk Analysis of Global Banking Systems
database contains quarterly data for 184 countries from 1978 to 2009. Bank claims include
loans, deposits, obligations and other assets.
Borio (2003) however, showed how macro-prudential approach is to limit the risk
of episodes of financial distress with significant losses in terms of the real output for the
economy as a whole. The main goal of the micro-prudential approach is to limit the risk
of episodes of financial distress at individual institutions, regardless of their impact on the
overall economy.
Gauthier et al. (2010) and Chan (2010) applied a network model to the macro-
prudential capital requirements approach for systemic risk analysis across the banking
system. Chan (2010) suggested a practical way to levy regulatory capital charges based
on the degree of interconnectedness among financial institutions. The charges are based
on the institution’s incremental contribution to systemic risk. The proposed too
connected-too-fail (TCTF) capital charge methodology may also provide a practical way
to define the proper perimeter of regulation (IMF, 2009d). While the methodology was
illustrated there for financial institutions, it did not preclude the inclusion of nonfinancial
and/or unregulated institutions.
Therefore, this study models Basel III from the real complex network topology
structure and contagion analysis to improve the probability of defaults of the banking
sector. However, maximum entropy method has been found not to be limited in capturing
the real-world complex networks.
RESEARCH METHODOLOGY
Our method follows that of Said (2015) which specified the matrix liabilities of countries’
banking systems to major country banking systems relative to their bank equity capital.
We use maximum eigenvalue of the matrix to generate the network stability index.
Data
In this article, the banking system is formed to show the yearly inflows of foreign claims
from 13 national banking systems vis-à-vis countries around the world. The BIS
consolidated banking statistics on an ultimate risk basis track foreign claims in individual
reporting countries and for the reporting area as a whole. The BIS publishes the foreign
claims of reporting countries in millions, US dollars, and the published data is a stock
value rather than a flow. Therefore, the value of annual sectors’ flows is subtracted from
the year-end stock values. The bilateral ultimate risk foreign claims data for individual
reporting countries have been used in the analysis. The amounts of the stock values will
also be adjusted using the consumer price index (CPI) of US dollars in 2013.
In this article, we assume that the national banking systems or reporting countries
lend to the cross-border countries’ banking systems as reported in the BIS. The national
banking systems will only lend to the other countries’ banking systems but not to their

122122
122
International Journal of Economics and Management
ownselves. Meanwhile, only 13 national banking systems can lend to the cross-border as
of 2013. We can see the number of foreign claims from each counterparty/country that is
borrowed from the national banking systems. Thus, the networks of the
interconnectedness of the cross-border will be explained in the next section.
Network Methodology
A network is a set of items which is known as nodes (vertices) and the edges connect the
nodes to each other. In our study, each banking system is considered as one node in the
network. Our sample consists of 13 national banking systems (reporting countries) that
correspond altogether to 13 bank-level nodes for each network. In this analysis, the
number of national banking systems or reporting countries (n) is always 13 in 2013, since
they are the only ones that have been reported to the BIS by the national banking systems.
The set Y = (1; 2; 3; ……………; y) represents the 13 national banking systems that lend
during a year. The network analysis of global banking will be based on the yearly inflow
of foreign claims from the 13 national banking systems (reporting countries) for 2013.
The set Y consists of the 13 bank-level reporting countries.
Let i be a bank-level reporting country and j be another bank-level reporting country.
A directed link originating with i and ending with j represents the inflows of funds
(foreign claims) from i to j, vis-a-vis, an out-degree for i and an in-degree for j. In other
words, if there are inflows of funds from a banking system i to a country j, there is a
directed link from i to j. On the other and, if there are outflows of funds (a negative flow)
from i to j, there is no link from i to j. In this analysis, we focus on both binary and
weighted network representations. We adjust the amounts to be in 2013 US dollars by
using the U.S. Department of Labor Bureau of Labor Statistics Consumer Price Index
(CPI). We take the average of annualised monthly index values rather than using the year-
end index values in order to capture the inherent structure of flows.
Eigenvector Centrality and Furfine's (2003) Contagion Analysis
The degree centrality shows the importance of each point node to another node. The
measuring of centrality is essential for analysing the frequency of a node to another
neighbour node. However, the neighbours of a node are not equivalent compared to other
nodes. Eigenvector centrality takes into account both the node and its neighbour's global
connectivity and shows high or low values of eigenvector centrality if it has connected
more or less, respectively to others or neighbours. Newman (2010, p.169) explained that
in many events, a node's importance in a network is increased by having connections to
other vertices that are themselves important. For the eigenvector centrality measurement,
we work with a different empirically calibrated weighted network. First of all, it should
be noted that the main aim behind this is to determine systemically important countries
and vulnerable banking systems which are exposed to those countries. Hence, we use
stock rather than flow values and also take into account the aggregate equities of
banking systems. The reason behind this is to weigh the

123123
123
Systemic Risk Analysis of Global Banking Systems
𝜆
∙ ⋯
foreign exposures of banking systems in terms of their aggregate banking system equities
vis-à-vis the counterparty countries. Additionally, the main focus is on the transactions
among the 13 reporting countries denote as (n)x(n) square matrix Z so that the element
zij is the outstanding amount of foreign liabilities of country i to the national banking
system j at the end of a year and the diagonal entries are zero. Therefore, a row sum gives
the total amount of foreign liabilities of a country to the (n - 1) foreign banks, and,
consequently, a column sum shows the total amount of foreign banks claims of a national
banking system on the (n - 1) countries.
The matrix ℵ is shown below. As matrix ℵ is asymmetric, it has two sets of
𝑟
eigenvectors; the right eigenvectors and the left eigenvectors. We denote 𝑣� as the right
eigenvector centrality for the ith node for the matrix ℵ . Hence, the centrality of a node i
is proportional to the sum of the centralities of i's neighbours. Therefore,
𝑟 1 𝑟
𝑣� = ∑� 𝛾� �
𝑣�
(1)
We take the largest eigenvalue, 𝜆𝑚𝑎𝑥 , and the corresponding eigenvector
(leading/maximum eigenvector) for the eigenvector centrality measure. The ith
component of the leading eigenvector gives us the eigenvector centrality score of the node i. Equivalently, we can obtain the eigenvalue equation for the matrix ℵ, or, in other words, we can say that centrality 𝑣 𝑟 satisfies,
ℵ𝑣𝑟 = 𝜆𝑚𝑎𝑥 𝑣𝑟
0 𝑧12
𝐶2
𝑧13
𝐶3 ⋯ ⋯ 0
0 0 𝑧23
𝐶3
⋯ ⋯ 𝑧 2𝑁
𝐶𝑁
ℵ = ∙ ∙ 0 ⋯ ⋯ ∙
(2)
𝑧 � 1
𝐶1 ∙ ⋯ 0 ⋯
𝑧 � 𝑁
𝐶𝑁
∙ ∙ ⋯ ⋯ 0 ∙ 𝑧 𝑁 1
[ 𝐶1
𝑧 𝑁�
𝐶�
⋯ 0 ]
What do right and left eigenvector centralities tell us? In her study, Markose (2012)
described the right eigenvector centrality as the systemic risk index and the left
eigenvector centrality as the vulnerability index of the financial intermediaries in
question. Her study is based on the bilaterally netted weighted network of derivatives
liabilities and assets of financial intermediaries. We will stick to these definitions with a
slight modification which is necessary concerning the network structure in this study.
Hence, we call the right eigenvector centrality an indicator of a country's sector systemic
risk basically because it measures the impact of total foreign liabilities of a country's
sector relative to the respective capital of its neighbouring sector banking systems.
Accordingly, we call the left eigenvector centrality an indicator of a national banking
system vulnerability basically because it measures the impact of capital absorption of
its total foreign claims relative to the corresponding neighbouring economies of countries.
124124
124
International Journal of Economics and Management
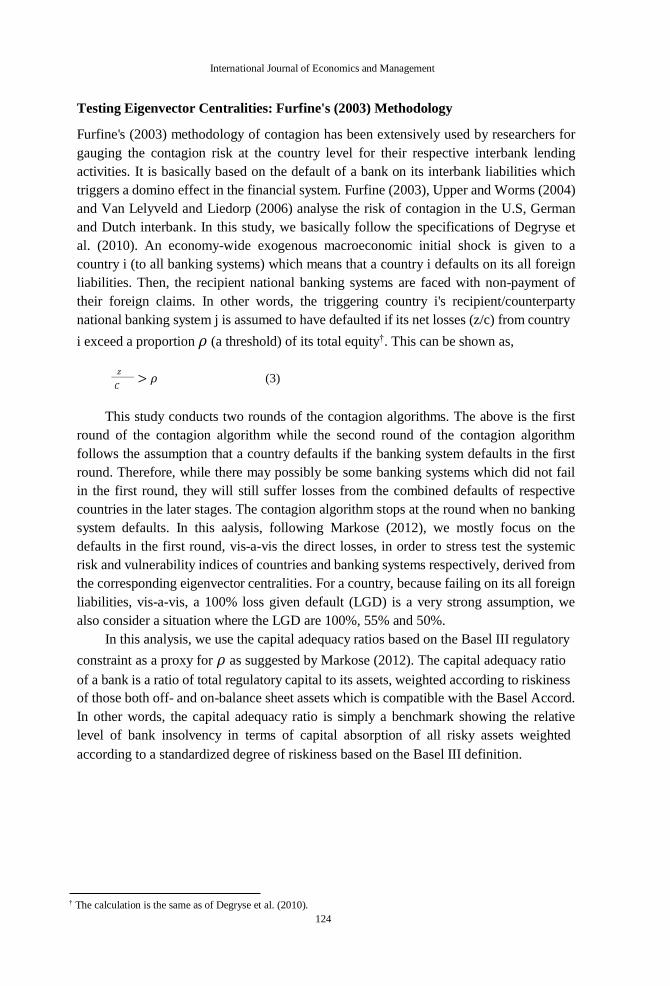
Testing Eigenvector Centralities: Furfine's (2003) Methodology
Furfine's (2003) methodology of contagion has been extensively used by researchers for
gauging the contagion risk at the country level for their respective interbank lending
activities. It is basically based on the default of a bank on its interbank liabilities which
triggers a domino effect in the financial system. Furfine (2003), Upper and Worms (2004)
and Van Lelyveld and Liedorp (2006) analyse the risk of contagion in the U.S, German
and Dutch interbank. In this study, we basically follow the specifications of Degryse et
al. (2010). An economy-wide exogenous macroeconomic initial shock is given to a
country i (to all banking systems) which means that a country i defaults on its all foreign
liabilities. Then, the recipient national banking systems are faced with non-payment of
their foreign claims. In other words, the triggering country i's recipient/counterparty
national banking system j is assumed to have defaulted if its net losses (z/c) from country
i exceed a proportion 𝜌 (a threshold) of its total equity†. This can be shown as,
𝑧 � � > 𝜌 (3) 𝐶�
This study conducts two rounds of the contagion algorithms. The above is the first
round of the contagion algorithm while the second round of the contagion algorithm
follows the assumption that a country defaults if the banking system defaults in the first
round. Therefore, while there may possibly be some banking systems which did not fail
in the first round, they will still suffer losses from the combined defaults of respective
countries in the later stages. The contagion algorithm stops at the round when no banking
system defaults. In this aalysis, following Markose (2012), we mostly focus on the
defaults in the first round, vis-a-vis the direct losses, in order to stress test the systemic
risk and vulnerability indices of countries and banking systems respectively, derived from
the corresponding eigenvector centralities. For a country, because failing on its all foreign
liabilities, vis-a-vis, a 100% loss given default (LGD) is a very strong assumption, we
also consider a situation where the LGD are 100%, 55% and 50%.
In this analysis, we use the capital adequacy ratios based on the Basel III regulatory
constraint as a proxy for 𝜌 as suggested by Markose (2012). The capital adequacy ratio
of a bank is a ratio of total regulatory capital to its assets, weighted according to riskiness
of those both off- and on-balance sheet assets which is compatible with the Basel Accord.
In other words, the capital adequacy ratio is simply a benchmark showing the relative
level of bank insolvency in terms of capital absorption of all risky assets weighted
according to a standardized degree of riskiness based on the Basel III definition.
† The calculation is the same as of Degryse et al. (2010).

125125
125
Systemic Risk Analysis of Global Banking Systems
RESULTS
Table 1 shows the network statistics for the empirically constructed global banking
networks for the case of 13 nodes which involve banking systems. The total number of
all possible directed or connected links between the counterparties are shown by 78 edges.
The clustering coefficient is 0.5 which has shown a highly clustering connection between
one bank and another bank. The distribution of in degrees from banks show less
asymmetry than do the out degrees in terms of all higher moments given by standard
deviation, skewness, kurtosis, and mean. they are equivalent. The eigenvalue is 0.286328.
The maximum eigenvalue is a measure of the stability of a network. May (1972) showed
that a network is determined to be stable if its maximum eigenvalue is smaller than 1.
Thus, in this analysis, the maximum eigenvalue is less than 1 and the network is assumed
to be stable.
Table 1 Network Results
Nodes 13 Edges 78 CC 0.5 Mean in 6 Standard Deviation in 2.886751 Skewness in -0.14738 Kurtosis in 0.559855 Mean out 6 Standard deviation out 2.886751 Skewness out 0.147382 Kurtosis out 0.559855 Eigenvalue 0.286328
Figure 1 Sectoral Global Banking Visualisation in 2010 (Net-Flow)

126126
126
International Journal of Economics and Management
The visualisation of the network of global banking is shown in Figure 1 for net flow
in 2013. In the diagram, the outer circle represents the banking systems from
representative countries that receive the number of foreign investments from national
banking systems/reporting countries.
In addition, the transaction between national banking systems is netted out in Figure
1 in order to see which banking systems are net investors. In other words, it is said that a
banking system is investing on a net basis if the total inflow of foreign claims of a banking
system is investing on a net basis and if the total inflow of foreign claims of a banking
systems are higher than the amount of total foreign investment of its country of origin.
Besides, the bigger nodes show that the higher amount of investment is made
bilaterally. It can be seen that the United States has the largest node while the United
Kingdom ranked the second largest node.
Additionally, the thicker the links, the higher the amount of foreign lending of a
banking system. In the same vein, Switzerland, the United Kingdom, France and Germany
all have thicker links to foreign lending from the United States. Moreover, we also can
see that some banking systems such as the United States and the United Kingdom are
making vast amounts of foreign investments, implying that they constitute the largest
node in the periphery. The other reporting countries such as Greece, Austria, Belgium,
Portugal, Spain, Ireland, Netherland and Italy constitute the smaller amount of
investments between the reporting countries as indicated by the thinner links.
(a)
(b)
Figure 2 100% Loss Given Default on Contagion Effect

127127
127
Systemic Risk Analysis of Global Banking Systems
(c)
(d)
(e)
(f)
Figure 2 Cont.

128128
128
International Journal of Economics and Management
(g)
(h)
(i)
(j)
Figure 2 Cont.

129129
129
Systemic Risk Analysis of Global Banking Systems
(k)
(l)
Figure 2 Cont.
Visualisation of the contagion effect can be shown in Figure 2 (a to l) with 100%
LGD. Our assumption is that, if the shock is attributed to each counterparty country, the
contagion has a very little effect on the other reporting national banking systems in 100%
LGD. The full results on the effect of domino loss can be shown in Appendix 1. However,
the loss attributed to the shocks is less and cushioned by the 6% of Tier 1 capital ratio. It
shows from the figures that if the shock comes from any other than the United States’s
banking system, there is no failure effect on all of the other national banking systems. The
figures further show no signal of losses or defaults from the shock. The banking systems
still can survive with the new Tier I capital ratio that has been set by Basel III. Our results
support the new Basel III regulatory constraint. However, this is not consistent with Said
(2015) that found that contagion effect has defaulted most of reporting countries that
interconnected with trigger country. Said (2015) used data set under the Basel II
regulatory constraint. Thus, our results show that under Basel III regulatory constraint,
the probability of default to each banking system is less compared to Basel II regulatory
constraints as shown in Said (2015). The idea of Basel committee to strengthen the
regulatory constraints has been proven by our findings that most of the banking systems
do not default from any shocks.

International Journal of Economics and Management
130130
130
Figure 3 50% Loss Given Default on Contagion Effect
Figure 3 illustrates the visualisation of the contagion effect with 50% LGD. Our
assumption is that, if the shock is attributed to the United States, the contagion has less
default on the other reporting national banking systems in 50% LGD, except for
Switzerland. It reveals that if the shock comes from the United States’s national banking,
the effect of failure will be on Switzerland’s banking system only. Switzerland’s national
banking has been found to have had the largest investment with the United States and this
contagion gives a big impact on the country. At only 50% LGD, it has shown that
Switzerland is weakening due to default. However, the other counterparty countries have
not defaulted (refer to the Table 2). This is supported by the aim of Basel III for stabilizing
the banking system.
Figure 4 55% Loss Given Default on Contagion Effect

131131
131
Systemic Risk Analysis of Global Banking Systems
The visualisation of the contagion effect with 55% LGD is presented in Figure 4.
Our assumption is that, if the shock is attributed to the United States, the contagion will
not default the other reporting national banking systems in 50% LGD, except for
Switzerland’s national banking. Switzerland has been found to have had the largest
investment with the United States and this contagion gives a big impact on Switzerland’s
banking system. With the assumption of 55% LGD in the first round, it shows that
Switzerland’s banking system has defaulted after the shock attributed to the United States.
The second round of contagion effect shows that the other counterparty countries have
not defaulted even when the shock is attributed to Switzerland.
Table 2 Contagion Analysis at 50% and 55% LGD
Country Domino Loss (50% Domino Loss (55%
LGD) (million USD) LGD) (million USD)
United Kingdom 241.08 265.19 Switzerland 298.73 328.6 France 197.43 217.17 Belgium 0 0.32 Germany 152.19 167.41 Italy 0 0 Austria 0.03 0.04 Spain 77.79 85.57 Portugal 0.03 0.6 Netherland 40.8 56.29 Greece 0 0.32 Ireland 0 0 United States 3701.5 3701.5 Total Domino Loss 4709.58 4823.01
Table 2 presents the results of contagion analysis if the shock is attributed to the
United States. The results are shown for 50% and 55% LGDs. If the shock is attributed to
the United States, the contagion will default Switzerland the highest amount of 298.73
million US dollars and 328.6 million US dollars for both rates respectively. However, the
result reveals that with 50% LGD, Belgium, Italy, Greece and Ireland have shown no
effect at zero loss. Similarly, Austria and Portugal have only 0.03 million US dollars
losses. In addition, at 55% LGD, Italy and Ireland still remain at zero level of losses after
the United States shocks. The total domino loss for both 50% and 55% LGDs are 4 709.58
million US dollars and 4 823.01 million US dollars respectively. The top four most
affected countries are Switzerland, United Kingdom, France, and Germany under the 50%
and 55% LGDs.. United Kingdom defaulted the second at 241.08 million US dollars and
265.19 million US dollars after Switzerland due to the shock attributed to the United
States at 50% and 55% LGD respectively. France and Germany defaulted at 197.43
million US dollars and 152.19 million US dollars at 50% LGD. While the two countries
were held at 217.17 million US dollars and 167.41 million US dollars at 55% LGD.

132132
132
International Journal of Economics and Management
Table 3 Contagion Analysis at 100% LGD (million US dollars)
Country Domino Loss Domino Loss (100% Domino Loss (100%
(100% LGD) UK LGD) Switzerland LGD) France
United Kingdom 1294.14 0 0 Switzerland 163.93 317.1 18.19 France 15.21 0 922.35 Belgium 4.84 0.58 0 Germany 210.14 0 0 Italy 0 0 0 Austria 9.32 0 0 Spain 316.35 0 0 Portugal 0 1.03 0 Netherland 4.44 20.75 0 Greece 0 0.58 0 Ireland 0 0 0 United States 0 0 0 Total Domino Loss 2018.37 340.04 940.54
Table 4 Contagion Analysis at 100% LGD (million US dollars)
Country Domino Loss (100% Domino Loss (100% Domino Loss
LGD) Belgium LGD) Germany (100% LGD) Italy
United Kingdom 0 0 0 Switzerland 0 59.11 59.11 France 205.56 14.79 14.79 Belgium 134.67 0 0 Germany 18.53 508.5 508.5 Italy 0 99.7 99.7 Austria 0.65 0 0 Spain 0 0 0 Portugal 0 0 0 Netherland 107.69 87.48 87.48 Greece 0.3 0 0 Ireland 0 0 0 United States 5.08 0 0 Total Domino Loss 472.48 769.58 769.58
Table 5 Contagion Analysis at 100% LGD (million US dollars)
Country Domino Loss (100% Domino Loss Domino Loss (100%
LGD) Austria (100% LGD) Spain LGD) Portugal
United Kingdom 0 0 12.89 Switzerland 9.62 13.46 0 France 2.91 90.51 9.45 Belgium 0 7.03 0.07 Germany 32.7 69.89 19.99 Italy 85.15 0 0 Austria 126.68 0 0.67 Spain 1.01 385.82 49.24 Portugal 0 0 42.11 Netherland 3.13 31.97 0 Greece 0.46 0 0 Ireland 0 0 0 United States 0 0 0 Total Domino Loss 261.36 598.68 134.42

133133
133
Systemic Risk Analysis of Global Banking Systems
Table 6 Contagion Analysis at 100% LGD (million US dollars)
Country Domino Loss (100% Domino Loss (100% Domino Loss (100%
LGD) Netherland LGD) Greece LGD) Ireland
United Kingdom 0 4.28 31.88 Switzerland 0 0 19.27 France 53.19 0.75 31.56 Belgium 0 0 17.86 Germany 0 11.3 40.35 Italy 0 1.04 8.84 Austria 0 0 1.09 Spain 0 0.43 2.67 Portugal 6.02 0.32 2.58 Netherland 264.09 1.1 9.68 Greece 0 35.86 0.27 Ireland 0 0 55.22 United States 0 7.3 44.58 Total Domino Loss 323.30 62.38 265.85
CONCLUSIONS
Overall, this study has contributed to the network topology of financial networks by using
the Basel III regulatory constraint. Our findings show that banking systems such as those
of the United States and the United Kingdom are making vast amounts of foreign
investments, implying that they constitute the largest node of the periphery. The results
in the contagion effects proved that only Switzerland has collapsed after a shock from a
core country such as the United States. However, other counterparty countries have not
defaulted on contagion effects. The implementation of Basel III regulatory constraint has
been found to be a cushion for banking systems from any shocks or losses. Although, our
findings differ from the previous published studies (e.g. Said 2015), they are consistent
with the main aim of the new Basel accord in stabilizing the banking systems. Our results
further show that under Basel III regulatory constraint, the probability of default to each
banking system is less compared to Basel II regulatory constraints as found in Said (2015).
The idea of Basel committee to strengthen the regulatory constraints has been proven by
our findings that most of the banking systems were not defaulted from any shocks except
for Switzerland. Nevertheless, the assumption of 55% loss given default for Switzerland
is at a high percentage as compared to findings in Said (2015). This shows that the Basel
III regulatory constraints have found to be a cushion for banking systems.
An implication of our findings is that monetary authority can use contagion analysis
to predict any default effects if there is shock triggering from any other banking systems.
A key policy priority for Central banks should, therefore, be to employ network
methodology for detecting an early warning signal from any bank defaults.

134134
134
International Journal of Economics and Management
REFERENCES
Allen, F. and Gale, D. (2000), “Financial Contagion”, Journal of Political Economy, Vol. 108, pp.
1-33.
Bech, M. and Atalay, E. (2008), “The topology of the Federal funds market”, Federal Reserve Bank
of New York: Staff report, No. 354.
Borio, C. (2003), “Towards a macro prudential framework for financial supervision and
regulation?”, CES ifo Economic Studies, Vol. 49, pp. 181-216.
Boss, M., Elsinger, H., Summer, M. and Thurner, S. (2004), “Network Topology of the interbank
market”, Quantitative Finance, Vol. 4, pp. 677-684.
Buiter, W. (2009), “The unfortunate uselessness of most 'state of the art' academic monetary
economics,” Available from: www.voxeu.org/index.php?q=node/3210 (accessed 3 May 2013).
Castren, O. and Rancan, M. (2013), “Macro-Networks: An application to Euro Area Finance
Accounts,” ECB Working Paper Series.
Chan, J. A. (2010), “Balance sheet network analysis of too-connected-to-fail risk in global and
domestic banking systems”, IMF working paper. 10/107 (Washington: International Monetary
Fund).
Craig, B. R. and Von Peter, G. (2010), “Interbank Tiering and Money Center Banks”, FRB of
Cleveland Working Paper, pp. 10-14.
Degryse, H., Elahi, M. A. and Penas, M. F. (2009), “Cross-border exposures and nancial
contagion”, European Banking Sector Discussion Paper : 2009-02.
Degryse, H., Elahi, M. A. and Penas, M. F. (2010), “Cross-Border Exposures and Financial
Contagion”, International Review of Finance, Vol. 10 No. 2, pp. 209-240.
Eichengreen, B. (2010), “Globalization and the crisis”, Institute of Economic Research University
of Munich CES ifo Forum Journal, Vol. 11 No.3, pp. 20-24.
Elsinger, H. A. L. and Summer, M. (2006), “Risk assessment for banking systems”, Management
Science, Vol. 52 No. 9 pp. 1301–1314.
Fagiolo, G. (2010), "The international-trade network: gravity equations and topological
properties", Journal of Economic Interaction and Coordination, Springer, Vol. 5 No. 1, pp. 1-
25.
Furfine, C. H. (2003), “Interbank exposures: Quantifying the risk of contagion”, Journal of Money,
Credit and banking, Vol. 35 No. 1, pp. 111-125.
Gauthier, C., Lehar, A. and Souissi, M. (2010), “Macroprudential regulation and systemic capital
requirements”, Working Papers, pp. 10-4, Bank of Canada.
Harada, K., Hoshi, T., Imai, M., Koibuchi, S. and Yasuda, A. (2015), “Japan's Financial Regulatory
Responses to the Global Financial Crisis”, The First Great Financial Crisis of the 21st Century,
pp. 145-166.
Hattori, M. and Suda, Y. (2007), “Developments in a cross-border bank exposure network”, Bank
of Japan Working Paper, pp. 07-21.

135135
135
Systemic Risk Analysis of Global Banking Systems
Kiyotaki, N. and Moore, J. (1997) “Credit Cycles”, Journal of Political Economy, Vol. 105, pp.
211-48.
Leitner, Y. (2005), “Financial networks: Contagion, commitment, and private sector bailouts”,
Journal of Finance, Vol. 60 No. 6, pp. 2925-2953.
Lelyveld, I. and Liedorp, F. (2004), “ Interbank Contagion in the Dutch Banking Sector”, DNB
Working Paper, No. 5, pp. 1-31.
Lelyveld, I. and Liedorp, F. (2006), “Interbank Contagion in the Dutch banking sector: A sensitivity
analysis”, International Journal of Central Banking, Vol. 2 No. 2, pp. 99-133.
Markose and Goktan, (2013), “Euro-Zone Cross Border Banking Flows and Sovereign Contagion:
A Network Analysis”, PhD Thesis University of Essex.
Markose, S. M. (2011), “Multi-Agent Financial Modelling and Complexity Approach to Systemic
Risk Monitoring for G10 and BRICs: A Post 2007 Perspective”, Talk given at Reserve Bank of
India, Financial Stability Unit, August 2010.
Markose, S. M. (2012), “Systemic Risk from Global Financial Derivatives: A Network Analysis
of Contagion and Its Mitigation with Super-Spreader Tax”, IMF Working Paper, No.12/282.
May, R. M. (1972), “Will a Large Complex System be Stable?”, Nature, Vol. 238, pp. 413-414.
McGuire, P. and Wooldridge, P. (2005), “The BIS consolidated banking statistics: structure, uses
and recent enhancements”, BIS Quarterly Review, September.
Minoiu and Reyes, (2011), “A network analysis of global banking: 1978-2009”, IMF Working
Paper. WP/11/74.
Newman and Me, E. J. (2010), “ Networks: An Introduction”, Oxford University Press, Oxford.
Rochet, J. and Tirole, J. (1996), “Interbank lending and systemic risk”, Journal of money, credit
and banking, Vol. 28, pp. 33-62.
Said, Fathin and Faizah, (2015), “Global Banking on the Financial Network Modelling: Sectorial
Analysis”, Computational Economics, Vol. 46 No. 4, pp. 1-27.
Tannuri, M. (2006), “Contagion in the Brazilian Interbank Currency Exchange Market,” Est. econ.,
São Paulo, Vol. 36 No. 2 pp. 251-262, ABRIL-JUN HO 2006
Upper, C. and Worms, A. (2004), “Estimating bilateral exposures in the German Interbank Market.
Is there a danger of contagion?”, European Economic Review, Vol. 48, pp. 827-849.
Vousinas, G. L. (2015), “Supervision of financial institutions”, Journal of Financial Regulation
and Compliance, Vol. 23 No. 4, pp. 383-n/a.
Wells, S. (2004), “UK Interbank exposures: Systemic risk Implications”, Journal of monetary
economics, Vol. 2, pp. 66-77.

136136
136
International Journal of Economics and Management
ACKNOWLEDGEMENT
We thank Dr. Kuntal Das from University of Canterbury, Australia for comments that
improved the manuscript during the 2nd Applied Financial Modelling Conference 2017,
Deakin University, Australia.